Submitted:
24 February 2025
Posted:
25 February 2025
You are already at the latest version
Abstract
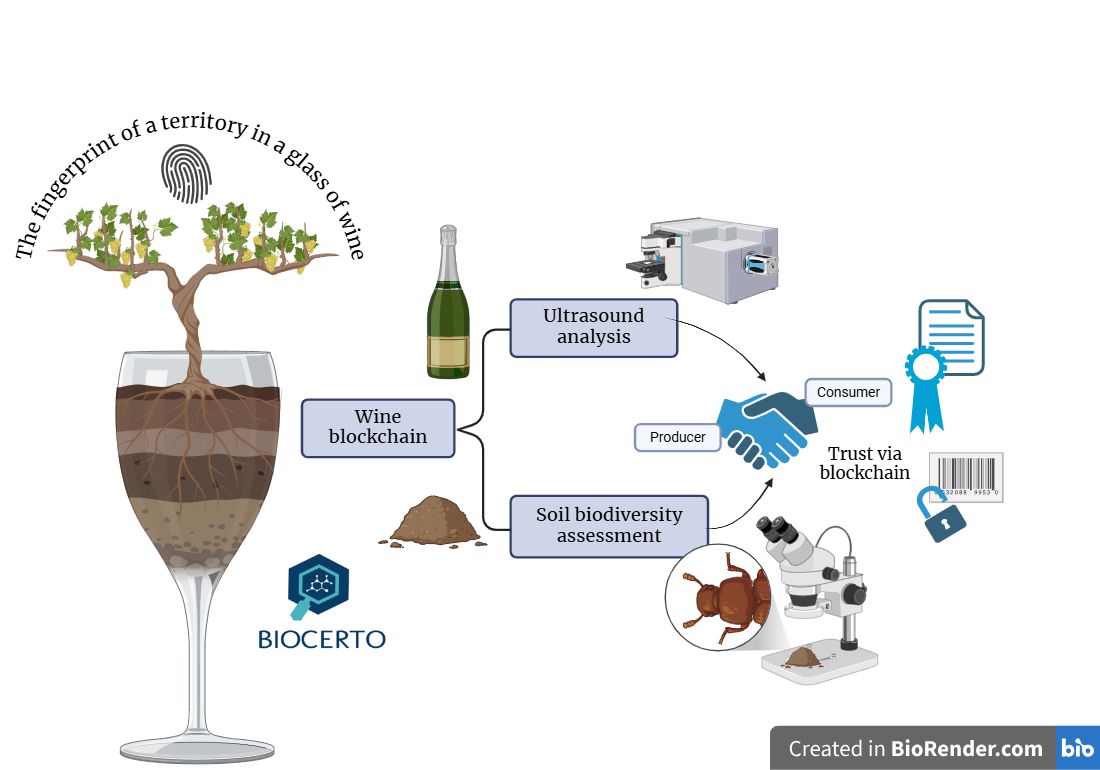
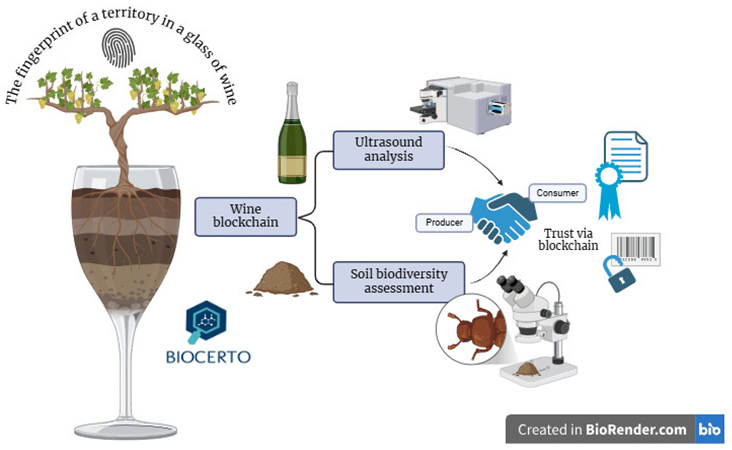
The wine industry faces increasing challenges related to authenticity, safety, and sustainability due to recurrent fraud, shifting consumer preferences, and environmental concerns. In this study, part of the B.I.O.C.E.R.T.O project, we integrated blockchain technology with ultrasonic spectroscopy and soil quality data by using the arthropod-based Soil Biological Quality Index (QBS-ar), to enhance traceability, ensure wine quality, and certify sustainable vineyard practices. Four representative wines from the Marche region (Sangiovese, Maceratino, and two Verdicchio PDO varieties) were analysed across two vintages (2021 and 2022). Ultrasound spectroscopy demonstrated high sensitivity in distinguishing wines based on ethanol and sugar content, comparable to conventional viscosity-based methods. The QBS-ar index was applied to investigate the soil biodiversity status according to the agricultural management practices applied in each vineyard, reinforcing consumer confidence in environmentally responsible viticulture. By recording these data on a public blockchain, we developed a secure, transparent, and immutable certification system to verify the geographical origin of wines along with their unique characteristics. This is the first study to integrate advanced analytical techniques with blockchain technology for wine traceability, simultaneously addressing counterfeiting, consumer demand for transparency, and biodiversity preservation. Our findings support the applicability of this model to other agri-food sectors, with potential for expansion through additional analytical techniques, such as isotopic analysis and further agroecosystem sustainability indicators.
Keywords:
QBS-ar
; sound speed
; vineyards
; wine cellar
; biodiversity
; sustaiability
; viscosity
; density
1. Introduction
According to the Assoenologi Observatory, Ismea, and the Italian Wine Union (UIV), the grape harvest for 2024 is estimated to be 41 million hectolitres, which represents a 7% increase compared to 2023. Although this volume is lower (-12.8%) than the average of the last five years, Italy confirms its role as the world’s leading wine producer, especially in light of the sharp decline in French production [1]. Nonetheless, a slowdown in global demand was registered, likely due to uncertainties in the economic and geopolitical landscape, as well as shifts in consumption patterns, especially among younger generations. Emerging trends in wine consumption include a heightened emphasis on health, safety and environmental impact of food production [1].
A recent study found that 68% of Italians are concerned about the impact of their dietary choices on their health [2]. This concern stems partly from repeated food scandals. In 2018, a fraudulent event occurred where 150,000 liters of generic white wine were misrepresented and sold as Verdicchio dei Castelli di Jesi PDO [3]. At the European level, wine is a significant agricultural product that is exported worldwide. However, it also ranks among the most frequently counterfeited food products [4]. It is estimated that fraud in the European wine sector costs approximately 1.3 billion euros annually [5].
These recurring and patterned frauds have not only discouraged consumers but have also undermined their confidence in wine products. The primary concerns among consumers revolve around the authenticity, safety, and quality of wines. So far, various methodological approaches and accurate characterization methods to ensure authenticity and market transparency have been identified to meet this demand.
Among these, blockchain technology is certainly central. The blockchain technology is a decentralised ledger containing information of a product or process recorded on a distributed peer-to-peer network that guarantees its security, traceability, immutability, non-clonability, transparency and accessibility, while respecting privacy. With such technology, it is possible to register and notarize on a public register (public blockchain) with a certain date the unique characteristic information of an agri-food product (i.e., wine) to certify the geographical origin through an infallible cryptographic system that cannot be modified externally.
The use of this technology for wine traceability requires the collection of chemical-physical characteristics that can be unequivocally attributed to each vineyard and relative wine produced. Several traditional techniques are currently available for wine characterization, including sensory analysis, chromatography and spectrophotometry [6]. However, ultrasonic spectroscopy has recently emerged as a new easily applicable technique [6,7,8] for the chemical-physical characterization of food and beverages, including wine, in a non-invasive, non-destructive, and easy-automated manner [9,10]. Ultrasounds are acoustic waves having a frequency above the audible range for humans (~20 kHz), which can be generated from piezoelectric elements and propagate longitudinally through a material via adiabatic compression and decompression cycles [11,12]. Low-intensity and high-frequency ultrasounds (frequency above 100 kHz) can be experimentally employed to investigate the chemical-physical properties of materials by monitoring the variation of the ultrasound wave parameters, such as sound speed and attenuation, which are dependent on the structure of the material itself [13]. Different high-frequencies ultrasound devices, operating at single-frequency, frequency scanning or simultaneous multi-frequencies scanning mode have been employed for the characterization of the chemical-physical properties of a large variety of monophasic, heterogeneous or colloidal materials, including paints, cosmetics, ceramics, foods and pharmaceutical products [7,14,15].
With regards to the characterization of wines, the main application of techniques employing high-frequency ultrasounds has been the real-time monitoring of the wine fermentation process [8]. Novoa-Diaz et al. have monitored the conversion of malic acid into lactic acid during the fermentation process in red wines using 1 MHz ultrasound longitudinal waves [16]. Similarly, Lamberti et al. investigated the alcoholic fermentation process of wine in comparison to saccharose-ethanol model solutions, using a similar ultrasound apparatus [17]. Only more recently, high-frequency ultrasound spectroscopy has been proposed as a tool to discriminate between white and red wines as well as among different varieties [6].
Apart from aspects relating to the chemical and physical characteristics of the wine and its safety, consumers are increasingly interested in environmental issues, preferring wines produced using sustainable agricultural practices that respect biodiversity [1]. A choice experiment on wine consumers, estimated their willingness to pay for biodiversity conservation practices in vineyards, confirming their interest in this topic [18]. Adopting sustainable soil management practices in vineyards can help maintain ecological balance and enhance vine health. Additionally, understanding the relationship between vineyard management and soil biodiversity is crucial for achieving environmentally and economically sustainable viticulture [19]. To evaluate the sustainability of the agricultural practices applied in vineyards, various bioindicators can be used. One of the most commonly used metrics to assess the impact of agricultural practices on soil biodiversity is the arthropod-based Soil Biological Quality Index (QBS-ar) [20,21]. This index has already been successfully used to assess soil quality in vineyards [19,22,23,24,25,26].
In the present study, part of the project B.I.O.C.E.R.T.O (Marche Region, RDP 2014/22 - M 16.1, ID 41377), the QBS-ar index, along with rheological and ultrasonic techniques, were integrated with blockchain technology with the following aims:
- (1)
- to ensure the origin, safety, quality, and the unique characteristics of Marche Region wines for the final consumers by using novel techniques (i.e., ultrasonic spectroscopy);
- (2)
- to certify the use of sustainable agricultural practices in vineyards, promoting soil biodiversity conservation by using the QBS-ar Index.
To achieve this, four wine samples representative of the Marche region were selected. The samples included one red wine (Sangiovese) and three white wines: Maceratino and two varieties of Verdicchio, representing two distinct Protected Designation Origin (PDO) wines of the area - Matelica and Castelli di Jesi (Table 1). The wines were analysed for two consecutive vintages (2021 and 2022). In addition, the QBS-ar index was applied for two years to the vineyards from which the wines originated.
Although blockchain has been widely applied in the wine industry to certify the origin of raw materials and all steps of the supply chain [27], this is the first time, to the best of our knowledge, that data obtained through advanced technologies, such as ultrasound spectroscopy and QBS-ar index, are included in a blockchain in addition to classical traceability data, with the aim of combating counterfeiting, enhancing the value of Made in Italy, and preserving and protecting biodiversity.
2. Materials and Methods
2.1. Study Sites: Vineyards and Wines
The farms involved in the project and the type of wines, analyzed by using non-destructive ultrasonic techniques, are shown in Table 1. Unfortunately, due to production problems, the Maceratino wine (AGR) was only analysed for a single vintage (2021). For the Belisario winery, due to the extensive size of the vineyard (about 20 hectares) and the different planting age (BEL-G, BEL-V), it was deemed necessary to collect two QBS-ar samples to ensure more reliable data.
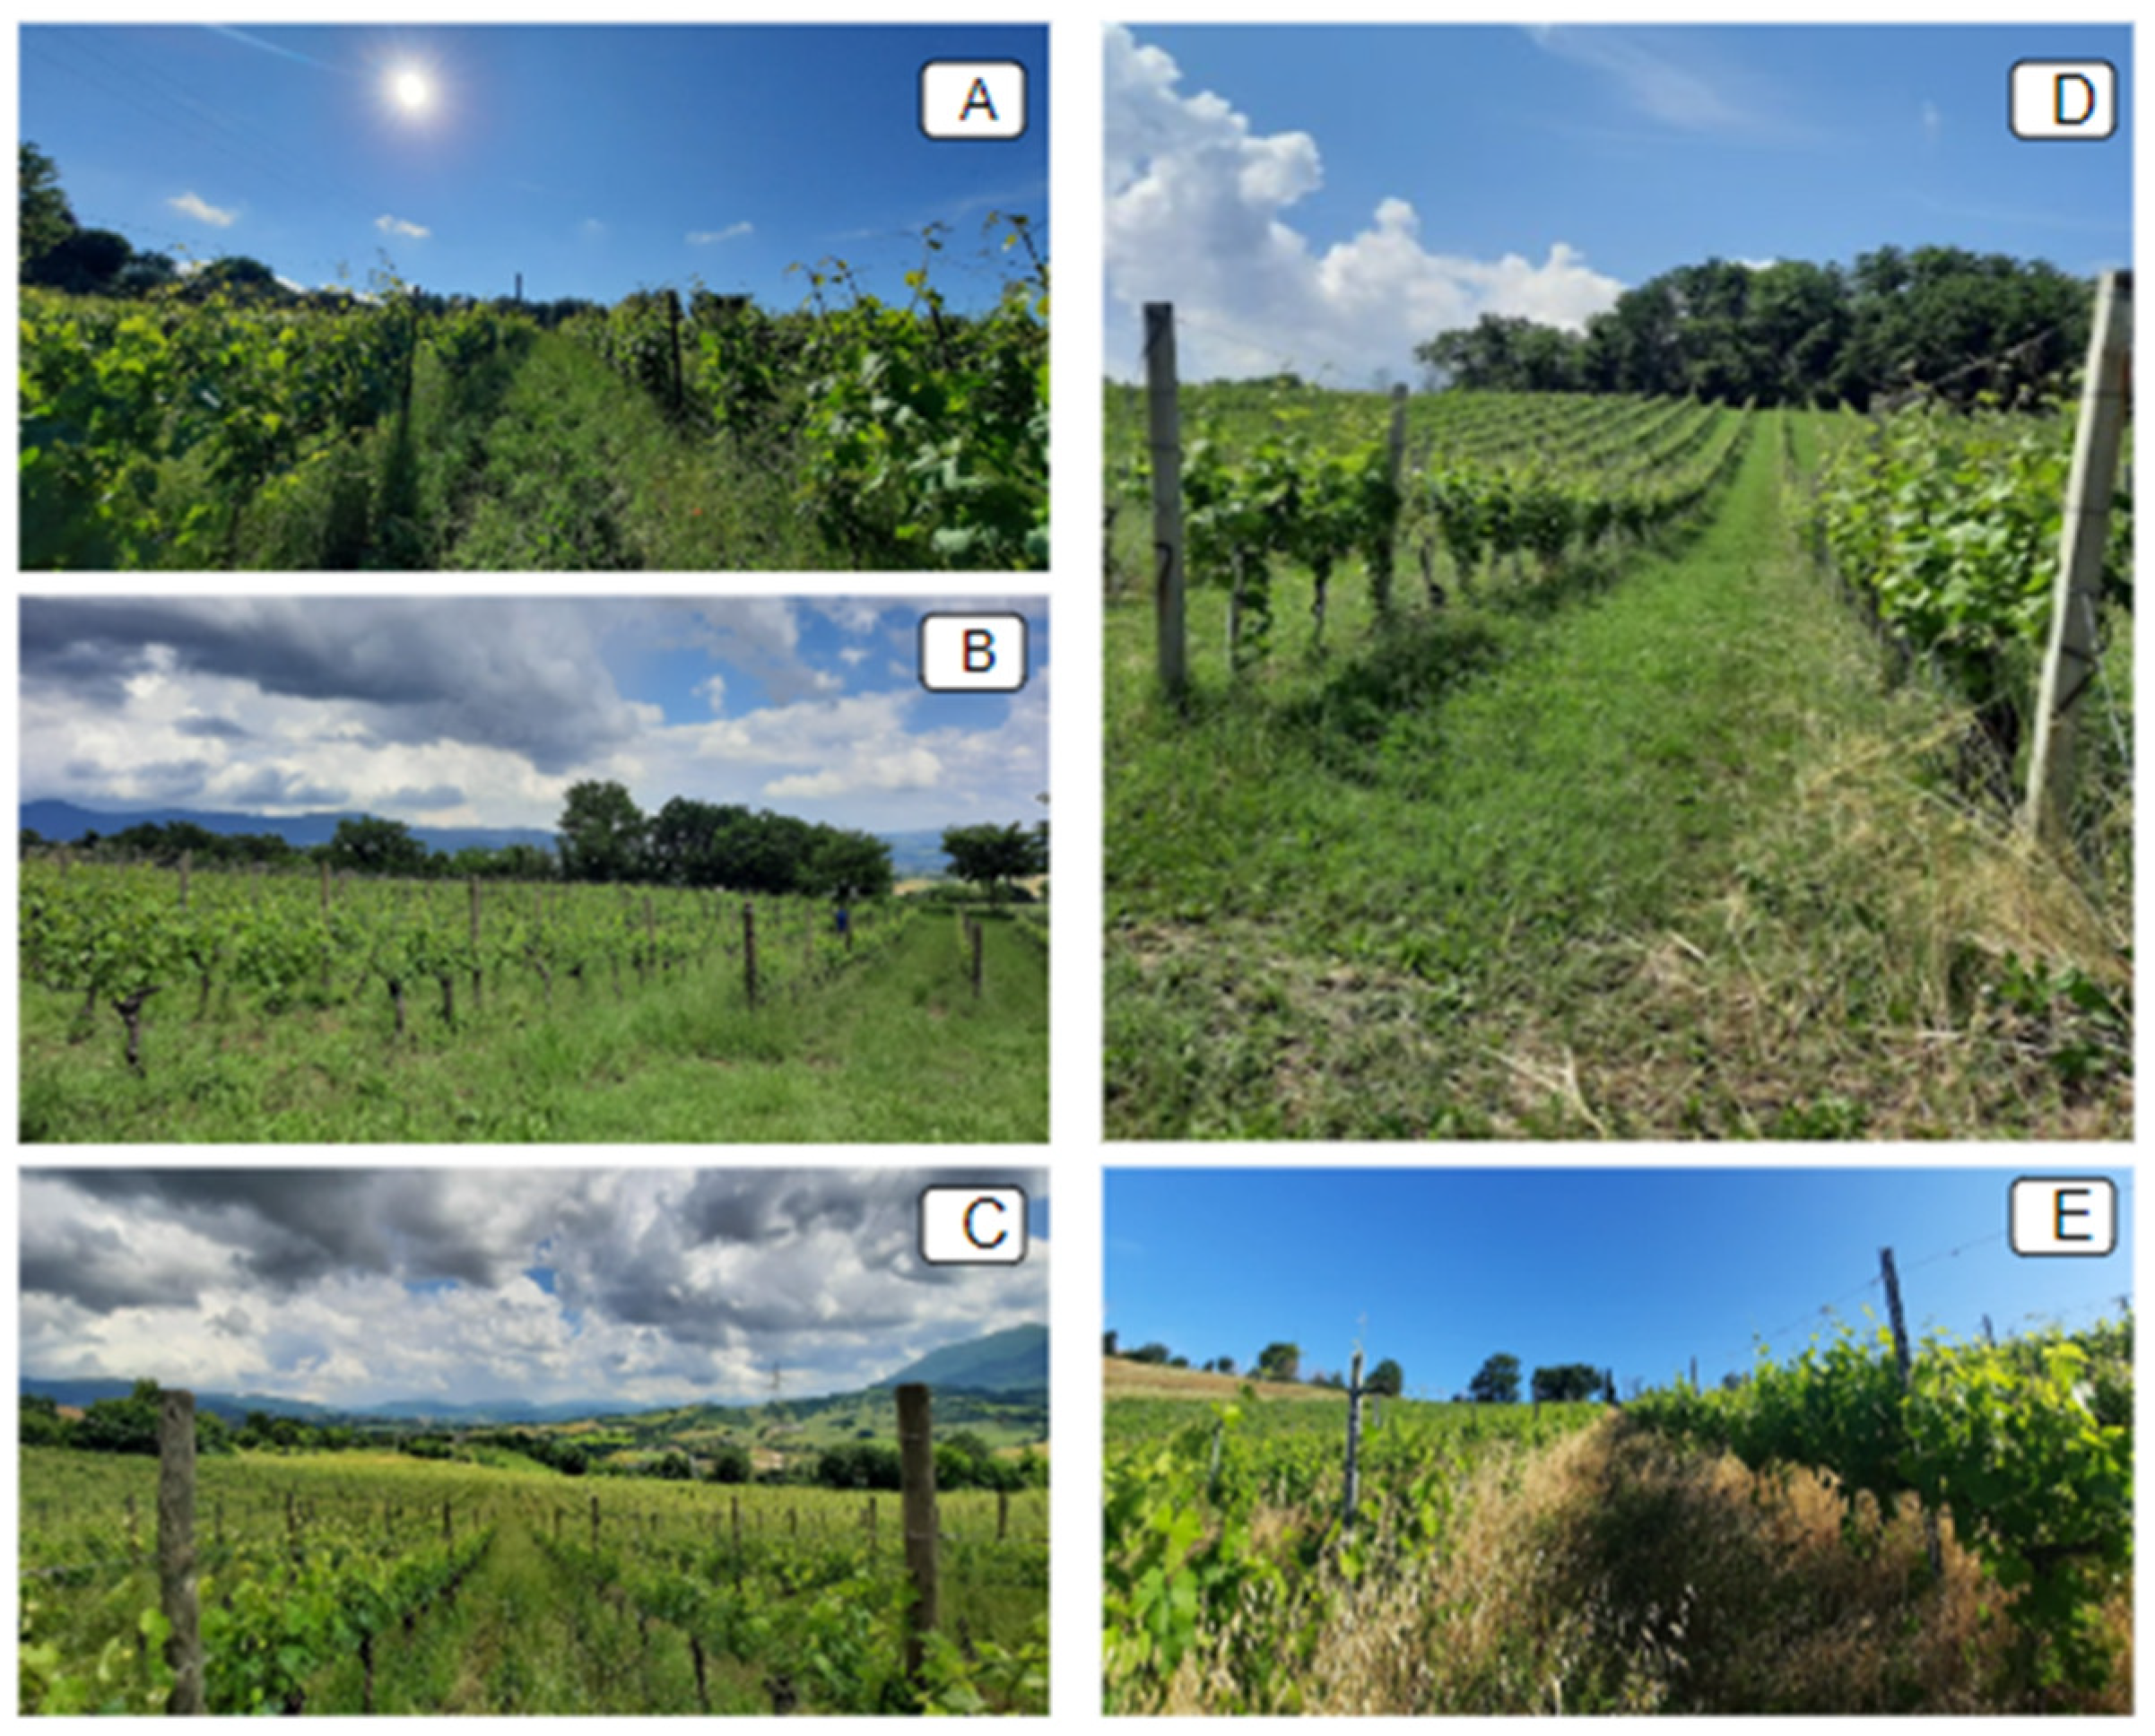
Figure 1.
Images of the analysed sites: A) Azienda Agr. IIS G. Garibaldi (AGR); B) Cantina Belisario (BEL-G); C) Cantina Belisario (BEL-V); D) Az. Agr. Brocani (BRO); E) Az. Agr. Passacantando (PAS).
Figure 1.
Images of the analysed sites: A) Azienda Agr. IIS G. Garibaldi (AGR); B) Cantina Belisario (BEL-G); C) Cantina Belisario (BEL-V); D) Az. Agr. Brocani (BRO); E) Az. Agr. Passacantando (PAS).
Az. Agr. Istituto Statale di Istruzione Superiore (I.I.S.) G. Garibaldi
The I.I.S. G. Garibaldi in Macerata has a rich history that dates back to 1868. The Agricultural School features a farm that covers over 70 hectares. The grape varieties grown there include: Sangiovese, Montepulciano, Ciliegiolo, Maceratino, Merlot, Lacrima, Verdicchio, Fiano, and Grechetto. The wines produced at the Institute include: Rosso Piceno PDO, Colli Maceratesi Bianco PDO (Ribona), and rosé, white and red table wine. The school had a vital role in education, serving as an essential resource for the practical application and development of specific skills in the agricultural sector.
Az. Agr. Brocani
The Brocani farm is a family-run winery that exclusively produces and vinifies grapes from its own organic vineyards, which are located across the municipalities of Staffolo, Cupramontana, and San Paolo di Jesi. The farm covers approximately 12.5 hectares and transforms all its production into a variety of wines, including Verdicchio Classico, Esino Rosso PDO, Vino Rosso IGT, Vino Bianco IGT, and flavored wines. The grape varieties grown there include: Verdicchio and Montepulciano. The winery focuses on high-quality production while promoting environmental sustainability, regional connections, authenticity, and more mindful consumption.
Az. Agr. Passacantando
The Passacantando farm was established in 1996, building on a family farming tradition that began in the 1960s. The farm covers 90 ha across various locations in the municipalities of Tolentino and San Severino Marche, where they cultivate cereals, forage, and olives. Additionally, the farm has 2 hectares of vineyards, specifically Sangiovese. Currently, the farm is managed organically and has diversified its activities to include agritourism.
Cantina Belisario
Cantina Belisario is a 300-hectare vineyard and the largest producer of Verdicchio di Matelica PDO, a typical white wine from the Marche region. All the vineyards are located in the Alta Valle Esina. The company manages the vineyards directly, with each wine label linked to a specific vineyard. Each vineyard represents a distinct project that begins with the initial planting. The careful selection of grapes and musts is aimed at achieving the highest quality to meet the needs and expectations of Belisario wine purchasers.
2.2. Chemical-Physical Characterization of Wines
2.2.1. Viscosity Measurements
Viscosity measurements were performed using a rotational rheometer (Kinexus Lab+, Malvern Instruments Limited, Malvern, Worcestershire, UK). Tests were carried out using a C40/4 cone-plate geometry at 25 °C in the shear rate range between 1 and 100 s-1. Viscosity values were calculated by fitting the shear stress vs shear rate plots using a power law equation model:
where y is the shear rate, X is the shear stress, A is the power law viscosity (Pa s) and n is the power law index. Data were the mean ± standard deviation of three independent measurements
2.2.2. High-Resolution Ultrasound Spectroscopy (HR-US) Analyses
High-resolution ultrasonic spectroscopy is an ultrasonic technique based on the resonance phenomenon between the sample and its medium as a reference. A transmitter generates a longitudinal ultrasonic wave, which travels through a sample cell and is reflected by a receiver, creating a stationary wave with amplified amplitude. The speed of the wave is calculated from its frequency and wavelength, while ultrasonic attenuation determines the half-bandwidth of resonant peaks, enabling measurements of velocity and attenuation. By analysing resonant peaks across different frequencies (1–18 MHz), the frequency dependence of ultrasonic parameters can be investigated. The device uses two piezo transducers positioned opposite each other, allowing measurements with high resolution (down to 0.2 mm/s for velocity) in a wide range of sample volume. The standard setup includes a 2-mL thermostated cell (5–120°C) with stirring capability and supports various operating programs like temperature ramp, kinetic mode, titration mode, and multi-frequency mode [7,28].
HR-US analyses were performed using a high-resolution ultrasound spectrometer (HR-US 102; Ultrasonic Scientific, Dublin, Ireland). The instrument is fitted with two 2 mL-capacity cells: one for the sample and the other one for the reference. Water was employed as reference liquid. Ultrasound parameters such as sound speed (m/s) and attenuation (1/m) were recorded for each sample of wine at a temperature of 25 °C and a frequency of 5.4 MHz. Absolute ultrasound parameters were measured over a time of 300 s for each analysis and reported as the mean of the collected values. Data were the mean ± standard deviation of three independent measurements.
2.2.3. Refractive Index and Density Measurements
Refractive index measurements were carried out at 25°C using an Abbe Refractometer (NAR-1T LIQUID, Atago Co., LTD, Minato-ku, Tokyo, Japan), featuring the refractive index scale and the BRIX scale. Density measurements were carried out at 25 °C using a digital densimeter with an oscillating U-tube (DMA-5000M, Anton-Paar, Graz, Austria). Data are reported as the range of measurements of three independent measurements.
2.3. Soil health Assessment Using the Arthropod-Based Biological Soil Quality Index (QBS-ar)
The Arthropod-Based Biological Soil Quality Index (QBS-ar) [20,21] was used to assess the soil health condition of the various vineyards involved in the present study. The index is determined by identifying the main groups of soil microarthropods and assigning an Ecomorphological Index (EMI), ranging from 1 to 20, based on the microarthropod’s level of adaptation to soil life. The sum of the EMI provides the QBS-ar value, which indicates soil quality. At each vineyard, one QBS-ar sample was collected, consisting of three subsamples of soil cores (A, B, C). The subsamples were collected from the central area of the vineyard, spaced approximately 10 meters apart in various inter-rows, and located away from the vineyard’s edge. A steel core drill was used to obtain an equivalent volume of soil, approximately 800 cm³. The samples were transported to the laboratory and, within 24 hours, placed in a Berlese-Tullgren selector, equipped with 25 W light bulbs and a 2 mm sieve mesh, for the extraction of soil microarthropods, which was completed over a period of 7 days. Total QBS-ar and partial QBS-ar values were calculated for each experimental site [22]. Once the QBS-ar value (both partial and total) was defined, it was compared with the numerical ranges reported in [29] for assigning the biological soil quality judgment. The numerical intervals vary depending on the management system considered. In this case, we specifically focused on tree crops and vineyards (whose value ranges from <60 = null to >160 = excellent). Soil samples were collected twice from the same vineyards, in June 2022 and 2023. The partial QBS-ar data were subjected to the Shapiro-Wilk test for normality before analysis. Data were then compared between years (Wilcoxon-Mann-Whitney test) and between vineyards (Kruskal-Wallis test). In addition, differences between vineyards were assessed by post hoc test (Dunn test). A p-value < 0.05 was considered significant. Statistical analysis was performed using R software, version 4.2.0 [30].
2.4. The B.I.O.C.E.R.T.O. Blockchain Development
The digital platform (B.I.O.C.E.R.T.O.) consists of a front-end and back-end microservices connected to a cloud data centre, connected to a public blockchain network. The platform was developed within the project to analyse and manage all phases of an integrated production chain.
The information collected along the production chain was archived in the cloud on the platform and the digital files notarized on the public blockchain through complex cryptographic systems, in order to guarantee the immutability and unchangeability of the data and information collected and provide transparency on the production processes. Various processes were recorded in the platform, including: the identification of the system and the census of the farms and sites involved in the study, the planning of the sampling calendar with assignment of tasks, the execution of the sampling, the data on the collection of soil samples and the related metadata.
For example, soil sampling events and soil and wine analysis output files were recorded, and the original files were uploaded to the digital platform. The terrain and corresponding coordinates were associated with each sample.
All this information is summarized in the form of a Biocerto Digital Certificate. At this point the Quadrans blockchain API is invoked for the notarization of the original files and the Biocerto Digital Certificate of the product. QR-codes are generated to be associated with the product and the territory of origin. The notarial register, the original files and the platform can only be consulted by authorized users. The front-end of the platform is visible only under authentication for administrators’ use. While a public front-end visible to all consumer users is available which allows them to view the Biocerto Digital Certificate using the QR code and the authenticity verification of the Certificate.
The prototype of the blockchain network represents the distributed digital infrastructure on which all BIOCERTO notarization services were based and is supported by the “Quadrans” public infrastructure.
To use these services, some computational nodes have been configured exposed on the external internet network capable of accessing the Quadrans API for notarizing the digital files collected.
The blockchain network consisted of physical servers (minicomputers) and virtual servers (cloud data centres) called nodes with the specific hardware and software characteristics for the type of service required.
The registry of notarisation was unique, distributed and shared among all the nodes of the network and was, by definition, decentralised, allowing for an additively scalable solution.
3. Results and Discussion
3.1. Viscosity Determination
All the wines analysed (AGR, BRO, PAS, BEL; TAB.1) showed the typical behaviour of newtonian liquids, in which the measured viscosity is independent of the shear rate applied, at least in the range investigated (1-100 s-1) (Figure 2A) [31]. The measured viscosity was in the range of 0.015-0.03 Pa s with the highest value calculated for the PAS wine (0.028-0.030 Pa s). On the other side, lower viscosity values (below 0.020 Pa s) were calculated for the other wines (AGR, BRO and BEL). The calculated power law indexes were close to 1, being for all wines in the range 0.972-1.054. No statistically significant differences were found between viscosity values of the same wine produced in different years (2021 and 2022) (multiple T-test unpaired, statistical significance P˂0.05) (Figure 2B).
3.2. High-Resolution Ultrasound Characterization
Parameters from HR-US technology, such as sound speed (m/s) and attenuation (1/m) recorded at high-intensity and low frequency (2–100 kHz) of ultrasounds, can be employed to investigate structural and chemical-physical properties of materials. When the ultrasound waves pass through a material, the velocity of propagation of the wave (sound speed) changes, and the wave itself loses part of its energy, leading to an increase in attenuation parameter. Indeed, the propagation of the ultrasound waves in a material is dependent on the structure and composition of materials, since affected by the nature of the chemical bonds and mass of molecules and/or supramolecular aggregates composing the sample. Therefore, HR-US configures as a versatile and non-destructive technique to characterise materials of a different nature, by monitoring the differences and variations between ultrasound parameters. HR-US technique can perform ultrasound measurements with a high-resolution up to 0.2 mm/s for sound speed and 0.2% for attenuation, being suitable for the analysis of liquid samples with a low concentration of solutes as wines.
Sound speed (U) depends on the density (ρ) and the adiabatic compressibility (β) of the liquid according to the Laplace equation:
Ultrasonic attenuation (α) refers to the decrease in fluctuation amplitude (A) during the travel of the ultrasound wave through the material since a loss of energy transported by the wave occurs according to the equation:
where A0 is the initial amplitude and z is the travelled distance.
Figure 3A and 3C reports the raw data from sound speed attenuation over the measurement time (360 s) of the three wines, from which the mean ± SD values were calculated (Figure 3B and 3D). A similar trend with the respect to viscosity was found for the ultrasound parameters. Specifically, PAS wine showed the highest sound speed values on both analysed years (~1583 m/s for 2021 year and ~1589 m/s for 2022 year), with the respect to the other wines that displayed lower values (for BRO and BEL wines the sound speed as between 1577-1579 m/s for both years and for AGR the sound speed was ~1565 m/s for 2021 year).
Yet, PAS wine showed the highest attenuation value, at least for the year 2022, but the larger variability among measurements, as resulted from the higher relative standard deviation (RSD %, range between 6-12) with respect to sound speed measurements (RDS% range between 0.01-0.04), suggests that attenuation is a less accurate ultrasound parameter.
The three wines (BRO, BEL and PAS) produced in 2022 years and AGR wine produced in 2021 were further characterised in terms of refractive index and density. Refractive index measurements provided refractive index and brix values listed in Table 2. From Brix values, representing the grams of sugars in 100 mL of wines [31], it can be deduced that PAS 2022 wine has the highest sugar content, while AGR 2021 the lowest one. This result completely fits the trend previously observed for viscosity and sound speed. Similarly, the highest density value was measured for PAS 2022 (0.9950-0.9951 g/mL), confirming its highest sugar content among all analysed wines. Indeed, sugars and other secondary compounds present in wine such as glycerol and tartaric acid can increase the density, while ethanol has the opposite effect by decreasing it [32].
Standard solution of saccharose and ethanol in water at the percentage of 4%, 8%, 12% and 16% w/w were analysed to further confirm that the ultrasound parameters (sound speed and attenuation) measured using HR-US technique are mainly affected by the ethanol and sugar content, which are the two more abundant components in wine after water (Figure 5). Sound speed showed a linear increase as a function of both saccharose and ethanol concentration in the range investigated (4-16 % w/w), differently from the attenuation parameter. Moreover, it has also emerged that the variation of sound speed over concentration is more pronounced in ethanol–water solutions than in water–saccharose solutions (Figure 4A). On the other side, less marked differences were observed in the plots relating to the variation of the attenuation parameter (Figure 5B). Therefore, at least for sound speed, it seems that ethanol content can have a predominant role over sugar content in determining the ultrasound-responsive properties of wines, as previously reported by Lamberti et al. [17].
Notably, the measured absolute values both from attenuation (from ~0.5 to ~1.5 1/s) and from sound speed (from ~ 1500 to 1600 m/s) were comparable to those measured for wines, confirming that ethanol and sugars are able to affect ultrasound measurements and are the main constituents on which differences in sound speed and attenuation on wines can be ascribed.
3.2. Soil health Assessment Using the QBS-ar
Among soil fauna, soil microarthropods contribute significantly to organic matter decomposition, nutrient cycling, plant growth, and overall ecosystem functioning [33]. They are recognized as reliable indicators of soil health [21], capable of effectively assess the sustainability of agricultural practices [22,34,35,36,37].
The application of the QBS-ar method to the vineyards from which the wines in our study were produced showed that the average total QBS-ar value obtained in the different vineyards was very high and similar between 2022 (184) and 2023 (181) (Table 3).
The results showed that a higher average partial QBS-ar value was found in 2022 (134) compared to 2023 (116), although the difference was not statistically significant. Likewise, no significant differences in partial QBS-ar values were observed among the different vineyards in both years (Figure 5). In 2022, the vineyard of the Az. Agr. IIS G. Garibaldi showed a notably higher average partial QBS-ar value (182) than the other vineyards, particularly when compared to Cantina Belisario (BEL-G =104; BEL-V =127) and Brocani farm (106). Further, the average partial QBS-ar value found in Az. Agr. Passacantando was high (151). Compared to 2022, 2023 exhibited greater homogeneity in values. Nonetheless, consistently with the previous year (2022), the vineyards of Az. Agr. Passacantando (141) and Az. Agr. IIS G. Garibaldi (138) showed higher values, while the vineyards of Az. Agr. Brocani (85), the youngest (100) and the oldest vineyard of Cantina Belisario (115) showed lower values (Figure 5).
Figure 5.
Boxplot of the distribution of the partial QBS-ar value obtained in each vineyard in 2022 and 2023. The package “ggplot2” was used to generate the plot [30].
Figure 5.
Boxplot of the distribution of the partial QBS-ar value obtained in each vineyard in 2022 and 2023. The package “ggplot2” was used to generate the plot [30].
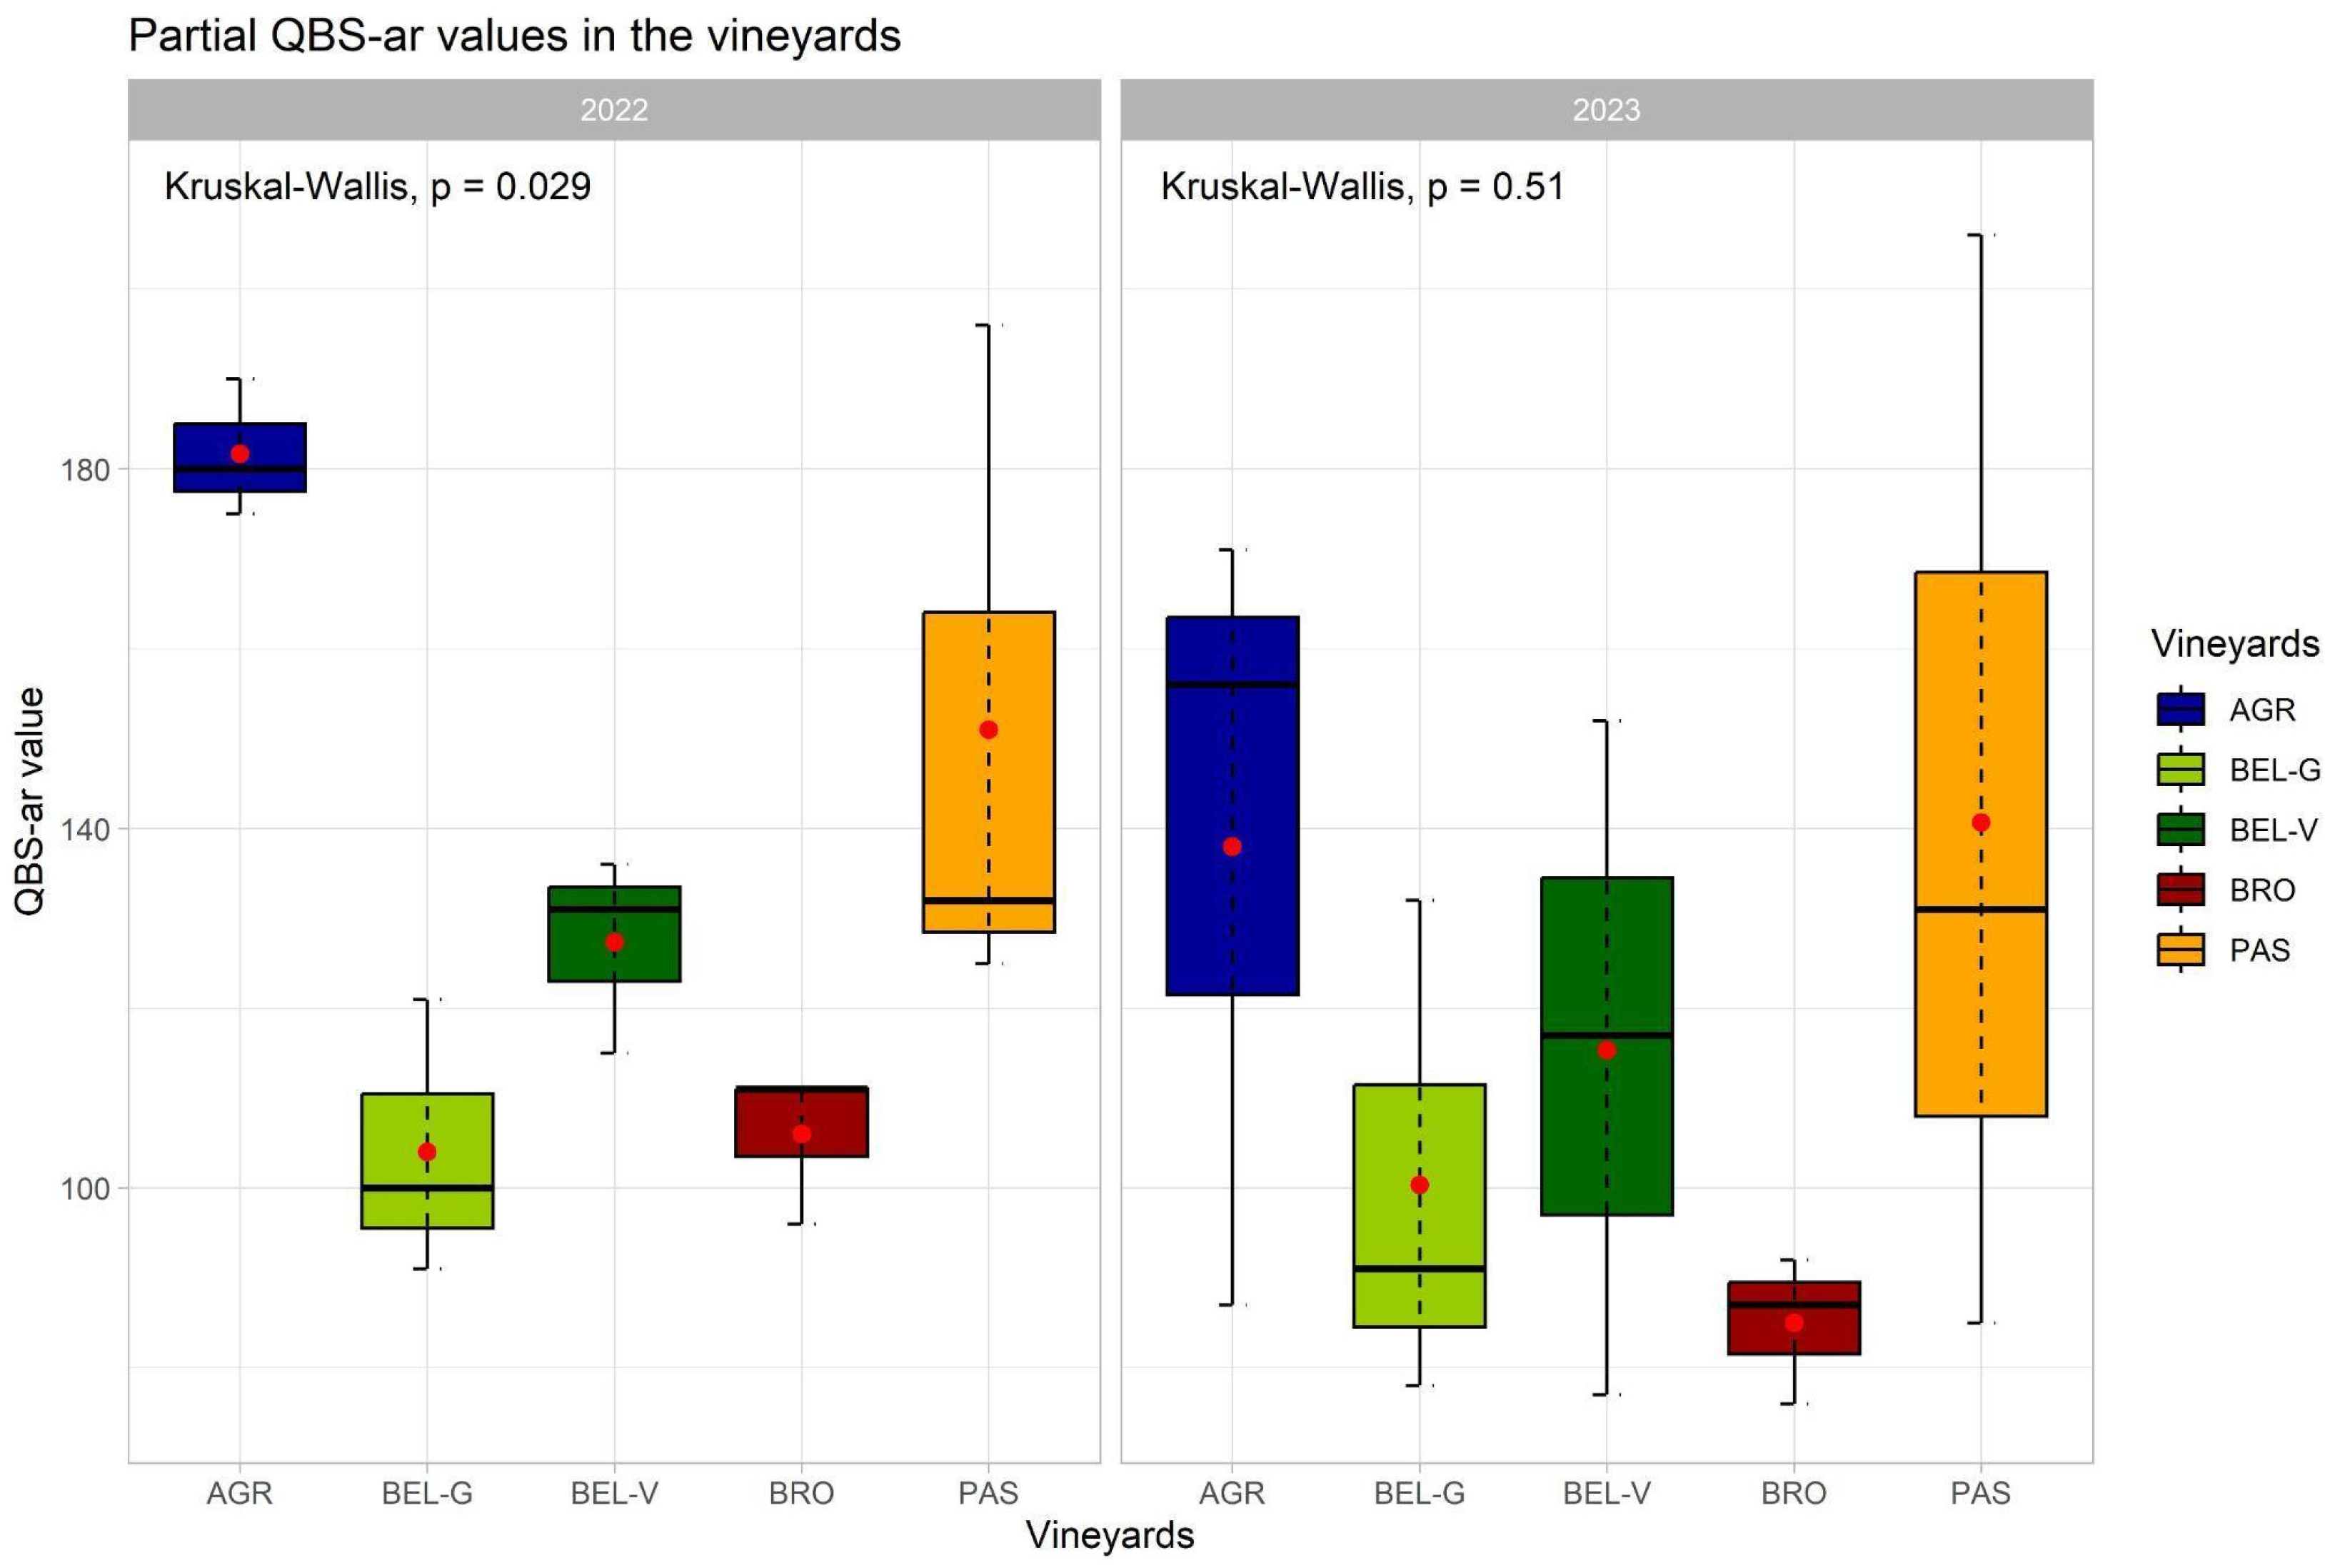
The overall soil quality of the vineyards analysed was excellent (Table 3). The total and average partial QBS-ar values registered in both years exceeded the threshold set for high biological quality in agricultural soils (93.7) [20,38]. In both 2022 and 2023, Az. Agr. Passacantando and Az. Agr. IIS G. Garibaldi vineyards recorded the highest QBS-ar values. This indicates that these farms have greater soil health, which can be attributed to their implementation of more sustainable agricultural practices. On the other hand, in both years, Brocani seemed to be the lowest performing farm; in its case, more biodiversity-friendly practices could be implemented to enhance soil biodiversity. In fact, during the two years examined, this was the only farm that received a lower soil quality judgment, although it was good. Soil quality certificates for each year and each vineyard are available online at: https://www.biocerto.it/certificati-biocerto.
3.3. B.I.O.C.E.R.T.O. Blockchain
The results obtained from soil and wine analysis allowed for the creation of the Biocerto Certificate. Each year of production (2021 and 2022) was associated with a Digital Certificate and a QR-code with its ID, which was then printed on the product packaging (the Digital Certificate of the bottle can be found on Biocerto.it). Operators have inserted all the obtained results into the Biocerto platform to produce a Biocerto Digital Certificate of the investigated wines and vineyard soils. An algorithm (SHA256) calculated the digital fingerprint of the Certificate (hash), which was a unique alphanumeric string and represented the cryptographic fingerprint of the document. In this way, any subsequent modification of the Certificate would produce an alphanumeric string different from the original. The alphanumeric string of the Original Certificate was recorded on the blockchain with a certain date, which can also be verified by third parties of the creation of the document. The blockchain ledger is freely accessible and verifiable at any time.
In addition, the B.I.O.C.E.R.T.O. project involved the installation of some physical computational nodes to be connected to the Blockchain network. In this way the notarization and the registration of the Certificates and laboratory and field analysis reports were included in a fast and reliable manner without additional costs, and with the certainty of possessing the “register” physically within the computational node. The cryptographic fingerprint of the Certificate was recorded in the register of a public blockchain.
To verify the conformity of the digital certificate with the original, it was possible to identify the information on the receipt, view the data it contains where the document’s alphanumeric string ‘docHash’ and all the registration details in the blockchain were listed.
4. Conclusion
This study presented a method for developing an open prototype that safely incorporates unalterable data to certify the quality of wine, considering both its chemical-physical composition and the sustainability of its production. Various techniques, including ultrasound spectroscopy and the analysis of soil mesofauna, to evaluate soil health, have been applied. Ultrasound spectroscopy, especially in terms of sound speed parameter, demonstrated a high sensitivity to discriminate among wines, at least comparable to that of the most common technique based on viscosity measurement. Indeed, as for the viscosity, ultrasound speed from wines seems to be mainly affected by the ethanol and sugar content.
To summarize, the overall approach aligns with the growing consumer interest and demand for products with certified origins and sustainable production practices that do not compromise biodiversity preservation. We are confident that this model can be applied to other businesses and other product types other than wine, and that it can be further implemented with additional analyses such as isotopic analysis [39] and further indicators of agroecosystem sustainability, including soil microbial communities and their enzymatic activity [40].
Author Contributions
D.R.P.: data curation, formal analysis, investigation, validation, visualization,writing - original draft, writing - review & editing; M.C.: data curation, formal analysis, investigation, validation, visualization,writing - original draft, writing - review & editing; B.S.: formal analysis, investigation, validation, visualization, writing - review & editing; A.D.: formal analysis, investigation,validation, visualization, writing - review & editing; F.F.: data curation, formal analysis, investigation, validation, visualization,writing - original draft, writing - review & editing; A.P.: resources, project administration; G.B.: conceptualization, methodology, validation, formal analysis, data curation, writing, reviewing, editing, visualisation, supervision, project administration, funding acquisition; A.L.T.: conceptualization, methodology, validation, formal analysis, data curation, writing, reviewing, editing, visualisation, supervision, project administration, funding acquisition. All authors have read and agreed to the published version of the manuscript.
Funding
The present work was financially supported by Marche Region, Rural Development Program 2014/22 — M16.1.A.2 Funding Operational Groups (B.I.O.C.E.R.T.O. project ID 41377) to Antonietta La Terza (A.L.T.) and Giulia Bonacucina (G.B.).
Acknowledgments
The authors would like to thank the agronomist Amleto Fioretti (https://www.studio-fioretti.com/, accessed on 18 February 2025), Edoardo Rosato and Ilaria Santandrea of the Copagri Marche (https://copagri.org/, accessed on 18 February 2025) for their assistance in promoting the results of our study. We would also like to thank the G. Garibaldi Agricultural School for hosting our experimental activities in their vineyard, and all the wineries involved in this study for providing wine samples and access to their vineyards.
References
- ISMEA - Relazione vendemmiale 2024. Available online: https://www.ismeamercati.it/flex/cm/pages/ServeBLOB.php/L/IT/IDPagina/13248 (accessed on Feb 3, 2025).
- Coldiretti Frodi a tavola fanno paura a due italiani su tre. Available online: https://www.coldiretti.it/economia/frodi-paura-tavola-due-italiani-3 (accessed on Feb 4, 2025).
- WineNews. Truffa del Verdicchio: 150000 litri di vino bianco comune spacciati come DOC. 4 June 2018. Available online: https://winenews.it/it/truffa-del-verdicchio-150-000-litri-di-vino-bianco-comune-spacciati-come-doc_365164/ (accessed on Feb 4, 2025).
- Popîrdă, A.; Luchian, C.E.; Cotea, V. V.; Colibaba, L.C.; Scutarașu, E.C.; Toader, A.M. A Review of Representative Methods Used in Wine Authentication. Agric. 2021, 11, 225. [Google Scholar] [CrossRef]
- Joint Research Centre - European Commission. Wine fraud – How genuine is your wine? Adulteration of wine is a worldwide issue affecting consumers. The JRC just released a Certified Reference Material (CRM) to verify the authenticity of wines (2021, 27 Jul). Available online: https://joint-research-centre.ec.europa.eu/jrc-news-and-updates/wine-fraud-how-genuine-your-wine-2021-07-27_en (accessed on Feb 7, 2025).
- Corbacho, J.Á.; Morcuende, D.; Rufo, M.; Paniagua, J.M.; Ontalba, M.Á.; Jiménez, A. Use of Non-Destructive Ultrasonic Techniques as Characterization Tools for Different Varieties of Wine. Sensors 2024, 24, 4294. [Google Scholar] [CrossRef] [PubMed]
- Bonacucina, G.; Perinelli, D.R.; Cespi, M.; Casettari, L.; Cossi, R.; Blasi, P.; Palmieri, G.F. Acoustic spectroscopy: A powerful analytical method for the pharmaceutical field? Int. J. Pharm. 2016, 503. [Google Scholar] [CrossRef]
- Zhang, Q.A.; Zheng, H.; Lin, J.; Nie, G.; Fan, X.; García-Martín, J.F. The state-of-the-art research of the application of ultrasound to winemaking: A critical review. Ultrason. Sonochem. 2023, 95, 106384. [Google Scholar] [CrossRef]
- García Martín, J.F. Applications of ultrasound in the beverage industry; Nova Publishers, 2016; ISBN 978-1-63485-069-8. [Google Scholar]
- McClements, D.J. Ultrasonic characterization of foods and drinks: principles, methods, and applications. Crit. Rev. Food Sci. Nutr. 1997, 37, 1–46. [Google Scholar] [CrossRef] [PubMed]
- Breazeale, M.A.; McPherson, M. Physical Acoustics. In Handbook of Acoustics; Springer: New York, 2007. [Google Scholar]
- Delmas, H.; Barthe, L.; Cleary, R. Ultrasonic mixing, homogenization, and emulsification in food processing and other applications. In Power Ultrasonics: Applications of High-Intensity Ultrasound, Second Edition ed; Woodhead Publishing, 2023; pp. 665–685. ISBN 9780128202548. [Google Scholar]
- Agrawal, M.; Prasad, A.; Bellare, J.R.; Seshia, A.A. Characterization of mechanical properties of materials using ultrasound broadband spectroscopy. Ultrasonics 2016, 64, 186–195. [Google Scholar] [CrossRef] [PubMed]
- Vergilio, M.M.; Vasques, L.I.; Leonardi, G.R. Characterization of skin aging through high-frequency ultrasound imaging as a technique for evaluating the effectiveness of anti-aging products and procedures: A review. Ski. Res. Technol. 2021, 27, 966–973. [Google Scholar] [CrossRef]
- Pandey, D.K.; Pandey, S. Don, Dissanayake, Ed.; Ultrasonics: A Technique of Material Characterization. In Acoustic waves; InTech, 2010; pp. 397–430. ISBN 9789533071114. [Google Scholar]
- Novoa-Díaz, D.; Rodríguez-Nogales, J.M.; Fernández-Fernández, E.; Vila-Crespo, J.; García-Álvarez, J.; Amer, M.A.; Chávez, J.A.; Turó, A.; García-Hernández, M.J.; Salazar, J. Ultrasonic monitoring of malolactic fermentation in red wines. Ultrasonics 2014, 54, 1575–1580. [Google Scholar] [CrossRef]
- Lamberti, N.; Ardia, L.; Albanese, D.; Di Matteo, M. An ultrasound technique for monitoring the alcoholic wine fermentation. Ultrasonics 2009, 49, 94–97. [Google Scholar] [CrossRef]
- Mazzocchi, C.; Ruggeri, G.; Corsi, S. Consumers’ preferences for biodiversity in vineyards: A choice experiment on wine. Wine Econ. Policy 2019, 8, 155–164. [Google Scholar] [CrossRef]
- Ghiglieno, I.; Simonetto, A.; Sperandio, G.; Ventura, M.; Gatti, F.; Donna, P.; Tonni, M.; Valenti, L.; Gilioli, G. Impact of Environmental Conditions and Management on Soil Arthropod Communities in Vineyard Ecosystems. Sustain. 2021, Vol. 13, Page 11999 2021, 13, 11999. [Google Scholar] [CrossRef]
- Parisi, V. La qualità biologica del suolo.Un metodo basato sui microartropodi. ACTA Nat. L’ATENEO Parm. 2001, 37, 105–114. [Google Scholar]
- Parisi, V.; Menta, C.; Gardi, C.; Jacomini, C.; Mozzanica, E. Microarthropod communities as a tool to assess soil quality and biodiversity: a new approach in Italy. Agric. Ecosyst. Environ. 2005, 105, 323–333. [Google Scholar] [CrossRef]
- Coletta, M.; Monticelli, M.; D’Alessandro, A.; Gentili, C.; Torresi, A.; Waris, N.; La Terza, A. Managing soil to support soil biodiversity in protected areas agroecosystems: a comparison between arable lands, olive groves, and vineyards in the Conero Park (Italy). Environ. Monit. Assess. 2025, 197, 200. [Google Scholar] [CrossRef]
- Di Giovanni, F.; Nardi, F.; Frati, F.; Migliorini, M. Below-ground arthropod diversity in conventional and organic vineyards: A review. Crop Prot. 2024, 180, 106666. [Google Scholar] [CrossRef]
- Maienza, A.; Remelli, S.; Verdinelli, M.; Baronti, S.; Crisci, A.; Vaccari, F.P.; Menta, C. A magnifying glass on biochar strategy: long-term effects on the soil biota of a Tuscan vineyard. J. Soils Sediments 2023, 23, 1733–1744. [Google Scholar] [CrossRef]
- Ghiglieno, I.; Simonetto, A.; Donna, P.; Tonni, M.; Valenti, L.; Bedussi, F.; Gilioli, G. Soil Biological Quality Assessment to Improve Decision Support in the Wine Sector. Agron. 2019, Vol. 9, Page 593 2019, 9, 593. [Google Scholar] [CrossRef]
- Gonçalves, F.; Nunes, C.; Carlos, C.; López, Á.; Oliveira, I.; Crespí, A.; Teixeira, B.; Pinto, R.; Costa, C.A.; Torres, L. Do soil management practices affect the activity density, diversity, and stability of soil arthropods in vineyards? Agric. Ecosyst. Environ. 2020, 294, 106863. [Google Scholar] [CrossRef]
- Cricelli, L.; Mauriello, R.; Strazzullo, S. Exploring blockchain adoption in the italian wine industry: insights from a multiple case study. Wine Econ. Policy 2024, 13, 89–104. [Google Scholar] [CrossRef]
- Buckin, V. High-resolution ultrasonic spectroscopy. J. Sens. Sens. Syst 2018, 7, 207–217. [Google Scholar] [CrossRef]
- Menta, C.; Leoni, A.; Conti, F.D. Il ruolo della fauna edafica nel mantenimento della funzionalità del suolo. In La percezione del suolo; Dazzi, C., Ed.; Le penseur: Brienza (PO), 2011; pp. 179–183. [Google Scholar]
- R Core Team A language and environment for statistical computing; Foundation for Statistical Computing: Vienna, 2021.
- Yaa’ri, R.; Schneiderman, E.; Ben Aharon, V.; Stanevsky, M.; Drori, E. Development of a Novel Approach for Controlling and Predicting Residual Sugars in Wines. Fermentation 2024, 10, 125. [Google Scholar] [CrossRef]
- Evangelou, A.; Kechagia, D.; Beris, E.; Tataridis, P.; Chatzilazarou, A.; Shehadeh, F.; Shehadeh, A. Correlation of Wine’s Main Components’ Concentration with the Density of Model Aqueous Solutions and Wine Samples. J. Food Eng. Technol. 2022, 11, 36–43. [Google Scholar] [CrossRef]
- Lavelle, P.; Decaëns, T.; Aubert, M.; Barot, S.; Blouin, M.; Bureau, F.; Margerie, P.; Mora, P.; Rossi, J.P. Soil invertebrates and ecosystem services. Eur. J. Soil Biol. 2006, 42, S3–S15. [Google Scholar] [CrossRef]
- D’Alessandro, A.; Coletta, M.; Torresi, A.; Dell’Ambrogio, G.; Renaud, M.; Ferrari, B.J.D.; La Terza, A. Evaluation of the Impact of Plant Protection Products (PPPs) on Non-Target Soil Organisms in the Olive Orchard: Drone (Aerial) Spraying vs. Tractor (Ground) Spraying. Sustain. 2024, 16, 11302. [Google Scholar] [CrossRef]
- Menta, C.; Conti, F.D.; Fondón, C.L.; Staffilani, F.; Remelli, S. Soil Arthropod Responses in Agroecosystem: Implications of Different Management and Cropping Systems. Agron. 2020, Vol. 10, Page 982 2020, 10, 982. [Google Scholar] [CrossRef]
- Dubie, T.R.; Greenwood, C.M.; Godsey, C.; Payton, M.E. Effects of Tillage on Soil Microarthropods in Winter Wheat. Southwest. Entomol. 2011, 36, 11–20. [Google Scholar] [CrossRef]
- Parisi, V.; Menta, C. Microarthropods of the soil: Convergence phenomena and evaluation of soil quality using QBS-ar and QBS-C. Fresenius Environ. Bull. 2008, 17, 1170–1174. [Google Scholar]
- Menta, C.; Conti, F.D.; Pinto, S.; Bodini, A. Soil Biological Quality index (QBS-ar): 15 years of application at global scale. Ecol. Indic. 2018, 85, 773–780. [Google Scholar] [CrossRef]
- Petrini, R.; Sansone, L.; Slejko, F. F.; Buccianti, A.; Marcuzzo, P.; Tomasi, D. The 87Sr/86Sr strontium isotopic systematics applied to Glera vineyards: A tracer for the geographical origin of the Prosecco. Food Chemistry 2015, 170, 138–144. [Google Scholar] [CrossRef]
- Aguiar, J.F.; Liberal, I.M.; Muñoz, M.L.; Cantos-Villar, E.; Puertas, B.; Archidona-Yuste, A.; Casimiro-Soriguer, R.; Coletta, M.; Gonzáles-Robles, A.; Gramaje, D.; et al. Development of whole-soil microbial inoculants based on solid-phase fermentation for the regeneration of the functioning of vineyard soils. In Rhizosphere; 2025; p. 101039. [Google Scholar]
Figure 2.
Viscosity (Pa s) vs shear rate (s-1) plots for the analysis on wines (BRO, BEL, and PAS) produced in 2022 year (A); Comparison between viscosity (Pa s, Mean ± SD, n=3) measured for the analysed wines (AGR, BRO, BEL, and PAS) produced in 2021 and 2022 years (B). .
Figure 2.
Viscosity (Pa s) vs shear rate (s-1) plots for the analysis on wines (BRO, BEL, and PAS) produced in 2022 year (A); Comparison between viscosity (Pa s, Mean ± SD, n=3) measured for the analysed wines (AGR, BRO, BEL, and PAS) produced in 2021 and 2022 years (B). .
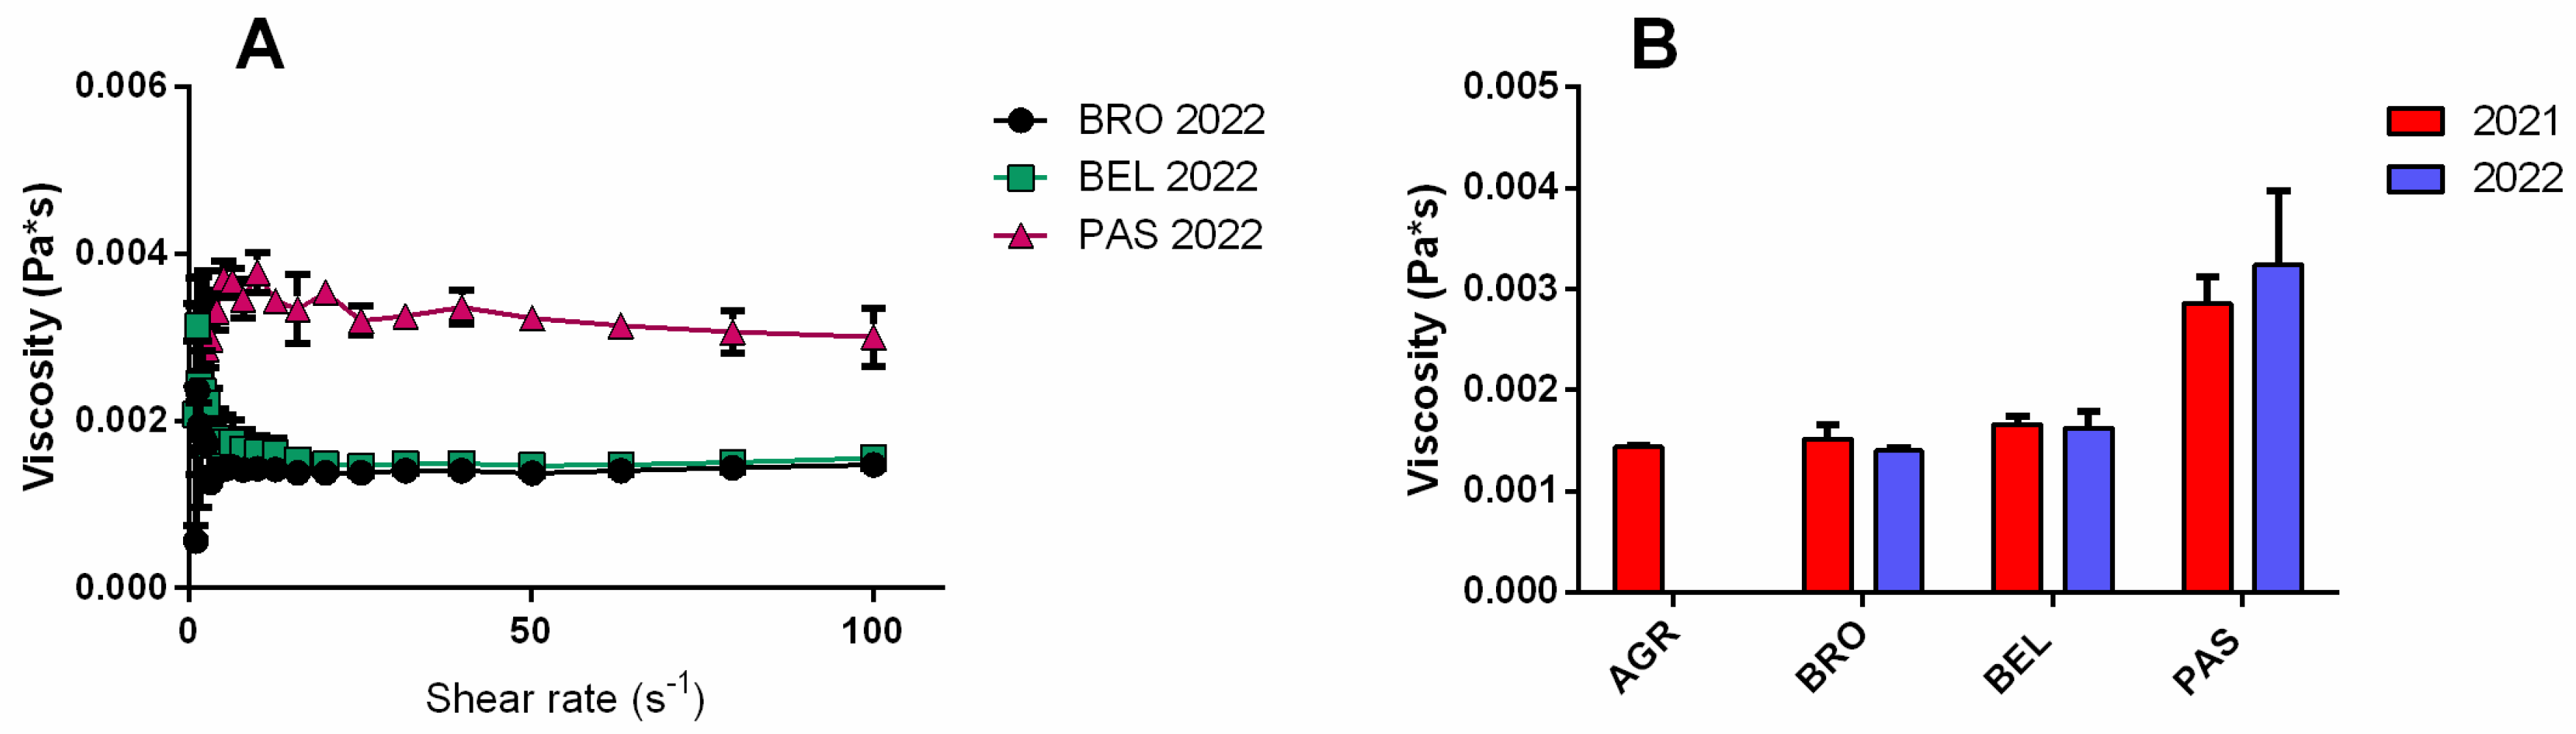
Figure 3.
Sound speed (m/s) vs time (s) plots for the analysis on wines (BRO, BEL and PAS) produced in 2022 year (A); Comparison between sound speed (mean ± SD, n=3) measured for the analysed wines (AGR, BRO, BEL and PAS) produced in 2021 and 2022 years (B). Attenuation (1/m) vs time (s) plots for the analysis on wines (BRO, BEL and PAS) produced in 2022 year (C); Comparison between attenuation (mean ± SD, n=3) measured for the analysed wines (AGR, BRO, BEL, and PAS) produced in 2021 and 2022 years (D).
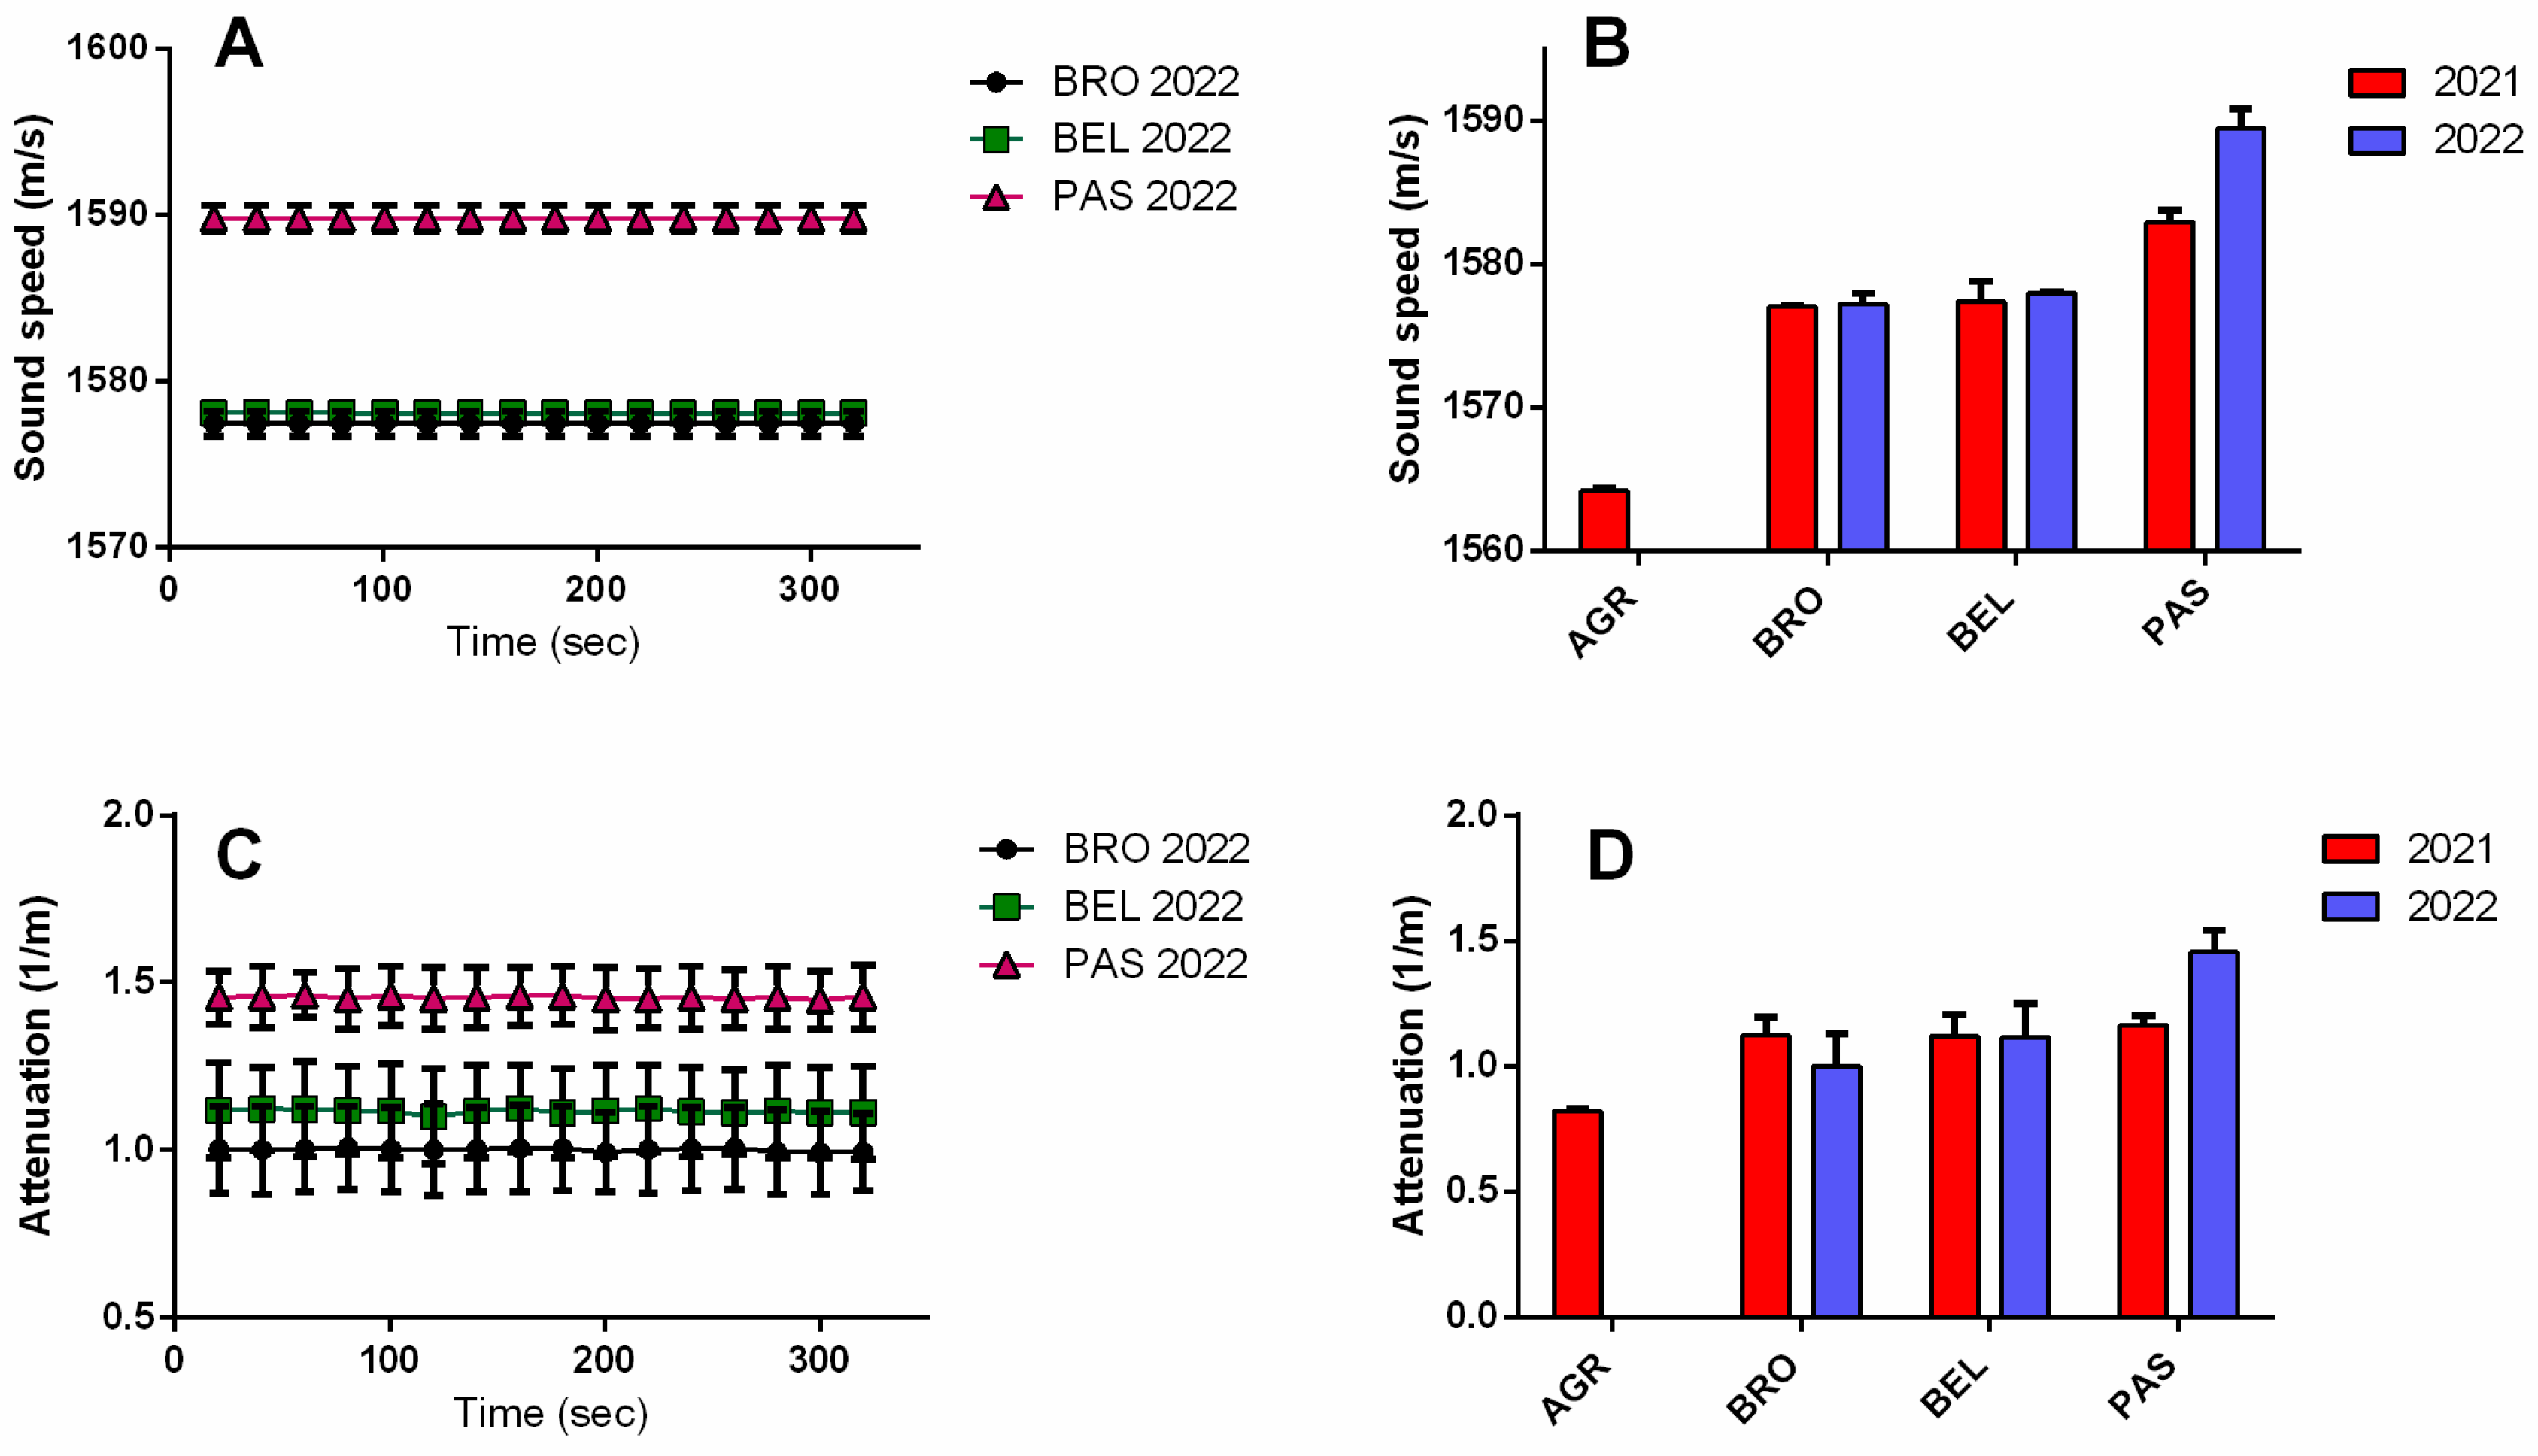
Figure 4.
Variation of sound speed (m/s) (A) and variation of attenuation (1/m) (B) vs concentration (% w/w) for standard solution of saccharose and ethanol at different concentrations (4, 8, 12, 16 % w/w).
Figure 4.
Variation of sound speed (m/s) (A) and variation of attenuation (1/m) (B) vs concentration (% w/w) for standard solution of saccharose and ethanol at different concentrations (4, 8, 12, 16 % w/w).
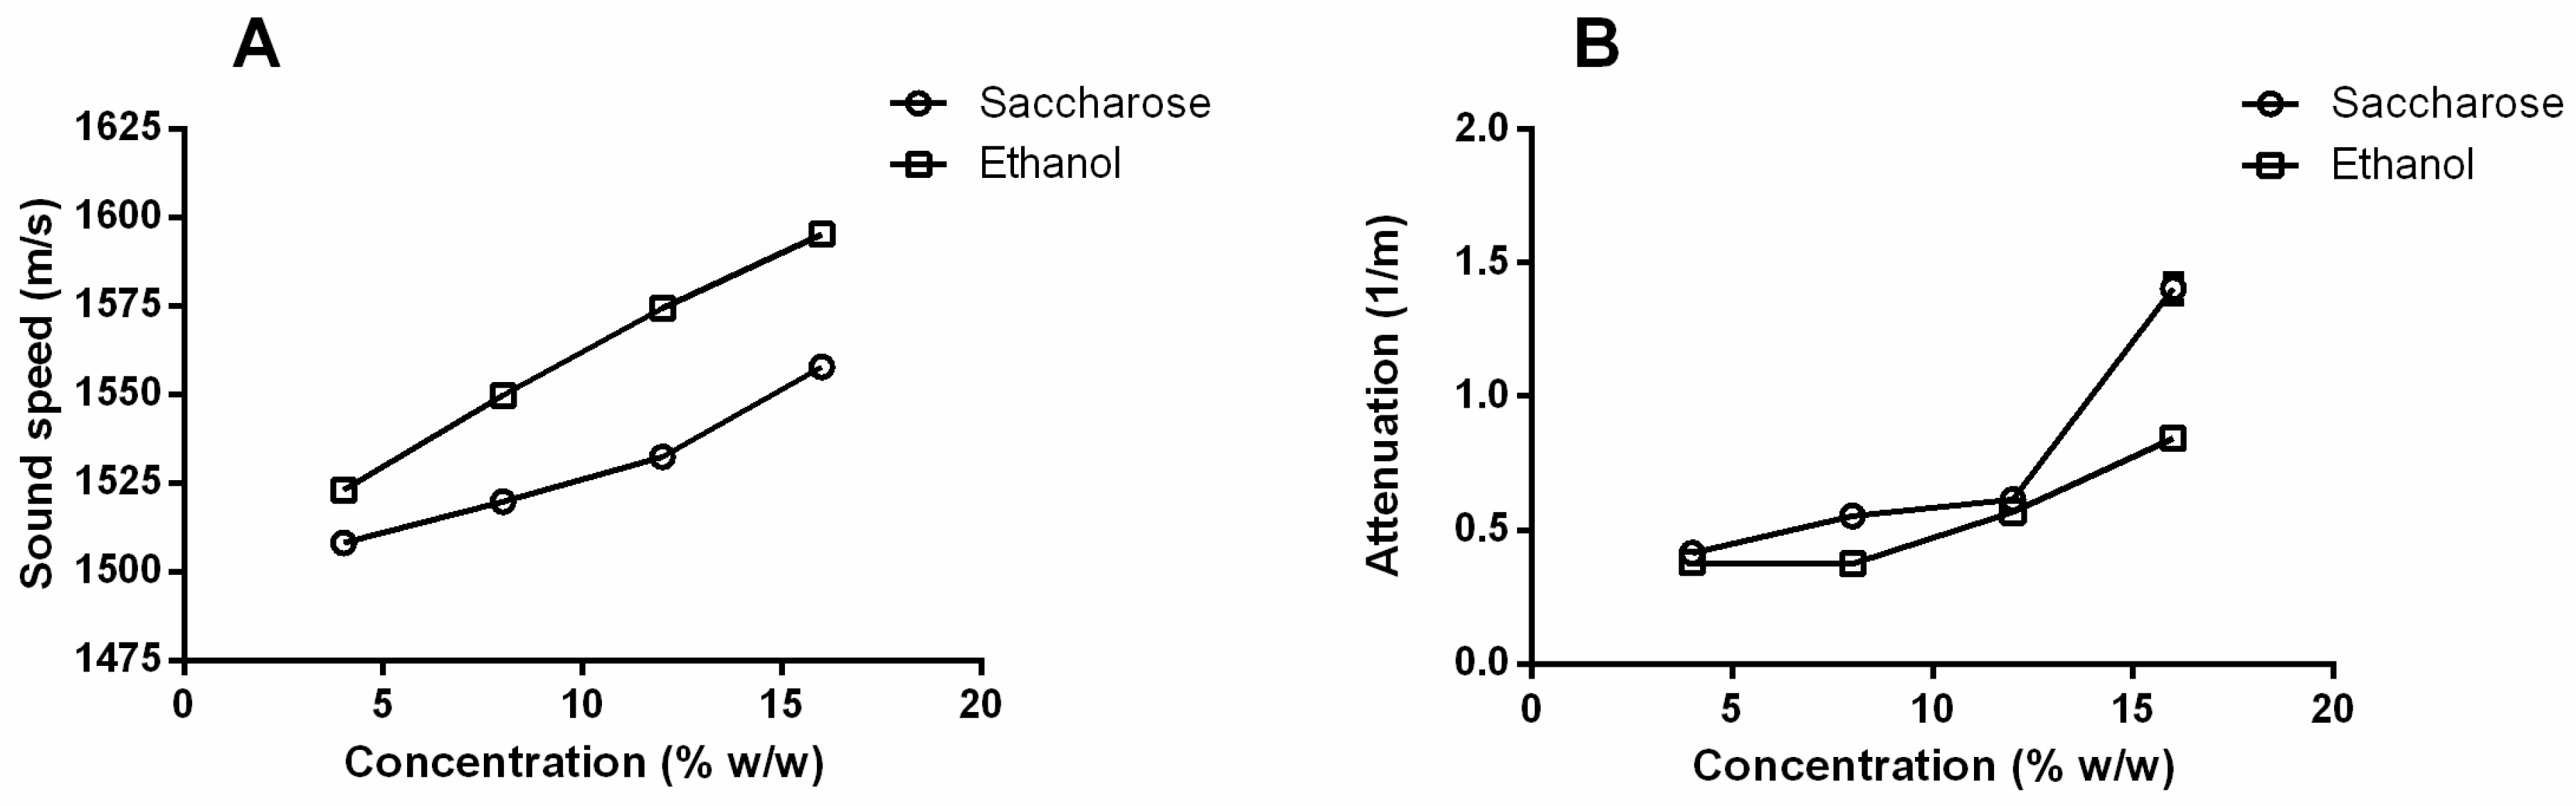

Table 1.
Farms and vineyards involved in the study. In brackets is reported the commercial name of the bottle of wine used through the study.
Table 1.
Farms and vineyards involved in the study. In brackets is reported the commercial name of the bottle of wine used through the study.
| Farms | Vineyard ID | Location | Geographical coordinates | Wine | Berry type | |
| Az. Agr. I.I.S. G. Garibaldi | AGR | Macerata (MC) | 43°17′8.83″ N | 13°25°9.03″ E | Maceratino | White |
| Az. Agr. Brocani | BRO | Staffolo (AN) | 43°27′5.89″ N | 13°9′21.99″ E | Verdicchio dei Castelli di Jesi PDO Classico Superiore (Ligami) | White |
| Az. Agr. Passacantando | PAS | Tolentino (MC) | 43°14′24.07″ N | 13°17′14.09″ E | Sangiovese | Red |
| Cantina Belisario | BEL-G | Matelica (MC) | 43°15′9.85″ N | 12°59′14.87″ E | Verdicchio di Matelica PDO (Vigneti B) | White |
| Cantina Belisario | BEL-V | Matelica (MC) | 43°15′7.95″ N | 12°59′6.17″ E | Verdicchio di Matelica PDO (Vigneti B) | White |
Table 2.
Refractive index, Brix, density values (g/mL) and ethanol content (% v/v) for the three wines produced in 2022 (BRO, BEL and PAS) and the AGR wine produced in 2021.
Table 2.
Refractive index, Brix, density values (g/mL) and ethanol content (% v/v) for the three wines produced in 2022 (BRO, BEL and PAS) and the AGR wine produced in 2021.
| Refractive index | Brix values (°Bx) | Density (g/mL) |
Ethanol content (% v/v)* | |
| BRO 2022 | 1.343-1.344 | 7-7.5 | 0.9895-0.9896 | 14 |
| BEL 2022 | 1.343-1.344 | 7-7.0 | 0.9901-0.9902 | 13 |
| PAS 2022 | 1.347-1.348 | 9-9.5 | 0.9950-0.9951 | 14 |
| AGR 2021 | 1.341-1.342 | 6-6.5 | 0.9894-0.9895 | 11 |
* Ethanol content (% v/v) are from the manufacturer.
Table 3.
Total QBS-arl values obtained in each vineyard in 2022 and 2023, and related soil quality judgments [29].
Table 3.
Total QBS-arl values obtained in each vineyard in 2022 and 2023, and related soil quality judgments [29].
| Vineyard | 2022 | Soil quality judgment | 2023 | Soil quality judgment |
| AGR | 200 | Excellent | 192 | Excellent |
| BRO | 161 | Excellent | 143 | Good |
| PAS | 227 | Excellent | 212 | Excellent |
| BEL-G | 162 | Excellent | 163 | Excellent |
| BEL-V | 171 | Excellent | 193 | Excellent |
Disclaimer/Publisher’s Note: The statements, opinions and data contained in all publications are solely those of the individual author(s) and contributor(s) and not of MDPI and/or the editor(s). MDPI and/or the editor(s) disclaim responsibility for any injury to people or property resulting from any ideas, methods, instructions or products referred to in the content. |
© 2025 by the authors. Licensee MDPI, Basel, Switzerland. This article is an open access article distributed under the terms and conditions of the Creative Commons Attribution (CC BY) license (http://creativecommons.org/licenses/by/4.0/).
Copyright: This open access article is published under a Creative Commons CC BY 4.0 license, which permit the free download, distribution, and reuse, provided that the author and preprint are cited in any reuse.


