
Submitted:
24 February 2025
Posted:
25 February 2025
You are already at the latest version
Abstract
This article provides a comprehensive analysis of predictive models for individual cancer risk, examining their development, application, and evaluation. The study covers various cancer types, highlighting the diversity and sophistication of models over time. Utilizing data from PubMed, Web of Science, and Scopus, the research includes models developed for 22 cancer types, with significant emphasis on breast and colorectal cancers due to their prevalence and early detection benefits. The analysis reveals an uneven distribution of models, often concentrated in the United States and the United Kingdom, with a notable gap in models for rarer cancers. Key methodologies such as logistic regression and Cox proportional hazards models dominate the field, reflecting a preference for established statistical techniques. The study underscores the importance of incorporating multiple risk factors, including genetic, environmental, lifestyle, and clinical data, to enhance predictive accuracy. Despite advancements, the article identifies a critical need for external validation and standardization in reporting practices to improve model reliability and generalizability. The findings emphasize the potential of these models in personalized cancer prevention and early detection, while also calling for continued research and methodological harmonization to address existing gaps and challenges.
Keywords:
Cancer Risk Prediction
; Predictive Models
; Risk Factors
; Model Validation
; Personalized Medicine
1. Introduction
The genesis of cancer risk prediction models dates back several decades, with pioneering efforts aimed at identifying individuals at higher risk of developing chronic diseases. Among the first of these was the Framingham Coronary Risk Prediction Model introduced in 1976 [1], which utilized a combination of clinical and biological factors to estimate the risk of heart disease. This model set the precedent for future endeavors in risk prediction, demonstrating the utility of incorporating multiple risk factors into a cohesive model to inform clinical decision-making. Its success paved the way for the development of models focused on cancer risk, beginning in earnest in the late 1980s and early 1990s. These early models primarily targeted breast cancer, integrating known risk factors such as age, reproductive history, and family history to calculate an individual's absolute risk of developing the disease over a specified timeframe.
The interest in and reliance on cancer risk prediction models have only intensified since. Today, the proliferation of digital platforms, from informational websites to comprehensive handbooks and professional society resources, underscores the growing public and professional interest in these tools. This is further evidenced by the emergence of companies offering genetic risk profiling services and the prioritization of risk prediction research by leading cancer institutions like the National Cancer Institute (NCI). The NCI, recognizing the significance of risk prediction in cancer research, has highlighted it as an area of "extraordinary opportunity" [2].
However, as the number of cancer types studied and the sophistication of predictive models have expanded, so too has the variability in their development, application, and evaluation. The proliferation of models has led to a landscape marked by significant disparities in the number and type of models available for different cancer types. This uneven distribution raises important questions about the factors driving these disparities and the implications for cancer risk prediction across the spectrum of disease. It underscores the need for a comprehensive examination of the current state of cancer risk prediction modeling, with a focus on understanding the diversity of approaches and the challenges and opportunities they present.
This article aims to delve into these issues, providing a thorough analysis of the existing landscape of cancer risk prediction models. By examining the differences in the number and nature of models developed for various cancer types, it seeks to shed light on the complexities of predicting cancer risk and the implications for clinical practice, public health policy, and future research directions.
2. Materials and Methods
2.1. Study Selection
We evaluated cancer risk prediction models by searching PubMed, Web of Science, and Scopus up to December 2023. Inclusion criteria mandated studies to be peer-reviewed, detailed risk models of cancer. Diagnostic models were included, but diagnostic testing studies were excluded, as were feasibility studies and cost-benefit studies. Models for the development of a second cancer were included, but prognostic models for the risk of cancer relapse, metastasis or cancer-specific survival were excluded.
2.2. Data Extraction and Synthesis
For each study, we extracted comprehensive data including model name, year, type, targeted population, geographical area, follow-up duration, number of subjects, derivation set size, validation metrics, discrimination power, factors incorporated, TRIPOD level, data sources, data collection years, participant age, prediction rule risk thresholds, study design, methods, applicability, strengths, limitations, risk measures, calibration, accuracy (sensitivity/specificity), independent testing, inclusion/exclusion criteria, prognostic/diagnostic focus, validation efforts, and reproducibility.
3. Results
3.1. Type of Cancer
Our comprehensive analysis encompassed a wide array of cancer types, each represented by distinct models focusing on risk prediction. The models spanned across 22 cancer types (Table 1). This diverse collection illustrated the breadth of research efforts aimed at developing predictive models that incorporate a range of risk factors.
We did not find any model for Cancer of the brain or nervous system, Kaposi sarcoma, Mesothelioma, Penis cancer, Anal cancer, Vaginal cancer, Bone sarcoma, Soft tissue sarcoma, Small intestine cancer, and Sinonasal cancer. There are several possible reasons for this.First, some cancers, such as Kaposi sarcoma and Sinonasal cancer, are relatively rare, making it challenging to gather sufficient data for model development. Second, several of these cancers might have complex pathophysiologies that may complicate risk prediction modeling. And third, there may be less research focus or funding for certain cancers compared to more prevalent types like breast or lung cancer. In any case, the research focus is clearly skewed towards the most frequent cancers [3] and particularly towards cancers for whom early diagnosis might be the most feasible and beneficial. Efforts are now underway to have such models inform screening [4].
The integration of subtype-specific data into cancer risk prediction models offers a nuanced approach that may significantly enhance the accuracy and clinical utility of these models.We have provided an overview of the different subtypes for the cancers for whom it was most relevant, namely colorectal cancer, esophageal cancer, head and neck cancer, and prostate cancer (Figure 1). The underlying logic for the development of specific models within these cancers is somewhat different for each.
Colorectal cancer encompasses 2 distinct subtypes based on location, with notable differences between colon cancer and rectal cancer in terms of location, progression, and response to treatment. Esophageal cancer subtypes are distinguished by their cellular origins (adenocarcinoma and squamous cell carcinoma), presenting unique challenges in risk prediction. The subtype analysis helps in understanding the etiological differences — primarily tied to acid reflux and smoking or alcohol consumption, respectively. H&N cancers are notable for their large number of subsites, making it difficult to include sufficient patients for each specific subsite. Prostate cancer models are primarily divided by clinical relevance. These distinctions are useful, since they can significantly influence the management strategies. Indolent tumors might require active surveillance, whereas aggressive forms demand more intensive treatment modalities.
3.2. Year of Publication
The earliest model we identified was published in 1988 and models have continued to be published up until the present (Figure 2). Upon examining the frequency of publications over these years, we see steadily rising interest in the field, although we also observe a non-uniform distribution. The late 1980s and early 1990s show sporadic activity with a few publications, signaling the nascent stages of cancer risk modeling. This period likely represents the foundational research efforts, characterized by pioneering studies exploring the feasibility and methodologies for cancer risk prediction. A good example of this is the Gail model for breast cancer [5] which was published in 1989 and has not only been adapted to specific populations [6], but has also led to the development of other models that have tried to imitate its unique methodology [7,8,9]. Starting in 2000, we see a noticeable uptick in the number of publications, which could be attributed to advances in computational methods, increased availability of epidemiological data, and a growing recognition of the potential for predictive models in personalizing cancer screening and prevention strategies. This continued interest is likely driven by the integration of new technologies (e.g., machine learning, big data analytics) into risk modeling, the identification of new risk factors through genomic studies, and a push towards more personalized and precise oncology.
3.3. Applicability
The examination of target populations for the applicability of newly developed cancer risk prediction models reveals a broad spectrum of demographics and clinical conditions, reflecting the diverse nature of cancer risk factors and tailored preventive strategies (Figure 2). For this analysis, we did not take ethnic background or nationality into account, since this is inherent in the development population. We did not represent age criteria to allow for easier representation of the data. Without considering such age criteria, roughly half of the prediction models were applicable to the general public. The pronounced emphasis on gender-specific cancer risk prediction models can be largely attributed to the prevalence of breast and prostate cancers, which are the most common cancers among women and men, respectively. This focus is not only reflective of the high incidence rates but also underscores the significant impact these cancers have on public health.
Models tailored to chronic hepatitis (3.8%), other medical conditions (1.7%) and symptomatic patients (1.9%) highlight the integration of clinical indicators in risk prediction and a move towards more personalized medicine.
Targeted models for high-risk groups, including those with a family history of breast (1.6%) or ovarian cancer (1.0%), point towards the use of genetic information and family medical history as critical components in predicting cancer risks. These models are crucial for early intervention strategies in populations known to carry higher genetic risks.
3.4. Population Used for Development
Our analysis of the geographical areas utilized for the development of such models reveals a concentrated effort across a select number of countries, with the United States (USA) and the United Kingdom (UK) leading in terms of the volume of contributions (Figure 2). This distribution highlights the significant engagement of these countries in cancer research and particularly their pivotal role in the development of large databases that are critical in the development of risk prediction models.
The geographical distribution of cancer risk prediction model development efforts also reflects a targeted approach, often dictated by the incidence rates of specific cancers within regions. This targeted focus is not arbitrary but a strategic alignment with the pressing needs of each region, informed by the prevalent cancer types. For example, liver cancer, which has a markedly higher incidence in Asia compared to Western countries, sees a proportionately larger number of predictive models developed within Asian countries. This regional concentration in model development is driven by the imperative to address the most significant cancer threats affecting the population, leveraging local research capacities and clinical insights to devise accurate predictive tools.
The emphasis on developing region-specific models based on prevalent cancer types does not necessarily detract from the global utility of these models. Instead, it highlights the complexity of cancer as a global health challenge and underscores the importance of a multifaceted approach in prediction model development. However, what might pose a potential limitation in the global applicability of these models is the underrepresentation of many other countries and regions. This skew towards data from predominantly Western and Asian populations might limit the effectiveness of the prediction models when applied to populations with different genetic backgrounds, lifestyles, and environmental exposures.
The integration of data from multinational studies into these models serves to bridge the gap between regional specificity and global applicability. This approach ensures that the models are not only reflective of the unique cancer profiles of different regions but are also versatile enough to be adapted across various global contexts.
The development of robust cancer risk prediction models is critically dependent on the demographic and statistical characteristics of the subjects included in the development cohorts. An analysis of the cohort sizes used across various studies provides insights into the statistical power and potential generalizability of the resulting models (Figure 2).
A significant number of studies rely on relatively small cohorts. While these studies can offer highly detailed data on specific populations, they may lack the statistical power necessary for broader applicability and may be more prone to overfitting. Larger cohorts can provide the robust data needed to account for a variety of genetic, environmental, and lifestyle factors that influence cancer risk. They also typically provide a more reliable basis for developing predictive models due to their greater diversity and statistical power. However, the feasibility of assembling such large cohorts often limits their availability. Therefore, strategies that combine data from multiple smaller studies (meta-analysis) or the use of synthetic data augmentation techniques may be necessary to enhance the predictive accuracy and generalizability of risk models.
3.5. Inclusion/Exclusion Criteria
Inclusion and exclusion criteria of the population used to develop a model is critical, as they directly influence the model's applicability, accuracy, and generalizability. We scored the inclusion and exclusion criteria for its specificity and comprehensiveness. Based on the content and specificity of the descriptions, criteria were classified into three categories (Figure 3).
Strong criteria were often detailed and tailored to the study’s specific cancer type or risk factor. For example, criteria such as "Patients aged ≥18 years referred for haematuria investigations" and "Previous history of bladder cancer" reflect a focused approach to participant selection, aiming to isolate effects of specific variables on cancer risk.
Moderate criteria, while still significant, offered less granularity. These included conditions like general cancer histories or broader demographic specifications, e.g., "No prior history of cancer (except nonmelanoma skin cancer)" or "African-American ethnicity aged 35–64 years." Such criteria help refine the study population but do not delve into as much detail as strong criteria.
Weak criteria were noted to be the least specific, sometimes due to incomplete data or overly broad definitions, such as participants described simply by lack of certain diagnostic data or minimal demographic details without further health specifications.
The strength of inclusion and exclusion criteria is pivotal in determining the precision and relevance of cancer risk prediction models. Strong criteria enhance the model’s predictive power by ensuring that the cohort closely matches the intended population. However, overly restrictive criteria can limit the generalizability of the results. Therefore, it is important to clearly define criteria without diluting the predictive accuracy due to a less targeted participant pool.
3.6. Reproducibility
In the context of cancer risk prediction models, user-friendliness and accessibility are essential for ensuring that these tools can be widely adopted and effectively utilized across various clinical and research settings, particularly because automated tools remain relatively rare [10]. We used a scoring system, with each entry categorized according to its implied ease of use based on several indicators:
- Easy: Models that allowed for straightforward usage by including elements such as scoring tables, nomograms or simple formulas. Models that were supported by a website or mobile application were also included here.
- Medium: Models that required a working knowledge of statistics or dedicated software to reproduce were included here to reflect a moderate level of user accessibility.
- Hard: Models involving advanced methods like machine learning or missing significant information.
This analysis reveals a significant proportion of cancer risk prediction models that are user-friendly, potentially facilitating broader adoption and application in diverse settings (Figure 3). We consider this to be of critical importance, particularly because we have attempted to reproduce a large number of these models by way of a mobile application [11], thereby facilitating access to them. However, the considerable number of models with moderate or challenging ease of use highlights the ongoing need for improved design and documentation practices to make these tools more accessible.
3.7. Discrimination Power
Discriminatory power, measured by the Area Under the Receiver Operating Characteristic Curve (AUROC), is crucial for the clinical utility of cancer risk models. Our dataset comprises AUROC values derived from various studies or models focused on cancer risk prediction. A total of 716 AUROC values were extracted and analyzed after appropriate data cleaning, including conversion of percentage values and removal of entries before validation (Figure 3). The concentration of scores around the upper end of the spectrum (0.85-0.89) suggests that most cancer risk prediction models perform well in distinguishing between high-risk and low-risk individuals [12]. This high level of performance is essential for models used in clinical settings where the cost of false negatives (failing to identify at-risk individuals) can be significant.
A small number of models exhibit AUROC values below 0.7, which, while still considered acceptable, indicate lower predictive accuracy. These models may require further refinement or might be specific to cancers that are inherently more challenging to predict due to overlapping symptoms with other conditions or less distinct biomarker profiles.
The histogram's wide spread also raises important considerations regarding the variability in model construction, such as differences in underlying algorithms, training datasets, and the specific cancer types being predicted. For instance, models trained on large, well-annotated datasets or those utilizing more advanced machine learning techniques may demonstrate higher AUROC values.
3.8. TRIPOD Level
The Transparent Reporting of a multivariable prediction model for Individual Prognosis Or Diagnosis (TRIPOD) statement, which came out in 2015 [13], encompasses a checklist of 22 essential items, designed to standardize the reporting of studies that develop, validate, or update multivariable prediction models, irrespective of the diagnostic or prognostic aim.
The primary thrust of the TRIPOD guidelines is to foster transparency in reporting prediction model studies. This is achieved by mandating detailed disclosures regarding model development, statistical analysis, validation processes, and performance metrics. Specifically, the guidelines advocate for the explicit reporting of external validation efforts, which are indispensable for gauging a model's generalizability and performance in real-world scenarios. The initiative categorizes predictive models based on their developmental and validation stages into distinct levels: 1a, 1b, 2a, 2b, 3, and 4.
In analyzing the distribution of TRIPOD levels within our dataset, it's evident that the practices surrounding the development and validation of predictive models vary significantly across studies (Figure 3). We can say that roughly one quarter of the published models rely solely on apparent performance, one quarter exclusively use resampling techniques, one quarter randomly split the data in development and validation sets and one quarter tries to externally validate the model. In other words, for a clear majority of the models attempts were to validate them, although one a minority externally validated them. A larger focus on external validation would be welcome, since this is crucial for determining the generalizability and applicability of predictive models across different populations and settings. Furthermore, for almost a quarter of the models, no validation efforts were made. This is unfortunate, since techniques such as bootstrapping or cross-validation are possible even when data are limited, while still mitigating overfitting and providing a more robust estimate of model performance. The observed distribution reflects a growing recognition within the scientific community of the need for rigorous evaluation methods to ensure the reliability and generalizability of prediction models.
It should be noted that no additional searches were made for independent validations of the models, which explains the low number of level 4 publications, and that many of the studies that externally validated their data also used resampling techniques beforehand.
3.9. Data for Development
The dataset shows a significant reliance on prospective cohort studies (36.4%), valued for their ability to establish temporal sequences between risk factors and cancer outcomes (Figure 4). Retrospective cohort studies (21.8%) offer cost-effective exploration of large populations and historical data, crucial for hypothesis generation. Case-control studies (21.4%) are efficient for studying rare cancers by comparing individuals with and without cancer to identify risk factors.
Interestingly, the dataset also includes Pooled Cohort and Pooled Case-Control studies, signifying a collaborative effort to enhance statistical power and generalize findings across different populations. These pooled analyses, though less common, demonstrate the research community's commitment to overcoming individual study limitations and variability in risk factor exposure across populations.
3.10. Model Methodology
The analysis shows a clear preference for "Logistic regression" and "Cox proportional hazards model" designs, making up almost two-thirds of the models. Logistic regression, used in 44.2% of the cases, is favored for its straightforward interpretation of binary outcomes like cancer presence, aiding clinical decision-making (Figure 4). Cox proportional hazards model, at 20.4%, excels in survival analysis, crucial for assessing variables affecting time to events such as recurrence or mortality, thanks to its ability to handle censored data and time-dependent variables. Additionally, "Other" models, which account for 24.2%, indicate researchers' openness to diverse and innovative methods for complex cancer-related questions.
The aggregation category "Other", which constitutes approximately 24.2% of the studies, was used to group modeling strategies that occurred 5 times or less. Its significant size demonstrates the willingness among researchers to innovate and tailor approaches to complex cancer-related questions. Of note, 2.3% of models relied on the Gail method, which was developed specifically for cancer risk prediction [5].
3.11. Calibration
Calibration ensures cancer risk prediction models' predicted probabilities match observed outcomes, enhancing model reliability and clinical decision-making [14]. Calibration was primarily evaluated using calibration plot analysis, the Hosmer-Lemeshow test and calculating the observed-to-expected ratio (Figure 4).
The high number of “NR” (Not Reported) entries indicate that calibration is underreported, particularly when compared to discrimination. The common use of the Hosmer-Lemeshow test and calibration plot analysis indicates their popularity in assessing model calibration. The 'Other/combination' category reflects mixed reporting practices, highlighting the need for standardized reporting.
3.12. Factors Incorporated
As depicted in the accompanying bar graph, there is a significant variance in the number of risk factors utilized across different models (Figure 4). The majority of models incorporate between 4 and 10 risk factors, suggesting a preference for models that balance predictive power and model simplicity.
Notably, the models employing exactly 5 risk factors represent the peak in our distribution, indicating a common model configuration that may offer an optimal balance between complexity and ease of interpretation. This could be reflective of the fact that beyond a certain point, adding more risk factors can lead to diminishing returns in terms of predictive accuracy and model usability.
A notable observation from the analysis of cancer risk prediction models is the relatively large number of models that utilize only one risk factor. This phenomenon may initially seem counterintuitive given the complex nature of cancer, but two key factors contribute to its prevalence. First, the single risk factor in question is often a score of some sort that relies on several elements. These are usually high-resolution imaging and sophisticated genetic sequencing techniques, allowing for comprehensive insights. Second, the models in question were usually developed for highly selected target groups, which is clear from the intended inclusion and exclusion criteria for their development cohort.
The presence of models with 20 or more risk factors highlights an approach where extensive data collection and analysis are prioritized. These models, although less common, were usually models employing machine learning or where highly individualized clinical information was available. The risk factors in these models might include genetic markers, lifestyle factors, and detailed medical histories, which can significantly enhance predictive accuracy at the cost of increased data requirements and computational complexity.
Still, this accounts for a relatively modest number of models, suggesting a threshold beyond which the inclusion of additional risk factors may not be practical or beneficial in everyday clinical practice.
The analysis of the most frequently incorporated risk factors across various models offers a revealing glimpse into the current priorities and methodologies in cancer risk assessment (Figure 5).
The most prominent risk factors are:
- Age and Gender: Unsurprisingly, age remains the most commonly cited risk factor, reflecting its fundamental influence on cancer susceptibility across multiple types. Similarly, gender is frequently considered, underlining specific cancer risks that are prevalent in either males or females, such as prostate and breast cancers, respectively.
- Genetic Markers: The inclusion of genetic markers, notably Polygenic Risk Scores and SNPs (Single Nucleotide Polymorphisms), highlights a significant shift towards genetic profiling in cancer prediction. These factors are crucial for assessing hereditary risks and are increasingly used to personalize screening and prevention strategies.
- Family History: This risk factor, often broken down into specific cancers such as lung cancer, underscores the importance of genetic predispositions in cancer risk assessments. The recurrence of family history across various models indicates a general consensus about its predictive value for hereditary cancer types.
- Lifestyle Factors (Smoking, Alcohol): Lifestyle choices such as smoking and alcohol consumption are well-represented in cancer risk models. These modifiable risk factors are critical for public health strategies and are actionable in preventative measures.
- Ethnicity: The inclusion of ethnicity and race as consolidated factors reflects the recognition of different cancer risks and outcomes among ethnic groups, possibly due to genetic, socioeconomic, or environmental variations.
- Medical History & Symptoms: Conditions like diabetes have been linked to an increased risk of certain cancers, illustrating the interconnected nature of chronic diseases and cancer risk.
The diversity of these risk factors across models points to a multi-faceted approach to cancer risk prediction, where both genetic and environmental factors are considered. This broad spectrum of risk factors aids clinicians in developing more accurate risk assessments and tailored prevention strategies. Moreover, it emphasizes the need for interdisciplinary research to further refine the impact of each risk factor on cancer development.
4. Discussion
We have mapped the landscape of cancer risk prediction models, illustrating a diversity of approaches that span traditional epidemiological factors and emerging methodologies. The variation in model development, validation, and performance metrics across different cancer types highlights the multifaceted nature of cancer risk prediction and the ongoing evolution of research methodologies in this field.
A key observation from our analysis is the nuanced manner in which risk factors are integrated into predictive models. While genetic markers, including polygenic risk scores, play a role in certain models, it's evident that the most robust models incorporate a blend of genetic, environmental, lifestyle, and clinical factors. This comprehensive approach mirrors the complex etiology of cancer, suggesting that an interplay of diverse risk factors contributes to the disease's development.
This paper underscores a prevalent challenge in the external validation of risk prediction models. Many models have not undergone rigorous testing in diverse populations, which raises questions about their generalizability and utility in broader clinical and public health contexts. Addressing this challenge requires a concerted effort to standardize validation practices and ensure models are tested across varied demographic groups, enhancing their applicability and impact.
The methodological diversity observed among the included models calls for a move towards harmonization. Establishing consensus on methodological best practices, including the selection and weighting of risk factors, could improve the reliability and reproducibility of predictive models. Future research should also prioritize the exploration of underrepresented cancer types and risk factors, broadening the scope of predictive modeling to encompass a wider array of cancers.
The potential impact of these predictive models on cancer prevention and early detection is substantial. Tailored risk assessment can guide personalized screening strategies, potentially leading to earlier detection and more effective interventions for high-risk individuals. However, the translation of these models into clinical practice necessitates not only methodological rigor but also careful consideration of the ethical implications associated with risk prediction, particularly regarding data privacy and the potential for health disparities.
5. Conclusion
The analysis underscored the progress and challenges within the field of cancer risk prediction. While significant strides have been made, gaps remain, particularly in model validation and in covering a broader spectrum of cancer types. Our findings suggest an ongoing need for rigorous external validation to ascertain models' applicability and for continued research to fill the existing gaps, thereby enhancing the predictive accuracy and utility of cancer risk models in personalized medicine and public health.
Supplementary Materials
The following supporting information can be downloaded at the website of this paper posted on Preprints.org.
Funding
None of the authors received funding.
Data Availability Statement
A full list of analyzed models, separated by cancer type and with the name of the model, year of publication, subtype, development population and area, discrimination, included risk factors, TRIPOD level, study design, methodology, applicability, validation and references, has been included as a supplementary file.
Conflicts of Interest
All authors declare that they have no conflicts of interest.
References
- Kannel WB, McGee D, Gordon T. A general cardiovascular risk profile: The Framingham study. Am J Cardiol 1976;38:46–51. [CrossRef]
- National Cancer Institute (2006) The nation’s investment in cancer research. A plan and budget proposal for the fiscal year 2006. n.d.
- Siegel RL, Giaquinto AN, Jemal A. Cancer statistics, 2024. CA Cancer J Clin 2024;74:12–49. [CrossRef]
- Jeter LK, Morello R, Rivere AE, Fuhrman GM, Mackey AM, Corsetti RL, et al. Impact of Launching A High-Risk Breast Cancer Screening Program Using the Tyrer-Cuzick Model. Am Surg 2023;89:1077–8. [CrossRef]
- Gail MH, Brinton LA, Byar DP, Corle DK, Green SB, Schairer C, et al. Projecting individualized probabilities of developing breast cancer for white females who are being examined annually. J Natl Cancer Inst 1989;81:1879–86. [CrossRef]
- Gail MH, Costantino JP, Pee D, Bondy M, Newman L, Selvan M, et al. Projecting individualized absolute invasive breast cancer risk in African American women. J Natl Cancer Inst 2007;99:1782–92. [CrossRef]
- Cassidy A, Myles JP, van Tongeren M, Page RD, Liloglou T, Duffy SW, et al. The LLP risk model: an individual risk prediction model for lung cancer. Br J Cancer 2008;98:270–6. [CrossRef]
- Wu X, Lin J, Grossman HB, Huang M, Gu J, Etzel CJ, et al. Projecting individualized probabilities of developing bladder cancer in white individuals. J Clin Oncol Off J Am Soc Clin Oncol 2007;25:4974–81. [CrossRef]
- Fears TR, Guerry D, Pfeiffer RM, Sagebiel RW, Elder DE, Halpern A, et al. Identifying individuals at high risk of melanoma: a practical predictor of absolute risk. J Clin Oncol Off J Am Soc Clin Oncol 2006;24:3590–6. [CrossRef]
- Westerlinck P, Coucke P. Review of interactive digital solutions improving health literacy of personal cancer risks in the general public. Int J Med Inf 2021;154:104564. [CrossRef]
- Westerlinck P, Coucke P, Albert A. Development of a cancer risk model and mobile health application to inform the public about cancer risks and risk factors. Int J Med Inf 2024;189:105503. [CrossRef]
- Çorbacıoğlu ŞK, Aksel G. Receiver operating characteristic curve analysis in diagnostic accuracy studies: A guide to interpreting the area under the curve value. Turk J Emerg Med 2023;23:195–8. [CrossRef]
- Collins GS, Reitsma JB, Altman DG, Moons KGM. Transparent Reporting of a multivariable prediction model for Individual Prognosis or Diagnosis (TRIPOD): the TRIPOD statement. Ann Intern Med 2015;162:55–63. [CrossRef]
- Huang Y, Li W, Macheret F, Gabriel RA, Ohno-Machado L. A tutorial on calibration measurements and calibration models for clinical prediction models. J Am Med Inform Assoc JAMIA 2020;27:621–33. [CrossRef]
Figure 1.
Representation of subtypes in models for Head and Neck cancer, Colorectal cancer, Prostate cancer and Esophageal cancer.
Figure 1.
Representation of subtypes in models for Head and Neck cancer, Colorectal cancer, Prostate cancer and Esophageal cancer.
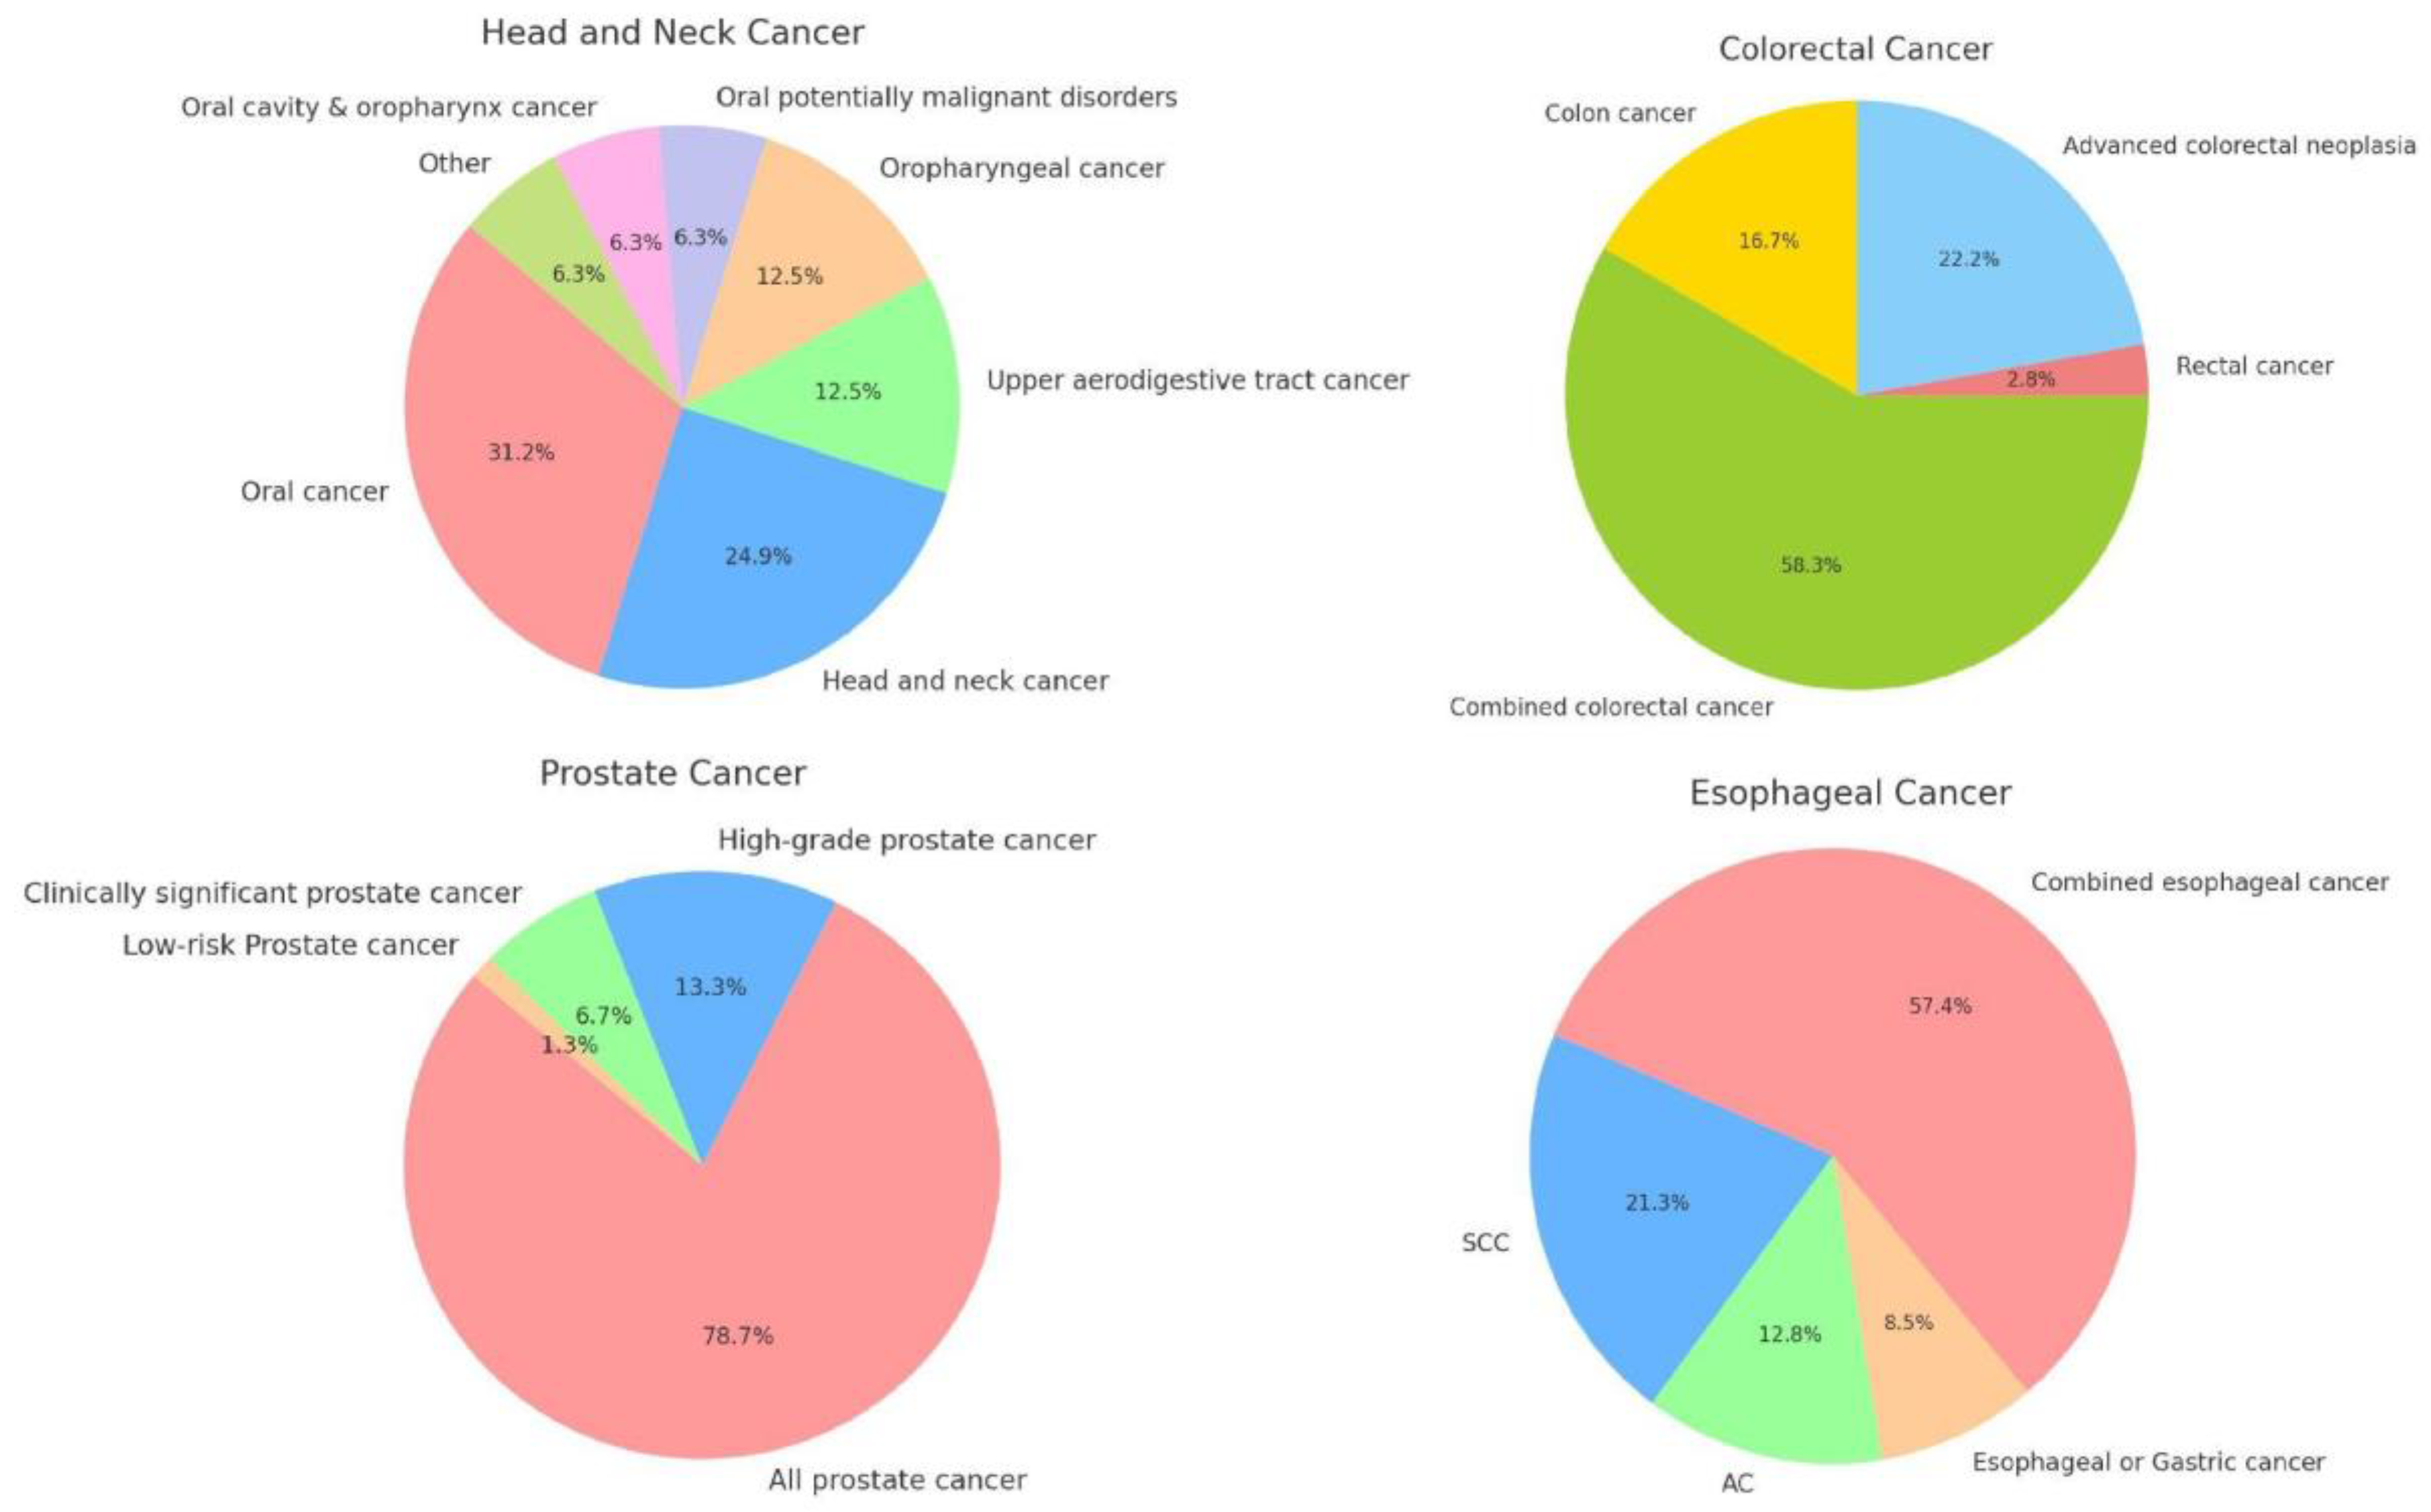
Figure 2.
Division of models for year of publication, target population, size of the development group and country of development.
Figure 2.
Division of models for year of publication, target population, size of the development group and country of development.
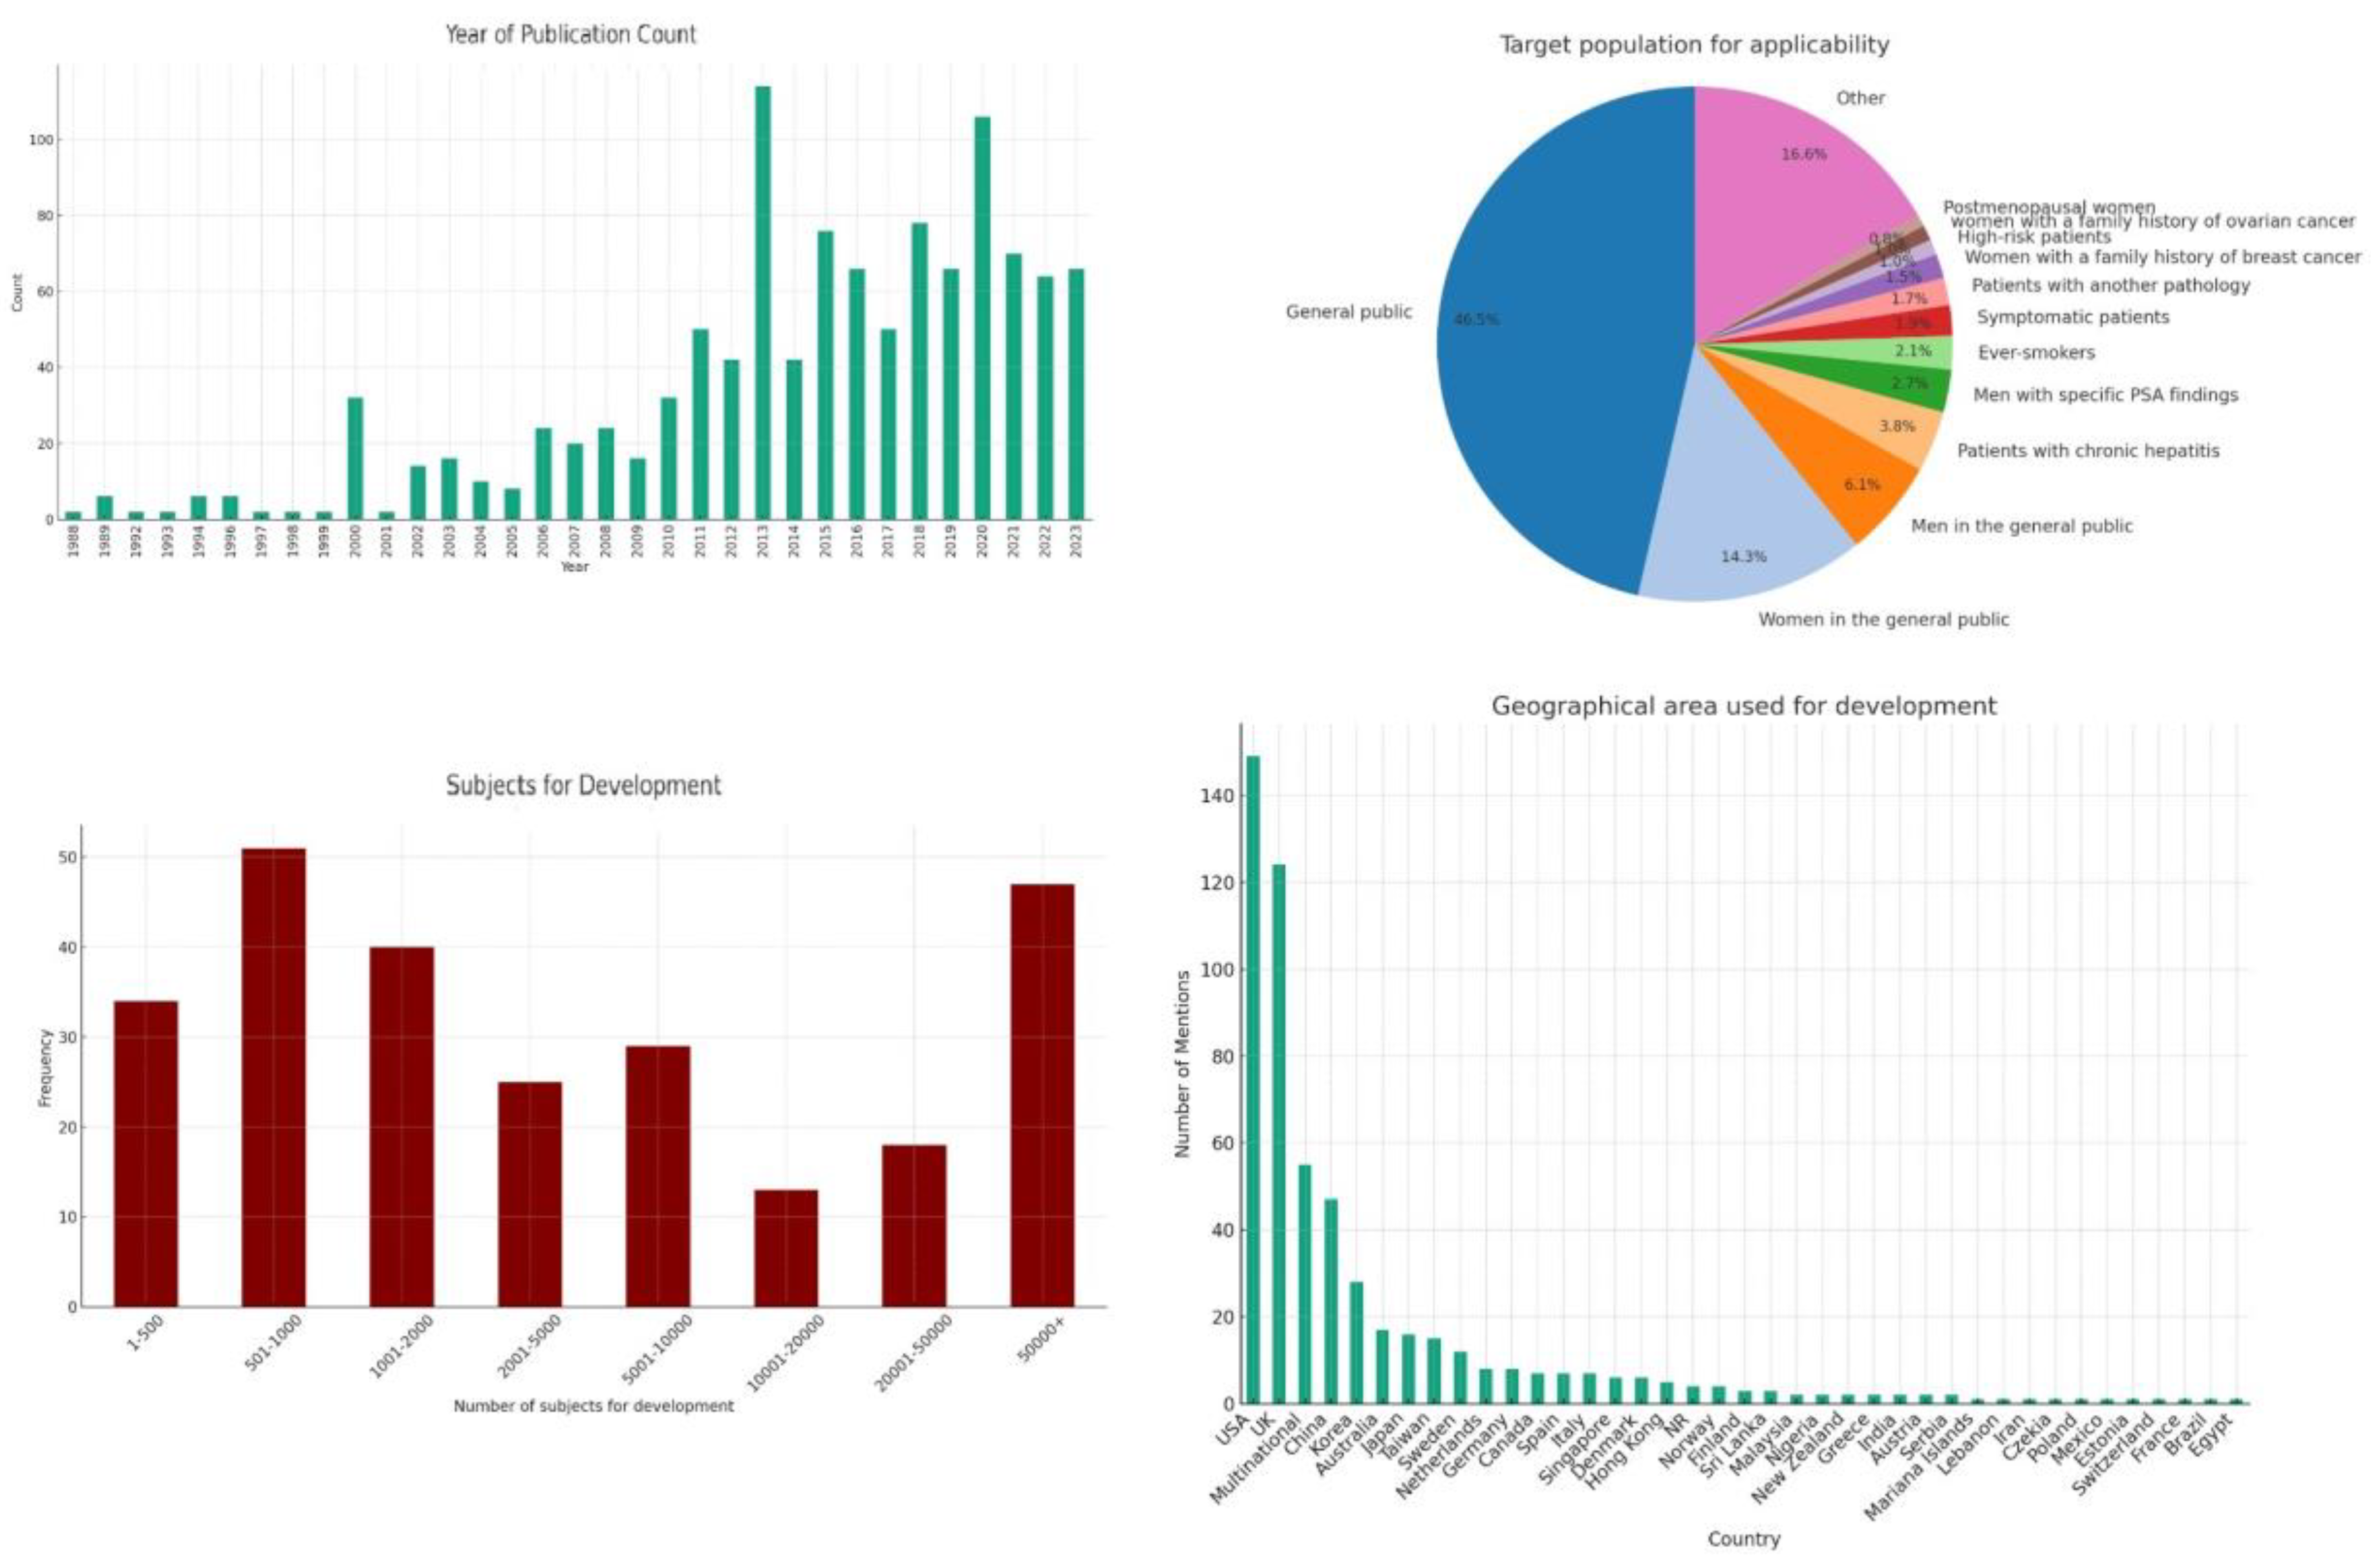
Figure 3.
Division of models for reproducibility, strength of criteria, discrimination and TRIPOD level.
Figure 3.
Division of models for reproducibility, strength of criteria, discrimination and TRIPOD level.
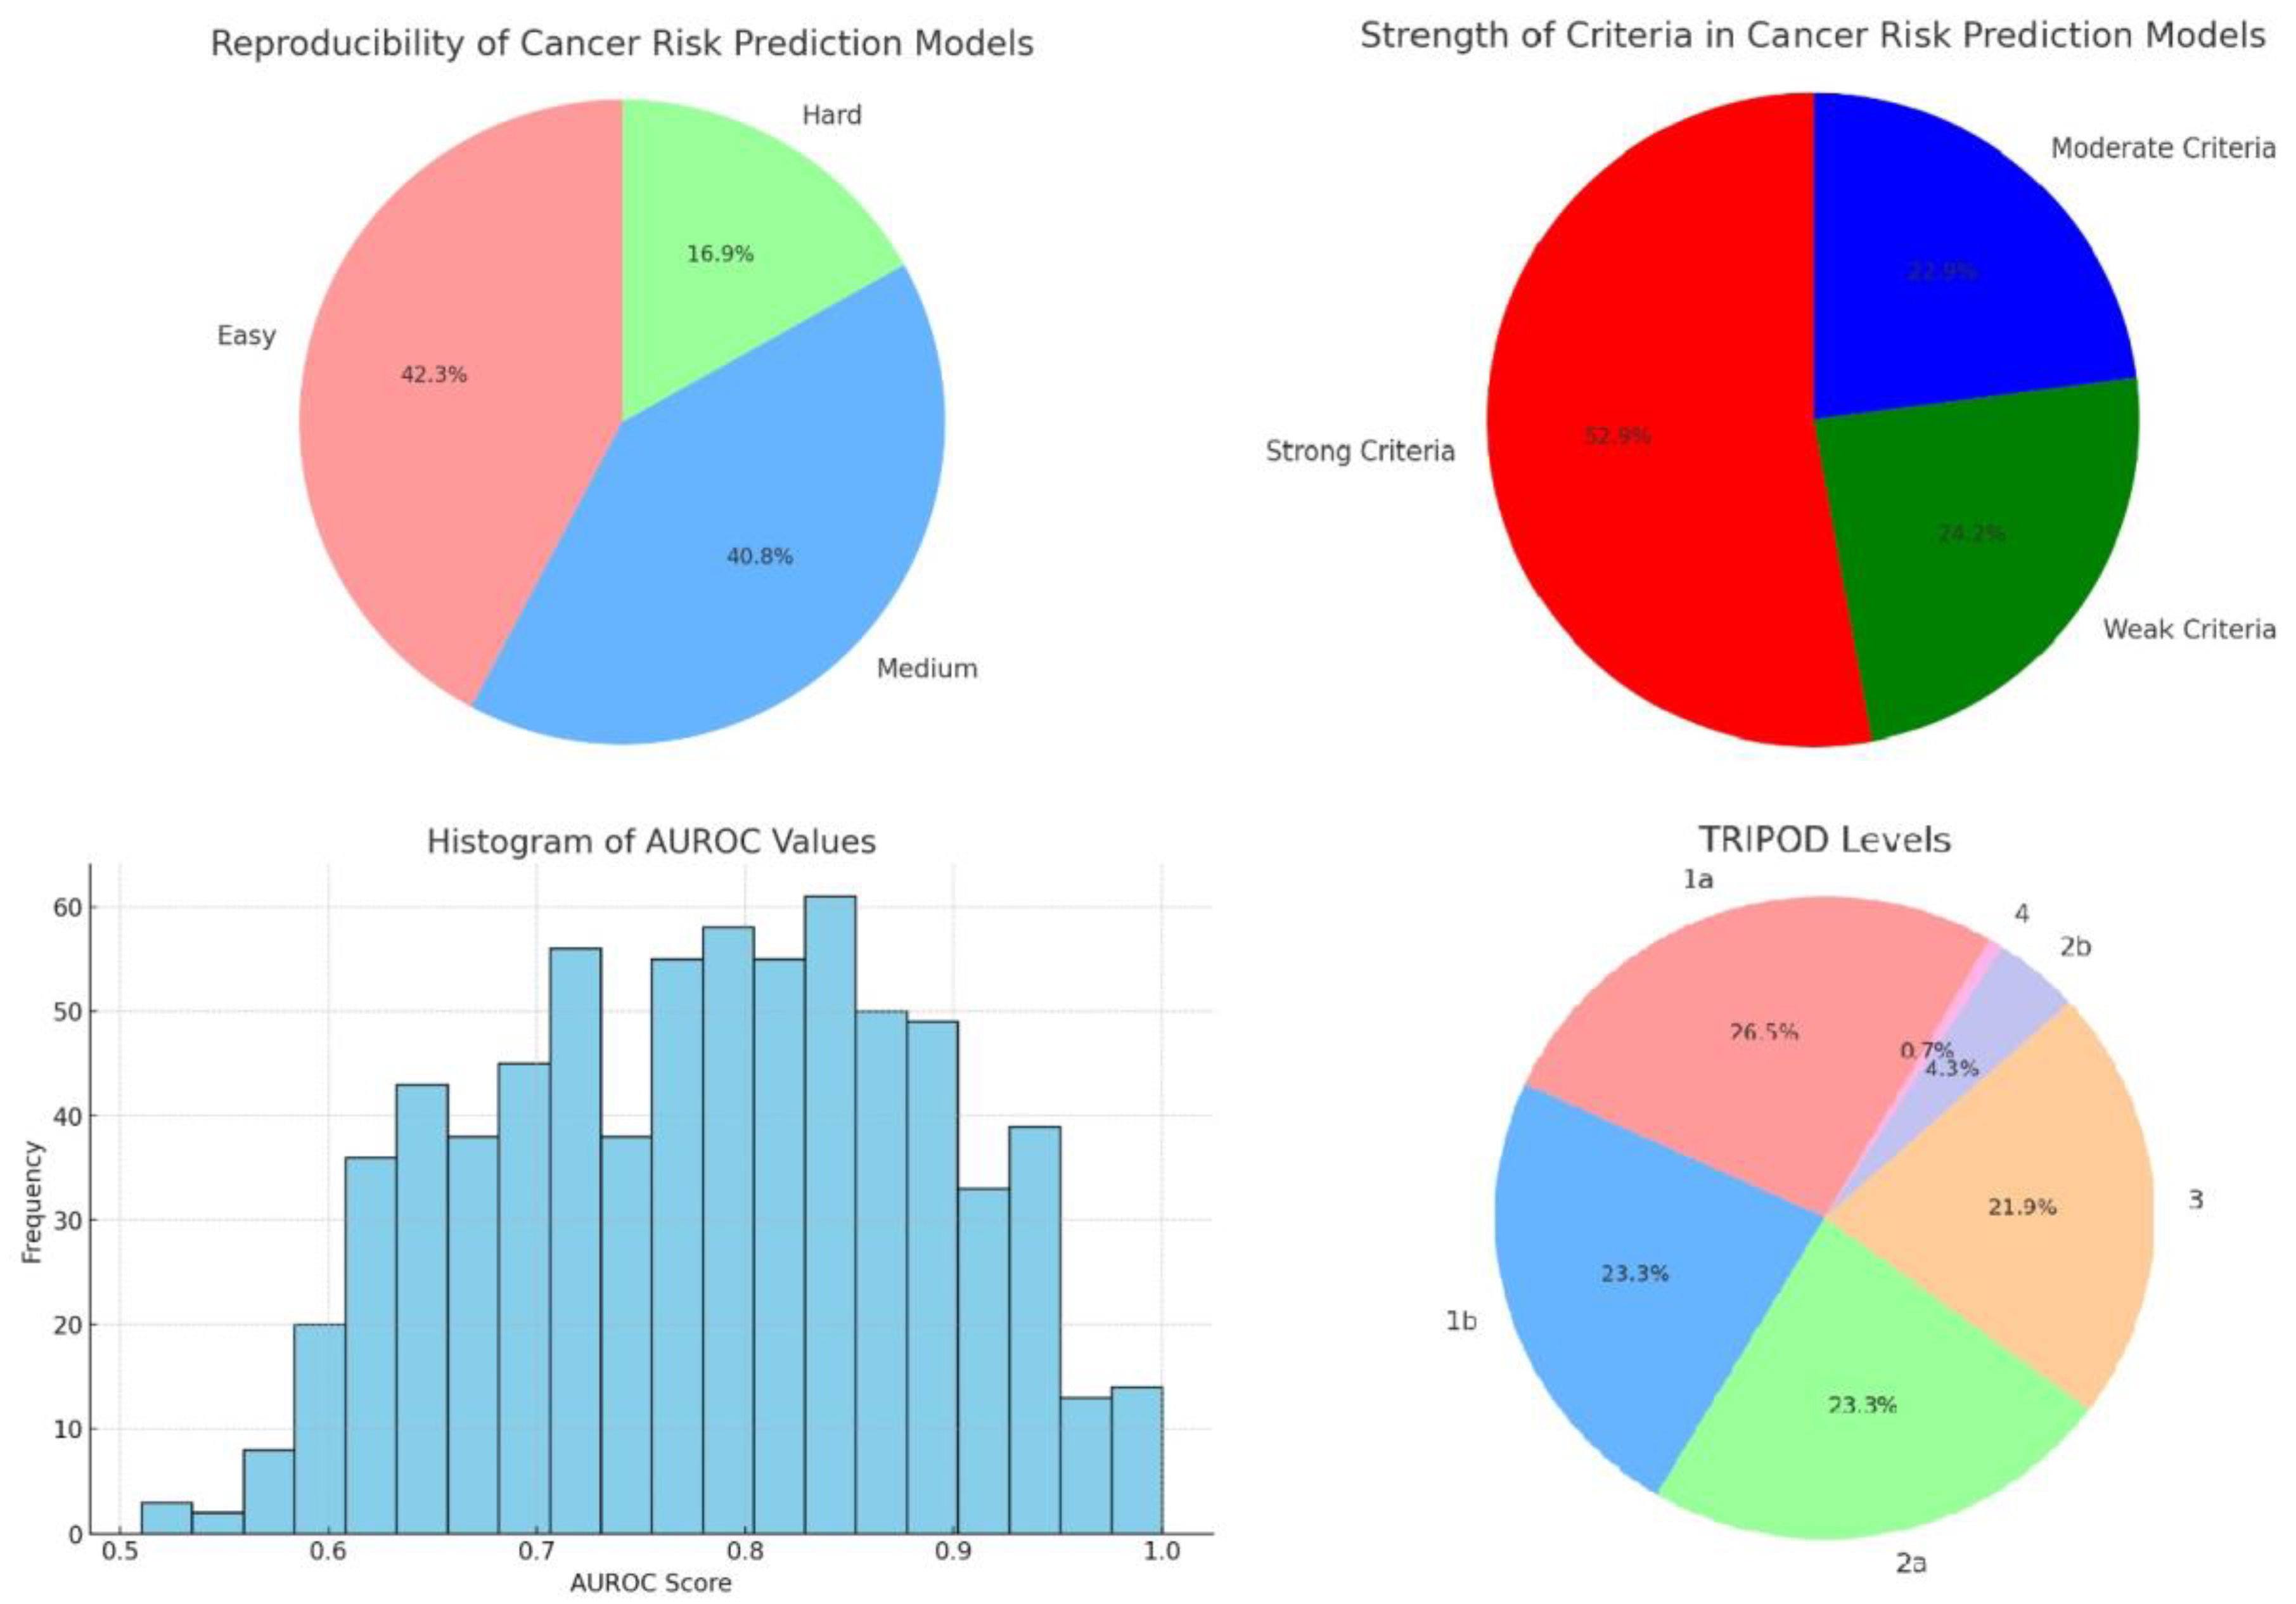
Figure 4.
Division of models for methodology, calibration, number of risk factors and study design.
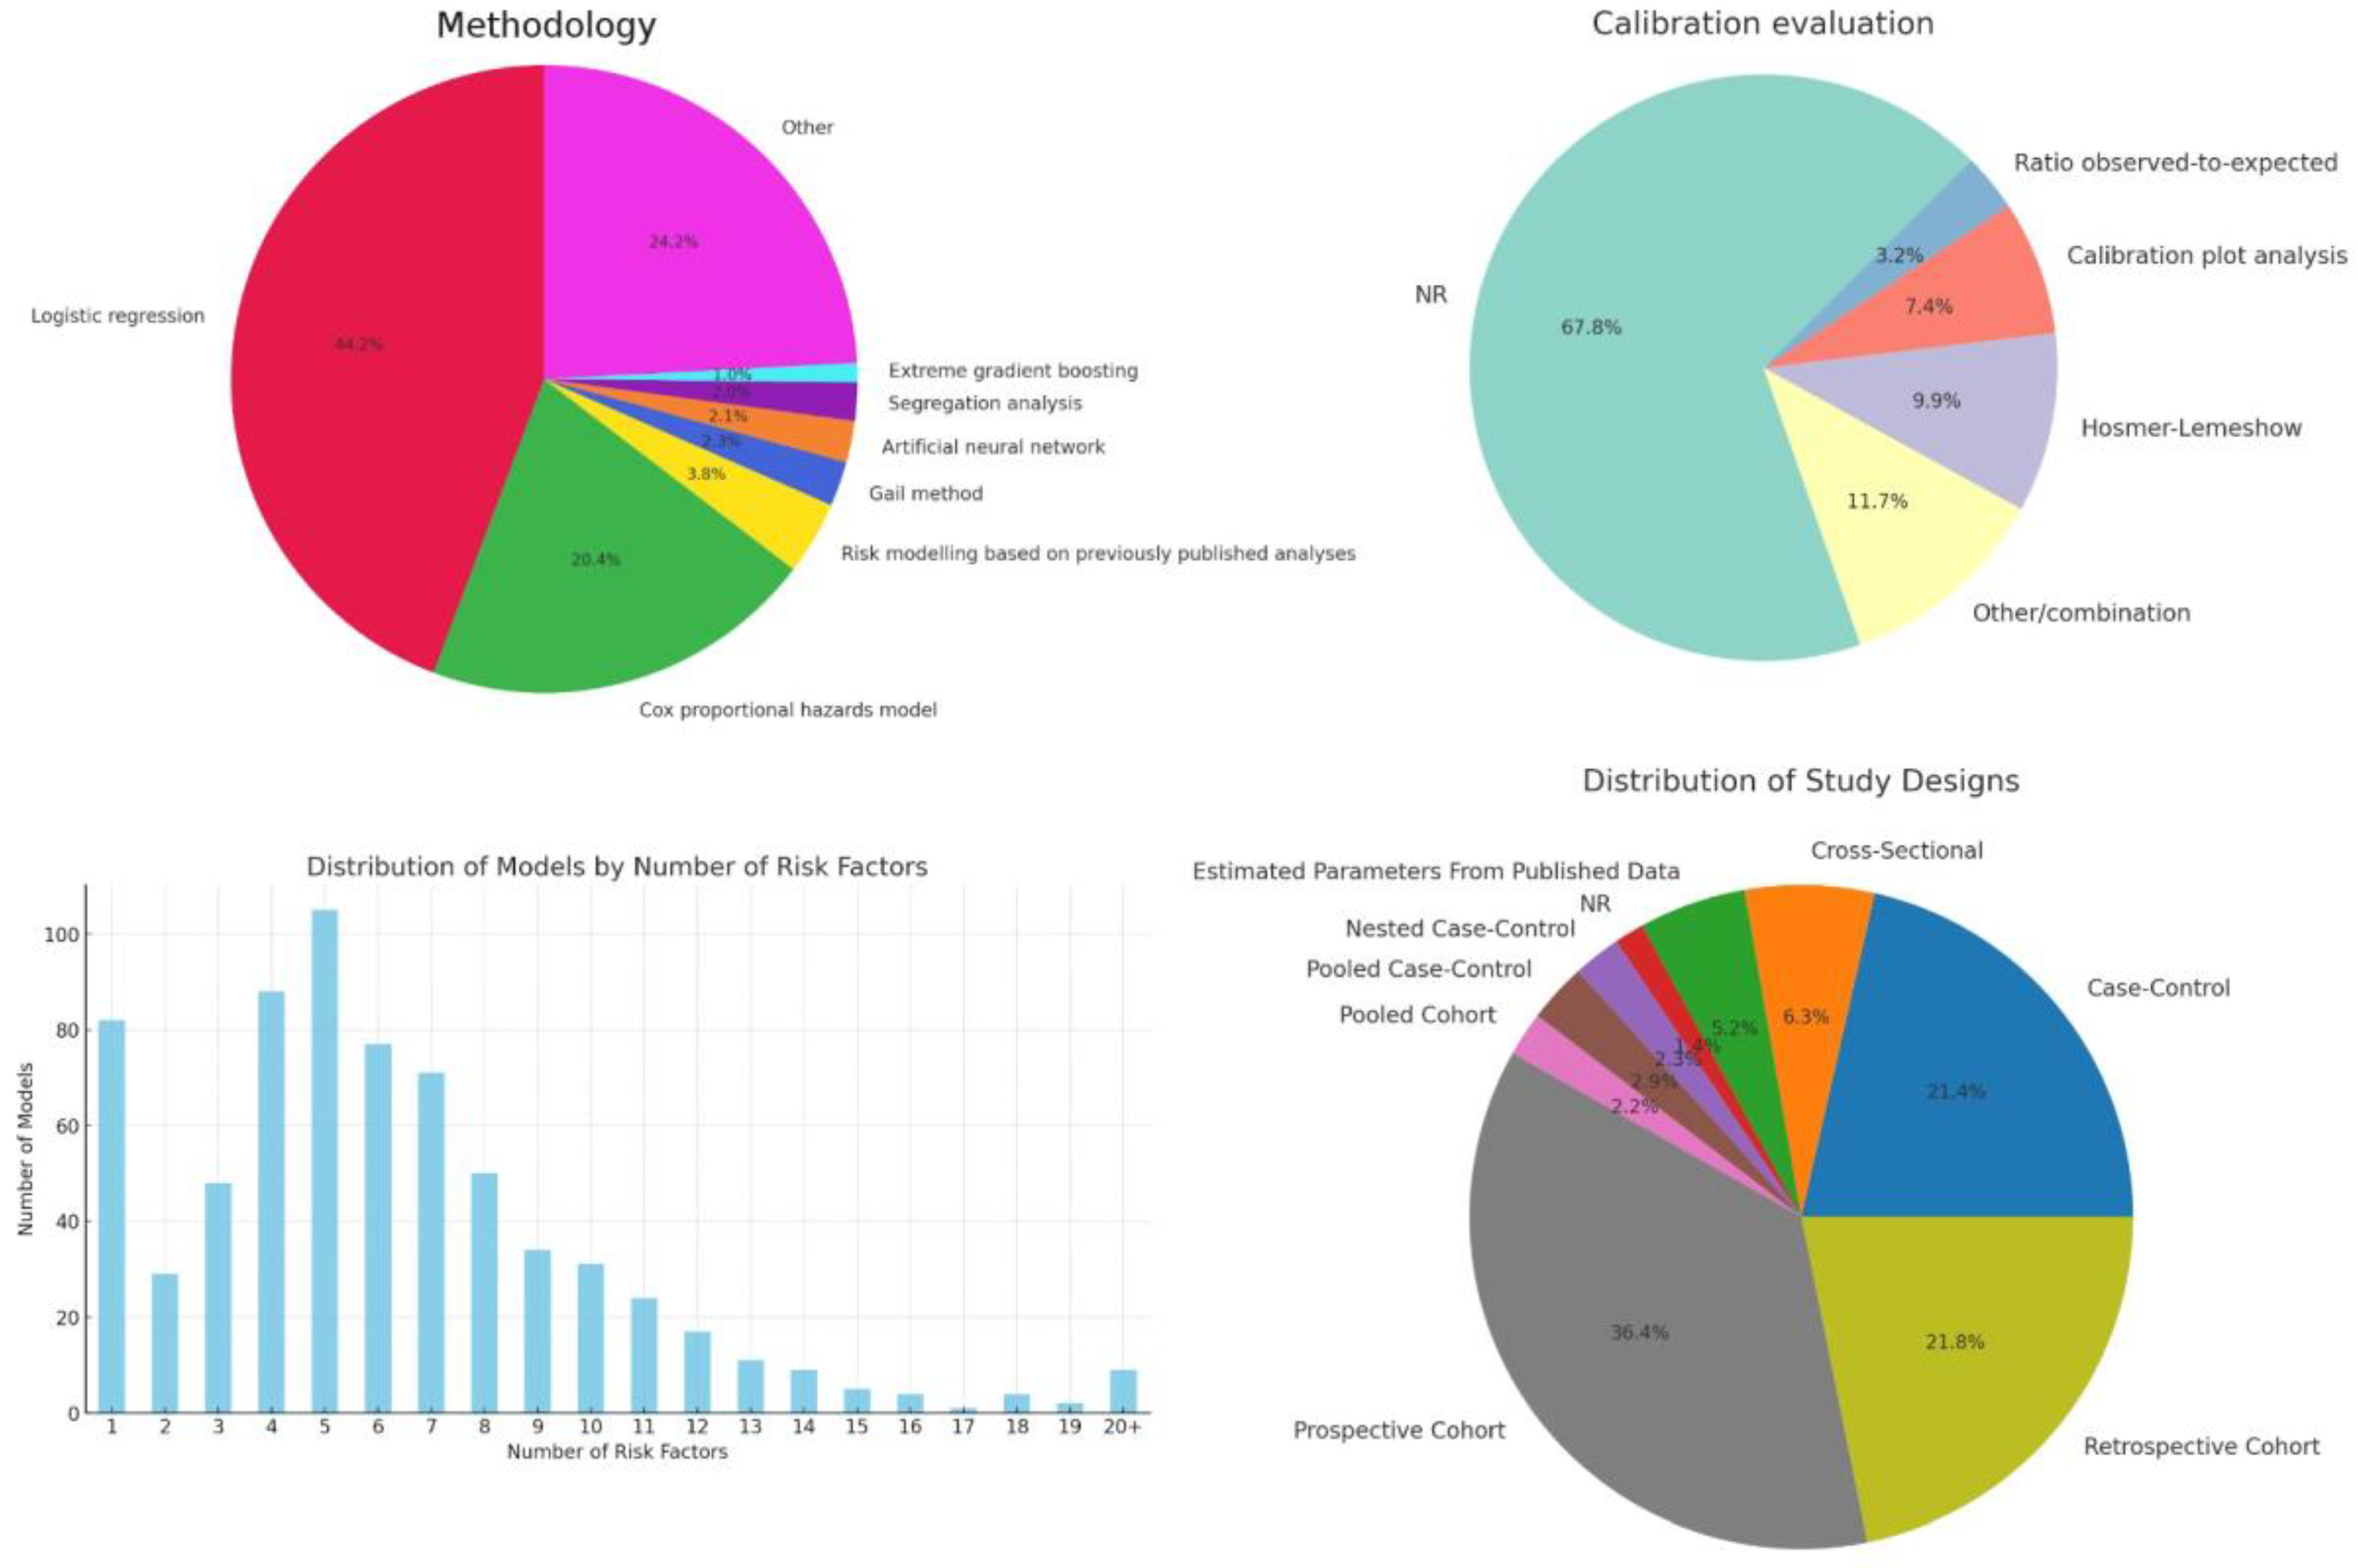
Figure 5.
Most frequent risk factors in models.
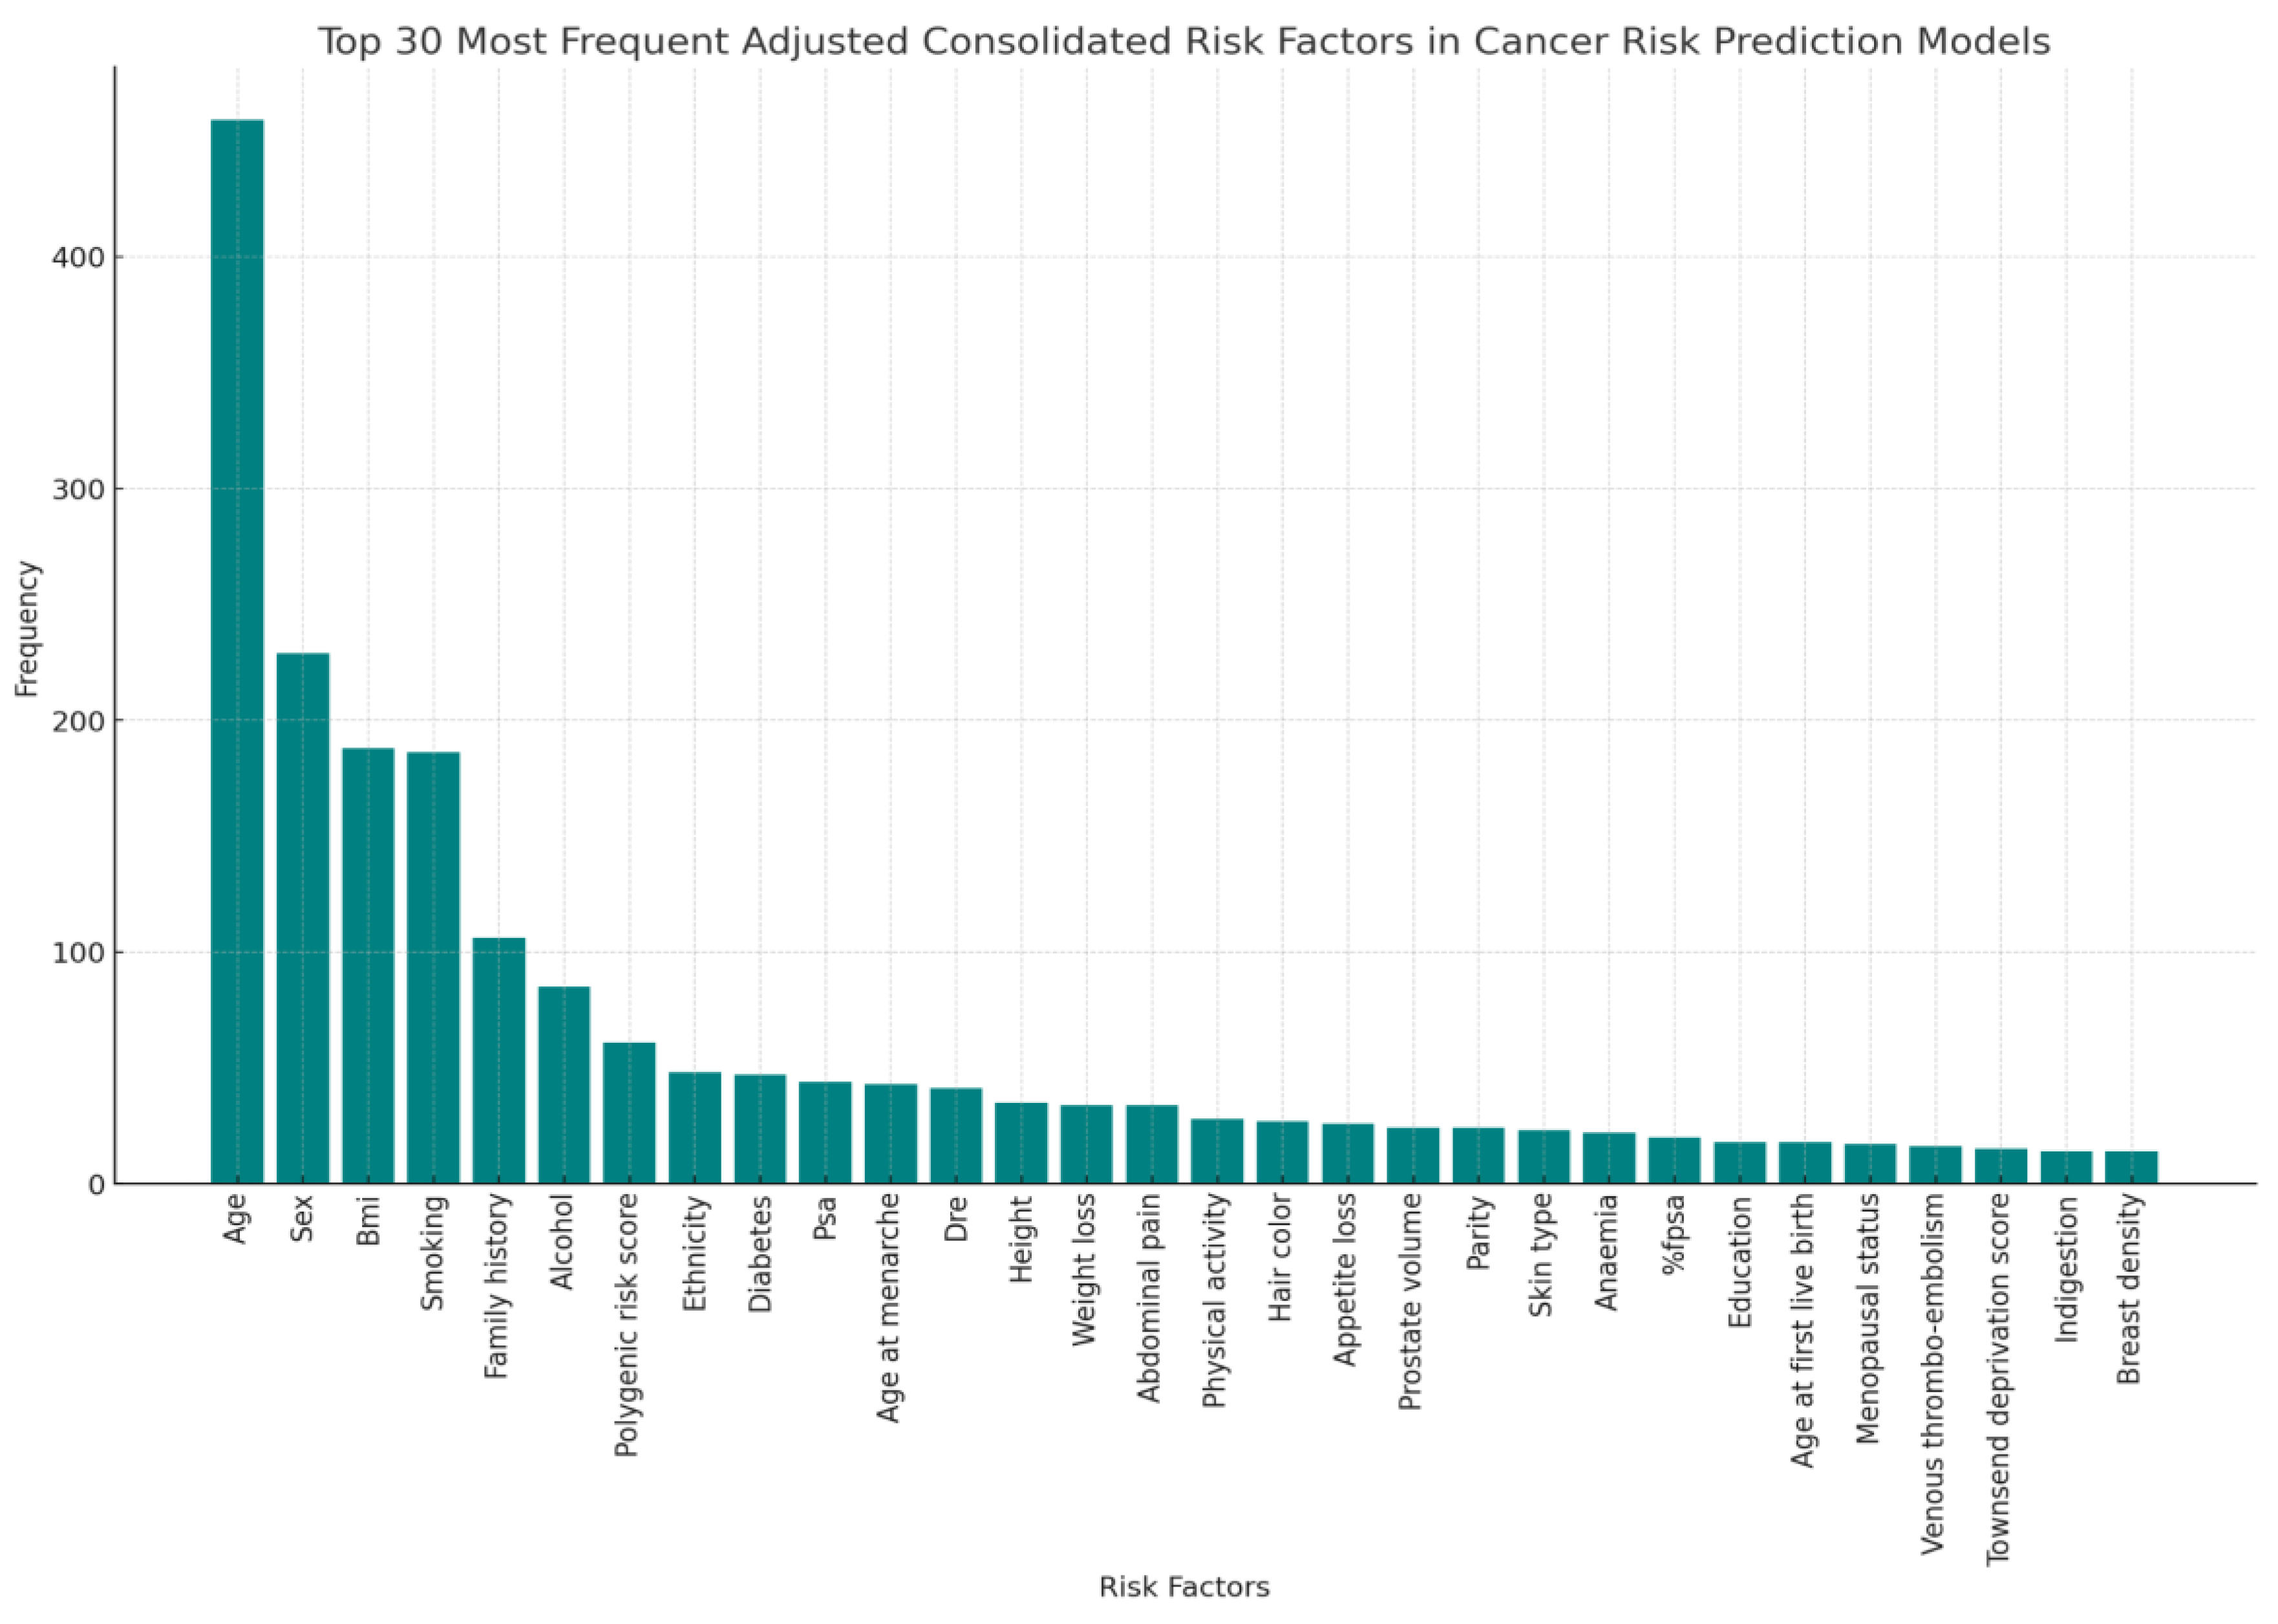

Table 1.
Division of models across cancers and articles.
| Cancer Type | Number of Articles | Number of Models |
| Bladder | 17 | 29 |
| Breast | 103 | 143 |
| Colorectal | 94 | 144 |
| Oeso | 23 | 47 |
| Blood | 6 | 9 |
| Kidney | 25 | 39 |
| Head & Neck | 16 | 23 |
| Liver | 33 | 46 |
| Lung | 40 | 65 |
| Ovary | 14 | 14 |
| Pancreas | 35 | 48 |
| Prostate | 68 | 97 |
| Melanoma | 35 | 62 |
| Stomach | 17 | 19 |
| Testis | 2 | 2 |
| Thyroid | 4 | 6 |
| Cervix | 4 | 4 |
| Endometrium | 16 | 17 |
| General | 3 | 4 |
| Non-melanoma skin cancer | 7 | 10 |
| Eye | 1 | 1 |
| Gallbladder | 1 | 3 |
Disclaimer/Publisher’s Note: The statements, opinions and data contained in all publications are solely those of the individual author(s) and contributor(s) and not of MDPI and/or the editor(s). MDPI and/or the editor(s) disclaim responsibility for any injury to people or property resulting from any ideas, methods, instructions or products referred to in the content. |
© 2025 by the authors. Licensee MDPI, Basel, Switzerland. This article is an open access article distributed under the terms and conditions of the Creative Commons Attribution (CC BY) license (http://creativecommons.org/licenses/by/4.0/).
Copyright: This open access article is published under a Creative Commons CC BY 4.0 license, which permit the free download, distribution, and reuse, provided that the author and preprint are cited in any reuse.


