
Submitted:
24 February 2025
Posted:
24 February 2025
You are already at the latest version
Abstract
This study aimed to investigate the impact of ultrasonic pretreatment vacuum drying (UAVD) and temperature on drying kinetics and qualitative attributes of blood oranges, in comparison to several drying methods: hot air drying (HAD), vacuum drying (VD), and freeze drying (FD). The drying kinetics and modeling, total phenolic content (TPC), anti-oxidant capability (assessed using DPPH and ABTS tests), individual phenolic profiles, vitamin C concentration, and color factors were meticulously examined. The HAD, VD, and UAVD procedures were conducted at 50, 60, and 70°C, resulting in reduced drying periods with increasing temperature. The integration of ultrasound markedly lowered drying durations. Eleven thin-layer drying models were utilized to recreate the drying process precisely. Among the desiccated blood orange slices, the greatest total phenolic content (TPC) was observed in freeze-dried samples (131.27 mg GAE/100g), followed by those dried using ultrasonic-assisted vacuum drying (UAVD) at 50°C (128.77 mg GAE/g DM). Dried blood orange slices have a vitamin C content of 29.79 to 49.01 mg/100. The drying process substantially impacted the color parameters L*, a*, and b*. These findings highlight the efficacy of ultrasound-assisted drying in decreasing drying duration while improving the retention of bioactive components in blood orange slices.
Keywords:
blood orange
; ultrasound-assisted vacuum drying
; antioxidant capacity
; phenolic profile
; drying kinetics.
1. Introduction
Citrus fruits are commonly consumed around the world, primarily owing to their substantial nutritional value and related health benefits [1]. They constitute a significant portion of the world's fruit tree crops. During the 2022/23 marketing year, oranges accounted for 47% of global citrus production, totaling 48 million tons out of 100 million tons. In Turkey, citrus fruit production in 2023 reached 7.9 million tons, including 2.3 million tons of oranges, cultivated across 495 thousand hectares. The principal citrus-producing regions in Turkey are Antalya, Adana, Muğla, and Hatay [2].
The blood orange (Citrus sinensis (L.) Osbeck), commonly called pigmented or red-orange, comprises three primary cultivars: Moro, Tarocco, and Sanguinello. Unlike other orange varieties, the defining characteristic of blood oranges is the existence of red pigments in the flesh and, in some cases, the peel. These pigments, known as anthocyanins, develop in response to low night temperatures. As a result, blood oranges are predominantly cultivated in Mediterranean regions with subtropical climates characterized by high daytime temperatures and low nighttime temperatures [3&4]. Additionally, blood oranges are recognized for their elevated levels of total phenolics, anthocyanins, and flavones, which contribute to their superior antioxidant properties [5].
A prevalent method for food preservation is drying, which provides benefits including prolonged shelf life, diminished packing and shipping expenses, and reduced weight and volume, thereby enhancing logistics. Additionally, drying enhances the retention of nutritional quality while lowering moisture content to levels that inhibit microbial growth [6&7]. Traditional hot-air convection drying is commonly utilized in the food industry because it is inexpensive and simple to implement. However, hot air drying has notable drawbacks, including adverse effects on food quality, environmental sustainability, and nutrient retention. Prolonged exposure to high temperatures during drying can significantly deteriorate bioactive chemicals and compromise their sensory attributes [8]. Novel drying methods that maximize energy economy while maintaining the quality characteristics of food items are therefore becoming more and more necessary [9].Among modern drying methods, freeze-drying is regarded as the most efficient approach to obtaining good-quality dried fruits and vegetables, as it preserves structural integrity and nutritional composition better than conventional methods. However, despite its advantages, freeze-drying is characterized by prolonged processing times and high operational costs, limiting its industrial application. As an alternative, VD has gained prominence for its ability to achieve faster drying rates at lower temperatures while operating in low-oxygen environments, thereby minimizing oxidative degradation of bioactive compounds. Advancements in drying technology have led to the evolution of integrated drying techniques that combine multiple methods to enhance efficiency, reduce costs, and improve sustainability. One such emerging approach is UAVD, which has gained attention for its potential to significantly accelerate drying while improving efficiency. This technique enhances the dehydration process by increasing the moisture transport rate without excessive thermal exposure. Water removal is accelerated by the cavitation effects produced by ultrasound, which help to create microchannels inside the food matrix. Furthermore, ultrasound promotes the extraction of tightly bound moisture by inducing localized pressure changes, all while maintaining relatively low temperatures, making it particularly beneficial for heat-sensitive food products [10]. A wide variety of food products including Asian pear [11], beef and chicken meats [12], carrot slices [13], green beans [10], nectarines [14], raspberry fruit [15], red peppers [16], salmon and trout fillets [17], Schisandra chinensis extract powder [18], papaya [19], and Flos Sophorae Immaturus [20] were effectively dried UAVD. The increasing adoption of UAVD underscores its significance as a modern dehydration technique that effectively addresses the limitations of conventional drying methods while ensuring superior preservation of food quality and nutritional integrity.
This study involved the drying of blood orange slices using HAD, VD, UAVD (at 50, 60, and 70°C), and FD methods. Several mathematical drying models were employed to examine drying kinetics and delineate the moisture removal behavior with time. Furthermore, the concentrations of TPC, DPPH, and ABTS, together with individual phenolic profiles, vitamin C levels, and color characteristics, were evaluated to ascertain the influence of various drying processes on the qualitative attributes of blood orange slices under varied temperature conditions.
2. Materials and Methods
2.1. Material
Blood oranges (Citrus sinensis (L.) Osbeck, cv. Sanguinello) were purchased in 2023 from an organic citrus farm located in Arsuz, Hatay, Turkey. Following procurement, the fresh oranges were transported to the Food Chemistry Laboratory at Yildiz Technical University and kept at 4°C till further processing. The initial percentage moisture of the fresh blood oranges was measured to be 83.10% ± 0.26% utilizing an infrared moisture analyzer (Rad-wag, MA 50-R). Prior to drying, the orange samples were thoroughly washed, wiped clean, and sliced into uniform 5-mm-thick sections. The dried slices were subsequently stored in a desiccator to preserve their structural integrity until further analysis.
In this study, all the chemicals used for TPC, antioxidant capacity analyses (DPPH and ABTS), individual phenolic compounds, and vitamin C content were procured by Sigma-Aldrich (St. Louis, USA) and Merck (Darmstadt, Germany).
2.2. Methods
2.2.1. Drying Procedure
The drying of blood orange slices was conducted utilizing HAD, VD, and UAVD at 50, 60, and 70°C, and FD. During HAD, VD, and UAVD, the weight losses of orange slices were monitored at 30-minute intervals. The blood orange slices were subjected to drying until the moisture content attained 0.1 kg of water per kg of dry matter.
The HAD procedure was performed using a Testo 440 vane probe anemometer (Lutron, AM-4201, Taiwan) at a constant air velocity of 1.3 m/s. Horizontal airflow was applied over the surface of the slices throughout the drying process [11].
A vacuum drier (Daihan WOV-30, Gangwon-do, South Korea) was employed for
VD. A vacuum with an ultimate pressure of 60 mbar and a pump speed of 2 L/s was sustained using a vacuum pump (EVP 2XZ-2C, Zhejiang, China) [11].
In the UAVD technique, blood orange slices were subjected to a 30-minute ultrasonic water bath (Daihan, WUCD10H, South Korea) running at 100% amplitude, with a power intensity of roughly 1 W/cm², a frequency of 40 kHz, and a capacity of 10 L. Subsequently, blood orange slices were dehydrated using a vacuum dryer (DaihanWOV-30, Gangwon-do, Republic of Korea) [11].
FD was performed utilizing a defined protocol on a laboratory freeze drier (Martin Christ, Beta 1–8 LSC plus). The samples were cryopreserved at -80 °C and processed over a period of 72 hours [11].
2.2.2. Mathematical modeling
The moisture ratio (MR) was expressed as Mt/M0 instead of (Mt - Me)/(M0 - Me), as the equilibrium moisture content (Me) is negligible relative to the moisture content at time t (Mt) or the initial moisture content (M0).
The drying rate (DR) curves were expressed as the weight loss per unit of time (g moisture/30 min). The drying rate (DR) of blood orange slices was determined by employing Eq. (1):
where ΔM is the weight change, Δt is the time change, Mt and Mt+Δt are the weight at time t and at time t+Δt, respectively. In this study, the weight change was measured every 30 min, so the Δt is 30 min.
The drying data collected during the experiments were analyzed by fitting them into eleven independent thin-layer drying models. Table 1 provides a comprehensive description of these models, which were assessed using nonlinear least squares regression analysis.
The model parameters and R² values were ascertained by nonlinear regression analysis performed with the STATISTICA software (StatSoft, Tulsa, USA). The acceptability of each model was evaluated using R2 and root mean square error (RMSE) values. A higher R2 value and a lower RMSE value indicated a well-fitting model. RMSE values were computed by employing Eq. (2) [32]:
In Eq. 2&3, MRprei represents the predicted moisture ratio, while MRexpi denotes the experimentally determined moisture ratio. N is the total count of observations, whereas m represents the quantity of constants used in the model.
The effective moisture diffusivity (Deff) of the orange slices was calculated based on Fick’s second law of diffusion (Eq. 4):
This equation was adapted to accommodate slab geometry and unsteady diffusion conditions, resulting in the following form:
In Eq. 5, Deff represents the effective moisture diffusivity (m2/s), L is the thickness of the orange slice measured at regular intervals (m), and n is the constant derived from the thin-layer drying models. For extended drying periods, this equation can be simplified into the form presented in Eq. (6).
The values of Deff were determined utilizing the slope (K) of a straight line derived from plotting the experimental drying data as lnMR against time. This calculation was based on the following equation:
2.2.3. Total energy consumption
The drying tests were conducted with a digital energy meter (PeakTech 9035, Germany) attached to a socket to monitor the energy consumption. Upon completion of the dehydration process, the drying systems' total energy consumption was measured using the approach outlined by Tekin et al. [10].
2.2.4. Methods of analyses
2.2.4.1. Extraction procedure
Fresh and dried orange samples were extracted with a methanol-water solution (50:50, v/v) at a ratio of 1:10 w/v. The orange sample mixture was homogenized at 10,000 rpm for 2 minutes using an ultra-turrax homogenizer (Daihan, HG-15D). Subsequent to homogenization, the mixture was agitated for 2 hours at 25 °C. Subsequent to shaking, the mixture was subjected to centrifugation at 2800 g for 10 minutes. The resultant supernatant was further filtered using a 0.45 μm syringe filter [33].
2.2.4.2. Determination of bioactive compounds
The TPC assay was carried out by Singleton and Rossi's modified procedure [34]. A UV–VIS spectrophotometer (Shimadzu UV-1800, Kyoto, Japan) measured the absorbance values at 760 nm. TPC was represented as mg GAE/g DM.
The analysis of DPPH was carried out by the methodology outlined by Brand-Williams et al. [35]. Absorbance was quantified at 515 nm, with results expressed as mg of Trolox equivalent (TE) per liter of material.
The ABTS radical cation scavenging capacity was evaluated using the technique established by Arnao et al. [36], with minor changes. The absorbance data was recorded at 734 nm, and outcomes were reported as mg TE/100 g DM.
2.2.4.3. Individual phenolic compounds
Individual phenolic compounds were analyzed by an HPLC system equipped with a diode array detector (SPD-M20A DAD, Shimadzu, Japan) in accordance with the methodology described by Turan et al. [37]. Chromatograms were monitored at wavelengths of 278, 320, and 360 nm, and the flow rate was maintained at 1 mL/min.
2.2.4.4. Vitamin C
The HPLC-DAD system (Shimadzu, Japan) was injected with 1 mL of the centrifuged blood orange juice after passing through a 0.45-μm filter (Millipore, Burlington, MA, USA). Supelco, Inc., Bellefonte, PA, USA, conducted the separation of ascorbic acid on a Supelcogel TM C 610H column (30 cm × 7.8 mm inner diameter) and a Supelguard column (5 cm × 4.6 mm) and detected the separation using a diode-array detector set at 210 nm. Pure standards of ascorbic acids were quantified using standard curves. The ascorbic acid concentrations are reported as milligrams per 100 grams of sample [38].
2.2.4.5. Color
The color of both fresh and dried orange slices was evaluated utilizing a chromameter (Konica Minolta CR-400, NJ, USA). The color parameters have been identified as L* (lightness/darkness), a* (redness/greenness), and b* (yellowness/blueness). The total color change (ΔE) of the slices was determined using the subsequent formula:
2.2.5. Statistical analysis
The statistical analysis was carried out using the Statistica software program (StatSoft, Inc., Tulsa, OK). All experiments were conducted in triplicate, and the results were expressed as the mean values along with their standard errors. A one-way ANOVA was performed to compare the mean values of the test results. Duncan’s multiple comparison test, at a 95% confidence level, was applied to evaluate the impact of different drying methods on bioactive compounds, changes in the phenolic profile, vitamin C levels, and the color characteristics of the orange samples.
3. Results
3.1. Drying kinetics
Fresh blood orange slices had an initial moisture percentage of 83.10% ± 0.26%. On a wet basis, the slices were dried until they had a final moisture percentage of 10%. Drying was performed using HAD, VD, and UAVD methods at temperatures of 50, 60, and 70 °C, as well as through FD. Figure 1 shows the pictures of fresh and dried blood oranges with HAD, VD, UAVD, and FD. The samples that were dried using HAD were found to have less volume.
Figure 2 indicates the experimental data for the moisture ratio (MR) vs time curves of blood oranges dried with HAD, UAVD, and VD methods. Regardless of the drying methods, the moisture ratio (MR) continuously diminished during drying period. There is no constant rate period in these curves, only a decreasing rate period is observed. The MR values were utilized to assess the eleven models delineated in Table 1.
Table 2 displays the predicted model parameters and the statistical metrics for blood orange slices. The model that most accurately represented the thin-layer drying kinetics was selected based on the greatest R² values and the lowest RMSE and χ² values. Table 2 indicates that the Logarithmic model was the most effective for the HAD, VD, and UAVD approaches, with R2 values ranging from 0.997 to 0.998, 0.999 to 1.000, and 0.999 to 1.000, respectively. The k values for the Logarithmic model were established as 0.131, 0.166, and 0.330 for 50, 60, and 70 °C for HAD drying, and 0.156, 0.156, and 0.152 for VD, respectively. Consequently, a vacuum facilitates the transfer of water from the inside to the exterior due to the elevated water vapor pressure at reduced temperatures. Akdas and Baslar [39] identified the logarithmic model as the most effective model for Mandarin. The remaining 10 models exhibited high determination coefficients (R²) ranging from 0.979 to 0.998 for HAD, from 0.983 to 1.000 for VD, and from 0.982 to 1.000 for UAVD methods.
Table 3 indicates the drying time, drying rate, effective moisture diffusivity, and total energy consumption of the blood orange slices. Drying times were recorded as 22.5 hours, 12.5 hours, and 9 hours for HAD; 11.5 hours, 9.5 hours, and 8.5 hours for VD; and 10 hours, 8.5 hours, and 7.5 hours for UAVD at 50, 60, and 70 °C, respectively. A reduction in drying time was observed with increasing temperatures. Further analysis revealed that ultrasonic pretreatment significantly decreased the drying period. The effectiveness of ultrasound in minimizing drying durations has also been reported in other studies involving various fruits [37,40,41]. The gradual increase in the product's temperature throughout the hot air-drying process, due to external heat transfer, impedes internal moisture migration, thereby extending the drying duration. In contrast, vacuum drying decreases pressure, which reduces the water boiling point in the food, hence increasing the surface evaporation rate. The combination of ultrasound with vacuum has been shown to significantly reduce drying times. This effect is attributed to cavitation, which creates microscopic voids within the structure of fruits and vegetables, facilitating easier water removal and thereby shortening the drying process. The secondary consequence is the mechanical impact induced by ultrasound, which diminishes the adhesion between moisture and the microtube, hence expediting moisture evacuation [42]. Furthermore, ultrasonic treatment can diminish internal viscosity and enhance the heat transfer coefficient [13]. The last impact of ultrasound is the thermal effect, which induces a marginally accelerated temperature rise, advantageous for the internal diffusion and evaporation of moisture [40].
3.2. Total phenolic content and antioxidant capacity
Citrus fruits are abundant in phenolic acids and flavonoids, two principal categories of natural antioxidants that underlie their functional qualities. The differences in flavonoid content in fruits are primarily due to biological factors [45]. These secondary metabolites serve several functions in the plant; specifically, in the fruit, they are linked to color, sensory attributes (flavor, astringency, texture), nutritional properties, and antioxidant activity [46].
TPC values and antioxidant capacity values determined by DPPH and ABTS methods of fresh blood orange slices and blood orange slices dried with HAD, VD, and UAVD at 50, 60, and 70 °C, as well as through freeze-drying are shown in Table 4. The TPC value of the fresh blood orange slice was 154.25 mg GAE/100g. The drying techniques and temperatures substantially influenced the total bioactive phenolic compounds and antioxidant activity levels. The FD dried blood orange slices have the highest TPC value (131.27 mg GAE/100g) within the dried blood orange slices. The TPC result of the samples dried by UAVD at 50 °C (128.77 mg GAE/100g DM) is comparable to that of the FD-dried samples (131.27 mg GAE/100g DM)(p<0.05). The preservation of TPC is due to the low temperature and vacuum conditions inherent to the FD process. Tekin-Cakmak et al. [15] and Goztepe et al. [33] indicated that some red fruits, when dried using similar procedures, had the greatest TPC values in freeze-dried samples. The TPC of dried blood orange slices diminished as a result of thermal degradation at rising temperatures throughout the drying process. For UAVD, TPC values decreased from 128.77 mg GAE/g DM to 65.25 mg GAE/g DM by increasing the temperature from 50 °C to 70 °C. Similarly, research on Tunisian eggplants examined how different drying techniques impacted their drying properties and bioactive compounds. Chouaibi et al. [47] established that both freeze-drying and ultrasound-assisted drying reduced product deterioration, corroborating results from analogous research. The elevated TPC value of UAVD-dried blood orange slices has been implicated in the occurrence of cavitation, resulting in the extraction of components that are released from cells during the drying process.
The antioxidant activity of many foods has been extensively studied due to its ability to counteract oxidation processes that reduce chronic illnesses associated with oxidative stress in the human body [48]. Various antioxidant chemicals, including ascorbic acid, flavonoids, and phenolic acids, were regarded as natural sources in horticulture goods. The ABTS analysis was employed to assess the antioxidant potential of both lipophilic and hydrophilic antioxidants, encompassing flavonoids (flavones, flavanones, and flavonols) and phenolic acids, particularly ferulic acid and p-coumaric acid [49]. The antioxidant capacity of fresh blood orange slices was determined to be 7380.01 mg TE/100g DM in the DPPH assay and 242.67 mg TE/100g DM in the ABTS assay. Consistent with the TPC results, the maximum DPPH and ABTS values recorded were 7330.09 mg TE/g DM and 226.46 mg TE/g DM, respectively, in FD-dried blood orange slices. At 50 °C, the UAVD technique yields 6907.63 mg TE/100g DM, followed by the FD method at 7339.09 mg TE/100g DM for DPPH, with the VD method resulting in 5990.63 mg TE/100g DM thereafter. A comparable pattern observed with DPPH is also evident with ABTS. Thermal treatments and oxidative processes may have caused the breakdown of phenolic compounds and reduced the antioxidant activity of the samples [50]. The antioxidant capacity of fruits dried using the UAVD technique surpasses that of samples dried using HAD, as indicated by TPC findings. The results indicate that the UAVD approach could be beneficial as an alternative to the HAD method.
3.3. Vitamin C
The concentrations of different chemical constituents, such as vitamins, minerals, and phenolics, which are recognized for their potent antioxidant qualities, impact the quality of citrus fruits [51]. Fresh juice has high levels of vitamin C, which is measured as ascorbic acid among the vitamins [52]. Rapisarda [53] reported that vitamin C is rich in blood oranges; in fact, Moro and Tarocco have a higher concentration of vitamin C than many other blood orange cultivars, with juice containing 0.50 to 0.80 g/kg. The vitamin C content of both fresh and dried blood orange slices is also shown in Table 4. Fresh blood orange slices have a vitamin C level of 55.32 mg/100g, whereas dried blood orange slices have a vitamin C content of 29.79 to 49.01 mg/100g, which is quite comparable to what has been found in other studies [46,54].
3.4. Individual phenolic compounds
Table 7 shows the effect of different drying methods and temperatures on individual phenolic compounds of blood orange slices. The HAD method caused greater reductions in the amount of all phenolic compounds identified than other drying methods. Hirsch [55] indicated that the activation of oxidative enzymes, including polyphenol oxidase, during hot air oven drying results in a reduction of flavonoid concentration. The loss was reduced due to the diminished activity of the polyphenol oxidase enzyme during freeze-drying at lower temperatures [56].
There are 6 hydroxycinnamic acids found in blood orange slices which are caffeic acid, chlorogenic acid, ferulic acid, o-coumaric acid, p-coumaric acid, and sinapic acid. Ferulic acid was the most dominant hydroxycinnamic acid in fresh and dried blood orange slices, accounting for the largest proportion of the total hydroxycinnamic acid contents. Ferulic acid is found mostly in fresh blood oranges (2442.164 mg/100gDM). Among dried blood oranges, freeze-dried blood oranges contained the most ferulic acid (2307.669 mg/100 gKM), followed by blood oranges dried with UAVD at 50 °C with a ferulic acid content of 2142.062 mg/100 gKM. Ellagic acid is a hexahydroxydiphenic acid abundantly found in fruits, pomegranates, cranberries, and other plant foods. This study found that it is the most abundant compound in blood orange after ferulic acid. Ellagic acid exhibits a wide range of biological properties, such as playing an active role in anti-cancer treatment [57].
Flavonoids isolated from citrus fruits are a group of natural compounds with phenolic structures. This study found 6 flavonoids chrysin and rutin were flavon, catechin, myricetin and quercetin were flavanol, and hesperidin was flavanone. Flavanone is the major flavonoid in orange varieties. Table 7 shows that hesperidin was a flavanone and the most abundant individual phenolic compound in fresh and dried blood orange slices. Hesperidin is found mostly in fresh blood oranges (12,201.82 mg/100gDM), followed by freeze-dried blood oranges (11,766.77 mg/100gDM).
3.5. Color
The critical factor of dried products influencing consumer acceptance is product color. Table 8 displays the color characteristics of fresh and dried blood orange slices. The L*, a*, and b* values of fresh blood orange slices are 54.07, 18.35, and 16.15, respectively. In contrast, the L* values of dried blood orange slices vary from 40.44 to 52.70, the a* values range from 9.90 to 19.38, and the b* values range from 5.11 to 16.15. The L*, a*, and b* values of the FD dry blood orange slices were the highest among all dried blood orange slices and were closer to the L*, a*, and b* values of fresh blood orange slices. The L*, a*, and b* values of blood orange slices dried using the freeze-drying method are then compared to those dried using the UAVD method at 50 °C. According to certain researches [10,11,37], the UAVD approach can avoid color changes throughout the drying process. Turan et al. [37] indicated elevated L*, a*, and b* values for UAVD-dried goji berries in comparison to HAD-dried samples. The reduction in the L* value of dried samples is mostly attributable to Maillard reactions and nonenzymatic browning, which are inevitable during drying operations [58]. Furthermore, drying may diminish essential substrates for the Maillard reaction, including sugars and soluble pigments, resulting in a decrease in the a* value of the dried samples [59].
The drying of various foods under constant conditions typically results in curves with distinct shapes during the falling rate period [43]. Damage to the cell structure of foods may result in deviations during the constant drying rate period [10]. Ultrasonic treatment enhances the drying rate by leveraging the beneficial impacts of heating through attenuation and adsorption, in conjunction with the mechanical effects of pressure waves [10,12,13]. Table 3 indicates that the drying rate values for the HAD, VD, and UAVD methods varied with drying temperature. The drying rate values obtained through the UAVD method, as presented in Table 3, exceeded those of the HAD and VD methods during the falling rate period, attributable to the beneficial effects of ultrasound. The drying rate values escalated with all drying techniques as the temperature increased. A shortened period is essential for the material to attain equilibrium moisture content. Figure 3 illustrates the drying rate vs kg water/kg drymatter.
In the current study, the Deff rose as the temperature rose in all of the drying processes. The Deff values of the HAD, VD, and UAVD dried samples varied from 9.08*10-6 to 2.82*10-5 m2/s, from 2.60*10-5 to 2.96*10-5m2/s, from 2.20*10-5 to 2.99*10-5, respectively. Table 3 displays the Deff values for the HAD-, VD-, and UAVD-dried blood orange slices at 50, 60, and 70 °C. The Deff values of the UAVD-dried samples are higher than those of the HAD-dried and VD-dried blood oranges. Table 3 presents the Deff values for the HAD, VD, and UAVD methods at 50, 60, and 70 °C. The Deff values of the UAVD-dried samples exceed those of the HAD-dried and VD-dried blood oranges. The data in Table 3 suggest that Deff increases as the temperature rises, which is because the hydration content of the blood oranges decreases due to the rapid evaporation of water molecules. As the temperature increased, Huang and Chen [44] noted that the Deff of sewage sludges increased.
Energy consumption varies with drying methods and temperature, and it decreases as the temperature increases. This study found that total energy consumption varied from 0.163 to 0.266 kWh with HAD, from 0.196 to 0.286 kWh with VD, and from 0.298 to 0.372 kWh with the UAVD method. The total energy consumption of samples dried using the UAVD method exceeded that of other drying methods; however, the drying times with UAVD were shorter, suggesting that UAVD drying may be more economical.
4. Conclusions
This study investigated the effects of different drying methods and temperatures on drying duration, bioactive compounds, vitamin C levels, and color alterations in blood oranges. UAVD demonstrated decreased drying time and improved retention of bioactive constituents, such as vitamin C, in comparison to VD and HAD. Moreover, UAVD exhibited less color changes and shrinkage relative to VD and HAD. Despite the samples dried by freeze-drying (FD) demonstrating the highest retention of bioactive substances, their total phenolic content (TPC) and CUPRAC recovery values were lower than those of the other samples. This study demonstrates that UAVD is efficacious for drying raspberry fruit, leading to decreased drying duration, negligible color and physical changes in samples, and improved retention of bioactive components.
Author Contributions
For research articles with several authors, a short paragraph specifying their individual contributions must be provided. The following statements should be used “Conceptualization, S.K. and Z.H.T.C.; methodology, Z.H.T.C.; software, Z.H.T.C. and S.K.; validation, D.Y., Z.H.T.C., and S.K.; formal analysis, D.Y. and Z.H.T.C.; investigation, D.Y. and Z.H.T.C.; resources, D.Y. and Z.H.T.C.; data curation, Z.H.T.C., and S.K.; writing—original draft preparation, Z.H.T.C., and S.K.; writing—review and editing, Z.H.T.C., and S.K. All authors have read and agreed to the published version of the manuscript.
Funding
This research received no external funding.
Institutional Review Board Statement
Not applicable.
Informed Consent Statement
Not applicable.
Data Availability Statement
The authors declare that all the data supporting the findings of this study are available within the article.
Conflicts of Interest
The authors declare no conflicts of interest.
Abbreviations
The following abbreviations are used in this manuscript:
| ABTS | 2,2'-azino-bis(3-ethylbenzothiazoline-6-sulfonic acid |
| Deff | Effective moisture diffusivity |
| DPPH | 2,2-diphenyl-1-picrylhydrazyl |
| DR | drying rate |
| FD | Freeze-drying |
| HAD | Hot air drying |
| HPLC | high-performance liquid chromatography |
| Me | Equilibrium moisture content |
| Mt | Moisture content at time t |
| M0 | Initial moisture content |
| MR | Moisture ratio |
| MRprei | Predicted moisture ratio |
| MRexpi | Experimentally determined moisture ratio |
| RMSE | Root mean square error |
| TPC | Total phenolic content |
| UAVD | Ultrasound-assisted vacuum drying |
| VD | Vacuum drying |
References
- Lv, X.; Zhao, S.; Ning, Z.; Zeng, H.; Shu, Y.; Tao, O.; Xiao, C.; Lu, C.; Liu, Y. Citrus fruits as a treasure trove of active natural metabolites that potentially provide benefits for human health. Chemistry Central Journal, 2015, 9, 1–14. [Google Scholar] [CrossRef] [PubMed]
- Gunduz, C.; Rezaei, M.; Quaglia, R.; Pironti, M. Culinary tourism: exploring cultural diplomacy through gastronomy festivals in Turkey and Italy. British Food Journal, 2024, 126, 2621–2645. [Google Scholar] [CrossRef]
- Medda, S.; Fadda, A.; Mulas, M. Influence of climate change on metabolism and biological characteristics in perennial woody fruit crops in the Mediterranean environment. Horticulturae, 2022, 8. [Google Scholar] [CrossRef]
- Rapisarda, P.; Bellomo, S. E.; Intrigliolo, F. Anthocyanins in blood oranges: composition and biological activity. Recent Research Developments in Agricultural & Food Chemistry, 2001, 5, 217–230. [Google Scholar]
- Rapisarda, P.; Fabroni, S.; Peterek, S.; Russo, G.; Mock, H. P. Juice of new citrus hybrids (Citrus clementina Hort. ex Tan.× C. sinensis L. Osbeck) as a source of natural antioxidants. Food Chemistry, 2009, 117, 212–218. [Google Scholar] [CrossRef]
- Abderrahim, K. A.; Remini, H.; Dahmoune, F.; Mouhoubi, K.; Berkani, F.; Abbou, A.; Aoun, O.; Dairi, S.; Belbahi, A.; Kadri, N.; Madani, K. Influence of convective and microwave drying on Algerian blood orange slices: Drying kinetics and characteristics, modeling, and drying energetics. Journal of Food Process Engineering, 2022, 45. [Google Scholar] [CrossRef]
- Hnin, K. K.; Zhang, M.; Ju, R.; Wang, B. A novel infrared pulse-spouted freeze drying on the drying kinetics, energy consumption and quality of edible rose flowers. LWT- Food Science and Technology, 2021, 136, 110318. [Google Scholar] [CrossRef]
- Ashtiani, S. H. M.; Rafiee, M.; Mohebi Morad, M.; Martynenko, A. Cold plasma pretreatment improves the quality and nutritional value of ultrasound-assisted convective drying: The case of goldenberry. Drying Technology, 2022, 40, 1639–1657. [Google Scholar] [CrossRef]
- Ashtiani, S. H. M.; Rafiee, M.; Morad, M. M.; Khojastehpour, M.; Khani, M. R.; Rohani, A.; Shokri, B.; Martynenko, A. Impact of gliding arc plasma pretreatment on drying efficiency and physicochemical properties of grape. Innovative Food Science and Emerging Technologies, 2020, 63, 102381. [Google Scholar] [CrossRef]
- Tekin, Z.H.; Başlar, M.; Karasu, S.; Kilicli, M. Dehydration of green beans using ultrasound-assisted vacuum drying as a novel technique: drying kinetics and quality parameters. Journal of Food Processing and Preservation, 2017, 41, e13227. [Google Scholar] [CrossRef]
- Kayacan, S.; Sagdic, O.; Doymaz, I.; Karasu, S. The effect of different drying methods on total bioactive properties, individual phenolic compounds, rehydration ability, color, and microstructural characteristics of Asian pear. Journal of Food Processing and Preservation, 2022, 46. [Google Scholar] [CrossRef]
- Baslar, M.; Kılıclı, M.; Toker, O. S.; Sagdıc, O.; Arici, M. Ultrasonic vacuum drying technique as a novel process for shortening the drying period for beef and chicken meats. Innovative Food Science and Emerging Technologies, 2014, 26, 182–190. [Google Scholar] [CrossRef]
- Chen, Z. G.; Guo, X. Y.; Wu, T. A novel dehydration technique for carrot slices implementing ultrasound and vacuum drying methods. Ultrasonics sonochemistry, 2016, 30, 28–34. [Google Scholar] [CrossRef]
- da Silva, E. S.; Brandão, S. C. R.; da Silva, A. L.; da Silva, J. H. F.; Coêlho, A. C. D.; Azoubel, P. M. Ultrasound-assisted vacuum drying of nectarine. Journal of Food Engineering, 2019, 246, 119–124. [Google Scholar] [CrossRef]
- Tekin Cakmak, Z. H.; Kayacan Cakmakoglu, S.; Avcı, E.; Sagdic, O.; Karasu, S. Ultrasound-assisted vacuum drying as alternative drying method to increase drying rate and bioactive compounds retention of raspberry. Journal of Food Processing and Preservation, 2021, 45. [Google Scholar] [CrossRef]
- Tekin, Z. H.; Baslar, M. The effect of ultrasound-assisted vacuum drying on the drying rate and quality of red peppers. Journal of Thermal Analysis and Calorimetry, 2018, 132, 1131–1143. [Google Scholar] [CrossRef]
- Baslar, M.; Kılıclı, M.; Yalınkılıc, B. Dehydration kinetics of salmon and trout fillets using ultrasonic vacuum drying as a novel technique. Ultrasonics Sonochemistry, 2015, 27, 495–502. [Google Scholar] [CrossRef]
- Wang, X.; Xu, S.; Wu, Z.; Li, Y.; Wang, Y.; Wu, Z.; Zhu, G.; Yang, M. A novel ultrasound-assisted vacuum drying technique for improving drying efficiency and physicochemical properties of Schisandra chinensis extract powder. Food Science & Nutrition, 2022, 10, 49–59. [Google Scholar]
- da Silva Júnior, E. V.; de Melo, L. L.; de Medeiros, R. A. B.; Barros, Z. M. P.; Azoubel, P. M. Influence of ultrasound and vacuum assisted drying on papaya quality parameters. LWT- Food Science and Technology, 2018, 97, 317–322. [Google Scholar] [CrossRef]
- Gong, Y.; Fan, L.; Wang, L.; Li, J. Flos Sophorae Immaturus: Phytochemistry, bioactivities, and its potential applications. Food Reviews International, 2023, 39, 3185–3203. [Google Scholar] [CrossRef]
- Kilic, A. Mathematical Modeling of Low Temperature High Velocity (LTHV) Drying in Foods. Journal of Food Process Engineering, 2017, 40. [Google Scholar] [CrossRef]
- Henderson, S.; Pabis, S. Grain drying theory: IV. The effect of air flow rate on the drying index. Journal of Agricultural Engineering Research, 1962, 7, 85–89. [Google Scholar]
- Lewis, W.K. The rate of drying of solid materials. Industrial & Engineering Chemistry, 1921, 13, 427–432. [Google Scholar]
- Yagcioglu, A. Drying characteristic of laurel leaves under different conditions. In Proceedings of the 7th International congress on agricultural mechanization and energy, Faculty of Agriculture, Cukurova University. 1999. [Google Scholar]
- Midilli, A.; Kucuk, H. Mathematical modeling of thin layer drying of pistachio by using solar energy. Energy conversion and Management 2003, 44(7), 1111–1122. [Google Scholar] [CrossRef]
- Toğrul, İ.T.; Pehlivan, D. Modelling of drying kinetics of single apricot. Journal of Food Engineering 2003, 58(1), 23–32. [Google Scholar] [CrossRef]
- Page, G.E. Factors Influencing the Maximum Rates of Air-Drying Shelled Corn in Thin layers. 1949, Purdue University.
- Süfer, Ö.; Sezer, S.; Demir, H. Thin layer mathematical modeling of convective, vacuum and microwave drying of intact and brined onion slices. Journal of Food Processing and Preservation 2017, 41, e13239. [Google Scholar] [CrossRef]
- Ertekin, C.; Yaldiz, O. Drying of eggplant and selection of a suitable thin layer drying model. Journal of Food Engineering 2004, 63, 349–359. [Google Scholar] [CrossRef]
- Wang, C.; Singh, R. A single layer drying equation for rough rice. 1978, ASAE paper.
- Corzo, O. , et al., Weibull distribution for modeling air drying of coroba slices. LWT - Food Science and Technology 2008, 41, 2023–2028. [Google Scholar] [CrossRef]
- Batu, H. S.; Kadakal, C. Drying characteristics and degradation kinetics in some parameters of goji berry (Lycium Barbarum L.) fruit during hot air drying. Italian Journal of Food Science, 2021, 33, 16–28. [Google Scholar] [CrossRef]
- Goztepe, B.; Kayacan, S.; Bozkurt, F.; Tomas, M.; Sagdic, O.; Karasu, S. Drying kinetics, total bioactive compounds, antioxidant activity, phenolic profile, lycopene and β-carotene content and color quality of Rosehip dehydrated by different methods. LWT- Food Science and Technology, 2022, 153, 112476. [Google Scholar] [CrossRef]
- Singleton, V. L.; Rossi, J. A. Colorimetry of total phenolics with phosphomolybdic-phosphotungstic acid reagents. American Journal of Enology and Viticulture, 1965, 16, 144–158. [Google Scholar] [CrossRef]
- Brand-Williams, W.; Cuvelier, M. E.; Berset, C. L. W. T. Use of a free radical method to evaluate antioxidant activity. LWT-Food Science and Technology, 1995, 28, 25–30. [Google Scholar] [CrossRef]
- Arnao, M. B.; Cano, A.; Hernández-Ruiz, J.; Garcıa-Cánovas, F.; Acosta, M. Inhibition by L-ascorbic acid and other antioxidants of the 2, 2′-azino-bis (3-ethylbenzthiazoline-6-sulfonic acid) oxidation catalyzed by peroxidase: a new approach for determining total antioxidant status of foods. Analytical Biochemistry, 1996, 236, 255–261. [Google Scholar] [CrossRef] [PubMed]
- Turan, B.; Tekin-Cakmak, Z. H.; Kayacan Çakmakoglu, S.; Karasu, S.; Kasapoglu, M. Z.; Avci, E. Effect of different drying techniques on total bioactive compounds and individual phenolic composition in goji berries. Processes, 2023, 11. [Google Scholar] [CrossRef]
- Modica, G.; Legua, P.; La Malfa, S.; Gentile, A.; Continella, A. Qualitative Traits and Antioxidant Properties of Blood Oranges Are Affected by the Genotype and the Climatic Conditions. Foods, 2024, 13. [Google Scholar] [CrossRef]
- Akdaş, S.; Başlar, M. Dehydration and degradation kinetics of bioactive compounds for mandarin slices under vacuum and oven drying conditions. Journal of Food Processing and Preservation, 2015, 39, 1098–1107. [Google Scholar] [CrossRef]
- Li, Y.; Wang, X.; Wu, Z.; Wan, N.; Yang, M. Dehydration of hawthorn fruit juices using ultrasound-assisted vacuum drying. Ultrasonics sonochemistry, 2020, 68, 105219. [Google Scholar] [CrossRef]
- Akcicek, A.; Avci, E.; Tekin-Cakmak, Z.H.; Kasapoglu, M.Z.; Sagdic, O.; Karasu, S. Influence of different drying techniques on the drying kinetics, total bioactive compounds, anthocyanin profile, color, and microstructural properties of blueberry fruit. ACS omega 2023, 8, 41603–41611. [Google Scholar] [CrossRef] [PubMed]
- Liu, S.; Zhu, W.; Bai, X.; Taifei, Y.; Yan, J. Effect of ultrasonic energy density on moisture transfer during ultrasound enhanced vacuum drying of honey. Journal of Food Measurement and Characterization, 2019, 13, 559–570. [Google Scholar] [CrossRef]
- Tepe, T. K.; Tepe, B. The comparison of drying and rehydration characteristics of intermittent-microwave and hot-air dried-apple slices. Heat and Mass Transfer, 2020, 56, 3047–3057. [Google Scholar] [CrossRef]
- Huang, Y.W.; Chen, M.Q. Thin-layer isothermal drying kinetics of municipal sewage sludge based on two falling rate stages during hot-air-forced convection. Journal of Thermal Analysis and Calorimetry, 2017, 129, 567–575. [Google Scholar] [CrossRef]
- Hunlun, C.; De Beer, D.; Sigge, G. O.; Van Wyk, J. Phenolic composition and total antioxidant capacity of South African frozen concentrated orange juice as affected by varietal, seasonal and regional differences. Journal of the Science of Food and Agriculture, 2019, 99, 1029–1037. [Google Scholar] [CrossRef] [PubMed]
- Legua, P.; Modica, G.; Porras, I.; Conesa, A.; Continella, A. Bioactive compounds, antioxidant activity and fruit quality evaluation of eleven blood orange cultivars. Journal of the Science of Food and Agriculture, 2022, 102, 2960–2971. [Google Scholar] [CrossRef] [PubMed]
- Chouaibi, M.; Snoussi, A.; Attouchi, S.; Ferrari, G. Influence of drying processes on bioactive compounds profiles, hydroxymethylfurfural, color parameters, and antioxidant activities of Tunisian eggplant (Solanum melongena L.). Journal of Food Processing and Preservation, 2021, 45, e15460. [Google Scholar] [CrossRef]
- Cömert, E. D.; Gökmen, V. Evolution of food antioxidants as a core topic of food science for a century. Food Research International, 2018, 105, 76–93. [Google Scholar] [CrossRef]
- Rapisarda, P.; Fabroni, S.; Peterek, S.; Russo, G.; Mock, H.P. Juice of new citrus hybrids (Citrus clementina Hort. ex Tan.× C. sinensis L. Osbeck) as a source of natural antioxidants. Food chemistry 2009, 117, 212–218. [Google Scholar] [CrossRef]
- Ertekin, O.; Yaldiz, C. Thin layer solar drying of some different vegetables. Drying Technology, 2001, 19, 583–596. [Google Scholar]
- Zhuo, Z.; Xi, W.; Hu, Y.; Nie, C.; Zhou, Z. Antioxidant activity of citrus fruits. Food Chemistry, 2016, 196, 885–896. [Google Scholar]
- Cebadera-Miranda, L.; Domínguez, L.; Dias, M. I.; Barros, L. , Ferreira, I. C., Igual, M., Martínez-Navarrete, N., Fernández-Ruiz, V., Morales, P.; Cámara, M. Sanguinello and Tarocco (Citrus sinensis [L.] Osbeck): Bioactive compounds and colour appearance of blood oranges. Food chemistry, 2019, 270, 395–402. [Google Scholar] [CrossRef]
- Rapisarda, P.; Tomaino, A.; Lo Cascio, R.; Bonina, F.; De Pasquale, A.; Saija, A. Antioxidant effectiveness as influenced by phenolic content of fresh orange juices. Journal of Agricultural and Food Chemistry, 1999, 47, 4718–4723. [Google Scholar] [CrossRef]
- Ordóñez-Díaz J., L.; Hervalejo, A.; Pereira-Caro, G.; Muñoz-Redondo, J. M.; Romero-Rodríguez, E.; Arenas-Arenas, F. J.; Moreno-Rojas, J. M. Effect of rootstock and harvesting period on the bioactive compounds and antioxidant activity of two Orange cultivars (‘Salustiana’ and‘Sanguinelli’) widely used in juice industry. Processes, 2020, 8, 1212. [Google Scholar] [CrossRef]
- Hirsch, A. R.; Förch, K.; Neidhart, S.; Wolf, G.; Carle, R. Effects of thermal treatments and storage on pectin methylesterase and peroxidase activity in freshly squeezed orange juice. Journal of the Science of Food and Agriculture, 2008, 56, 5691–5699. [Google Scholar] [CrossRef]
- Kumar, D.; Ladaniya, M.S.; Gurjar, M.; Kumar, S. Impact of drying methods on natural antioxidants, phenols and flavanones of immature dropped Citrus sinensis L. Osbeck fruits. Osbeck fruits. Scientific Reports 2022, 12(1), 6684. [Google Scholar] [CrossRef] [PubMed]
- Xue, P.; Zhang, G.; Zhang, J.; Ren, L. Synergism of ellagic acid in combination with radiotherapy and chemotherapy for cancer treatment. Phytomedicine, 2022, 99, 153998. [Google Scholar] [CrossRef] [PubMed]
- Kammoun Bejar, A.; Kechaou, N.; Boudhrioua Mihoubi, N. Effect of microwave treatment on physical and functional properties of orange (Citrus sinensis) peel and leaves. Journal of Food Processing and Technology, 2011, 2, 109–116. [Google Scholar] [CrossRef]
- Xiao, H.W.; Lin, H.; Yao, X.D.; Du, Z.L.; Lou, Z.; Gao, Z.J. Effects of different pretreatments on drying kinetics and quality of sweet potato bars undergoing air impingement drying. International Journal of Food Engineering 2009, 5. [Google Scholar] [CrossRef]
Disclaimer/Publisher’s Note: The statements, opinions, and data contained in all publications are solely those of the individual author(s) and contributor(s) and not of MDPI and/or the editor(s). MDPI and/or the editor(s) disclaim responsibility for any injury to people or property resulting from any ideas, methods, instructions, or products referred to in the content. |
Figure 1.
Fresh and dried blood oranges with HAD, VD, UAVD, and FD.
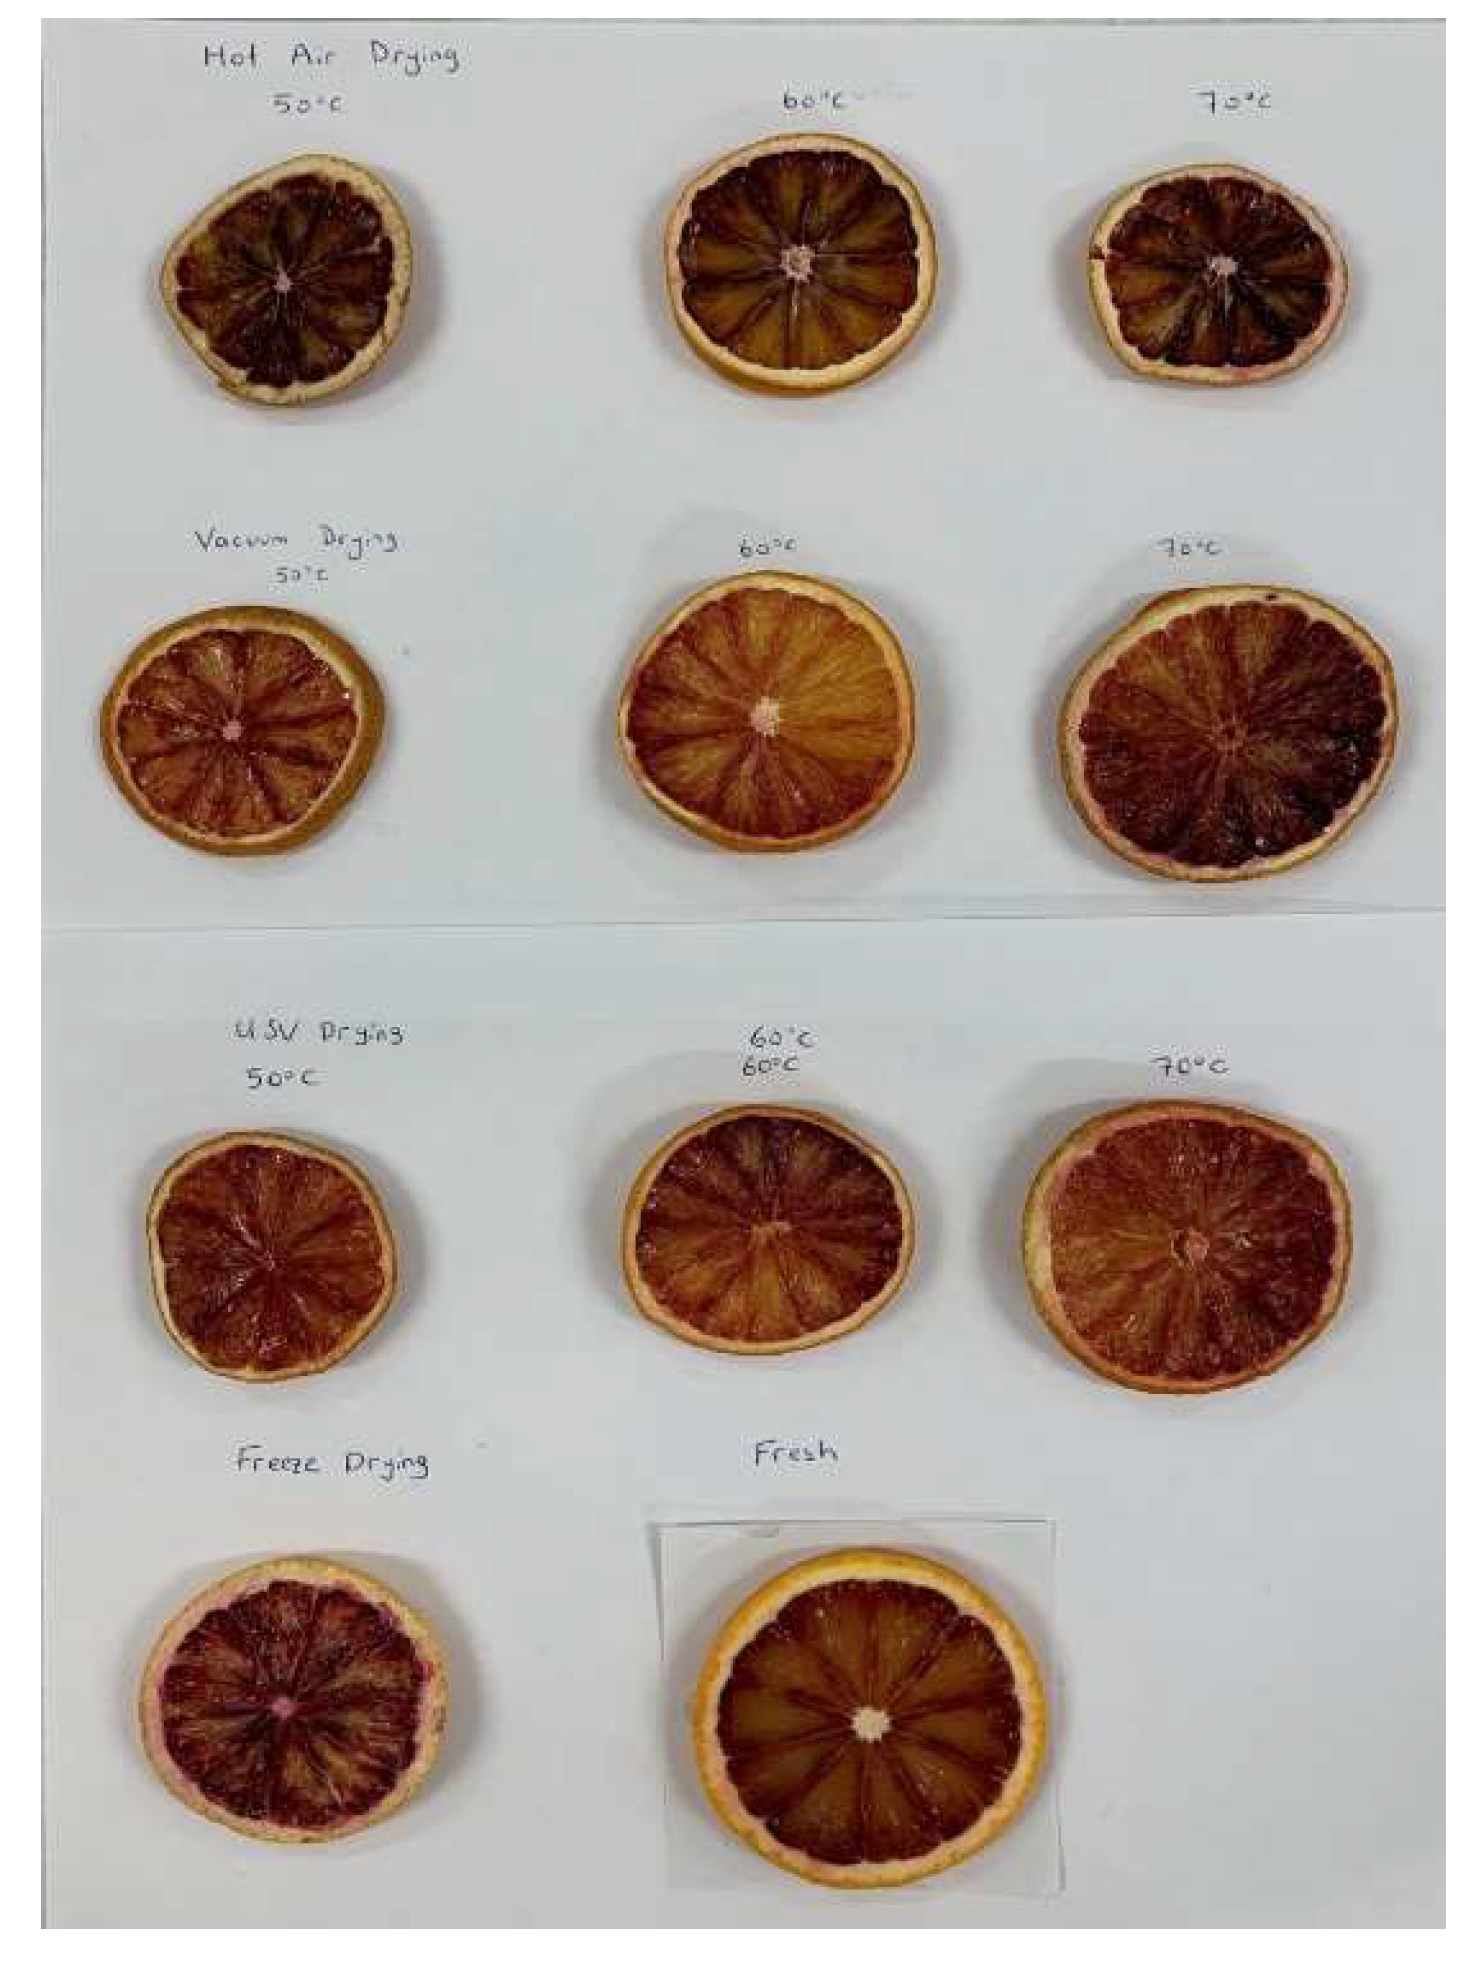
Figure 2.
Moisture ratio (MR) vs time (h).
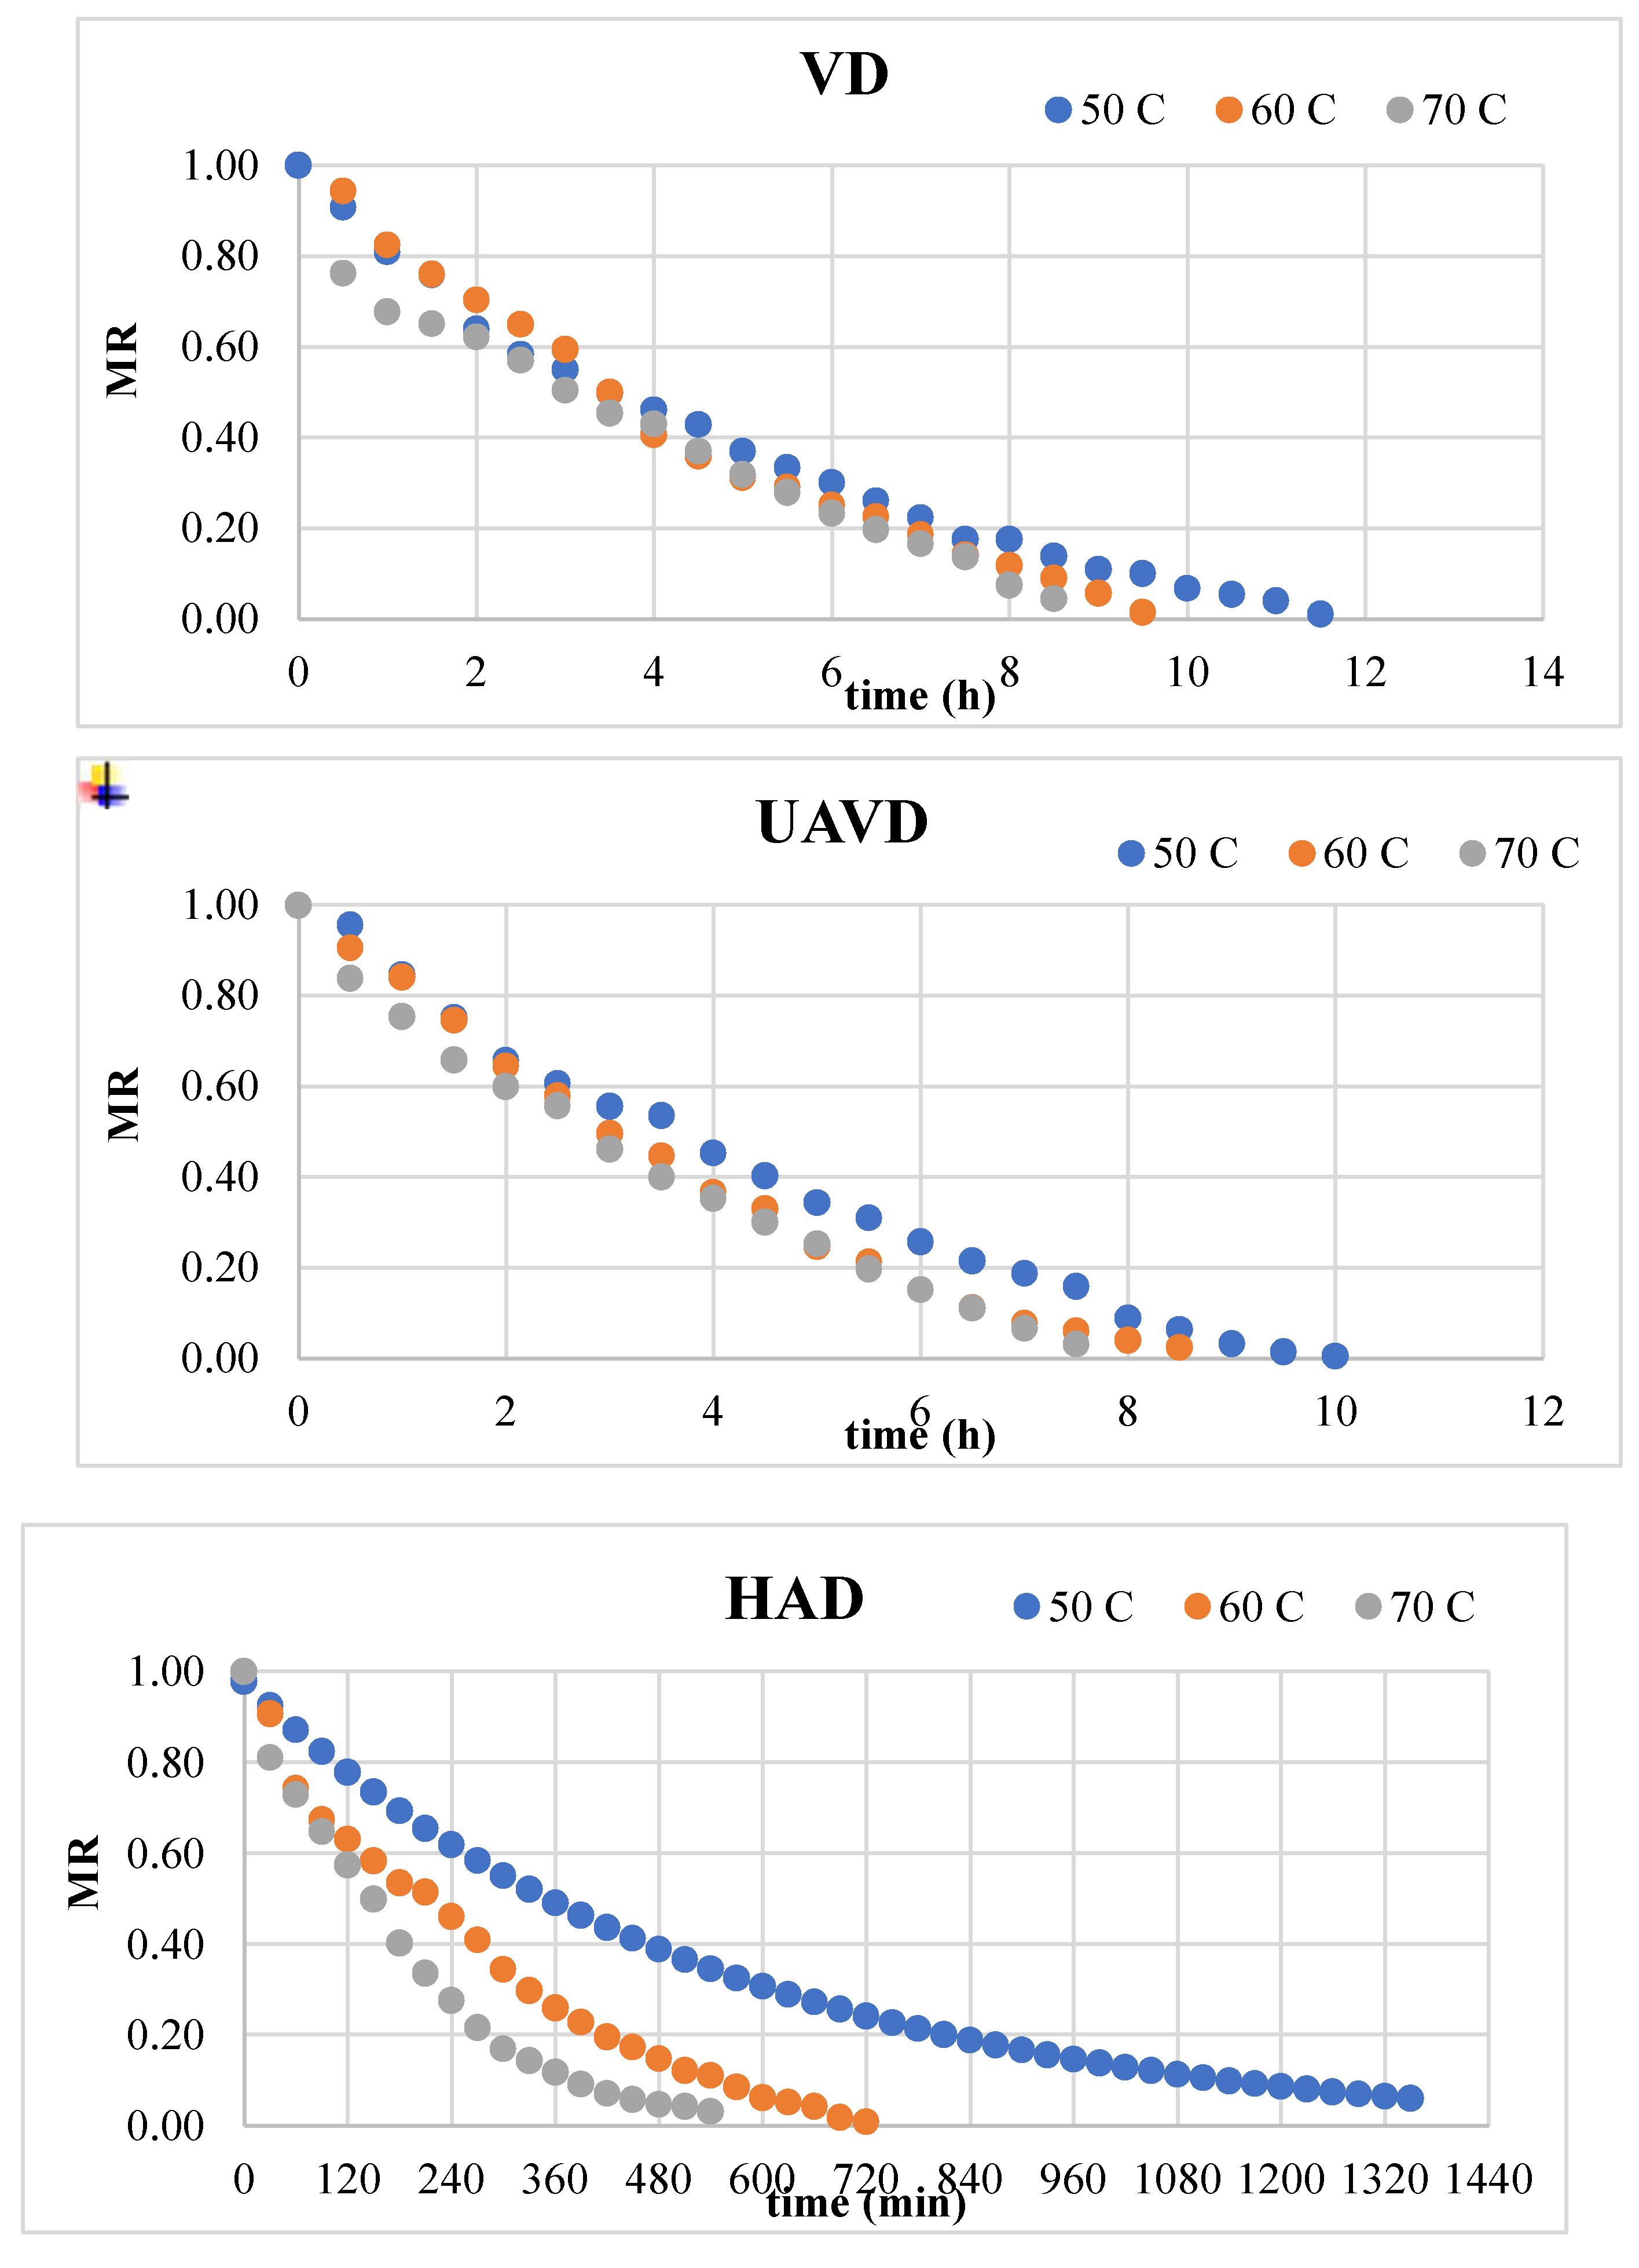
Figure 3.
Drying rate vs kg water/kg drymatter.
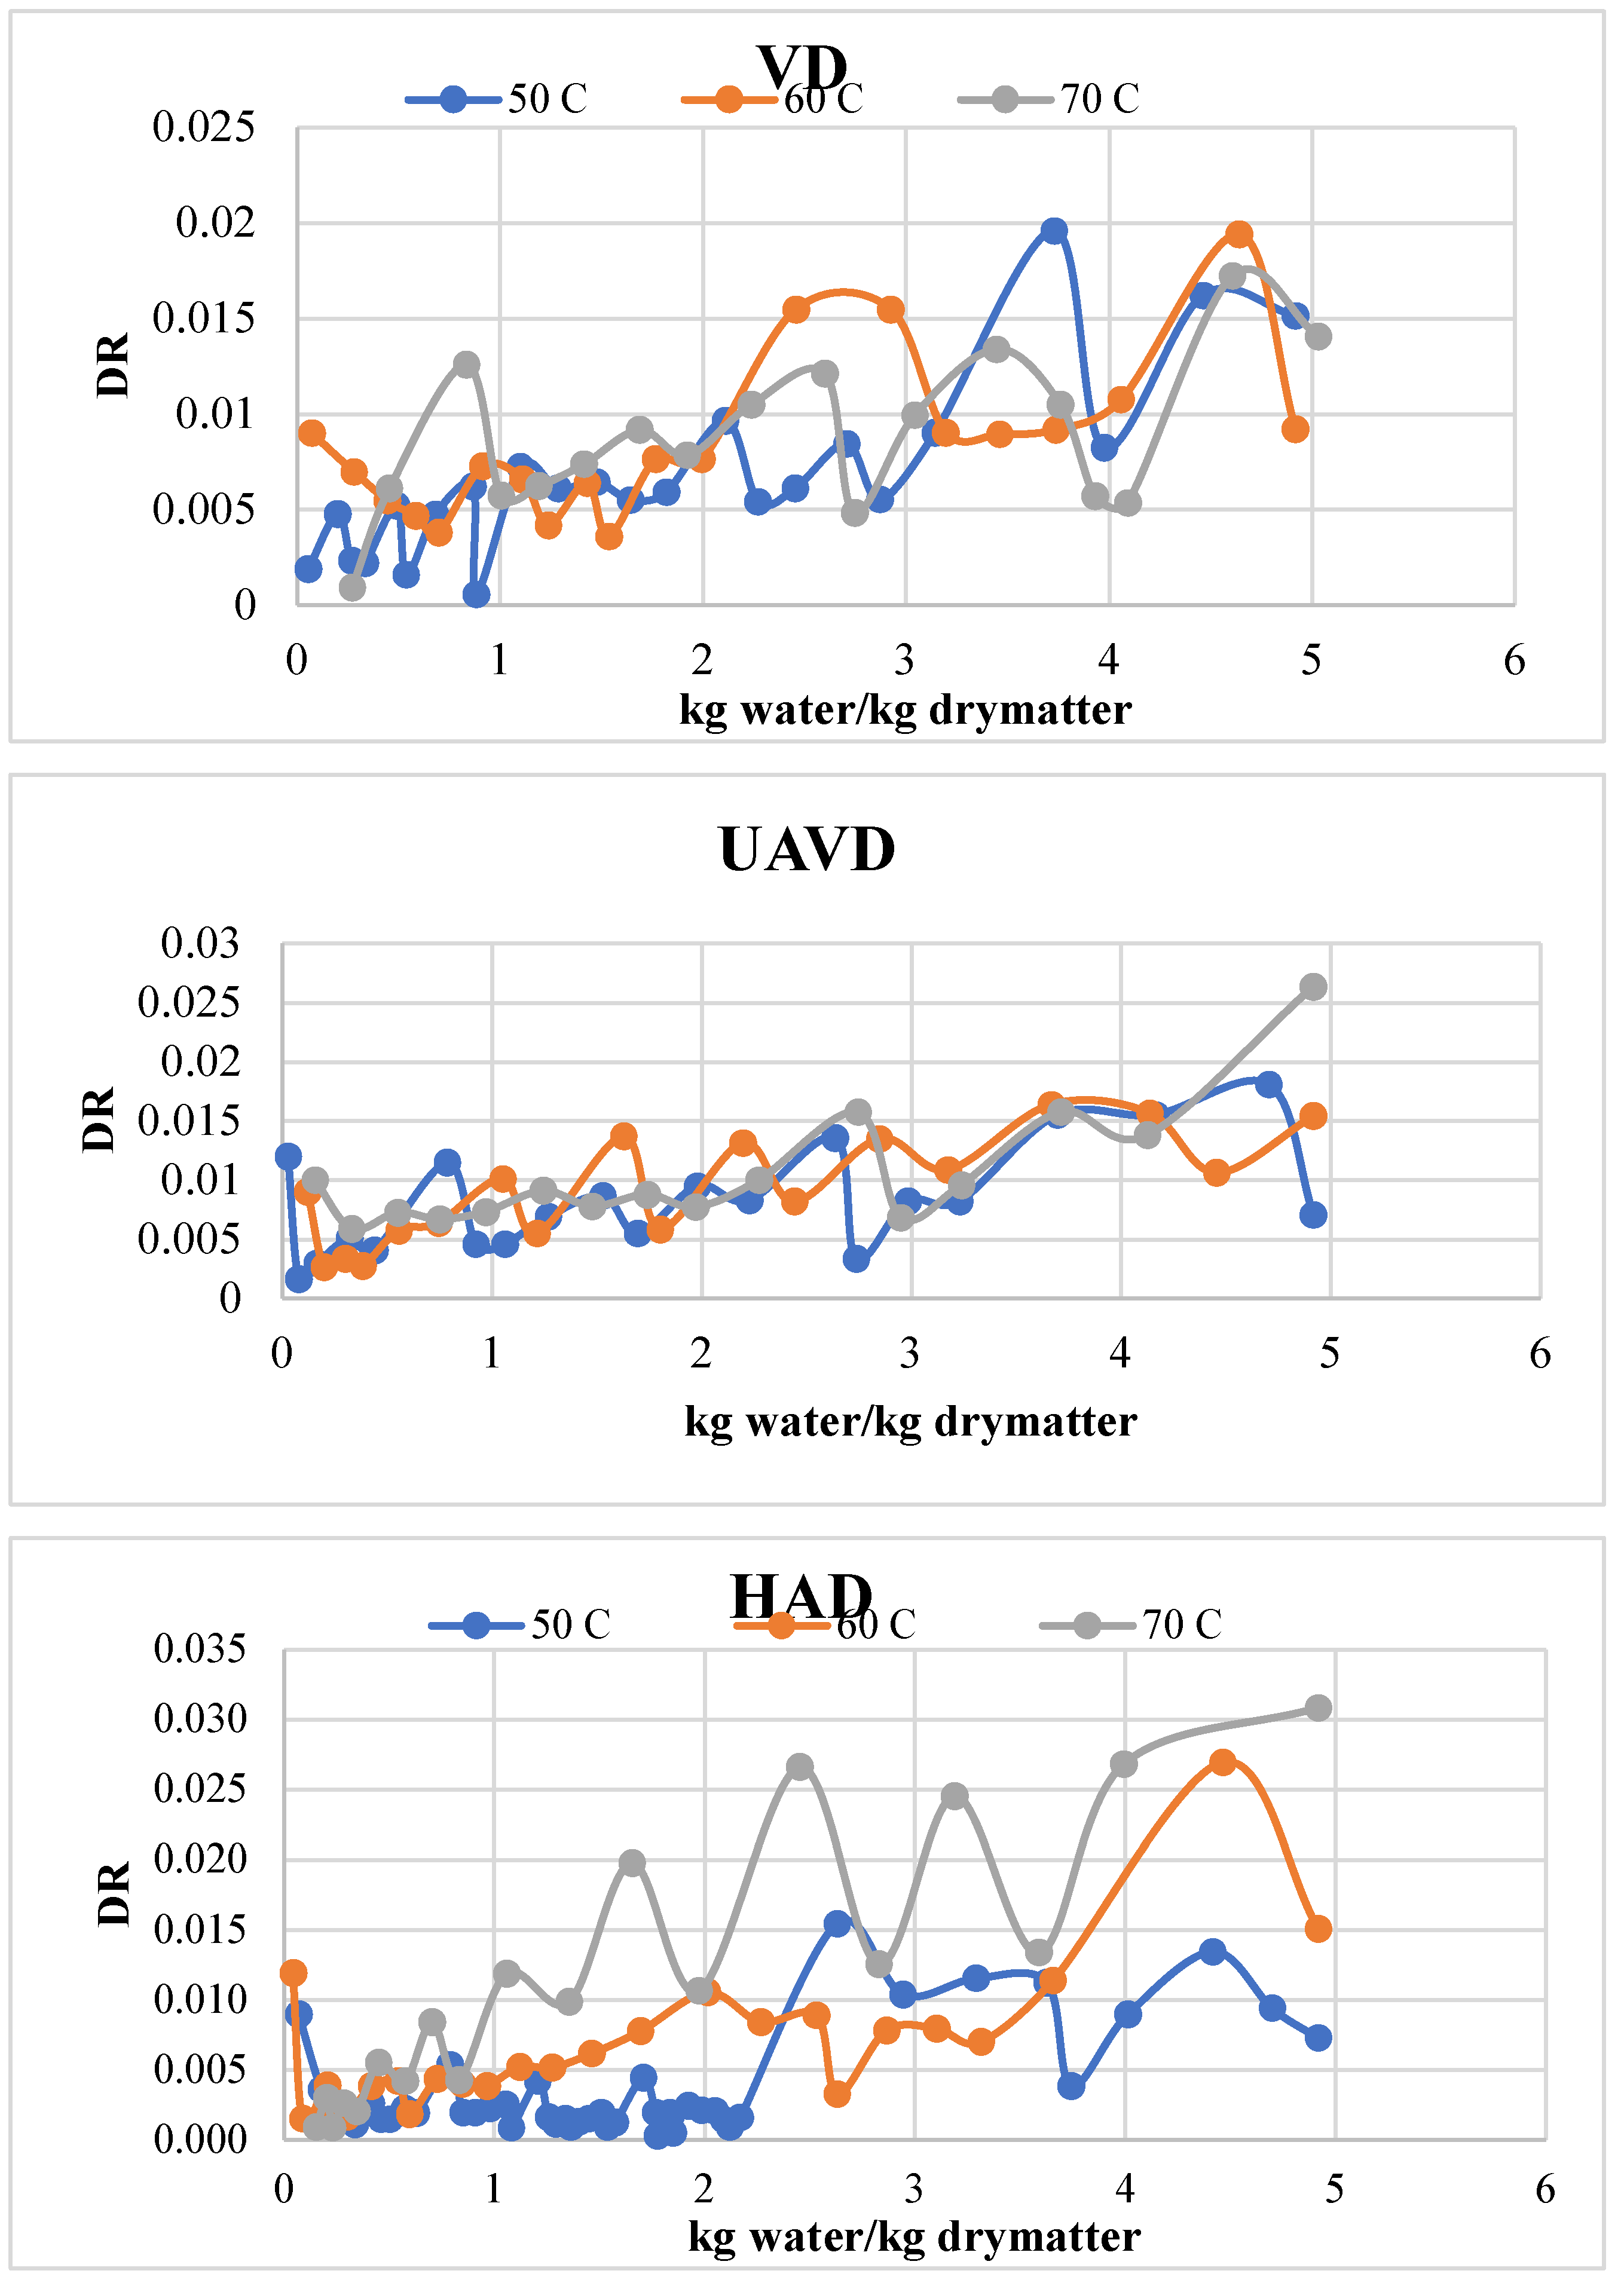

Table 1.
Thin-layer drying models applied to the blood orange slices drying curves.
| Model | Mathematical equation | Reference |
| Demir | y=a*exp(-k*x)^n+c | [21] |
| Henderson and Pabis | y=a*exp(-k*x) | [22] |
| Lewis | y=exp(-k*x) | [23] |
| Logarithmic | y=a*exp(-k*x)+c | [24] |
| Midilli and Kucuk | y=a*exp(-k*(x^n))+b*t | [25] |
| Modified Page | y=exp(-((k*x)^n)) | [26] |
| Page | y=exp(-k*(x^n)) | [27] |
| Parabolic | y=a+b*x+c*x^2 | [28] |
| Two-term exp | y=a*exp(-k*x)+(1-a)*exp(-k*a*x) | [29] |
| Wang and Singh | y=1+a*x+b*x^2 | [30] |
| Weibull | y=exp(-(x^a/b^a)) | [31] |
Table 2.
Calculated parameters and statistical model parameters according to HAD, VD, and UAVD.
| Model | Parameters | HAD | VD | UAVD | ||||||
| 50 °C | 60 °C | 70 °C | 50 °C | 60 °C | 70 °C | 50 °C | 60 °C | 70 °C | ||
| Demir et al. | a | 0.918 | 1.111 | 1.175 | 1.149 | 1.391 | 1.352 | 1.149 | 1.391 | 2.004 |
| k | 0.330 | -0.411 | -0.559 | -0.419 | -0.436 | -0.389 | -0.419 | -0.436 | -0.301 | |
| n | 0.396 | -0.403 | -0.480 | -0.372 | -0.358 | -0.392 | -0.372 | -0.358 | -0.304 | |
| c | 0.049 | -0.144 | -0.086 | -0.164 | -0.371 | -0.390 | -0.164 | -0.371 | -0.989 | |
| R2 | 0.983 | 0.997 | 0.998 | 0.999 | 0.999 | 0.998 | 0.999 | 0.999 | 0.999 | |
| RMSE | 0.0455 | 0.0212 | 0.0192 | 0.0165 | 0.0152 | 0.0161 | 0.0137 | 0.0195 | 0.0114 | |
| χ2 | 0.0023 | 0.0005 | 0.0005 | 0.0003 | 0.0003 | 0.0003 | 0.0002 | 0.0005 | 0.0002 | |
| Henderson and Pabis | a | 0.943 | 1.006 | 1.015 | 1.027 | 1.078 | 1.013 | 1.027 | 1.078 | 1.087 |
| k | 0.112 | 0.229 | 0.330 | 0.221 | 0.286 | 0.286 | 0.221 | 0.286 | 0.272 | |
| R2 | 0.982 | 0.993 | 0.995 | 0.994 | 0.987 | 0.998 | 0.994 | 0.987 | 0.982 | |
| RMSE | 0.0466 | 0.0343 | 0.0286 | 0.0470 | 0.0489 | 0.0399 | 0.0314 | 0.0356 | 0.0576 | |
| χ2 | 0.0023 | 0.0013 | 0.0009 | 0.0025 | 0.0027 | 0.0018 | 0.0011 | 0.0014 | 0.0038 | |
| Lewis | k | 0.120 | 0.227 | 0.325 | 0.215 | 0.265 | 0.282 | 0.215 | 0.265 | 0.248 |
| R2 | 0.979 | 0.993 | 0.995 | 0.993 | 0.983 | 0.990 | 0.993 | 0.983 | 0.976 | |
| RMSE | 0.0499 | 0.0344 | 0.0290 | 0.0532 | 0.0565 | 0.0402 | 0.0327 | 0.0448 | 0.0666 | |
| χ2 | 0.0025 | 0.0012 | 0.0009 | 0.0030 | 0.0034 | 0.0017 | 0.0011 | 0.0021 | 0.0047 | |
| Logarithmic | a | 0.918 | 1.111 | 1.075 | 1.149 | 1.391 | 1.352 | 1.149 | 1.391 | 2.004 |
| k | 0.131 | 0.166 | 0.330 | 0.156 | 0.156 | 0.152 | 0.156 | 0.156 | 0.091 | |
| c | 0.049 | 0.144 | 0.186 | -0.164 | -0.371 | -0.390 | -0.164 | -0.371 | -0.989 | |
| R2 | 0.983 | 0.997 | 0.998 | 0.999 | 0.999 | 0.998 | 0.999 | 0.999 | 0.999 | |
| RMSE | 0.0455 | 0.0212 | 0.0192 | 0.0165 | 0.0152 | 0.0161 | 0.0137 | 0.0195 | 0.0114 | |
| χ2 | 0.0022 | 0.0005 | 0.0004 | 0.0003 | 0.0003 | 0.0003 | 0.0002 | 0.0005 | 0.0002 | |
| Midilli et al. | a | 0.959 | 1.035 | 1.314 | 0.966 | 0.969 | 4.663 | 0.966 | 0.969 | 0.968 |
| k | 0.177 | 0.191 | 0.238 | 0.149 | 0.135 | 0.054 | 0.149 | 0.135 | 0.108 | |
| n | 0.809 | 0.842 | 1.203 | 1.194 | 1.449 | 0.723 | 1.194 | 1.450 | 1.559 | |
| b | -0.00004 | 0.00003 | 0.708 | 0.0000004 | -0.000015 | 2.890 | 0.0000004 | -0.00001 | 0.00006 | |
| t | -0.00004 | 0.00003 | 0.446 | 0.0000004 | -0.000015 | -1.268 | 0.0000004 | -0.00001 | 0.00006 | |
| R2 | 0.986 | 0.998 | 0.998 | 0.996 | 0.998 | 1.000 | 0.996 | 0.998 | 0.997 | |
| RMSE | 0.0406 | 0.0299 | 0.0183 | 0.0314 | 0.0192 | 0.0313 | 0.0243 | 0.0176 | 0.0233 | |
| χ2 | 0.0018 | 0.0011 | 0.0005 | 0.0013 | 0.0005 | 0.0014 | 0.0007 | 0.0004 | 0.0008 | |
| Modified Page | k | 0.123 | 0.224 | 0.319 | 0.211 | 0.259 | 0.279 | 0.211 | 0.259 | 0.247 |
| n | 0.845 | 1.083 | 1.127 | 1.131 | 1.374 | 1.140 | 1.131 | 1.374 | 1.464 | |
| R2 | 0.986 | 0.994 | 0.997 | 0.996 | 0.998 | 0.993 | 0.996 | 0.998 | 0.997 | |
| RMSE | 0.0411 | 0.0319 | 0.0222 | 0.0320 | 0.0213 | 0.0343 | 0.0256 | 0.0207 | 0.0255 | |
| χ2 | 0.0018 | 0.0011 | 0.0004 | 0.0011 | 0.0005 | 0.0013 | 0.0007 | 0.0005 | 0.0007 | |
| Page | k | 0.170 | 0.198 | 0.276 | 0.172 | 0.186 | 0.233 | 0.172 | 0.156 | 0.129 |
| n | 0.845 | 1.083 | 1.127 | 1.131 | 1.374 | 1.140 | 1.131 | 1.374 | 1.464 | |
| R2 | 0.986 | 0.994 | 0.997 | 0.996 | 0.998 | 0.993 | 0.996 | 0.998 | 0.997 | |
| RMSE | 0.0411 | 0.0319 | 0.0222 | 0.0320 | 0.0213 | 0.0343 | 0.0256 | 0.0207 | 0.0255 | |
| χ2 | 0.0018 | 0.0011 | 0.0006 | 0.0011 | 0.0005 | 0.0013 | 0.0007 | 0.0005 | 0.0007 | |
| Parabolic | a | 0.877 | 0.937 | 0.957 | 0.957 | 1.012 | 0.951 | 0.957 | 1.012 | 1.014 |
| c | 0.002 | 0.006 | 0.014 | 0.006 | 0.010 | 0.009 | 0.006 | 0.010 | -0.178 | |
| b | -0.072 | -0.148 | -0.224 | -0.146 | -0.198 | -0.186 | -0.146 | -0.198 | 0.006 | |
| R2 | 0.970 | 0.996 | 0.998 | 0.998 | 0.999 | 0.998 | 0.998 | 0.999 | 0.999 | |
| RMSE | 0.0598 | 0.0251 | 0.0163 | 0.0184 | 0.0106 | 0.0187 | 0.0191 | 0.0241 | 0.0104 | |
| χ2 | 0.0038 | 0.0004 | 0.0001 | 0.0004 | 0.0001 | 0.0004 | 0.0004 | 0.0007 | 0.0001 | |
| Two Term Exp | a | 0.219 | 1.544 | 1.625 | 1.621 | 1.890 | 1.636 | 1.621 | 1.889 | 1.943 |
| k | 0.276 | 0.413 | 0.435 | 0.273 | 0.394 | 0.364 | 0.273 | 0.394 | 0.386 | |
| R2 | 0.988 | 0.994 | 0.997 | 0.996 | 0.997 | 0.993 | 0.996 | 0.997 | 0.995 | |
| RMSE | 0.2646 | 0.1535 | 0.0905 | 0.0341 | 0.0257 | 0.0332 | 0.0250 | 0.0217 | 0.0320 | |
| χ2 | 0.0016 | 0.0010 | 0.0005 | 0.0013 | 0.0007 | 0.0013 | 0.0007 | 0.0005 | 0.0012 | |
| Wang & Singh | a | -0.094 | -0.169 | -0.242 | -0.160 | -0.193 | -0.212 | -0.160 | -0.193 | -0.171 |
| b | 0.002 | 0.007 | 0.015 | 0.007 | 0.009 | 0.011 | 0.007 | 0.009 | 0.005 | |
| R2 | 0.955 | 0.993 | 0.997 | 0.996 | 0.999 | 0.996 | 0.996 | 0.999 | 0.999 | |
| RMSE | 0.0735 | 0.0339 | 0.0227 | 0.0185 | 0.0115 | 0.0264 | 0.0246 | 0.0245 | 0.0117 | |
| χ2 | 0.0057 | 0.0012 | 0.0006 | 0.0004 | 0.0001 | 0.0008 | 0.0007 | 0.0007 | 0.0002 | |
| Weibull | a | 0.845 | 1.083 | 1.127 | 1.131 | 1.374 | 1.140 | 1.131 | 1.374 | 1.464 |
| b | 8.114 | 4.456 | 3.138 | 4.732 | 4.865 | 3.585 | 4.733 | 3.865 | 4.042 | |
| R2 | 0.986 | 0.994 | 0.997 | 0.996 | 0.998 | 0.993 | 0.996 | 0.998 | 0.997 | |
| RMSE | 0.0411 | 0.0319 | 0.0222 | 0.0320 | 0.0213 | 0.0343 | 0.0256 | 0.0207 | 0.0255 | |
| χ2 | 0.0018 | 0.0011 | 0.0006 | 0.0011 | 0.0005 | 0.0013 | 0.0007 | 0.0005 | 0.0007 | |
Table 3.
Drying time, drying rate, effective moisture diffusivity, and total energy consumption of the blood oranges.
Table 3.
Drying time, drying rate, effective moisture diffusivity, and total energy consumption of the blood oranges.
| Drying Method | Temperature(°C) | Drying time(h) | DR*(h-1) | Deff** (m2/s) | Total Energy consumption (kW·h) |
| HAD | 50 | 22.5Aa | 0.044 | 9.08×10⁻¹⁰ | 0.163 |
| 60 | 12.0Ab | 0.083 | 2.32×10⁻⁹ | 0.209 | |
| 70 | 9.0Ac | 0.108 | 2.82×10⁻⁹ | 0.266 | |
| VD | 50 | 11.5Ba | 0.082 | 2.60×10⁻⁹ | 0.196 |
| 60 | 9.5Bb | 0.115 | 2.76×10⁻⁹ | 0.235 | |
| 70 | 8.5Bc | 0.130 | 2.96×10⁻⁹ | 0.286 | |
| UAVD | 50 | 10.0Ca | 0.104 | 2.20×10⁻⁹ | 0.298 |
| 60 | 8.5Cb | 0.118 | 2.90×10⁻⁹ | 0.333 | |
| 70 | 7.5Cc | 0.135 | 2.99×10⁻⁹ | 0.372 |
*DR: Drying rate and **Deff: Effective moisture diffusivity. Different lowercase letter displays significance of the parameters. Different uppercase letter displays significance of the parameters(p<0.5). .
Table 4.
Total phenolic content, antioxidant activity, and vitamin C values of fresh and dried blood orange.
Table 4.
Total phenolic content, antioxidant activity, and vitamin C values of fresh and dried blood orange.
| TPC (mg GAE/100g) | |||
| Fresh | 154.25±4.65A | 154.25±4.65A | 154.25±4.65A |
| FD | 131.27±0.41B | 131.27±0.41B | 131.27±0.41B |
| 50°C | 60°C | 70°C | |
| HAD | 107.08±0.27Da | 87.99±0.41Db | 44.00±1.90Ec |
| VD | 122.24±1.08Ca | 112.36±1.49Cb | 59.70±0.0.27Dc |
| UAVD | 128.77±0.95Ba | 108.16±1.08Cb | 65.25±2.03Cc |
| DPPH (mg TE/100g) | |||
| Fresh | 7380.01±16.44A | 7380.01±16.44A | 7380.01±16.44A |
| FD | 7339.09±8.84A | 7339.09±8.84A | 7339.09±8.84A |
| 50°C | 60°C | 70°C | |
| HAD | 5083.67±36.81Da | 4705.49±6.69Db | 2249.00±46.85Dc |
| VD | 5990.63±20.08Ca | 5123.83±36.81Cb | 4434.40±50.20Cc |
| UAVD | 6907.63±46.85Ba | 5950.476.69Bb | 4926.3753.55Bc |
| ABTS (mg TE/100g) | |||
| Fresh | 242.67±7.03A | 242.67±7.03A | 242.67±7.03A |
| FD | 225.46±0.35B | 225.46±0.35B | 225.46±0.35B |
| 50°C | 60°C | 70°C | |
| HAD | 162.93±6.67Ea | 139.74±3.16Eb | 118.31±2.81Ec |
| VD | 185.76±0.70Da | 153.80±1.76Db | 129.56±1.41Dc |
| UAVD | 218.08±4.22Ca | 192.79±7.03Cb | 169.60±2.11Cc |
| Vitamin C (mg/100g) | |||
| Fresh | 55.32±0.45A | 55.32±0.45A | 55.32±0.45A |
| FD | 49.01±0.21B | 49.01±0.21B | 49.01±0.21B |
| 50°C | 60°C | 70°C | |
| HAD | 36.19±0.14Da | 33.60±0.35Eb | 29.79±0.18Ec |
| VD | 44.81±0.30Ca | 41.40±0.25Db | 37.55±0.29Dc |
| UAVD | 46.10±0.08Ca | 44.82±0.44Ca | 41.63±0.20Cb |
*DR: Drying rate and **Deff: Effective moisture diffusivity. Different lowercase letter displays significance of the parameters(p<0.5). Different uppercase letter displays significance of the parameters(p<0.5). .
Table 7.
Individual phenolic compounds of blood orange slices (µg/100mL of dry weight).
| FRESH | FD | HAD | VD | UAVD | |||||||
| 50°C | 60°C | 70°C | 50°C | 60°C | 70°C | 50°C | 60°C | 70°C | |||
| 4-Hydroxybenzoic acid | 698.384 | 679.661 | 617.872 | 530.046 | 415.985 | 665.501 | 548.873 | 449.317 | 687.720 | 563.045 | 464.280 |
| Gallic acid | 694.133 | 663.086 | 586.187 | 506.159 | 386.882 | 608.642 | 563.000 | 420.385 | 630.301 | 585.626 | 458.424 |
| Protocatechuic acid | 90.007 | 76.274 | 50.086 | 34.536 | 29.728 | 60.823 | 52.608 | 51.665 | 81.743 | 87.068 | 59.782 |
| Syringic acid | 419.783 | 313.852 | 151.958 | 127.316 | 73.126 | 135.800 | 122.398 | 118.860 | 137.515 | 112.840 | 111.849 |
| Caffeic acid | 773.416 | 741.618 | 645.529 | 566.257 | 412.475 | 665.606 | 537.631 | 402.346 | 696.803 | 545.505 | 405.051 |
| Chlorogenic acid | 874.063 | 828.764 | 807.190 | 629.639 | 469.726 | 824.394 | 719.540 | 570.502 | 887.985 | 733.310 | 588.280 |
| Ferulic acid | 2442.164 | 2307.669 | 1723.559 | 1586.942 | 1223.456 | 1927.890 | 1884.938 | 1645.212 | 2142.062 | 1922.387 | 1633.186 |
| o-coumaric acid | 315.635 | 300.019 | 236.401 | 200.192 | 114.675 | 276.441 | 227.648 | 130.081 | 272.344 | 231.669 | 143.211 |
| p-coumaric acid | 902.509 | 910.730 | 835.561 | 726.757 | 622.768 | 853.823 | 773.700 | 651.752 | 876.964 | 757.289 | 683.279 |
| Sinapic acid | 569.698 | 547.795 | 439.647 | 387.185 | 265.075 | 459.391 | 354.217 | 295.903 | 498.377 | 339.098 | 259.853 |
| Ellagic acid | 1137.644 | 1075.601 | 814.108 | 756.400 | 529.044 | 911.640 | 844.927 | 708.886 | 980.226 | 860.551 | 731.712 |
| Catechin | 1796.558 | 1407.770 | 1046.529 | 885.411 | 874.530 | 1264.428 | 1088.181 | 892.293 | 1279.250 | 1284.575 | 856.867 |
| Chrysin | 698.898 | 684.894 | 604.188 | 400.100 | 241.552 | 630.269 | 568.110 | 451.798 | 670.510 | 550.835 | 452.889 |
| Hesperidin | 12,201.82 | 11,766.77 | 8,445.41 | 6,978.38 | 5,811.42 | 9,832.24 | 9,036.76 | 7814,85 | 10,710.31 | 9,419.63 | 7,757.89 |
| Quercetin | 265.783 | 219.296 | 182.930 | 146.665 | 127.057 | 152.290 | 125.304 | 108.828 | 178.698 | 134.023 | 106.376 |
| Rutin | 380.074 | 374.675 | 194.474 | 179.055 | 129.941 | 255.517 | 186.065 | 106.053 | 244.775 | 150.100 | 139.097 |
Table 8.
Color parameters of blood orange slices.
| FRESH | FD | HAD | VD | UAVD | |||||||
| 50 °C | 60 °C | 70 °C | 50 °C | 60 °C | 70 °C | 50 °C | 60 °C | 70 °C | |||
| L* | 54.07±0.61a | 52.70±0.16a | 44.48±0.25d | 43.20±0.10d | 40.44±0.07f | 49.75±0.13b | 47.57±0.31c | 42.51±0.09de | 46.73±0.16c | 43.42±0.26d | 42.14±0.09de |
| a* | 18.35±0.14ab | 19.38±0.41a | 14.80±0.10d | 12.46±0.19e | 9.90±0.18f | 17.64±0.04b | 16.34±0.02c | 14.97±0.09d | 19.35±0.23a | 18.72±0.08ab | 17.57±0.31b |
| b* | 16.11±0.02a | 15.38±0.26ab | 12.17±0.15c | 9.98±0.54d | 5.11±0.12f | 14.34±0.28b | 12.26±0.15c | 6.74±0.20ef | 14.14±0.15ab | 12.71±0.18c | 7.51±0.12e |
Different lowercase letter displays significance of the parameters (p<0.5). Different uppercase letter displays significance of the parameters(p<0.5). .
Disclaimer/Publisher’s Note: The statements, opinions and data contained in all publications are solely those of the individual author(s) and contributor(s) and not of MDPI and/or the editor(s). MDPI and/or the editor(s) disclaim responsibility for any injury to people or property resulting from any ideas, methods, instructions or products referred to in the content. |
© 2025 by the authors. Licensee MDPI, Basel, Switzerland. This article is an open access article distributed under the terms and conditions of the Creative Commons Attribution (CC BY) license (http://creativecommons.org/licenses/by/4.0/).
Copyright: This open access article is published under a Creative Commons CC BY 4.0 license, which permit the free download, distribution, and reuse, provided that the author and preprint are cited in any reuse.


