
Submitted:
16 June 2023
Posted:
19 June 2023
You are already at the latest version
Abstract
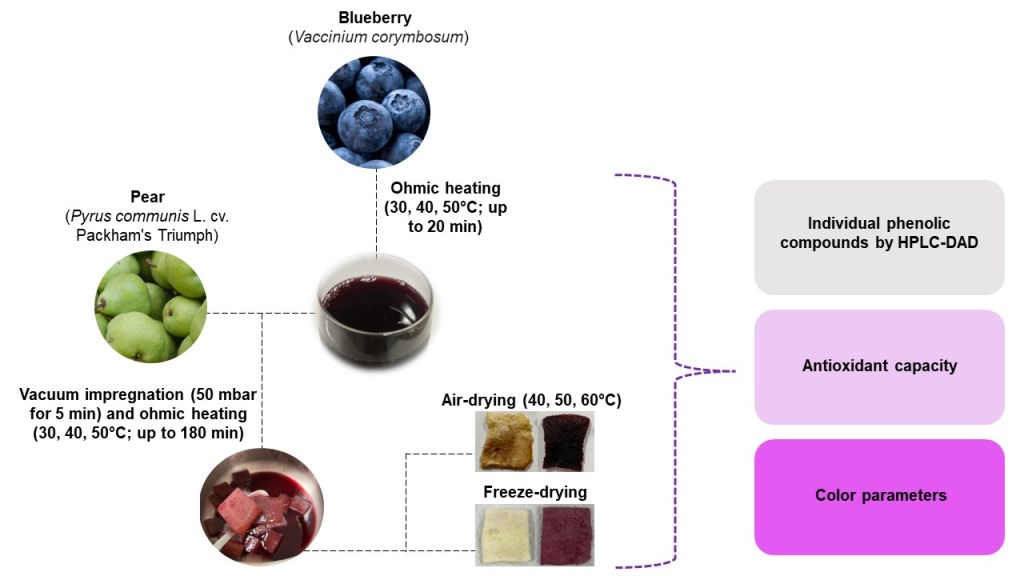
The focus of this study was to evaluate the effectiveness of incorporation of phenolic compounds from blueberry juice into pear slices using a combination of ohmic heating (OH) and vacuum impregnation (VI), followed by air- or freeze-drying. The results showed that OH is a valuable technique to increase the content of bioactive compounds and antioxidant capacity of blueberry juice. The optimal OH treatment is heating the juice at 50 °C for 20 min under an electric field of 13 V/cm. Furthermore, the combination of VI and OH showed the efficiency of enriching pear slices with bioactive compounds from blueberry juice. The best treatment is to immerse the slices for 90 min at 50 °C and an electric field of 7.8 V/cm. The presence of anthocyanin pigments from blueberry juice affects the color parameters of pear slices by increasing the a* parameter and decreasing the b* and L* parameters. However, both freeze-drying and air-drying (at temperatures of 40, 50, and 60 °C) negatively affected the phenolic content and antioxidant capacity. Notably, air-drying at 60 °C highest levels of phenolic compounds and antioxidant potential for both impregnated and non-impregnated pear slices among the drying processes applied.
Keywords:
anthocyanins
; ohmic extraction
; pulsed-vacuum
; Pyrus communis
; Vaccinium corymbosum
1. Introduction
A diet rich in fruits and vegetables is associated with the minimization of numerous chronic and degenerative diseases, contributing to well-being. The blueberry (Vaccinium spp.) and pear (Pyrus communis L.) fruits are highly accepted by consumers for their pleasant sensorial characteristics, being consumed fresh and processed as frozen pulps, jams, and jellies, among others. Also, they are consumed for being sources of phytochemicals with potential beneficial effects on health [1,2,3,4]. Different compounds with nutritional and bioactive potential are present in blueberries and pears, in which the phenolic compounds can be highlighted. These compounds are associated with numerous beneficial health properties, including antioxidant, antimicrobial, anti-inflammatory, anti-neurodegenerative, and anticarcinogenic, among other effects [1,3,4,5]. In blueberries, anthocyanins gain special prominence, being present, especially in the skin but also in the pulp of the fruit. These compounds are responsible for the purple color of these fruits and are present in high concentrations in them. Other phenolic compounds that may be present in blueberry fruits include phenolic acids, stilbenoids, hydrolysable and condensed tannins, and non-anthocyanin flavonoids [3,4,6]. Phenolic compounds are also found in pears, including flavan-3-ols, phenolic acids, flavonols, simple phenolics (hydroquinones), and anthocyanins for colored cultivars [1,2,5].
The high perishability of fresh fruits, seasonality, costs, among other factors, make it difficult to offer countless fruits in their fresh form constantly. Thus, fruit processing is a crucial way to offer practical and healthy fruit-based products for immediate consumption continuously. However, changes in the physicochemical, sensorial, nutritional, and functional properties can occur in processed products, especially on compounds that are more susceptible to heat, light, and pH changes. This is the case of phenolic compounds, especially anthocyanins, which can undergo degradation during technological processing [3,7,8,9].
The emerging technological processes such as ohmic heating (OH) and vacuum impregnation (VI) can help to obtain fruit-based products enriched with bioactive compounds [8,9,10]. In the OH or electroconductive heating, conductive foods are heated by passing an alternating electrical current through them. The presence of ionic constituents such as salts and acids make most foods conductors of electric current. In this technology, electrical energy is transformed into thermal energy, promoting uniform and rapid heating of food without the need for a heating medium. Also, the electroporation effect is caused in food by the electric field strength applied in the OH. This effect can break the cell wall and change the food matrix's structure, facilitating the entry of compounds into cells, but without necessarily causing a physical disruption of the tissue [10,11]. The OH is especially interesting when associated with VI. In the VI, the matrix food is immersed into the impregnation solution (hypertonic, hypotonic, or isotonic) and the vacuum is applied, being released to atmospheric pressure after a time. The hydrodynamic mechanism of pressure changes promotes an air-liquid flow within the food matrix's pores, where the impregnation solution will occupy the spaces [8,9,12]. Therefore, when OH and VI are used together, a better mass transfer occurs that accelerates the incorporation of sugars, minerals, vitamins, probiotics, and phenolic compounds, among others, from the impregnation solution into the cellular spaces of the food matrix [8,9,12,13].
Additionally, the subsequent application of conventional and emerging technologies such as convection drying and freeze-drying can contribute to increasing the shelf-life of these products by reducing the water content and making it possible to expand the range of products offered to the consumer [3,7]. Freeze-drying is an advanced drying method associated with obtaining products with high sensorial and nutritional quality. Due to the use of low temperatures and low pressure to remove water by sublimation, this technique allows the preservation of the physical structure and many compounds with low heat stability. However, its operating cost is high and rarely used commercially [3,14]. On the other hand, convection drying is widely applied in the food industry due to its cost-effectiveness. In this process, air passes continuously through food at a given temperature, humidity, and flow rate. However, air-dried foods' sensorial, nutritional, and bioactive characteristics are more severely affected [3,7,14]. Therefore, offering practical and healthy fruit-based products is a constant challenge in the food industry.
This study aimed to evaluate the incorporation kinetics and stability of phenolic compounds of blueberry juice treated by OH into pear slices using VI-OH followed by drying processes (air-drying and freeze-drying). Total phenolic, flavonoid, and anthocyanin contents, antioxidant capacity, individual phenolic compounds, and color parameters were evaluated during this study.
2. Materials and Methods
2.1. Reagents
Sodium carbonate (Na2CO3), Folin-Ciocalteu reagent, potassium chloride (KCl), sodium acetate trihydrate (CH3COONa.3H2O), aluminum chloride hexahydrate (AlCl3.6H2O), sodium hydroxide (NaOH), sodium nitrite (NaNO2), iron(III) chloride hexahydrate (FeCl3.6H2O), 2,4,6-Tris(2-pyridyl)-s-triazine (TPTZ), Trolox, hydrochloric acid (HCl), 2,2-diphenyl-1-picrylhydrazyl (DPPH), ethanol, and HPLC-grade solvents (water, acetonitrile, formic acid, and methanol) were purchased from Merck (Germany). The phenolic compounds (pelargonin chloride, epigallocatechin, cyanidin chloride, malvidin chloride, petunidin 3-O-β-glucosidase chloride, catechin, cyanidin 3-O-glucosidase chloride, gallic acid, myricetin, caffeic acid, epigallocatechin gallate, quercetin, p-coumaric acid, and epicatechin) were acquired from Sigma-Aldrich (St. Loius, USA). Distilled water was used in the analyses, except for individual phenolic compounds determination.
2.2. Samples
Blueberries (V. corymbosum) and pears (P. communis L. cv. Packham’s Triumph) were bought in the Ñuble region, Chile. The blueberries and pears were cold at -80 °C and 4 °C, respectively, until their use. Prior to use, the pears were peeled, cut into slices of 3 x 4 x 0.7 cm, and submerged into a solution composed by 2% citric acid and 1% ascorbic acid to prevent oxidation [9].
2.3. Blueberry treatment by OH
The whole and thawed blueberry fruits were added into water in the proportion of 1.2:1 (w/w, fruit:water), and an electric field strength of 13 V/cm at 30, 40, and 50 °C for 5, 10, 15, and 20 min was applied. The electric field strength was calculated as the ratio between the voltage applied and the distance between electrodes. The OH equipment used consists of two concentric stainless-steel cylinders (3.7 and 19 cm of diameter) with a plastic bottom connected to a power source by two electrodes. The temperature was controlled through a thermoregulated bath and an orbital shaker (Barnstead/Lab-line Max Q 2000, USA) was employed.
After the OH treatment, the whole blueberries were pressed and filtered to obtain the blueberry juice. The juice was kept at 4 °C in the dark and in the absence of oxygen for posterior use. The best OH treatment was selected according to the total bioactive compounds and antioxidant capacity data.
2.4. VI-OH of pear slices with blueberry juice
The VI-OH treatment was applied according to Pavez-Guajardo et al. [8], with minor modifications. The VI treatment was carried out at 50 mbar for 5 min in pear slices added into the impregnation solution in the proportion of 1:3 (w/w, pear:solution). The blueberry juice obtained by the selected OH treatment (electrical field strength of 13 V/cm at 50 °C for 20 min) was used as the impregnation solution. In the sequence, the impregnation process was completed applying OH with an electrical field strength of 7.8 V/cm, due to the alternating current at 60 Hz and 60 V. This step of the impregnation process was monitored up to 180 min and at 30, 40, and 50 °C.
The best VI-OH treatment of pear slices with blueberry juice was selected according to the total bioactive compounds and antioxidant capacity data.
2.5. Drying processes of pear slices with blueberry juice
To assess the influence of drying processes on pear slices impregnated and not impregnated with blueberry juice, new pear slices and blueberry juice samples were obtained by applying the conditions selected for the extraction of blueberry juice by OH treatment (electrical field strength of 13 V/cm at 50 °C for 20 min) and for the impregnation of pear slices with blueberry juice by VI-OH treatment (50 mbar for 5 min; electrical field strength of 7.8 V/cm at 50 °C for 90 min). This strategy was adopted to prevent the early degradation of bioactive compounds.
The drying of pear slices with and without impregnation was evaluated by air-drying and freeze-drying. The air-drying was carried out in a forced air oven (Memmert, Model HCP-108, Germany) at 40, 50, and 60 °C, while the freeze-drying was carried out at -45 °C and 0.055 mbar in a manual freeze dryer (Labconco, Freezone 2.5 manual, USA). The drying processes occurred until the samples reaching 18% moisture, monitored by controlling the samples weight [15].
2.6. Total phenolic, flavonoid, and anthocyanin contents
For the extraction of phenolic compounds from pear slices impregnated/not impregnated and dried/not dried, the triturated samples (5 g) were extracted with 10 mL of ethanol:water (6:4, v/v) for 20 min in a shaker (Gerhardt, model RO 500, Germany) protected from light. After centrifugation for 10 min at 10 °C and 4000 rpm, the supernatant was collected. The residue was subjected to the extraction process twice more and the supernatants were combined. The blueberry juice was analyzed directly. Further dilutions were performed when necessary.
2.6.1. Total phenolic content (TPC)
The TPC was determined using the Folin-Ciocalteu method describe by Waterhouse [16]. Briefly, the sample (100 µL) was mixed with distilled water (7.9 mL) and Folin-Ciocalteu reagent (500 µL). After 1 to 8 min, 1.5 mL of 20% (w/v) NaHCO₃ was added to the mixture and incubated for 2 h in the dark. The absorbance was measured at 760 nm in a spectrophotometer (Genesys 10 S UV-Vis, Thermo Scientific, Germany). The result was deducted from the blank and expressed as mg of gallic acid equivalent (GAE) per 100 mL or per 100 g of dry matter (dm).
2.6.2. Total flavonoid content (TFC)
The TFC was determined using the colorimetric method describe by Dewanto et al. [17]. Briefly, the sample (250 µL) was mixed with distilled water (1250 µL) and 75 µL of 5% (w/v) NaNO2. After 6 min, 150 µL of 10% (w/v) AlCl3.6H2O was added to the mixture. After 5 min, 500 µL of 1 M NaOH and 250 µL of distilled water were added to the mixture. The absorbance was immediately measured at 510 nm. The result was deducted from the blank and expressed as mg of catechin equivalent (CE) per 100 mL or per 100 g of dm.
2.6.3. Total monomeric anthocyanin content (TMA)
The TMA was determined using the differential pH method describe by Lee et al. [18], with minor modifications. Briefly, 0.5 mL of sample was mixed with 2 mL of 0.025 M KCl (pH 1.0). This same procedure was performed with 2 mL of 0.4 M CH3COONa.3H2O (pH 4.5). After 25 min in the dark, the absorbance of the mixtures was measured at 510 nm and 700 nm. The results were deducted from the blank and expressed as µg cyanidin 3-glucoside equivalent (C3G) per 100 mL or per 100 g of dm.
2.7. Antioxidant capacity
The antioxidant capacity of the extracts obtained in the section 2.6 was assessed by the DPPH free radical scavenging assay and ferric reducing antioxidant power (FRAP) assay.
2.7.1. DPPH
The DPPH assay was performed according to the method reported by Thaipong et al. [19], with minor modifications. Briefly, 150 µL of the sample was mixed with 2850 µL of DPPH methanolic solution adjusted to 1.1 absorbance units. After 20 min of incubation in the dark, the absorbance of the solution was measured at 515 nm. The result as deducted from the blank and expressed as µmol Trolox equivalents (TE) per 100 mL or per 100 g of dm.
2.7.2. FRAP
The FRAP assay was performed according to Benzie and Strain [20], with minor modifications [19]. The FRAP reagent was prepared freshly by mixing 25 mL of 300 mM CH3COONa.3H2O (pH 3.6), 2.5 mL of 10 mM TPTZ (in 40 mM HCl), and 2.5 mL of 20 mM FeCl3.6H2O. This solution was warmed at 37 °C before use. Briefly, 150 µL of the sample was mixed with 2850 µL of FRAP reagent. After 30 min of incubation in the dark and at 37 °C, the absorbance was measured at 593 nm. The result was deducted from the blank and expressed as µmol TE per 100 mL or per 100 g of dm.
2.8. Color parameters
The color was measured in a spectrocolorimeter (Konica Minolta Optics, CM-5, Japan) adjusted to operate with D65 illuminant, observer angle of 10°, and in reflectance mode. The CIE L* (darkness-lightness), a* (green-red axis), and b* (blue-yellow axis) coordinates were measured against a white background.
2.9. Phenolic compounds by high-performance liquid chromatography (HPLC)
Three solvent systems (water, ethanol:water (6:4, v/v), and methanol:water (8:2, v/v)) were evaluated for the extraction of phenolic compounds from dried pear slices impregnated and not impregnated, and the best signal/noise ratio was obtained by the methanol system. Briefly, the triturated samples were extracted with methanol:water (8:2, v/v) in the proportion of 1:2, respectively, for 1 h in an ultrasonic bath (Elma, E 30 H Elmasonic, Cientec Instrumentos Cientificos, Germany) at 10 °C and protected from light. After centrifugation for 20 min at 10 °C and 7000 rpm, the supernatant was collected and filtered using 45 µm PTFE syringe tip filters (Merck Millipore, Ireland) prior injection on the HPLC system. For the non-dried pear slices impregnated and not impregnated, the triturated samples were centrifugated for 20 min at 10 °C and 7000 rpm, and the supernatant was filtered prior injection on the HPLC system. The blueberry juice was analyzed after filtration. Further dilutions were performed when necessary.
Fourteen phenolic compounds were determined according to the method described by Ruiz et al. [21], with minor modifications, using a series 200 HPLC system from Perkin Elmer (Massachusetts, USA) coupled to a diode array detector. The chromatography separation was carried out in a Purospher STAR RP-18 endcapped column (5 μm, 125 x 4 mm; Merck, Germany) at 40 °C, with 0.8 mL min-1 flow rate, and a gradient of mobile phase (solvent A - water/acetonitrile/formic acid at the proportion of 8.7:0.3:1, v/v/v); solvent B - water/acetonitrile/formic acid at the proportion of 4:5:1, v/v/v) of 94–70% of solvent A (0–15 min), 70–50% of solvent A (16–30 min), 50–40% of solvent A (31–35 min), 40–94% of solvent A (36–41 min), and 94% of solvent A for stabilization (41–45 min). The phenolic compounds were monitored at 280 nm for phenolic acids and non-anthocyanin flavonoids, and at 520 nm for anthocyanins. The results were expressed as mg per 100 mL or per 100 g of dm.
2.10. Statistical analysis
Data were presented as mean ± standard deviation of three independent replicates. Statistical differences between the mean values were verified by the analysis of variance (ANOVA) followed by the least significant difference (LSD) test using the statistical program Statgraphics Centurion XVI Software (Statgraphics, Virginia, USA, 2009). All statistical tests were performed at 5% level (p < 0.05).
3. Results and discussion
3.1. Blueberry treatment by OH
Blueberry fruits contain several bioactive compounds in which anthocyanins can be highlighted. These compounds are responsible for the purple color of these berries and may represent more than 50% of the total content of phenolic compounds in these fruits. However, other phenolic groups are also present in blueberries, such as phenolic acids and non-anthocyanin flavonoids [4,6]. An efficient transfer of phenolic compounds and other bioactive compounds to products and raw materials obtained from blueberries, such as blueberry juice, is essential to enrich these products with compounds with potential health effects. The OH can assist in this regard, as it promotes an electroporation effect stimulating the break of the cell wall and facilitating the subsequent extraction of the compounds of interest, but without causing the physical disruption of the food matrix [22,23].
In this study, whole blueberry fruits were submitted to the OH aiming specially the disruption of the cell wall from the fruit skin to facilitate the extraction of anthocyanins since these compounds are present in high amounts in this part of the fruit [4,24]. As shown in Table 1, the values of TPC, TFC, and TMA of blueberry juice were affected by the different OH treatments. In general, the increase in the time and in the temperature of OH promoted an increase in the values of TPC, TFC, and TMA of the blueberry juice, indicating a better efficiency in the rupture of the cell wall and, consequently, in the accessibility of bioactive compounds to be extracted from the fruit. The highest values for TPC (201.09 mg GAE/100 mL) and TFC (148.57 mg CE/100 mL) were observed in the OH treatment at 50 °C for 20 and 15 min, respectively. The highest value of TMA was found in the OH treatment at 30 °C for 20 min (1219.04 µg C3G/100 mL), despite that high values of TMA were also observed at 40 and 50 °C for 15 and 20 min. These findings indicate that the OH contributes to the extraction of phenolic compounds from the blueberry fruit but may somewhat negatively affect anthocyanin content. Despite being potent antioxidant compounds, anthocyanins have low stability, influenced by many factors such as moisture, light, pH, temperature, oxygen, sugar content, metals, and enzymes [25,26]. Therefore, our data suggest that longer times and temperatures of OH are unlikely to promote intense improvements in the extraction of anthocyanins, which may favor the degradation of this critical group of phenolic compounds present in blueberries.
The phenolic compounds are well known due to their beneficial health properties, in which the antioxidant capacity can be highlighted. Compounds with potential antioxidant action against the oxidation process through different mechanisms of action, which include scavenging free radicals, chelating metal ions, quenching singlet oxygen and secondary oxidation products, and inactivating reactive oxygen and nitrogen species [27,28]. Through antioxidant action, these compounds attenuate the effects of oxidative stress and minimize other harmful health effects. Also have neuroprotective, anti-inflammatory, anticancer, and cardioprotective, among other effects [24,27]. As observed for TPC, TFC, and TMA, the different OH treatments also affected the antioxidant capacity of blueberry juice (Table 1). Especially for the FRAP assay, increasing the time and temperature of OH increased the antioxidant capacity of the OH-treated blueberry juices. The highest values for DPPH assay were found in the OH at 30 °C for 15 and 20 min, and at 50 °C for 20 min (419.88 to 430.16 µmol TE/100 mL), while for FRAP assay the highest value was verified at 50 °C for 20 min (562.24 µmol TE/100 mL). These findings seem to be related to the content of phenolic compounds extracted from the blueberry fruit in each of the OH conditions studied. For example, especially the high value for DPPH at 30 °C for 15/20 min can be linked to the TMA of the blueberry juice, as well as the high values for DPPH and FRAP at 50 °C for 15/20 min are possibly associated with the values of TPC and TFC, besides TMA. The increase in the values of TPC and antioxidant capacity by FRAP assay was also reported for carrot and mulberry juices treated by OH and associated with the electroporation effect that facilitates the release of phenolic compounds with antioxidant potential [29,30,31].
Therefore, the OH proves to be an important technological tool to improve the bioactive compounds content of fruit juices. Considering the data obtained, the OH treatment selected to obtain the blueberry juice was set at 50 °C for 20 min in which high values of TPC, TFC, TMA, and antioxidant capacity were obtained.
3.2. VI-OH of pear slices with blueberry juice
The search for functional foods that contain constituents with potential beneficial health effects is constant. Thus, the enrichment of foods with bioactive compounds is promising and was applied in this study. The pears are fruits with high acceptance among consumers and contain sugars, fibers, organic acids, minerals, amino acids, fatty acids, and phenolic compounds such as phenolic acids and flavonoids [2,32]. However, the presence of anthocyanins is basically limited to the cultivars with purple skin, such as the anthocyanins petunidin (cv. Winter Nelis) and cyanidin (cv. Beurre Bosc) [33]. In this sense, enriching pear slices with blueberry juice can improve phenolic compounds' content, especially the anthocyanins, and provide food with increased functional potential. The VI technique proves to be an excellent tool for incorporating constituents such as phenolic compounds into porous foods, such as pears. Due to the pressure changes that occur during VI, the pores present in the food matrix are filled with the impregnation solution, thus ensuring the incorporation of constituents into this matrix [9,12,34]. The assistance of VI with emerging technologies such as OH, ultrasound, and pulsed electric field [35,36,37] can improve the enrichment of the food matrix and the mass transfer. In the case of the association of VI with OH, the incorporation of compounds can be accelerated due to the electroporation effect caused by OH, which can facilitate the entry process of the impregnation solution into the pores of the food matrix [8,12].
In Figure 1, it is possible to verify that the VI-OH treatment indeed increased the phenolic compounds' content on the impregnated pear slices. For all temperatures studied, the values of TPC and TFC (Figure 1a and 1b, respectively) decreased in the first minutes of VI-OH treatment compared to the non-treated pear. It was associated with the effects of the VI treatment on the pear matrix which may have caused, for example, the initial departure of constituents from the matrix into the impregnation solution to establish a balance in the medium. However, with time increasing of OH, the values of TPC and TFC increased up to around 90 min, in which they maintained some degree of stability up to 180 min, for all temperatures studied. Furthermore, the impregnation was more efficient as the temperatures of OH increased, in which the highest values of TPC and TFC were obtained at 50 °C per 90 min (398.03 mg GAE/100 g dm and 182.62 mg CE/100 g dm, respectively).
As the non-treated pear did not contain anthocyanins, the VI treatment itself could somewhat promote the impregnation of color compounds in the pear slices, which was intensified with the subsequent application of the OH (Table 1 and Figure S1). As shown in Figure 1c, the anthocyanin impregnation was higher as the temperature of OH increased, as well as with the increase in the time of OH up to around 90 min, in which showed relative stability up to 180 min, although the highest value of TMA was observed in this time at 50 °C (3258.69 µg C3G/100 g dm). Despite this, it is essential to highlight that, based on our data, longer times of OH would not promote intense increases in the valued of TMA, once the plateau was reached. At the same time, higher temperatures of OH would possibly favor the degradation of anthocyanins and not promoting an intense increase in the impregnation process, as discussed in the OH treatment of blueberry juice. Therefore, the association of OH with the VI proved essential to ensure an adequate enrichment of pear slices with bioactive compounds, especially anthocyanins.
The enrichment of pear slices with bioactive compounds promoted by the VI-OH treatments consequently affected their antioxidant capacity, as shown in Table 2. As verified for TPC and TFC, a decrease in the value for DPPH and FRAP was observed in the first minutes of VI-OH treatment compared to the non-treated pear and linked to the effects of the VI treatment on the pear matrix. However, for all temperatures studied, increasing the time of OH promoted an increase in the value for DPPH and FRAP, especially up to around 90 min, although the highest values were observed at 180 min in many cases. Furthermore, the impregnation of antioxidant compounds showed to be more efficient as the temperatures of OH increased.
The antioxidant capacity of pear slices enriched by VI-OH treatment seems strongly associated with the content of bioactive compounds impregnated in the different conditions studied. Our findings suggest that non-anthocyanidin antioxidant compounds, such as phenolic acids and non-anthocyanin flavonoids, are the compounds primarily responsible for the antioxidant capacity of the impregnated pears, with an increasing contribution of anthocyanins to this activity as temperature and time of OH increase. This fact leads, in general, to higher values of antioxidant capacity being observed after 90 min of VI-OH treatment, especially at 180 min, where the highest TMA values were observed for the temperature conditions of 40 and 50 °C.
Therefore, the association of OH with VI improved the bioactive compound content of pear slices. Considering the data obtained, the VI-OH treatment selected to obtain pear slices enriched with blueberry juice was set at 50 °C for 90 min in which high values of TPC, TFC, TMA, and antioxidant capacity were obtained.
3.3. Drying processes of pear slices with blueberry juice
The availability of fresh fruits is commonly limited by the seasonality of production, short shelf life, and the accessibility and cost of the product in the market. Thus, processed products present great convenience to the consumer because the product will constantly be available and are generally suitable for immediate consumption [3,7,8,9]. Technological processes such as convection drying, freeze-drying, and osmotic dehydration can be applied to products from fruits for improvement of their conservation, as they promote the reduction of water content, the concentration of solutes, especially when applied heat encourage the microbial decline [3,7,8,9,10]. This set of factors allows an extension of the processed product shelf life compared to the fresh one, in addition to other advantages such as storage at room temperature and reduction of transport and storage costs, among others. On the other hand, physicochemical, sensorial, nutritional, and functional changes can occur in the processed products, especially considering compounds that are more susceptible to heat, light, pH changes, among other factors that are altered in processed products. One example is the phenolic compounds, especially anthocyanins, which can undergo degradation when applying technological processes [3,7,8,9].
Considering the non-dried pear slices, it was observed that, as expected, the process of impregnating the pear slice with blueberry juice by VI-OH promoted an increase in the values of TPC, TFC, TMA, and antioxidant capacity compared to the non-impregnated pear (Table 3), indicating the enrichment of this product with bioactive compounds. As shown in Table 4, blueberry juice has several phenolic compounds in its composition, therefore being an impregnation solution with a high potential for enrichment of other food matrices. The anthocyanins pelargonin, cyanidin, petunidin 3-glucosidase, and cyanidin 3-glucosidase were quantified in blueberry juice, with concentrations ranging from 62.22 to 3.24 mg/100 mL. In addition to anthocyanins, five non-anthocyanin flavonoids (epigallocatechin, catechin, epicatechin, myricetin, and quercetin) and three phenolic acids (gallic, caffeic, and p-coumaric acids) were also quantified in blueberry juice, in which epigallocatechin and epicatechin stood out with the highest concentrations (125.47 and 30.81 mg/100 mL, respectively).
In general, it is possible to observe an increase in the concentration of phenolic compounds in the pear slice after impregnation with blueberry juice (Table 4) compared to the non-impregnated pear, indicating that this food has indeed enriched with bioactive compounds and in agreement with the findings found in Table 3. Incorporating anthocyanins into the pear slice was visibly verified (Figure S1), promoting changes in the color parameters (Table 3). The presence of anthocyanin pigments from blueberry juice in the pear slice promoted an increase in the value of a* (tendency towards red coloration) and a reduction in the values of b* (tendency towards blue color) and L* (tendency towards darkness) compared to the non-impregnated pear. The color changes are due to the retention especially of these pigments from the blueberry juice, into the pores of the pear matrix [8,12]. However, as shown in Table 4, only cyanidin was quantified in the impregnated pear slice. This may be due to a lower stability of the other anthocyanins quantified in the VI-OH process since anthocyanins are more susceptible to degradation [25,26], associated with lower susceptibility to impregnation in the studied matrix. In addition, color compounds from the degradation of anthocyanins and other anthocyanins not quantified in this study may also have contributed to the color and bioactive potential of the impregnated pear slice.
The impregnation process also contributed to the increase in the concentration of epigallocatechin, catechin, and myricetin in the impregnated pear compared to the non-impregnated pear. On the other hand, a decrease in the concentration of gallic acid, caffeic acid, and epicatechin was observed in the impregnated pear compared to the non-impregnated pear (Table 4). These findings indicate the migration of bioactive compounds between blueberry juice and pear in equilibrium processes, contributing to the increase of some compounds and the decrease of others. However, in general, it is possible to consider that the impregnation process promoted an increase in the concentration of bioactive compounds in the pear (sum of quantified phenolic compounds of 243.68 mg/100 g dm for non-impregnated pear and 462.49 mg/100 g dm for impregnated pear), which consequently impacted its bioactive potential.
Therefore, the enrichment of pear pieces with bioactive compounds from blueberry juice by VI-OH makes it possible to offer a fruit-based product with improved bioactive potential compared to the non-impregnated product. However, the water content of impregnated and non-impregnated pear slices (81.0 and 82.0%, respectively) is an important limiting factor for the shelf life of these products. Thus, applying the technological processes of freeze-drying and convection drying promotes a reduction in the water content and consequently increases the product's shelf life [3,7]. The drying of the samples took place until reaching 18% moisture. Although the extension of the shelf life of the products is assured in this condition, the applied drying processes promoted intense alteration on the bioactive and color characteristics for both non-impregnated and impregnated pear slices.
Considering the dried pear slices, it is possible to observe that all dying conditions promoted an intense decrease of TPC, TFC, TMA, and antioxidant capacity compared to non-dried pear slices (Table 3). This same behavior was observed for phenolic compounds, except for quercetin, in which significant decreases were observed for the dried pears compared to the non-dried pears, reaching reductions of up to 4.8 and 7.1-fold in the sum of quantified phenolic compounds for non-impregnated and impregnated pears, respectively (Table 4). Phenolic compounds comprise a diverse range of compounds with different chemical structures and can be degraded to varying levels by factors such as light, oxygen, oxidizing compounds, metals, temperature, pH, and enzymes, to mention a few [38,39,40,41]. Therefore, the drying processes involve a set of factors with a high potential for phenolic compounds degradation, such as light, heat, oxygen, exposure time, which act together with characteristics of the product, such pH, enzymes, metals, oxidizing compounds, water, among others and can enhance the degree of degradation of phenolic compounds [38,42]. The increase in quercetin concentration can also be considered a result of degradation/hydrolysis processes of phenolic compounds present in impregnated and non-impregnated pears caused by drying. The presence of glycosides of quercetin such as rutin (quercetin 3-O-rutinoside), isoquercitrin (quercetin 3-β-D-glucoside), quercitrin (quercetin 3-rhamnoside), hyperoside (quercetin 3-galactoside), and miquelianin (quercetin 3-O-glucuronide) has already been reported in blueberry and pear fruits, being these compounds susceptible to hydrolysis with the consequent release of the aglycone quercetin [4,6,43,44]. In this sense, our data suggest that the drying processes promoted the degradation at different levels of the individual phenolic compounds present in both impregnated and non-impregnated pear slices, consequently affecting the total content of bioactive compounds and the antioxidant potential of dried pears compared to the non-dried pears. Besides that, it is possible to observe different levels of influence for each drying condition on phenolic compounds, antioxidant capacity, and color parameters.
As shown in Table 3, among the drying conditions for the non-impregnated pear slices, more intense decreases were observed in the values of TPC, TFC, DPPH, and FRAP for air-drying at 40 and 50 °C (up to 9.6, 46.6, 24.8, and 23.5-fold, respectively, compared to non-dried pear) and freeze-drying (26.4, 70.0, 27.3, and 24.9-fold, respectively, opposed to non-dried pear) compared to the air-drying at 60 °C (4.4, 12.6, 6.6, and 6.0-fold, respectively, in contrast to non-dried pear). Considering the drying conditions for the impregnated pear slices, the same behavior was observed for TMA, DPPH, and FRAP values , in which more intense decreases were observed for air-drying at 40 and 50 °C (up to 5.3, 8.4, and 7.7-fold, respectively, compared to non-dried pear) and freeze-drying (4.2, 7.6, and 7.0-fold, respectively, opposed to non-dried pear) compared to the air-drying at 60 °C (3.3, 4.7, and 4.3-fold, respectively, in contrast non-dried pear). For TPC, the highest decrease was verified for freeze-drying (6.3-fold compared to non-dried pear) while the lowest decrease was obtained for air-drying at 50 °C (2.5-fold in contrast to non-dried pear). On the other hand, freeze-drying promoted the lowest TFC value (6.6-fold opposed to non-dried pear), while the highest decrease was observed for air-drying at 40 and 50 °C (up to 9.9-fold in relation to non-dried pear).
Considering the individual phenolic compounds, it is possible to observe that the drying conditions affected each analyte differently (Table 4). Although there was no significant difference between the drying conditions studied, a trend toward lower degradation of cyanidin after freeze-drying and higher degradation after air-drying at 60 °C was observed. For myricetin and gallic acid, it is also possible to observe a trend of higher degradation of these phenolic compounds as the temperature of the air-drying increases. Also, the values found for air-drying conditions were significantly lower than those seen after freeze-drying for myricetin (up to 1.4-fold for impregnated pear), while they were generally statistically equal to those found after freeze-drying for gallic acid.
In contrast to these findings, a trend of increasing concentration with increasing air-drying temperature was observed for epigallocatechin, epicatechin, and caffeic acid. The values found for air-drying conditions were significantly higher than those seen after freeze-drying for epigallocatechin (up to 3.6 and 2.9-fold for non-impregnated and impregnated pears, respectively), At the same time, they were considerably lower than those found after freeze-drying for epicatechin (up to 1.4 and 1.7-fold for non-impregnated and impregnated pears, respectively). For caffeic acid, the values found for air-drying conditions were statistically equal to those verified after freeze-drying. It was also observed a significantly higher concentration of catechin after air-drying at 60 °C compared to the other drying conditions (up to 1.3 and 1.4-fold for non-impregnated and impregnated pears, respectively), as well as similar concentrations to each other for the other drying conditions. A significant increase in quercetin concentration was observed with increasing air-drying temperature. Also, the values found for freeze-drying were significantly lower than those found for air-drying conditions at 50 and 60 °C (up to 1.6 and 1.4-fold for non-impregnated and impregnated pears, respectively).
Based on these data, it is possible to suggest that changes in the concentration of the investigated phenolic compounds are probably linked to processes of degradation and/or hydrolysis of phenolic compounds stimulated during drying processes. The extrinsic factors involved in the drying conditions (such as light, oxygen, and heat) and intrinsic factors associated with the food product (such as enzymes, water, sugars, and pH) can stimulate the degradation of phenolic compounds [40,45], leading to the decrease observed in the concentration of cyanidin, gallic acid, and myricetin. At the same time, the increase of quercetin concentration may be associated with the hydrolysis of quercetin glycosides, as well as the increase of epigallocatechin, catechin, and epicatechin concentration may be associated with hydrolysis of condensed tannins (proanthocyanidins), thus releasing the quercetin, epigallocatechin, catechin, and epicatechin aglycones [46,47]. The release of phenolic compounds with a more straightforward can be interesting from a biological point of view since gastrointestinal absorption is favored for phenolic compounds with low molecular weight. Therefore, phenolic compounds with a complex structure (such as anthocyanins, non-anthocyanin flavonoids, and tannins) have low bioavailability compared to phenolic compounds with a simple structure (such as phenolic acids and aglycones of non-anthocyanin flavonoids and anthocyanins) [48,49,50]. However, they may also be more susceptible to degradation during product storage as well as during gastrointestinal digestion [40,50]. Therefore, the applied drying processes will provide products with different degrees of phenolic composition and antioxidant potential, in which the air-drying at 60 °C seems to provide a product with high levels of phenolic compounds and antioxidant potential for both impregnated and non-impregnated pear slices.
The applied drying processes also promoted changes in the physical and color characteristics of the samples (Table 3 and Figure S1). The pear slices dried with air-drying showed changes in their shape, volume, and texture, as expected when heat is used. Moreover, the influence of air-drying on the color of the samples was observed especially for the non-impregnated pear where a certain degree of browning seems to have occurred probably due to non-enzymatic browning reactions [3,7,24]. For these samples, a decrease in luminosity (L*) and a tendency towards red and yellow coloration (increase in the values of a* and b*) was verified compared the non-dried sample. For the impregnated and dried samples, they maintained color parameters very close to those observed for the impregnated and non-dried samples. The freeze-dried pear slices showed a porous texture, and their shape and volume were preserved but with reduced weight, characteristics expected for this technological process [3,14]. For the non-impregnated sample, a decrease in luminosity (L*) and a tendency towards red and yellow coloration (increase in the values of a* and b*) was observed in contrast to the non-dried sample. However, there was an increase in the parameters L*, a*, and b* for the impregnated sample compared to the values found for the non-dried sample, which suggests a possible loss of color compounds to some degree.
4. Conclusion
In this study was possible to confirm that OH contributes to the increase in the content of bioactive compounds and antioxidant potential of blueberry juice, making this product an important source of bioactive compounds for the enrichment of vegetable matrices, such as pears. The OH at 50 °C for 20 min and electrical field strength of 13 V/cm was chosen as the best treatment for blueberry juice. Furthermore, the VI associated with the OH ensured the enrichment of pear pieces with bioactive compounds from blueberry juice, increasing the concentration of bioactive compounds in the pear, such as cyanidin, epigallocatechin, and catechin, which consequently impact on pear’s bioactive potential and color parameters. The VI-OH at 50 °C for 90 min and electrical field strength of 7.8 V/cm was selected as the best treatment for impregnation of pear slices with blueberry juice. However, when freeze-drying and air-drying processes were applied, the content of phenolic compounds and the antioxidant capacity decreased for both impregnated and non-impregnated pears, in addition to impacting the color parameters. Among the drying processes, the air-drying at 60 °C seems to provide a product with high levels of phenolic compounds and antioxidant potential.
Supplementary Materials
The following supporting information can be downloaded at the website of this paper posted on Preprints.org, Figure S1: Pear slices after (a) vacuum impregnation (VI) with blueberry juice at 50 mbar for 5 min; (b) VI followed by ohmic heating (OH) at 50 °C for 90 min; (c) VI-OH followed by air-drying at 40 °C; (d) VI-OH followed by air-drying at 50 °C; (e) VI-OH followed by air-drying at 60 °C; (f) VI-OH followed by freeze-drying; (g) air-drying at 40 °C; (h) air-drying at 50 °C; (i) air-drying at 60 °C; (j) freeze-drying.
Author Contributions
Conceptualization, Siluana Seraglio and Jorge Moreno; Data curation, Siluana Seraglio, Maria Guerra-Valle and Constanza Pavez-Guajardo; Formal analysis, Siluana Seraglio and Constanza Pavez-Guajardo; Funding acquisition, Jorge Moreno; Investigation, Siluana Seraglio, Belkis Hernández-Velásquez, Moira Osses-Millar, Bárbara Malverde-Muñoz, Maria Guerra-Valle and Constanza Pavez-Guajardo; Methodology, Siluana Seraglio, Belkis Hernández-Velásquez, Moira Osses-Millar, Bárbara Malverde-Muñoz, Maria Guerra-Valle and Constanza Pavez-Guajardo; Project administration, Jorge Moreno; Resources, Jorge Moreno; Software, Siluana Seraglio, Belkis Hernández-Velásquez, Moira Osses-Millar, Bárbara Malverde-Muñoz, Maria Guerra-Valle and Constanza Pavez-Guajardo; Supervision, Jorge Moreno; Validation, Siluana Seraglio, Constanza Pavez-Guajardo and Jorge Moreno; Visualization, Siluana Seraglio and Constanza Pavez-Guajardo; Writing – original draft, Siluana Seraglio, Belkis Hernández-Velásquez, Moira Osses-Millar and Bárbara Malverde-Muñoz; Writing – review & editing, Siluana Seraglio, Maria Guerra-Valle, Constanza Pavez-Guajardo and Jorge Moreno.
Funding
This research was funded by Fondecyt Regular en Investigación 2018-2021 (Folio 1181270) through the financial support of ANID-Chile (Agencia Nacional de Investigación y Desarrollo de Chile).
Institutional Review Board Statement
Not applicable.
Informed Consent Statement
Not applicable.
Data Availability Statement
Not applicable.
Acknowledgments
Not applicable.
Conflicts of Interest
The authors declare no conflict of interest.
References
- Brahem, M.; Renard, C.M.G.C.; Eder, S.; Loonis, M.; Ouni, R.; Mars, M.; Le Bourvellec, C. Characterization and quantification of fruit phenolic compounds of European and Tunisian pear cultivars. Food Res Int 2017, 95, 125–133. [Google Scholar] [CrossRef] [PubMed]
- Li, X.; Li, X.; Wang, T.; Gao, W. Nutritional composition of pear cultivars (Pyrus Spp.). In Nutritional Composition of Fruit Cultivars; Elsevier, 2016; pp. 573–608.
- Muñoz-Fariña, O.; López-Casanova, V.; García-Figueroa, O.; Roman-Benn, A.; Ah-Hen, K.; Bastias-Montes, J.M.; Quevedo-León, R.; Ravanal-Espinosa, M.C. Bioaccessibility of phenolic compounds in fresh and dehydrated blueberries (Vaccinium Corymbosum L.). Food Chem Adv 2023, 2, 100171. [Google Scholar] [CrossRef]
- Mustafa, A.M.; Angeloni, S.; Abouelenein, D.; Acquaticci, L.; Xiao, J.; Sagratini, G.; Maggi, F.; Vittori, S.; Caprioli, G. A New HPLC-MS/MS method for the simultaneous determination of 36 polyphenols in blueberry, strawberry and their commercial products and determination of antioxidant activity. Food Chem 2022, 367, 130743. [Google Scholar] [CrossRef] [PubMed]
- Kolniak-Ostek, J.; Kłopotowska, D.; Rutkowski, K.P.; Skorupińska, A.; Kruczyńska, D.E. Bioactive compounds and health-promoting properties of pear (Pyrus Communis L.) fruits. Molecules 2020, 25, 4444. [Google Scholar] [CrossRef] [PubMed]
- Becker Pertuzatti, P.; Teixeira Barcia, M.; Gómez-Alonso, S.; Teixeira Godoy, H.; Hermosin-Gutierrez, I. Phenolics Profiling by HPLC-DAD-ESI-MSn aided by principal component analysis to classify rabbiteye and highbush blueberries. Food Chem 2021, 340, 127958. [Google Scholar] [CrossRef]
- Zia, M.P.; Alibas, I. Influence of the drying methods on color, vitamin C, anthocyanin, phenolic compounds, antioxidant activity, and in vitro bioaccessibility of blueberry fruits. Food Biosci 2021, 42, 101179. [Google Scholar] [CrossRef]
- Pavez-Guajardo, C.; Ferreira, S.R.S.; Mazzutti, S.; Guerra-Valle, M.E.; Sáez-Trautmann, G.; Moreno, J. Influence of in vitro digestion on antioxidant activity of enriched apple snacks with grape juice. Foods 2020, 9, 1681. [Google Scholar] [CrossRef]
- Guerra-Valle, M.E.; Moreno, J.; Lillo-Pérez, S.; Petzold, G.; Simpson, R.; Nuñez, H. Enrichment of apple slices with bioactive compounds from pomegranate cryoconcentrated juice as an osmodehydration agent. J Food Qual 2018, 2018, 1–9. [Google Scholar] [CrossRef]
- Moreno, J.; Gonzales, M.; Zúñiga, P.; Petzold, G.; Mella, K.; Muñoz, O. Ohmic heating and pulsed vacuum effect on dehydration processes and polyphenol component retention of osmodehydrated blueberries (Cv. Tifblue). Innov Food Sci Emerg Technol 2016, 36, 112–119. [Google Scholar] [CrossRef]
- Gupta, S.; Sastry, S.K. Ohmic heating assisted lye peeling of pears. J Food Sci 2018, 83, 1292–1298. [Google Scholar] [CrossRef]
- Moreno, J.; Echeverria, J.; Silva, A.; Escudero, A.; Petzold, G.; Mella, K.; Escudero, C. Apple snack enriched with L-arginine using vacuum impregnation/ohmic heating technology. Food Sci Technol Int 2017, 23, 448–456. [Google Scholar] [CrossRef]
- Akman, P.K.; Uysal, E.; Ozkaya, G.U.; Tornuk, F.; Durak, M.Z. Development of probiotic carrier dried apples for consumption as snack food with the impregnation of Lactobacillus Paracasei. LWT 2019, 103, 60–68. [Google Scholar] [CrossRef]
- Subbiah, V.; Duan, X.; Agar, O.T.; Dunshea, F.R.; Barrow, C.J.; Suleria, H.A.R. Comparative study on the effect of different drying techniques on phenolic compounds in australian beach-cast brown seaweeds. Algal Res 2023, 72, 103140. [Google Scholar] [CrossRef]
- AOAC Official Methods of Analysis; 18th ed.; AOAC International: Gaithersburg, 2010.
- Waterhouse, A.L. Determination of total phenolics. In Current Protocols in Food Analytical Chemistry; John Wiley & Sons, Inc.: Hoboken, NJ, USA, 2003. [Google Scholar]
- Dewanto, V.; Wu, X.; Adom, K.K.; Liu, R.H. Thermal processing enhances the nutritional value of tomatoes by increasing total antioxidant activity. J Agric Food Chem 2002, 50, 3010–3014. [Google Scholar] [CrossRef] [PubMed]
- Lee, J.; Durst, R.W.; Wrolstad, R.E.; Eisele, T.; Giusti, M.M.; Hach, J.; Hofsommer, H.; Koswig, S.; Krueger, D.A.; Kupina; , S. ; et al. Determination of total monomeric anthocyanin pigment content of fruit juices, beverages, natural colorants, and wines by the pH differential method: collaborative study. J AOAC Int 2005, 88, 1269–1278. [Google Scholar] [CrossRef]
- Thaipong, K.; Boonprakob, U.; Crosby, K.; Cisneros-Zevallos, L.; Hawkins Byrne, D. Comparison of ABTS, DPPH, FRAP, and ORAC assays for estimating antioxidant activity from guava fruit extracts. J Food Comp Anal 2006, 19, 669–775. [Google Scholar] [CrossRef]
- Benzie, I.F.F.; Strain, J.J. The ferric reducing ability of plasma (FRAP) as a measure of “antioxidant power”: the FRAP assay. Anal Biochem 1996, 239, 70–76. [Google Scholar] [CrossRef]
- Ruiz, A.; Hermosín-Gutiérrez, I.; Mardones, C.; Vergara, C.; Herlitz, E.; Vega, M.; Dorau, C.; Winterhalter, P.; von Baer, D. Polyphenols and antioxidant activity of calafate (Berberis Microphylla) fruits and other native berries from southern Chile. J Agric Food Chem 2010, 58, 6081–6089. [Google Scholar] [CrossRef]
- Sarkis, J.R.; Jaeschke, D.P.; Tessaro, I.C.; Marczak, L.D.F. Effects of ohmic and conventional heating on anthocyanin degradation during the processing of blueberry pulp. LWT 2013, 51, 79–85. [Google Scholar] [CrossRef]
- Shao, L.; Zhao, Y.; Zou, B.; Li, X.; Dai, R. Ohmic heating in fruit and vegetable processing: quality characteristics, enzyme inactivation, challenges and prospective. Trends Food Sci Technol 2021, 118, 601–616. [Google Scholar] [CrossRef]
- Martín-Gómez, J.; Varo, M.Á.; Mérida, J.; Serratosa, M.P. Influence of drying processes on anthocyanin profiles, total phenolic compounds and antioxidant activities of blueberry (Vaccinium Corymbosum). LWT 2020, 120, 108931. [Google Scholar] [CrossRef]
- Enaru, B.; Drețcanu, G.; Pop, T.D.; Stǎnilǎ, A.; Diaconeasa, Z. Anthocyanins: factors affecting their stability and degradation. Antioxidants 2021, 10, 1967. [Google Scholar] [CrossRef] [PubMed]
- Herrera-Balandrano, D.D.; Chai, Z.; Beta, T.; Feng, J.; Huang, W. Blueberry anthocyanins: an updated review on approaches to enhancing their bioavailability. Trends Food Sci Technol 2021, 118, 808–821. [Google Scholar] [CrossRef]
- Zeb, A. Concept, mechanism, and applications of phenolic antioxidants in foods. J Food Biochem 2020, 44. [Google Scholar] [CrossRef]
- Shahidi, F.; Zhong, Y. Measurement of antioxidant activity. J Funct Foods 2015, 18, 757–781. [Google Scholar] [CrossRef]
- Negri Rodríguez, L.M.; Arias, R.; Soteras, T.; Sancho, A.; Pesquero, N.; Rossetti, L.; Tacca, H.; Aimaretti, N.; Rojas Cervantes, M.L.; Szerman, N. Comparison of the quality attributes of carrot juice pasteurized by ohmic heating and conventional heat treatment. LWT 2021, 145, 111255. [Google Scholar] [CrossRef]
- Debbarma, T.; Thangalakshmi, S.; Tadakod, M.; Singh, R.; Singh, A. Comparative analysis of ohmic and conventional heat-treated carrot juice. J Food Process Preserv 2021, 45. [Google Scholar] [CrossRef]
- Darvishi, H.; Salami, P.; Fadavi, A.; Saba, M.K. Processing kinetics, quality and thermodynamic evaluation of mulberry juice concentration process using ohmic heating. Food Bioprod Process 2020, 123, 102–110. [Google Scholar] [CrossRef]
- Li, X.; Zhang, J.-Y.; Gao, W.-Y.; Wang, Y.; Wang, H.-Y.; Cao, J.-G.; Huang, L.-Q. Chemical composition and anti-inflammatory and antioxidant activities of eight pear cultivars. J Agric Food Chem 2012, 60, 8738–8744. [Google Scholar] [CrossRef]
- Wang, Z.; Barrow, C.J.; Dunshea, F.R.; Suleria, H.A.R. A Comparative investigation on phenolic composition, characterization and antioxidant potentials of five different Australian grown pear varieties. Antioxidants 2021, 10, 151. [Google Scholar] [CrossRef]
- Abalos, R.A.; Naef, E.F.; Aviles, M.V.; Gómez, M.B. Vacuum impregnation: a methodology for the preparation of a ready-to-eat sweet potato enriched in polyphenols. LWT 2020, 131, 109773. [Google Scholar] [CrossRef]
- Tylewicz, U.; Tappi, S.; Mannozzi, C.; Romani, S.; Dellarosa, N.; Laghi, L.; Ragni, L.; Rocculi, P.; Dalla Rosa, M. Effect of pulsed electric field (PEF) pre-treatment coupled with osmotic dehydration on physico-chemical characteristics of organic strawberries. J Food Eng 2017, 213, 2–9. [Google Scholar] [CrossRef]
- Moreno, J.; Zúñiga, P.; Dorvil, F.; Petzold, G.; Mella, K.; Bugueño, G. Osmodehydration assisted by ohmic heating/pulse vacuum in apples (cv. fuji): retention of polyphenols during refrigerated storage. Int J Food Sci Technol 2017, 52, 1203–1210. [Google Scholar] [CrossRef]
- Yılmaz, F.M.; Ersus Bilek, S. Ultrasound-assisted vacuum impregnation on the fortification of fresh-cut apple with calcium and black carrot phenolics. Ultrason Sonochem 2018, 48, 509–516. [Google Scholar] [CrossRef] [PubMed]
- Albuquerque, B.R.; Heleno, S.A.; Oliveira, M.B.P.P.; Barros, L.; Ferreira, I.C.F.R. Phenolic compounds: current industrial applications, limitations and future challenges. Food Funct 2021, 12, 14–29. [Google Scholar] [CrossRef] [PubMed]
- Giada, M. de L.R. Food Phenolic compounds: main classes, sources and their antioxidant power. In Oxidative Stress and Chronic Degenerative Diseases - A Role for Antioxidants; InTech, 2013; pp. 87–112.
- Alara, O.R.; Abdurahman, N.H.; Ukaegbu, C.I. Extraction of phenolic compounds: a review. Curr Res Food Sci 2021, 4, 200–214. [Google Scholar] [CrossRef]
- Vuolo, M.M.; Lima, V.S.; Maróstica Junior, M.R. Phenolic compounds. In Bioactive Compounds; Elsevier, 2019; pp. 33–50 ISBN 9780128147757.
- de la Rosa, L.A.; Moreno-Escamilla, J.O.; Rodrigo-García, J.; Alvarez-Parrilla, E. Phenolic compounds. In Postharvest Physiology and Biochemistry of Fruits and Vegetables; Elsevier, 2019; pp. 253–271 ISBN 9780128132784.
- Öztürk, A.; Demirsoy, L.; Demirsoy, H.; Asan, A.; Gül, O. Phenolic compounds and chemical characteristics of pears (Pyrus Communis L.). Int J Food Prop 2015, 18, 536–546. [Google Scholar] [CrossRef]
- Liaudanskas, M.; Zymonė, K.; Viškelis, J.; Klevinskas, A.; Janulis, V. Determination of the phenolic composition and antioxidant activity of pear extracts. J Chem 2017, 2017, 1–9. [Google Scholar] [CrossRef]
- Cao, H.; Saroglu, O.; Karadag, A.; Diaconeasa, Z.; Zoccatelli, G.; Conte-Junior, C.A.; Gonzalez-Aguilar, G.A.; Ou, J.; Bai, W.; Zamarioli, C.M.; et al. Available technologies on improving the stability of polyphenols in food processing. Food Front 2021, 2, 109–139. [Google Scholar] [CrossRef]
- Montes-Ávila, J.; López-Angulo, G.; Delgado-Vargas, F. Tannins in fruits and vegetables: chemistry and biological functions. In Fruit and Vegetable Phytochemicals; John Wiley & Sons, Ltd: Chichester, UK, 2017; pp. 221–268. [Google Scholar]
- Das, A.K.; Islam, Md.N.; Faruk, Md.O.; Ashaduzzaman, Md.; Dungani, R. Review on tannins: extraction processes, applications and possibilities. S Afr J Bot 2020, 135, 58–70. [Google Scholar] [CrossRef]
- García-Villalba, R.; González-Sarrías, A.; Giménez-Bastida, J.A.; Selma, M.V.; Espín, J.C.; Tomás-Barberán, F.A. Metabolism of dietary (poly)phenols by the gut microbiota. In Comprehensive Gut Microbiota; Elsevier, 2022; pp. 149–175.
- Chen, Z.; Zheng, S.; Li, L.; Jiang, H. Metabolism of flavonoids in human: a comprehensive review. Curr Drug Metab 2014, 15, 48–61. [Google Scholar] [CrossRef] [PubMed]
- Cosme, P.; Rodríguez, A.B.; Espino, J.; Garrido, M. Plant phenolics: bioavailability as a key determinant of their potential health-promoting applications. Antioxidants 2020, 9, 1263. [Google Scholar] [CrossRef] [PubMed]
Figure 1.
Vacuum impregnation assisted by ohmic heating kinetics of pear slices enriched with blueberry juice throughout 180 min at 30, 40, and 50 °C on (a) total phenolic content (TPC); (b) total flavonoid content (TFC); and (c) total monomeric anthocyanins (TMA). GAE – gallic acid equivalent. CE – catechin equivalent. C3G – cyanidin 3-glucoside equivalent. dm – dry matter. Results are presented as mean ± standard deviation.
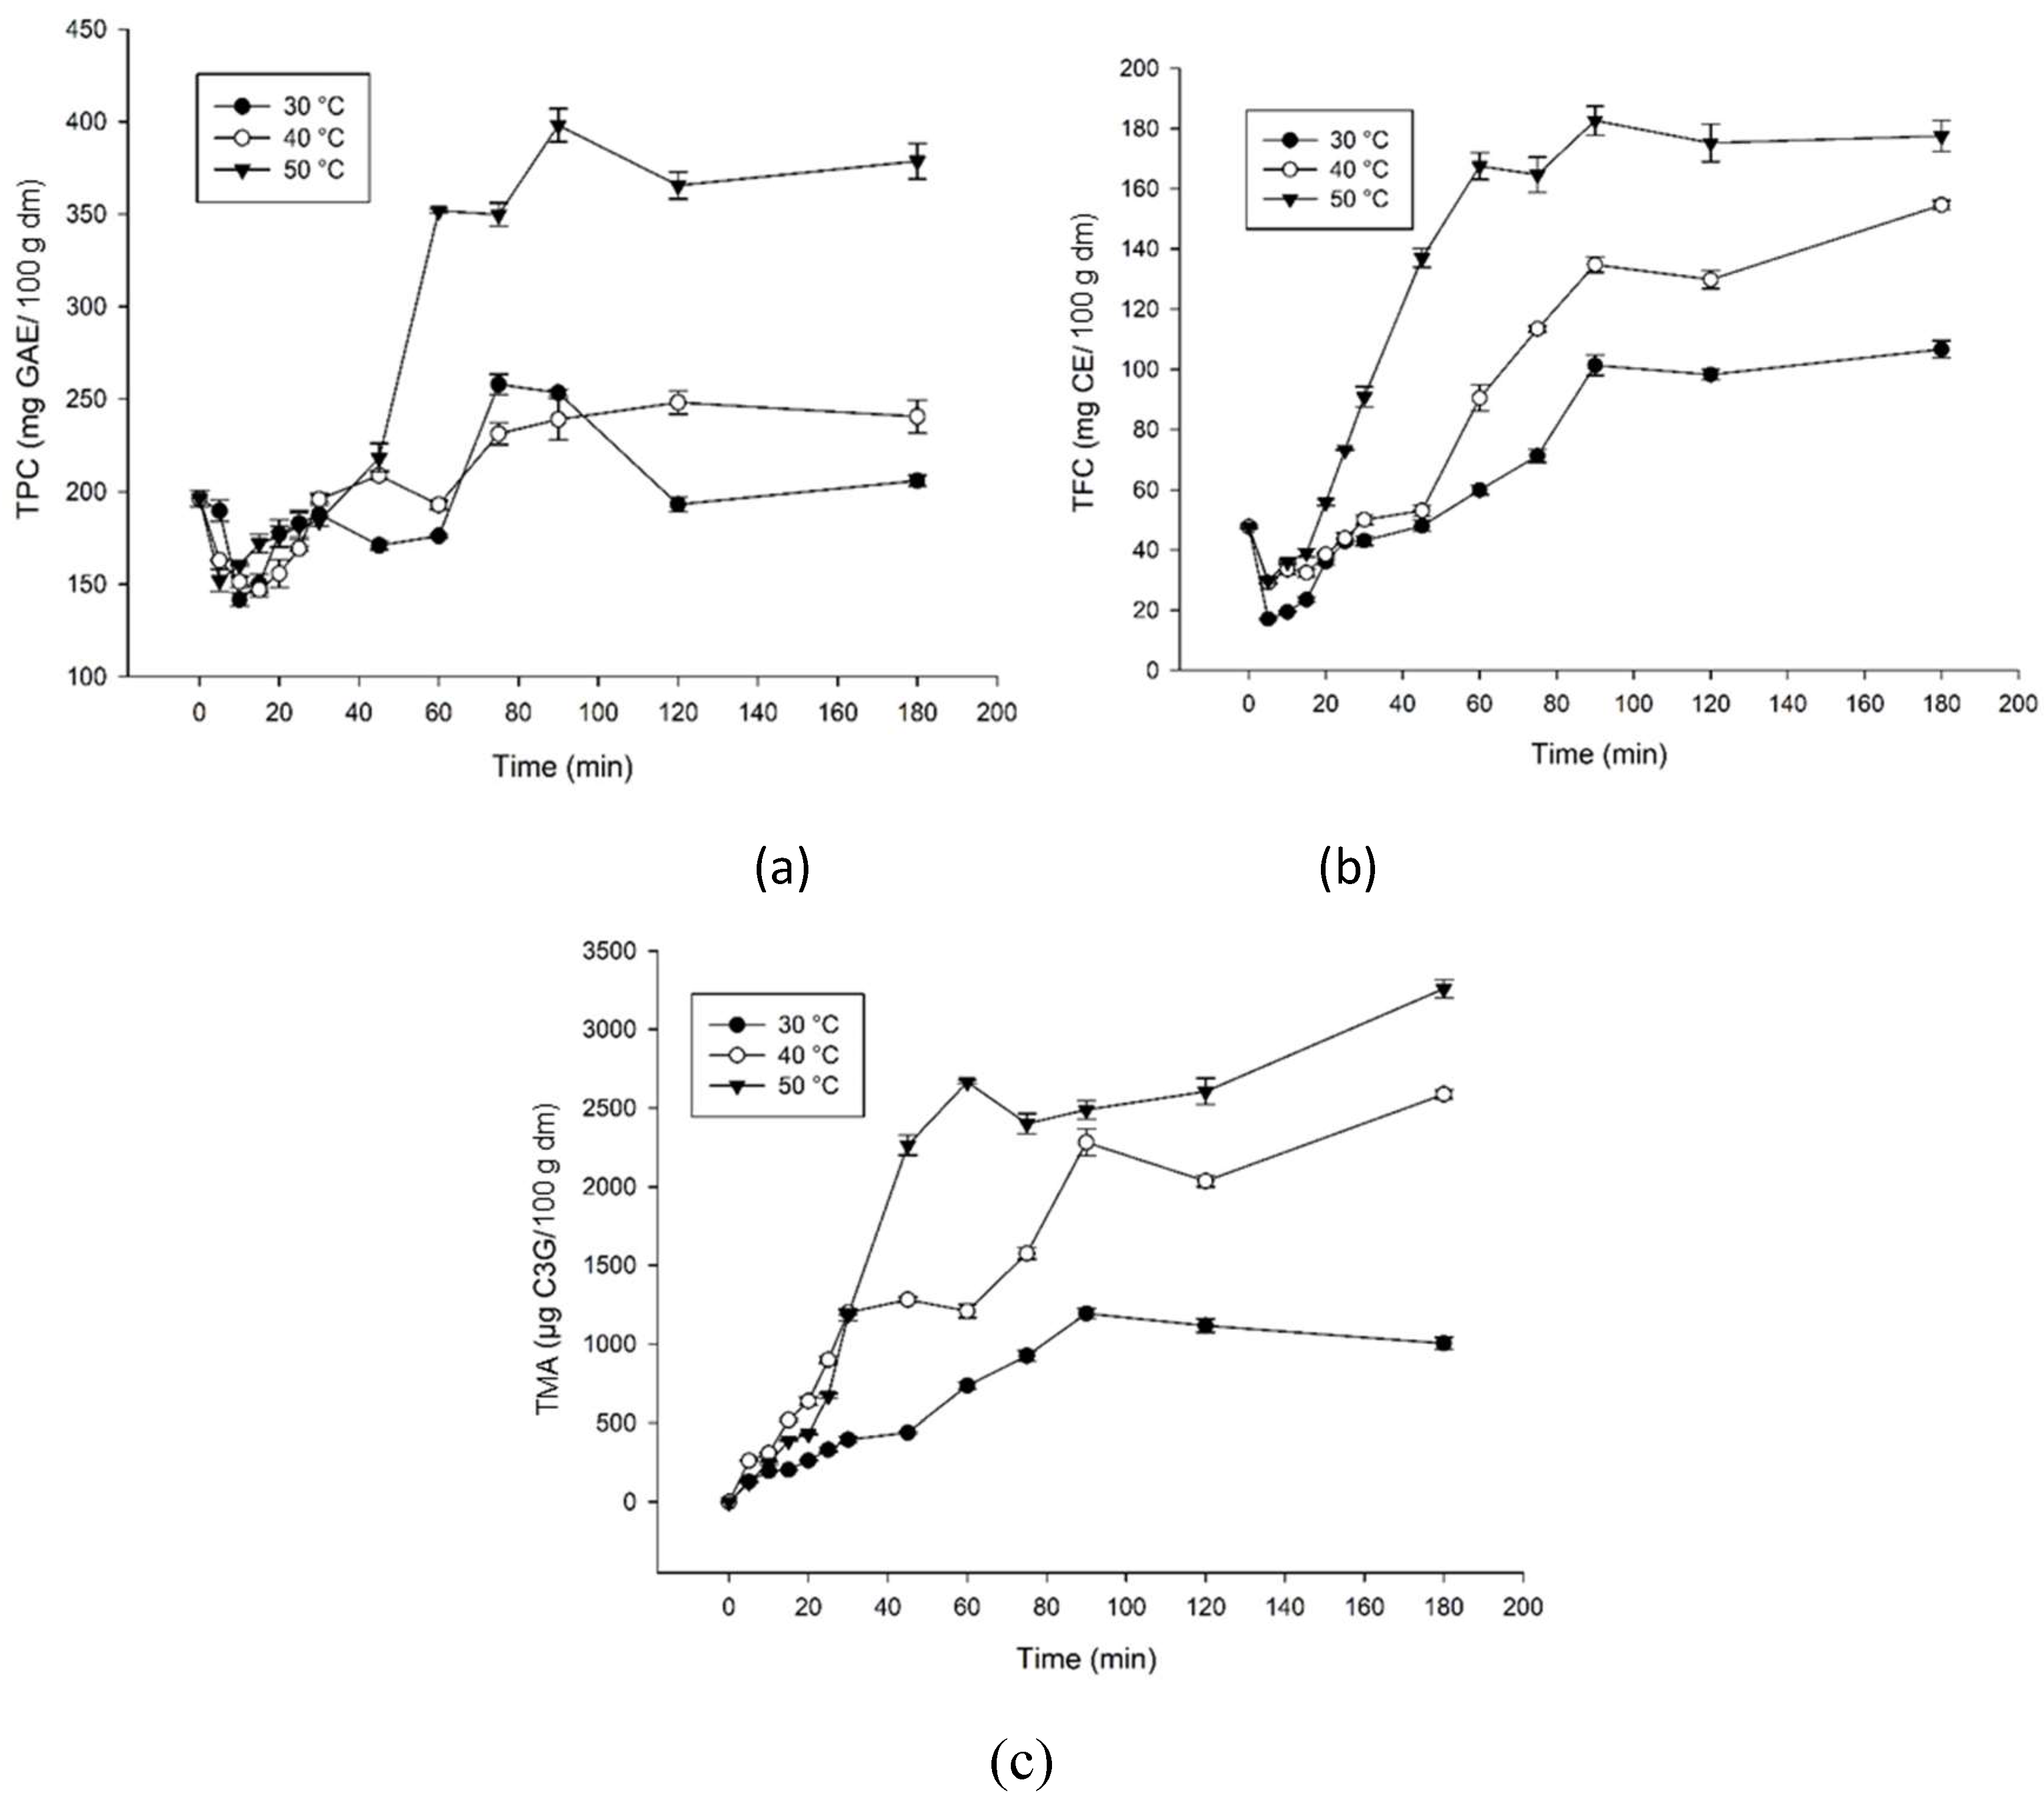

Table 1.
Total bioactive compounds and antioxidant capacity of blueberry juice treated by ohmic heating throughout 20 min at 30, 40, and 50 °C.
Table 1.
Total bioactive compounds and antioxidant capacity of blueberry juice treated by ohmic heating throughout 20 min at 30, 40, and 50 °C.
| Temperature (°C) | Time (min) | TPC (mg GAE/100 mL) |
TFC (mg CE/100 mL) |
TMA (µg C3G/100 mL) |
Antioxidant capacity | |
|---|---|---|---|---|---|---|
| DPPH (µmol TE/100 mL) |
FRAP (µmol TE/100 mL) |
|||||
| Non-treated juice | 152.00 ± 3.14 a | 90.93 ± 0.50 a | 354.03 ± 9.23 a | 327.94 ± 5.54 a | 403.84 ± 0.84 a | |
| 30 | 5 | 156.54 ± 3.27 ab | 97.45 ± 1.09 b | 473.15 ± 9.64 b | 343.77 ± 5.02 b | 403.24 ± 2.80 a |
| 10 | 161.69 ± 4.48 b | 96.98 ± 3.76 b | 642.35 ± 11.23 d | 371.00 ± 7.94 c | 409.77 ± 1.66 ab | |
| 15 | 174.12 ± 2.28 cd | 124.49 ± 0.41 e | 1074.72 ± 19.42 hi | 419.88 ± 3.15 e | 428.97 ± 7.40 c | |
| 20 | 188.97 ± 6.44 f | 134.46 ± 1.64 g | 1219.04 ± 23.26 j | 430.16 ± 2.35 e | 464.97 ± 7.52 e | |
| 40 | 5 | 175.93 ± 2.28 cd | 110.02 ± 1.64 c | 512.53 ± 19.26 c | 335.16 ± 9.46 ab | 425.04 ± 7.07 bc |
| 10 | 178.36 ± 1.28 de | 118.09 ± 2.49 d | 826.34 ± 11.53 e | 365.44 ± 7.51 c | 430.84 ± 8.00 c | |
| 15 | 179.27 ± 2.57 de | 122.83 ± 2.05 e | 1024.12 ± 34.24 g | 366.27 ± 5.91 c | 438.17 ± 9.38 cd | |
| 20 | 182.30 ± 2.28 e | 136.59 ± 1.48 gh | 1085.53 ± 16.13 i | 382.11 ± 9.14 d | 449.10 ± 9.20 de | |
| 50 | 5 | 170.78 ± 2.09 c | 118.32 ± 3.96 d | 442.53 ± 11.53 b | 330.72 ± 4.73 a | 428.04 ± 15.95 c |
| 10 | 172.90 ± 0.90 cd | 129.71 ± 1.06 f | 969.23 ± 28.24 f | 361.83 ± 9.27 c | 448.44 ± 19.06 de | |
| 15 | 195.03 ± 6.05 g | 148.57 ± 0.50 i | 1040.42 ± 19.53 gh | 392.38 ± 4.88 d | 519.10 ± 12.23 f | |
| 20 | 201.09 ± 1.57 h | 139.43 ± 1.48 h | 1035.14 ± 16.35 g | 427.11 ± 2.09 e | 562.24 ± 3.67 g | |
Results are presented as mean ± standard deviation. TPC – total phenolic content. TFC – total flavonoid content. TMA – total monomeric anthocyanins. DPPH – 2,2-diphenyl-1-picrylhydrazyl. FRAP – ferric reducing antioxidant power. GAE – gallic acid equivalent. CE – catechin equivalent. C3G – cyanidin 3-glucoside equivalent. TE – Trolox equivalent. a-j Different lowercase letters in the same column indicate statistical difference (p ≤ 0.05) according to the LSD test.
Table 2.
Vacuum impregnation assisted by ohmic heating kinetics of pear slices enriched with blueberry juice throughout 180 min at 30, 40, and 50 °C on the antioxidant capacity (µmol TE/100 g dm).
Table 2.
Vacuum impregnation assisted by ohmic heating kinetics of pear slices enriched with blueberry juice throughout 180 min at 30, 40, and 50 °C on the antioxidant capacity (µmol TE/100 g dm).
| Time (min) |
DPPH | FRAP | ||||
|---|---|---|---|---|---|---|
| 30 °C | 40 °C | 50 °C | 30 °C | 40 °C | 50 °C | |
| Non-treated pear | 630.53 ± 3.62 c,A | 630.93 ± 1.45 d,A | 630.54 ± 1.76 c,A | 619.54 ± 11.53 e,A | 619.73 ± 11.24 f,A | 619.54 ± 11.23 d,A |
| 5 | 534.67 ± 6.54 a,C | 471.35 ± 3.56 a,B | 454.74 ± 9.53 a,A | 402.42 ± 5.35 a,B | 371.43 ± 7.45 a,A | 401.76 ± 5.23 a,B |
| 10 | 521.24 ± 11.25 a,B | 478.74 ± 18.54 ab,A | 476.35 ± 20.64 a,A | 402.73 ± 3.73 a,A | 407.53 ± 3.84 b,A | 443.24 ± 11.23 b,B |
| 15 | 549.42 ± 7.63 a,B | 499.35 ± 10.45 ab,A | 576.19 ± 18.45 b,C | 416.35 ± 16.53 ab,A | 427.54 ± 3.35 bc,A | 535.74 ± 2.34 c,B |
| 20 | 545.56 ± 19.54 a,AB | 515.74 ± 13.45 bc,A | 553.24 ± 15.74 b,B | 432.74 ± 5.63 b,A | 447.45 ± 12.64 c,A | 794.05 ± 11.35 e,B |
| 25 | 584.86 ± 22.74 b,B | 548.73 ± 6.63 c,A | 624.74 ± 20.02 c,C | 435.63 ± 10.63 bc,A | 488.24 ± 11.35 d,B | 833.34 ± 5.36 f,C |
| 30 | 617.92 ± 21.34 bc,A | 656.43 ± 19.45 d,A | 730.93 ± 21.03 d,B | 456.23 ± 11.73 c,A | 561.63 ± 17.36 e,B | 994.56 ± 10.64 g,C |
| 45 | 644.23 ± 26.75 c,A | 718.03 ± 4.73 e,B | 987.93 ± 12.64 e,C | 499.92 ± 7.34 d,A | 702.02 ± 27.74 h,B | 1111.82 ± 35.54 h,C |
| 60 | 638.73 ± 29.42 c,A | 750.82 ± 25.34 e,B | 974.55 ± 7.95 e,C | 615.03 ± 11.03 e,A | 663.06 ± 9.34 g,A | 1377.45 ± 30.63 k,B |
| 75 | 746.35 ± 11.02 d,A | 903.35 ± 18.12 f,B | 998.63 ± 12.64 e,C | 781.53 ± 19.85 h,B | 702.34 ± 24.53 h,A | 1222.34 ± 16.35 i,C |
| 90 | 747.93 ± 3.24 d,A | 952.30 ± 3.63 g,B | 1061.83 ± 6.63 f,C | 741.46 ± 2.39 g,A | 886.66 ± 28.13 j,B | 1278.64 ± 24.35 j,C |
| 120 | 756.82 ± 10.86 d,A | 1046.26 ± 30.2 h,B | 1044.92 ± 22.73 f,B | 672.14 ± 5.98 f,A | 743.25 ± 6.84 i,B | 1204.35 ± 5.63 i,C |
| 180 | 755.64 ± 36.92 d,A | 1197.11 ± 58.64 i,B | 1109.44 ± 19.46 g,B | 813.63 ± 26.34 i,A | 1124.45 ± 32.35 k,B | 1278.34 ± 13.36 j,C |
Results are presented as mean ± standard deviation. DPPH – 2,2-diphenyl-1-picrylhydrazyl. FRAP – ferric reducing antioxidant power. TE – Trolox equivalent. dm – dry matter. a-k Different lowercase letters in the same column indicate statistical difference (p ≤ 0.05) according to the LSD test. A-C Different capital letters in the same row for each assay, indicate statistical difference (p ≤ 0.05) according to the LSD test.
Table 3.
Total bioactive compounds, antioxidant capacity, and color parameters of pear slices impregnated and not impregnated with blueberry juice before and after drying processes.
Table 3.
Total bioactive compounds, antioxidant capacity, and color parameters of pear slices impregnated and not impregnated with blueberry juice before and after drying processes.
| Sample | TPC (mg GAE/100 g dm) |
TFC (mg CE/100 g dm) |
TMA (µg C3G/100 g dm) |
Antioxidant capacity | Color parameters | |||
|---|---|---|---|---|---|---|---|---|
| DPPH (µmol TE/100 g dm) |
FRAP (µmol TE/100 g dm) |
L* | a* | b* | ||||
| P | 228.03 ± 5.74 g | 84.76 ± 5.31 e | - | 838.42 ± 8.79 d | 876.34 ± 12.54 d | 76.16 ± 2.75 e | -3.36 ± 0.10 a | 17.86 ± 0.56 d |
| P40 | 24.16 ± 1.25 abc | 3.42 ± 0.30 ab | - | 35.27 ± 1.24 a | 38.24 ± 1.12 a | 48.23 ± 1.51 c | 13.17 ± 0.40 e | 32.86 ± 1.43 fg |
| P50 | 23.82 ± 4.43 ab | 1.82 ± 0.08 a | - | 33.74 ± 1.52 a | 37.25 ± 1.53 a | 46.33 ± 1.93 c | 14.28 ± 0.65 f | 32.58 ± 1.36 f |
| P60 | 52.17 ± 2.45 cd | 6.74 ± 0.34 b | - | 127.36 ± 3.35 b | 145.25 ± 5.36 b | 38.33 ± 1.98 b | 13.59 ± 0.78 ef | 26.33 ± 1.44 e |
| PF | 8.65 ± 0.24 a | 1.21 ± 0.04 a | - | 30.73 ± 1.03 a | 35.23 ± 1.35 a | 70.43 ± 2.66 d | 7.75 ± 0.44 d | 34.40 ± 1.67 g |
| PI | 299.90 ± 7.50 h | 120.26 ± 5.43 f | 6290.02 ± 100.23 d | 1031.85 ± 14.42 e | 1097.43 ± 19.42 e | 20.57 ± 0.83 a | 6.16 ± 0.35 c | 1.43 ± 0.09 ab |
| PI40 | 67.33 ± 3.83 de | 12.73 ± 0.51 c | 1690.27 ± 50.24 bc | 136.73 ± 2.35 b | 153.45 ± 5.24 b | 18.86 ± 0.94 a | 2.08 ± 0.10 b | 1.32 ± 0.09 a |
| PI50 | 118.46 ± 6.83 f | 12.14 ± 0.45 c | 1180.53 ± 30.74 a | 123.27 ± 3.69 b | 142.53 ± 6.34 b | 21.50 ± 0.95 a | 6.24 ± 0.49 c | 3.11 ± 0.21 b |
| PI60 | 95.03 ± 2.75 ef | 15.64 ± 0.93 cd | 1900.62 ± 100.27 c | 218.12 ± 5.47 c | 254.78 ± 5.35 c | 19.26 ± 0.73 a | 1.73 ± 0.15 b | 1.29 ± 0.07 a |
| PIF | 47.64 ± 2.54 bcd | 18.25 ± 1.01 d | 1490.31 ± 110.71 b | 136.03 ± 4.24 b | 155.84 ± 4.24 b | 36.08 ± 2.07 b | 13.44 ± 0.61 e | 12.58 ± 0.83 c |
Results are presented as mean ± standard deviation. TPC – total phenolic content. TFC – total flavonoid content. TMA – total monomeric anthocyanins. DPPH – 2,2-diphenyl-1-picrylhydrazyl. FRAP – ferric reducing antioxidant power. GAE – gallic acid equivalent. CE – catechin equivalent. C3G – cyanidin 3-glucoside equivalent. TE – Trolox equivalent. L* – darkness-lightness. a* – green-red axis. b* – blue-yellow axis. (-) – not applicable. dm – dry matter. a-h Different lowercase letters in the same column indicate statistical difference (p ≤ 0.05) according to the LSD test. P – Pear slice not impregnated with blueberry juice and not dried. P40 – Pear slice not impregnated with blueberry juice and dried by air-drying at 40 °C. P50 – Pear slice not impregnated with blueberry juice and dried by air-drying at 50 °C. P60 – Pear slice not impregnated with blueberry juice and dried by air-drying at 60 °C. PF – Pear slice not impregnated with blueberry juice and dried by freeze-drying. PI – Pear slice impregnated with blueberry juice and not dried. PI40 – Pear slice impregnated with blueberry juice and dried by air-drying at 40 °C. PI50 – Pear slice impregnated with blueberry juice and dried by air-drying at 50 °C. PI60 – Pear slice impregnated with blueberry juice and dried by air-drying at 60 °C. PIF – Pear slice impregnated with blueberry juice and dried by freeze-drying.
Table 4.
Individual phenolic compounds of blueberry juice and pear slices impregnated and not impregnated with blueberry juice before and after the drying processes.
Table 4.
Individual phenolic compounds of blueberry juice and pear slices impregnated and not impregnated with blueberry juice before and after the drying processes.
| Phenolic compound |
Blueberry juice (mg/100 mL) |
Pear slices (mg/100 g dry matter) | |||||||||
|---|---|---|---|---|---|---|---|---|---|---|---|
| P | P40 | P50 | P60 | PF | PI | PI40 | PI50 | PI60 | PIF | ||
| Anthocyanin | |||||||||||
| Pelargonin | 62.22 ± 2.62 | nd | nd | nd | nd | nd | nd | nd | nd | nd | nd |
| Cyanidin 3-glucosidase | 3.24 ± 0.15 | nd | nd | nd | nd | nd | nd | nd | nd | nd | nd |
| Petunidin 3-glucosidase | 6.83 ± 0.31 | nd | nd | nd | nd | nd | nd | nd | nd | nd | nd |
| Cyanidin | 23.55 ± 1.09 | nd | nd | nd | nd | nd | 20.18 ± 0.90 b | 0.76 ± 0.05 a | 0.69 ± 0.03 a | 0.56 ± 0.03 a | 0.87 ± 0.04 a |
| Malvidin | nd | nd | nd | nd | nd | nd | nd | nd | nd | nd | nd |
| Non-anthocyanin flavonoid | |||||||||||
| Epigallocatechin | 125.47 ± 5.65 | 169.98 ± 5.90 f | 34.10 ± 1.51 bc | 35.86 ± 1.46 bc | 40.91 ± 1.75 c | 11.33 ± 0.58 a | 347.92 ± 15.95 g | 62.39 ± 2.97 d | 58.32 ± 2.45 d | 80.48 ± 3.69 e | 27.36 ± 1.27 b |
| Catechin | 18.49 ± 1.02 | 35.69 ± 1.60 d | 24.13 ± 1.09 ab | 25.44 ± 0.91 b | 31.01 ± 1.43 c | 23.49 ± 0.89 ab | 68.43 ± 2.82 e | 22.27 ± 0.95 a | 25.38 ± 0.90 b | 31.89 ± 1.60 c | 25.12 ± 1.08 b |
| Epigallocatechingallate | nd | nd | nd | nd | nd | nd | nd | nd | nd | nd | nd |
| Epicatechin | 30.81 ± 1.50 | 27.48 ± 1.41 g | 5.53 ± 0.28 c | 5.63 ± 0.27 c | 6.61 ± 0.30 d | 7.75 ± 0.29 e | 9.51 ± 0.47 f | 2.58 ± 0.12 a | 2.64 ± 0.11 ab | 3.05 ± 0.14 ab | 4.51 ± 0.17 c |
| Myricetin | 8.84 ± 0.45 | nd | nd | nd | nd | nd | 9.98 ± 0.39 c | 2.14 ± 0.09 a | 2.00 ± 0.10 a | 1.91 ± 0.08 a | 2.62 ± 0.10 b |
| Quercetin | 2.28 ± 0.10 | nd | 0.36 ± 0.02 a | 0.48 ± 0.02 b | 0.55 ± 0.03 c | 0.35 ± 0.02 a | nd | 0.66 ± 0.03 d | 0.75 ± 0.03 e | 0.96 ± 0.05 f | 0.67 ± 0.03 d |
| Phenolic acid | |||||||||||
| Gallic acid | 3.31 ± 0.14 | 8.08 ± 0.30 g | 7.70 ± 0.25 f | 7.24 ± 0.22 e | 6.69 ± 0.27 d | 7.01 ± 0.22 de | 4.73 ± 0.16 c | 4.36 ± 0.15 b | 4.18 ± 0.16 b | 3.80 ± 0.14 a | 4.01 ± 0.15 ab |
| Caffeic acid | 5.17 ± 0.24 | 2.44 ± 0.11 e | 0.85 ± 0.03 c | 0.87 ± 0.04 c | 0.93 ± 0.04 c | 0.90 ± 0.04 c | 1.75 ± 0.07 d | 0.53 ± 0.02 a | 0.59 ± 0.03 ab | 0.62 ± 0.03 b | 0.59 ± 0.03 ab |
| p-Coumaric acid | 3.04 ± 0.14 | nd | nd | nd | nd | nd | nd | nd | nd | nd | nd |
| Sum | 293.25 ± 7.45 | 243.68 ± 4.88 | 72.68 ± 2.50 | 75.52 ± 2.73 | 86.69 ± 2.97 | 50.83 ± 1.88 | 462.49 ± 18.53 | 95.70 ± 3.97 | 94.56 ± 3.37 | 123.27 ± 4.69 | 65.74 ± 2.56 |
Results are presented as mean ± standard deviation. nd – not detected. a-g Different lowercase letters in the same row, for pear slices, indicate statistical difference (p ≤ 0.05) according to the LSD test. P – Pear slice not impregnated with blueberry juice and not dried. P40 – Pear slice not impregnated with blueberry juice and dried by air-drying at 40 °C. P50 – Pear slice not impregnated with blueberry juice and dried by air-drying at 50 °C. P60 – Pear slice not impregnated with blueberry juice and dried by air-drying at 60 °C. PF – Pear slice not impregnated with blueberry juice and dried by freeze-drying. PI – Pear slice impregnated with blueberry juice and not dried. PI40 – Pear slice impregnated with blueberry juice and dried by air-drying at 40 °C. PI50 – Pear slice impregnated with blueberry juice and dried by air-drying at 50 °C. PI60 – Pear slice impregnated with blueberry juice and dried by air-drying at 60 °C. PIF – Pear slice impregnated with blueberry juice and dried by freeze-drying.
Disclaimer/Publisher’s Note: The statements, opinions and data contained in all publications are solely those of the individual author(s) and contributor(s) and not of MDPI and/or the editor(s). MDPI and/or the editor(s) disclaim responsibility for any injury to people or property resulting from any ideas, methods, instructions or products referred to in the content. |
© 2023 by the authors. Licensee MDPI, Basel, Switzerland. This article is an open access article distributed under the terms and conditions of the Creative Commons Attribution (CC BY) license (http://creativecommons.org/licenses/by/4.0/).
Copyright: This open access article is published under a Creative Commons CC BY 4.0 license, which permit the free download, distribution, and reuse, provided that the author and preprint are cited in any reuse.


