
Submitted:
23 February 2025
Posted:
24 February 2025
You are already at the latest version
Abstract
Crop yield prediction is crucial for enhancing productivity, managing risks, ensuring food security, and improving the overall sustainability of agriculture. This study evaluated the Random Forest (RF) machine learning method for its ability to predict wheat yield responses to climate and soil related factors, with Multiple Linear Regression (MLR) serving as a benchmark. The results revealed that RF outperformed MLR in predicting wheat yield. Mean absolute error (MAE) and root mean squared error (RMSE) were used as evaluation metrics, with RF achieving an MAE of 135.88 and an RMSE of 163.90. In comparison, MLR produced an MAE of 435.74 and an RMSE of 653.39. These findings demonstrate that RF has superior wheat yield forecasting capabilities compared to MLR.
Keywords:
Crop yield prediction
; Sustainability
; Machine learning
; Random Forest
Introduction
Crop yield prediction is essential for enhancing productivity, managing risks, ensuring food security, and improving the overall sustainability of agriculture (Basso et al., 2013). Accurate yield predictions help farmers allocate resources such as water, fertilizers, and labor more efficiently. Predicting crop yields in advance also aids in the planning of marketing and distribution, allowing stakeholders—from farmers to food processors and retailers—to prepare for demand and supply fluctuations, reducing waste and ensuring food availability (Jeong et al., 2016; Aslan et al., 2024). Additionally, weather patterns, pests, and diseases can greatly affect crop yields. By predicting yields, farmers can take proactive measures, such as adjusting planting schedules or implementing pest control strategies. Governments and organizations also rely on crop yield predictions to make informed decisions regarding agricultural policy, subsidies, and crop insurance, ensuring that farmers receive adequate support during poor harvests or unforeseen challenges (Basso et al., 2013).
Crop yield prediction is crucial for food security. As climate change alters growing conditions, crop yield predictions can help farmers adapt by identifying potential changes in optimal planting times or locations (Jhajharia et al., 2023). This information allows for the modification of agricultural practices to maintain high productivity in a changing climate. Yield predictions also support farmers and agribusinesses in making investment decisions, such as whether to plant a particular crop or invest in new technology (Klompenburg et al., 2020; Jhajharia et al., 2023). Furthermore, it aids in assessing the potential profitability of different crops.
Wheat production plays a significant role in Ethiopian agriculture, contributing to both food security and the economy. It is a key staple, particularly in urban areas where it is consumed in the form of bread, pasta, and other processed foods. With urbanization and changing dietary patterns, the demand for wheat has been rising (Hodson et al., 2020). Wheat production in Ethiopia is concentrated in the highland areas, which offer favorable climates with cooler temperatures and fertile soil—essential for wheat farming. However, Ethiopia’s wheat production is vulnerable to the impacts of climate change, such as unpredictable rainfall patterns and rising temperatures. Additionally, pests like wheat rusts and various diseases can severely affect yields if not properly managed (Hodson et al., 2020). Unsustainable farming practices, such as soil erosion and degradation, further threaten wheat yields.
Various process-based and statistical models have been used to predict crop yields. Although process-based models are valuable, their calibration and validation can be challenging under certain conditions (Gonzalez-Sanchez et al., 2014; Matsumura et al., 2015; Dhillon et al., 2023).
Statistical models, while easier to interpret and able to work with smaller datasets, often struggle to capture complex relationships, especially those involving non-linearities, interactions, or high-dimensional data. They also require assumptions about data distribution and the relationship between variables, which may not always hold true in real-world scenarios (Haider et al., 2019). To address these limitations, machine learning approaches offer a promising alternative. Machine learning, a branch of artificial intelligence, has gained importance in crop yield prediction. Machine learning algorithms, such as decision trees, support vector machines, ensemble methods, and neural networks, can handle non-linear relationships and complex interactions between features that traditional statistical models might miss (Gonzalez-Sanchez et al., 2014; Jeong et al., 2016; Jhajharia et al., 2023). When provided with large datasets, machine learning models often outperform traditional statistical models in terms of prediction accuracy. These models can continuously improve as more data is introduced, allowing them to adapt to changing conditions, such as climate change and evolving farming techniques (Jeong et al., 2016).
The present study aims to evaluate the effectiveness of Random Forest (RF) regression in predicting wheat yield based on a time-series dataset of various climate and soil related factors. Additionally, the study seeks to identify and quantify the key factors that significantly affect wheat yield.
Materials and Methods
Dataset
The data used in this analysis were obtained from various sources, covering the period from 1980 to 2018, for model training and testing. Data on wheat yield, area coverage, and fertilizer use (nitrogen and phosphate) were sourced from the FAO database, accessed on December 20, 2024. Climate data were obtained from the National Meteorological Agency of Ethiopia, while CO2 emissions (in kilotons) for the specified period were retrieved from the World Bank database, also accessed in December 2024. These sources were combined to create a dataset containing 1,092 data points for the present analysis. Wheat yield was treated as the target variable, with the other variables used as predictors (Table 1). The analysis incorporated five climatic variables—monthly maximum temperature, monthly minimum temperature, monthly rainfall, monthly relative humidity, and CO2—as well as three soil-related variables: nitrogen and phosphate fertilization uses, and crop harvested area. For the climate variables, data from the growing season (June to November) were considered except for CO2 which is on annual bases. Fertilizer use for each nutrient was adjusted for specific wheat crop land. Additionally, year was included as a predictor to account for temporal variability due to technological advances, such as improvements in genetics and management practices (Jeong et al., 2016).
Data preprocessing
Data preprocessing, along with the subsequent tasks of training and testing the models, was performed using relevant machine learning libraries in Python. Missing values in the dataset were imputed using the mean. The data were then split into training and testing sets, with 80% of the data used for training and the remaining 20% allocated for testing.
Machine learning techniques
Random Forest (RF)
A random forest (RF) regression model was used to predict wheat yield. RF is an ensemble machine learning method that combines multiple decision trees to enhance prediction performance and accuracy. Each tree is trained on a random subset of the data, and predictions are made by aggregating the results from all the trees through averaging. This approach is robust against overfitting (Breiman, 2001). Feature importance and partial dependence plots were created to assess how much the model relies on a particular feature when making predictions. The partial dependence plots illustrate how the model's predictions change with respect to the most important feature, while keeping all other features constant (Breiman, 2002).
Multiple Linear Regression (MLR)
Multiple linear regression (MLR) was used as a benchmark model for predicting wheat yield. MLR is a statistical technique that models the relationship between input features and a continuous target variable by fitting a linear equation to the observed data (Gonzalez-Sanchez et al., 2014). MLR is one of the most commonly used statistical models for predicting crop yield (Gonzalez-Sanchez et al., 2014; Jeong et al., 2016; Klompenburg et al., 2020). The same dataset used for the RF models was employed to construct the MLR model. The details of the dataset and definitions of the variables used in the study are presented in Table 1.
Evaluation metrics
The models made predictions on the test set, and their performance was evaluated using mean absolute error (MAE) and root mean squared error (RMSE). These are common evaluation metrics for crop prediction, with lower values indicating better model performance (Haider et al., 2019). The metrics were calculated as follows:
where,
n is the number of observations
yi is the observed value of the target variable
is the predicted value of the target variable
is an error for each observation
Results and Discussion
The study demonstrates that the Random Forest (RF) model is an effective tool for predicting wheat yield. The RF model outperformed the Multiple Linear Regression (MLR) model in predicting wheat yield. Specifically, the RF model achieved a Mean Absolute Error (MAE) of 135.88 and a Root Mean Square Error (RMSE) of 163.90 when predicting wheat yield over a 39-year period based on test data. In comparison, the MLR model showed poorer performance, with an MAE of 435.74 and an RMSE of 653.39 (Table 2). A comparison of the observed and predicted values shows that the RF model’s predictions fit very well (Table 3 and Figure 1) compared to MLR model’s predictions (Table 4 and Figure 2). Both the RF and MLR models were trained and tested using the same dataset. The superior performance of the RF model has also been reported by other Authors (Jeong et al., 2016; Roell et al., 2020; Jhajharia et al., 2023).
The variable importance measures of the RF model indicated that the most influential feature was the year, followed by nitrogen fertilizer use, wheat crop land, and phosphate fertilizer use. Other climate variables were ranked lower in terms of importance (Figure 3. The partial dependence plot for the year, which isolates the effect of other factors, shows that although wheat yield exhibited an increasing trend from 2000 to 2010, it showed yield plateau after 2010 (Figure 4). This trend aligns with the influence of modern agricultural practices and technological changes on wheat yield over time (Jeong et al., 2016; Roell et al., 2020). Furthermore, CO2 emission, increasing the use of nitrogen fertilizer, expanding wheat crop land, and utilizing phosphate fertilizers are key factors for improving wheat yield. Given that crop land is a limiting resource, advances in crop genetics, modernizing agronomic practices and adopting improved fertilizers would contribute to higher wheat yields and sustainable agricultural practices (Roell et al., 2020; Jhajharia et al., 2023). The current study serves as a preliminary result and suggests the need for further analyses using a larger dataset and additional features that may affect wheat yield.
Conclusions
This study evaluated the effectiveness of the Random Forest (RF) regression model, using Multiple Linear Regression (MLR) as a benchmark, to model the complex yield responses of wheat. The results demonstrated that RF outperformed MLR in predicting wheat yield. Thus, RF regression proves to be an effective tool for predicting wheat yield, provided that a broad range of predictor variables is considered.
Disclosure Statement
No conflict of interest.
About Author
Yared Semahegn Belete (PhD) is a senior plant breeding researcher in the EIAR based at Holetta Research Center. He is also trained in data science.
Funding
This study received no external funding
References
- Aslan, M. F., Sabanci, K., & Aslan, B. (2024). Artificial intelligence techniques in crop yield estimation based on Sentinel-2 data: A comprehensive survey. Sustainability, 16(18), 8277. [CrossRef]
- Basso, B., Cammarano, D., & Carfagna, E. (2013, July). Review of crop yield forecasting methods and early warning systems. In Proceedings of the first meeting of the scientific advisory committee of the global strategy to improve agricultural and rural statistics, FAO Headquarters, Rome, Italy (Vol. 241).
- Breiman, L. (2001). Random forests. Machine learning, 45, 5-32.
- Breiman, L. (2002). Manual on setting up, using, and understanding random forests. Berkeley: Statistics Department University of California Berkeley.
- Dhillon, M. S., Dahms, T., Kuebert-Flock, C., Rummler, T., Arnault, J., Steffan-Dewenter, I., & Ullmann, T. (2023). Integrating random forest and crop modeling improves the crop yield prediction of winter wheat and oil seed rape. Frontiers in Remote Sensing, 3, 1010978. [CrossRef]
- González Sánchez, A., Frausto Solís, J., & Ojeda Bustamante, W. (2014). Predictive ability of machine learning methods for massive crop yield prediction. [CrossRef]
- Haider, S. A., Naqvi, S. R., Akram, T., Umar, G. A., Shahzad, A., Sial, M. R., ... & Kamran, M. (2019). LSTM neural network based forecasting model for wheat production in Pakistan. Agronomy, 9(2), 72. [CrossRef]
- Hodson, D. P., Jaleta, M., Tesfaye, K., Yirga, C., Beyene, H., Kilian, A., ... & Erenstein, O. (2020). Ethiopia’s transforming wheat landscape: tracking variety use through DNA fingerprinting. Scientific reports, 10(1), 18532. [CrossRef]
- Jeong, J. H., Resop, J. P., Mueller, N. D., Fleisher, D. H., Yun, K., Butler, E. E., ... & Kim, S. H. (2016). Random forests for global and regional crop yield predictions. PloS one, 11(6), e0156571. [CrossRef]
- Jhajharia, K., Mathur, P., Jain, S., & Nijhawan, S. (2023). Crop yield prediction using machine learning and deep learning techniques. Procedia Computer Science, 218, 406-417. [CrossRef]
- Van Klompenburg, T., Kassahun, A., & Catal, C. (2020). Crop yield prediction using machine learning: A systematic literature review. Computers and electronics in agriculture, 177, 105709. [CrossRef]
- Matsumura, K., Gaitan, C. F., Sugimoto, K., Cannon, A. J., & Hsieh, W. W. (2015). Maize yield forecasting by linear regression and artificial neural networks in Jilin, China. The Journal of Agricultural Science, 153(3), 399-410. [CrossRef]
- Roell, Y. E., Beucher, A., Møller, P. G., Greve, M. B., & Greve, M. H. (2020). Comparing a random forest based prediction of winter wheat yield to historical yield potential. Agronomy, 10(3), 395. [CrossRef]
Figure 1.
Graphical view of observed and predicted yield of wheat for RF model.
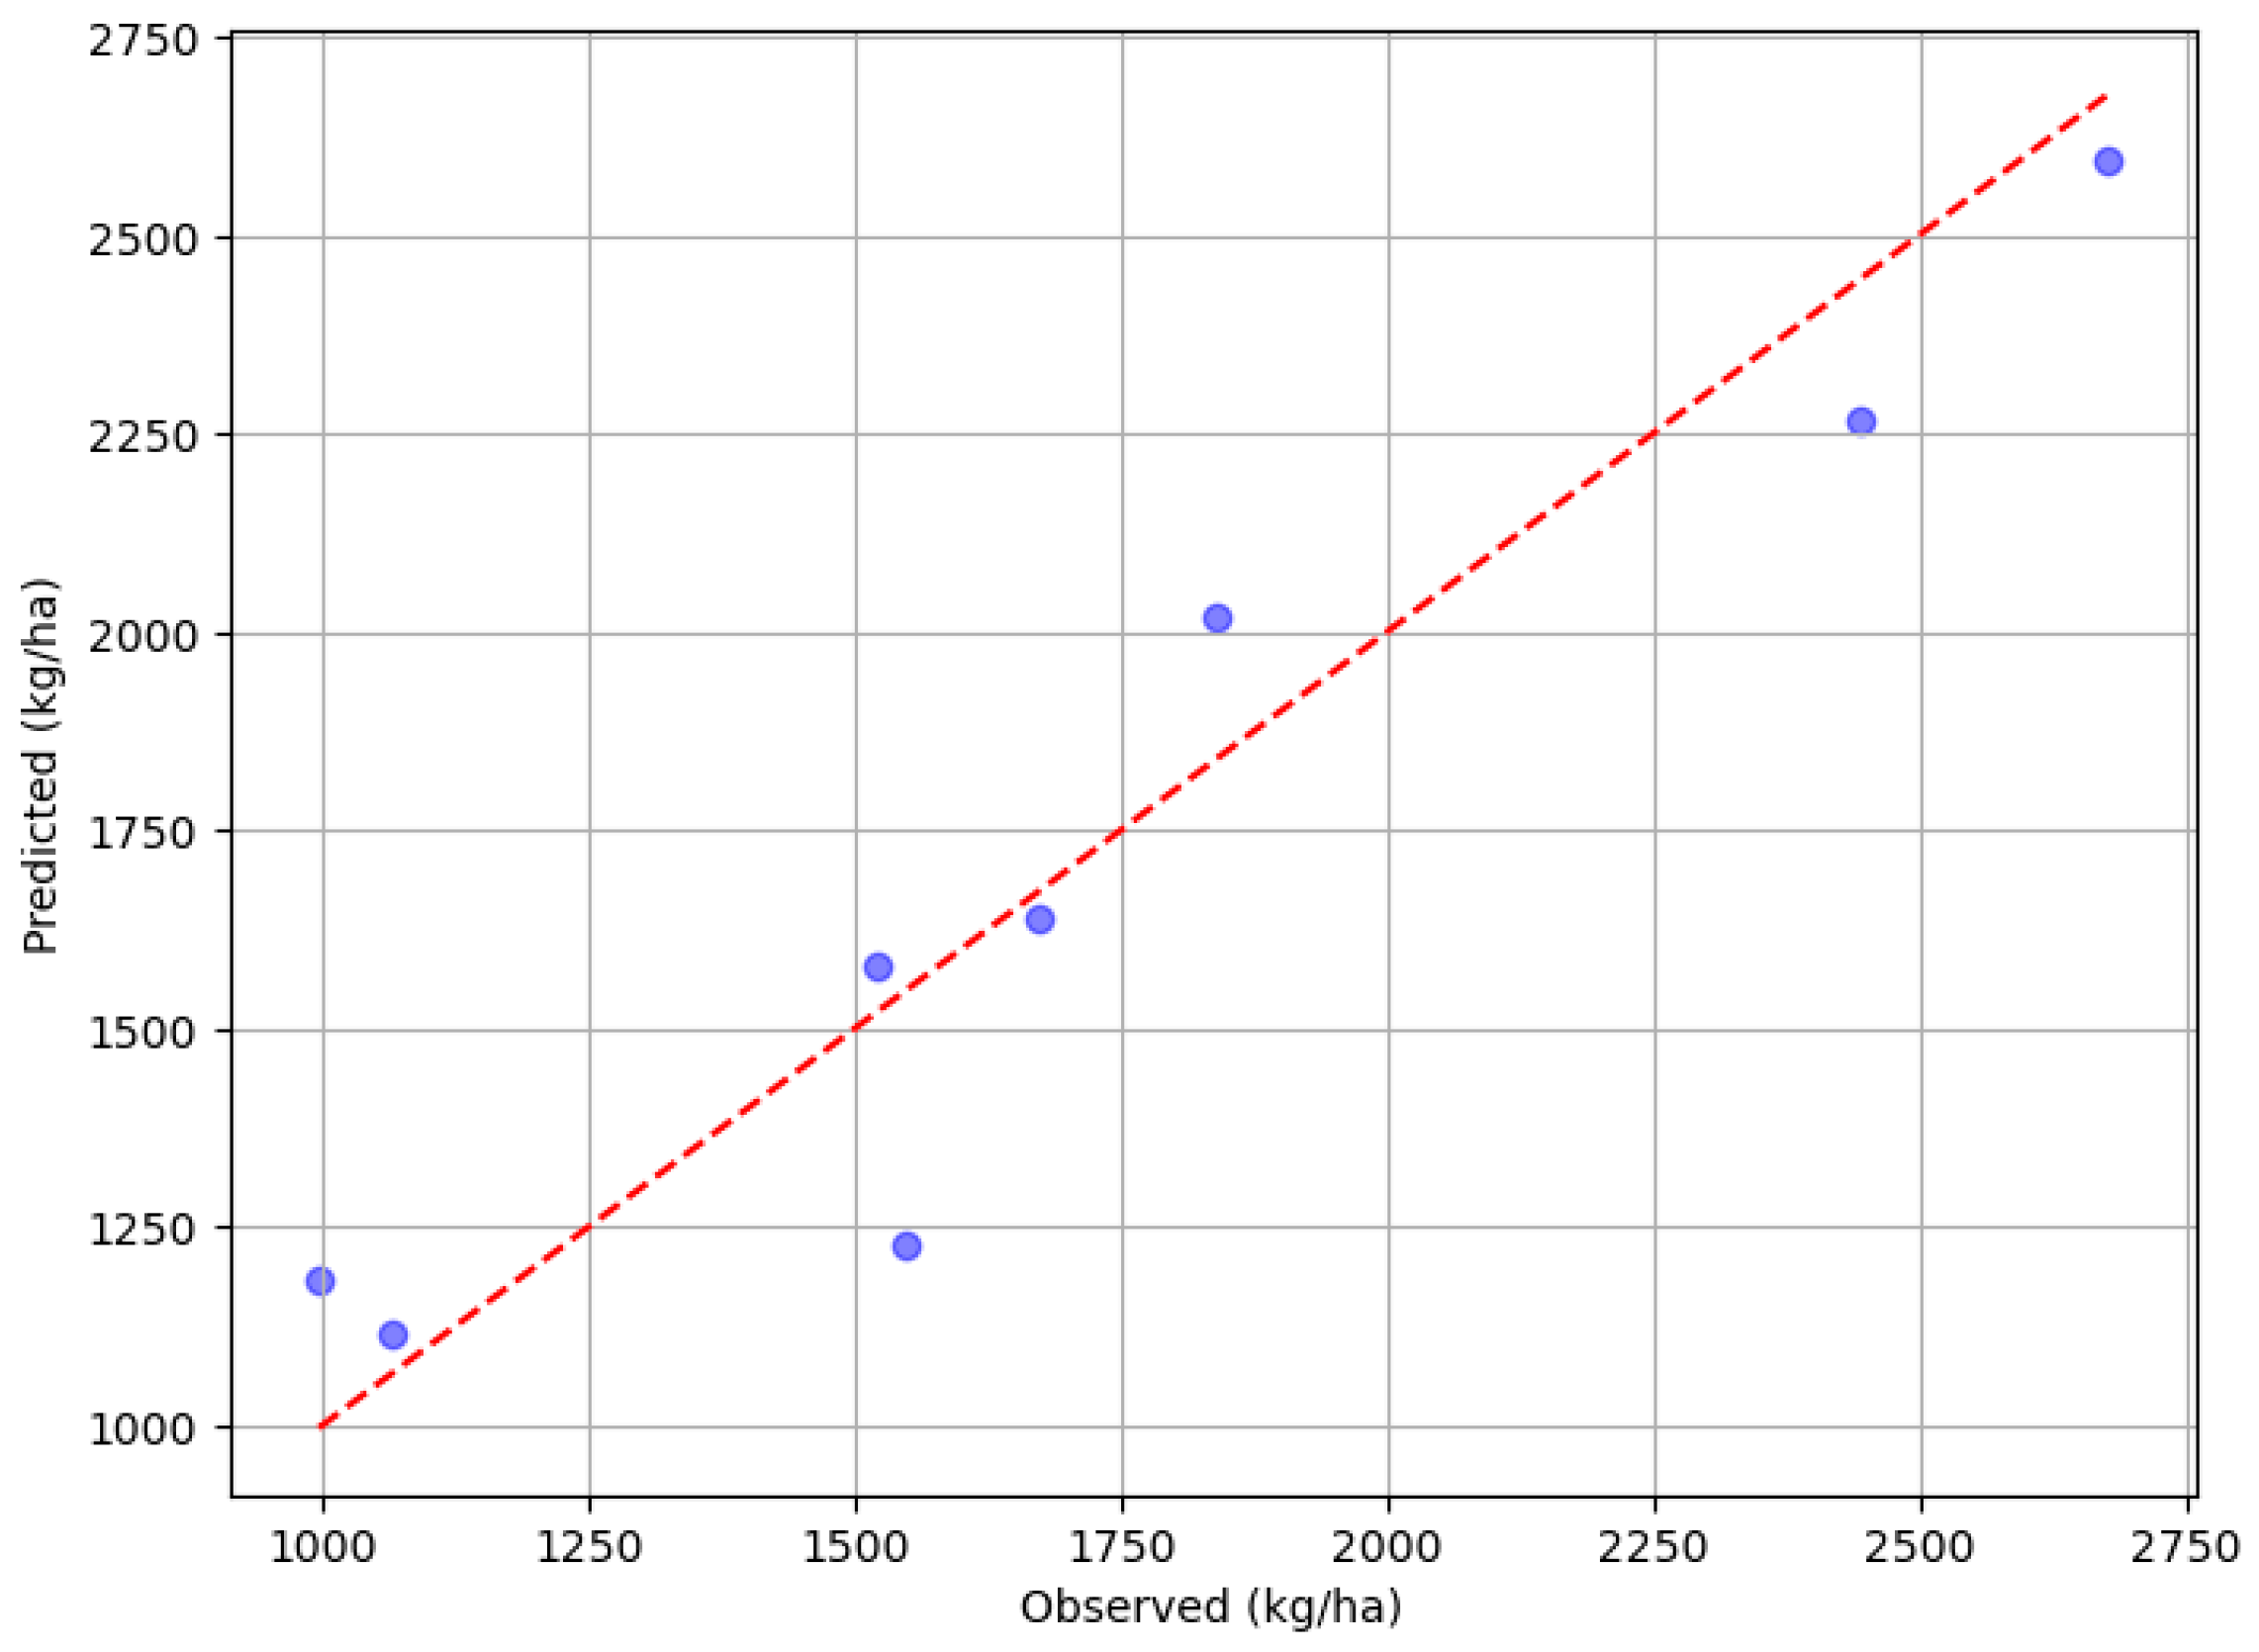
Figure 2.
Graphical view of observed and predicted yield of wheat for MLR model.
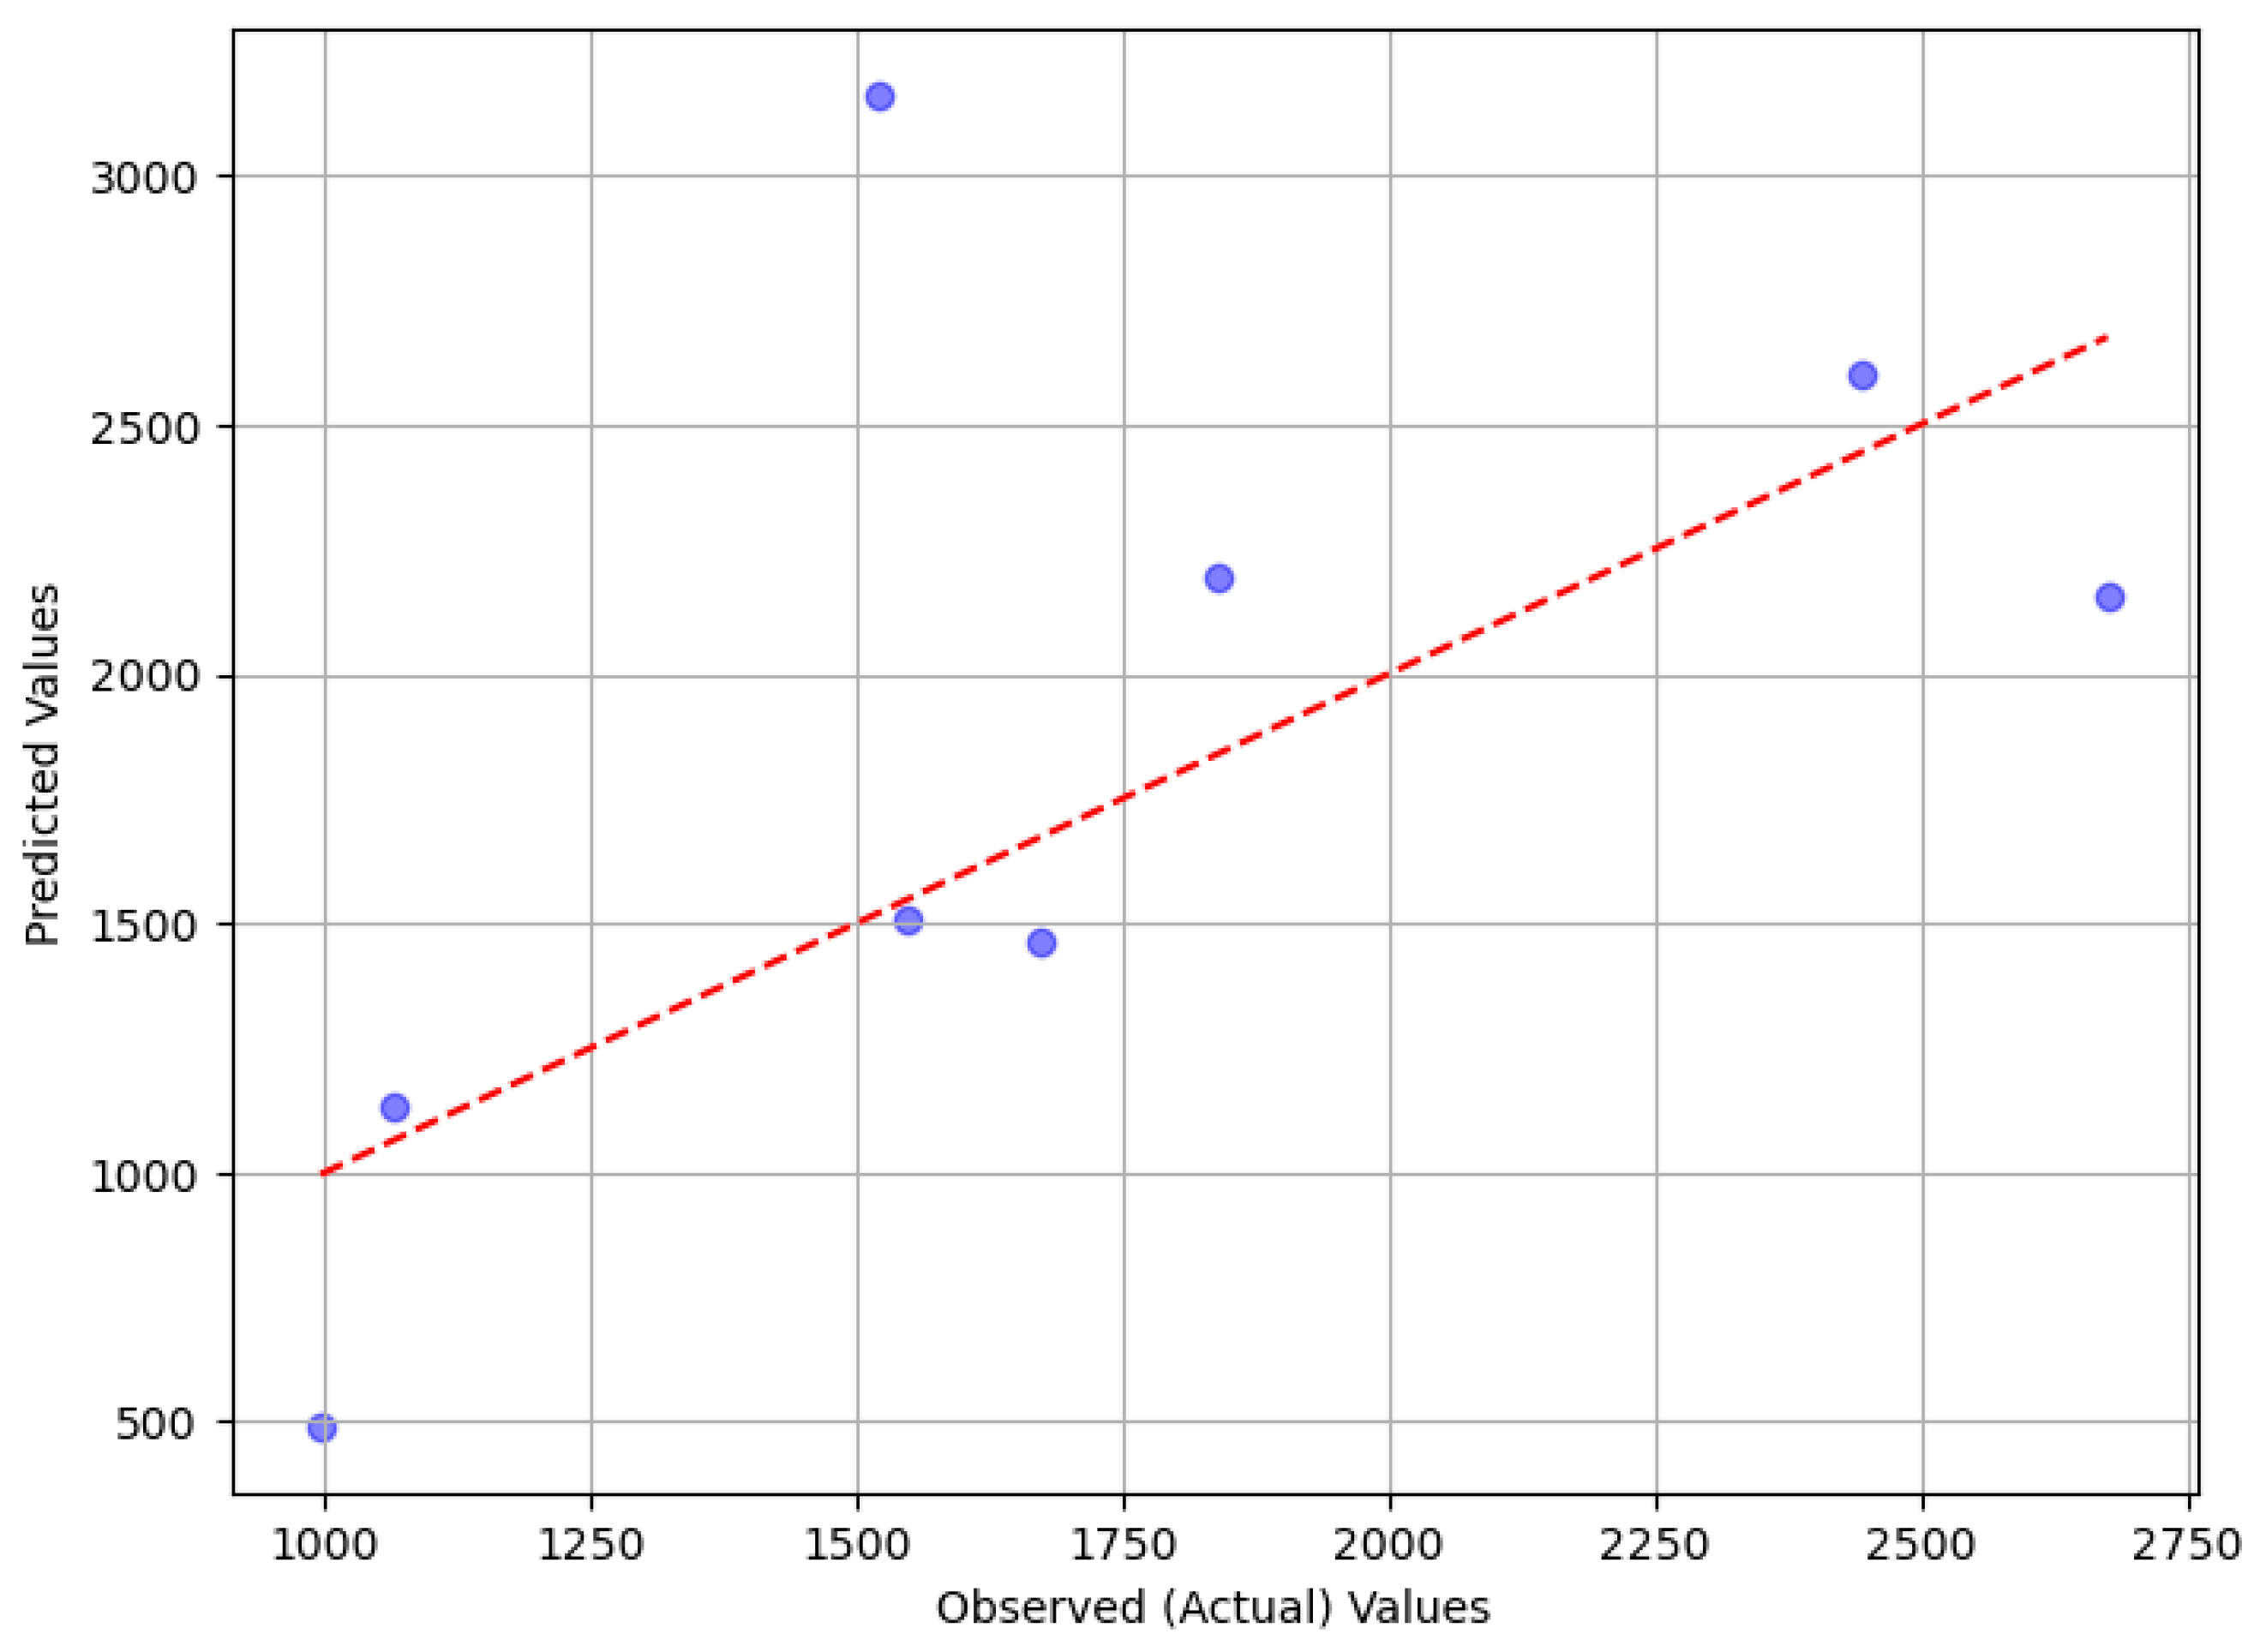
Figure 3.
Feature importance measures of random forest model. JunTmax-NovTmax=Maximum temperature (oc) for the months of June to November; JunTmin-NovTmin= Minimum temperature for the months of June to November (oc); JunRF-NovRF= Total amount of rainfall (mm) for the months of June to November ; JunRH-NovRH= Relative humidity (%) for the months of June to November; Nitro= Nitrogen fertilizer use (kg); Phosp = Phospahte fertilizer use (kg); CO2 = CO2 emission (kt).
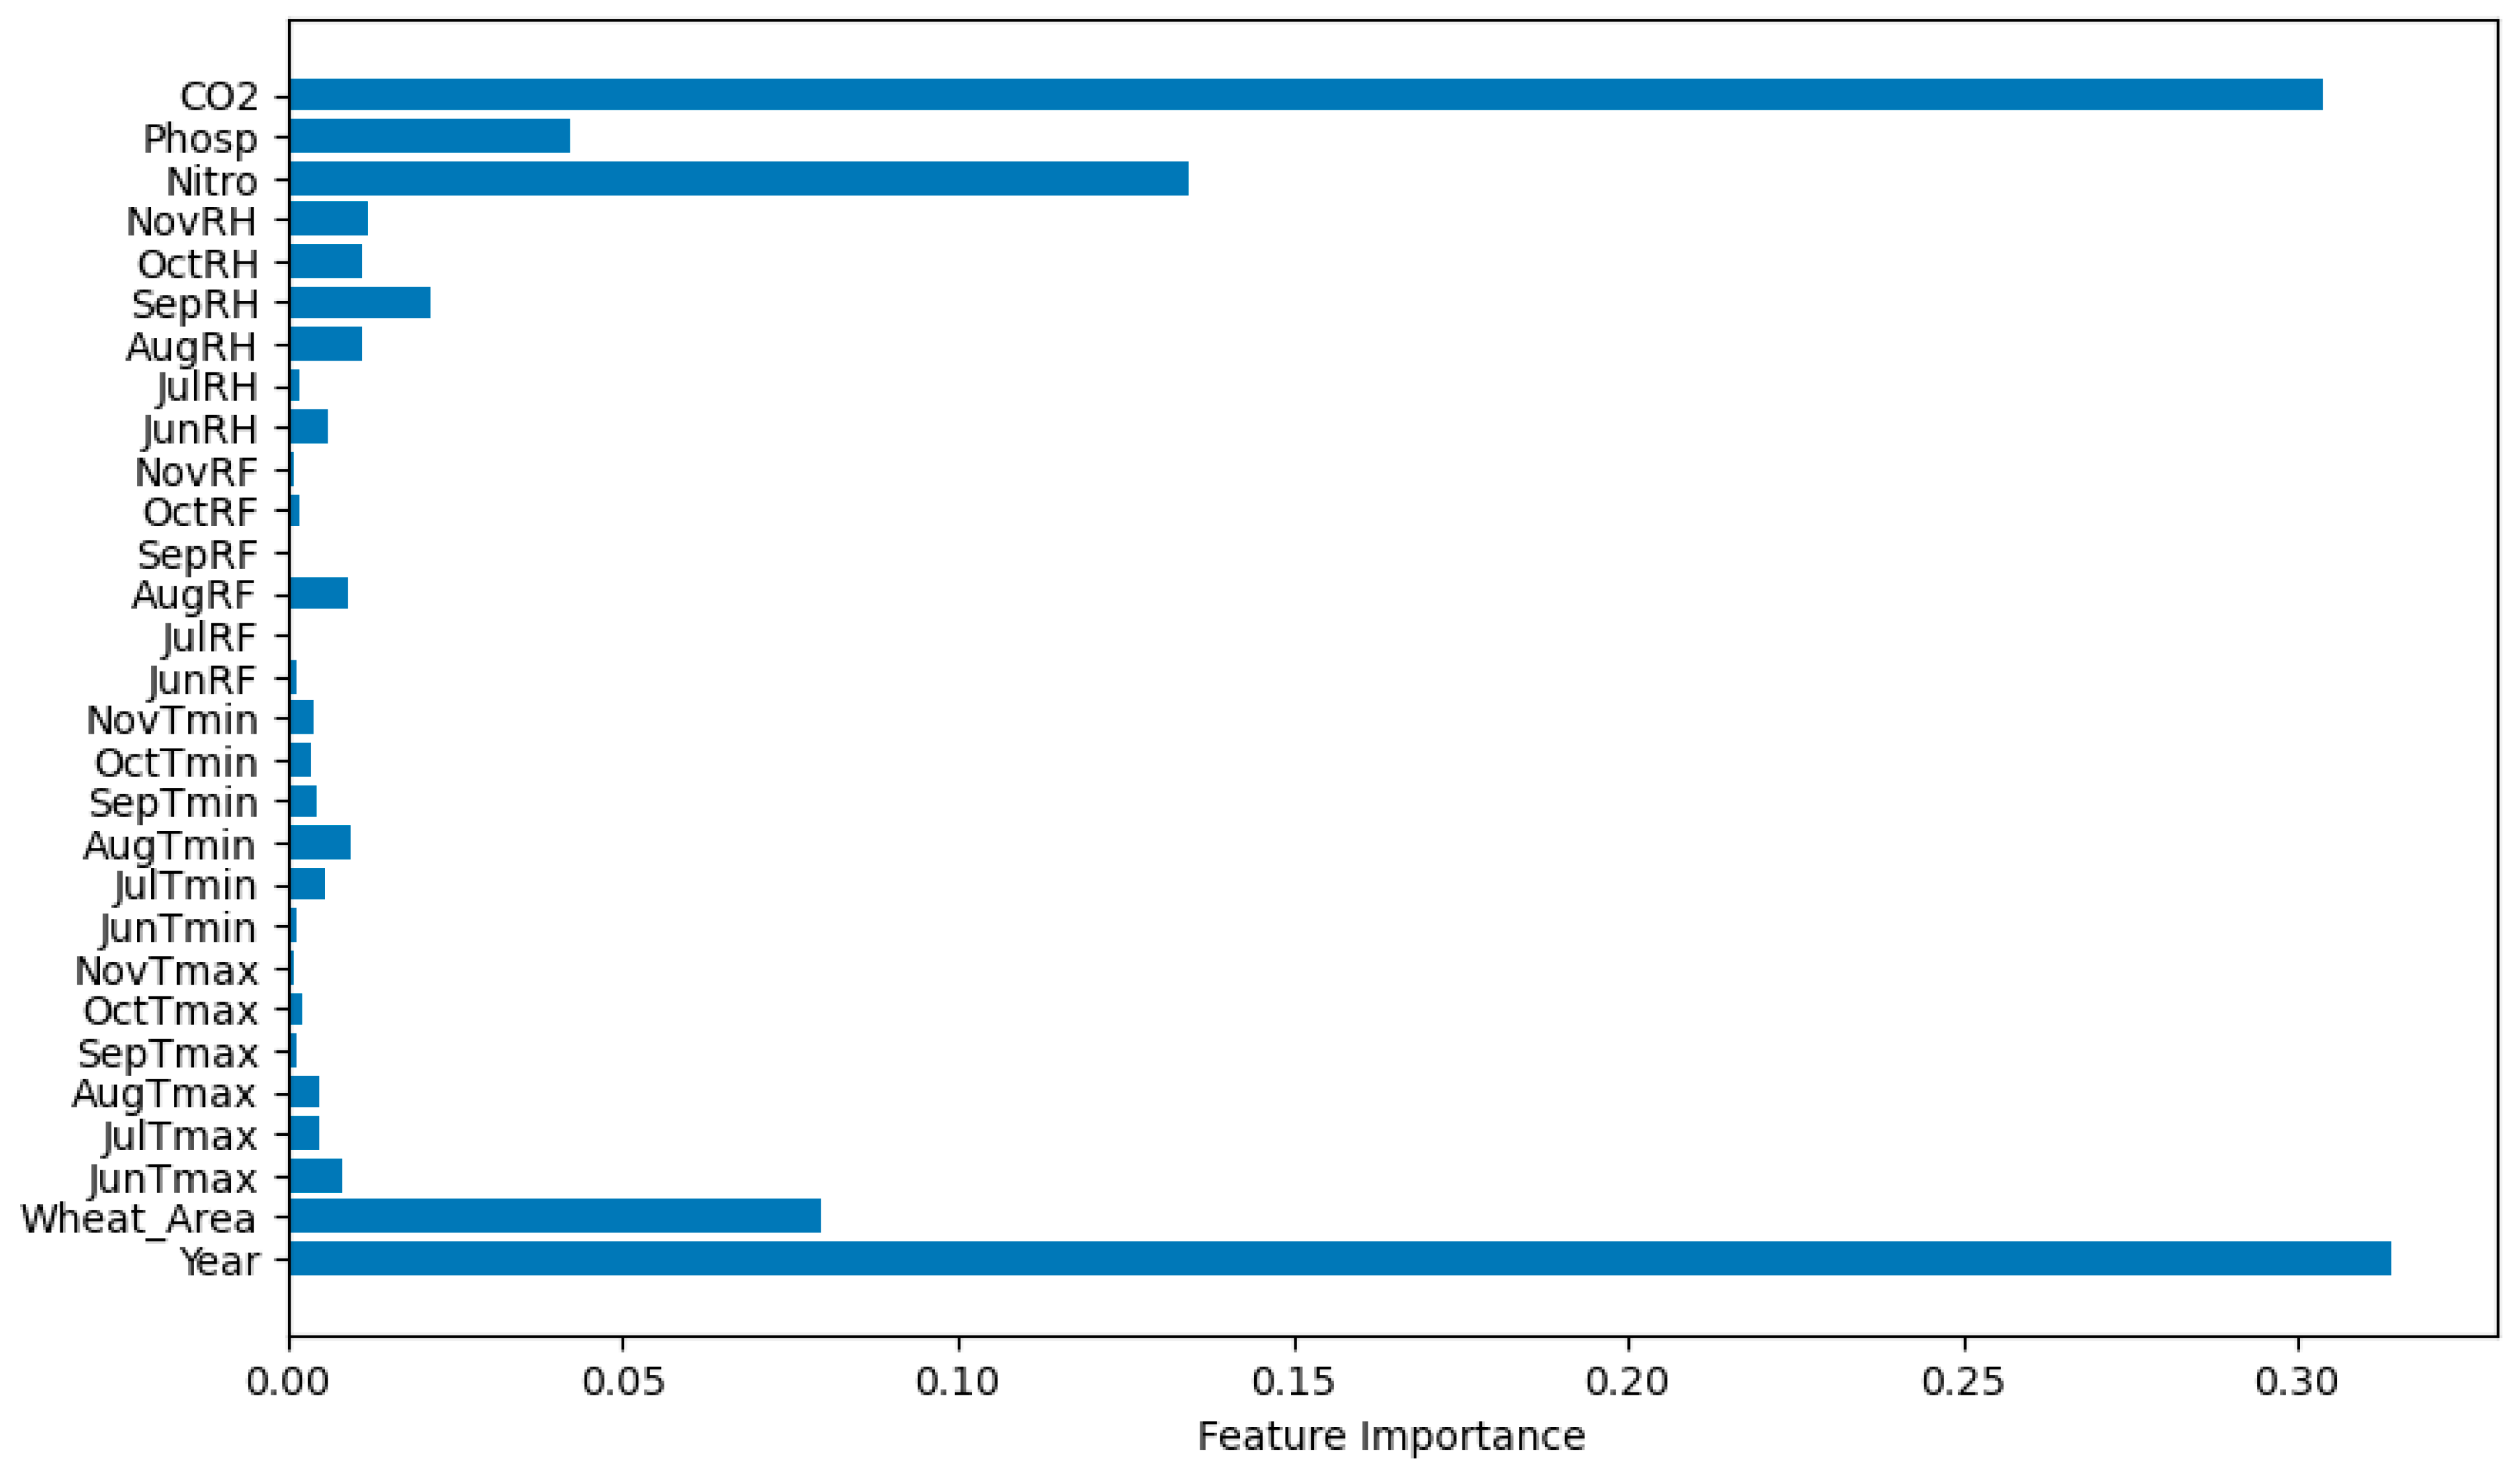
Figure 4.
Partial dependence plot for the top ranked predictor feature or variable.
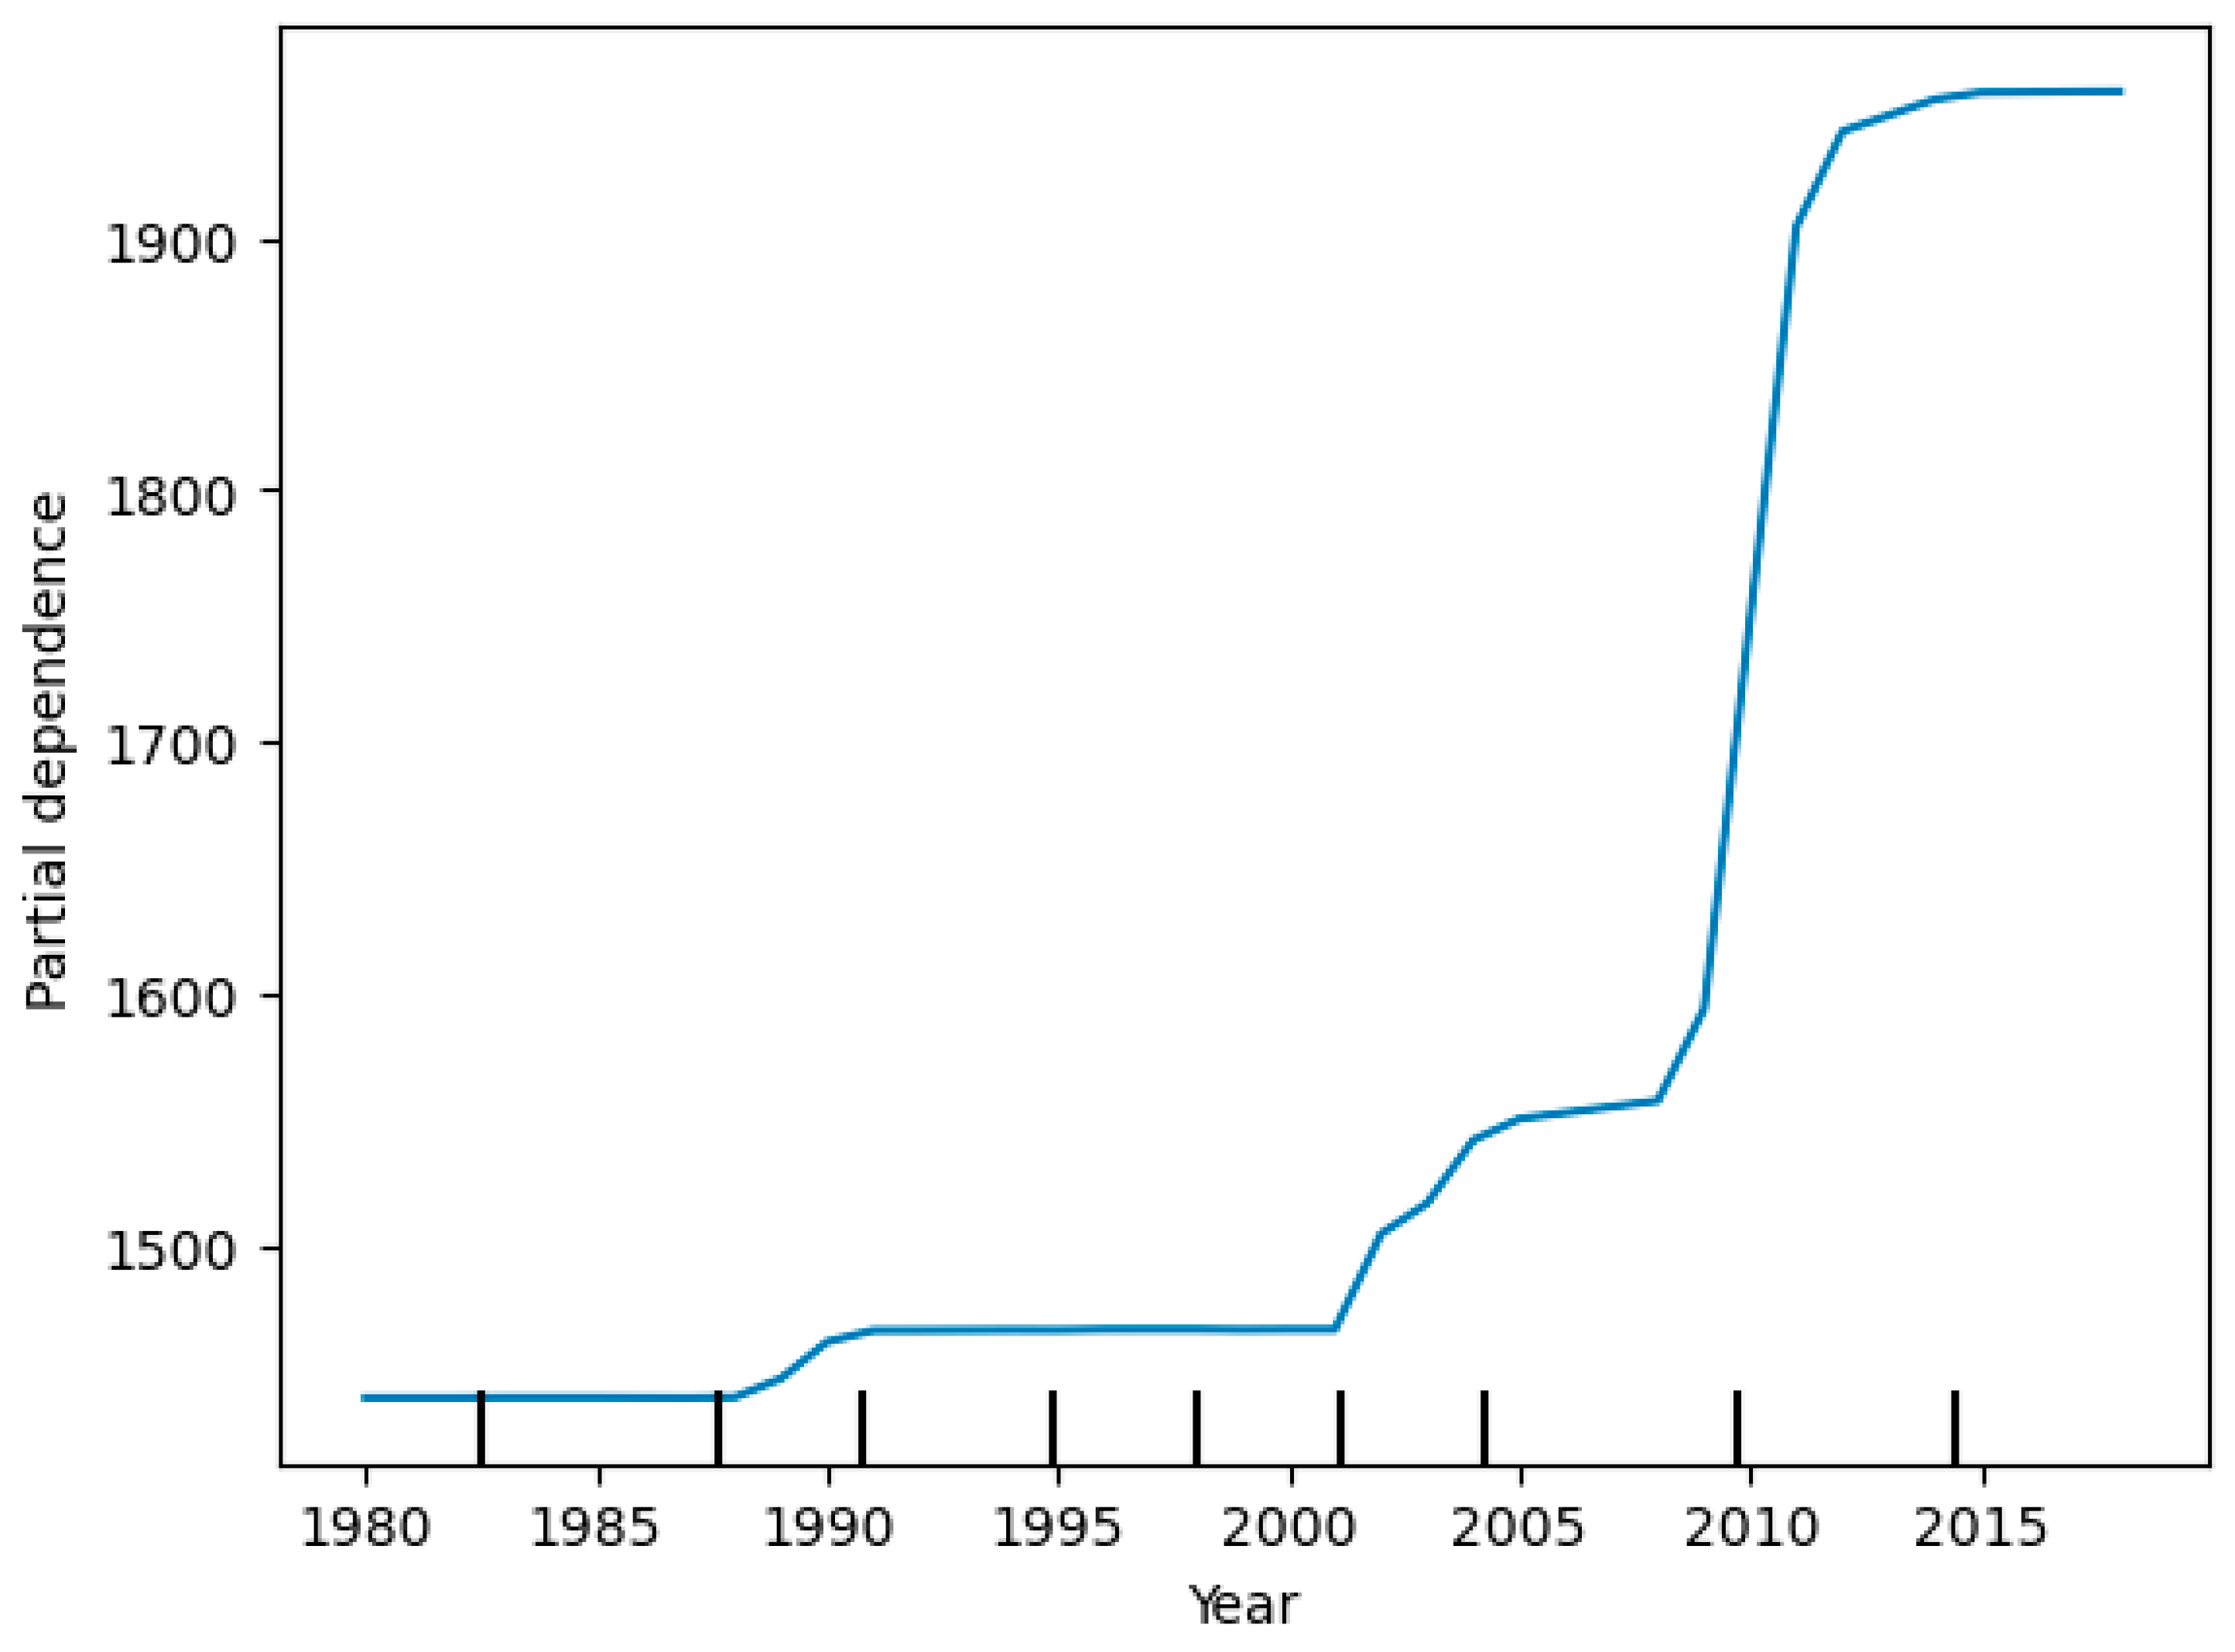

Table 1.
Target variable and features considered in the present dataset.
| Name | Description |
|---|---|
| Year | The period from 1980-2018 |
| Wheat yield (kg/ha) | Wheat production divided by wheat harvested area |
| Wheat area (ha) | Amount of crop land allocated to wheat production |
| Monthly maximum temperature (oc) | Average of daily maximum temperatures registered in the crop growing season (June to November) |
| Monthly minimum temperature (oc) | Average of daily minimum temperatures registered in the crop growing season (June to November) |
| Monthly rainfall (mm) | Total amount of daily rainfall registered in the crop growing season (June to November) |
| Monthly relative humidity (%) | Average of daily relative humidity registered in the crop growing season (June to November) |
| Nitrogen use (kg) | The total nitrogen use of wheat crop land |
| Phosphate (P2O5) (kg) | The total phosphate ((P2O5) use of wheat crop land |
| CO2 emission (in kilotons) | Annual CO2 emission |
Table 2.
Random forest and Multiple regression models performance.
| Model | Metrics | |
|---|---|---|
| MAE | RMSE | |
| Random forest | 135.879 | 163.898 |
| Multiple linear regression | 435.741 | 653.394 |
Table 3.
Observed and predicted wheat yield for RF model.
| Year | Observed (kg/ha) | Predicted (kg/ha) |
|---|---|---|
| 2013 | 2444.6 | 2268.410 |
| 2016 | 2675.5 | 2594.297 |
| 1984 | 1064.6 | 1115.205 |
| 1993 | 1548.7 | 1228.717 |
| 2010 | 1838.5 | 2018.509 |
| 2006 | 1520.4 | 1577.183 |
| 1986 | 996.0 | 1184.546 |
| 2007 | 1671.1 | 1637.389 |
Table 4.
Observed and predicted wheat yield for MLR model.
| Year | Observed (kg/ha) |
Predicted (kg/ha) |
|---|---|---|
| 2013 | 2444.6 | 2599.199168 |
| 2016 | 2675.5 | 2156.834186 |
| 1984 | 1064.6 | 1133.232548 |
| 1993 | 1548.7 | 1510.493370 |
| 2010 | 1838.5 | 2193.276380 |
| 2006 | 1520.4 | 3161.813250 |
| 1986 | 996.0 | 492.161659 |
| 2007 | 1671.1 | 1465.302321 |
Disclaimer/Publisher’s Note: The statements, opinions and data contained in all publications are solely those of the individual author(s) and contributor(s) and not of MDPI and/or the editor(s). MDPI and/or the editor(s) disclaim responsibility for any injury to people or property resulting from any ideas, methods, instructions or products referred to in the content. |
© 2025 by the authors. Licensee MDPI, Basel, Switzerland. This article is an open access article distributed under the terms and conditions of the Creative Commons Attribution (CC BY) license (http://creativecommons.org/licenses/by/4.0/).
Copyright: This open access article is published under a Creative Commons CC BY 4.0 license, which permit the free download, distribution, and reuse, provided that the author and preprint are cited in any reuse.


