
Submitted:
20 February 2025
Posted:
21 February 2025
You are already at the latest version
Abstract
The circular economy is strategically based on the three R's policy: reduce, recycle and reuse, which is not easy to apply to waste for which there are no processes that allow them to be recycled, or others for which reuse is not possible. One group of wastes that is particularly problematic because of its volume, quantity and diversity is the group of construction and demolition materials, including fibrous materials such as asbestos, for which there are still no clear alternatives for reintroduction into the supply chains of new processes. The destination of these end-of-life materials is landfill, with all the well-known drawbacks of limited landfill space, the high volume of material to be landfilled and the associated costs. In order to promote the reuse of asbestos fibres, it is essential to characterise them in physico-chemical terms and to assess how effectively mechanical and thermal treatments can transform these fibres for reuse, in order to provide the basis for a systematic approach to the incorporation of asbestos-containing waste into new construction applications. This analysis focuses on sustainable construction practices aimed at reusing waste materials to achieve significant reductions in carbon emissions over the entire life cycle of buildings.
Keywords:
circular economy
; reuse
; waste treatment
; asbestos
; thermal characterization
; mechanical characterization
1. Introduction
The reuse of end-of-life building materials is an emerging priority in industrial and environmental contexts, considering the significant challenges associated with asbestos and other hazardous wastes. Asbestos, once widely used in construction materials for its mechanical and thermal resistance, was later banned due to its impacts on human health, such as the development of serious respiratory diseases [1]. This material persists in the environment, and the treatment of asbestos-containing waste is central to the transition to a circular economy, which aims to transform waste into useful resources.
The circular economy (CE) has gained prominence as a solution to mitigate the environmental impacts of the construction industry, responsible for approximately 30% of solid waste generated globally [2]. The EC proposes to replace the linear “extract, produce, discard” model with a system that promotes the reuse and recycling of materials, reducing the extraction of natural resources and the impacts associated with waste disposal.
The European Union recognizes the central role of CE in the management of construction and demolition waste (C&DW), establishing strategies to maximize material recovery and minimize landfilling [3]. In particular, wastes such as asbestos-containing fiber cement are challenging due to their toxicity and complexity in treatment. However, advances in recycling technologies have shown the viability of reintroducing these materials into the production chain, even in complex contexts [4].
The treatment of asbestos-containing waste is a global priority due to the environmental and health risks. Strategies based on the circular economy, such as thermal transformation processes and reuse in construction materials, have the potential to significantly reduce the costs and impacts associated with asbestos [5]. However, these strategies require investment in infrastructure and appropriate legislation to be effective.
In the European sector, efforts to integrate CE principles into C&DW management include initiatives for aggregate recycling and reprocessing of hazardous waste into safe applications, while simultaneously addressing economic and environmental sustainability challenges [6].
This work is being developed as part of a research project called FiberRec, which aims to develop solutions for the recovery of asbestos-containing construction waste in accordance with CE principles. The main objective is to characterise asbestos fibres in physico-chemical terms and to evaluate the effectiveness of mechanical and thermal processes in their transformation and reuse. This article initiates a systematic approach to understand the feasibility of integrating asbestos-containing waste into new construction applications, contributing to minimising environmental impacts and creating a closed material cycle. Previous studies show that the reuse of building materials can significantly reduce the carbon emissions associated with the life cycle of buildings [6].
2. Materials and Methods
2.1. Sample Collection and Preparation
The samples in this study were collected from fiber cement panels on the roof of a building and prepared under specific protocols to avoid contamination and degradation of the fibers. The process included controlled drying and grinding, ensuring the production of particulate materials suitable for analysis. Correct sample preparation is essential to ensure accurate analysis, especially in the characterization of asbestos fibers, as indicated by [7].
2.2. Analytical Techniques
The analyses were carried out using specific equipment to ensure detailed and accurate results. The Scanning Electron Microscope (SEM), model Hitachi SU1510, was used for surface observation, providing high magnification images that allow detailed morphological analysis of asbestos fibers. Associated with SEM, Energy Dispersive Spectroscopy (EDS) was used, with the Bruker Quantax 200 system, to identify the elemental composition of the samples. This system allowed the accurate detection of elements such as calcium, magnesium, silicon, iron and aluminum, which are characteristic of the asbestos fibers present in fiber cement.
Prior to SEM analysis, samples were coated with a carbon layer, using a Quorum Q150R E carbon depositor, to improve image quality by creating a homogeneous conductive surface. This procedure is essential to ensure consistent and detailed results during microscopic analysis.
For identification of crystalline phases, a Bruker D8 Advance DaVinci X-ray Diffractometer was used, which employs specialized software, such as EVA (Bruker AXS) for phase identification and TOPAS (Bruker AXS) for structural refinement by the Rietveld method. This equipment enabled detailed analysis of the crystalline phases present in the samples, including chrysotile, calcite and quartz.
Powder samples were obtained using a Retsch PM100 bead mill, equipped with different sized beads (5 mm and 20 mm), operating at 550 revolutions per minute for 19 minutes. This equipment was used to reduce the fiber cement boards to a size suitable for subsequent analysis, without significantly altering the crystalline properties of the materials.
2.3. Experimental Protocol
The experimental steps were performed following a rigorous protocol that included initial sample preparation, SEM-EDS and XRD analyses. Initially, the samples were subjected to oven drying under controlled temperatures and subsequently ground in a Retsch PM100 ball mill, equipped with 20 mm and 5 mm balls, operating at a speed of 550 revolutions per minute for 19 minutes. The material was reduced to particles with a size of less than 75 µm, ensuring suitable conditions for subsequent analyses.
The morphological and chemical analysis of the particles was conducted using a Scanning Electron Microscope (SEM), model Hitachi SU1510, associated with a Bruker Quantax 200 Energy Dispersive Spectroscopy (EDS) system. The coating of the samples with carbon was performed using a Quorum Q150R E depositor, ensuring a homogeneous conductive surface to obtain high-quality images and perform an accurate characterization of the chemical composition of the particles.
To identify crystalline phases, the samples were analyzed by X-ray Diffraction (XRD), using the Bruker D8 Advance DaVinci diffractometer. Samples were prepared as leveled slides or compacted into discs for standardization. Phase identification was performed using EVA software (Bruker AXS), while structural refinement was performed using the Rietveld method using TOPAS software (Bruker AXS).
2.4. Limitations of Techniques
Although the techniques described are robust and widely used, they have important limitations. Scanning Electron Microscopy coupled with Energy Dispersive Spectroscopy (SEM-EDS) analysis may underestimate the presence of ultrafine fibers, with diameters smaller than 0.5 µm, due to the limited resolution of the equipment under standard conditions, as pointed out by [8]. The X-ray Diffraction (XRD) technique, although effective in identifying crystalline phases, does not allow distinguishing polymorphs that have similar chemical formulas, which can generate ambiguities in mineralogical identification without the support of complementary techniques, such as Raman spectroscopy. as discussed by [9].
2.5. Ethical and Environmental Considerations
During the study, appropriate safety protocols for handling asbestos were followed, considering its high carcinogenic risk. Furthermore, the management of the waste generated was carried out in compliance with local environmental regulations, ensuring minimal ecological impact.
3. Results
3.1. SEM Analysis
3.1.1. Sample A
SEM images of Sample A (plate and powder) reveal the presence of fibrous asbestos structures. Figure 1 shows the microstructures of the plate sample, where asbestos fibers are clearly observed, forming interwoven fiber networks that enhance the mechanical properties of the material. Magnifications range from 100x to 5000x.
In contrast, SEM images of the powdered Sample A (Figure 2) do not clearly show asbestos fibers. However, this does not confirm their absence, as the fibers may have been pulverized to sizes below the SEM detection limit.
3.1.2. Sample B
SEM images of Sample B (plate) indicate a similar fibrous network (Figure 3), confirming the presence of asbestos. Images of the powdered sample do not clearly display fibers, raising uncertainty about the grinding process's effectiveness in eliminating asbestos fibers.
3.1.3. Sample C
Sample C plate images (Figure 4) show a lower fiber concentration than Sample A, likely due to different manufacturing origins. Powdered Sample C images (Figure 4 and Figure 5) suggest that asbestos fibers might still be present in fragmented form.
In Figure 5, the microstructures of Sample C in powder form can be observed, with images captured at 2000x magnification. Once again, there is uncertainty as to whether grinding eliminates asbestos fibers, as some observations of these images suggest the presence of fiber remnants.
3.1.4. Sample D
3.2 SEM-EDS Analysis
3.2.1. Sample A
SEM-EDS analysis of Sample A (Figure 8 and Figure 9) identifies the elemental composition of the asbestos cement material. The primary elements detected include calcium, oxygen, silicon, magnesium, iron, aluminum, and sulfur.
Elemental quantification of Sample A powder is presented in Figure 10, showing calcium as the predominant component.
3.2.2. Sample B
3.2.3. Sample C
The elemental composition of Sample C powder (Figure 14) indicates a predominance of calcium, oxygen, and silicon, consistent with previous results.
3.2.4. Sample D
SEM-EDS analysis of Sample D (Figure 15) confirms a similar elemental profile, with no significant differences compared to other samples.
3.3 XRD Analysis
3.3.1. Sample A
3.3.2. Sample B
3.3.3. Sample C
3.3.4. Sample D
3.3.5. Summary of XRD Analysis
A comparative summary of the identified crystalline phases is presented in Table 1, demonstrating the consistency of the detected mineral phases across all samples.
4. Discussion
The thermal treatment of asbestos-containing materials (ACMs) has garnered significant attention due to its ability to transform hazardous fibrous minerals into non-fibrous, stable phases suitable for use in cement or mineral wool production. This section synthesizes findings from the current study with recent literature, providing a comparative analysis of the thermal effects on asbestos mineral transformation, its implications for material recycling, and its integration into circular economy models.
4.1. Thermal Decomposition and Phase Transformation of Asbestos
The results of this study revealed that temperatures above 700 °C initiate significant changes in asbestos fibers, while complete transformation into non-fibrous, stable phases occurs at temperatures of approximately 1000 °C or higher. This aligns with findings by Bloise (2019), who demonstrated that actinolite asbestos undergoes thermal decomposition at approximately 1030 °C, resulting in recrystallization into stable crystalline phases while preserving fibrous morphology as pseudomorphs [9].
The transformation of chrysotile (Mg3Si2O5(OH)4) into forsterite (Mg2SiO4) and enstatite (MgSiO3) under heat treatment was particularly evident in this study. Iwaszko (2019) found similar results, reporting that calcite decomposes into calcium oxide (CaO) and chrysotile transitions into forsterite and enstatite at 700 °C, with complete loss of fibrous morphology at 1300 °C [10]. This transformation highlights the efficacy of thermal treatment in detoxifying asbestos materials, making them safer for reuse.
4.2. Implications for Cement Production
The incorporation of thermally treated ACMs into cement production has been extensively studied. Kusiorowski et al. (2024) demonstrated that thermal treatment converts asbestos fibers into phases like belite (C2S) and alite (C3S), which are integral to cement clinker production. Their work emphasizes the dual benefits of reducing hazardous waste and enhancing material properties in cement applications [11].
Carneiro et al. (2021) optimized the calcination process for asbestos cement waste (ACW), achieving complete dehydroxylation of chrysotile at 800 °C and producing a material with 40.42% belite content, which provides binding capacity comparable to traditional cements [12]. The findings of the current study align with these results confirming the potential of thermally treated asbestos to contribute to sustainable cement manufacturing.
4.3. Potential for Mineral Wool Production
The use of thermally treated ACMs in mineral wool production has emerged as a viable alternative for material recycling. Wentao et al. (2019) demonstrated that pre-firing asbestos at 700 °C for 1 hour transformed chrysotile into forsterite, which subsequently formed intertwined spherulitic structures during sintering at 1200 °C. The resulting glass-ceramics exhibited enhanced mechanical strength and durability, meeting construction standards [13].
The current study corroborates these findings, as thermal treatment resulted in the formation of non-fibrous phases suitable for mineral wool production. This transformation not only reduces landfill demand but also aligns with circular economy principles by reintegrating waste materials into high-value applications.
4.4. Toxicological Considerations and Residual Reactivity
While thermal treatment effectively eliminates the fibrous morphology of asbestos, some studies suggest residual concerns. Ballirano et al. (2020) highlighted that thermally treated asbestos may retain surface reactivity, specifically oxygen-centered radicals like hydroxyl groups, which could pose potential health risks if not adequately managed [14]. The findings of this study suggest that incorporating treated asbestos into stable matrices, such as cement or mineral wool, can mitigate these risks effectively.
4.5. Comparative Analysis with Alternative Methods
Hydrothermal treatments have also been proposed as alternatives to thermal processes. Spasiano et al. (2019) showed that hydrothermal conditions combined with acidic solutions can degrade chrysotile fibers and convert them into inert phases like forsterite and enstatite [15]. However, these methods often require specialized equipment and longer processing times compared to thermal treatment.
The current study reinforces the efficiency of thermal treatment as a practical and scalable solution for asbestos detoxification, particularly when combined with downstream recycling processes.
4.6. Environmental and Economic Implications
The integration of thermally treated ACMs into industrial processes, such as cement and mineral wool production, offers significant environmental benefits by reducing landfill waste and minimizing raw material extraction. Ruiz et al. (2018) emphasized that these approaches align with the principles of the circular economy, transforming hazardous waste into secondary raw materials suitable for industrial use [3].
Economically, the reuse of treated asbestos can reduce disposal costs and create new revenue streams through the production of high-value materials, such as eco-friendly cement and advanced insulation products. These benefits underline the importance of developing policies and infrastructure to support the adoption of thermal treatment technologies.
5. Conclusions
This study confirmed the effectiveness of heat treatment in transforming asbestos-containing materials (ACM) into stable, non-fibrous mineral phases, providing a viable solution for the safe and sustainable management of hazardous waste. Analysis of the samples demonstrated that temperatures above 700 °C are sufficient to initiate the decomposition of asbestos minerals, with complete elimination of the fibrous morphology observed at temperatures above 1000 °C. The results obtained by X-ray diffraction (XRD) and scanning electron microscopy with energy dispersive spectroscopy (SEM-EDS) confirmed the phase transition as chrysotile to forsterite and enstatite, as well as the decomposition of calcite into calcium oxide (CaO), creating new stable and inert matrices. Furthermore, it was observed that grinding the samples significantly reduced the particle size, but did not eliminate the fibers, reinforcing the need for heat treatments to ensure the total neutralization of the associated risk. The integration of treated MCA into industrial processes, such as cement and mineral wool production, has been widely validated. Cement production with treated waste has shown promising results, with the presence of phases such as belite (C2S) and alite (C3S), improving the material's performance and promoting sustainability by replacing conventional raw materials. Likewise, the transformation of waste into mineral wool and advanced ceramics has shown technical feasibility, with resulting products of high quality and added value. Despite advances, this work also highlighted challenges. Although heat treatment eliminates the fibrous morphology, studies indicate that residual surface reactivity may persist under certain conditions. Therefore, it is necessary to further investigate the chemical reactivity and possible toxic impacts of the by-products generated, ensuring total environmental and occupational safety. Additionally, process optimization, such as the integration of hybrid technologies that combine thermal and hydrothermal treatments, can increase efficiency and reduce costs. The way forward includes the industrial scale of the proposed technologies, combined with public policies that encourage the recycling of waste containing asbestos. This study reinforces the potential of thermal treatment as a central pillar of a circular economy model, transforming hazardous waste into valuable resources and contributing to the reduction of the global environmental footprint. The continuation of this research could consolidate innovative and sustainable solutions for MCA management in different industrial contexts.
Author Contributions
Conceptualization, A.C. and L.J.R.N. ; methodology, L.J.R.N. and A.C.; validation, L.J.R.N. and A.C.; formal analysis, L.J.R.N. and A.C.; investigation, L.J.R.N. and A.C.; resources, L.J.R.N. and A.C.; data curation, L.J.R.N. and A.C.; writing—original draft preparation, L.J.R.N. and A.C.; writing—review and editing, L.J.R.N. and A.C.; visualization, L.J.R.N. and A.C.; supervision, L.J.R.N. and A.C. All authors have read and agreed to the published version of the manuscript.
Funding
This work is the result of the project FiberRec - Recovery of end-of-life construction materials: fiber processing from a circular economy perspective, Project No. 2022.09272.PTDC, whose funding was approved by FCT, I.P. All researchers were supported by proMetheus, Research Unit on Energy, Materials and Environment for Sustainability—UIDP/05975/2020, funded by national funds through FCT—Fundação para a Ciência e Tecnologia. A.C. financed by national funds through the FCT/MCTES.
Data Availability Statement
The data are available upon request to the corresponding author.
Acknowledgments
The authors thank FCT, I.P. for the opportunity to provide funding for research.
Conflicts of Interest
The authors declare no conflicts of interest.
References
- Zoraja B., Ubavin D, Stanisavljevic N., et al (2022). Assessment of asbestos and asbestos waste quantity in the built environment of transition country. Waste Management & Research. 2022;40(8):1285-1296. doi:10.1177/0734242X211064031.
- Benachio G., Freitas M., Tavares S. (2020). Circular economy in the construction industry: A systematic literature review, Journal of Cleaner Production, Volume 260, 2020, 121046, ISSN 0959-6526, . [CrossRef]
- Ruiz, L., Ramón X., Domingo S. (2020). The circular economy in the construction and demolition waste sector – A review and an integrative model approach. Journal of Cleaner Production, Volume 248, 119238, ISSN 0959-6526, . [CrossRef]
- Lachat, A., Mantalovas, K., Desbois, T., Yazoghli Marzouk, O., Colas, A. S., Di Mino, G., & Feraille, A. (2021). From Buildings’ End of Life to Aggregate Recycling under a Circular Economic Perspective: A Comparative Life Cycle Assessment Case Study. Sustainability, 13(17), 9625.
- Schützenhofer, S., Kovacic, I., Rechberger, H., Mack, S (2022). Improvement of Environmental Sustainability and Circular Economy through Construction Waste Management for Material Reuse. Sustainability, 14, 11087. [CrossRef]
- Norouzi M., Chàfer M., Cabeza L., Jiménez L., Boer D. (2021). Circular economy in the building and construction sector: A scientific evolution analysis, Journal of Building Engineering, Volume 44, 102704, ISSN 2352-7102, . [CrossRef]
- Lahondère, D., Wille, G., Schmidt, U., Silvent, J., Duron, J., and Duée, C. (2020). Morphological and chemical characterization of asbestos fibers in solid rocks: Towards an in-situ and combined analytical approach, EGU General Assembly 2020, Online, 4–8 May 2020, EGU2020-13773, 2020. [CrossRef]
- Valdré S., Poggi G., Buccola A., Casini G., Le Neindre N., et al. (2018). Time of flight identification with FAZIA. International Workshop on Multi facets of EoS and Clustering (IWM-EC 2018), May 2018, Catane, Italy. pp.167, ff10.1393/ncc/i2018-18167-7ff. ffhal-02116521f.
- Bloise A., Ricchiuti C., Lanzafame G., Punturo R. (2020). X-ray synchrotron microtomography: a new technique for characterizing chrysotile asbestos, Science of The Total Environment, Volume 703, 135675, ISSN 0048-9697, . [CrossRef]
- Iwaszko J. (2019). Making asbestos-cement products safe using heat treatment, Case Studies in Construction Materials, Volume 10, 2019, e00221, ISSN 2214-5095, . [CrossRef]
- Kusiorowski, R., Gerle, A., Kujawa, M. et al (2024). Characterisation of asbestos-containing wastes by thermal analysis. J Therm Anal Calorim 149, 10681–10694. [CrossRef]
- Carneiro G., Santos T., Simonelli G., Ribeiro D., Cilla M., Dias C. (2021). Thermal treatment optimization of asbestos cement waste (ACW) potentializing its use as alternative binder, Journal of Cleaner Production, Volume 320, 128801, ISSN 0959-6526, . [CrossRef]
- Wentao H., Jian Xu, Ran Li, Xiangzheng Zhao, Longzhen Qiu, Wen Yang (2019). Developing superhydrophobic rock wool for high-viscosity oil/water separation, Chemical Engineering Journal, Volume 368, Pages 837-846, ISSN 1385-8947, . [CrossRef]
- Ballirano P., Pacella A. (2020). Towards a detailed comprehension of the inertisation processes of amphibole asbestos: in situ high-temperature behaviour of fibrous tremolite. Mineralogical Magazine; 84(6):888-899. [CrossRef]
- Spasiano D., Luongo V., Race M., Petrella A., Fiore S., Apollonio C., Pirozzi F., Fratino U., Piccinni A. (2019). Sustainable bio-hydrothermal sequencing treatment for asbestos-cement wastes, Journal of Hazardous Materials, Volume 364, 2019, Pages 256-263, ISSN 0304-3894, . [CrossRef]
Figure 1.
(a) Sample A (100x magnification); (b) Sample A (200x magnification); (c) Sample A (1000x magnification); (d) Sample A (1400x magnification); and (e) Sample A (5000x magnification).
Figure 1.
(a) Sample A (100x magnification); (b) Sample A (200x magnification); (c) Sample A (1000x magnification); (d) Sample A (1400x magnification); and (e) Sample A (5000x magnification).
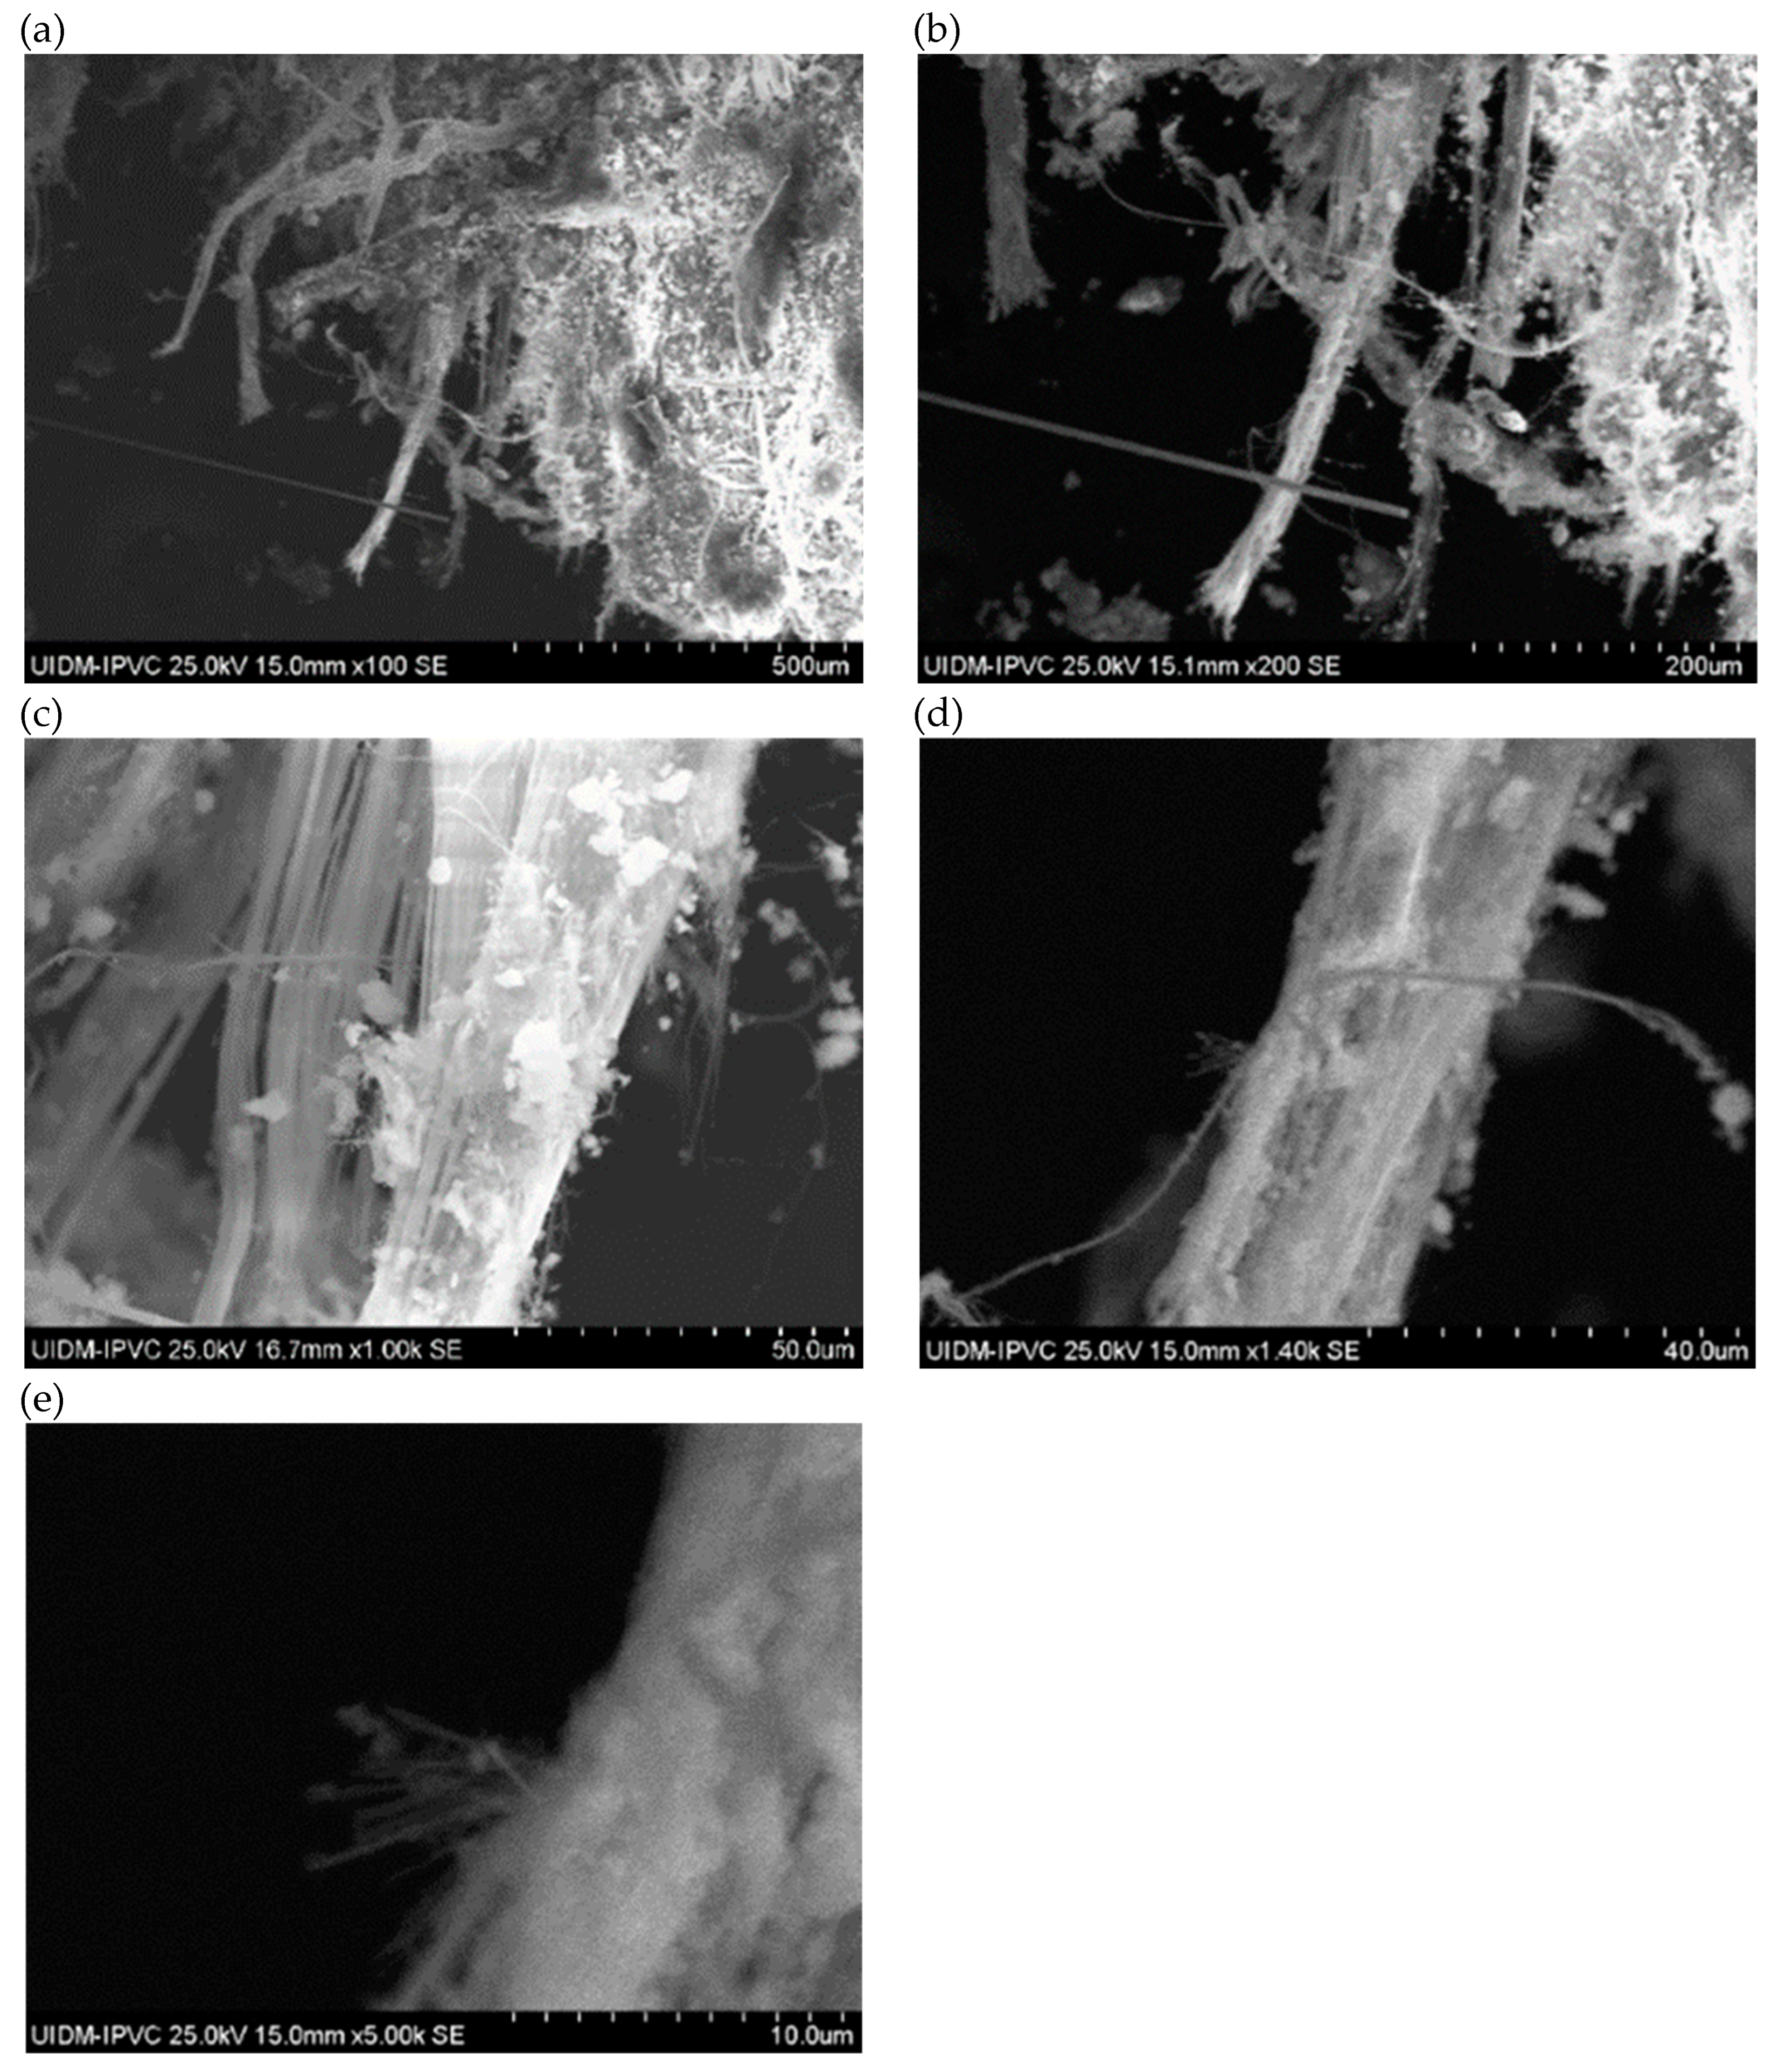
Figure 2.
(a) Sample A powder (2000x magnification); (b) Sample A powder (2000x magnification); and (c) Sample A powder (5500x magnification).
Figure 2.
(a) Sample A powder (2000x magnification); (b) Sample A powder (2000x magnification); and (c) Sample A powder (5500x magnification).
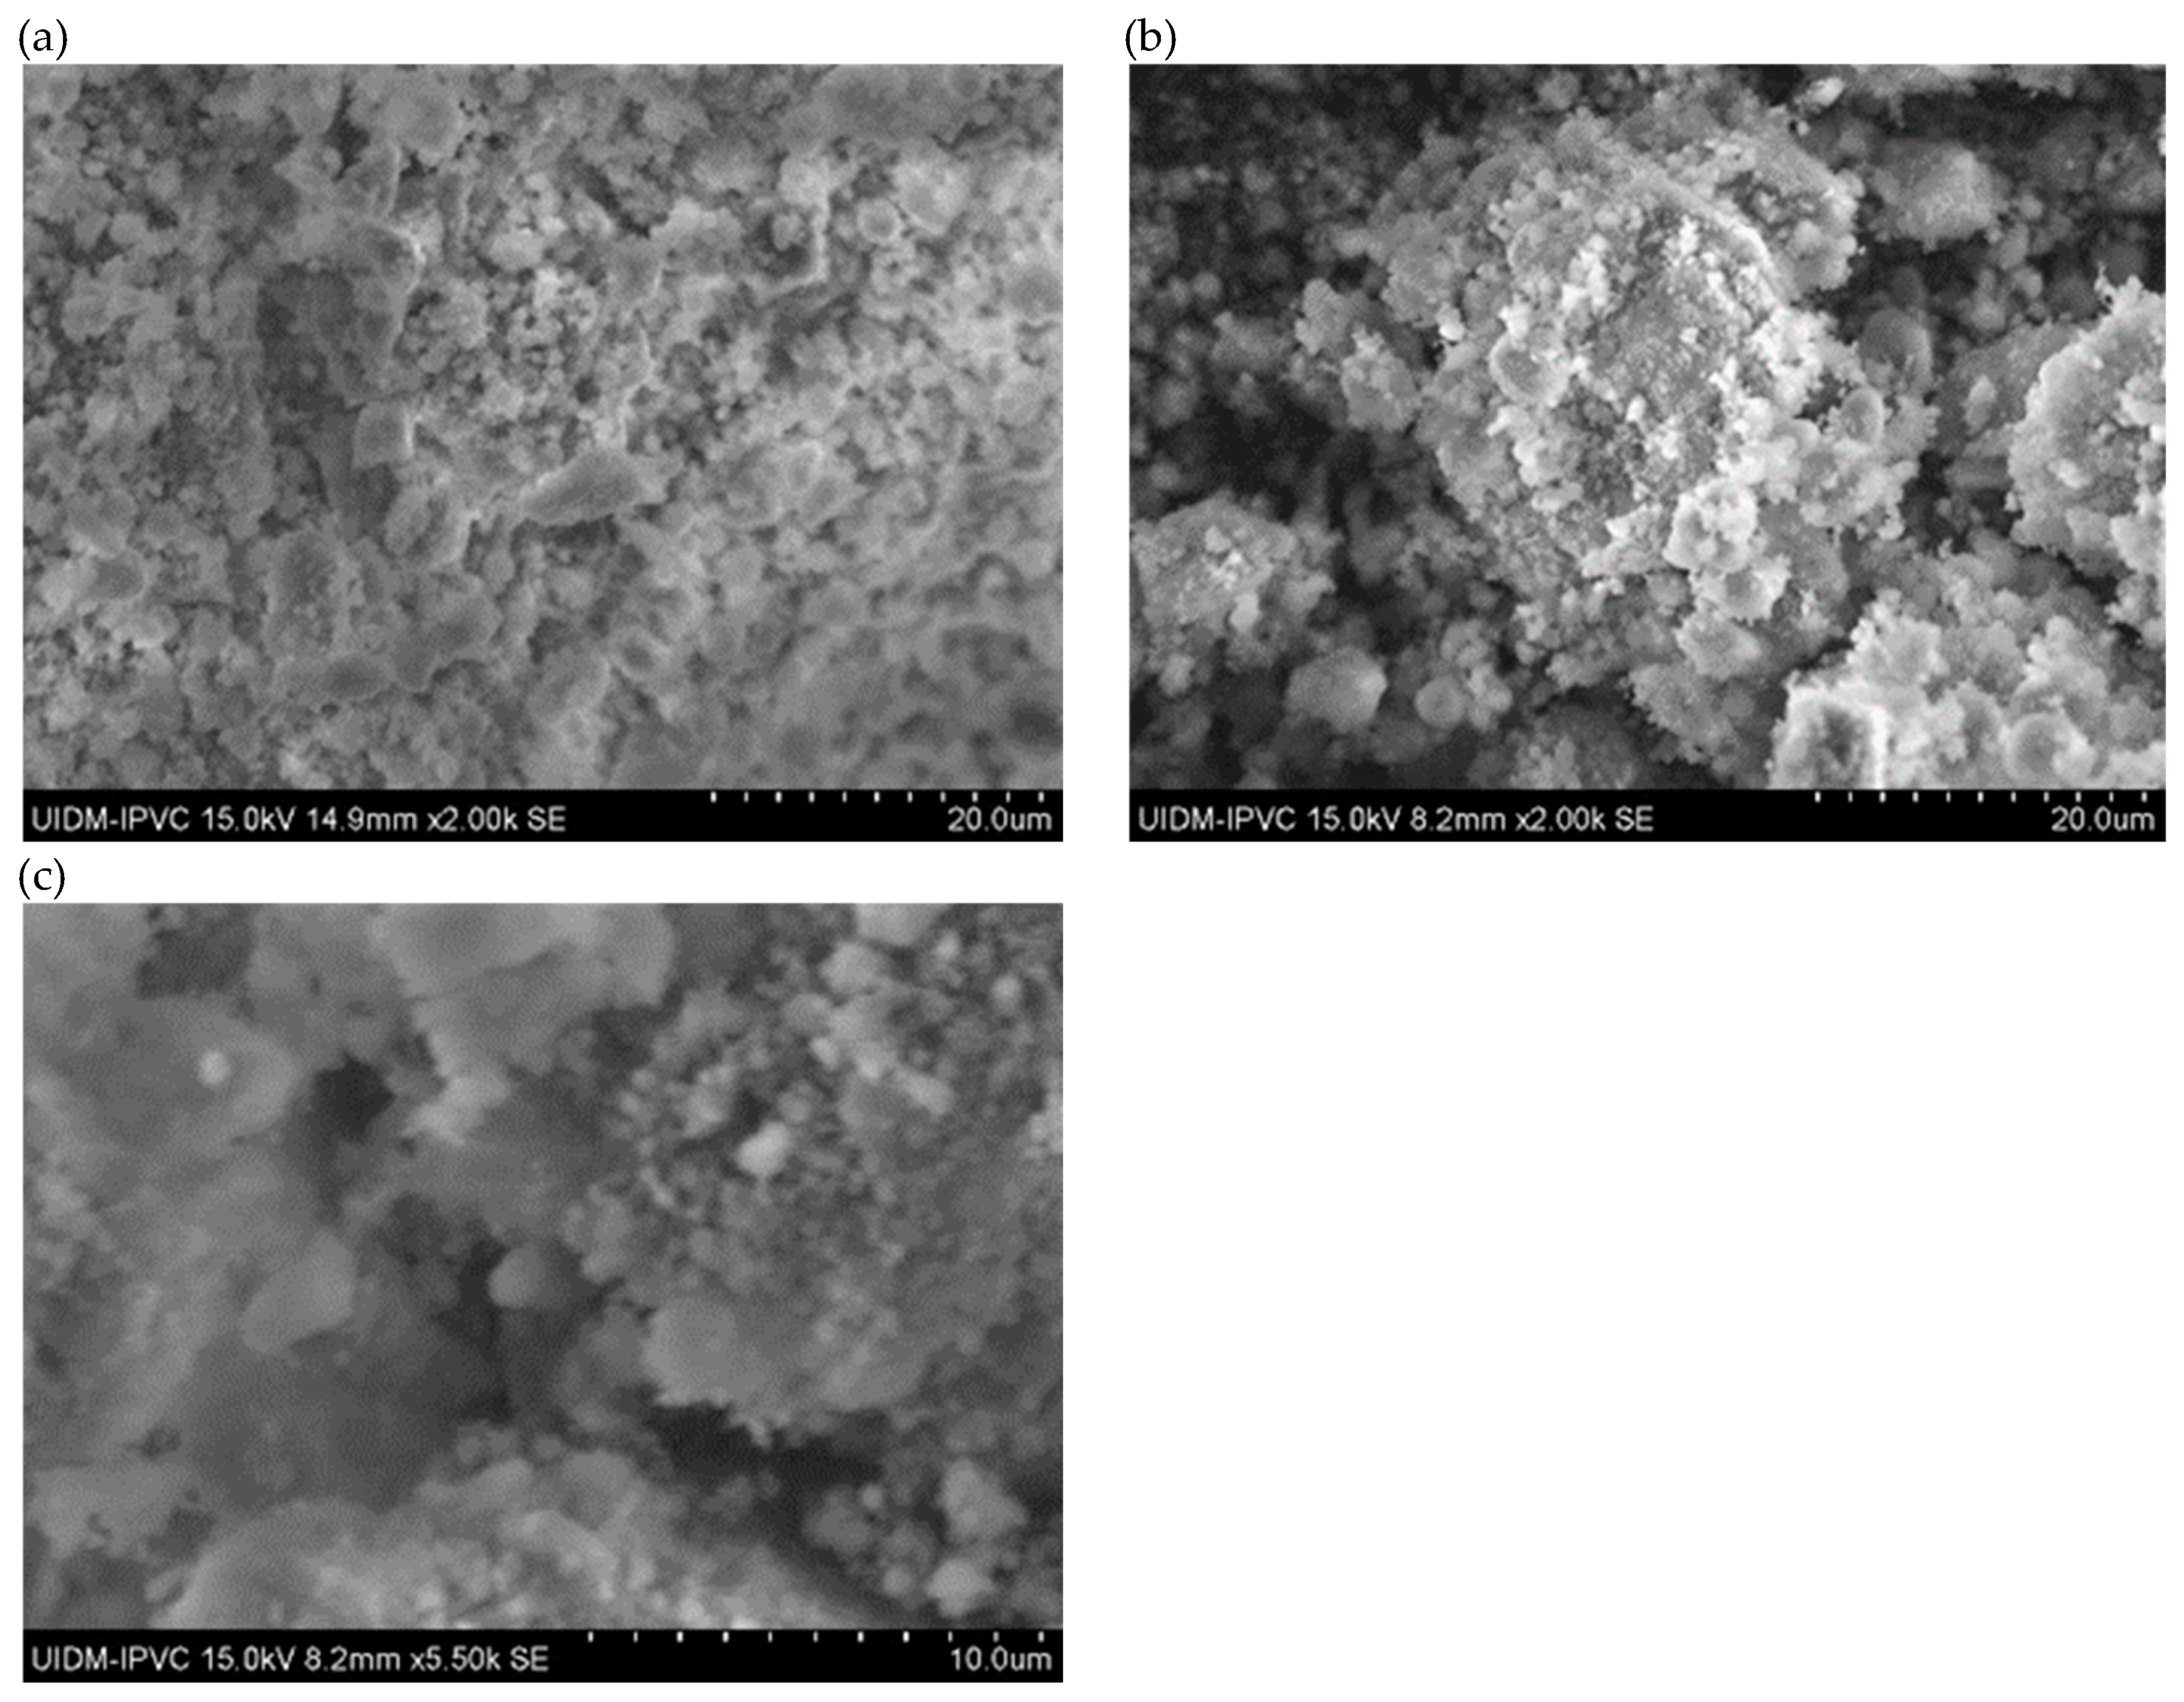
Figure 3.
(a) Sample B plate (50x magnification); (b) Sample B plate (200x magnification); (c) Sample B plate (500x magnification); (d) Sample B powder; and (e) Sample B powder.
Figure 3.
(a) Sample B plate (50x magnification); (b) Sample B plate (200x magnification); (c) Sample B plate (500x magnification); (d) Sample B powder; and (e) Sample B powder.
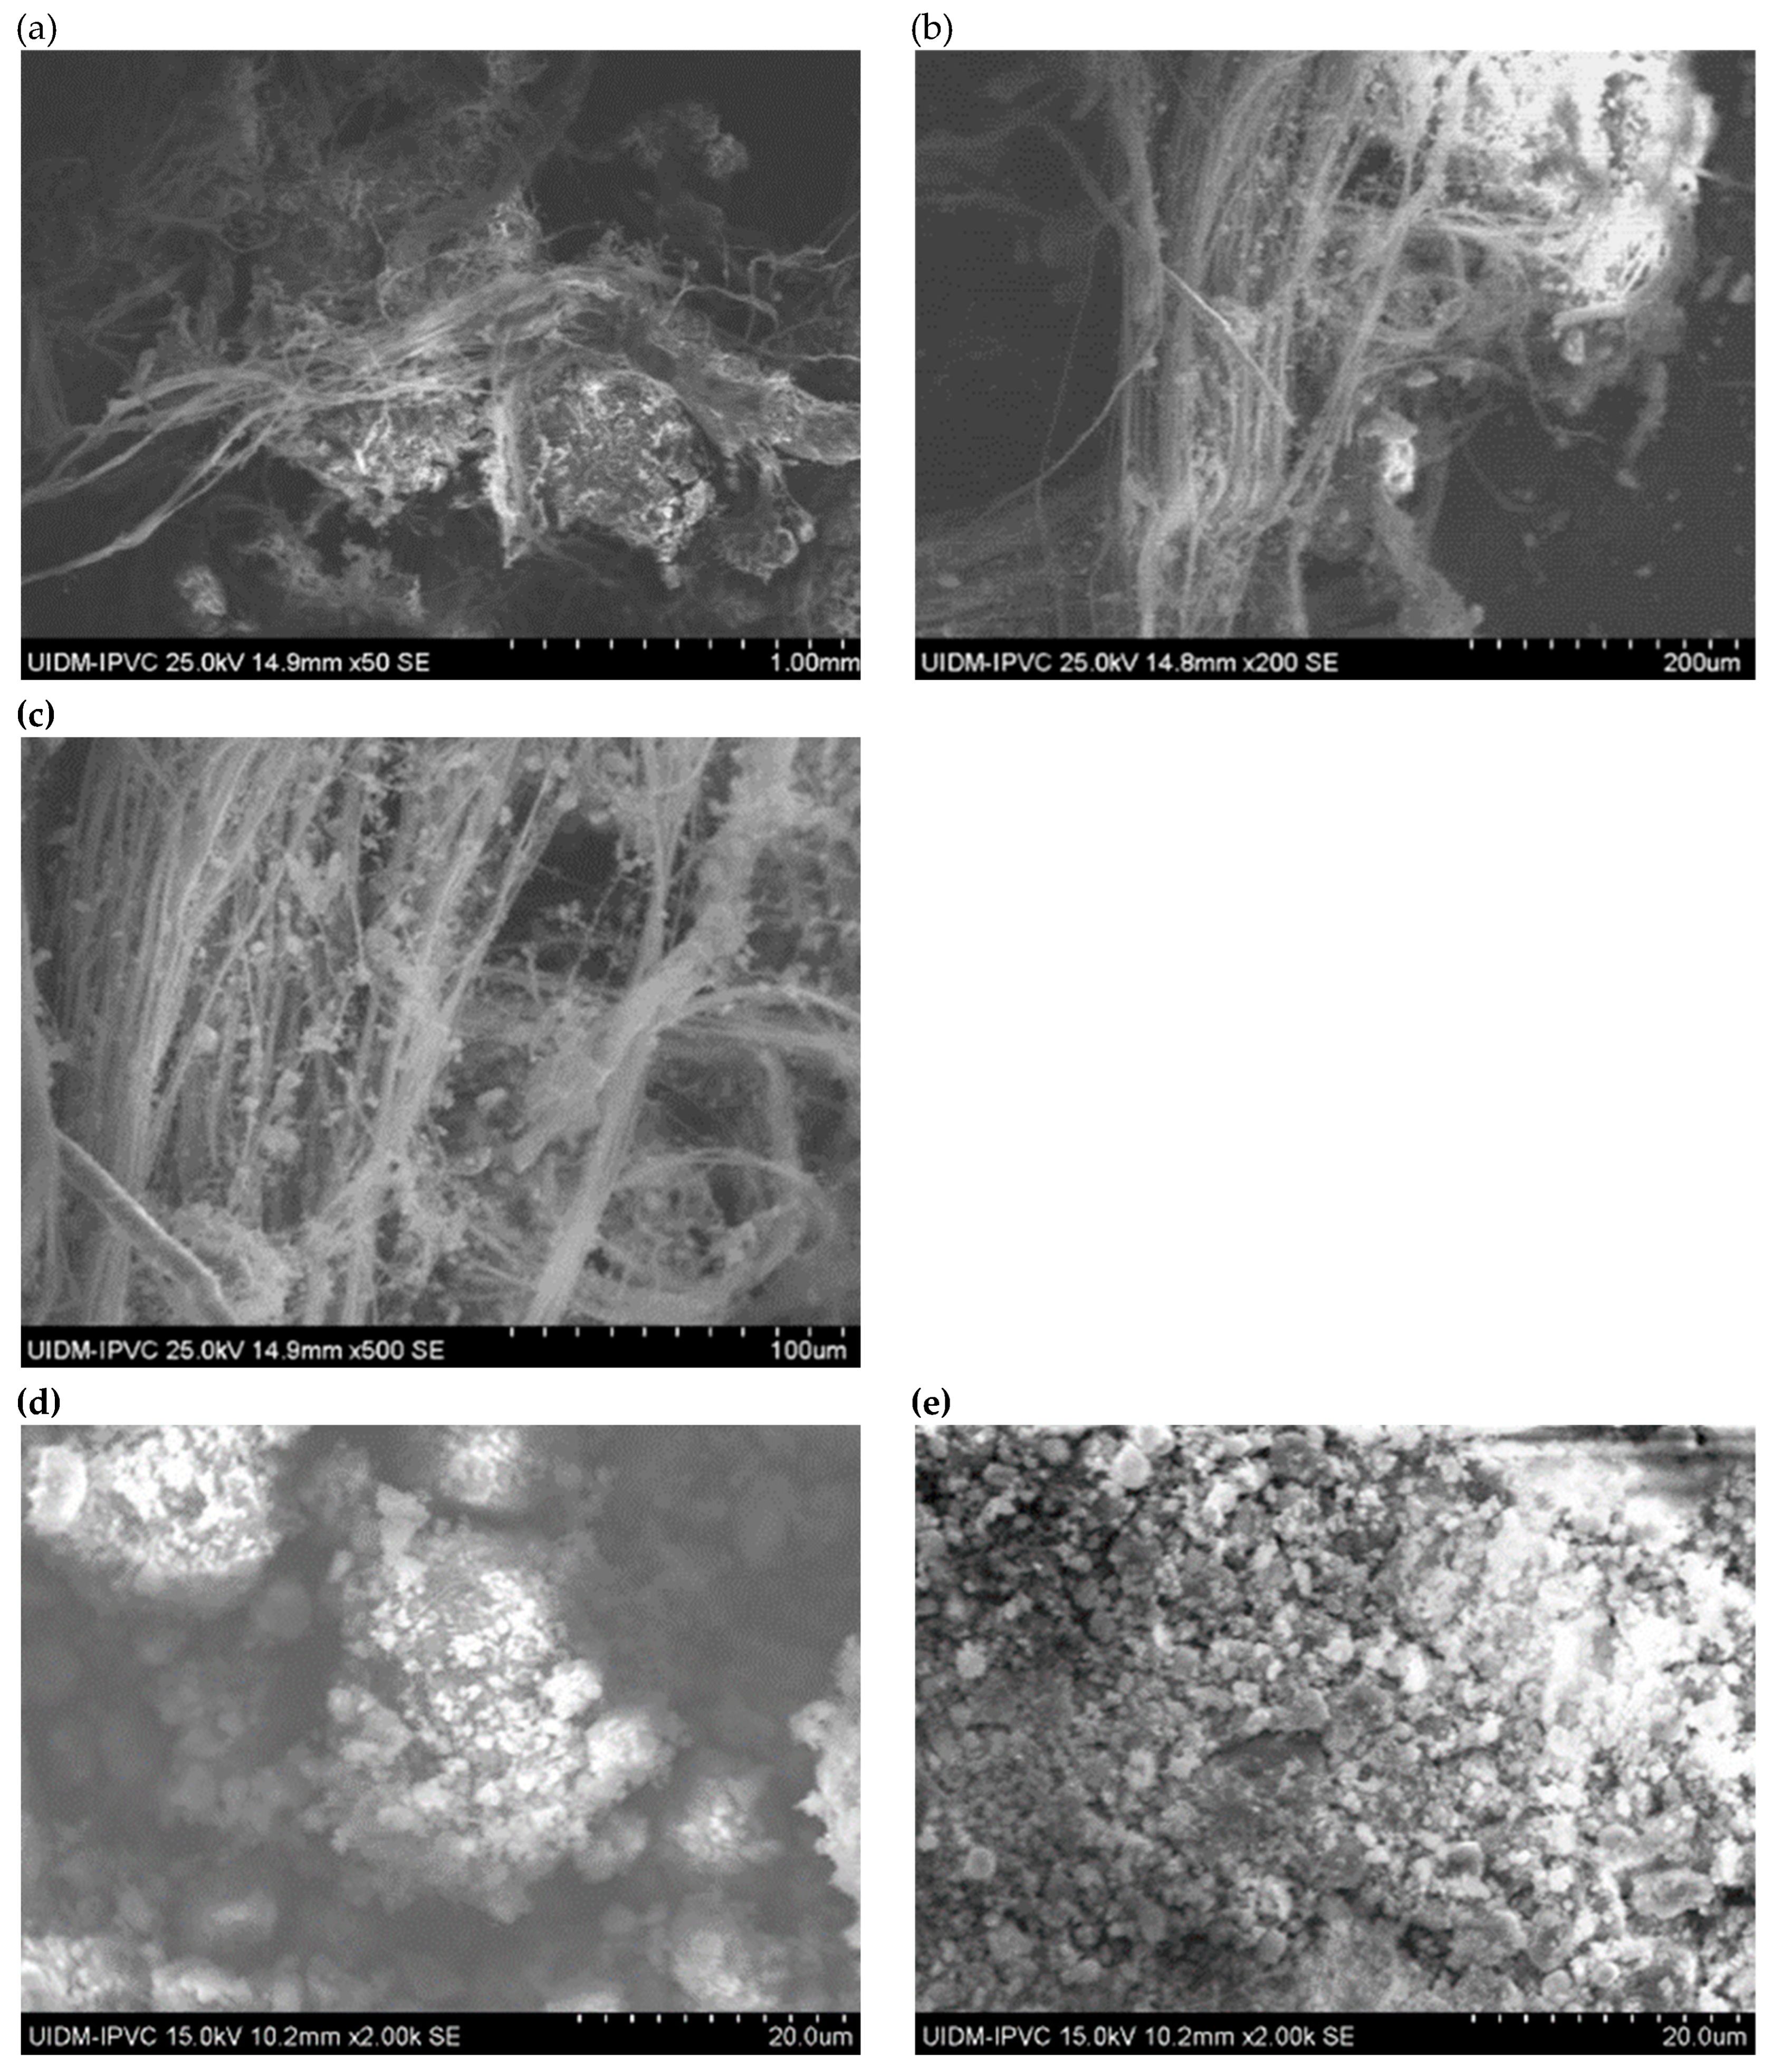
Figure 4.
(a) and (b) Sample C plate (various magnifications); and (c) and (d) Sample C powder.
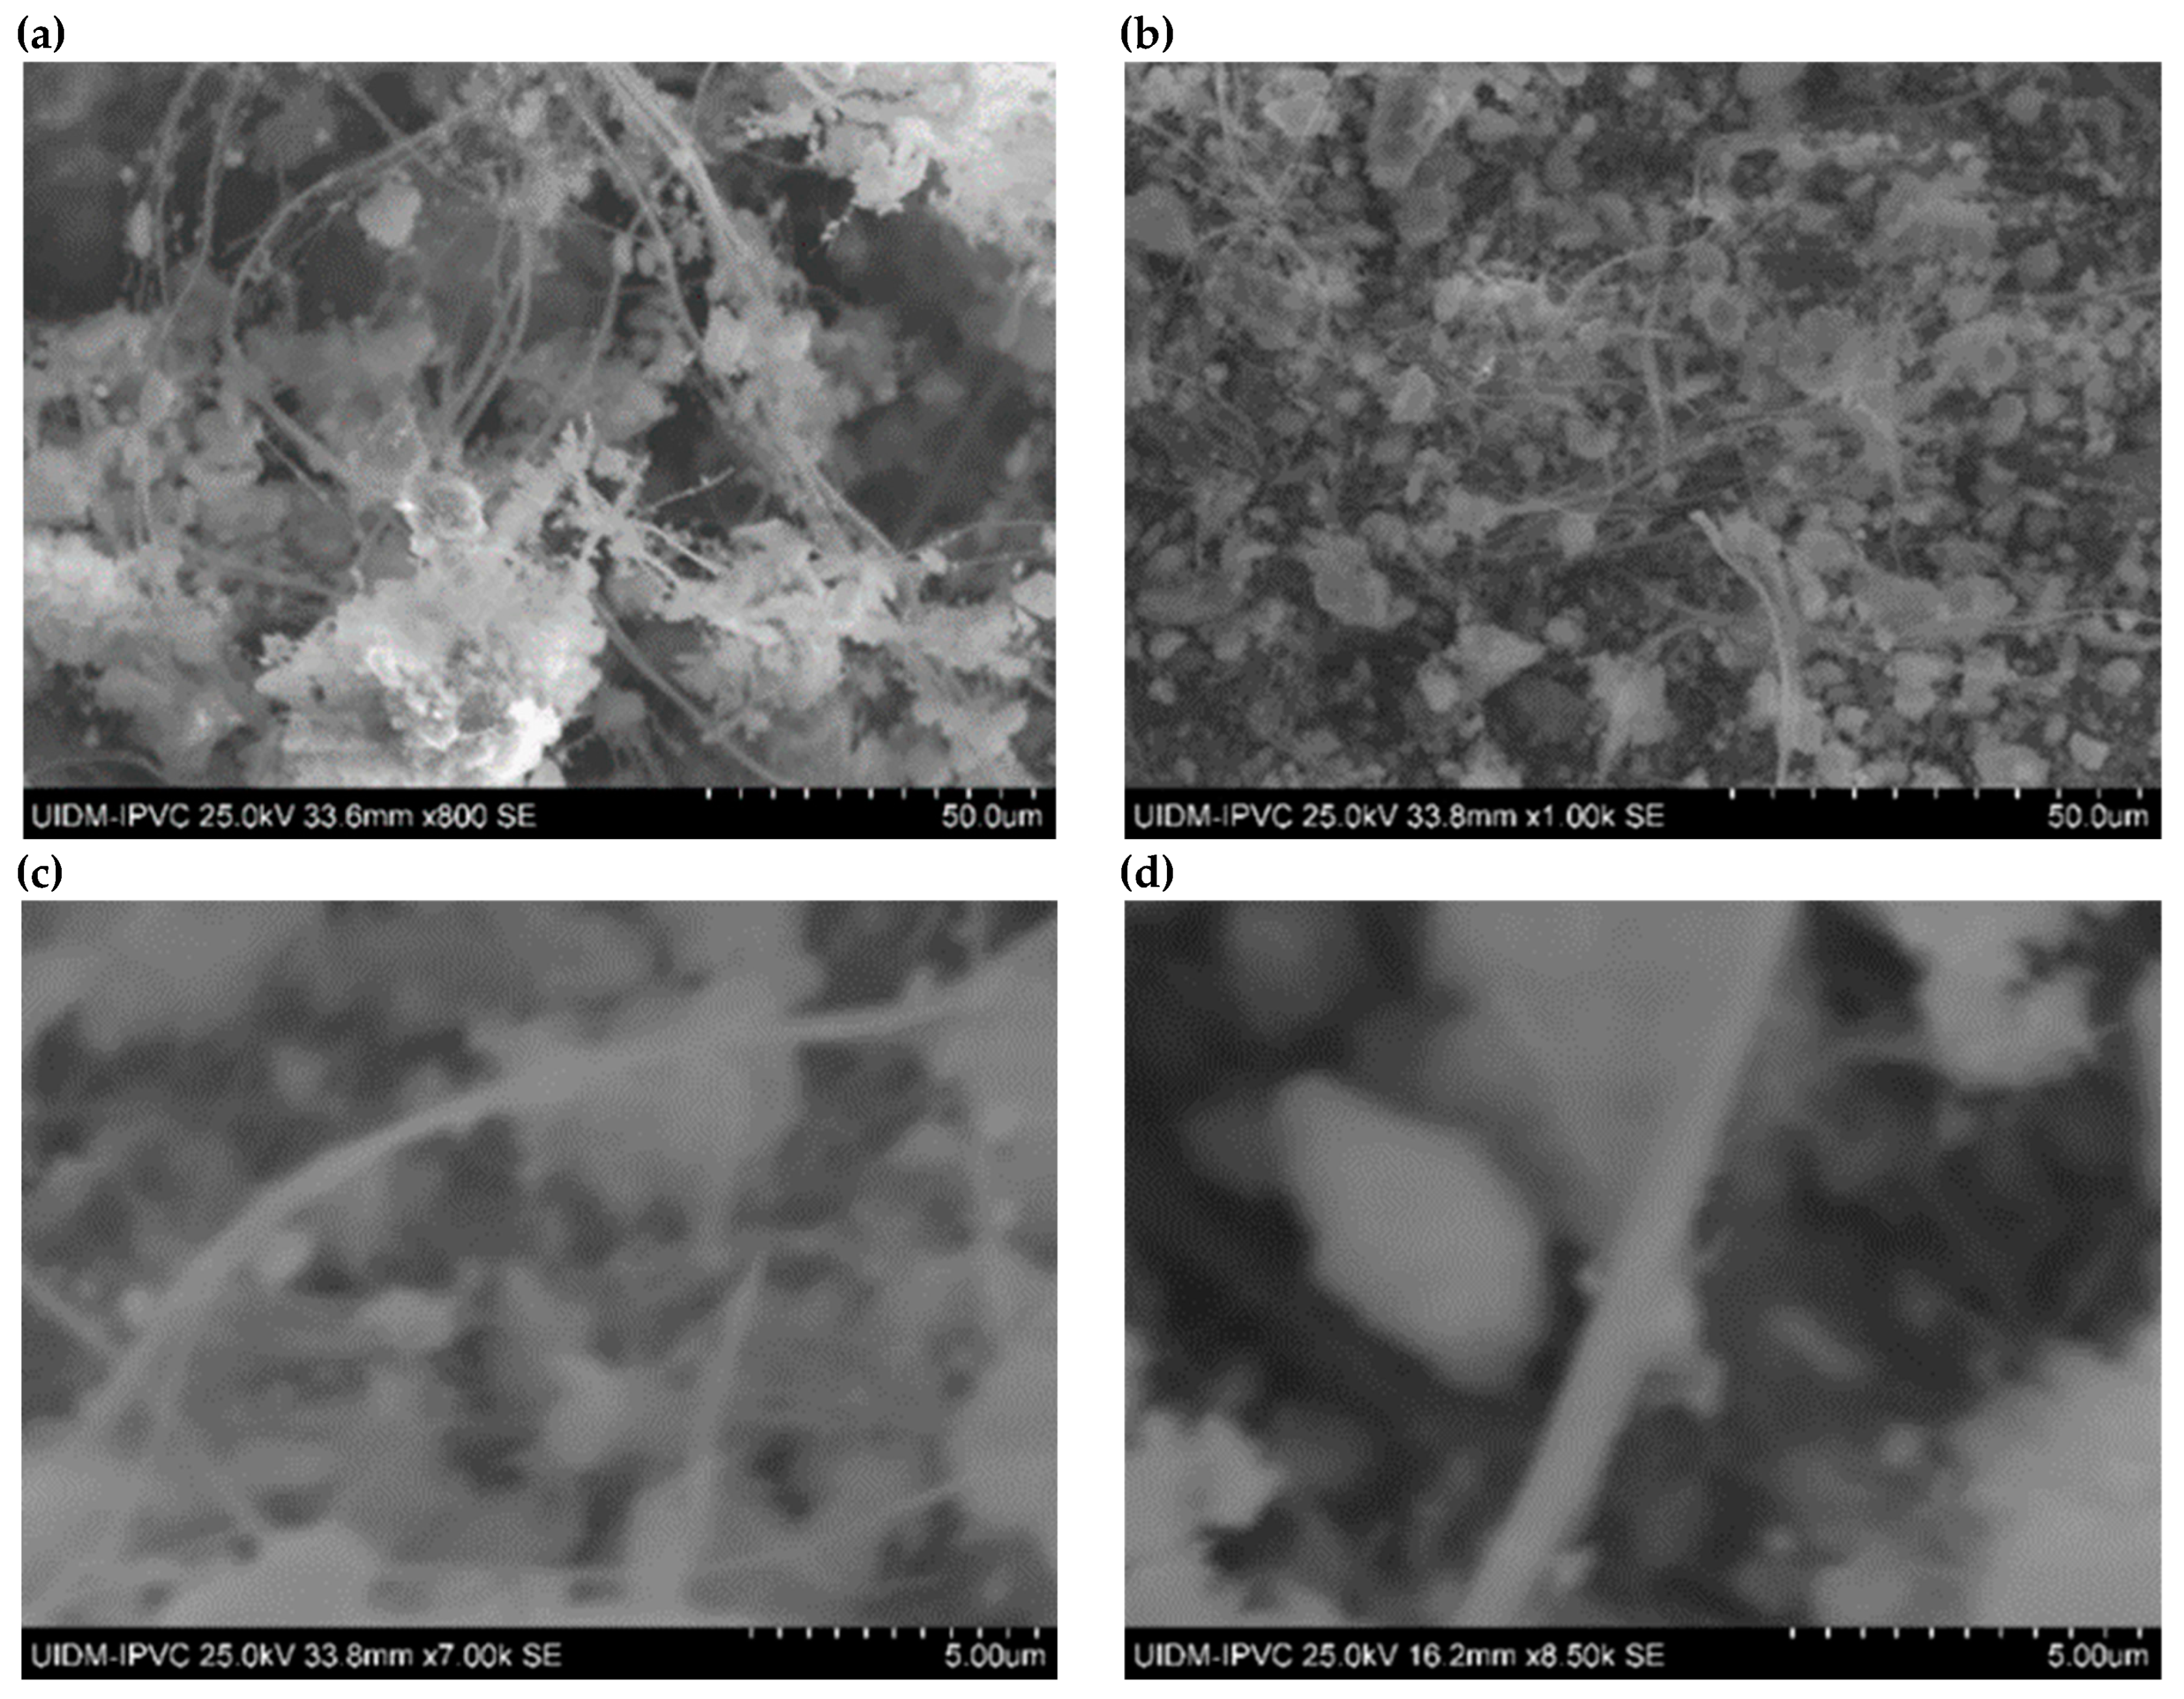
Figure 5.
(a) to (c) Sample C in powder form.
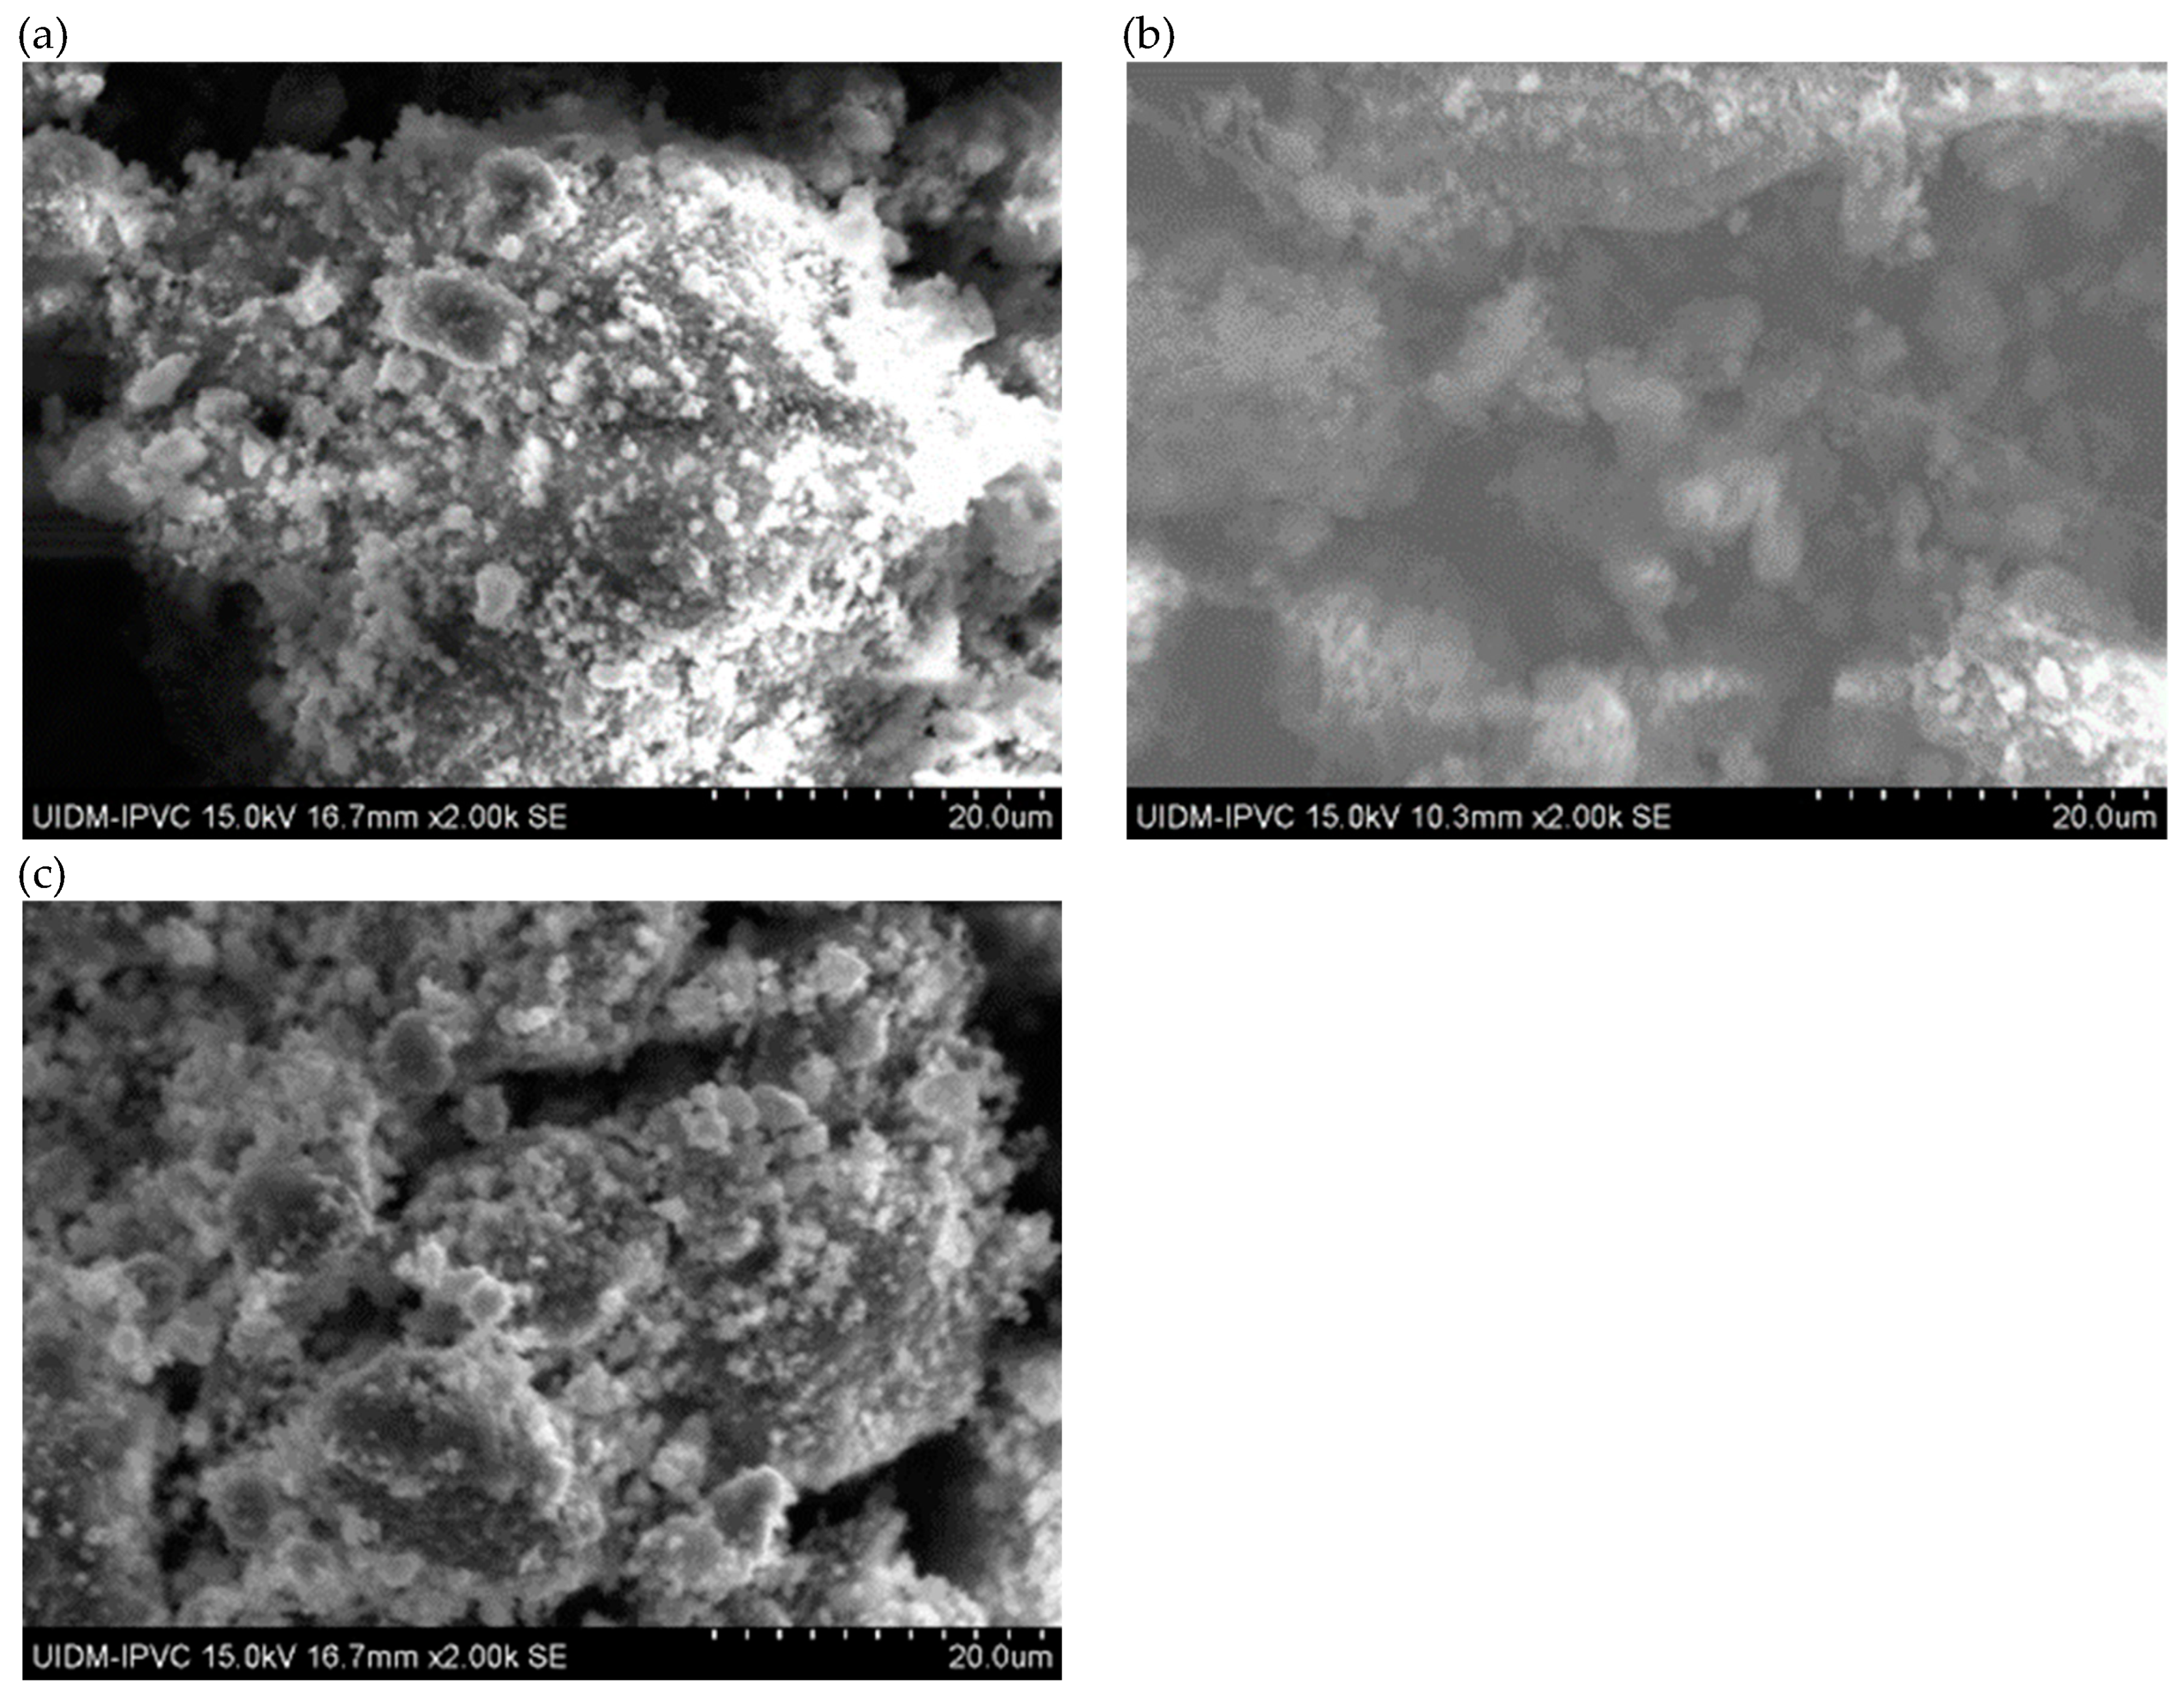
Figure 6.
(a) to (d) Sample D plate (various magnifications).
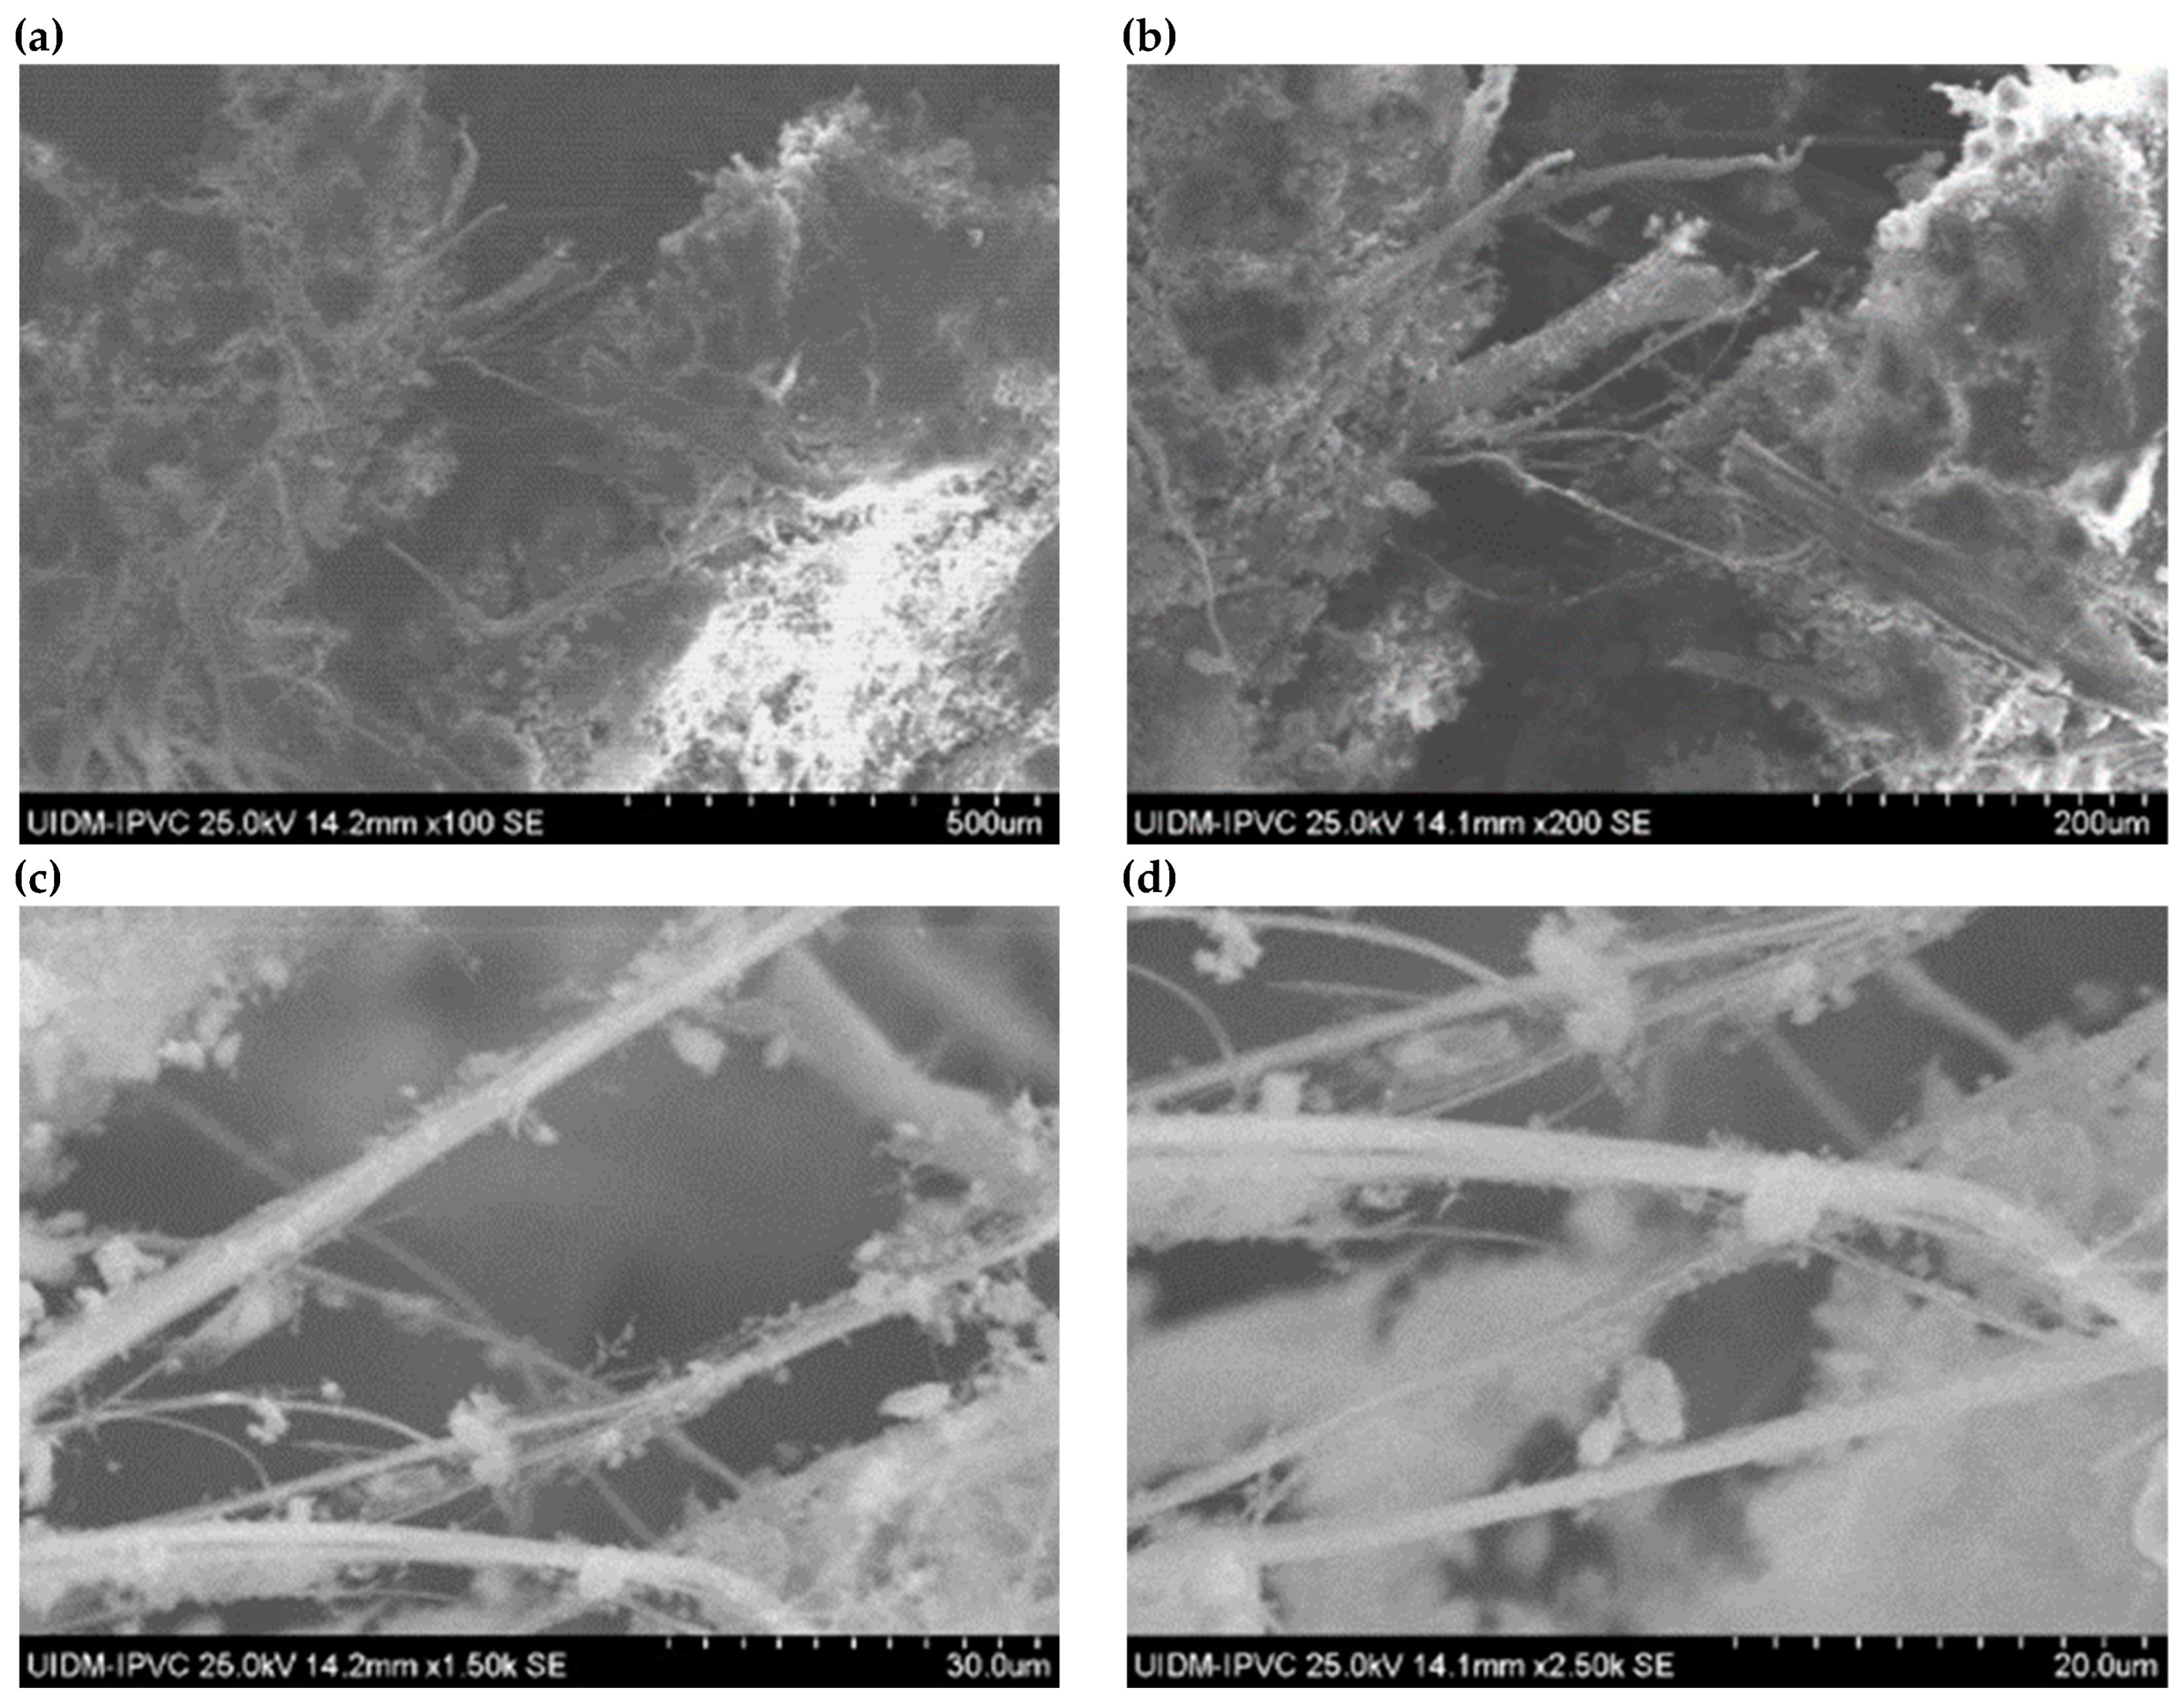
Figure 7.
(a) and (b) Sample D powder.
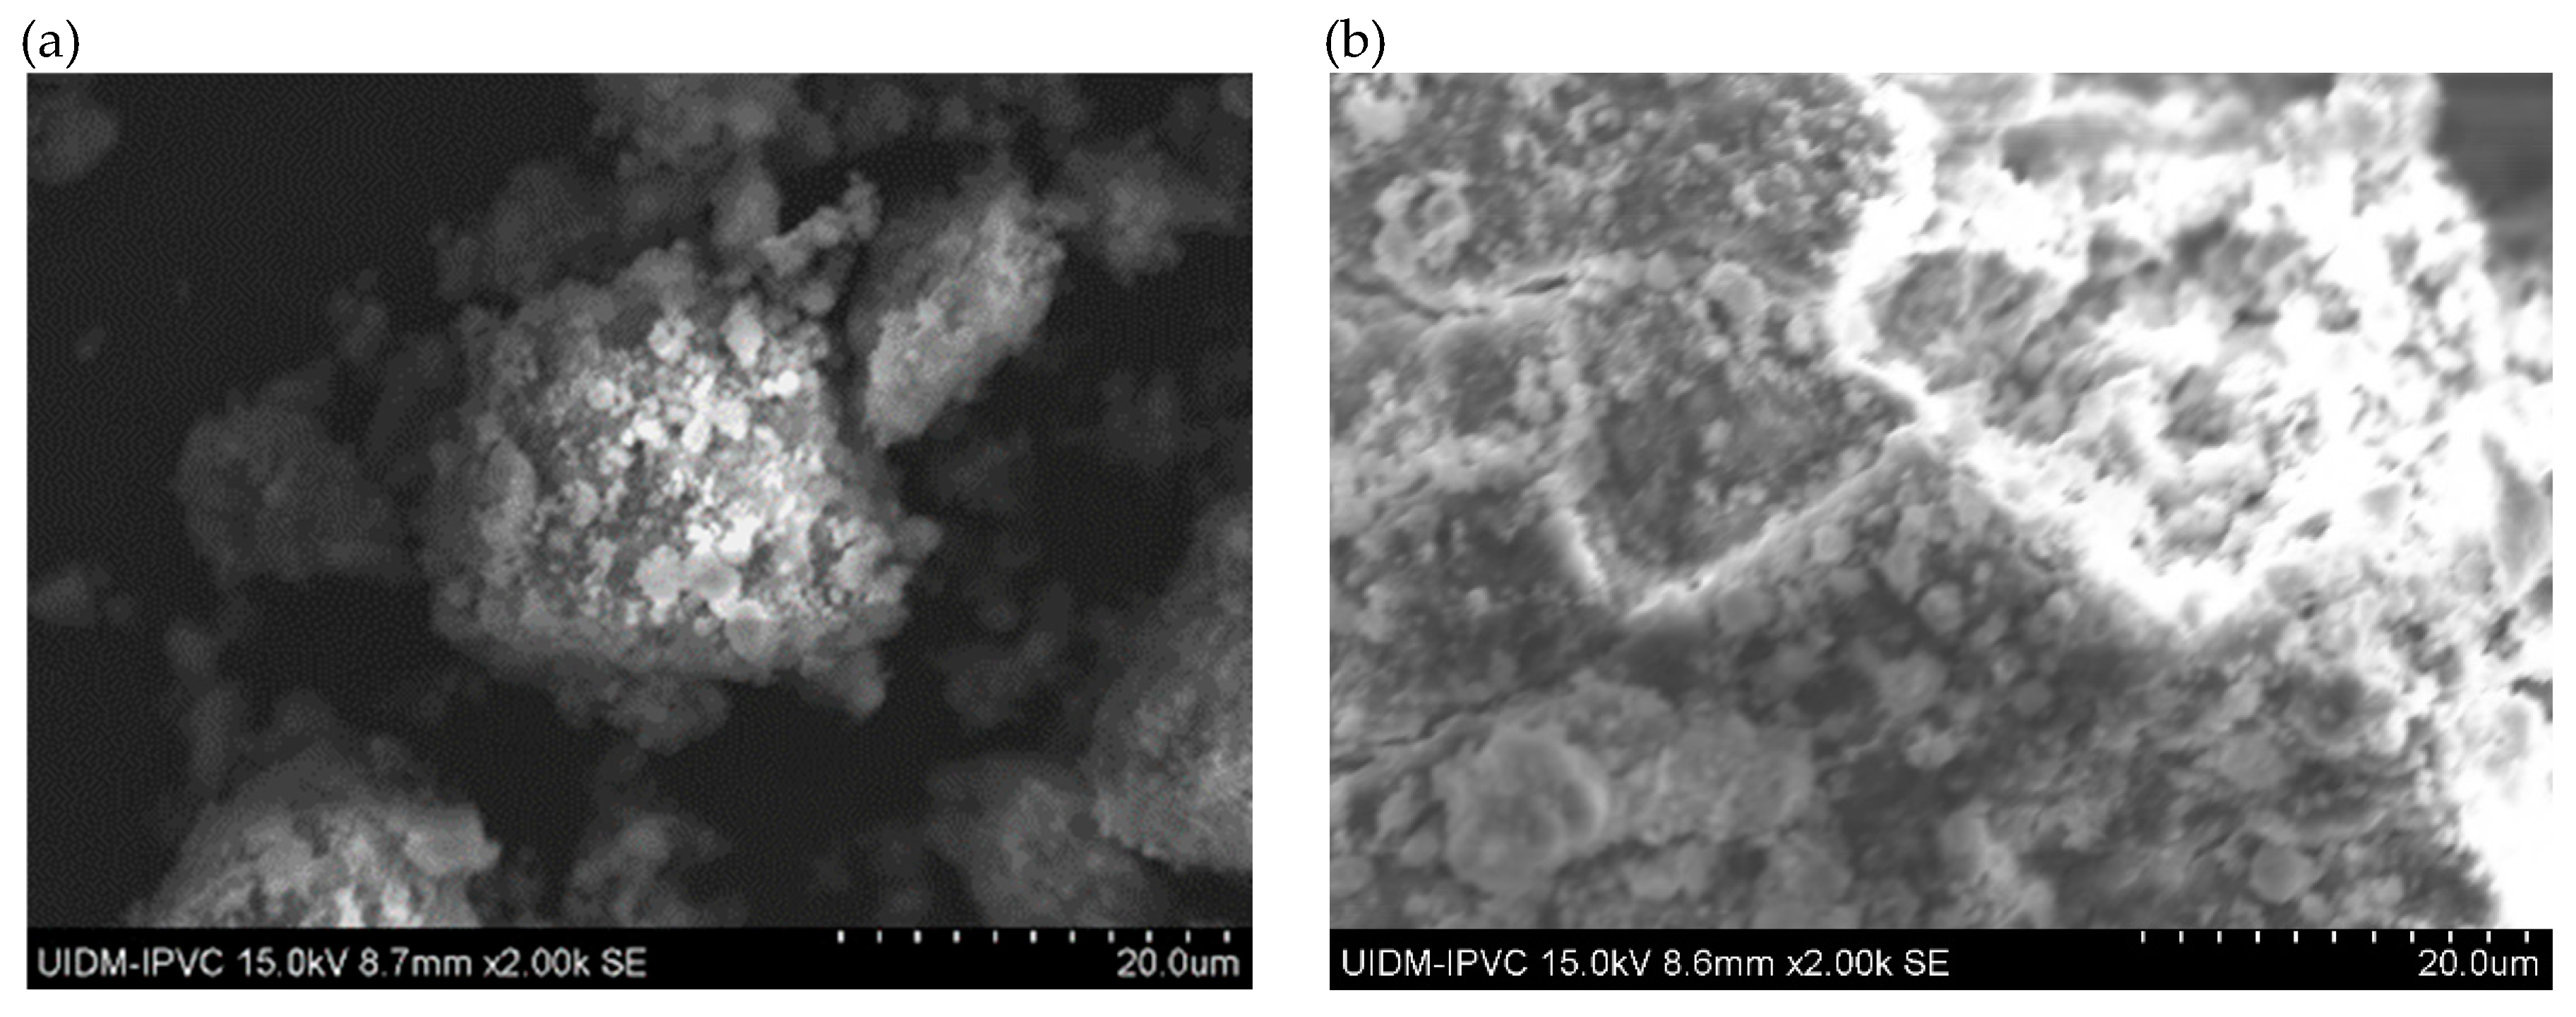
Figure 8.
(a) to (j) SEM-EDS images of Sample A plate (elemental distribution).
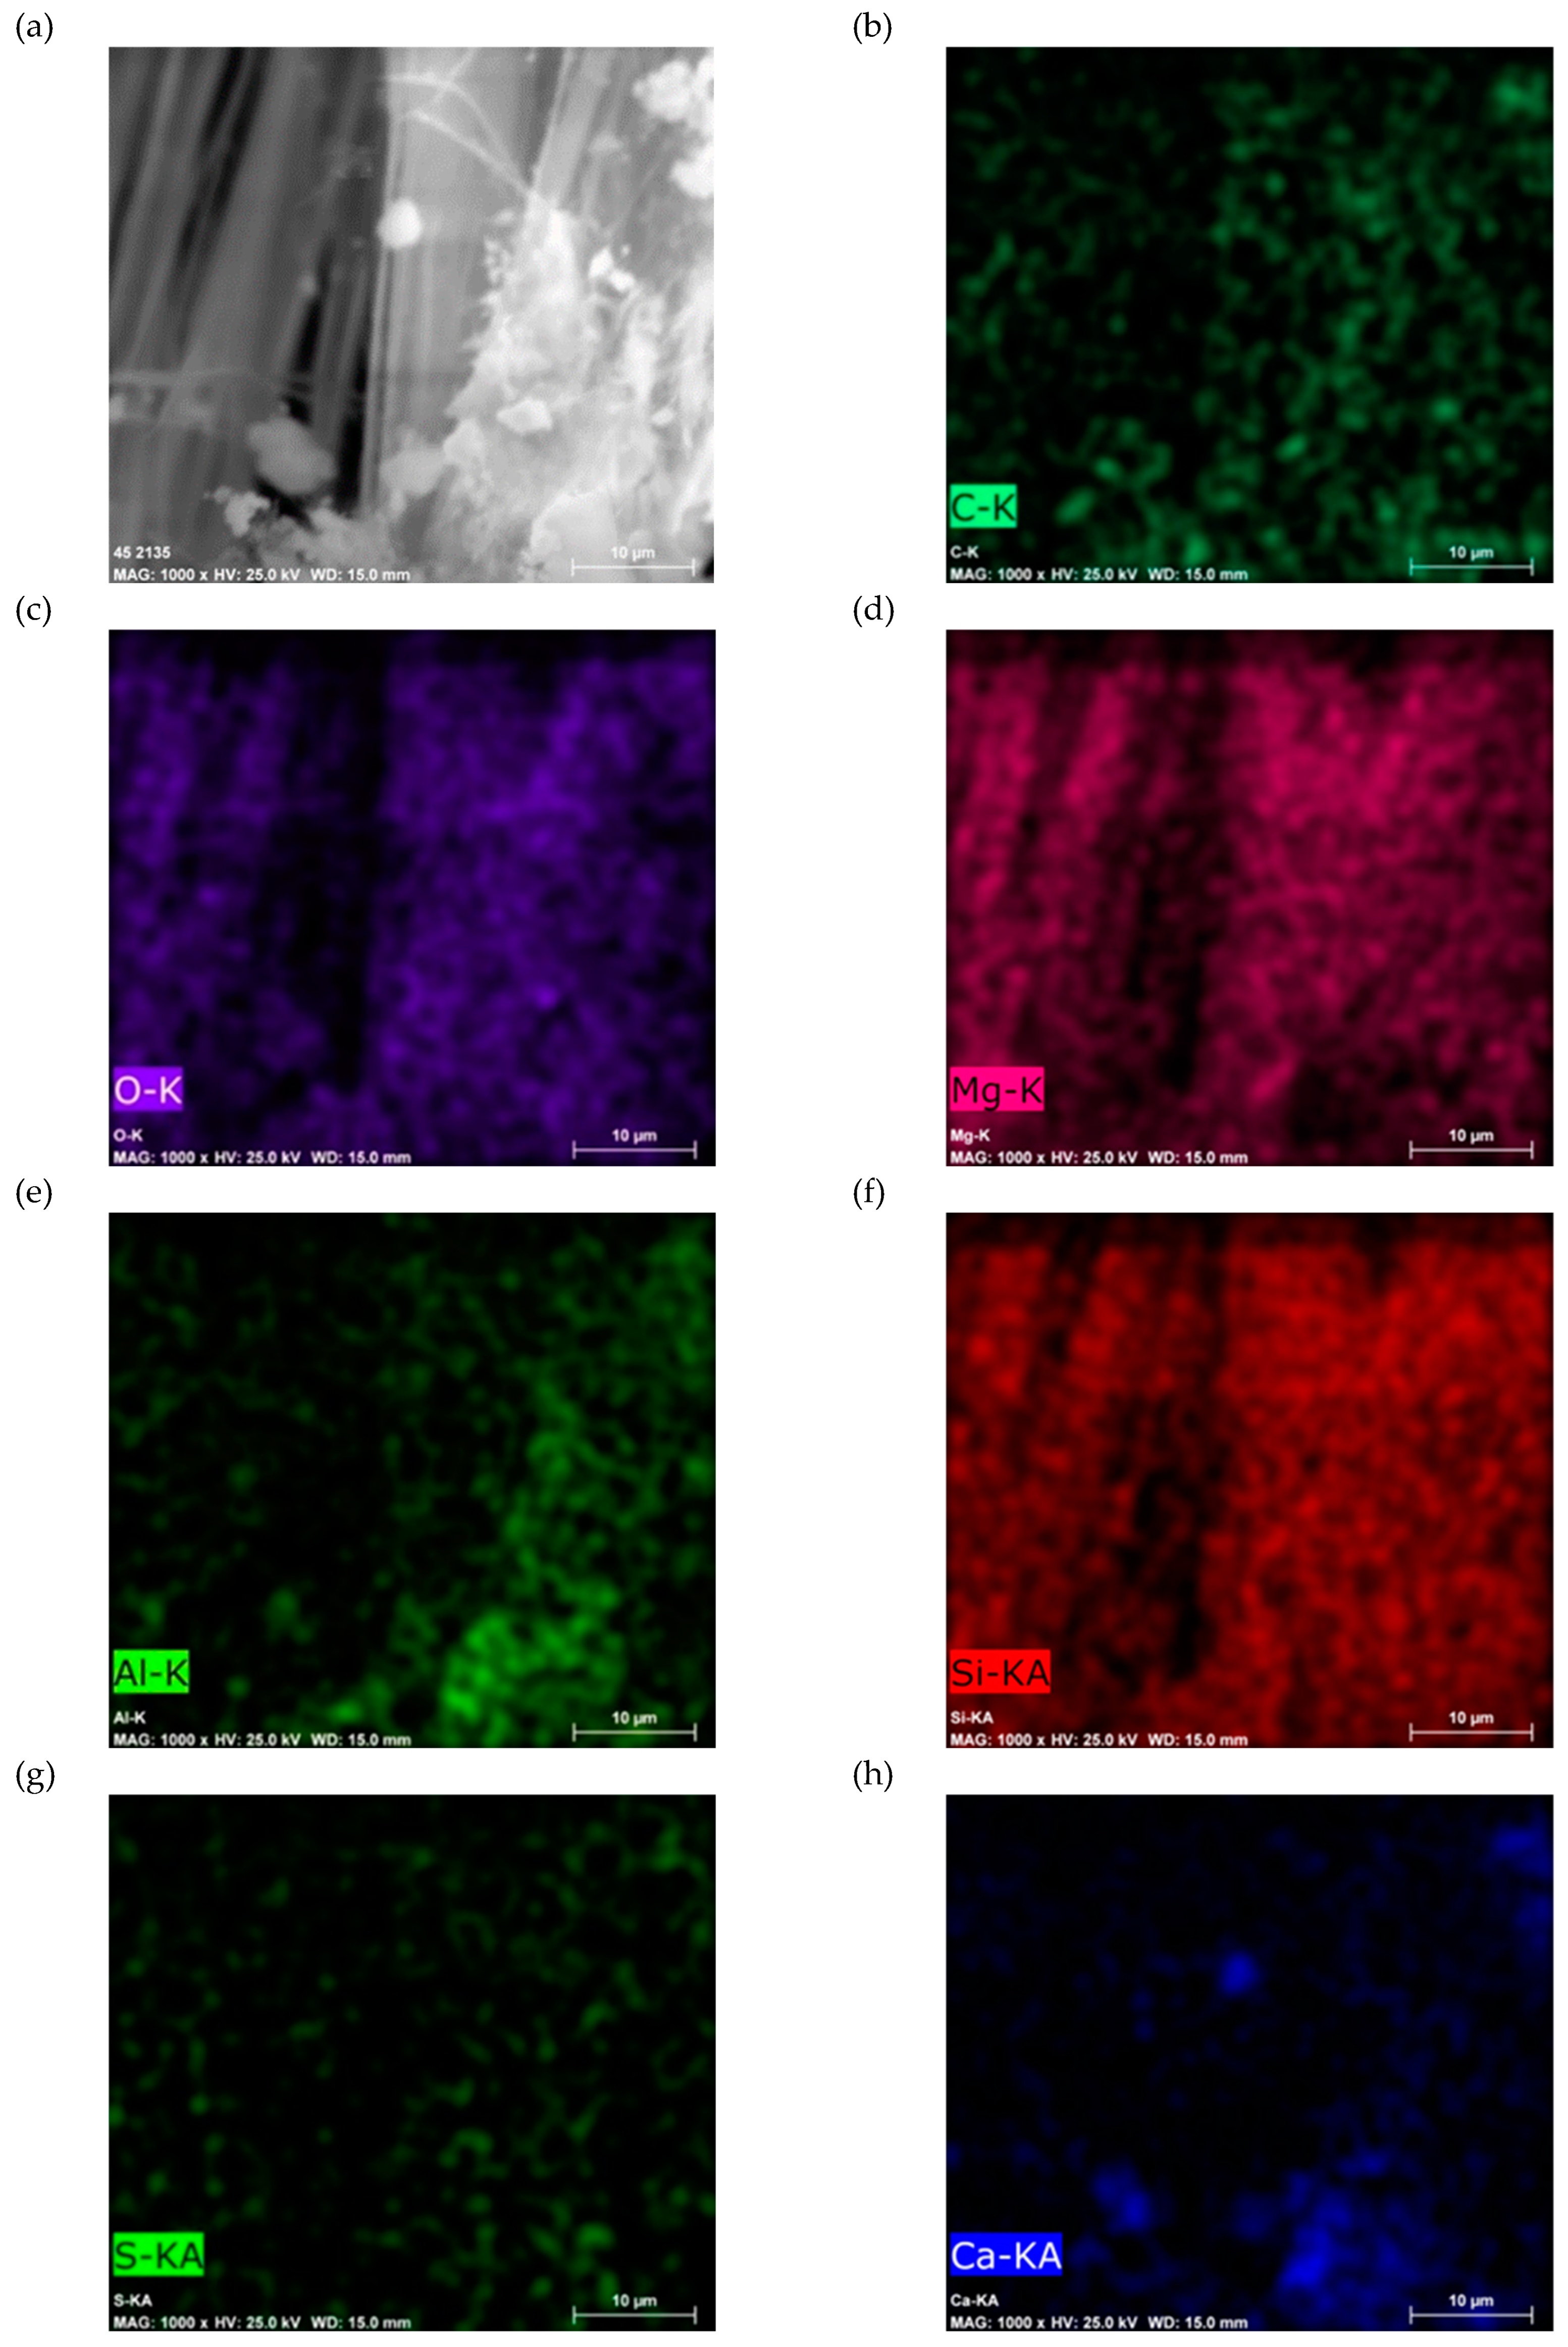
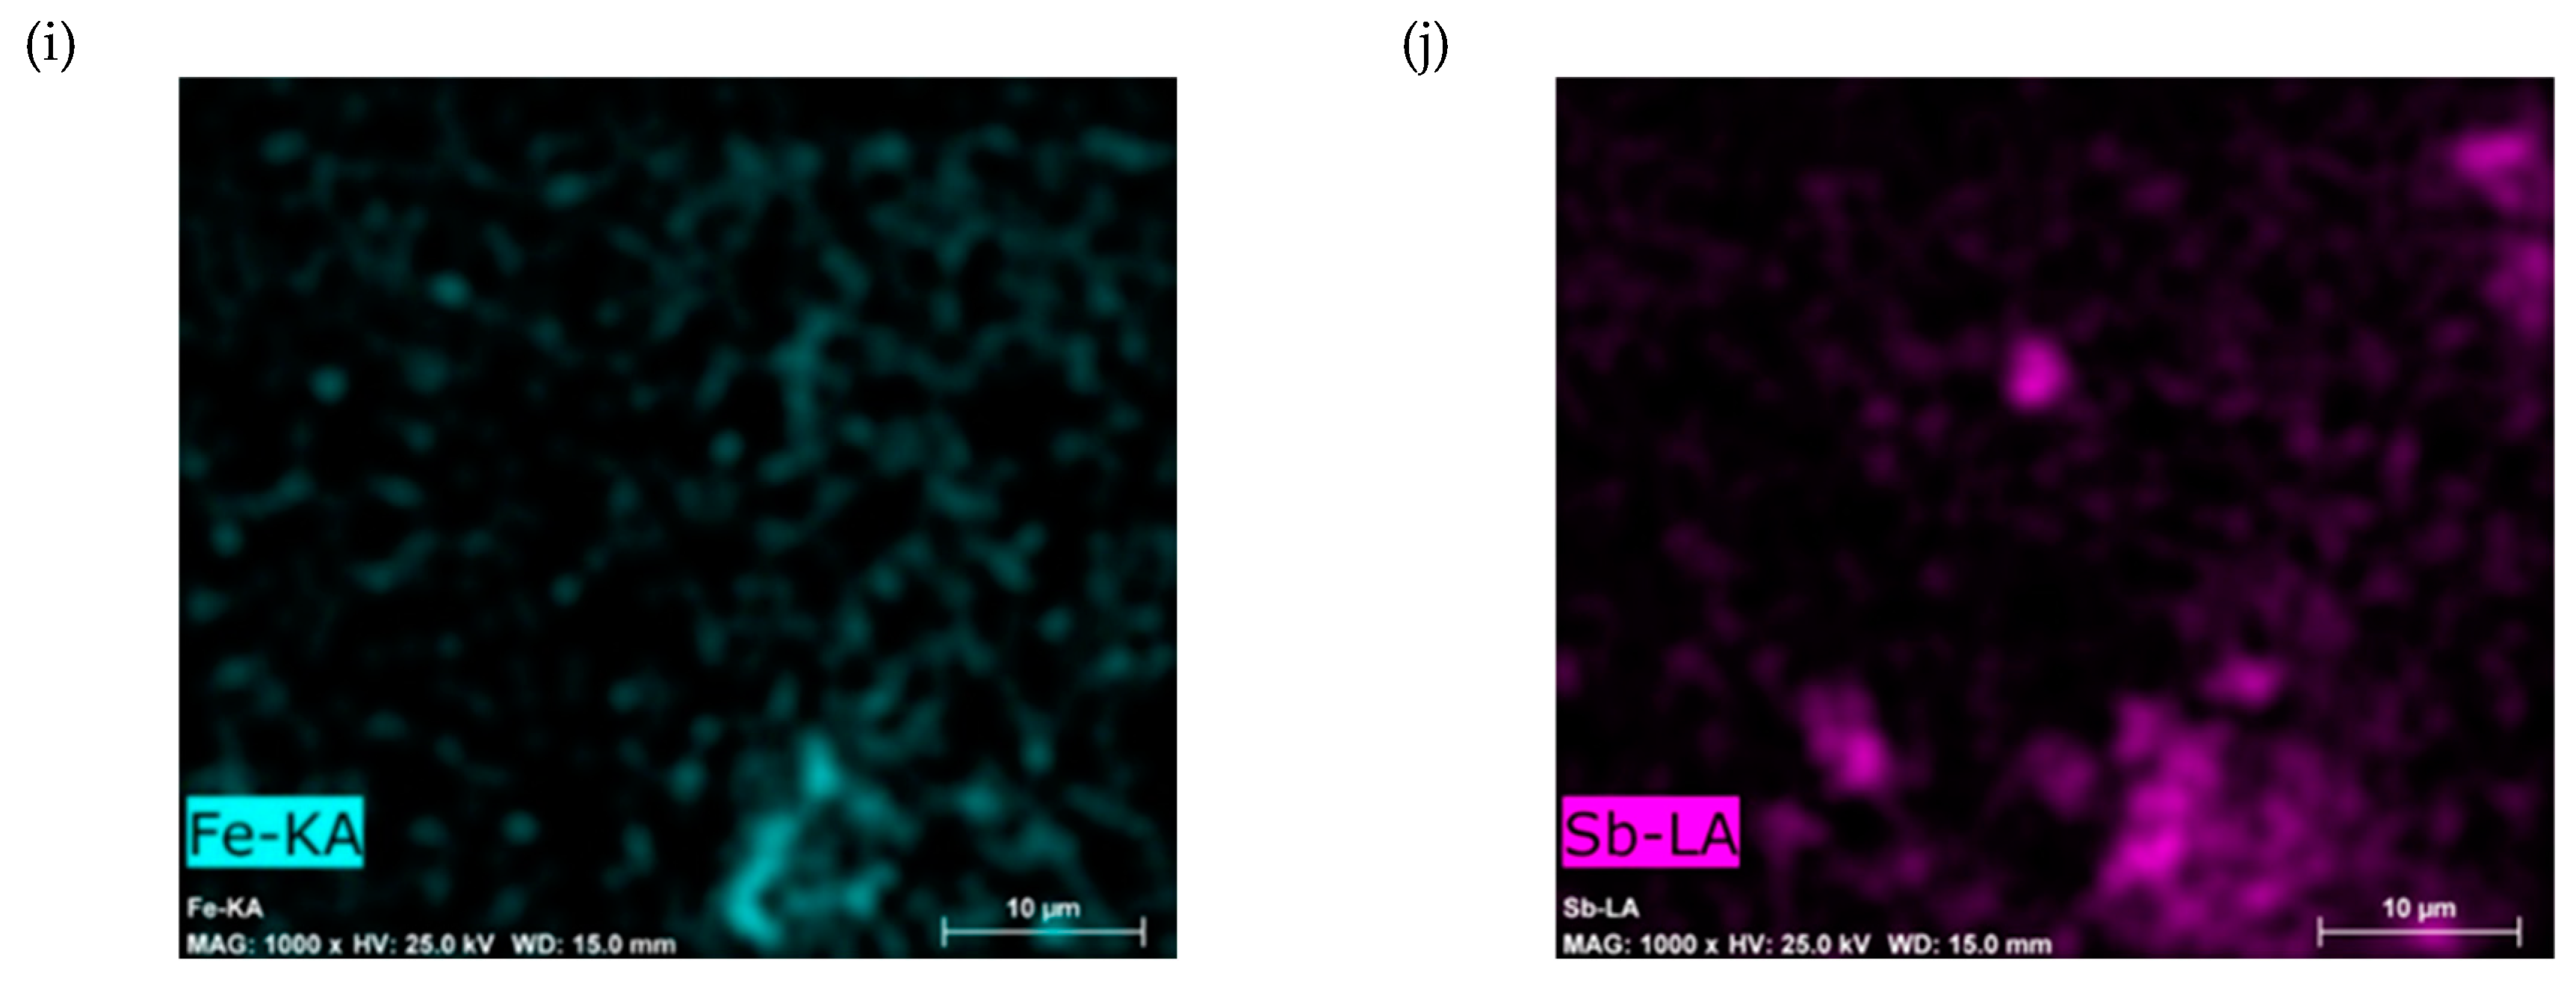
Figure 9.
(a) to (h) SEM-EDS images of Sample A powder.
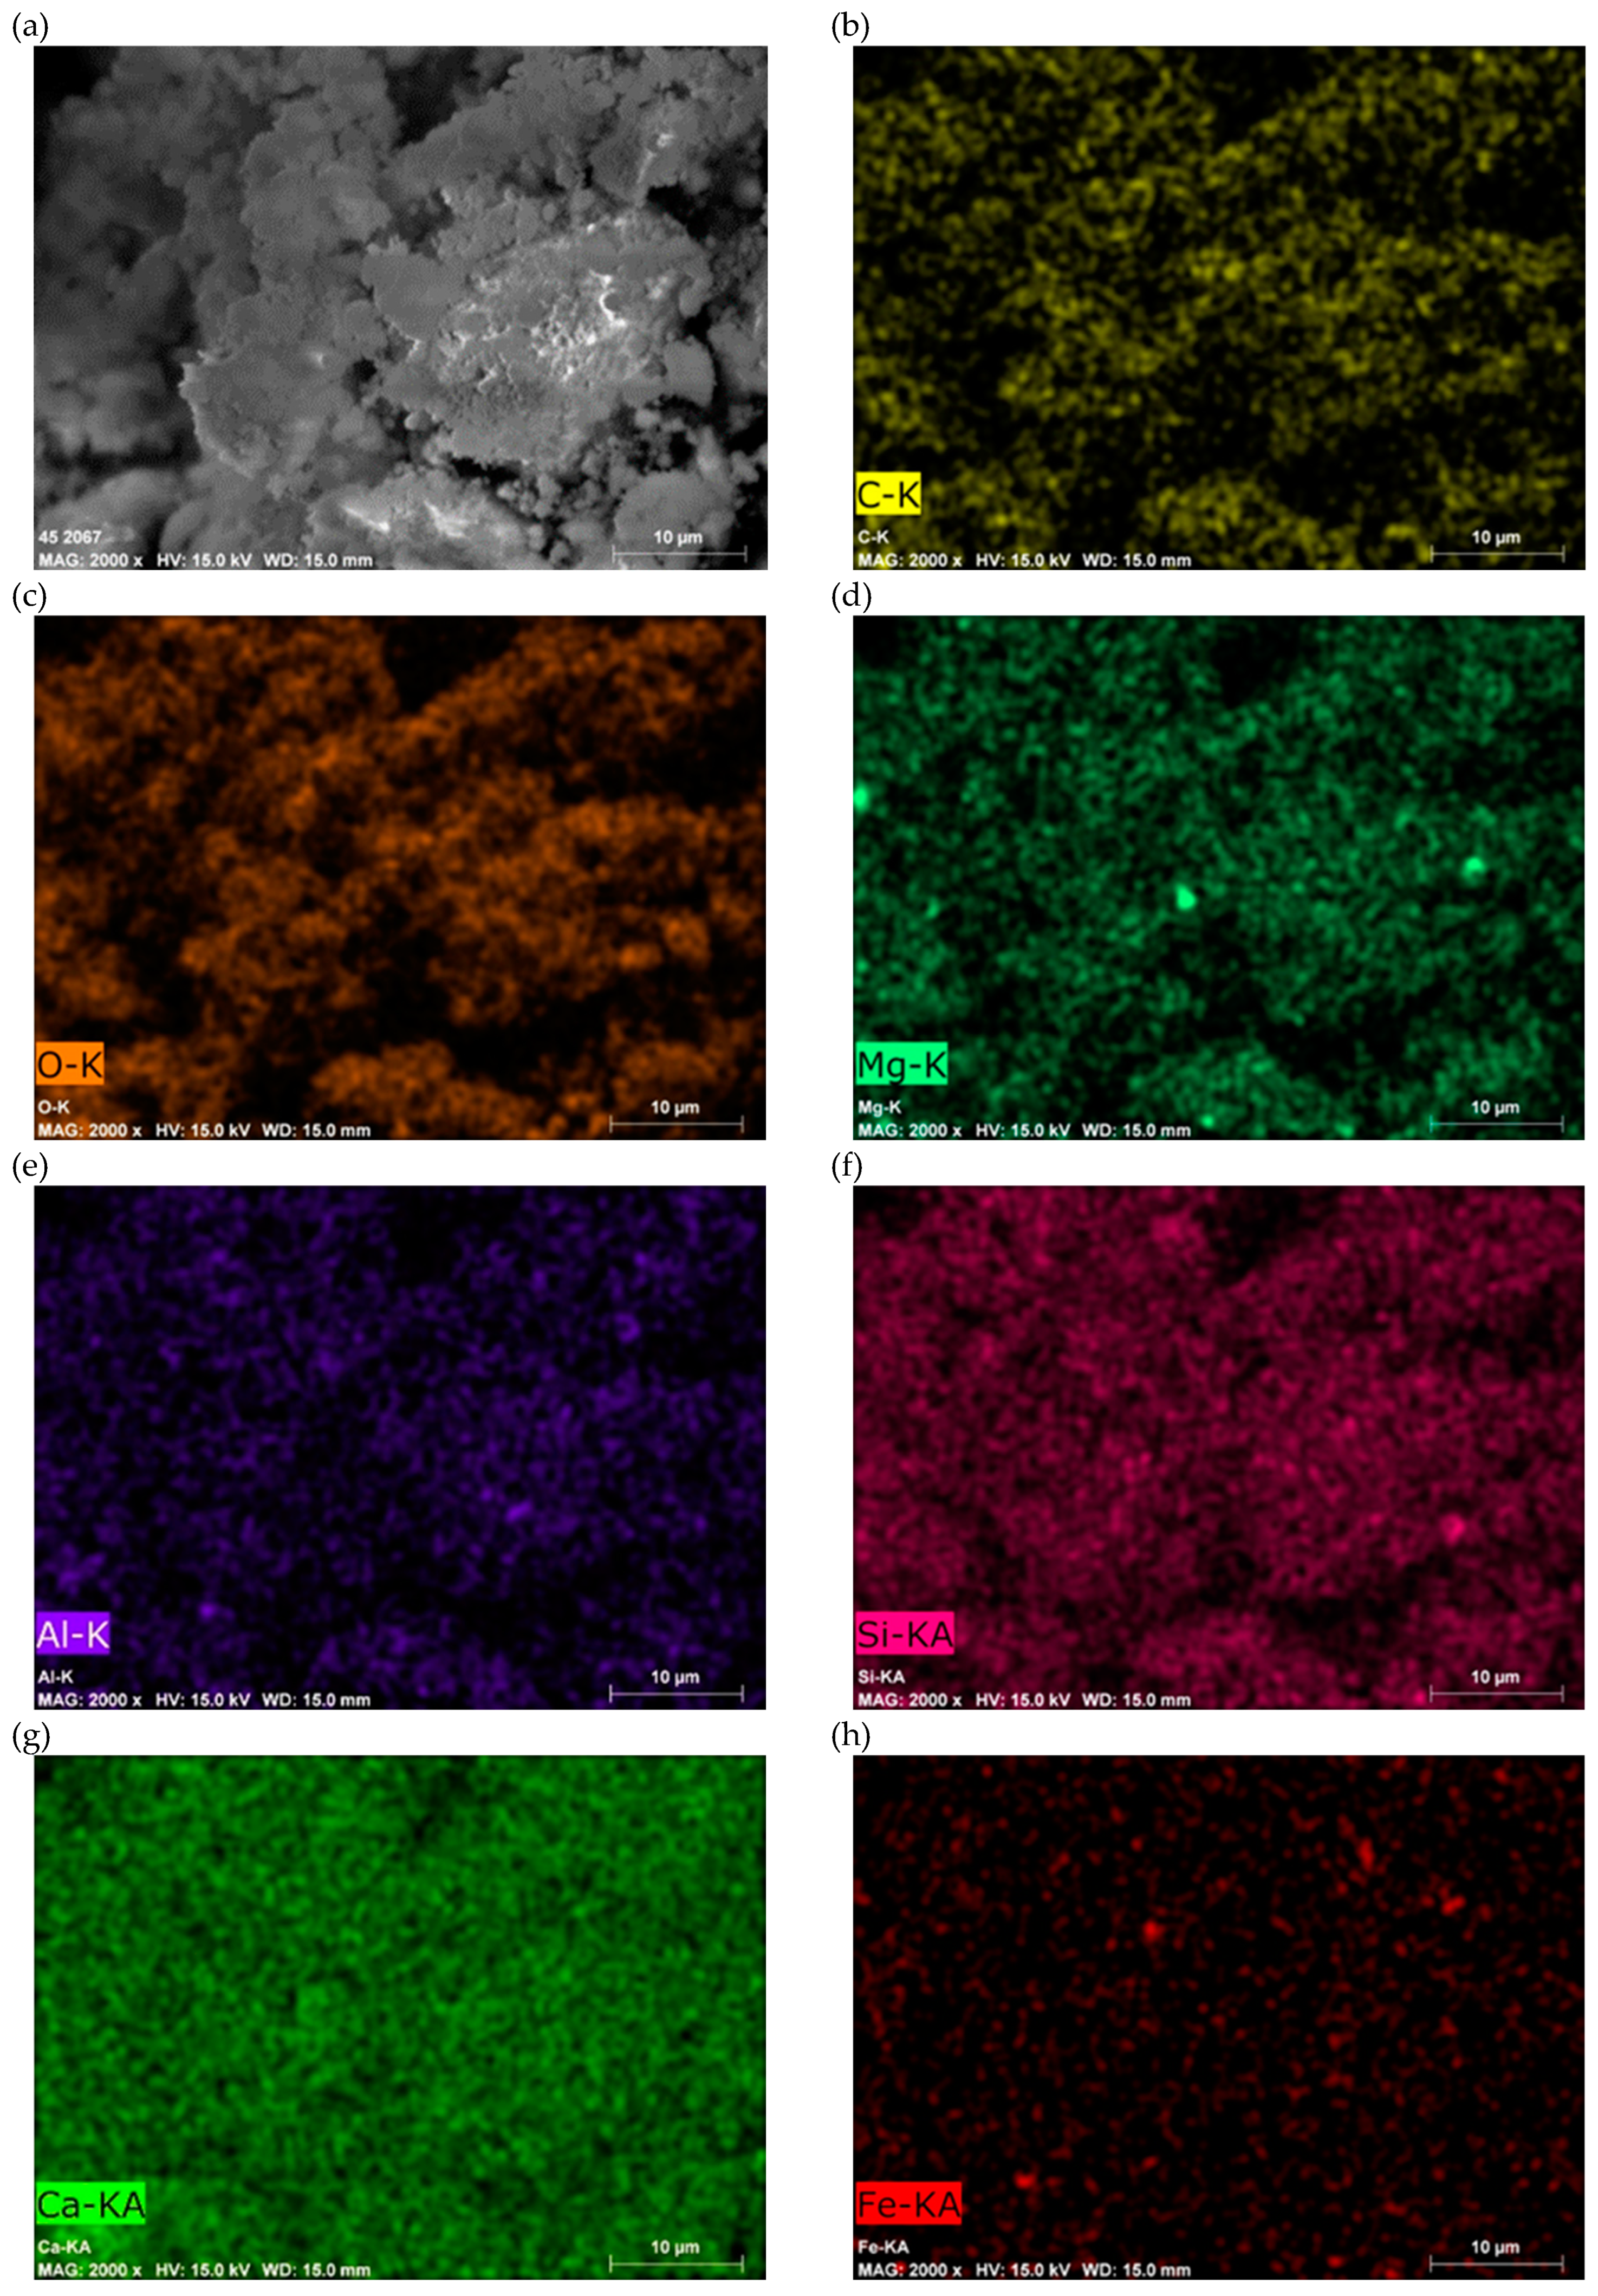
Figure 10.
EDS spectrum and elemental quantification of Sample A powder.
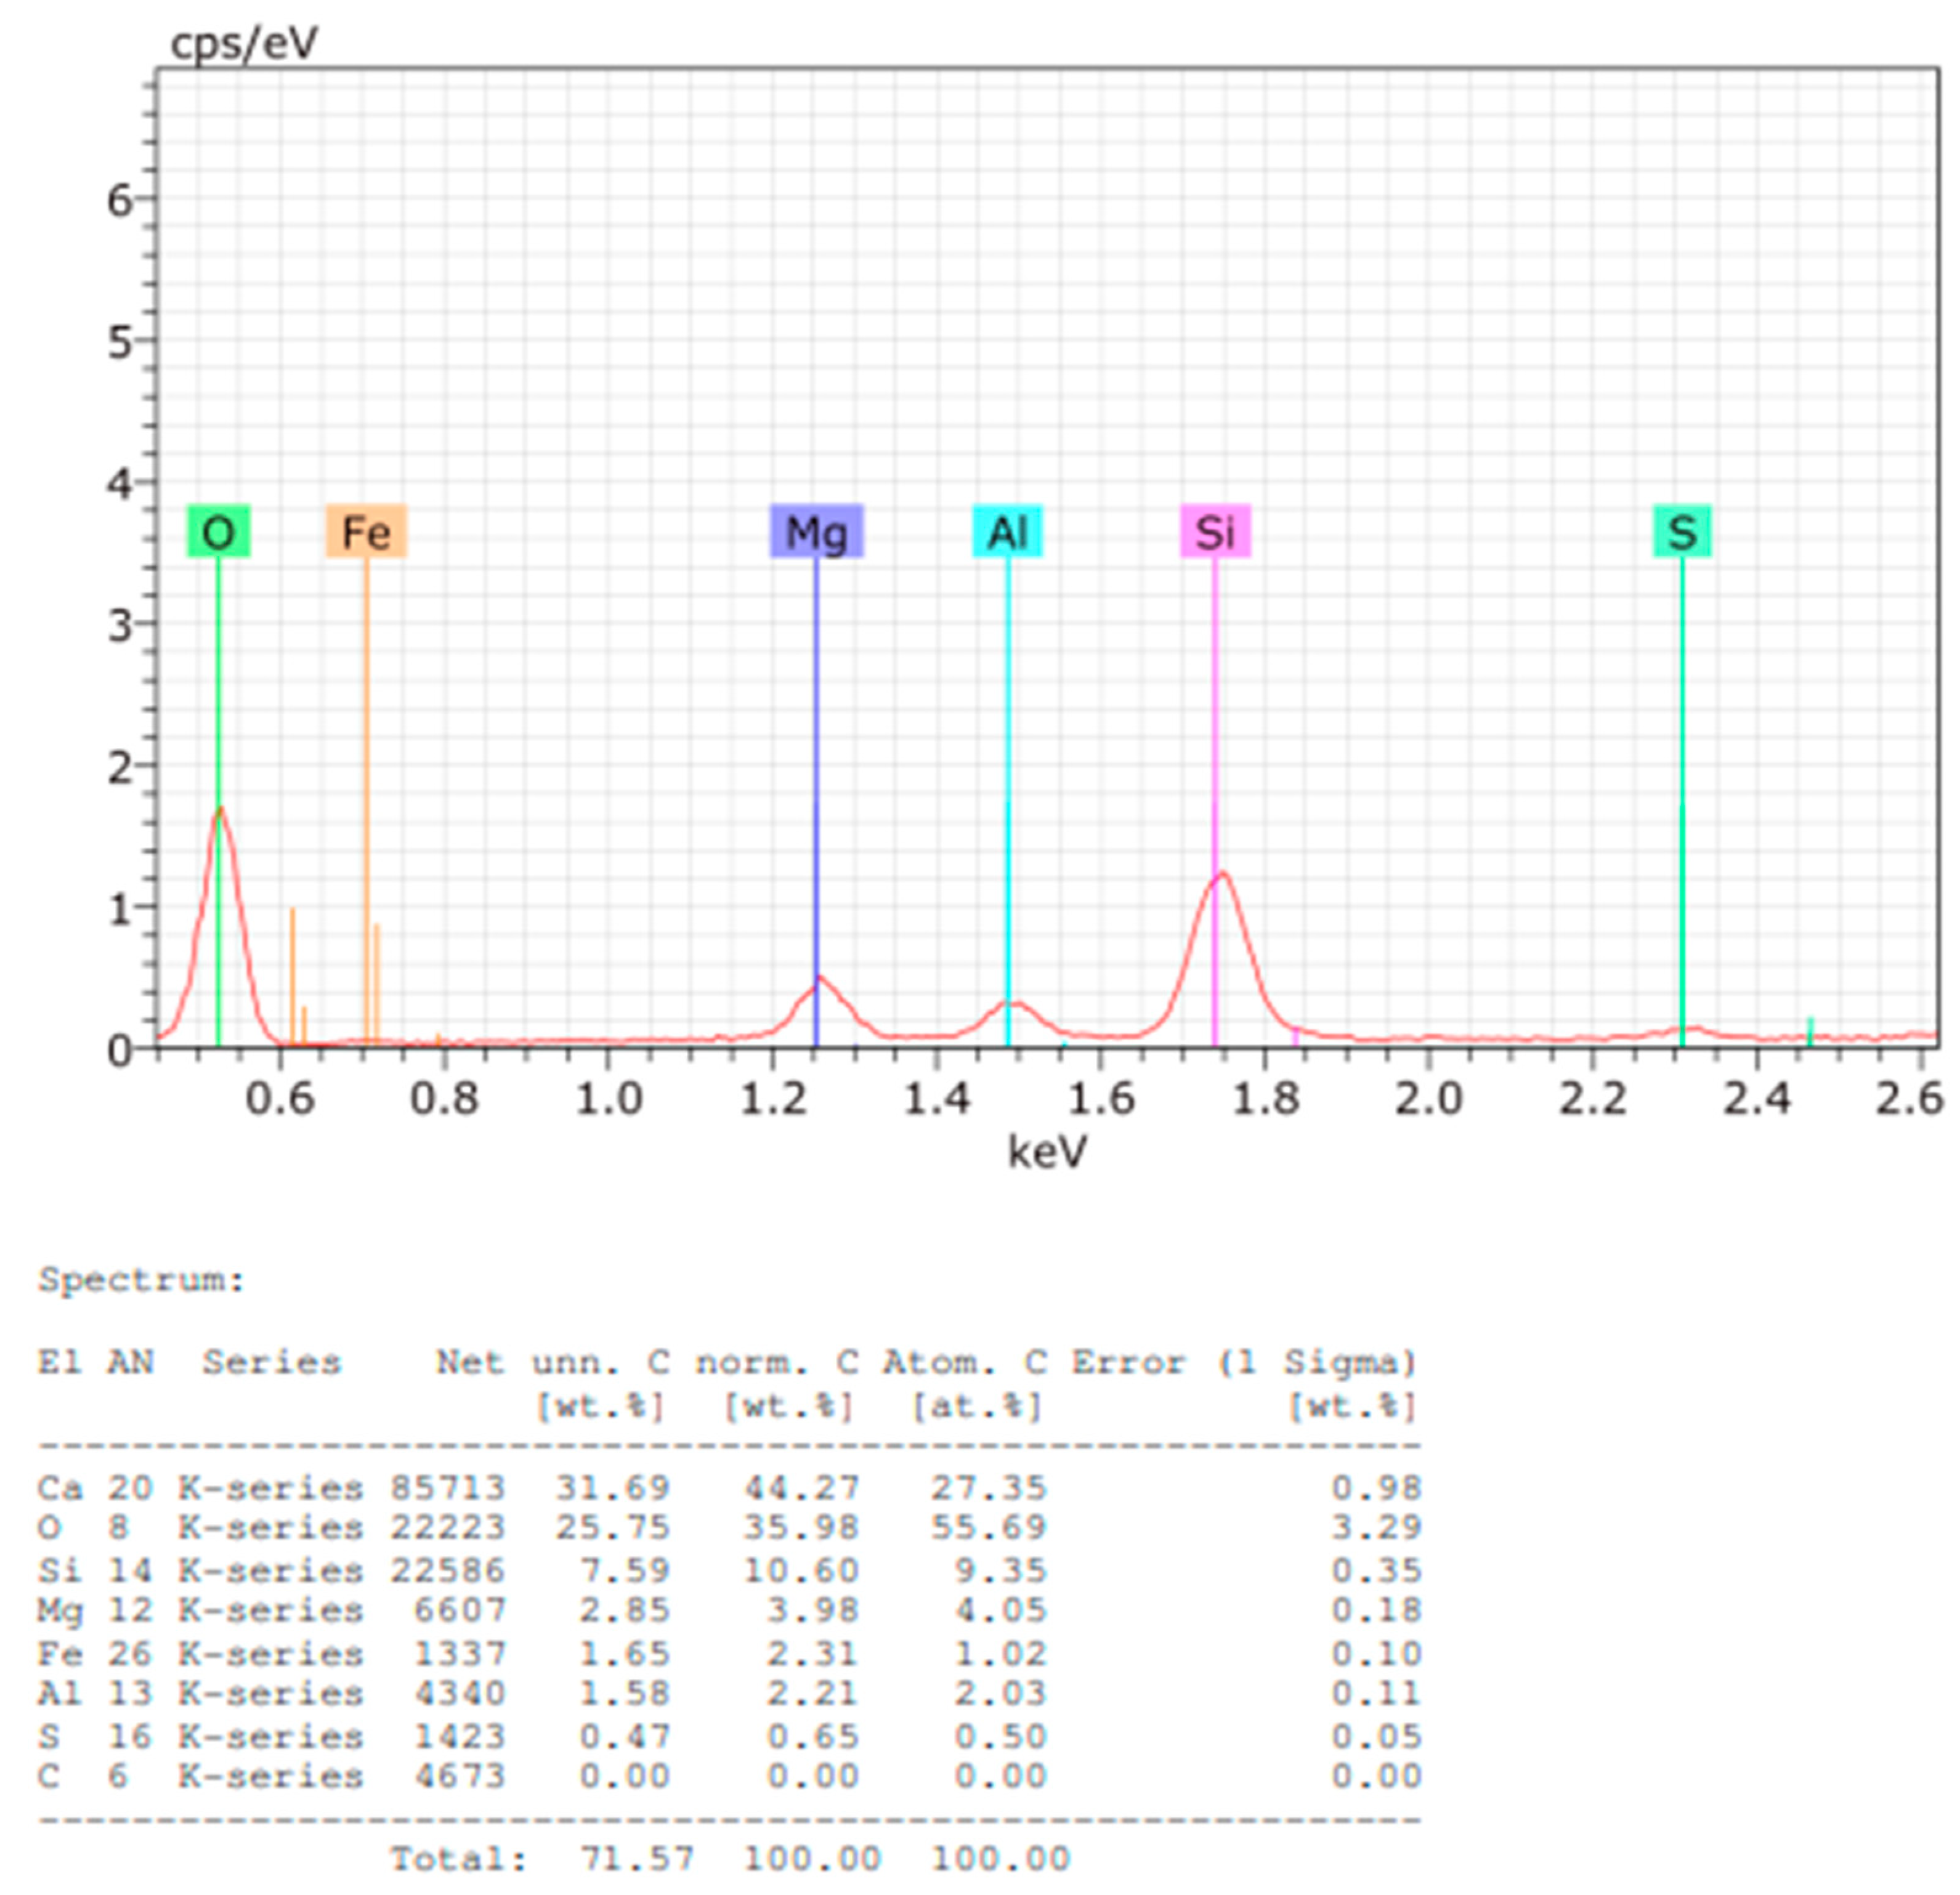
Figure 11.
(a) to (j) SEM-EDS images of Sample B plate and powder.
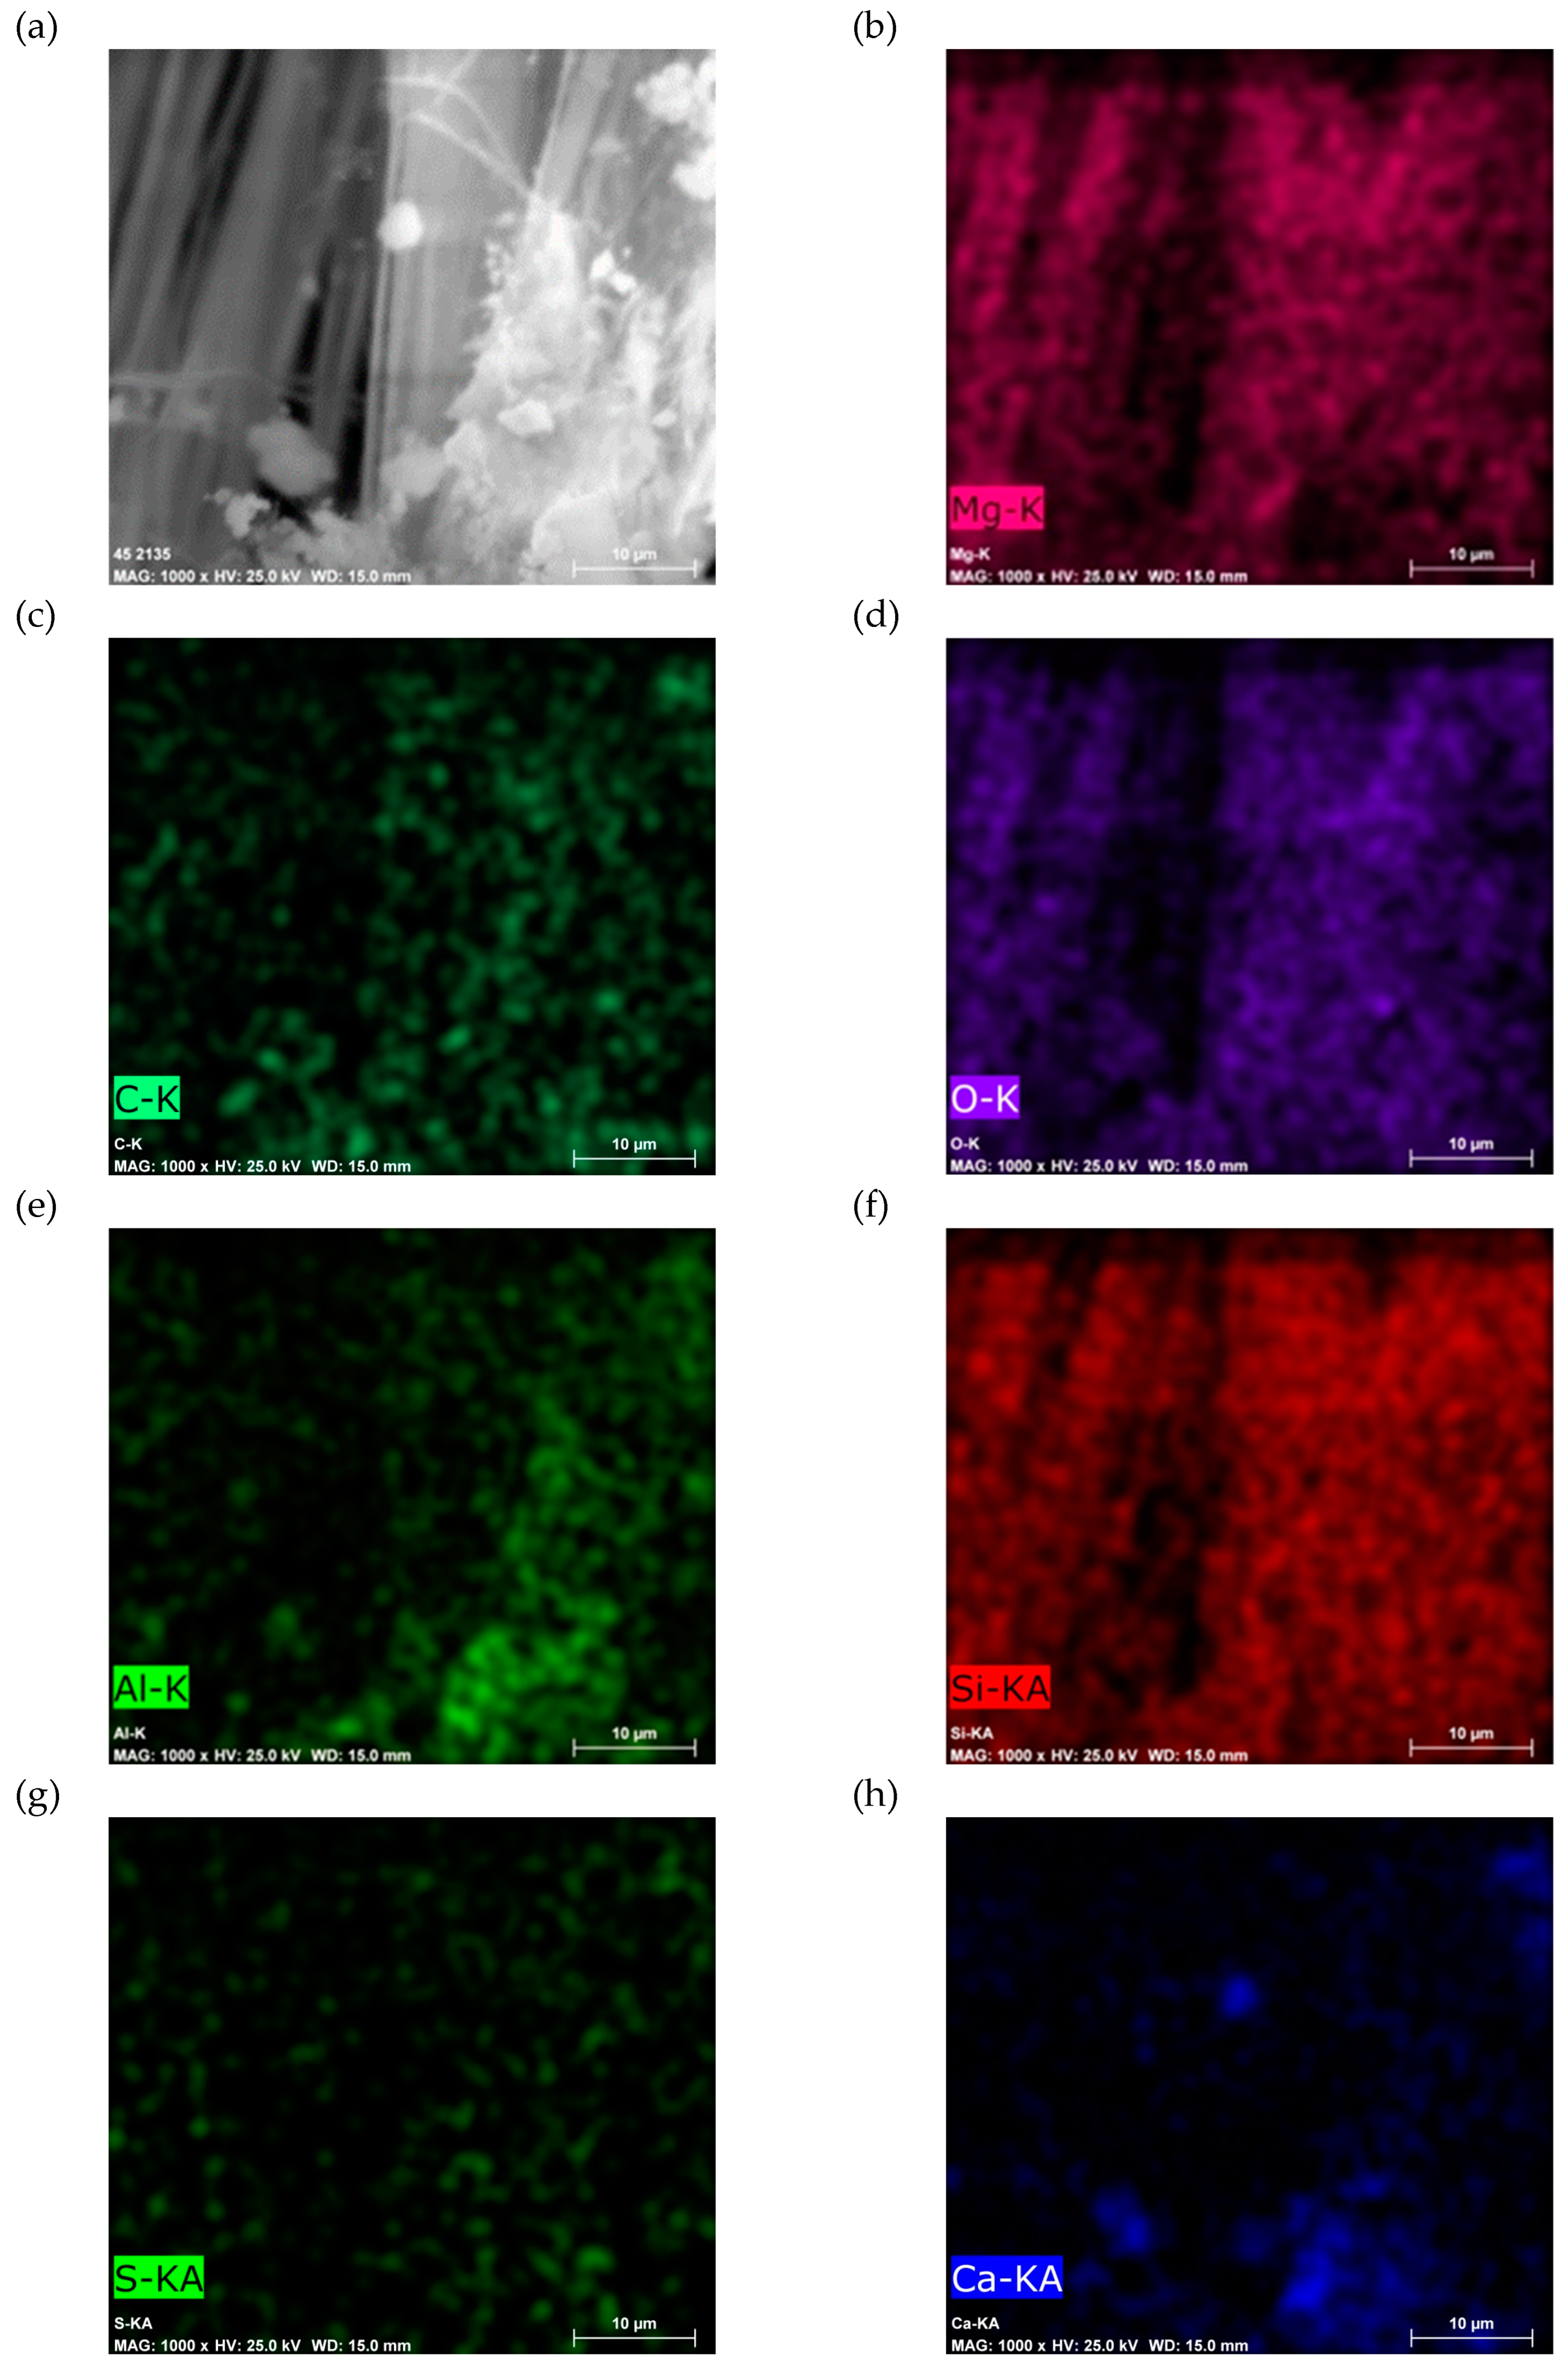
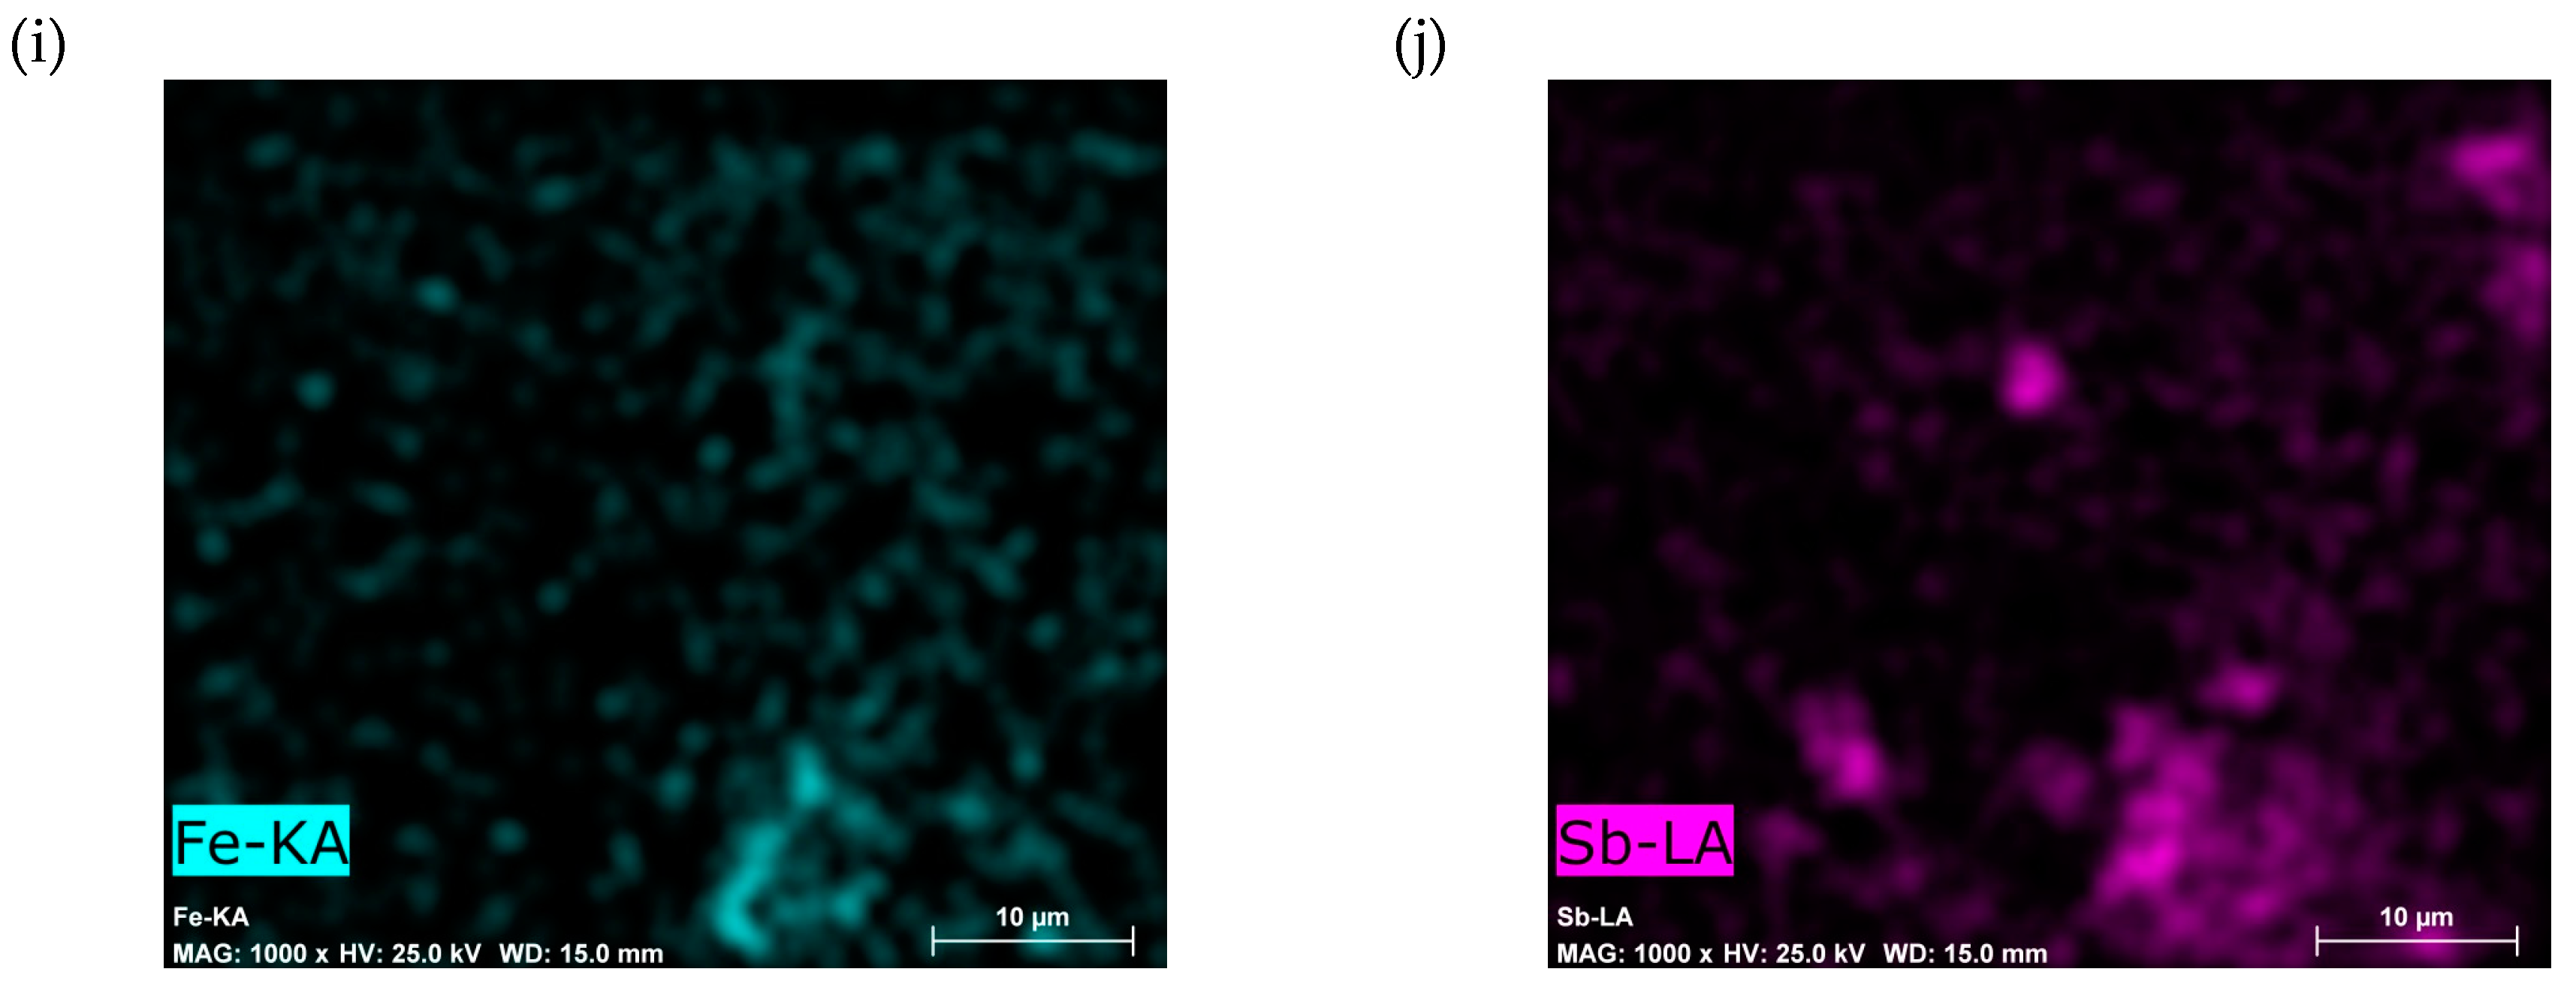
Figure 12.
EDS spectrum and elemental quantification of Sample B plate.
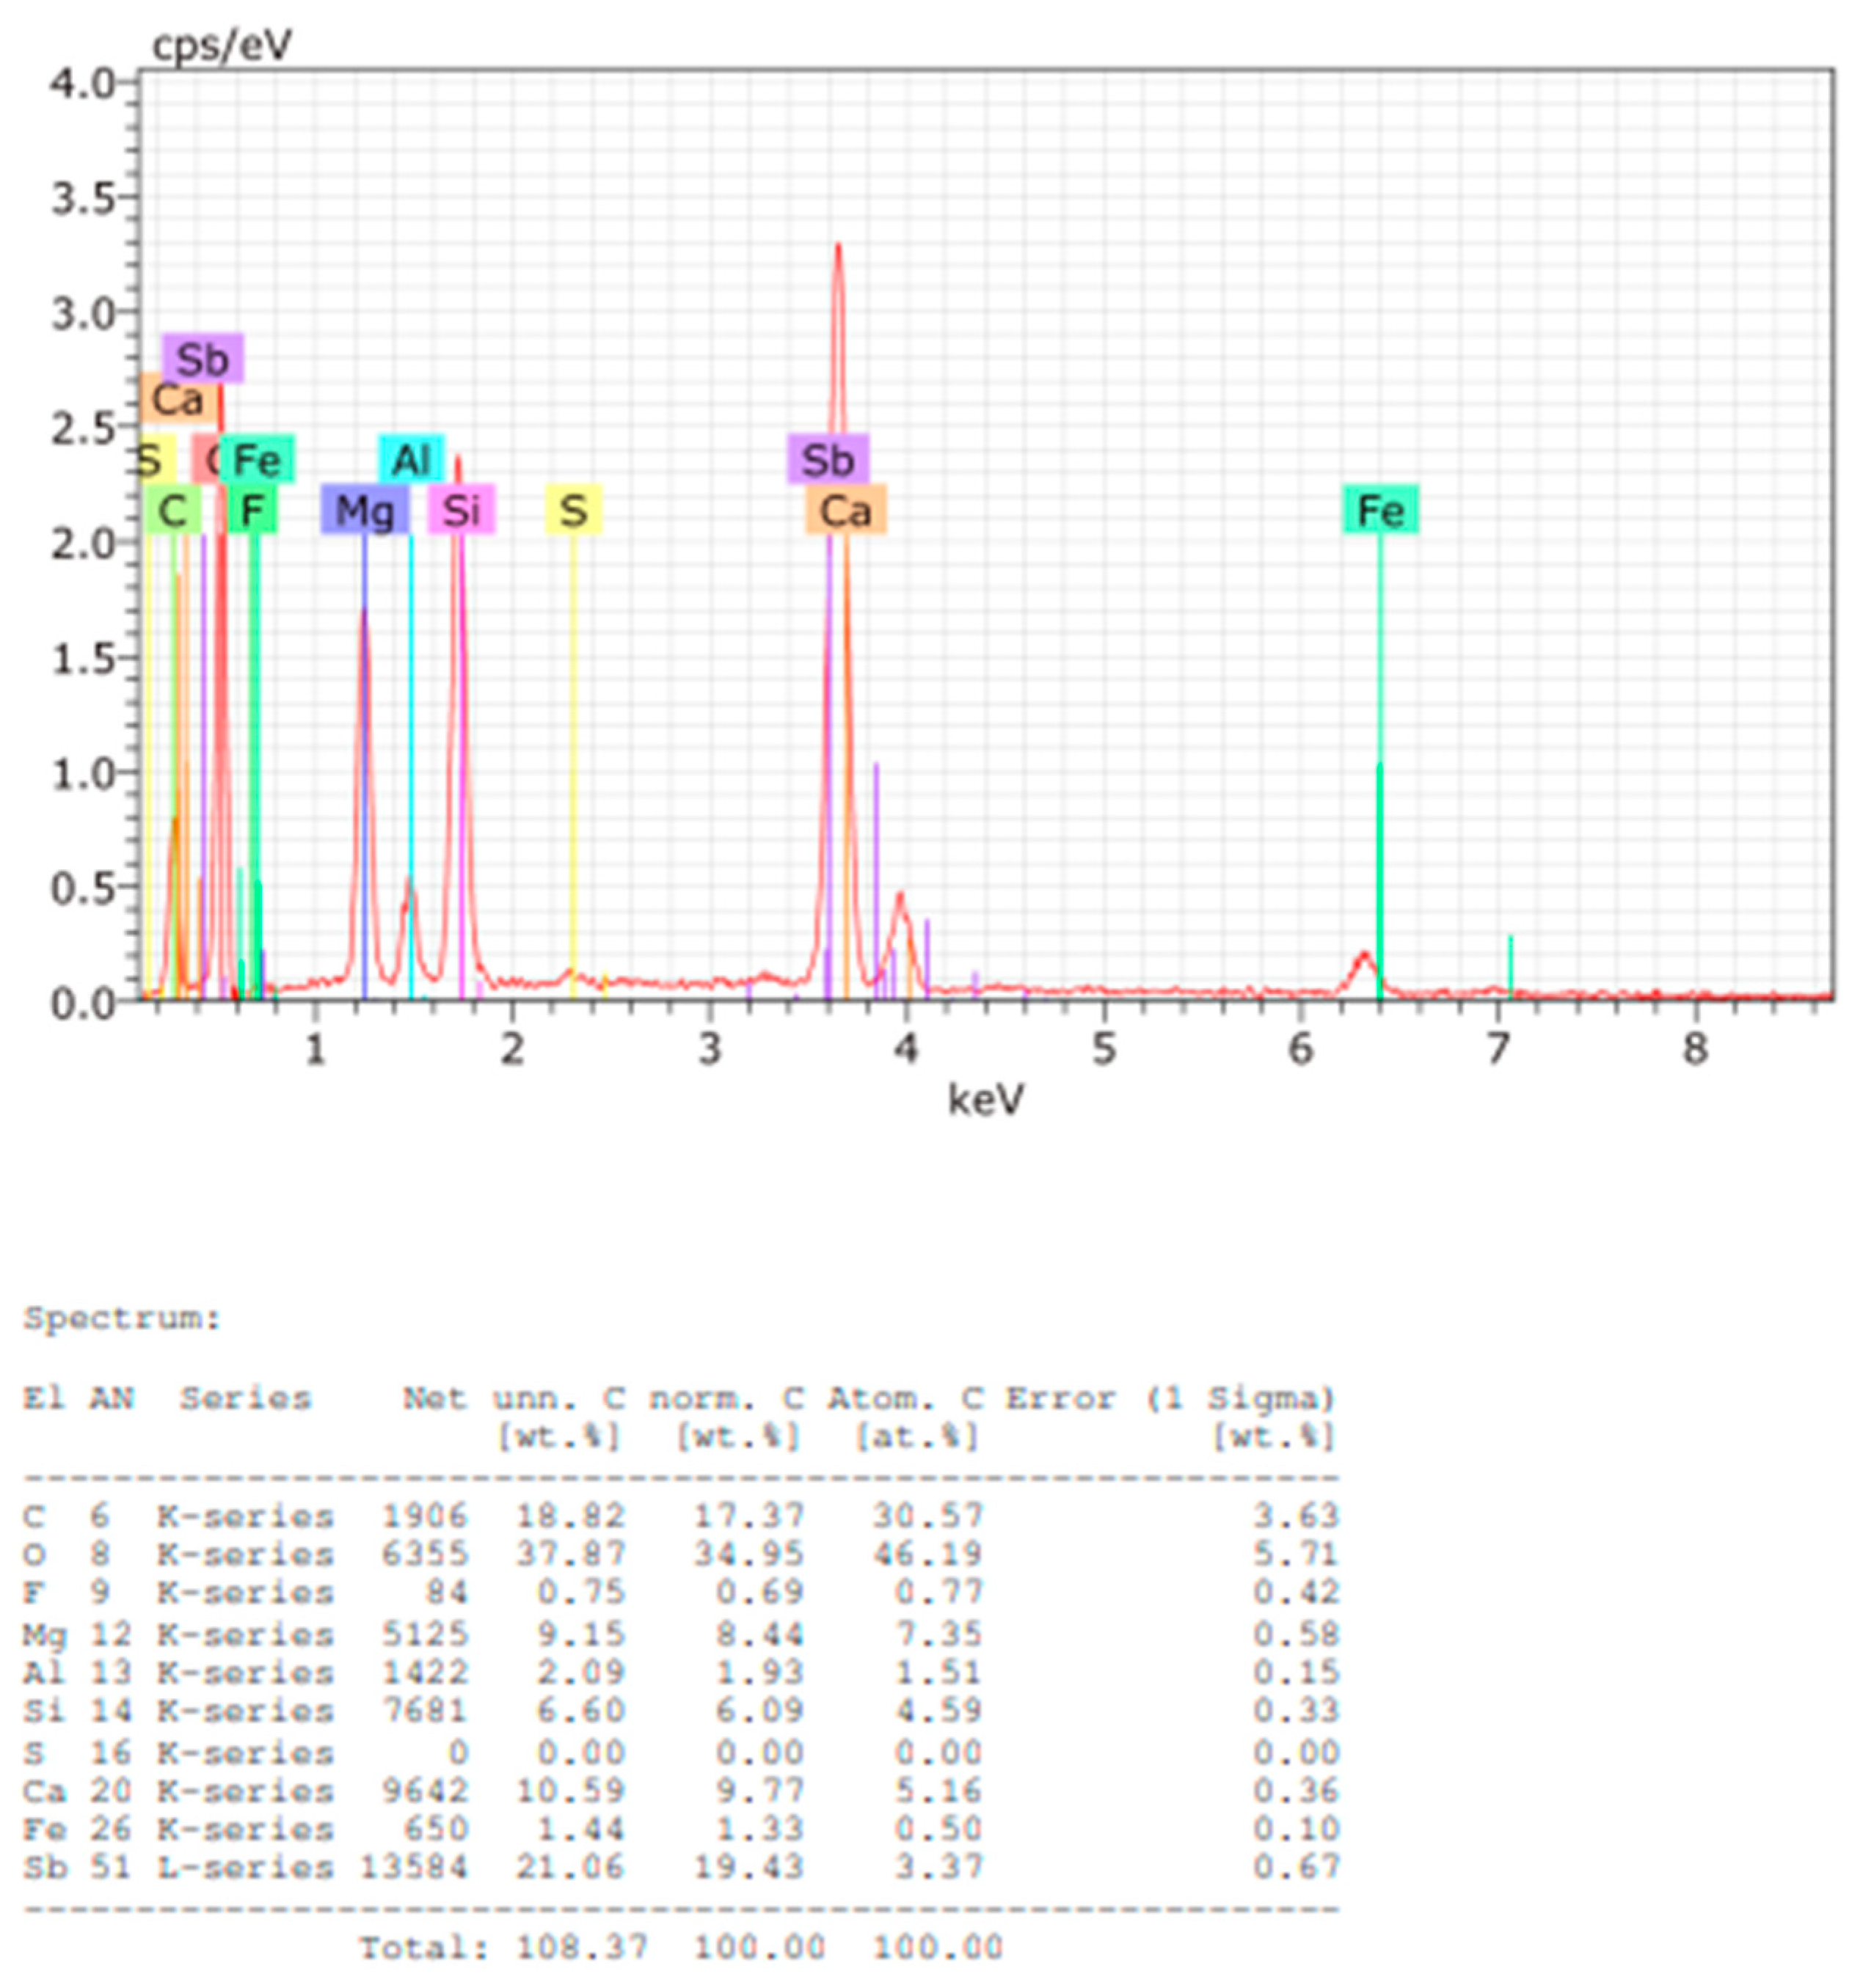
Figure 13.
EDS spectrum and elemental quantification of Sample B powder.
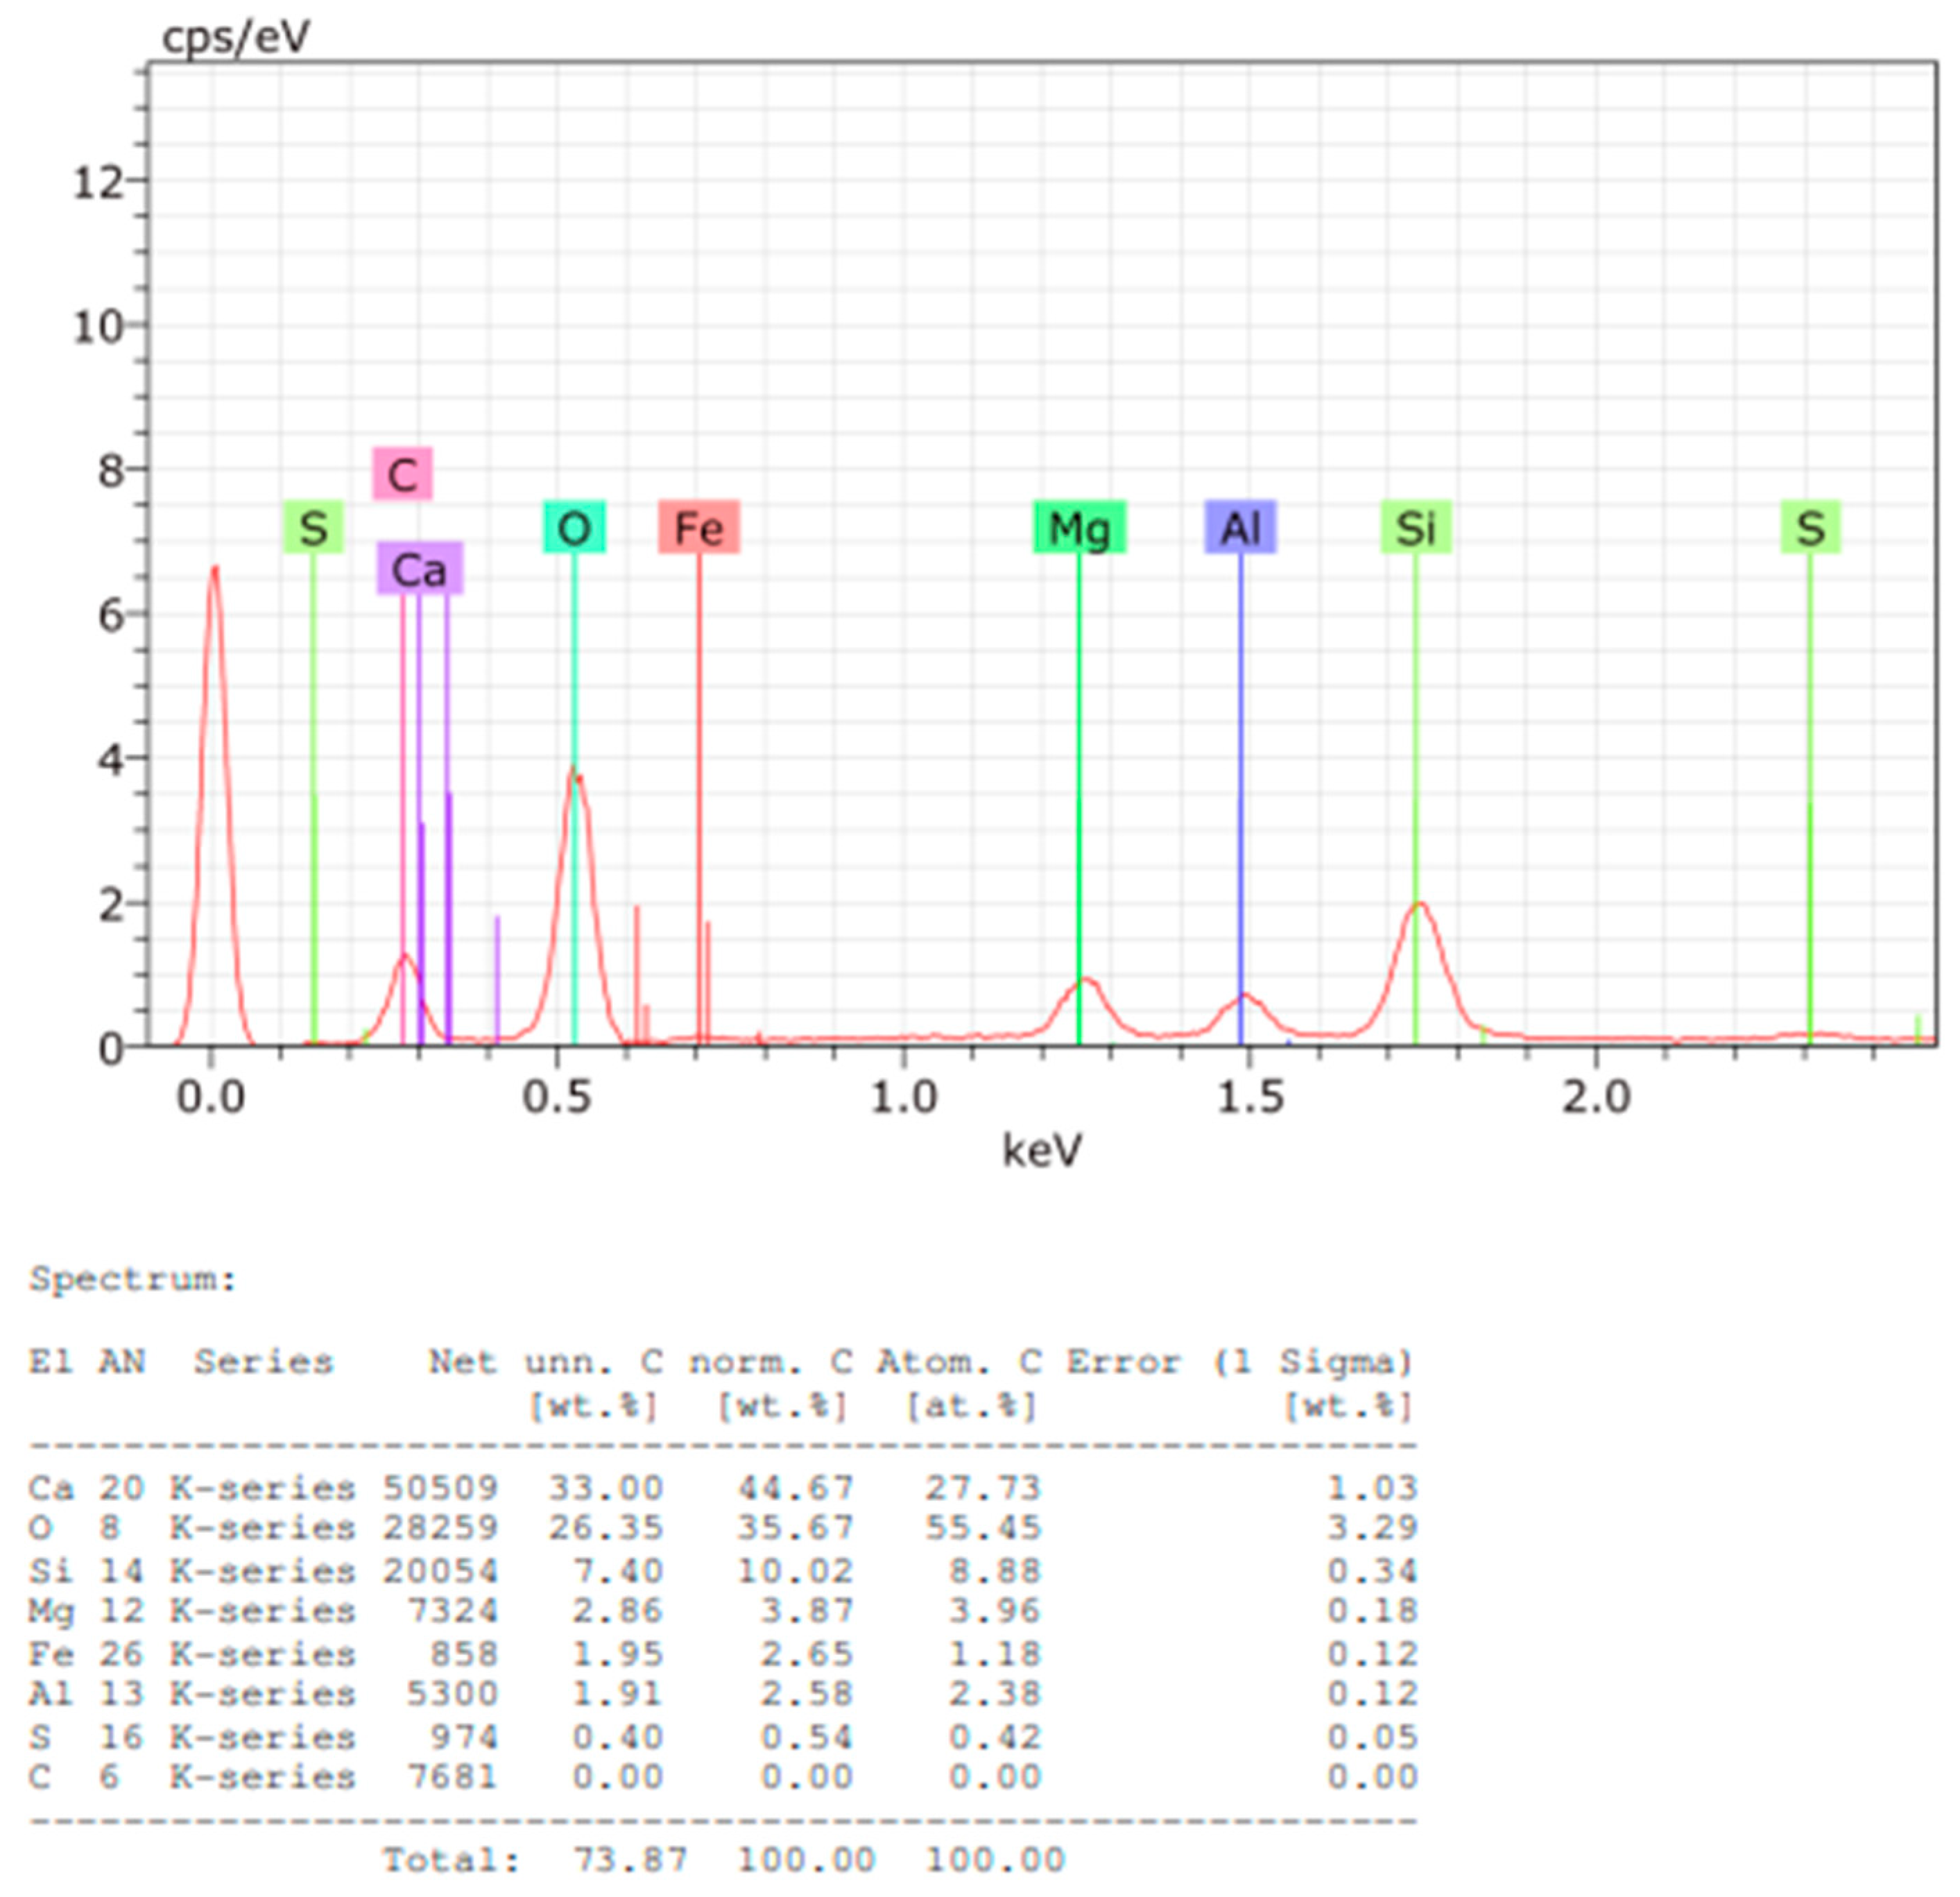
Figure 14.
EDS spectrum and elemental quantification of Sample C powder.
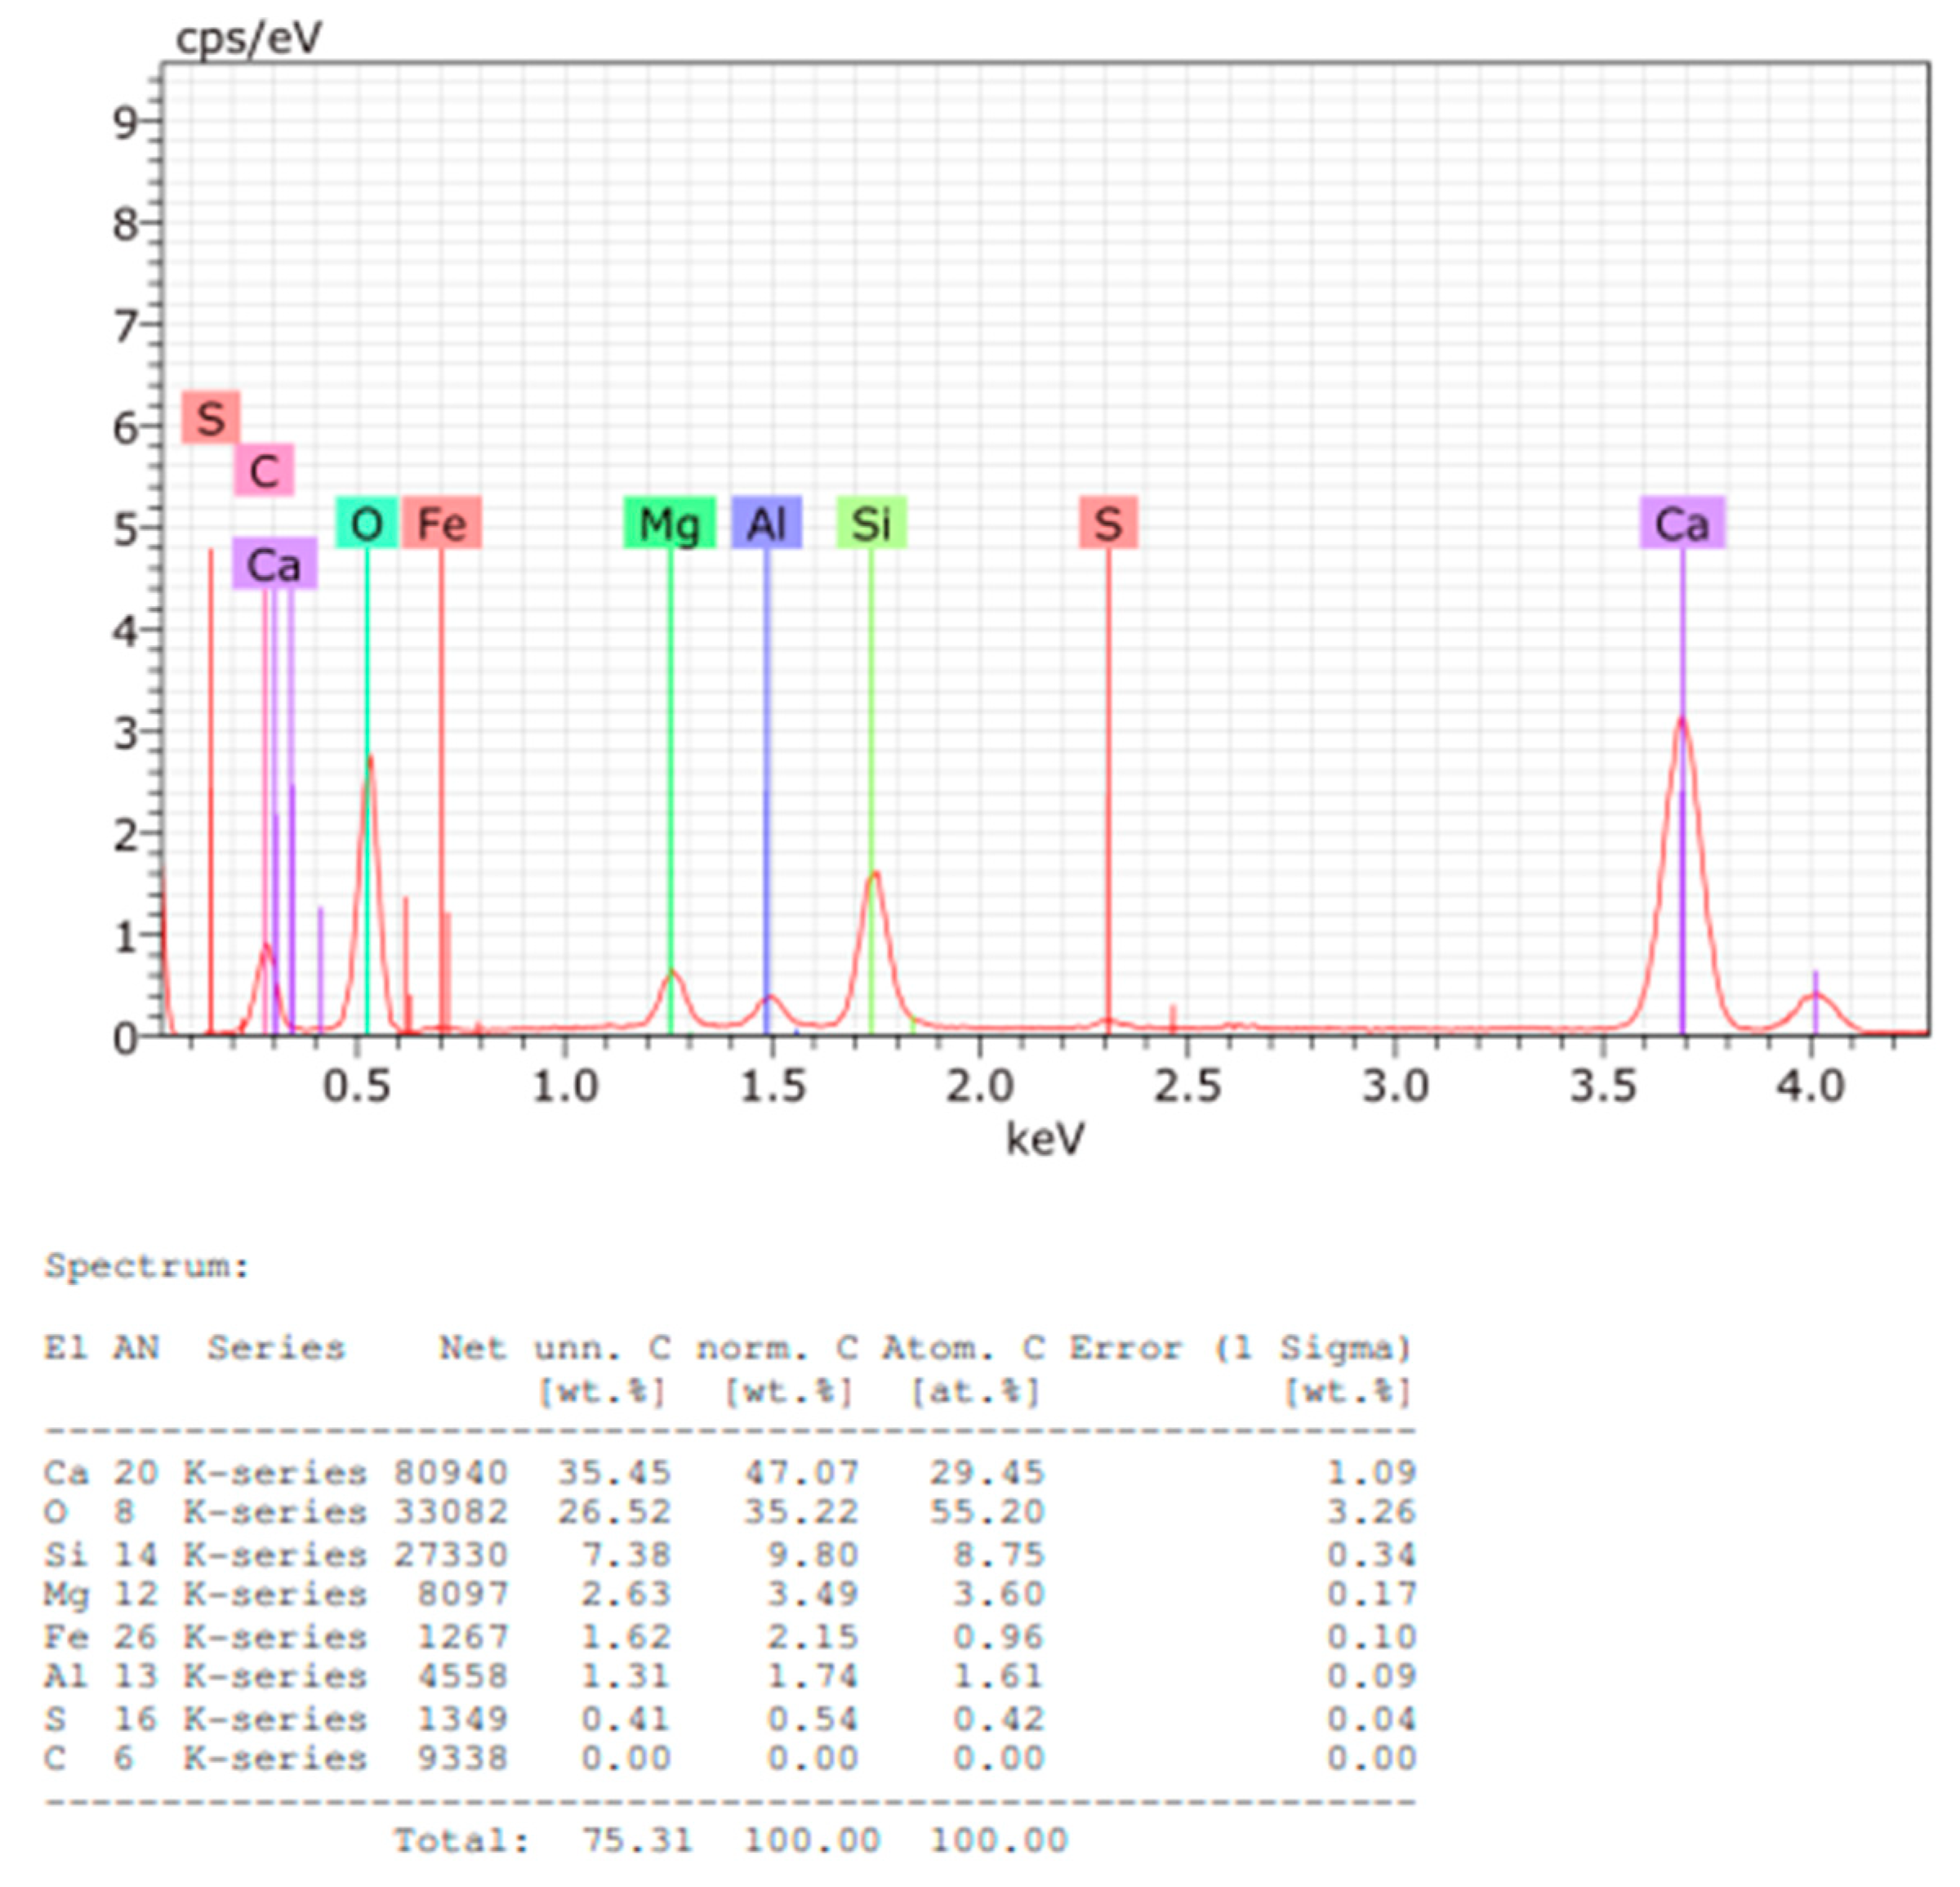
Figure 15.
EDS spectrum and elemental quantification of Sample D powder.
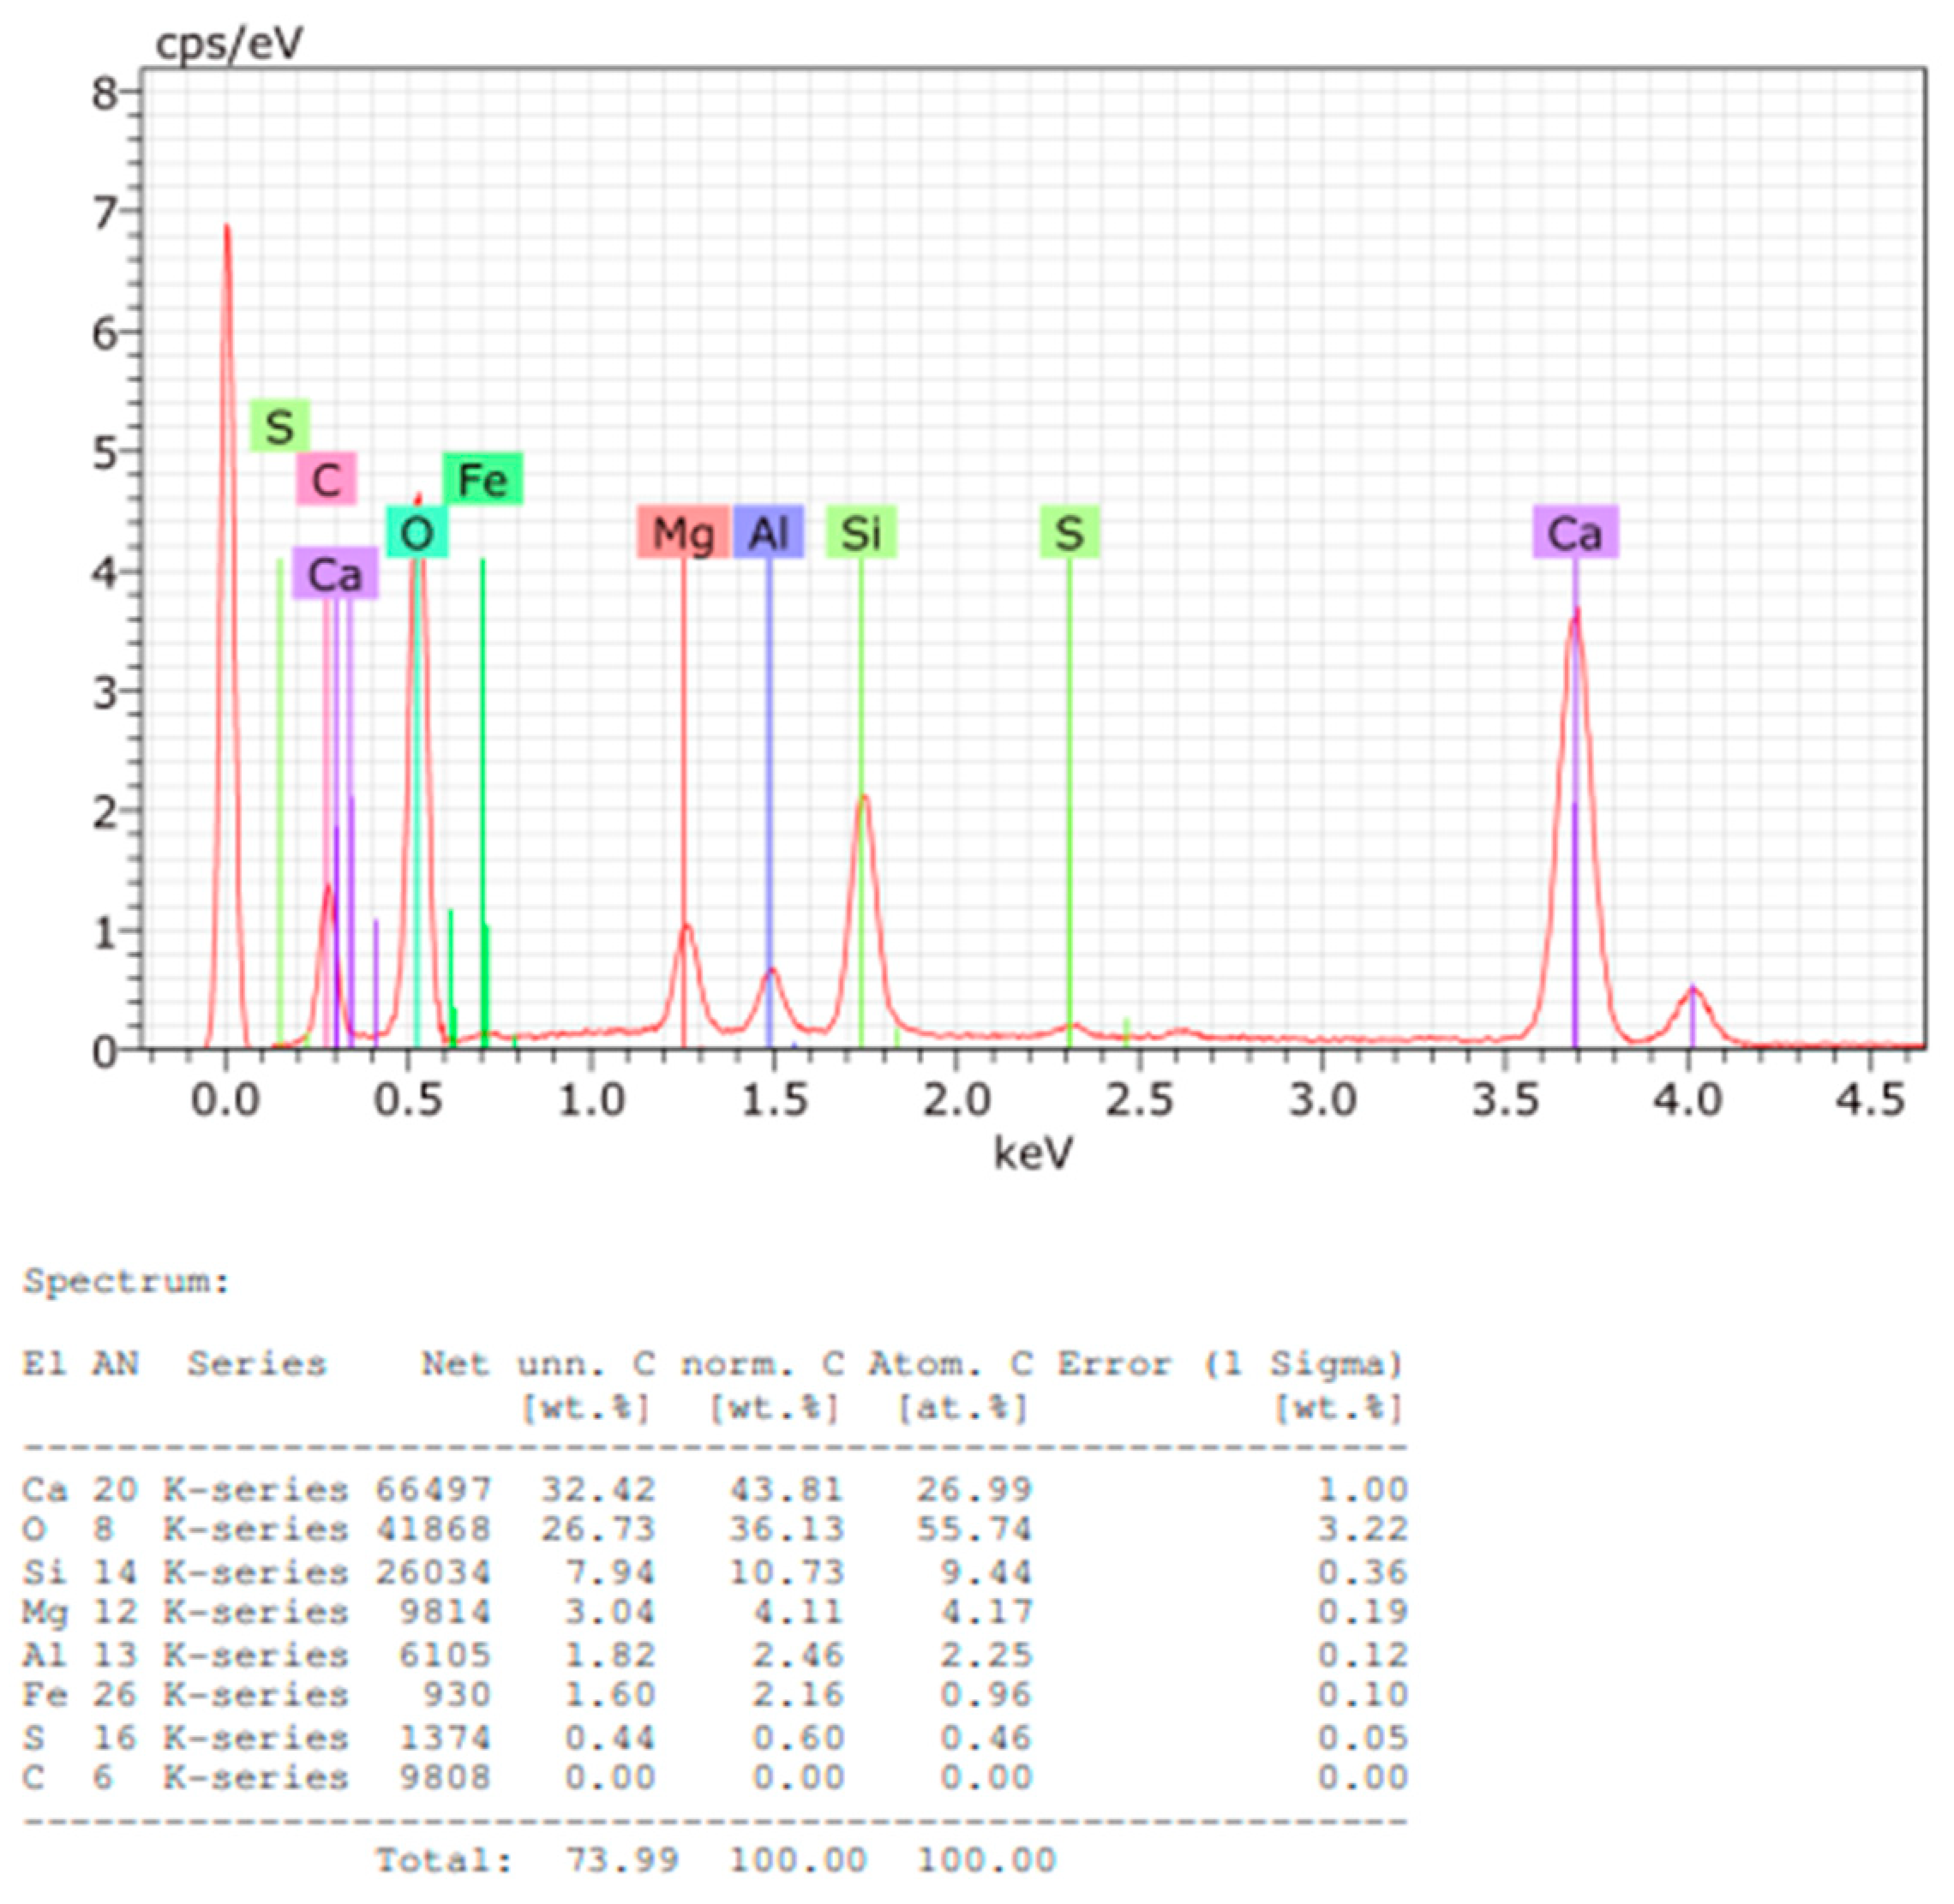
Figure 16.
XRD diffractogram of Sample A plate.
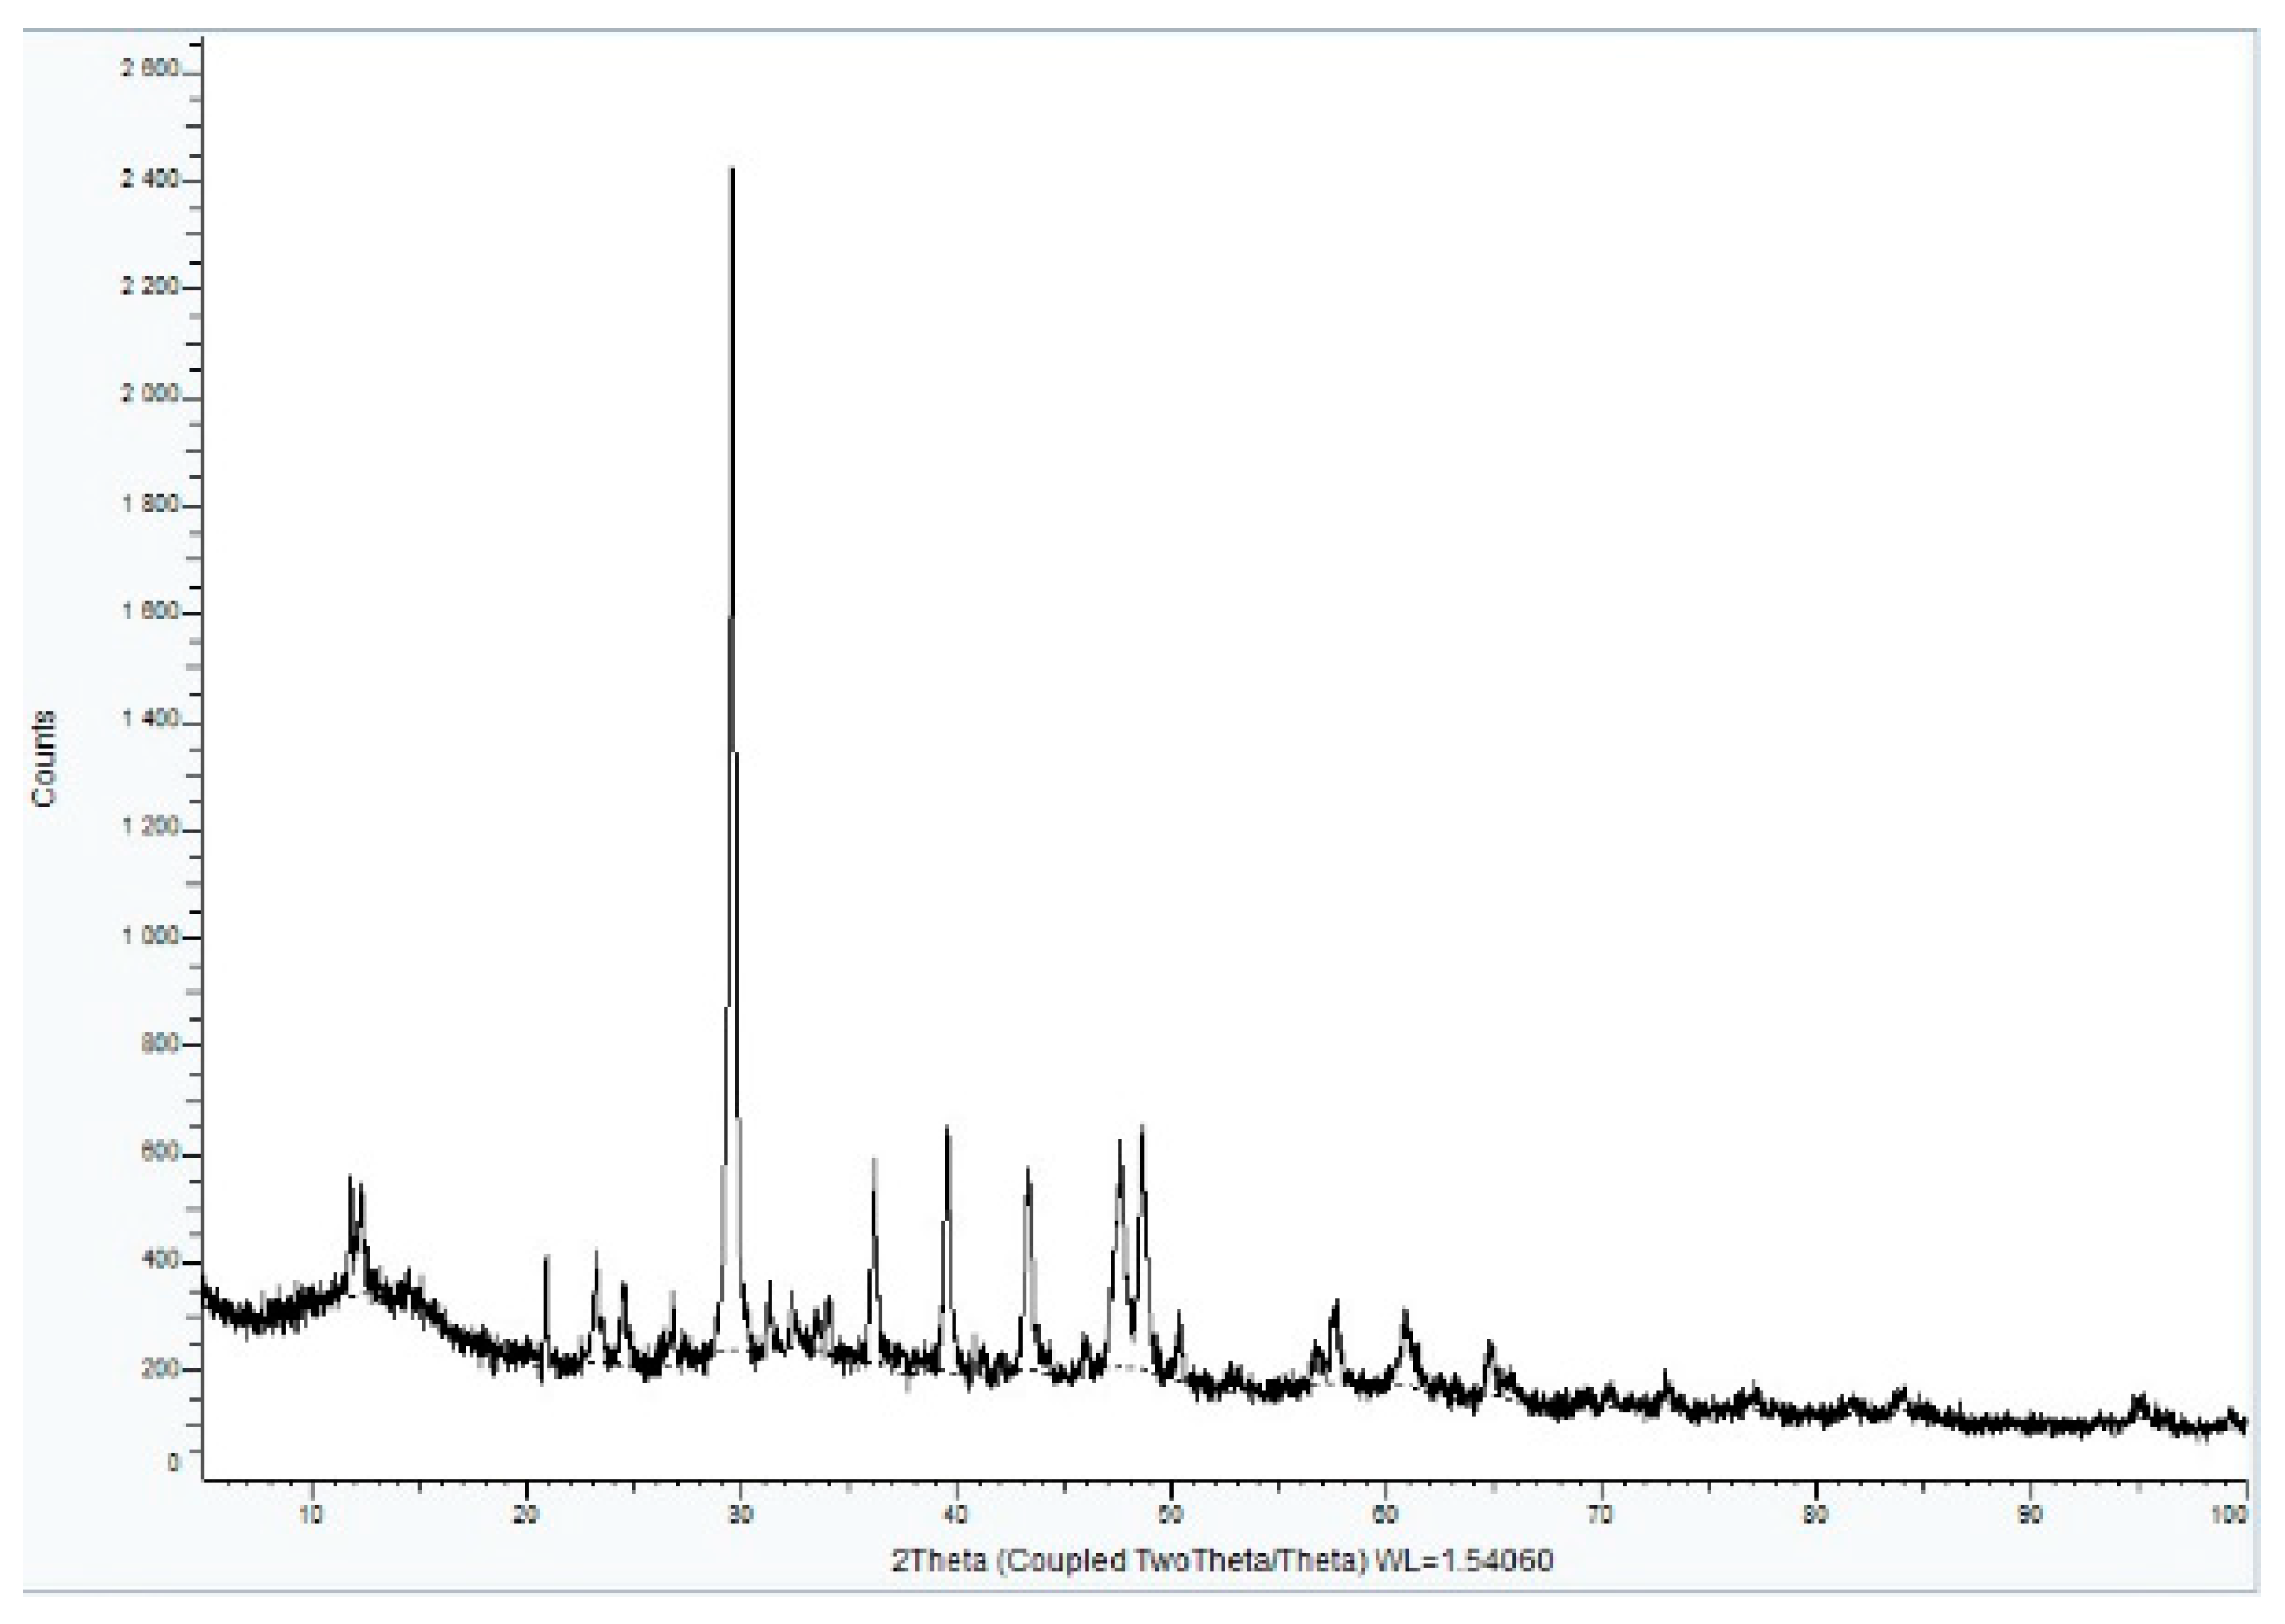
Figure 17.
XRD diffractogram with Rietveld refinement (Sample A plate).
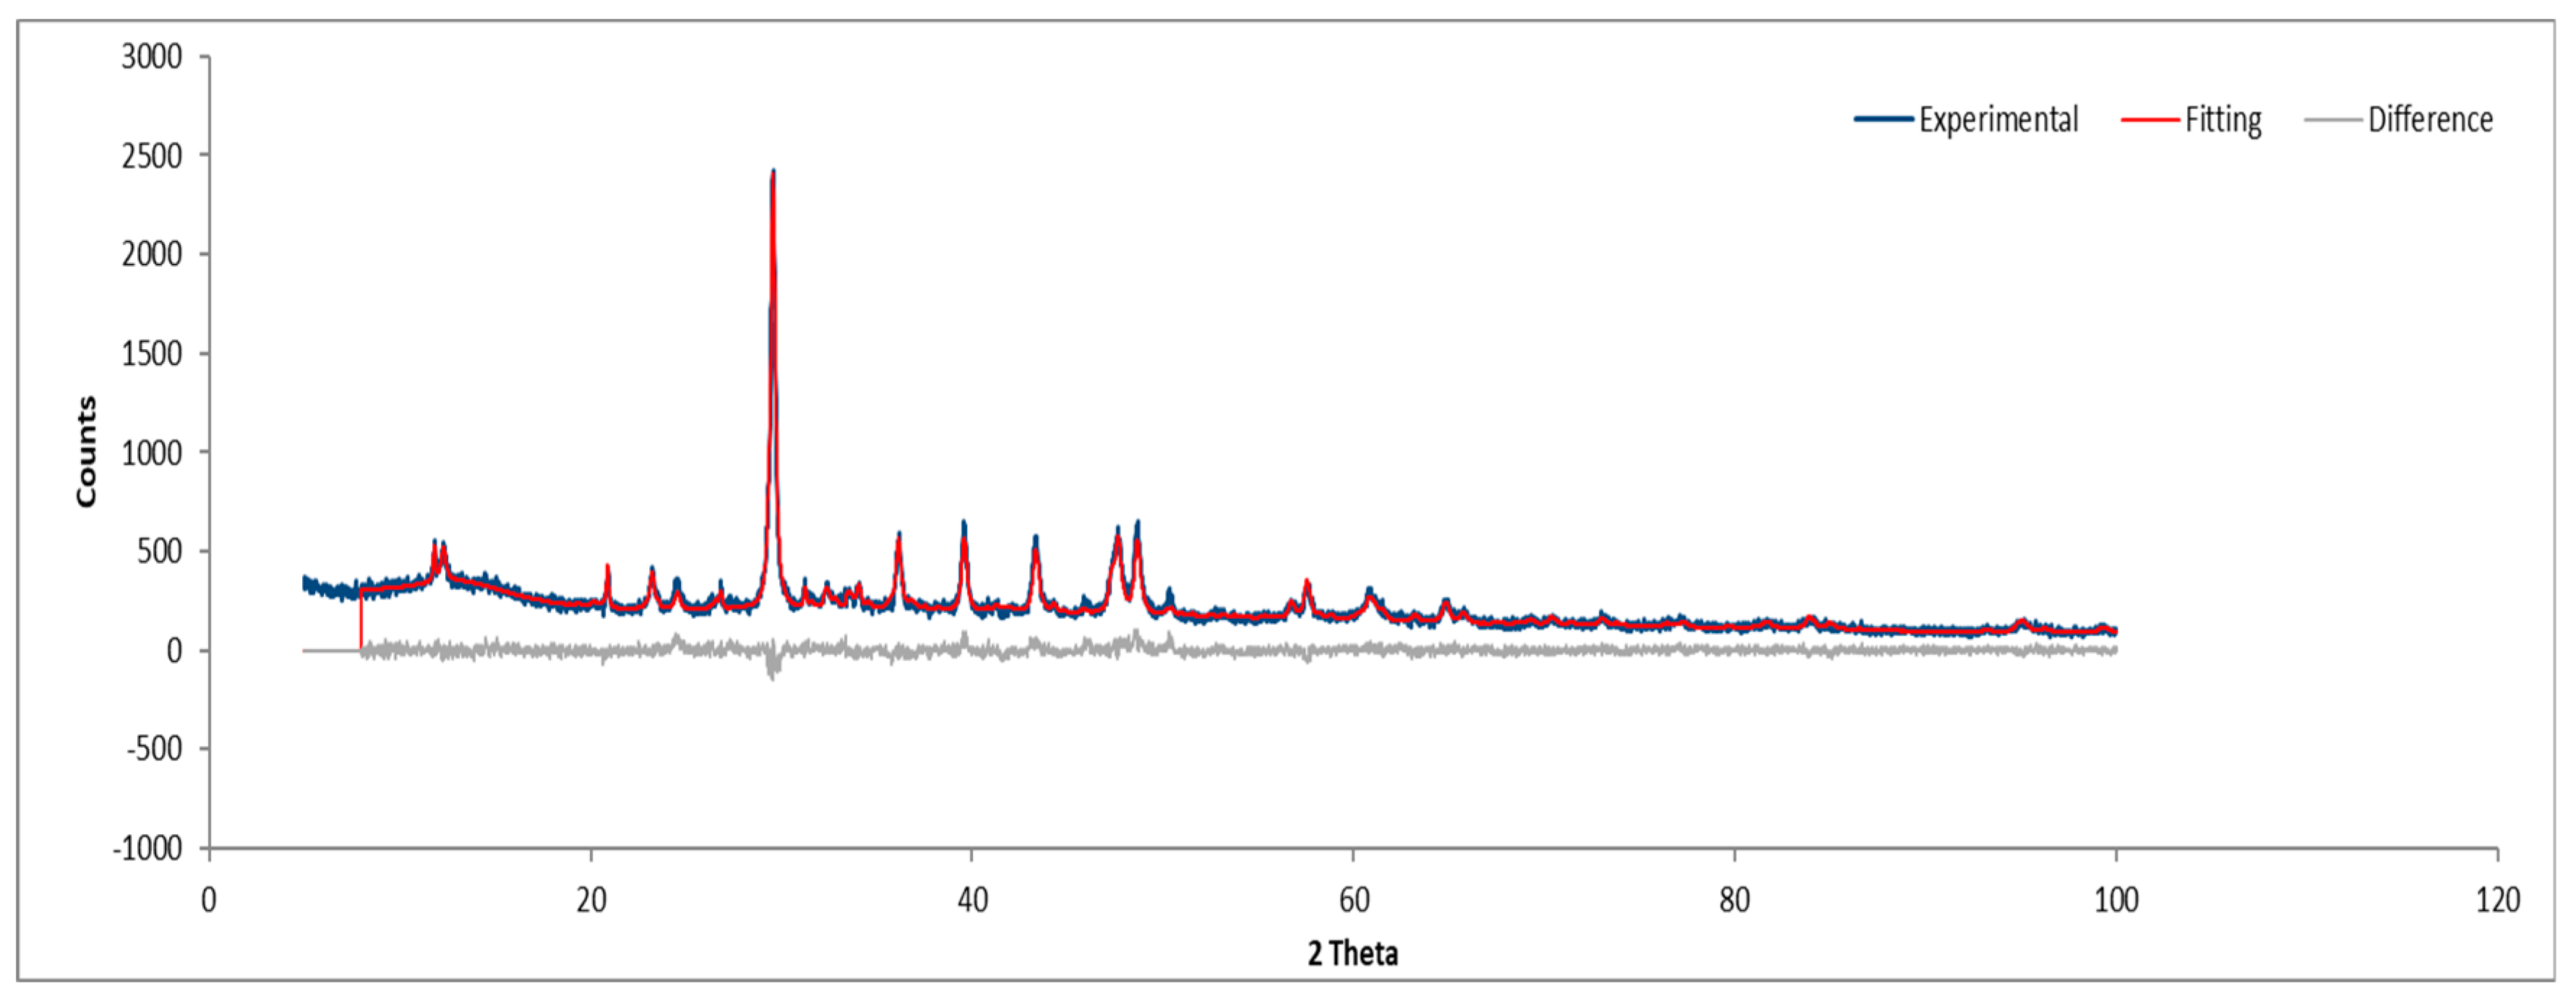
Figure 18.
XRD diffractogram with Rietveld refinement (Sample A powder).
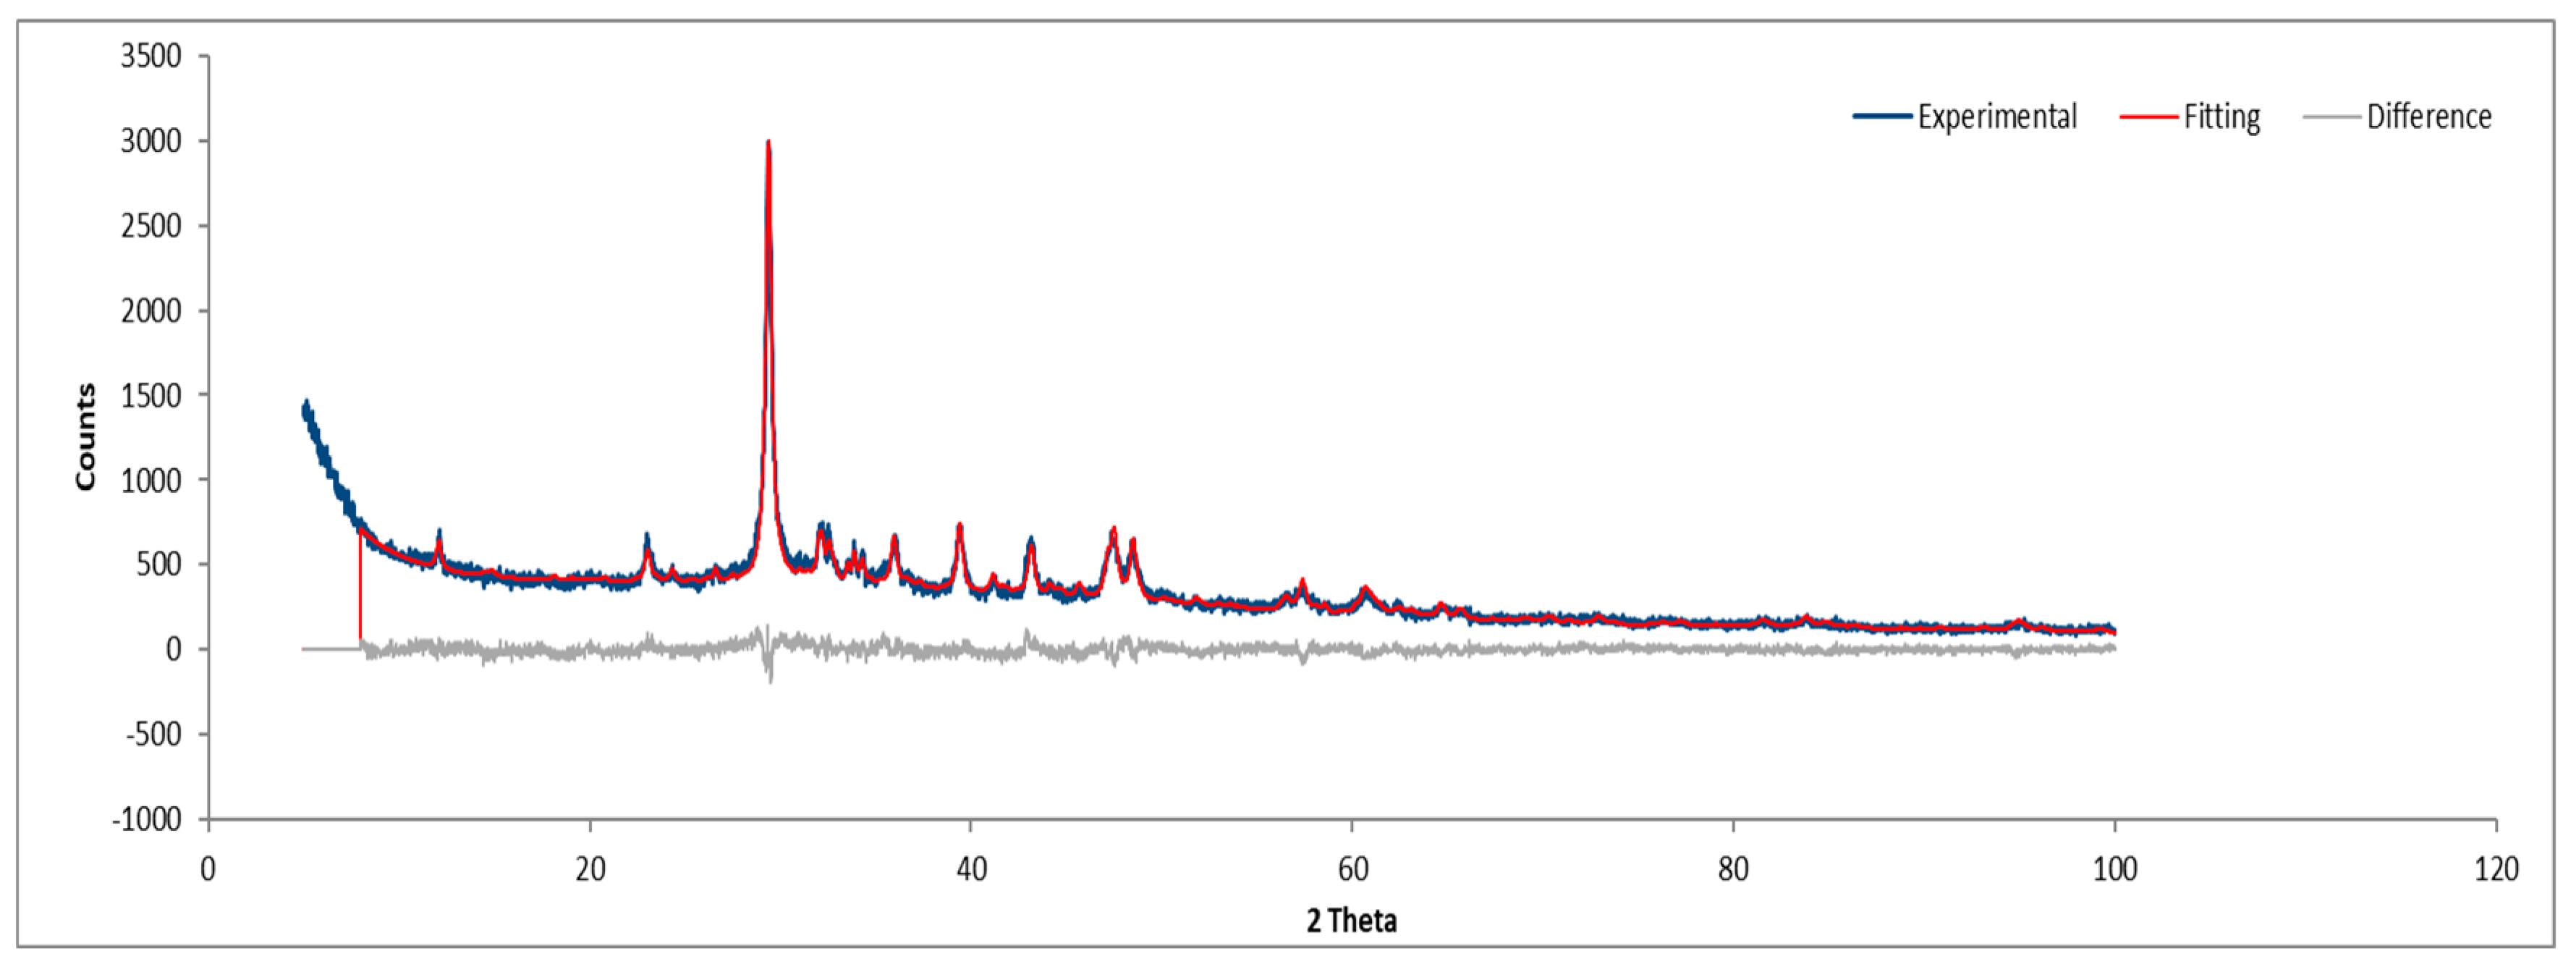
Figure 19.
XRD diffractogram of Sample B plate.
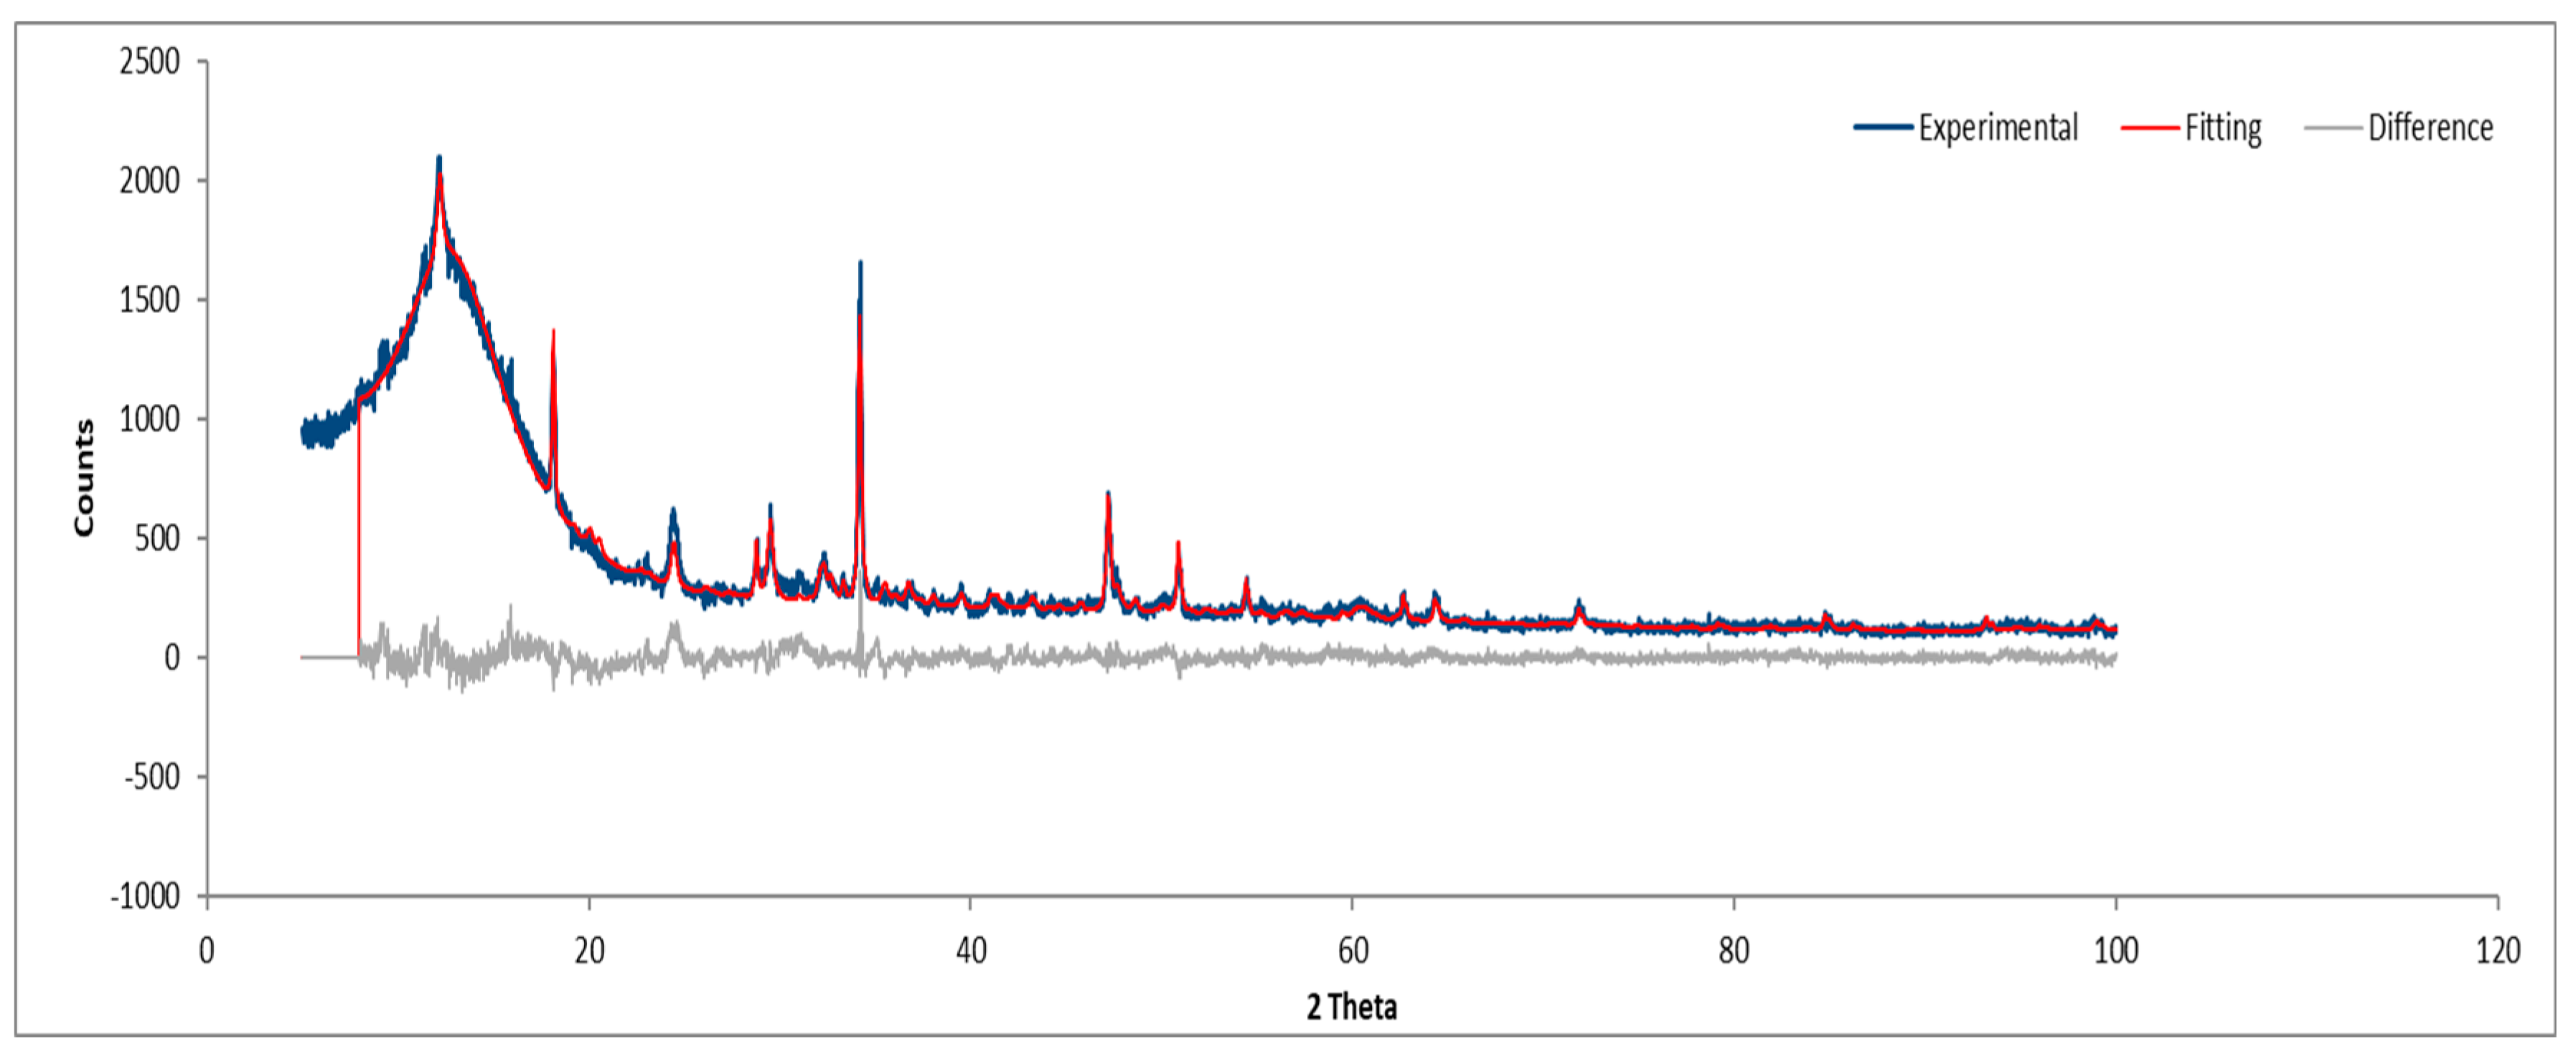
Figure 20.
XRD diffractogram of Sample B powder.
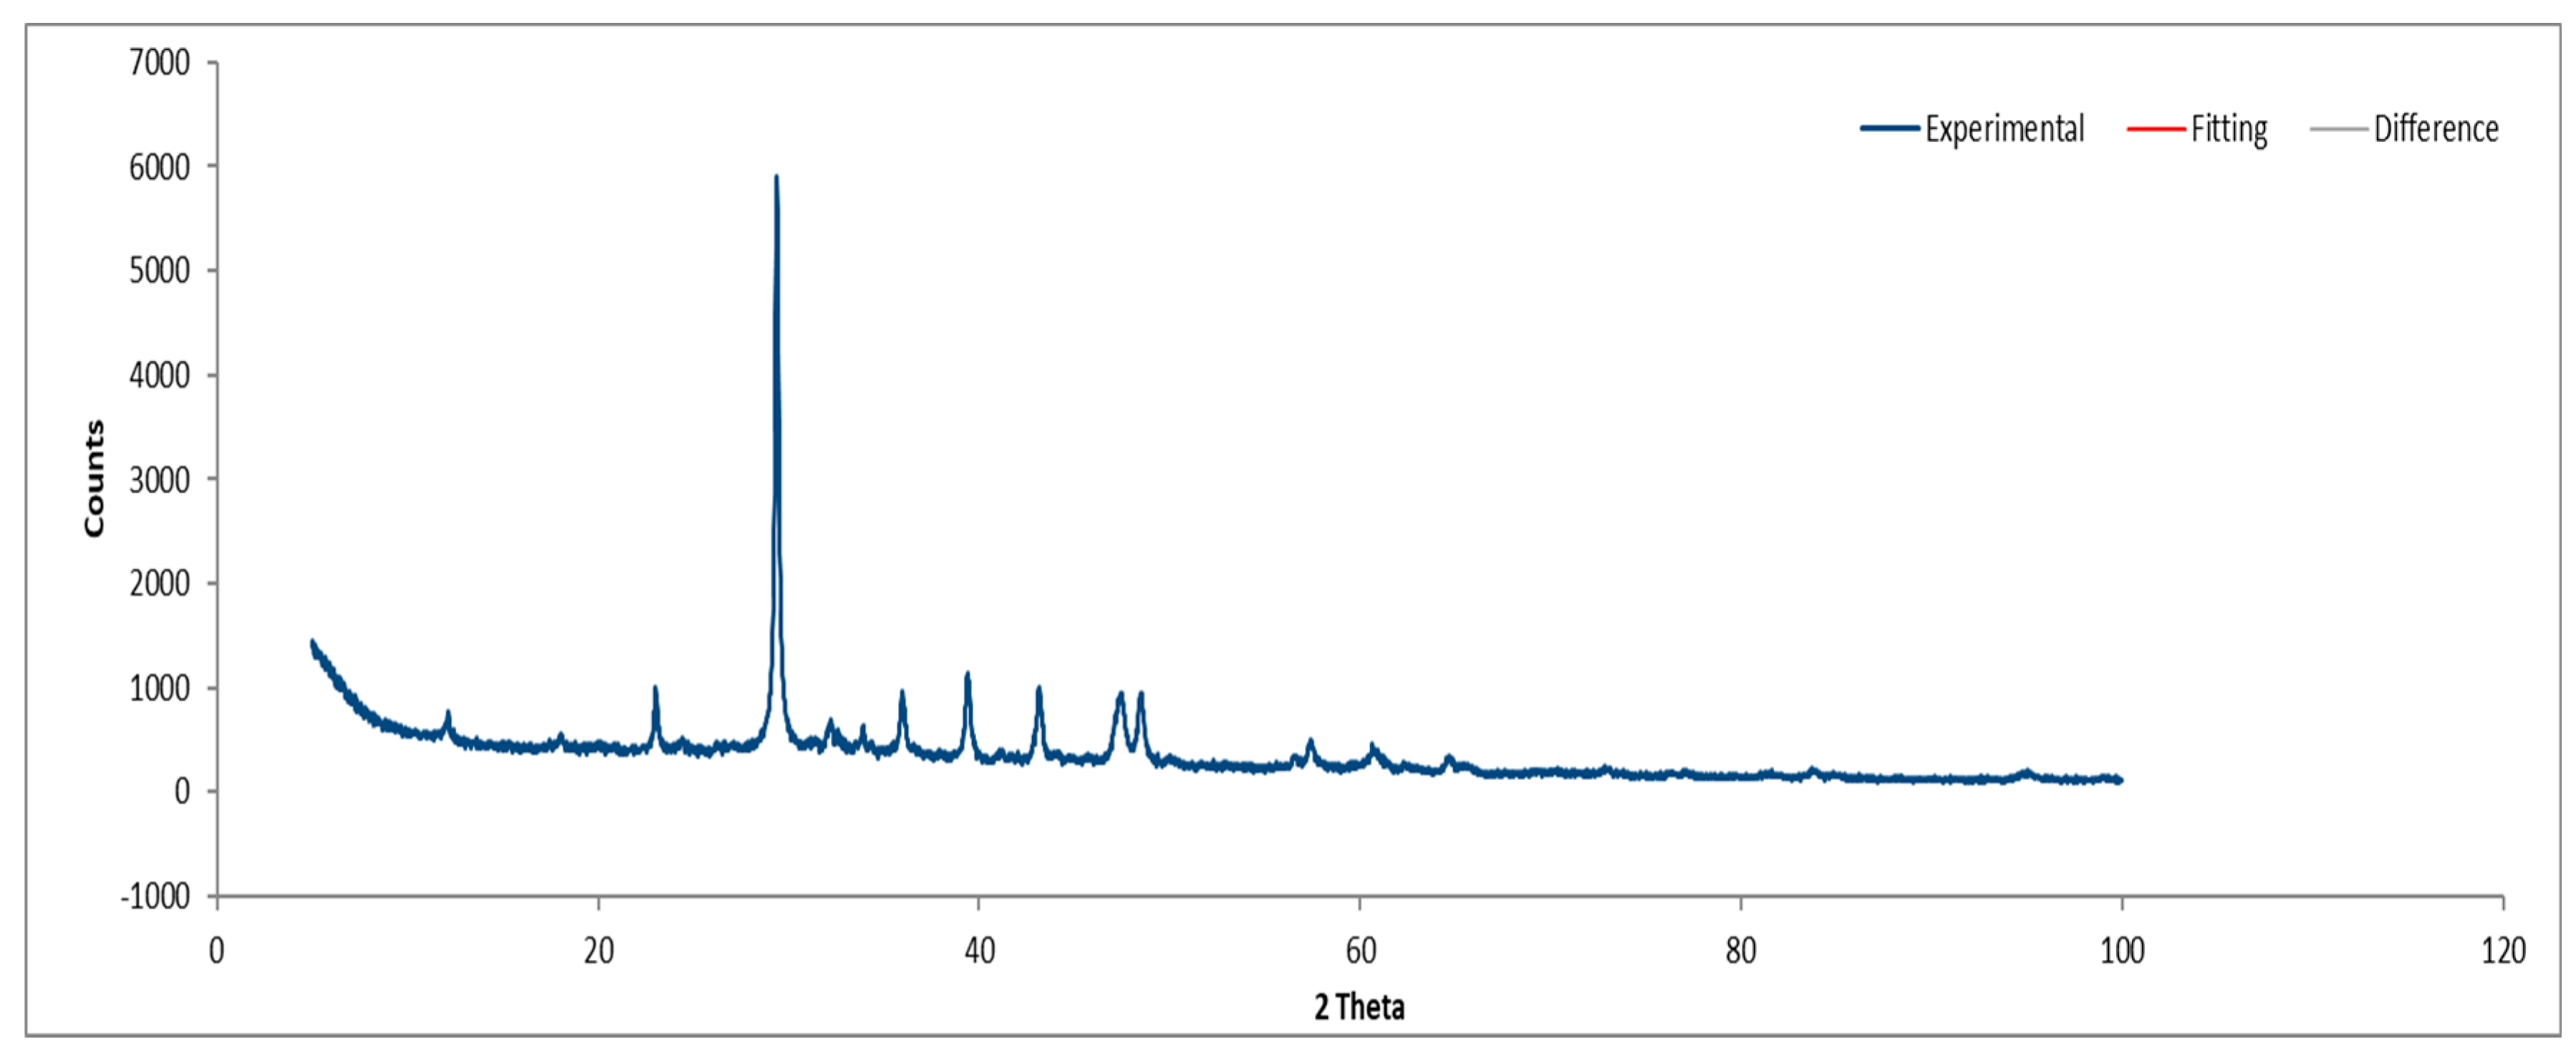
Figure 21.
XRD diffractogram of Sample C plate.
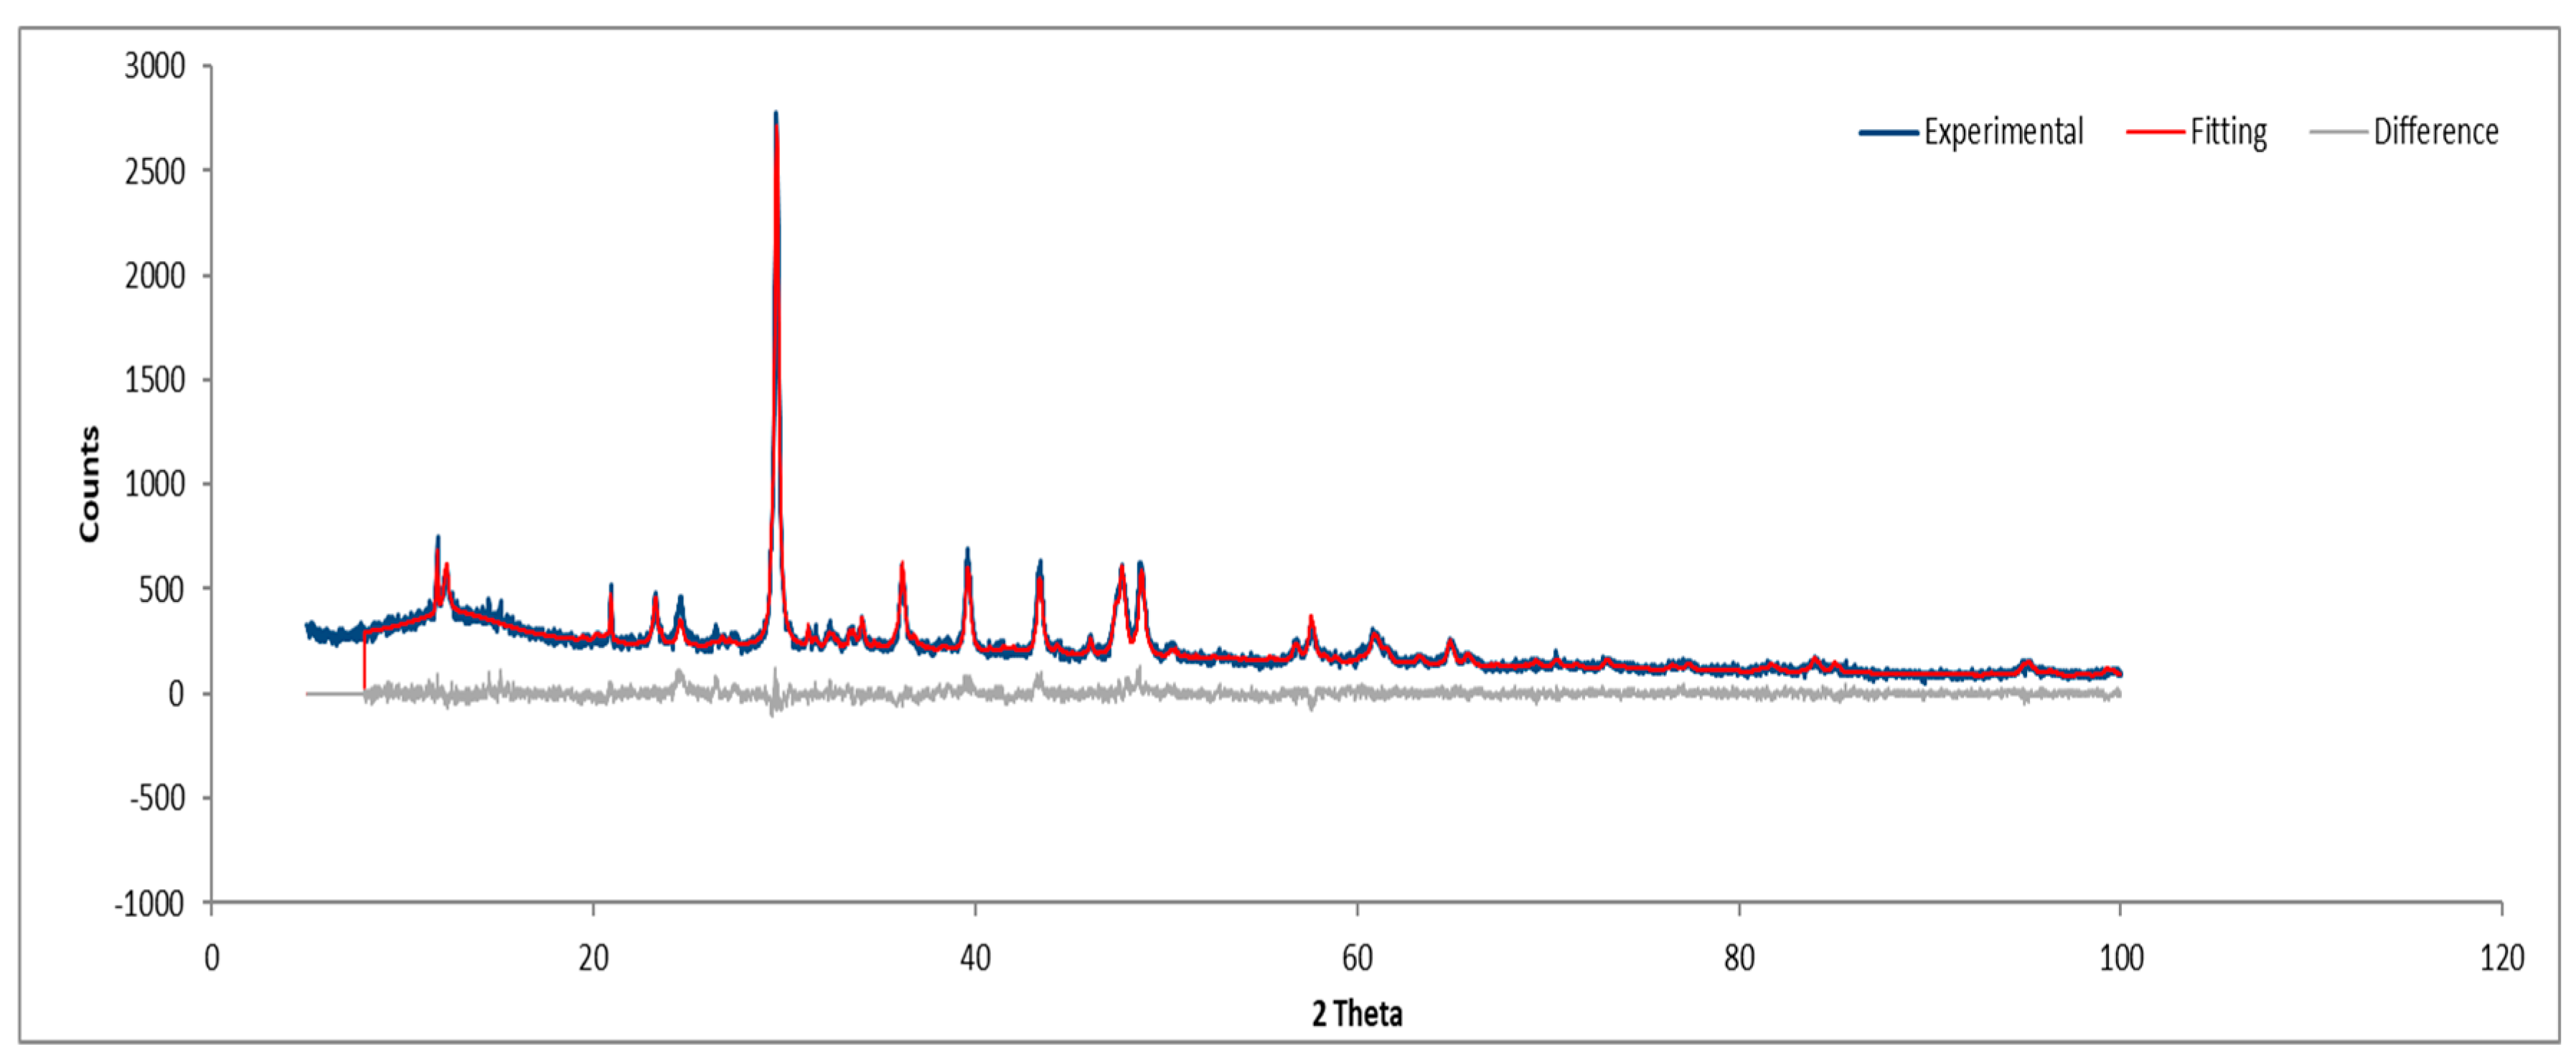
Figure 22.
XRD diffractogram of Sample C powder.
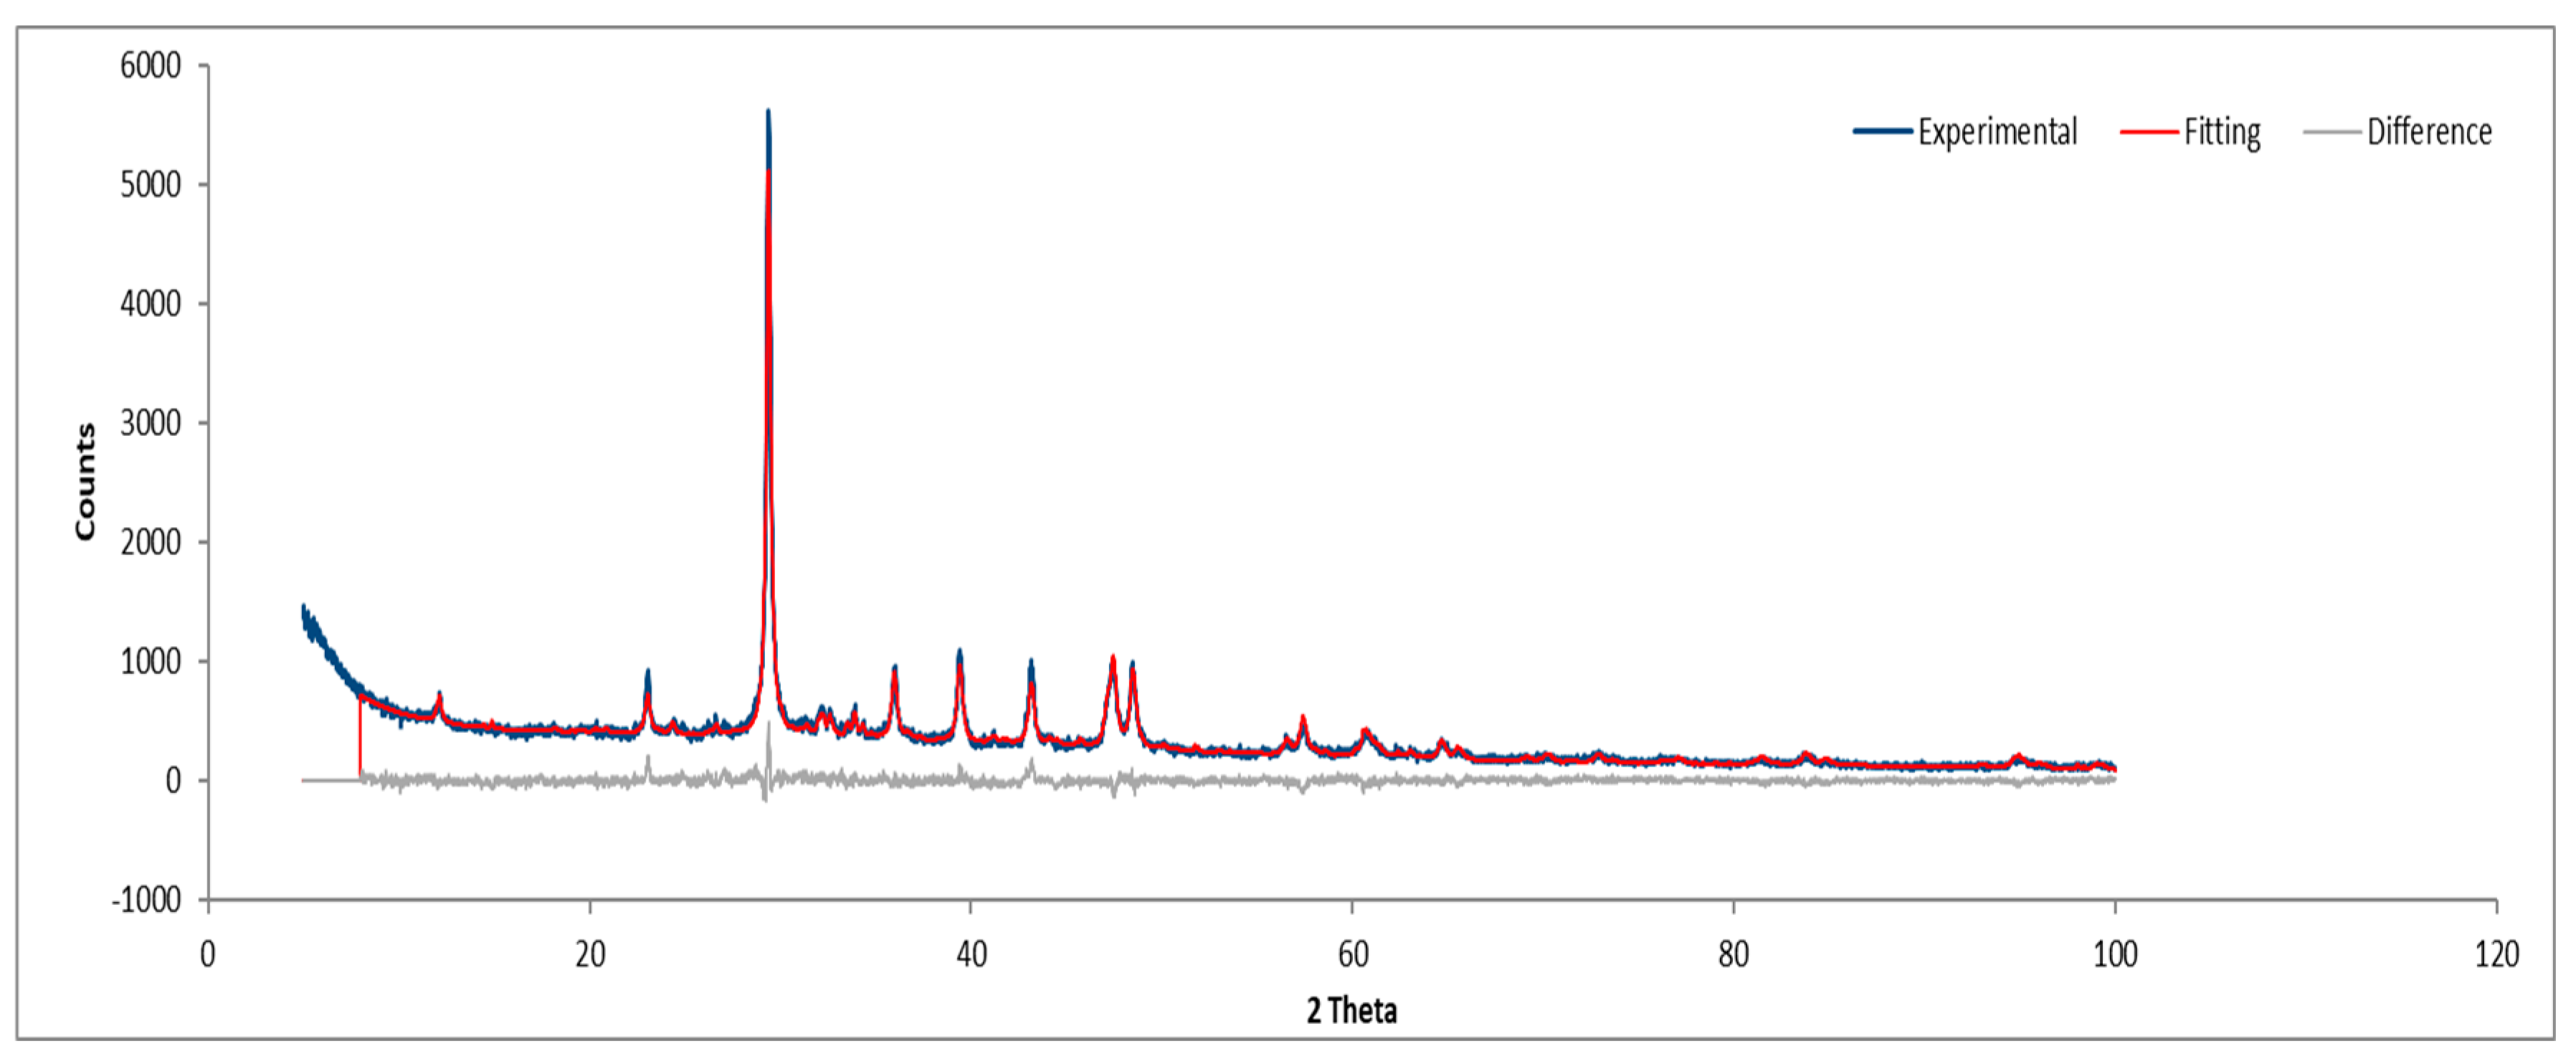
Figure 23.
XRD diffractogram of Sample D plate.
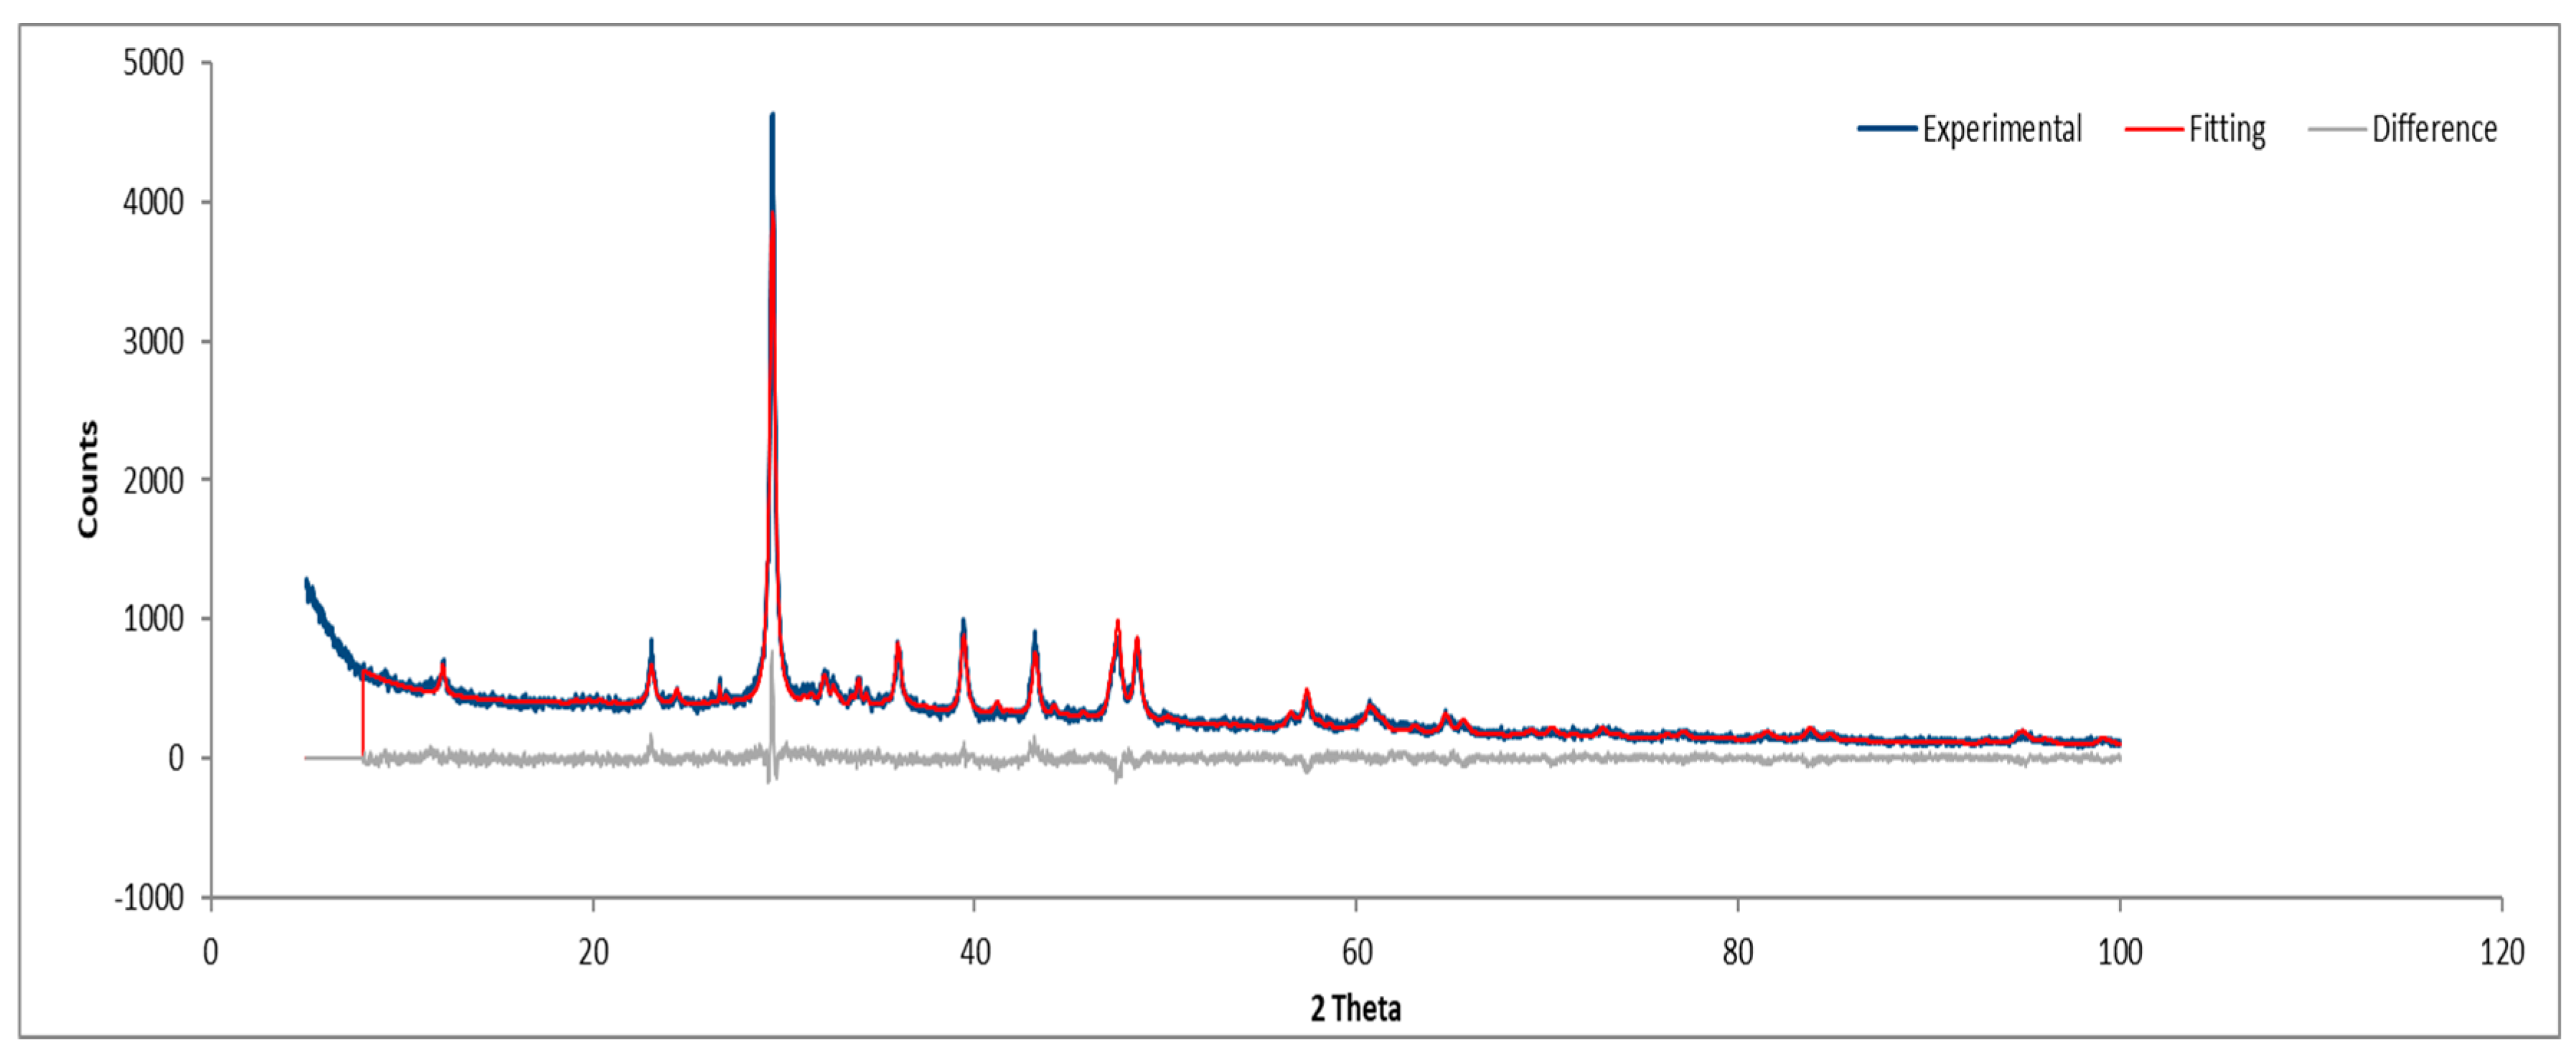
Figure 24.
XRD diffractogram of Sample D powder.
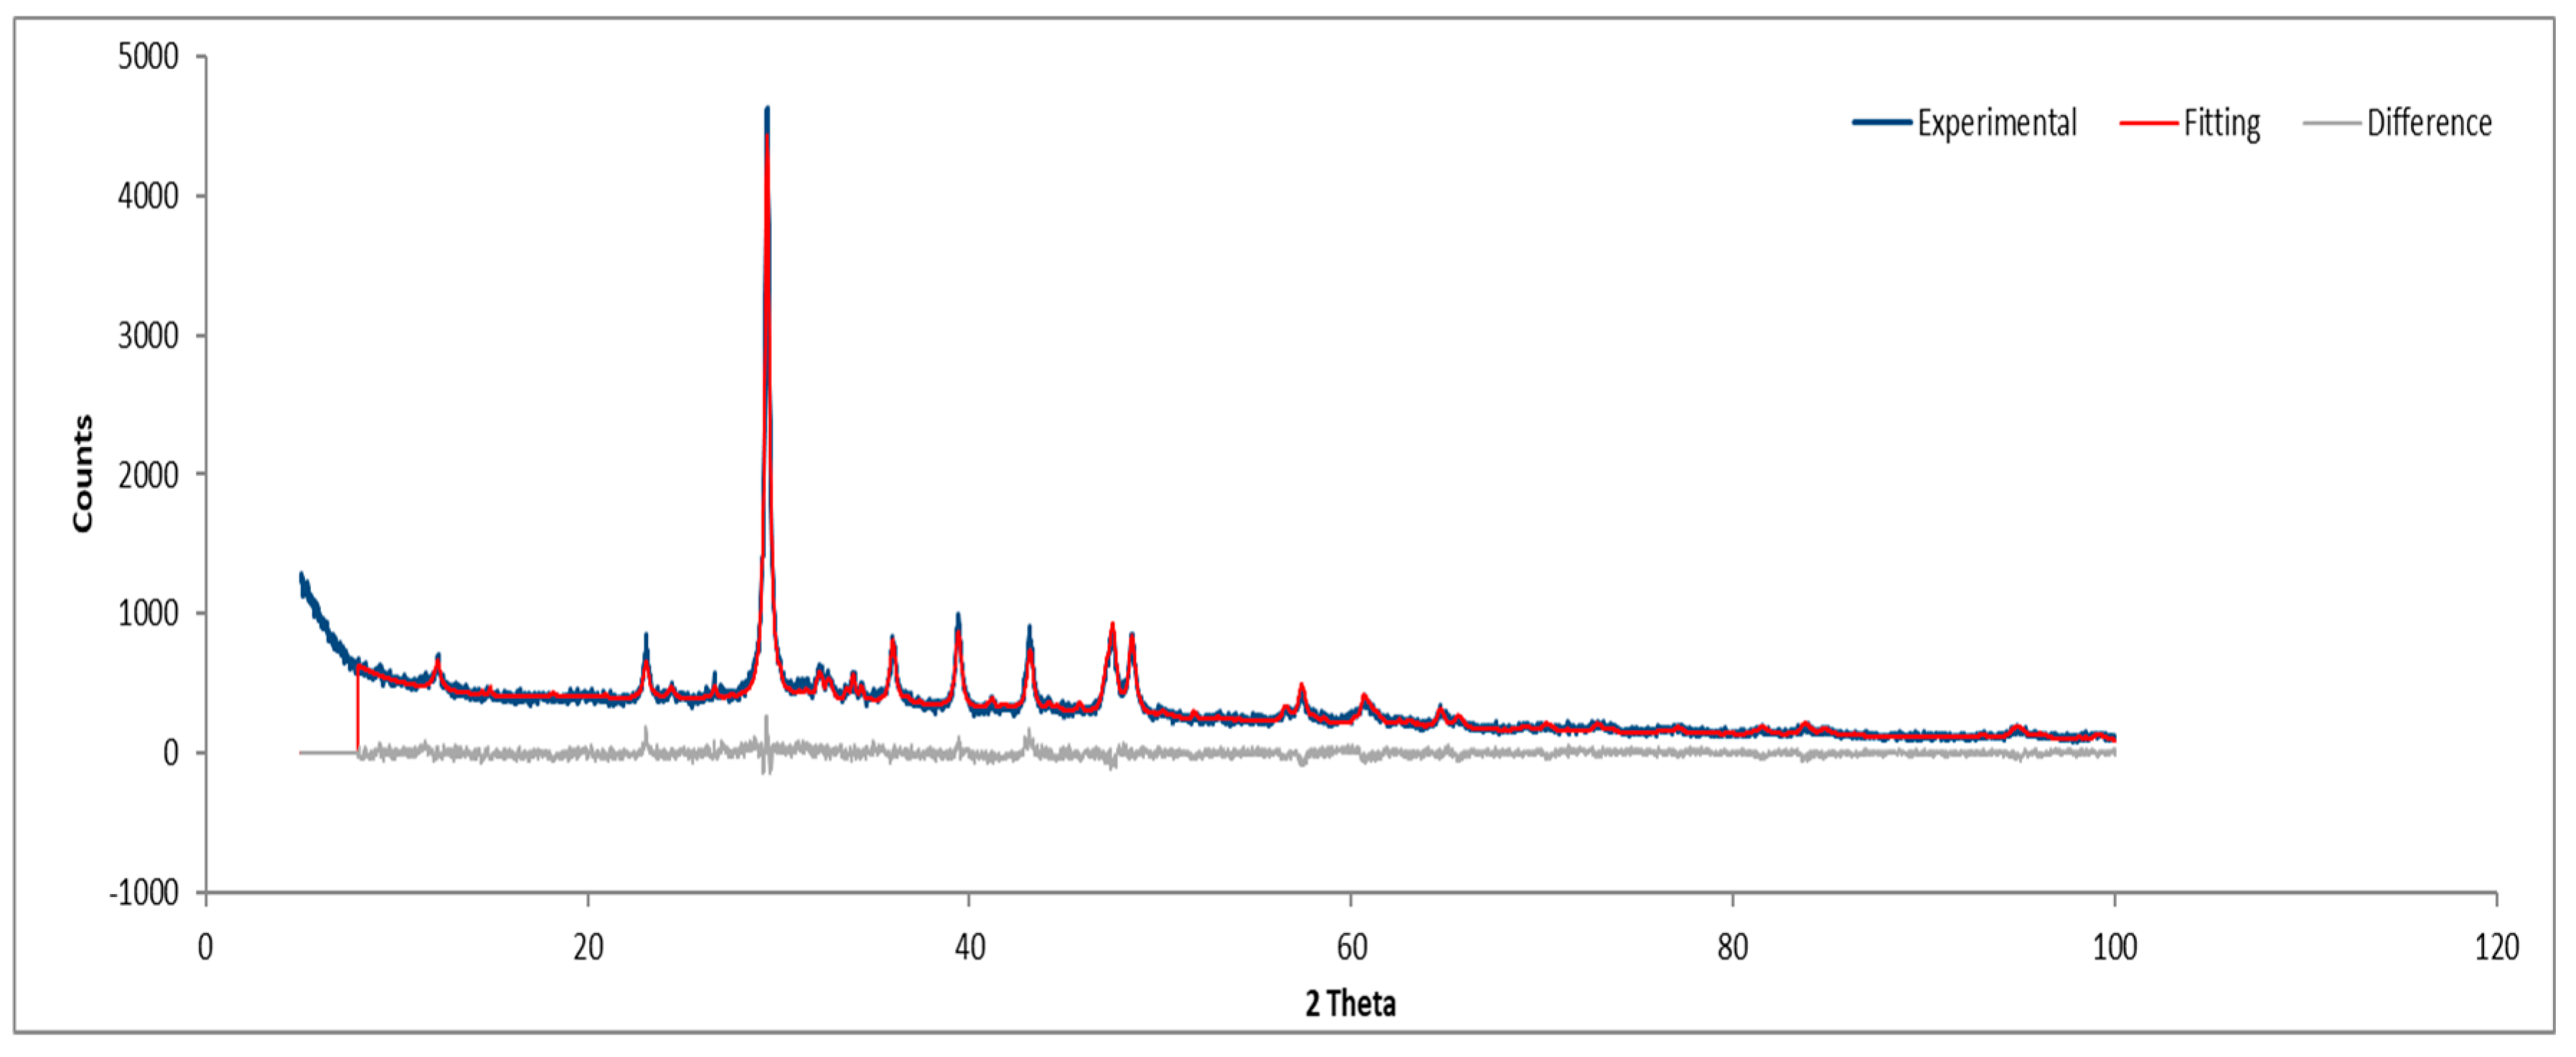

Table 1.
Summary of crystalline phases identified in XRD analysis.
| Powder Samples | Solid Fiber Samples | ||||||||
| A | B | C | D | A | B | C | D | ||
| C2S Beta Larnite | C2S Beta Larnite | 13,60 | 5,76 | 5,94 | 7,23 | 4,68 | 13,97 | 1,95 | 9,12 |
| C3S Alite M1 | C3S Alite M1 | 12,63 | 3,24 | 3,76 | 4,24 | * | 2,64 | * | * |
| C4AF Al Ca2 Fe O5 | C4AF Al Ca2 Fe O5 | 5,19 | 4,35 | 4,68 | 4,70 | 6,23 | 0,22 | 5,89 | 4,31 |
| Calcite, syn | Calcite, syn | 61,50 | 79,78 | 77,45 | 75,71 | 72,71 | 17,13 | 74,05 | 79,92 |
| Gypsum | Gypsum | * | * | * | * | 4,98 | * | 4,21 | * |
| Portlandite, syn | Portlandite, syn | * | * | * | * | * | 32,39 | * | * |
| Quartz, low | Quartz, low | 0,97 | 0,55 | 0,90 | 1,04 | 1,33 | * | 0,52 | 0,55 |
| Magnesium Silicate Hydroxide | Clinochrysotile-2Mc1 | 6,11 | 6,32 | 7,26 | 7,08 | 8,58 | 33,66 | 11,60 | 5,14 |
| Graphite | Graphite | * | * | * | * | 1,48 | * | 1,28 | 0,96 |
| Iron Silicon | Iron Silicon | * | * | * | * | * | * | 0,50 | * |
| 100 | 100 | 100 | 100 | 100 | 100 | 100 | 100 | ||
Disclaimer/Publisher’s Note: The statements, opinions and data contained in all publications are solely those of the individual author(s) and contributor(s) and not of MDPI and/or the editor(s). MDPI and/or the editor(s) disclaim responsibility for any injury to people or property resulting from any ideas, methods, instructions or products referred to in the content. |
© 2025 by the authors. Licensee MDPI, Basel, Switzerland. This article is an open access article distributed under the terms and conditions of the Creative Commons Attribution (CC BY) license (http://creativecommons.org/licenses/by/4.0/).
Copyright: This open access article is published under a Creative Commons CC BY 4.0 license, which permit the free download, distribution, and reuse, provided that the author and preprint are cited in any reuse.


