Submitted:
19 February 2025
Posted:
20 February 2025
Read the latest preprint version here
Abstract
Mealybugs (Hemiptera: Pseudococcidae) are one of the prevalent pests infesting wine grapes in the eastern United States. Their close association with ants (Hymenoptera: Formicidae) provides them protection against natural enemies. In this paper, we present our research on identification of mealybug species and ant genera around vineyard and the effect of the use of sugar dispensers on the populations of ants and mealybug around the vineyard and on fruit cluster infestations. Field trials were carried out in two commercial vineyards in Virginia, United States, with a history of mealybug infestations. The sugar dispensers with and without insecticide were deployed to control ant populations on the vineyard. Pseudococcus maritimus (Ehrhorn) and Ferrisia gilli Gullan were the two species of mealybugs recorded from both sites. Tetramorium Mayr, Lasius Fabricius, Solenopsis molesta (Say), Crematogaster Lund and Pheidole Westwood were some of the dominant ant genera found in close asso-ciation with mealybugs. Ant number remained low in the untreated check throughout the sampling season. Sugar dispensers having insecticide although had higher number of ants, the number started decreasing subsequently throughout the sampling season. Fruit cluster infestation was also higher in the untreated check lacking any sugar dispensers.
Keywords:
Pseudococcus maritimus
; Ferrisia gilli
; ant control
; mealybug management
; pest management
; vineyard
; sugar dispensers
; Lasius
; Tetramorium
; Crematogaster
1. Introduction
Mealybugs (Hemiptera: Pseudococcidae) are prevalent pests present in the grape growing regions around the world [1]. They are the phloem feeders that use their piercing and sucking mouthparts to feed on different parts of grapevine including roots. After feeding, they excrete excess fluid from their body as sugary liquid called honeydew. Ants are attracted to mealybugs for their honeydew, and in return clean mealybug colony, provide protection against the natural enemies and transport them to new feeding sites [2,3,4].
Honeydew is the main reason why ants tend and protect mealybugs. The use of sugar baits or toxic sugar baits allocated in small doses over the vineyard as an alternative food source to honeydew is more effective in targeting not only the foragers, but the entire nest is fed by them [5]. The forager ants when fed on toxicants present in insecticide dispensers baited with sugar are not killed immediately, but the toxicants are diluted when passed on from one ant to another during feeding. The process is trophallaxis, which is a nutritive fluid-exchange observed in social insects and some nonsocial insects. It helps baits with a low concentration of toxicants to reach from vines to ant nests and recruit more ants to the bait [6,7]. Hence rather than killing a single ant, this process can effectively control ants on a larger scale
Chemical control is one of the primary methods of mealybug management in vineyards [8]. In an alternative, studies have been conducted utilizing association between ants and mealybugs to control ants and its subsequent effect on mealybug populations in the vineyard [5,9,10,11]. Granular insecticides, liquid baits and insecticide-laced sugar provisioning have been tested in the field to control ant activity [5,9,10,11,12] and have provided effective control of ants and mealybugs. Artificial sugar dispensers have been deployed in the field with or without insecticides [5,9]. These methods could be effective in controlling ant populations, as instead of providing immediate control, ants take these materials back to the nest and hence divert attention from the mealybugs.
Therefore, our study aimed at recording the mealybug populations and ant genera around the vineyard. We monitored the distribution of populations of ants and mealybugs before and after deploying sugar dispensers and sugar-toxicant dispensers in the vineyard. During the harvest season, we also assess the level of mealybug infestations in the sampled area with and without the dispensers. The analysis reported here has shed some light on important ant genera in vicinity of mealybugs and the potential of sugar dispensers in controlling ants and mealybugs infestations in the vineyard.
2. Materials and Methods
2.1. Field Sites and Experimental Design
The ant-mealybug experiment was carried out in two vineyard sites: Orange County (vineyard HV), and Fauquier County (vineyard PC), Virginia, USA. Vineyards were selected based on the availability and pest pressure recorded by the researcher in the previous years. These are conventional vineyards, relying on synthetic insecticides for pest management. Each vineyard block was more than 10 years old and had a previous history of mealybug infestations. The trial was carried out in an area of 0.283 to 0.081 hectare inside each vineyard. Each experimental area was divided into three plots: control plots, sugar dispenser plots (SD), and sugar dispenser with insecticide (SDI) plots (Figure 1). The control plots were separated from other treatment plots by 10 to 20 meters. Two to three vine rows distance were maintained between the SD and SDI plots.
2.2. Sugar Dispensers
The sugar dispensers used in the field is based on earlier research by Daane, et al. [5] and repeated by Parrilli, et al. [11]. 250 ml HDPE narrow mouth bottles, assembled with white polypropylene closure were modified into dispenser (The Lab Depot, Dawsonville, GA). A 1 cm circular hole was drilled in the cap of the tube and a permeable mesh was placed between the tube and the cap. A 5.08 cm garden slotted mesh net cup was placed outside the cap with a plastic mesh outside to allow the entry of ants, but not bees (Fig. 1). Sugar dispensers, if improperly set up, could have a detrimental effect on bees in the vineyard.
We deployed 12-16 dispensers (Fig. 1) in four rows of vines, evenly placing them after every 5-10 plants through the experimental plots. They were deployed at the beginning of June and removed in the second week of September. A gap of 2-5 rows of grapevines was maintained in between each of the two treatments. The insecticide used for ant control was Greenway liquid ant-killing bait with the active ingredient 1% disodium octaborate tetrahydrate. Each of the dispensers was refilled and cleaned every one to two weeks.
2.3. Mealybug Species
Most of the mealybug species were identified and photographed in the field based on morphology. Some representatives were taken back to the laboratory for identification. Some of the samples were pooled out and identified by multiplex PCR using mitochondrial cytochrome oxidase subunit one gene based on Daane, et al. [13]. The mealybug numbers were also counted in the vineyard by using a 5-minute visual count.
2.4. Ant Activity
Ant populations in the vineyard were monitored and sampled weekly in all three treatment plots by both 1. Pitfall trapping 2. 1-minute visual count. 50 ml falcon centrifuge tubes were used for pitfall trapping, with 75% alcohol and a few drops of ethylene glycol as the preservative [14,15,16,17,18]. The advantage of using ethanol is that it does not attract ant species differentially. A total of 5-8 pitfall traps were placed randomly per experimental plot per site. Ant activity was also monitored by counting the number of ants crossing an imaginary line of 20 cm in length and in between the vine canopy and above the dispensers on the trunk for 1-minute. The vines for the visual count and pitfall trap placement were selected randomly to represent the whole plot. The ants were collected in 70% ethanol and taken back to the lab for identification using the identification keys [19].
2.5. Data Analysis
The foraging activity of the different ant species was calculated by the mean number of each ant species collected throughout the season. The data were first transformed using log transformation to check for homogeneity. As the data were not normally distributed, they were analyzed using Steel's method for nonparametric multiple comparisons with control. The Steel criterion uses the Wilcoxon test statistic in the pairwise comparisons of the standard control sample with each of the treatment samples [20]. Data were analyzed based on count per sampling date and total count throughout the season.
Before the commercial harvest, 25 fruit clusters per treatment in each replicate were evaluated using the following scoring system: 0= no mealybug or honeydew, 1=honeydew and five or fewer mealybugs, 2=honeydew and six to nine mealybugs, 3=honeydew and more than ten mealybugs, and 3=honeydew and egg mass). Fruit clusters with a score of 2 and 3 were considered unmarketable or extremely infested. Fruit cluster infestation was analyzed using Wilcoxon paired test [21].
Multivariate analysis was used to analyze the relation between the number of ants per minute, the number of mealybugs per vine, and the percentage of cluster damage for each of the sites. For the statistical analysis, we used the JMP Pro software package.
3. Results
3.1. Mealybug Species in the Vineyard
Two species of mealybugs were identified in the field and confirmed by multiplex PCR as Pseudococcus maritimus and Ferrisia gilli.
3.2. Ant Activity in the Vineyard
A total number of 1131 specimens of ants were collected in total (674 samples from HV vineyard and 457 from PC vineyard) over the whole field season, representing 12 genera of ants. Ants were identified up to genus level due to time constraint. The top five leading foragers in the vineyards include Tetramorium Mayr, Lasius Fabricius, Solenopsis molesta (Say), Pheidole Westwood, and Crematogaster Lund based on 1-minute count and pitfall trap data (Figure 2).
3.2.1. Field Studies with Sugar Dispensers
Fewer number of ants were observed and captured in the control treatment throughout the season. The sugar dispensers with insecticide bait initially attracted a higher number of ants during the initial few weeks of deployment and started decreasing throughout the season. In comparison to the other treatments, sugar baits attracted a higher number of ants throughout the season (Figure 3).
3.2.2. 1-Minute Count on the Trunk
Field analysis of the mean number of ants was calculated as average value for the entire season as well as per sampling dates. During the 1-minute count data analyses, the mean densities of ants in the SD and the SDI treatments were not significantly different from the density in the control before the placement of dispensers (Table 1: vineyard PC: Z: -0.274, p=0.946 for SD: control; Z: -0.508, p=0.829 for SDI: control; and vineyard HV: Z= -0.168, p=0.397 for SD: control; Z= -1.509, p=0.226 for SDI: control) for both vineyards.
When data were compared per sampling dates, the densities were not statistically significant for most of the sampling dates (Table 1) in both vineyards HV and site PC during the deployment of sugar dispensers. The mean densities of ants for the entire sampling period have different data analysis results. In vineyard PC, there was no significant difference in the mean densities of ants present in SDI treatment compared to the control (Table 2: Z=-0.17, p=0.97). However, there was a significant difference between the mean densities of ants present in the SD treatment in comparison to the control (Table 2: Z=4.02, p=0.0001). The result was just the opposite for vineyard HV. There is a significant difference in the mean densities of ants present in SDI treatment compared to the control (Table 2: Z=2.41, p=0.04). However, there was no significant difference between the mean densities of ants present in the SD treatment in comparison to the control (Table 2: Z=1.42, p=0.33).
3.2.3. Pitfall Trap Data
The mean densities of ants in the sugar bait and the ant bait treatments were not significantly different from the density in the control before the placement of ant dispensers in vineyard PC (Table 3: Z=-0.86, p=0.59 for SD: control; Z=-0.68, p=0.65 for SDI: control); and vineyard HV (Table 3: Z=-0.57, p=0.78 for SD: control; Z=-1.56, p=0.205 for SDI: control).
Like the one-minute data count, the pitfall trap data were analyzed for each of the sampling dates as well as the total sampling duration. When data were compared per sampling dates, the densities were not statistically significant for most of the dates (Table 3 and 4) in both vineyards during the deployment of sugar dispensers. The mean densities of ants for the entire sampling period have different results compared to the one-minute count. There was a significant difference in the mean densities of ants present in both the SDI and SD treatment compared to the control in vineyard PC (Table 4: Z=5.04, p=<0.001 for SD: control, and Z=3.604, p=0.0006 for SDI: control). There was also a significant difference in the mean densities of ants present in both the SDI and SD treatments compared to the control in vineyard HV (Table 4: Z=3.03, p=0.0047 for SD: control, and Z- score: 2.52, p=0.022 for SDI: control).
3.2.4. Fruit Cluster Injury Due to the Presence of Mealybugs
In vineyard HV, 50% of the infested clusters evaluated were from the control treatment, while 33% were from the SD treatment and 17% from the SDI treatment. In vineyard PC, 42% of the infested clusters evaluated were from the control treatment, while 37% were from the SD treatment and 21% from the SDI treatment (Figure 4). The nonparametric test for the fruit cluster infestation had similar results in both vineyards. The cluster infestation level was significantly different for sugar-toxicant bait in comparison to the control for both sites (vineyard PC: Z=2.034, p=0.0419; and vineyard HV: Z=3.005, p=0.0027 for SDI: control). On the other hand, the cluster infestation level between SD treatment in comparison to the control in both vineyards were not significantly different (vineyard PC: Z= -1.634, p=0.1023; vineyard H: Z=-1.863, p=0.0624 for SD: control).
3.2.5. Relation Between Ants, Mealybugs and Cluster Infestation
For the multivariate data analysis, we compared the data of ant densities, mealybug densities, and cluster injury data for the whole sampling season. For vineyard PC, the correlation coefficient between the number of ants per minute and the number of mealybugs per vine is low, positive, and not significant (r=0.158; p=0.097) in the control treatment. In the same treatment, the correlation coefficient between both the number of ants per minute as well as the number of mealybugs per vine and cluster damage is low, positive, and not significant (r=0.0641; p=0.76 for ant number; r=0.06; p=0.77 for mealybugs number). These weak-to-low correlation coefficient values imply that changes in one domain are not correlated strongly with changes in the related domain.
For the SDI treatment in vineyard P, the correlation coefficient between the number of ants per minute and the number of mealybugs per vine is low, positive, and significant (r=0.1882; p=0.0489). In the same treatment, the correlation coefficient between both the number of ants per minute and the cluster damage is weak, positive, and not significant (r=0.326; p=0.11). The number of mealybugs per vine and cluster damage has a moderate correlation coefficient with a highly significant effect (r=0.768, p<0.0001).
For the SD treatment in vineyard PC, the correlation coefficient between the number of ants per minute and the number of mealybugs per vine is low, positive, and not significant (r=0.037; p=0.69). In the same treatment, the correlation coefficient between both the number of ants per minute as well as the number of mealybugs per vine and cluster damage is low, positive, and not significant (r=0.175; p=0.401 for ant number; r=0.077; p=0.71 for mealybugs number).
For vineyard HV, the correlation coefficient between the number of ants per minute and the number of mealybugs per vine is weak, positive, and significant (r=0.2524; p=0.0239) in the control treatment. In the same treatment, the correlation coefficient between both the number of ants per minute as well as the number of mealybugs per vine and cluster damage is weak, positive, and not significant (r=0.177; p=0.397 for ant number; r=0.261; p=0.206 for mealybugs number).
For the SDI treatment in vineyard HV, the correlation coefficient between the number of ants per minute and the number of mealybugs per vine is weak, positive, and significant (r=0.337; p=0.0022). In the same treatment, the correlation coefficient between the number of ants per minute and the cluster damage is weak, positive, and not significant (r=0.0773; p=0.713). The number of mealybugs per vine and cluster damage has a moderate correlation coefficient with a highly significant effect (r=0.595, p=0.0017).
For the SD treatment in vineyard HV, the correlation coefficient between the number of ants per minute and the number of mealybugs per vine is weak, positive, and not significant (r=0.119; p=0.291). In the same treatment, the correlation coefficient between the number of ants per minute and the cluster damage is weak, positive, and not significant (r=0.1035; p=0.47). The number of mealybugs per vine and cluster damage has a moderate correlation coefficient with a highly significant effect (r=0.779, p<0.0001).
4. Discussion
This work represents the ant species collected by pitfall traps and one-minute count in two different vineyards in Virginia. This collection does not account for all the species of ants encountered in vineyards in Virginia. More intensive data collection is needed to reveal the species diversity of ants in vineyards in Virginia. Despite some of the drawbacks, these data best represent the specimens captured during the field trial.
Fifteen genera of ants were recorded foraging around commercial vineyards in Virginia in 2022. Among those ants, Tetramorium ant remains the dominant ant in both vineyards followed by the thief ant, the Lasius genus (garden ant), the odorous house ant (Tapinoma sessile), and the Pheidole genus (big-headed ants). During the field research, some of the ant species seen in close association to and tending after the mealybugs include genus like Crematogaster- the acrobat ant, especially species C. ashmeadi Emery and C. pilosa Emery, Tetramorium- the pavement ant, Lasius- the garden ant, and Solenopsis molesta- the thief ant.
Crematogaster ashmeadi and C. pilosa are arboreal ants native to the southeastern United States [22,23,24]. They are commonly known as acrobat ants because of the way the workers hold up their abdomen over the rest of the body when disturbed. They mostly nest in trees, logs, fallen branches, and in hollow stems of plants. These ants were seen in the grapevine under the bark, actively tending mealybugs and raising their abdomen up when alarmed or disturbed. As seen on the field, they also pick mealybugs up and transfer them to safe places when disturbed.
Tetramorium and Lasius have been two of the dominant genera seen in association with mealybugs, the former is subterranean, and the latter is arboreal [25]. Like Crematogaster, they were seen actively defending and moving mealybugs around to safer sections of the grapevines. Among the common genera of ants in the vineyard, Pheidole, and S. molesta are widespread generalists [26,27].
One of the drawbacks of using pitfall trap is the underrepresentation of subterranean ants and the high representation of epigeic ants. Some of the arboreal ants (e.e. Crematogaster and Lasius) included in the sample are also active on the surface. Some of the epigeic and subterranean ants are underrepresented in the one-minute visual count for ants in the trunk [18,28]. The pitfall traps were installed as soon as they reached the field early in the morning and taken back when leaving the field, the same day. In addition, the vineyards are mostly surrounded by wooded areas and hence may have contained ant species present in the forests as well.
The use of two different types of dispensers had a different effect on the pest densities in the vineyards. The result can be traced back to the varying effects of these dispensers on the activities of ants. The ant densities were similar in all the treatments before the deployment of dispensers. Although the ant densities were not significantly different across different treatments for each of the sampling dates for pitfall trap data, the data evaluation for the entire sampling period revealed significant differences in ant densities across different treatments when compared to the control. This result is similar to previous research on the use of dispensers [11]. The data evaluation for the entire sampling period for one-minute visual count data revealed a significant difference in ant densities in areas having sugar dispensers compared to the control in one of the sites and in areas having insecticide-laced sugar dispensers compared to the control in another site. The result is comparable to the previous research by Beltrà, et al. [9] and Perez-Rodriguez, et al. [29]. Thus, insecticide-laced sugar dispensers may reduce ant populations in vineyards, which could serve as an effective means for control of mealybugs in vineyards.
One of the important aspects of the experiment was the ant distribution in the presence of dispensers. During the initial days of dispenser deployment, ant densities were numerically higher in the plots containing insecticide-laced sugar dispensers compared to sugar dispensers and control. The distance between plots having two different kinds of dispensers was maintained at 4.3 to 6.4 meters distance. One of the promising aspects of using insecticide-laced sugar dispensers was seen two weeks later when numerous groups of two ants were seen carrying around many dead/sick ants. By the second week of July, most of the ant nests around the treatment region having ant toxicants were gone. I only saw a few foraging/wandering ants or a few new ant nests seen on that section of the field.
Contrary to sugar dispensers having insecticide treatment, sugar dispensers lacking insecticide treatment had lower densities of ants during the initial days of dispenser deployment and slowly the ant number starts increasing in a few weeks. By the third week of August, even in the trunk containing dispensers, more ants were seen around mealybugs than on the dispensers. The number of ant foragers at ant baits increasing over time can be explained by pheromone recruitment and the establishment of foraging trails [30].
The use of sugar/ant dispensers has often been combined with other methods of biological control like the use of predators or parasitoids [9,11]. The parasitization rate and predation rates on different treatments were not included in our study due to time constraints. Previous studies have recorded a significant increase in the predation pressure and parasitization rates in mealybugs when sugar dispensers were deployed [9,11,29].
A weak to low correlation exists between ant densities and mealybug densities in the control ant bait and sugar bait treatments, which suggests the changes in ant densities have a very little or weak effect on mealybug densities. A moderate correlation exists between mealybug densities and cluster injury due to mealybugs, which suggests changes in mealybug densities have a moderate effect on cluster injury. Although some of the results were significant, a strong correlation between the number of ants per minute, and the number of mealybugs per vine with the cluster infestation was lacking in our data. There is a weak correlation, however the use of dispensers in our study has led to numerically lesser ant activities, mealybugs numbers and cluster injury in the treatment area having ant baits with ant toxicants. A further study might be needed to study the effect of multiple years of placement of dispensers on ant activity, mealybug levels and cluster infestation rate on the vineyard. The dispensers should be continuously deployed for more than two consecutive years for increasing their efficacy against vineyard-dwelling ant populations [3].
5. Conclusions
The ants and mealybug population in the field can be managed effectively using sugar dispensers, especially the one having ant insecticide as reported from previous similar studies [5,9,10,11]. One of the time-consuming aspects of the dispensers used in the field started from the assemblage of all the tiny pieces of the sugar dispenser and its delivery. The current dispenser is more suitable for small- to medium-sized vineyards, which require a limited number of dispensers. More research should be carried out to optimize and improve the installation and maintenance to make it more friendly for vineyards of varying sizes.
Author Contributions
The following statements should be used “Conceptualization, P.C., D.G.F., T.K., M.N., C.B. and T.J.; methodology, P.C., D.G.F., T.K., M.N., C.B. and T.J.; software, P.C.; validation, P.C., D.G.F., T.K., M.N., C.B. and T.J.; formal analysis, P.C.; investigation, P.C., D.G.F., T.K., M.N., C.B. and T.J.; resources, P.C., R.M.; data curation, P.C.; writing—original draft preparation, P.C.; writing—review and editing, P.C., D.G.F., T.K., M.N., C.B. and T.J.; visualization, P.C.; supervision, P.C., D.G.F., T.K., M.N., C.B. and T.J.; project administration, R. M.; funding acquisition, D.G.P. All authors have read and agreed to the published version of the manuscript.
Funding
This research was funded by Virginia Wine Board (Virginia, United States).
Data Availability Statement
Our data are available online at MDPI page.
Acknowledgments
We would like to thank Dr. Donald Mullins, and Sandra Gabbert for allowing us to use their laboratory. We would also like to thank Dr. Chin-Cheng Scotty Yang and Virginia Tech Insect ID lab for help in ant identification.
Conflicts of Interest
The authors declare no conflicts of interest. The funders had no role in the design of the study; in the collection, analyses, or interpretation of data; in the writing of the manuscript; or in the decision to publish the results.
References
- Mani, M.; Amala, U. Fruit Crops: Grapevine. In Mealybugs and their Management in Agricultural and Horticultural crops; Mani, M., Shivaraju, C., Eds.; Springer India: New Delhi, 2016; pp. 329–351. [Google Scholar]
- Cheng, S.; Zeng, L.; Xu, Y. Mutualism between fire ants and mealybugs reduces lady beetle predation. Journal of Economic Entomology 2015, 108, 1560–1569. [Google Scholar] [CrossRef] [PubMed]
- Daane, K.M.; Sime, K.R.; Fallon, J.; Cooper, M.L. Impacts of Argentine ants on mealybugs and their natural enemies in California’s coastal vineyards. Ecological Entomology 2007, 32, 583–596. [Google Scholar] [CrossRef]
- Xu, C.; Su, J.; Qu, X.; Zhou, A. Ant-mealybug mutualism modulates the performance of co-occurring herbivores. Scientific Reports 2019, 9, 13004. [Google Scholar] [CrossRef]
- Daane, K.M.; Cooper, M.L.; Sime, K.R.; Nelson, E.H.; Battany, M.C.; Rust, M.K. Testing baits to control Argentine ants (Hymenoptera: Formicidae) in vineyards. Journal of Economic Entomology 2008, 101, 699–709. [Google Scholar] [CrossRef]
- Rust, M.K.; Reierson, D.A.; Klotz, J.H. Delayed toxicity as a critical factor in the efficacy of aqueous baits for controlling Argentine ants (Hymenoptera: Formicidae). J Econ Entomol 2004, 97, 1017–1024. [Google Scholar] [CrossRef]
- Wcislo, W.T. Trophallaxis in weakly social bees (Apoidea). Ecological Entomology 2015, 41, 37–39. [Google Scholar] [CrossRef]
- Franco, J.C.; Zada, A.; Mendel, Z. Novel approaches for the management of mealybug pests. In Biorational Control of Arthropod Pests: Application and Resistance Management; Ishaaya, I., Horowitz, A.R., Eds.; Springer Netherlands: Dordrecht, 2009; pp. 233–278. [Google Scholar]
- Beltrà, A.; Navarro-Campos, C.; Calabuig, A.; Estopà, L.; Wäckers, F.L.; Pekas, A.; Soto, A. Association between ants (Hymenoptera: Formicidae) and the vine mealybug (Hemiptera: Pseudococcidae) in table-grape vineyards in Eastern Spain. Pest Manag Sci 2017, 73, 2473–2480. [Google Scholar] [CrossRef]
- Daane, K.M.; Sime, K.R.; Hogg, B.N.; Bianchi, M.L.; Cooper, M.L.; Rust, M.K.; Klotz, J.H. Effects of liquid insecticide baits on Argentine ants in California's coastal vineyards. Crop Protection 2006, 25, 592–603. [Google Scholar] [CrossRef]
- Parrilli, M.; Profeta, M.; Casoli, L.; Gambirasio, F.; Masetti, A.; Burgio, G. Use of sugar dispensers to disrupt ant attendance and improve biological control of mealybugs in vineyard. Insects 2021, 12, 330. [Google Scholar] [CrossRef]
- Nondillo, A.; Andzeiewski, S.; Bello Fialho, F.; Bueno, O.C.; Botton, M. Control of Linepithema micans (Hymenoptera: Formicidae) and Eurhizococcus brasiliensis (Hemiptera: Margarodidae) in vineyards using toxic baits. Journal of Economic Entomology 2016, 109, 1660–1666. [Google Scholar] [CrossRef]
- Daane, K.M.; Middleton, M.C.; Sforza, R.; Cooper, M.L.; Walton, V.M.; Walsh, D.B.; Zaviezo, T.; Almeida, R.P. Development of a multiplex PCR for identification of vineyard mealybugs. Environ Entomol 2011, 40, 1595–1603. [Google Scholar] [CrossRef]
- Bestelmeyer, B.T.; Wiens, J.A. The effects of land use on the structure of ground-foraging ant communities in the Argentine Chaco. Ecological Applications 1996, 6, 1225–1240. [Google Scholar] [CrossRef]
- Calixto, A.; Marvin, K.; Dean, A. Sampling ants with pitfall traps using either propylene glycol or water as a preservative. Southwestern Entomologist 2007, 32, 87–91. [Google Scholar] [CrossRef]
- Wike, L.D.; Martin, F.D.; Paller, M.H.; Nelson, E.A. Impact of forest seral stage on use of ant communities for rapid assessment of terrestrial ecosystem health. Journal of Insect Science 2010, 10, 1–16. [Google Scholar] [CrossRef] [PubMed]
- Johnson, J.; Adkins, J.; Rieske, L.K. Canopy vegetation influences ant (Hymenoptera: Formicidae) communities in headwater stream riparian zones of Central Appalachia. Journal of Insect Science 2014, 14, 1–5. [Google Scholar] [CrossRef] [PubMed]
- Sheikh, A.; Ganaie, G.; Thomas, M.; Bhandari, R.; Rather, Y.A. Ant pitfall trap sampling: An overview. Journal of Entomological Research 2018, 42, 421–436. [Google Scholar] [CrossRef]
- Fisher, B.L.; Cover, S.P.; Kirsch, G.; Kane, J.; Nobile, A. Ants of North America.
- A guide to the genera, 1 ed.; University of California Press: 2007.
- Douglas, C.E.; Michael, F.A. On distribution-free multiple comparisons in the one-way analysis of variance. Communications in Statistics - Theory and Methods 1991, 20, 127–139. [Google Scholar] [CrossRef]
- Beatty, W. Decision Support Using Nonparametric Statistics; 2018.
- Tschinkel, W. The natural history of the arboreal ant, Crematogaster ashmeadi. Journal of Insect Science 2002, 2, 1–12. [Google Scholar] [CrossRef]
- Saarinen, E.V. Acrobat Ant Crematogaster ashmeadi Emery (Insecta: Hymenoptera: Formicidae: Myrmicinae); IFAS/University of Florida: Gainsville, Florida, 2021. [Google Scholar]
- MacGown, J.A. Ants (Formicidae) of the southeastern United States.
- Stock, T.; Gouge, D. Integrated pest management for ants in schools; Pacific Northwest Extension: 2022; p. 10.
- Wilson, E.O. Pheidole in the New World: A dominant, hyperdiverse ant genus; Harvard University Press: 2003.
- Delabie, J.H.C.; Fowler, H.G. Soil and litter cryptic ant assemblages of Bahian cocoa plantations. Pedobiologia 1995, 39, 423–433. [Google Scholar] [CrossRef]
- Ward, D.F.; New, T.R.; Yen, A.L. Effects of Pitfall Trap Spacing on the Abundance, Richness and Composition of Invertebrate Catches. Journal of Insect Conservation 2001, 5, 47–53. [Google Scholar] [CrossRef]
- Perez-Rodriguez, J.; Pekas, A.; Tena, A.; Wäckers, F. Sugar provisioning for ants enhances biological control of mealybugs in citrus. Biological Control 2021, 157, 104573. [Google Scholar] [CrossRef]
- Greenberg, L.; Klotz, J.H. Argentine Ant (Hymenoptera: Formicidae) Trail Pheromone Enhances Consumption of Liquid Sucrose Solution. Journal of Economic Entomology 2000, 93, 119–122. [Google Scholar] [CrossRef] [PubMed]
Figure 1.
a. Dispensers containing a. 25% sugar solution (sugar dispensers) and b. 1% disodium octaborate tetrahydrate bait (sugar dispensers with insecticide bait) deployed in the field.
Figure 1.
a. Dispensers containing a. 25% sugar solution (sugar dispensers) and b. 1% disodium octaborate tetrahydrate bait (sugar dispensers with insecticide bait) deployed in the field.
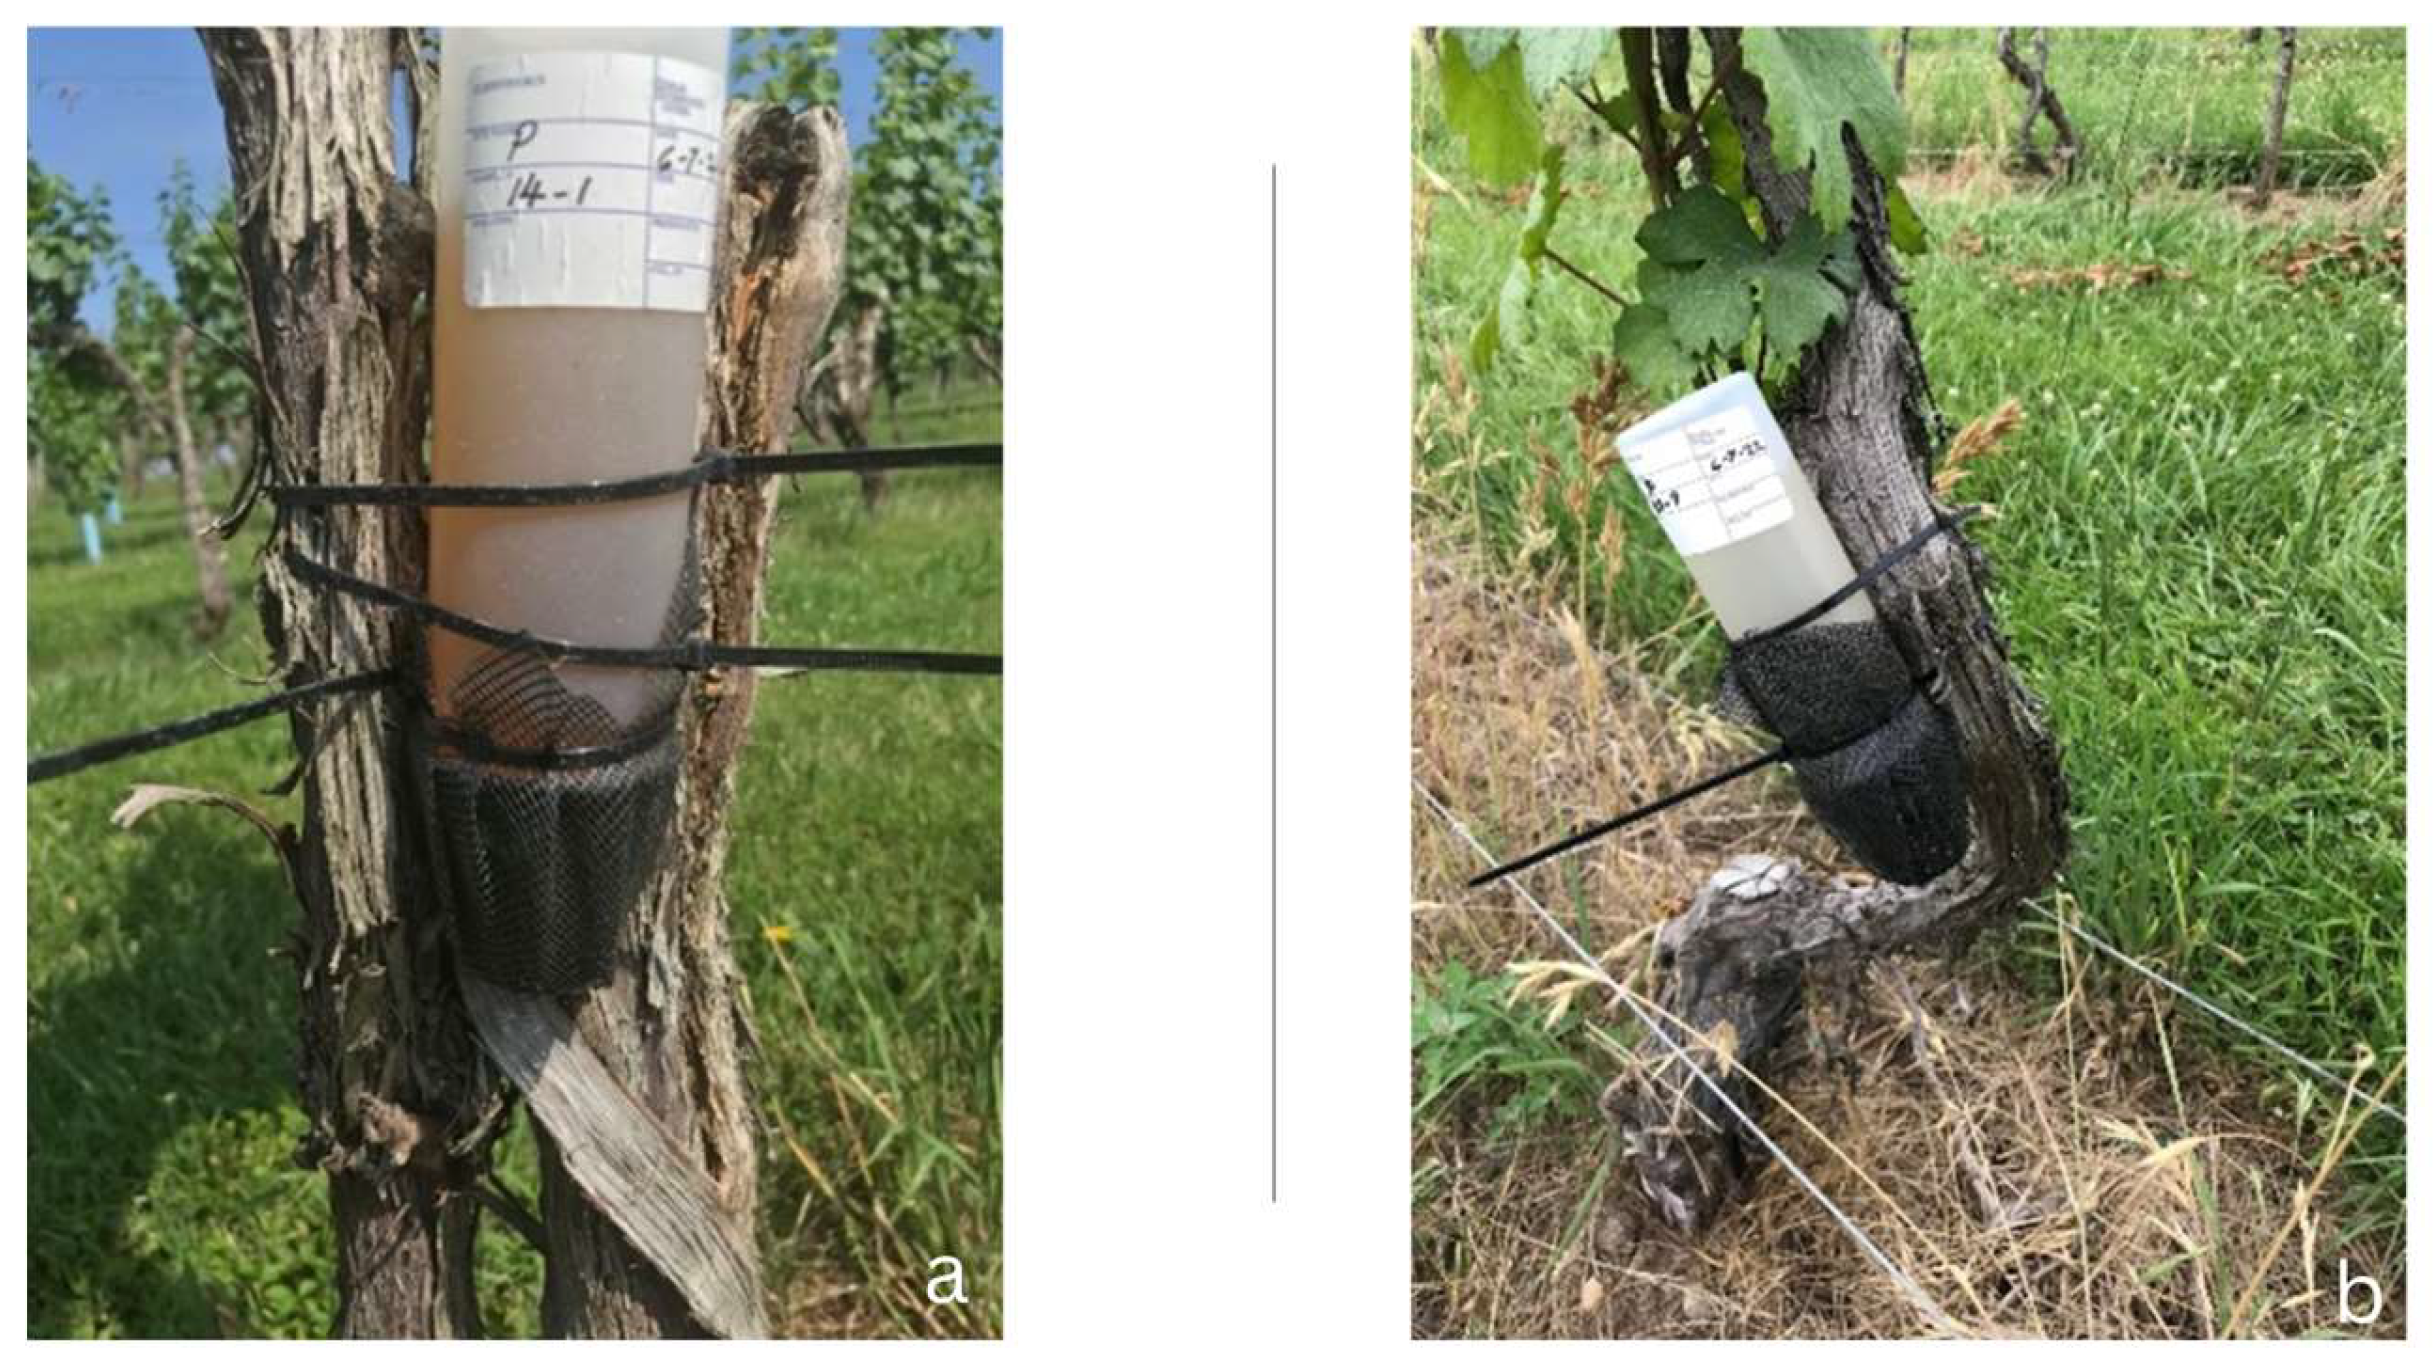
Figure 2.
Relative abundance of ants captured in the pitfall trap throughout the sampling period (June-September 2022) in sites HV (Orange County, Virginia) and PC (Fauquier County, Virginia) via pitfall trap and 1-minute count.
Figure 2.
Relative abundance of ants captured in the pitfall trap throughout the sampling period (June-September 2022) in sites HV (Orange County, Virginia) and PC (Fauquier County, Virginia) via pitfall trap and 1-minute count.
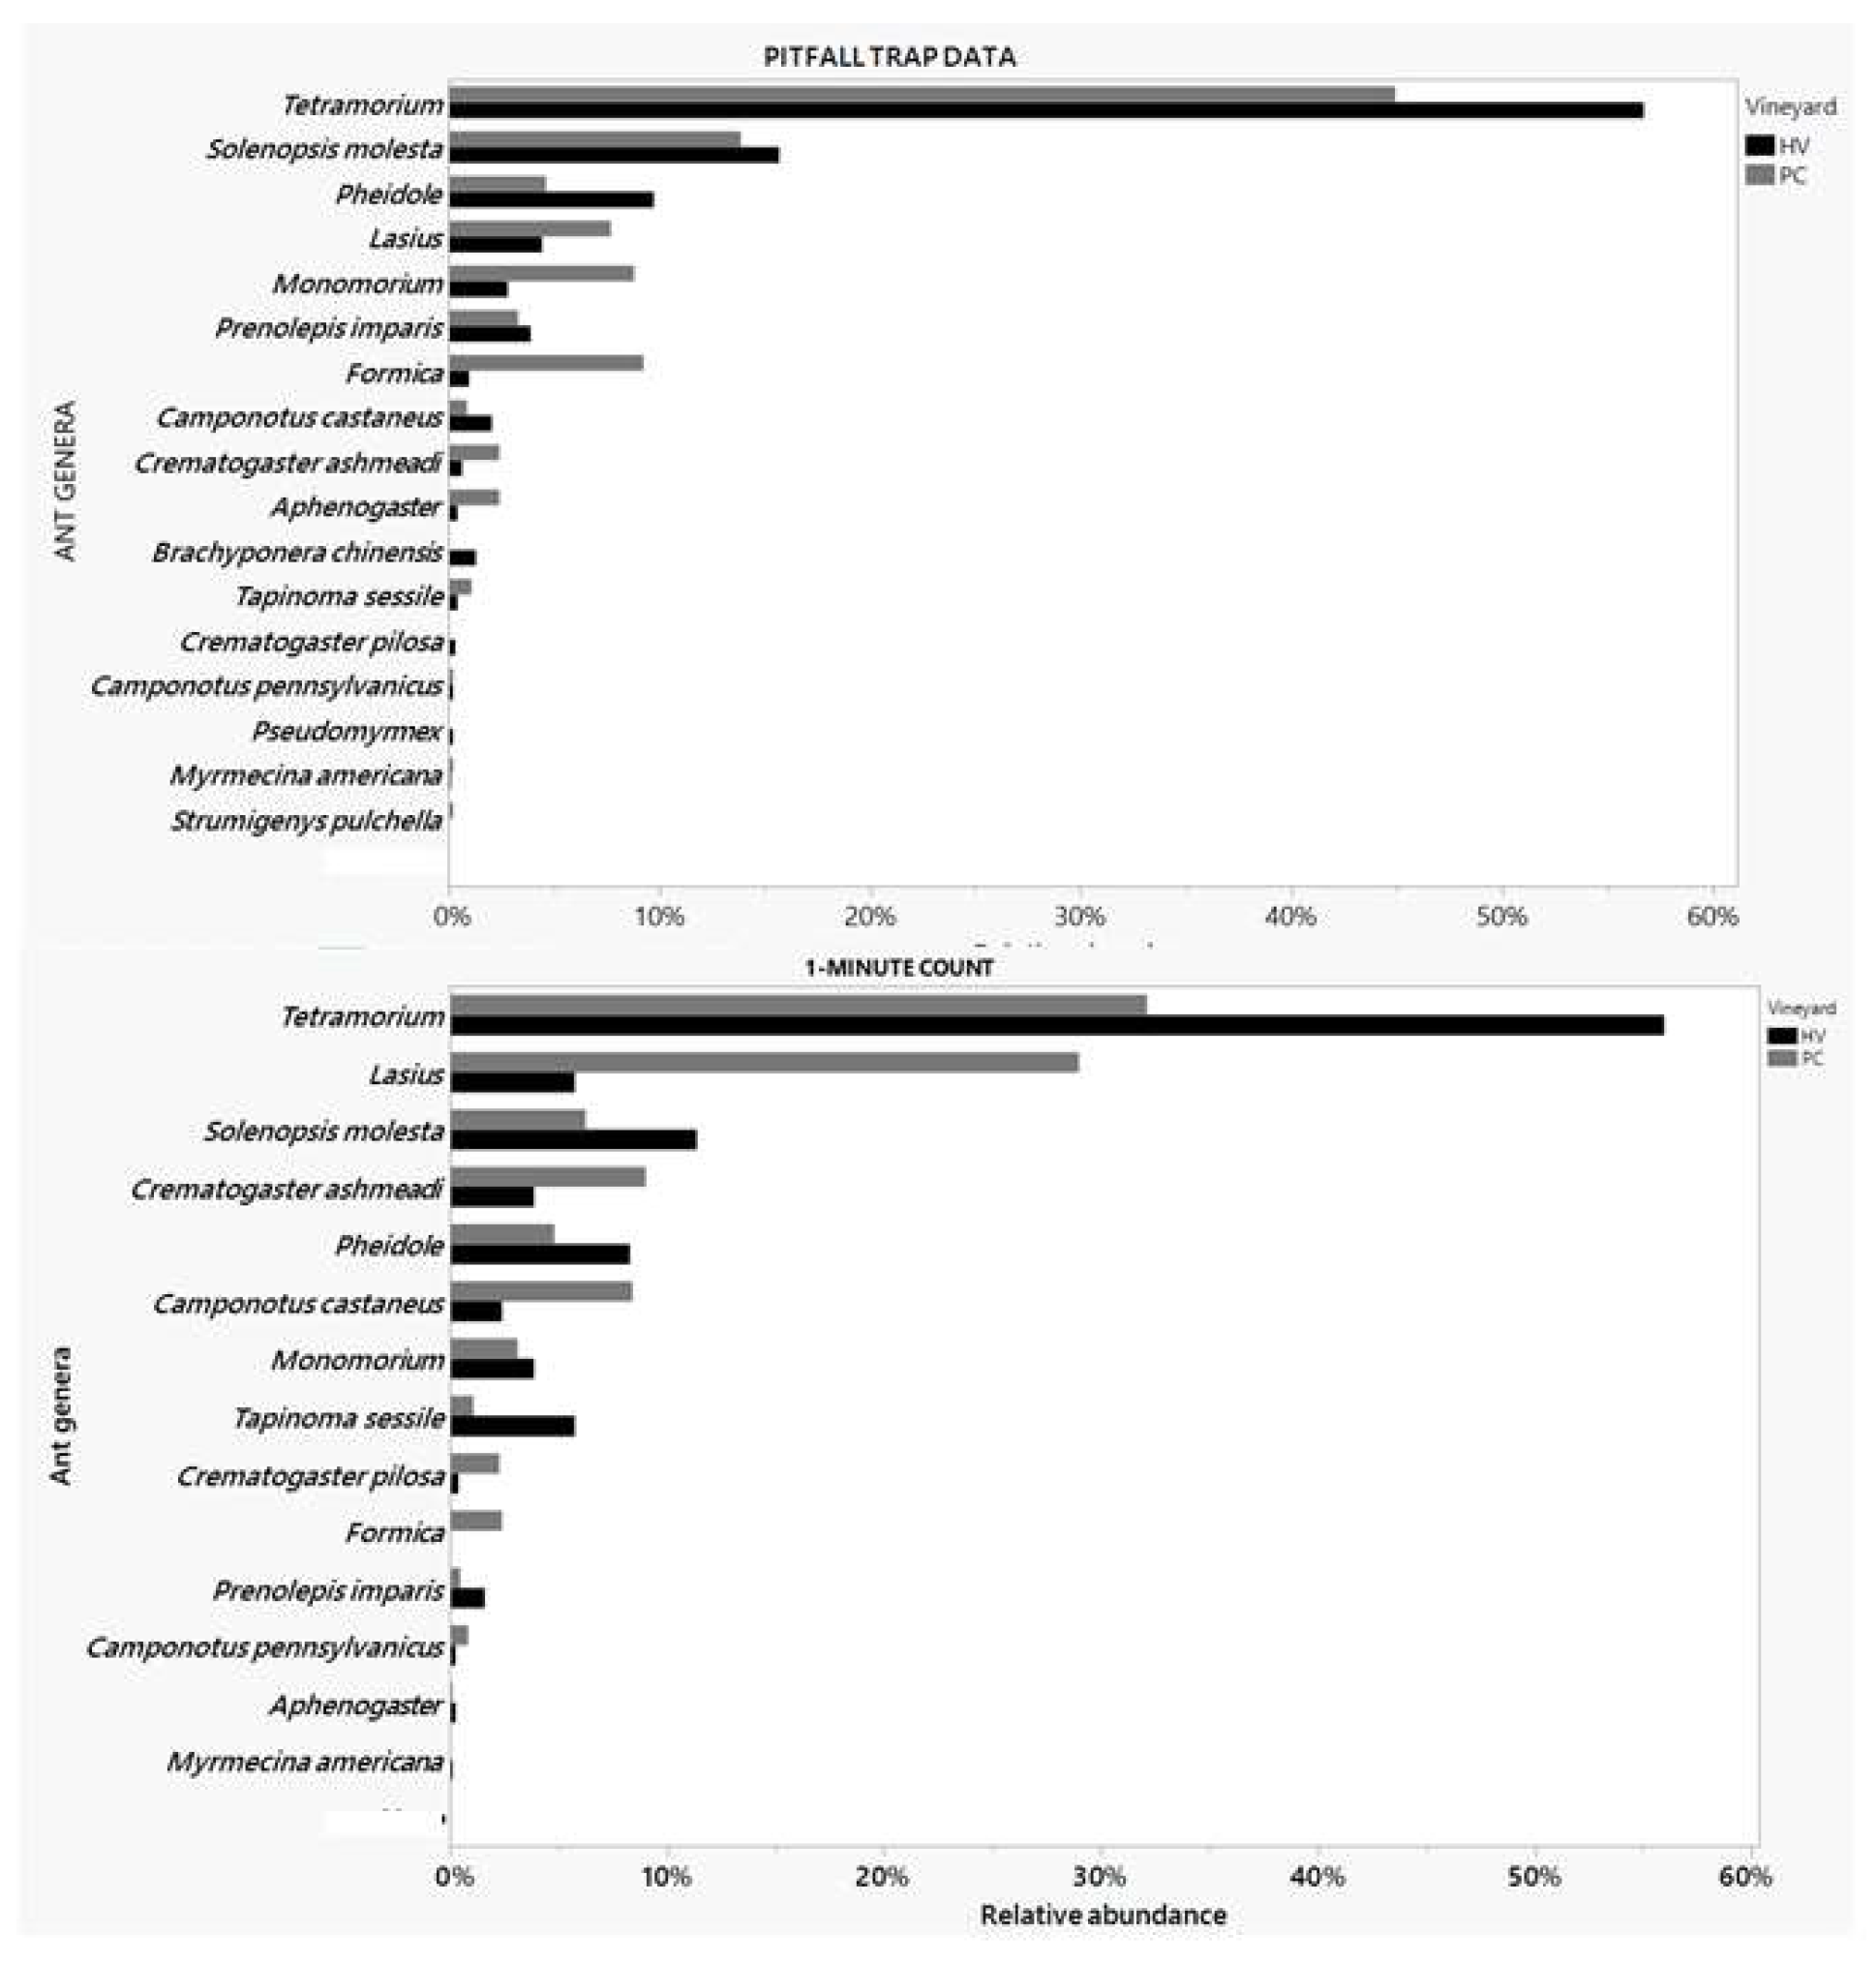
Figure 3.
Mean (+SEM) number of ants captured per pitfall trap in different treatments throughout the sampling season in vineyards HV (Orange County, Virginia) and PC (Fauquier County, VA).
Figure 3.
Mean (+SEM) number of ants captured per pitfall trap in different treatments throughout the sampling season in vineyards HV (Orange County, Virginia) and PC (Fauquier County, VA).
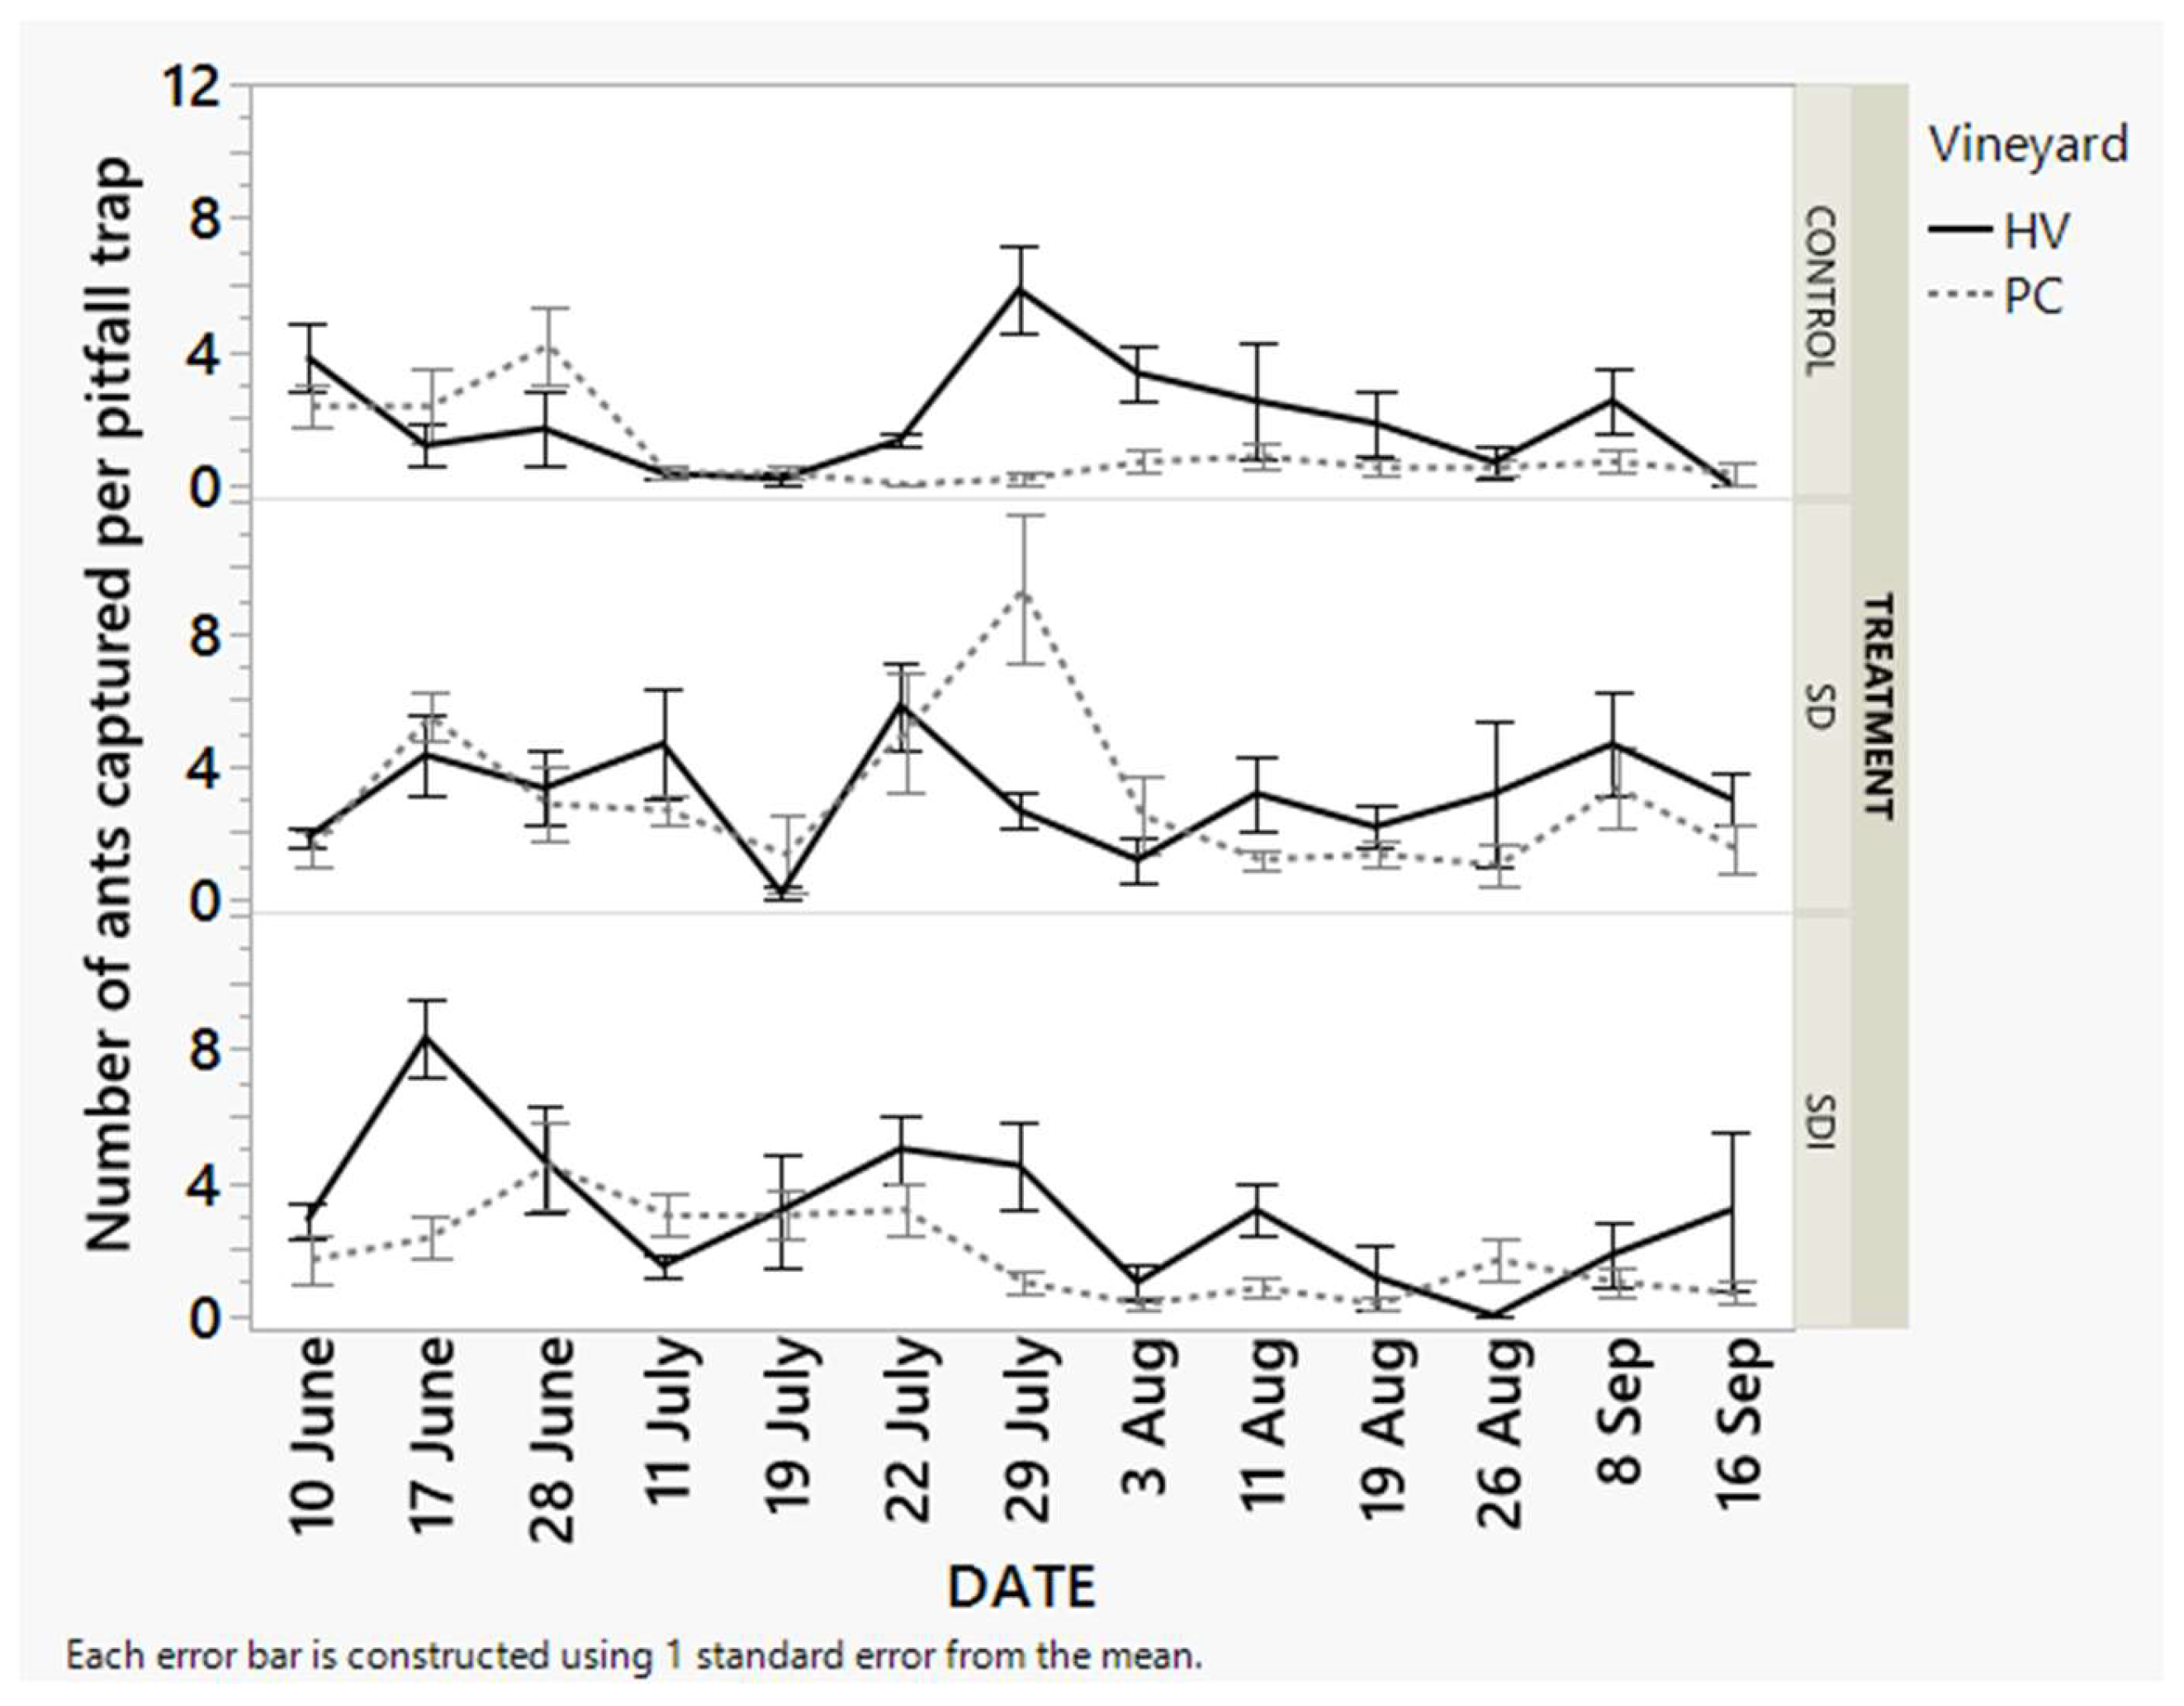
Figure 4.
Percentage of grape clusters infested in two vineyards (HV and PC). Each error bar is constructed using 1 standard error from the mean. Three treatments: 1. Control without any dispensers 2. Sugar dispensers with only sucrose solution (SD), and 3. Sugar dispensers with insecticide (SDI).
Figure 4.
Percentage of grape clusters infested in two vineyards (HV and PC). Each error bar is constructed using 1 standard error from the mean. Three treatments: 1. Control without any dispensers 2. Sugar dispensers with only sucrose solution (SD), and 3. Sugar dispensers with insecticide (SDI).
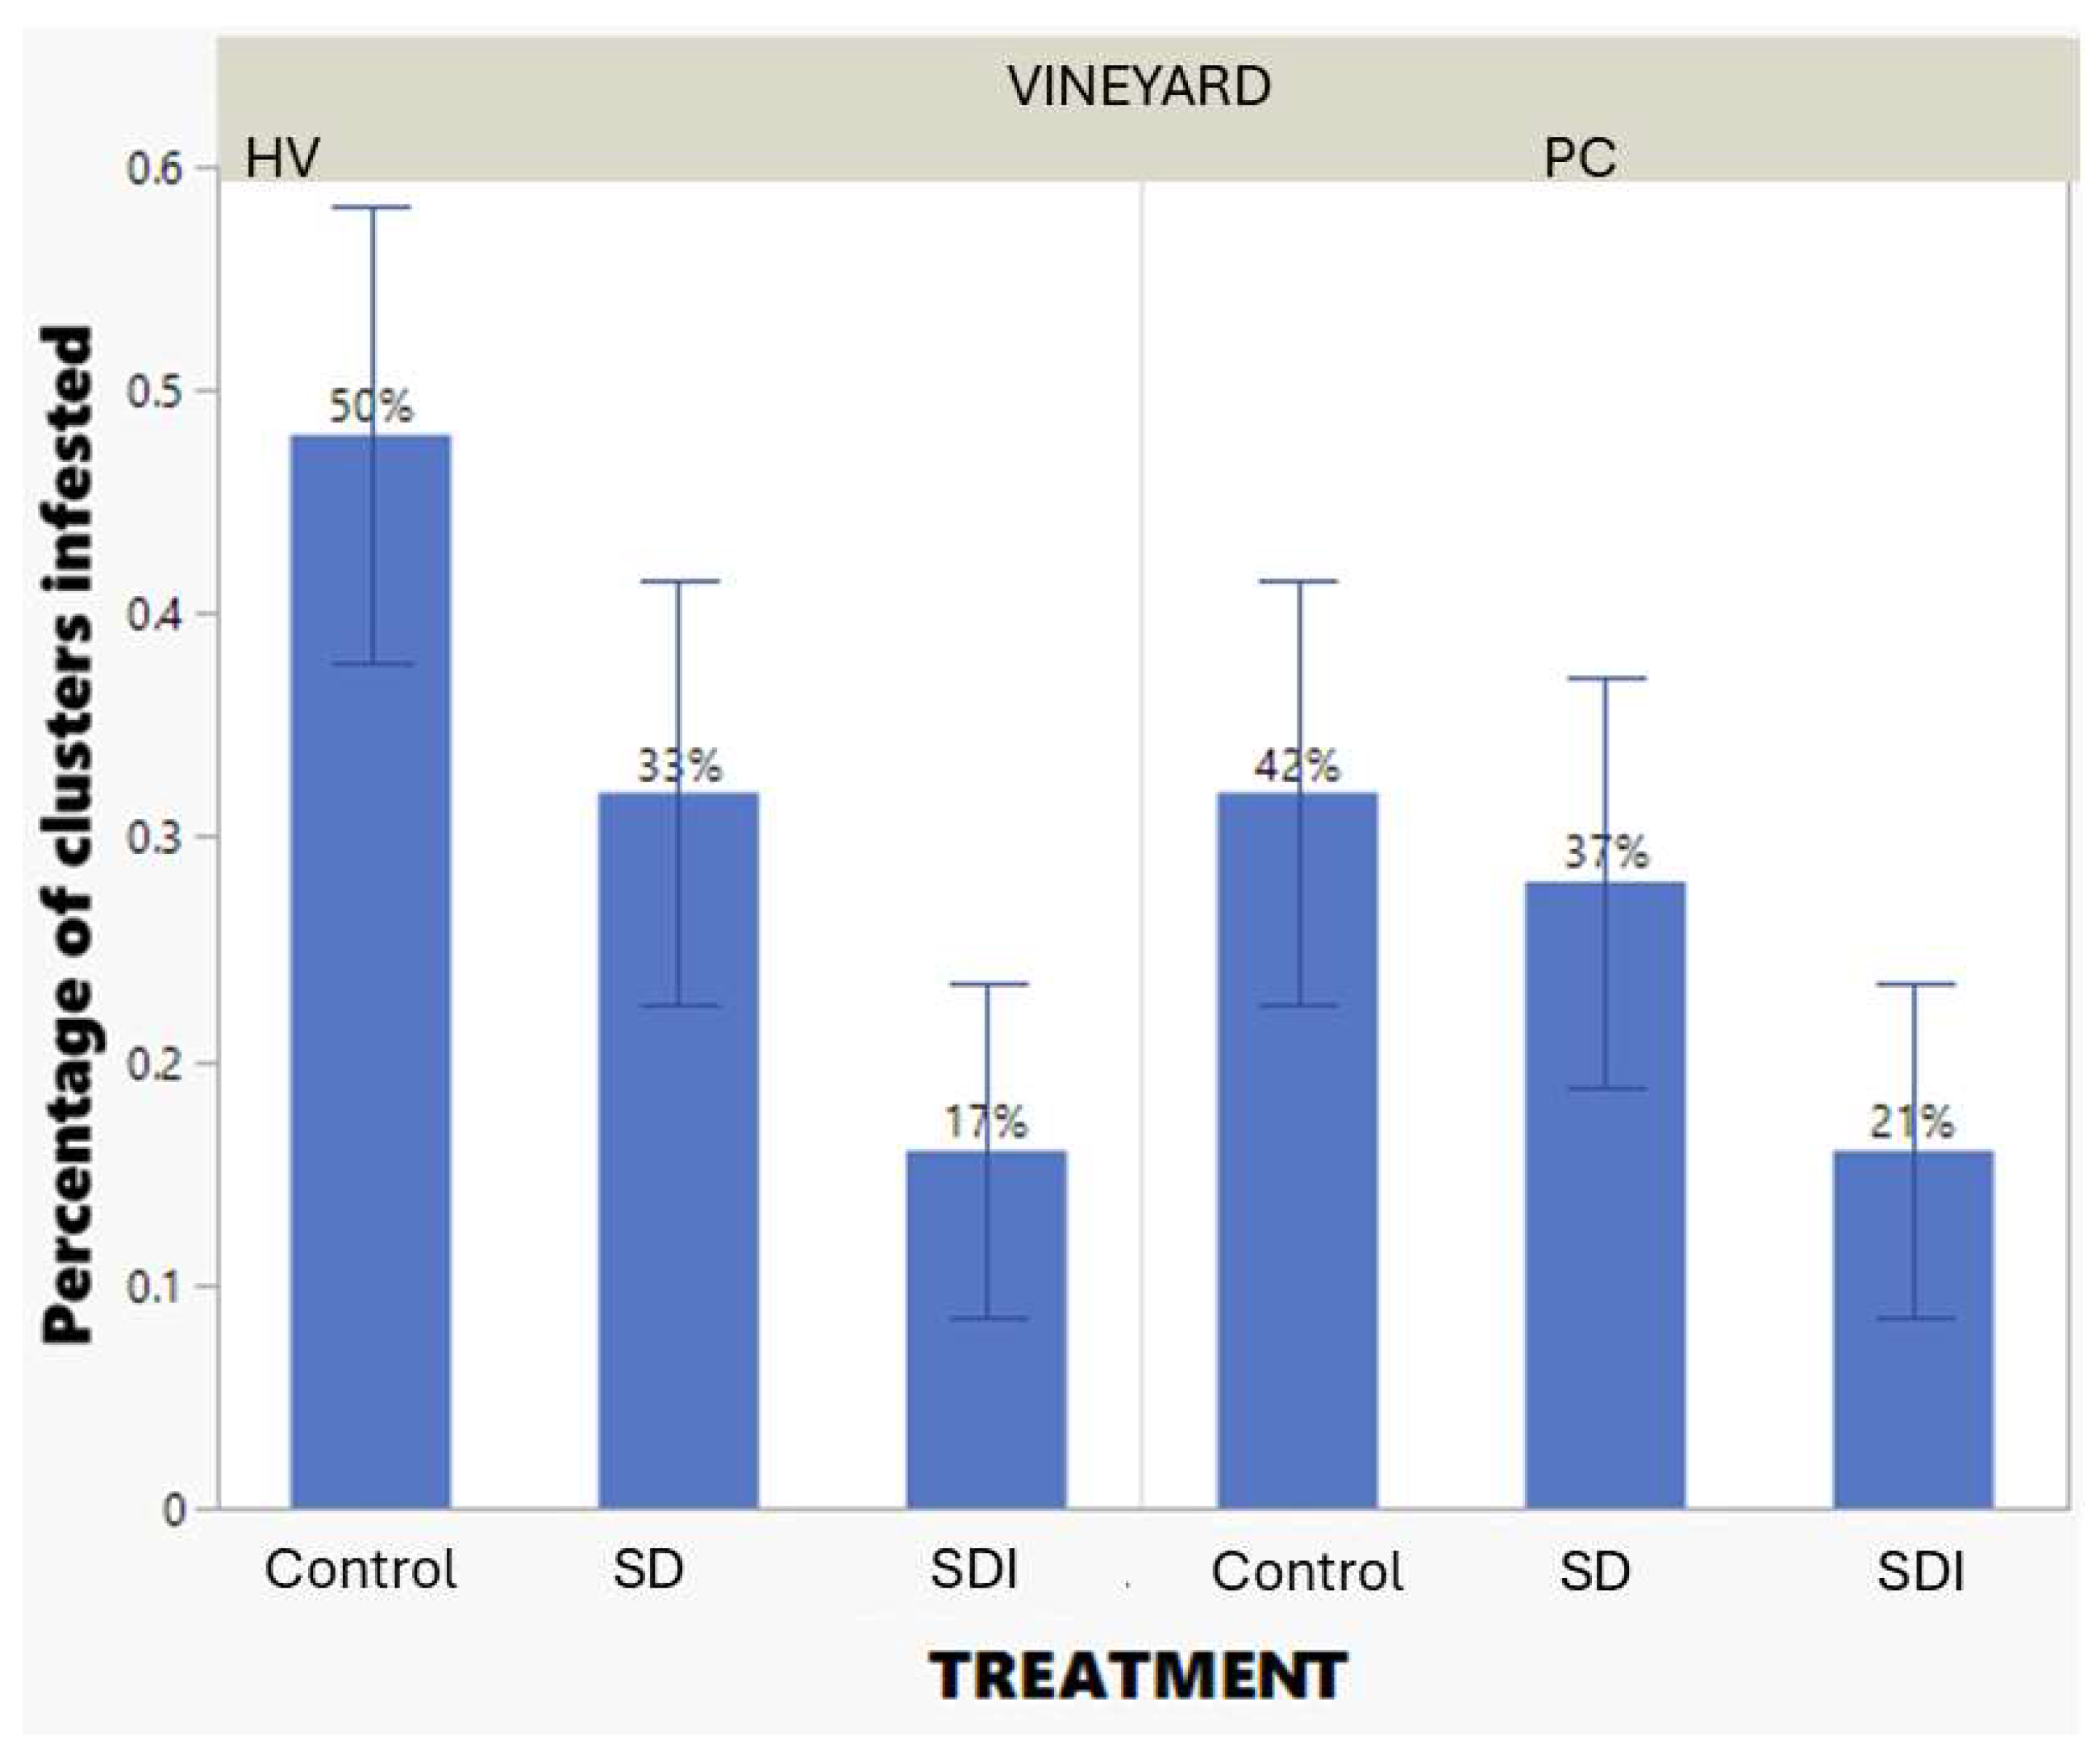

Table 1.
Variation in the mean number of ants per minute per sampling dates (1-minute count).
| Vineyard | Treatment (Content of dispenser)1 | Function | June 7 | June 16 | June 28 | July 11 | July 19 | July 28 | Aug 3 | Aug 11 | Aug 20 | Aug 26 | Aug 31 |
| PC | Control (empty) | Mean±SEM | 2.4+0.77 | 3.9+1.12 | 2.5+0.94 | 2.3+0.84 | 0.6+0.34 | 1+0.42 | 0.9+0.50 | 1.2+0.53 | 1.6+0.70 | 2.8+1.07 | 0.9+0.60 |
| SD (25% sucrose solution) | Mean±SEM | 2.1+0.86 | 3+1.50 | 0.7+0.26 | 3.2+0.55 | 4.9+0.85 | 5.6+0.64 | 2.5+0.65 | 4.2+0.86 | 3.3+0.88 | 3.9+1.1 | 1.1+0.50 | |
| Z-score | -0.27 | 0 | -0.59 | 0.99 | 3.49 | 3.53 | 1.71 | 2.46 | 1.45 | 1.002 | 0.97 | ||
| p-value | 0.94 | 1 | 0.77 | 0.51 | 0.0009* | 0.0008* | 0.15 | 0.026* | 0.25 | 0.50 | 0.51 | ||
| SDI (1 % disodium octaborate tetrahydrate) | Mean±SEM | 1.6+0.47 | 3.7+1.26 | 1.6+0.86 | 1.4+0.34 | 1.1+0.48 | 2.7+0.58 | 0.8+0.42 | 0.6+0.26 | 0.8+0.33 | 1.1+0.41 | 0.5+0.5 | |
| Z-score | -0.51 | -0.68 | -0.99 | -0.21 | 0.87 | 1.82 | 0.091 | -0.32 | -0.50 | -0.82 | -0.48 | ||
| p-value | 0.83 | 0.71 | 0.50 | 0.96 | 0.59 | 0.12 | 0.99 | 0.93 | 0.83 | 0.62 | 0.8426 | ||
| Vineyard | Treatment (Content of dispenser)1 | Function | June 10 | June 17 | June 29 | July 12 | July 21 | July 29 | Aug 5 | Aug 10 | Aug 22 | ||
| HV | Control (empty) | Mean±SEM | 2.8+0.92 | 2.6+0.89 | 2.4+0.77 | 3.4+2.02 | 3.2+1.072 | 0.9+0.79 | 5.8+2.22 | 5.9+0.18 | 5.1+1.65 | ||
| SD (25% sucrose solution) | Mean±SEM | 1.9+0.82 | 7.3+1.31 | 2+0.66 | 2.3+0.63 | 2.3+0.65 | 4+0.71 | 2.4+0.52 | .2.9+0.52 | 5.3+1.29 | |||
| Z-score | -1.17 | 2.48 | -0.27 | 0.95 | 3.49 | 3.14 | -0.91 | -0.53 | 0.38 | ||||
| p-value | 0.39 | 0.0248* | 0.95 | 0.54 | 0.0009* | 0.003* | 0.63 | 0.81 | 0.90 | ||||
| SDI (1 % disodium octaborate tetrahydrate) | Mean±SEM | 1.3+0.55 | 5.2+0.81 | 0.5+0.5 | 2.9+0.93 | 1.6+0.42 | 2+1.53 | 1.44+0.7 | 2.5+1.37 | 0.66+033 | |||
| Z-score | -1.51 | 1.95 | -2.08 | 0.76 | 0.87 | -0.45 | 1.61 | -1.77 | -2.17 | ||||
| p-value | 0.22 | 0.09 | 0.06 | 0.67 | 0.59 | 0.86 | 0.24 | 0.13 | 0.056 |
1 Three treatments: 1. Control without any dispensers 2. Sugar dispensers with only sucrose solution (SD), and 3. Sugar dispensers with insecticide (SDI). *Signifies significant values.
Table 2.
Total variation in the mean number of ants per minute throughout sampling season (1-minute count).
Table 2.
Total variation in the mean number of ants per minute throughout sampling season (1-minute count).
| Vineyard | Treatment (Content of dispenser)1 | Function | |
| PC | Control (empty) | Mean±SEM | 1.83+0.31 |
| SD (25% sucrose solution) | Mean±SEM Z-score p-value |
3.14+0.4 4.023 0.0001* |
|
| SDI (1 % disodium octaborate tetrahydrate) | Mean±SEM Z-score p-value |
1.44+0.29 -0.17 0.97 |
|
| HV | Control (empty) | Mean±SEM | 3.57+0.49 |
| SD (25% sucrose solution) | Mean±SEM Z-score p-value |
3.38+0.33 1.42 0.33 |
|
| SDI (1 % disodium octaborate tetrahydrate) | Mean±SEM Z-score p-value |
1.76+0.27 2.409 0.042* |
1 Three treatments: 1. Control without any dispensers 2. Sugar dispensers with only sucrose solution (SD), and 3. Sugar dispensers with insecticide (SDI). *Signifies significant values.
Table 3.
Variation in the mean number of ants per minute per sampling dates (Pitfall trap data).
| Vineyard | Treatment (Content of dispenser)1 | Function | June 7 | June 16 | June 28 | July 11 | July 19 | July 28 | Aug 3 | Aug 11 | Aug 20 | Aug 26 | Aug 31 | ||
| PC | Control (empty) | Mean±SEM | 2.33+0.61 | 2.33+1.14 | 4.16+1.16 | 0.33+0.21 | 0.33+0.21 | 0+0 | 0.16+0.16 | 0.66+0.33 | 0.8+0.40 | 0.5+0.22 | 0.5+0.22 | 0.66+0.33 | 0.33+0.33 |
| SD (25% sucrose solution) | Mean±SEM | 1.5+0.56 | 5.5+0.76 | 2.83+1.08 | 2.67+0.42 | 0.16+0.16 | 5+1.807 | 9.33+2.23 | 2.5+1.17 | 1.16+0.307 | 1.33+0.42 | 1+0.63 | 3.33+1.229 | 1.5+0.76 | |
| Z-score | -0.86 | 1.96 | -0.081 | 2.91 | 0.09 | 3.015 | 2.91 | 1.41 | 0.59 | 1.48 | 1.482 | 2.138 | 1.43 | ||
| p-value | 0.59 | 0.91 | 0.62 | 0.0068* | 0.99 | 0.0050* | 0.007* | 0.27 | 0.77 | 0.24 | 0.237 | 0.059 | 0.26 | ||
| SDI (1 % disodium octaborate tetrahydrate) | Mean±SEM | 1.6+0.47 | 3.7+1.26 | 1.6+0.86 | 1.4+0.34 | 1.1+0.48 | 2.7+0.58 | 0.8+0.42 | 0.6+0.26 | 0.8+0.33 | 1.1+0.41 | 0.5+0.5 | |||
| Z-score | -0.51 | -0.68 | -0.99 | -0.21 | 0.87 | 1.82 | 0.091 | -0.32 | -0.50 | -0.82 | -0.48 | ||||
| p-value | 0.83 | 0.71 | 0.50 | 0.96 | 0.59 | 0.12 | 0.99 | 0.93 | 0.83 | 0.62 | 0.8426 | ||||
| Vineyard | Treatment (Content of dispenser)1 | Function | June 10 | June 17 | June 29 | July 12 | July 14 | July 21 | July 29 | Aug 5 | Aug 10 | Aug 30 | Sep 5 | Sep 9 | Sep 15 |
| HV | Control (empty) | Mean±SEM | 3.83+1.014 | 1.16+0.65 | 1.16+1.11 | 0.33+0.211 | 0.16+0.16 | 1.33+0.211 | 5.83+1.27 | 3.33+0.802 | 2.5+1.71 | 1.83+0.94 | 0.67+0.49 | 2.5+0.96 | 0±0 |
| SD (25% sucrose solution) | Mean±SEM | 1.83+0.307 | 4.33+1.202 | 3.33+1.11 | 4.67+1.6 | 0.16+0.16 | 5.83+1.3 | 2.66+0.49 | 1.16+0.65 | 3.16+1.108 | 2.16+0.65 | 3.16+2.23 | 4.66+1.54 | 3+0.816 | |
| Z-score | -0.57 | 2.75 | 1.70 | 2.57 | 1.79 | 2.88 | -0.72 | -1.89 | 1.063 | 0.67 | 0.716 | 1.067 | 3.003 | ||
| p-value | 0.78 | 0.011* | 0.156 | 0.019* | 0.13 | 0.007* | 0.69 | 0.105 | 0.461 | 0.73 | 0.69 | 0.46 | 0.0052* | ||
| SDI (1 % disodium octaborate tetrahydrate) | Mean±SEM | 2.83+0.54 | 8.33+1.17 | 4.67+1.58 | 1.5+0.34 | 3.16+1.70 | 5+1 | 4.5+1.33 | 1+0.0.51 | 3.16+0.79 | 1.16+0.98 | 0+0 | 1.83+0.98 | 3.16+2.37 | |
| Z-score | -1.56 | 1.95 | 1.46 | 2.35 | 0.000 | 2.25 | -1.53 | -2.056 | 0.92 | -0.86 | -1.35 | -0.501 | B. 2.65 | ||
| p-value | 0.20 | 0.09 | 0.24 | 0.035* | 1 | 0.045* | 0.21 | 0.073 | 0.55 | 0.594 | 0.29 | 0.834 | 0.015* |
1 Three treatments: 1. Control without any dispensers 2. Sugar dispensers with only sucrose solution (SD), and 3. Sugar dispensers with insecticide (SDI). *Signifies significant values.
Table 4.
Total variation in the mean number of ants per minute throughout sampling season (Pitfall trap data).
Table 4.
Total variation in the mean number of ants per minute throughout sampling season (Pitfall trap data).
| Vineyard | Treatment (Content of dispenser)1 | Function | |
| PC | Control (empty) | Mean±SEM | 1.013+0.19 |
| SD (25% sucrose solution) | Mean±SEM Z-score p-value |
3+0.385 5.042 <0.0001* |
|
| SDI (1 % disodium octaborate tetrahydrate) | Mean±SEM Z-score p-value |
1.81+0.215 3.604 <0.0006 |
|
| HV | Control (empty) | Mean±SEM | 1.936+0.2893 |
| SD (25% sucrose solution) | Mean±SEM Z-score p-value |
3.089+0.3419 3.030 0.0047* |
|
| SDI (1 % disodium octaborate tetrahydrate) | Mean±SEM Z-score p-value |
3.102+0.3865 2.52 0.022* |
1 Three treatments: 1. Control without any dispensers 2. Sugar dispensers with only sucrose solution (SD), and 3. Sugar dispensers with insecticide (SDI). *Signifies significant values.
Disclaimer/Publisher’s Note: The statements, opinions and data contained in all publications are solely those of the individual author(s) and contributor(s) and not of MDPI and/or the editor(s). MDPI and/or the editor(s) disclaim responsibility for any injury to people or property resulting from any ideas, methods, instructions or products referred to in the content. |
© 2025 by the authors. Licensee MDPI, Basel, Switzerland. This article is an open access article distributed under the terms and conditions of the Creative Commons Attribution (CC BY) license (http://creativecommons.org/licenses/by/4.0/).
Copyright: This open access article is published under a Creative Commons CC BY 4.0 license, which permit the free download, distribution, and reuse, provided that the author and preprint are cited in any reuse.


