Submitted:
17 February 2025
Posted:
19 February 2025
You are already at the latest version
Abstract
In the United States, General Aviation (GA) moves a small volume of passengers, but it accounts for a disproportionate number of accidents and serious incidents. There is concern among GA pilots and owners that an airplane is more likely to fail in the first hours of service following maintenance, e.g., human errors during maintenance and early mortality of newly installed components. However, no prior work has investigated whether this concern is substantiated by data. Prior research has analyzed maintenance-related failures in airline transport aviation, but not in GA. This paper asks the question: does evidence show higher rates of aircraft-caused accidents and serious incidents in GA airplanes just returned to service after inspective maintenance? We analyze GA events reported to the NTSB between 2008 and 2024, comparing the post-maintenance reliability sampled on adverse events caused by aircraft alone, against those caused by human error alone. We find that the answer is yes: the risk is 33.8% higher than baseline in the first hour following an inspection, and it remains higher than baseline for at least the first 31 hours. Heightened pilot and operator caution in the early hours in service after an inspection are therefore justified.
Keywords:
General
; aviation
; maintenance
; reliability
; inspection
; failure
1. Introduction
General Aviation (GA) moves a negligible amount of passengers per year compared to airline transport operators, but it accounts for 71.6% of all accidents and serious incidents reported to the United States’ National Transportation Safety Board (NTSB) between 2008 and 2024 (see Table 1). (For brevity, we will call event any accident or serious incident that is reported to the NTSB, per definitions in ICAO Annex 13 or, equivalently, 49 CFR §830.2 in the US Federal regulations.) Of those events, 66.0% were imputed to aircraft-related causes, as either the primary factor or a co-factor, suggesting that mechanical factors are a prime concern. The cumulative loss of life, health, and property associated with these events suggests that GA safety deserves more attention and systematic analysis than it has received so far.
Maintenance plays a critical factor in aircraft-related events. A 2002 FAA study[1] found that at least 7.05% of all GA accidents that occurred between 1988 and 1997 were maintenance-related. Furthermore, the authors
believe that 7.05% is a conservative estimate of GA maintenance-related accidents during this period. [...] there are probably many more maintenance-related accident reports in the NTSB Database that were not included in this study because they were not designated with a maintenance code.
Two known, major causes of failure after maintenance are: (1) early mortality of newly installed components, and (2) Maintenance-Induced Failures (MIFs), i.e., failures whose leading cause is improperly performed maintenance. In GA, a large fraction of all maintenance is performed as a result of scheduled inspections. All GA planes undergo annual inspections. Then, planes involved in training or rental are typically also inspected every 100 hours in service. During an inspection, not only faulty systems are impacted, being replaced or repaired, but healthy systems are touched as well, as necessary to determine their health. As a result, systems that will later be deemed healthy are disassembled and re-assembled. This exposes those systems to human error. More specifically, there is a non-zero risk that, while repairing faulty systems, mechanics accidentally degrade healthy ones, thus causing early failures after the inspection. This is just one example of MIF, but numerous articles have examined the diverse incarnations of MIF [1,4,6,7,10].
Maintenance risks are a popular discussion topic among GA pilots, owners and mechanics, with some explicitly voicing the concern that airplanes would be more dangerous to fly during the first hours in service after maintenance, compared to their baseline risk level (i.e., after accumulating more service time without incident). But in these discussions, beliefs are typically only supported by anecdotal evidence and personal experience. Some mechanics[2] even propose a maintenance minimalism approach: avoid maintenance except when strictly necessary, with the intent of reducing MIF risks. Despite deserving quantitative analysis, the matter has not been explored in prior literature. We focus on that creating that analysis.
In our approach, we isolate the sample of NTSB events that occurred between 2008 and 2024, involving airplanes operating under Part 91 regulations, in which the aircraft was a causal factor and human performance was not, and study the two metrics Airframe Time in Service since Last Inspection (ATSLI), and Engine Time in Service since Last Inspection (ETSLI). We identify the distribution of events with respect to ATSLI and ETSLI values. Finally, we estimate the hazard rates associated with strictly aircraft-caused events.
Paper organization. The remainder of this paper is organized as follows: Section 3 describes the public datasets we consume; Section 4 describes the statistical methods we employ to correct sampling bias and estimate hazard functions; Section 5 presents the results; and Section 6 draws our conclusions.
Novelty claims. To the best of our knowledge, this paper is the first to focus on General Aviation while investigating a link between maintenance and accidents. It is also the first to propose employing strictly human-caused events as a proxy for the over-representation of low times in service, to correct for sampling bias.
2. Related Literature
Boyd[3] offers a broad analysis of the safety record of General Aviation (GA) operations, discussing accident risk factors and possible mitigations, but does not cover maintenance-induced failures. Hieminga and Turkoglu[4] examine maintenance-associated risks and propose a taxonomy to classify them, but they analyzed commercial air transport only. Insley and Turkoglu[6] also limited their review and analysis of aircraft maintenance-related accidents and serious incidents to commercial air transport aviation. Ewertowski et al.[5] discuss risk management in GA, but do not address maintenance-related risk. Tyagi et al.[7] offer a comprehensive review of all literature on safety management and hazard in the aircraft maintenance industry, but it excludes GA. Janovec and Mojžišová[8] explore in depth the root causes of maintenance-related accidents in civil aviation (once again, excluding GA) and propose countermeasures, but do not focus on quantitative risk estimation. Kiyak[9] models the impact of preventive maintenance on total cost (including reliability cost and maintenance cost), but does not estimate risk quantitatively in any area of flight operations. Wild[10] performs an in-depth statistical examination of maintenance-related accidents that occurred in civil aviation as reported in the Aviation Safety Network dataset, but he does not cover GA, and the research questions he explores do not include a relationship between risk and time in service after maintenance.
3. Data Sources
3.1. NTSB Events
Our research uses the public NTSB Aviation Database1, in the format that the NTSB adopted in 2008. This is a relational database comprising 20 tables in Microsoft Access MDB format. Four tables are of interest to our exploration: "events", "aircraft", "findings", and "engines". At the time of our analysis, the database includes accidents and serious incidents that occurred between January 2008 and November 2024.
Our analysis focuses exclusively on GA airplanes (Part 91). The aircraft categories we exclude (rotorcraft, powered lift, lighter than air, etc.) account for a minor fraction of the dataset. We also exclude space launch operations and unmanned craft events, which are also negligible. Events can have a record of ATSLI, ETSLI, both, or neither. We restrict our analysis to events for which either ATSLI or ETSLI is tracked. The cardinality of these sets are in Table 2.
Causal Factors. The NTSB offers causal findings for each event. Causal factors are crucial to the statistical analysis we conduct in this paper. Most events have more than one causal factor. Our approach distinguishes two major causal factors: aircraft and human.
- We call an event human-related and aircraft-related if any of the NTSB findings associated with that event are in the aircraft and in the human category, respectively.
- We call an event strictly human-caused if at least one of its findings is in the human category and no findings are in the aircraft category.
- We call an event strictly aircraft-caused if at least one of its findings is in the aircraft category and no findings are in the human category.
3.2. FAA General Aviation and Part 135 Activity Surveys
We approach post-maintenance reliability by comparing the sample of adverse events caused by the aircraft alone against the sample of those caused by human error alone. In this way we can estimate the proportional hazard () due to recent maintenance. This choice is justified in detail in Section 3.4.
In the last section of this paper, we will report the absolute hazard rates () for strictly aircraft-caused events, expressed in events per Million hours (pMh) flown and, equivalently, Mean Times Between Failures (MTBF) expressed in hours in service. We derive those as the product: , where is the baseline hazard rate of strictly aircraft-caused events over all GA hours flown.
In turn, we estimate the baselines using data from Table 2.1 of the General Aviation and Part 135 Activity Surveys published by the United States’ Federal Aviation Administration (FAA)2. We use survey years 2018 through 2023, inclusively. Note that the surveys lump together Part 91 and Part 135 statistics, while, in the context of this paper, we focus on Part 91 flights only. In spite of this difference, the FAA surveys are still the best resource available to us to estimate . We compute as the ratio between 2018-2023 Part 91+135 event counts we extracted from the NTSB dataset and the total hours flown reported in the FAA survey. The results are in Table 3. Since the survey distinguishes between single- and twin-engine aircraft, we compute distinct values of for single- and twin-engine aircraft, and for generic piston aircraft regardless of number of engines. In the table, we report baseline rates for both strictly aircraft-caused events and aircraft-related events, for comparison.
3.3. Metrics of Interest
Two metrics tracked in the NTSB dataset are crucial to our research question: Airframe Time in Service since Last Inspection (ATSLI) and Engine Time in Service since Last Inspection (ETSLI). By Time In Service (TIS), we never intend to mean wall-clock time elapsed since a specified occurrence, but rather a cumulative count of hours during which the aircraft was operated since that occurrence. Operators are required by law to record the TIS when maintenance is performed. The law affords operators some freedom in how to measure TIS, with most GA operators choosing tachometer time. The tachometer accumulates, per each real-time hour, a fraction of hours equal to the ratio between the RPMs the engine was developing, and a reference RPM value, typically maximum-continuous-power RPMs. For example, if the pilot operates the engine at 60% of reference RPMs for one wallclock hour, tachometer time will increase its count by 0.6. Tachometer time can even run faster than real time, if the pilot exceeds the reference RPM value.
At each event, the NTSB makes an effort to reconstruct ATSLI and ETSLI from the aircraft records and other investigations, with variable degrees of success. In the NTSB database, about one third of the events report ATSLI and/or ETSLI values (Table 2). We limit our analysis only to events for which ATSLI or ETSLI is recorded.
The amount and type of maintenance information that the NTSB has decided to track limits the scope of research questions that one can answer. For example, the dataset does not track inspections preceding the last one, which makes it impossible to test a hypothesis that accounts for a plane’s longer-term maintenance history.
3.4. Sampling Bias and Low-time-in-service Over-representation
The NTSB event sample suffers from a sampling bias that causes low ATSLI and ETSLI values to be over-represented. Specifically, most GA airplanes do not fly many hours between mandated inspections, so events with low ATSLI and ETSLI are disproportionately frequent.
An explanation of the causes follow. Annual inspections must occur at calendar intervals, regardless of time in service, and most GA planes do not see many hours in service in each 12-month interval, due to the constraints inherent in personal ownership. Further evidence for this claim is offered by the breakdown of NTSB events by purpose of flight (see Table 4), where 75.7% of all Part 91 events occurred in personal flights. By contrast, aircraft used for commercial passenger carriage are used as much as business allows. Moreover, airplanes used for instruction or rental are typically subject to 100-hour inspections in addition to annual inspection. As a result, these planes are virtually never flown at ATSLI or ETSLI values that exceed 100 hours.
Without bias correction, the data would suggest artificially low survival rates at high time-in-service values. The bias countermeasures we employ are described in the next section.
4. Methods
To correct the sampling bias present in the sample of strictly aircraft-caused events we plan to divide hazard rates, at any given time in service t, by a measure of the over-representation of all GA flying at that t. Ideally, that measure would be the statistical distribution of ATSLI and ETSLI values across all GA hours flown. Unfortunately, that measure is not available because neither the NTSB nor the FAA dataset tracks uneventful flights.
We propose using a proxy population as a measure of the over-representation. The proxies we choose are the ATSLI and ETSLI distributions of strictly human-caused events. This is a creative choice and deserves justification: it seems reasonable to assume that human performance is independent from aircraft- and engine- time in service. By this logic, strictly human-caused events should occur uniformly over all hours flown in a given aircraft and therefore be a reasonable proxy for how ATSLI and ETSLI distribute across all Part-91 hours flown.
We plot histograms of the two distributions of strictly aircraft- and strictly human-caused events, in red and green, respectively, in Figure 2 with 5-h wide bins. Note that bins are drawn semi-transparent: a majority of red bins surpassing the corresponding green ones in the bins in the 0–75h range suggest that airplanes suffer from increased early hazards, even after sampling bias correction.
5. Results
In Section 5.1 we begin by comparing the statistical distributions of service hours since last inspection between the samples of strictly human-caused events and strictly aircraft-caused events. In Section 5.2 we visually compare their empirical survival functions. In Section 5.3 we model the effect of maintenance with a time-invariant multiplicative factor of the baseline hazard function. In Section 5.4 we fit the hazard functions independently and produce a time-varying hazard proportion function. Finally, in Section 5.5 we estimate the absolute hazard functions of post-maintenance flight.
5.1. Hypothesis Testing
We now perform a two-sample Kolmogorov-Smirnov hypothesis test to get a quantitative measure that aircraft-caused event rates exceed human-caused events, which serve as a measure of over-representation. We perform this test for both ATSLI and ETSLI.
- Alternate hypothesis : "Strictly aircraft-caused events occur at lower ATSLI/ETSLI values than strictly human-caused events." (i.e., "Recent maintenance raises failure rates".)
- Null hypothesis : The two samples come from the same distributions. "Strictly aircraft-caused and strictly human-caused events are drawn from the same distribution over ATSLI/ETSLI." (i.e., "Recent maintenance does not affect failure rates".)
Test protocol: we choose as a significance level; if p-value , we reject in favor of ; if p-value , we are unable to reject .
The results are presented in Table 5: in both tests, p-values are well below significance, so we reject the null hypothesis in both cases. Data supports the alternate hypothesis: aircraft-caused events occur at disproportionately lower time-in-service values, i.e., recent maintenance raises accident and incident rates.
5.2. Survival Function Comparison
Additional confirmation of the increased aircraft risk due to recent inspective maintenance after bias correction is obtained comparing the empirical survival functions3 of the two populations of interest, charted in Figure 3. Charted in red is the empirical survival function of strictly aircraft-caused events; charted in green is the empirical survival function of strictly human-caused events, which is our measure of over-representation. The left and right charts depict ATSLI and ETSLI, respectively; they show a consistent story.
Note that the survival rates we chart here are not computed over the entire population of aircraft flown in the period examined–that population is not tracked by the NTSB–but only over the population of airplanes that incurred an event at some point. For example, if the survival function assumes value 0.2 at 70h ATSLI, that means that 20% of the aircraft that experienced an event at some point still have not experienced it at 70h. Actual survival rates are much higher. We will present absolute failure rates at the end of this paper.
Discussion: In both charts, the strictly aircraft-caused survival function curves descend earlier than the strictly human-caused survival curves, with a gap between the two that extends from 0h until approximately 60h. This indicates that aircraft risk is heightened during that window, even after correcting for low-TIS over-representation.
5.3. Risk Quantification via Cox’s Proportional Hazards Model
We now estimate the increased aircraft risk due to recent inspective maintenance while correcting for sampling bias, by fitting our data to Cox’s Proportional Hazards (CPH) model. We do that for both ATSLI and ETSLI values, obtaining similar results. CPH is a model from survival analysis theory which assumes that a population suffers a baseline risk, represented by hazard function and, in addition to that, when a particular treatment or an action is applied, the hazard function becomes . The proportional hazard is a time-invariant factor that multiplies the baseline hazard. (For definitions of terms like hazard function, reliability function, ECHF, etc., please see the Reliability and Survival Statistics Term Summary in the Appendix A.)
We apply Breslow’s method[11] of non-parametric CPH fitting to the two samples: strictly human-caused events, representing , and strictly aircraft-caused events, representing . We truncate both samples at the 200h cutoff point, past which the proportionality assumption no longer seems to hold (see Figure 4). We obtain the following estimates and confidence intervals for :
Discussion: CPH fitting reveals that in the 0...200h range of time in service after inspection, aircraft causes are responsible for a 23% average increase in accidents and serious incidents. Results are similar for both airframe and engine times in service. Assuming that strictly human-caused events are not associated with maintenance, this would indicate that airplanes are indeed more dangerous immediately after maintenance.
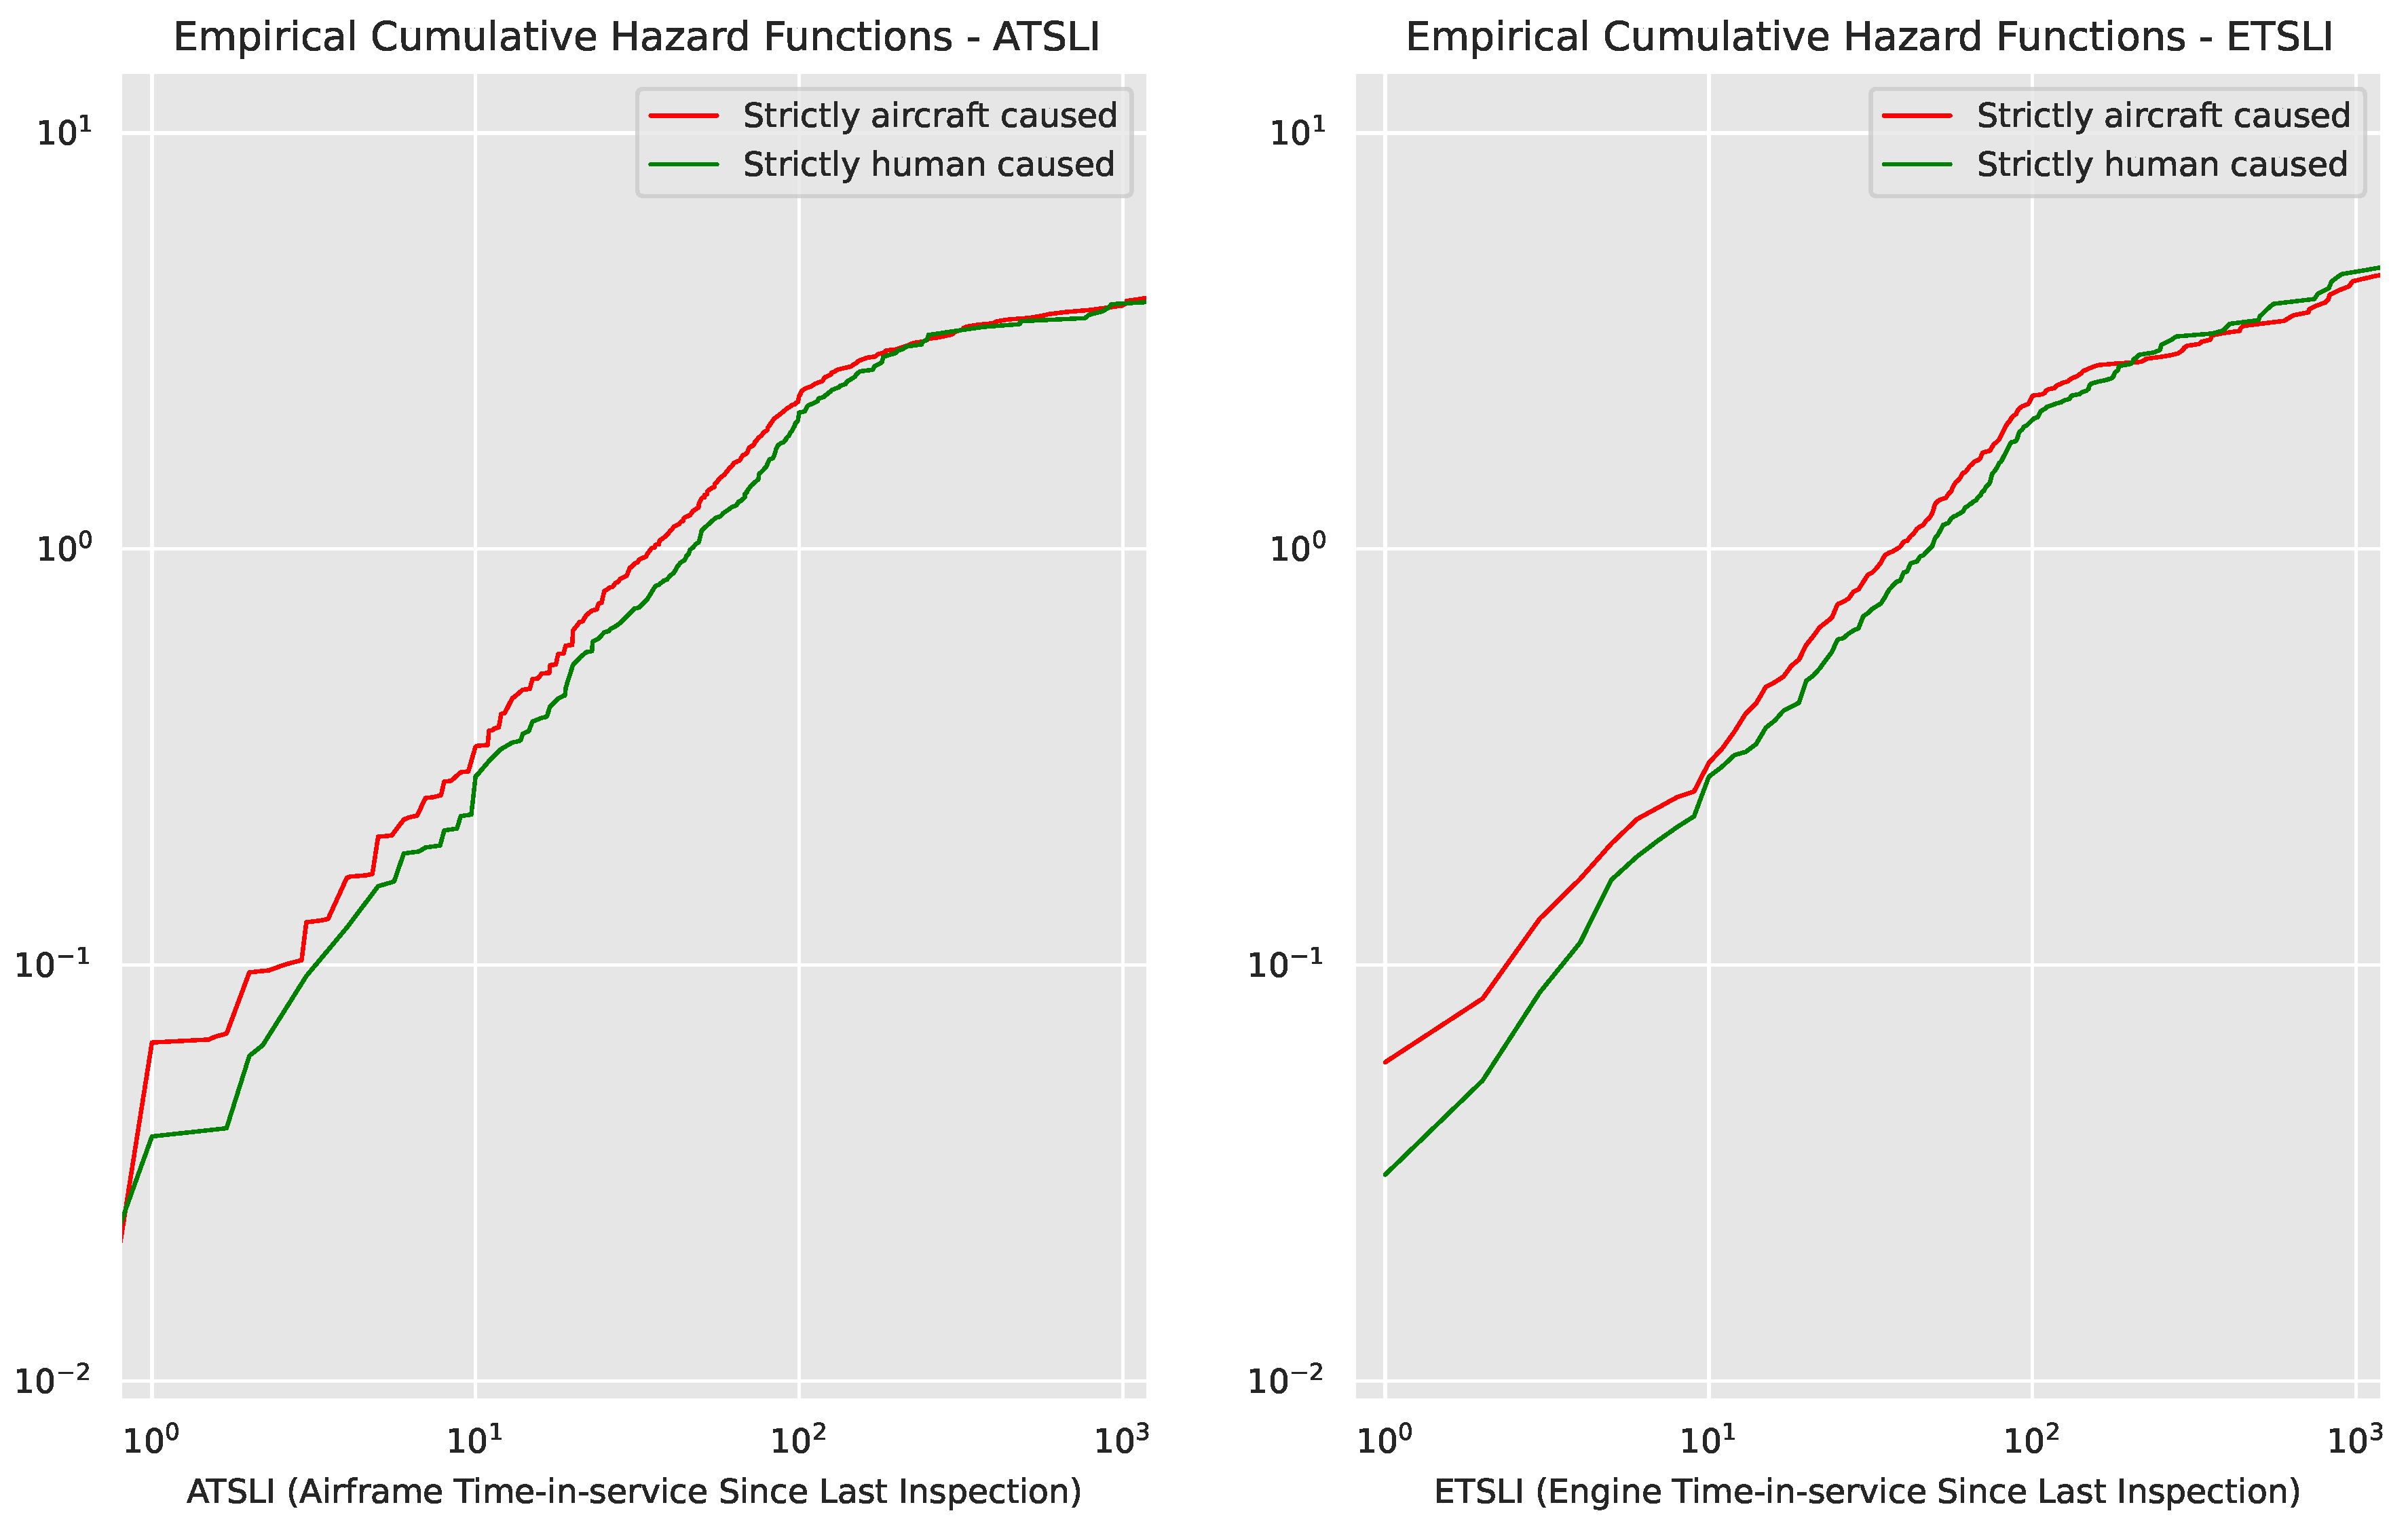 Limitations: Because CPH assumes a time-invariant , it does not model how aircraft risk changes over the first few hours in service. Nevertheless, it is a useful summary indicator of the risk gap between the two populations, approximated by constant hazard functions and . The two CHFs corresponding to and appear as straight lines in log-log space: see the red and the green dashed lines in Figure 5, plotted against the empirical CHF of the actual distributions, drawn with discrete dots.

Table 6.
Results of Breslow’s method of non-parametric CPH fitting applied to both measures of time in service.
Table 6.
Results of Breslow’s method of non-parametric CPH fitting applied to both measures of time in service.
| ATSLI | ETSLI | |
|---|---|---|
| Estimated | 1.2268 | 1.2353 |
| 95% confidence interval for | [1.1037, 1.3637] | [1.0930, 1.3962] |
Figure 4.
Region of applicability of Cox’s Proportional Hazard (CPH) model. Visually, the CPH assumptions hold in the region where the Empirical Cumulative Hazard Functions (ECHF) for the two populations are parallel when charted in log-log space. Here, that region appears to be to be 0...200 h. The red curve is the strictly aircraft-caused events’ ECHF, and the green is the strictly human-caused events’ ECHF, our measure of over-representation. The left and right charts depict ATSLI and ETSLI, respectively.
In the next section of this paper, we obtain a time-varying estimate of the proportional risk.
5.4. Proportional Hazard Function Estimation
We now take the final step toward deriving the time-dependent proportional Hazard Function of strictly aircraft-caused events. With that, we can compute absolute event rates for every hour of ATSLI or ETSLI, which express how dangerous an airplane is during that hour in service.
To do that, we adopt a parametric approach:
- We fit the ATSLI distribution of strictly aircraft-caused events. This distribution suffers from sampling bias as described earlier. The best fit is a Weibull mixture, of parameters , depicted in Figure 6(a).
- We fit the ATSLI distribution of strictly human-caused events. This distribution is our chosen measure of sampling bias. The best fit is Weibull mixture, of parameters , depicted in Figure 6(b).
- We derive , the proportional hazard functions corrected for sampling bias. It is charted in Figure 7.
We choose to derive as a ratio between two smooth, parameterized PDF functions.
Figure 7 shows that during the first hour, the hazard rate is 33.8% higher then baseline, then it’s 30.0% higher in the second hour, and it keeps decreasing, crossing the baseline level at 31h ATSLI. It reaches a minimum at 188h ATSLI, at which the relative risk is 56.4% of baseline. Then it starts increasing again, crossing baseline level once more at 327h and reaching a new peak at 478h ATSLI, at a risk level 37.1% above the baseline. In its first 500h, the curve resembles a typical "bathtub curve" hazard function as seen in numerous reliability applications[12], with an early mortality period, a useful life period, and a wear-out period.
We decide not to extend our ATSLI considerations to ETSLI because the quality of parametric fits we were able to achieve on ETSLI data (see Figure 6(c),(d)) appeared insufficient for use in further analysis.
5.5. Absolute Hazard Function Estimation
We now combine , the bias-corrected proportional hazard function of strictly airplane-caused events as a function of ATSLI (derived in the previous section) with , the time-invariant absolute baseline hazard rate we derived earlier, in Section 3.2. We use three distinct estimates for , one for single-engine planes, one for twin-engines, and one for generic piston engines.
That yields absolute risk rates that we tabulate in Table 7, Table 8, and Table 9 for the first 15h ATSLI. Note that we estimated on strictly aircraft-caused events to exclude the influence of other factors, but it seems now sound to also apply also to aircraft-related events, so the tables present for both event classes.
An example of using the tables follows: in the first hour of service since inspection, hazard is increased by a factor of : in Single-Engine airplanes, this leads to a rate of 11.533 strictly aircraft-caused events per million hours and 69.059 aircraft-caused events per Million hours. Equivalently, the expected amounts of hours flown before a strictly aircraft-caused or an aircraft-related event are 86,707 and 14,480 hours. These hazard rates are significantly higher than the baselines presented in Section 3.2.
6. Conclusions
We examined a commonly held belief that maintenance raises the risk of accidents and serious incidents in general aviation in the immediate service hours after an inspection. We subjected this belief to quantitative scrutiny, and found it to be substantiated by data.
Specifically, we examined the distribution of time-in-service-since-last-inspection metrics in failures occurring in the population of accidents and serious incidents reported to the NSTB in 2008-2024, affecting general aviation airplanes. We found this sample to be biased towards low time-in-service values, because most planes are flown only a few hours between mandated inspections. We studied the population of strictly aircraft-caused events using the strictly human-caused events as a measure of bias. We verified via Kolmogorov-Smirnov hypothesis testing that the two populations are statistically distinct. Via CPH model fitting, we estimated the average proportional hazards for the first hours in service. Finally, we fitted the two populations with Weibull distributions and obtained an analytic estimate of the proportional hazard as a function of time , which shows that in the first hour in service, hazard rates are 33.8% higher than baseline.
Our findings consistently substantiate the belief that inspective maintenance increases danger in the first hours of service after a plane returns from inspective maintenance. This belief, commonly held on an empirical and anecdotal basis, is now supported by statistical evidence. Pilot and owners of Part 91 airplanes are therefore justified in exercising increased caution when performing post-maintenance acceptance flights and flying those planes in the subsequent hours in service. Efforts to increase the standards of maintenance processes and materials will likely reduce these risks.
Supplementary Materials
The authors make their entire research notebook available for review and reproduction at the following address: https://nbviewer.org/urls/www.scarpaz.com/flight/Statistics/How%20Risky%20is%20Maintenance%20v5.ipynb.
Author Contributions
Conceptualization, D.S.; methodology, D.S. and J.H.; software, D.S.; validation, J.H.; investigation, D.S.; writing—original draft preparation, D.S.; writing—review and editing, J.H.; visualization, D.S.. All authors have read and agreed to the published version of the manuscript.
Funding
This research received no external funding.
Institutional Review Board Statement
Not applicable.
Informed Consent Statement
Not applicable.
Data Availability Statement
No new datasets were created in the course of this study. All data analyzed in this study are from public domain resources: (1) NTSB Aviation Database, available at https://data.ntsb.gov/avdata, and (2) FAA General Aviation and Part 135 Activity Suveys, at https://www.faa.gov/dataresearch/aviationdatastatistics/generalaviation.
Acknowledgments
In this section you can acknowledge any support given which is not covered by the author contribution or funding sections. This may include administrative and technical support, or donations in kind (e.g., materials used for experiments).
Conflicts of Interest
The authors declare no conflicts of interest.
Abbreviations
The following abbreviations are used in this manuscript:
| CDF | Cumulative Distribution Function |
| CFR | Code of Federal Regulations |
| CHF | Cumulative Hazard Function |
| CPH | Cox’s Proportional Hazards (CPH) model |
| ECHF | Empirical Cumulative Hazard Function |
| FAA | Federal Aviation Administration |
| GA | General Aviation, i.e., operations performed according to Part 91 Regulations |
| MIF | Maintenance-Induced Failure |
| Probability Density Function | |
| pMh | per Million hours |
| MTBF | Mean Time Between Failures |
| NTSB | National Transportation Safety Board |
| ATSLI | Airframe Time in Service since Last Inspection, measured in hours |
| ETSLI | Engine Time in Service since Last Inspection, measured in hours |
| TIS | Time in Service |
Appendix A. Reliability and Survival Statistics Term Summary
We offer a concise refresher of reliability statistics as we will apply them in this paper.
Survival analysis is the branch of statistics that studies and predicts the expected duration of time until an event of interest occurs (e.g., death in living organisms, failure in mechanical systems) on the basis of measured data.
In our application, the events of interest are NTSB-tracked events (accidents or serious incidents), that were categorized as strictly aircraft-caused or strictly human-caused, per definitions given above.
In the term definitions below, the term failure denote the event of interest, and not an airplane failure in the general sense. It is possible for many mechanical failures to occur and not lead to any NTSB event, and therefore no failure in the sense of word used here. The readers should avoid being confused by this ambiguity.
-
is the failure Probability Density Function (PDF) of the lifetimes.
- -
- It is the probability that a failure occurs at time t.
- -
- .
- -
- Equivalently: what fraction of the population experienced a failure around time t.
-
is the Cumulative Density Function (CDF):
- -
- The probability that a failure occurs at any time before t
- -
- -
- Equivalently, what fraction of the population has already experienced a failure at time t
- -
- In our application, F(t) is the fraction of planes that have suffered an event at or before time t
-
is the Hazard function (HF)
- -
- The conditional probability that a failure will occur between t and , given that it hasn’t occurred yet at time t.
- -
- -
- It equals
-
Difference between and
- -
- is the (unconditional) probability that the element will fail in the interval
- -
- is the conditional probability that the element will fail in the same time interval, given that it has survived until time t.
-
, the Reliability Function, also called the Survival Function (SF)
- -
- Defined as
- -
- The probability that the member of the population survives at least till time t (i.e., does not experience an event before t):
- -
- Equivalently, what fraction of the population has not yet suffered an event at a given time.
| 1 | see the Data Availability Statement at the end of this paper. |
| 2 | see the Data Availability Statement at the end of this paper. |
| 3 | for a precise definition of this term, see the Reliability and Survival Statistics Term Summary in the Appendix A. |
References
- Goldman, S. M., Fiedler, E. R., and King, R.E., General Aviation Maintenance-Related Accidents: A Review of Ten Years of NTSB Data. Office of Aerospace Medicine, Federal Aviation Administration. December 2002.
- Busch, M., How Risky is Maintenance? (online video), (https://www.youtube.com/watch?v=oHwtkZNSlPA. Accessed Jan 30, 2025.
- Boyd, D. D. (2017) A Review of General Aviation Safety (1984–2017), Aerospace Medicine and Human Performance, Aerospace Medical Association, 88(7). [CrossRef]
- Hieminga, J., Turkoglu, C., (2018) Risks Associated with Aircraft Maintenance in European Commercial Air Transport, Proc. Intl. Cross-industry Safety Conference (ICSC) - European STAMP Workshop & Conference (ESWC) (ICSC-ESWC 2018), Vol. 273. [CrossRef]
- Ewertowski, T., Berlik, M., Sławińska, M. (2024) The Effectiveness of Operational Residual Risk Assessment: The Case of General Aviation Organizations in Enhancing Flight Safety in Alignment with Sustainability. Sustainability, 16(23). [CrossRef]
- Insley, J., Turkoglu, C. (2020) A Contemporary Analysis of Aircraft Maintenance-Related Accidents and Serious Incidents. Aerospace 7(81). [CrossRef]
- Tyagi, A., Tripathi, R., Bouarfa, S. (2023). Safety Management System and Hazards in the Aircraft Maintenance Industry: a Systematic Literature review. Aviation, 27(3), 212–224. [CrossRef]
- Janovec, M., Mojžišová, K. (2024) Increasing aircraft maintenance safety by minimizing human error, Proc. 13th International Conference on Air Transport – INAIR 2024, Challenging the Status Quo in Aviation, Transportation Research Procedia, 81, 118-127. [CrossRef]
- Kiyak, Emre. (2012). The effects of aircraft preventive maintenance on reliability. International Journal of Applied Mathematics and Informatics. 6. 9-16.
- Wild, G. (2023) A Quantitative Study of Aircraft Maintenance Accidents in Commercial Air Transport. Aerospace, 10, 689. [CrossRef]
- Royston, P., Parmar, M. K. B. (2002). Flexible Parametric Proportional-hazards and Proportional-odds Models for Censored Survival Data, with Application to Prognostic Modelling and Estimation of Treatment Effects. Statistics in Medicine, 21(15), 2175–2197. [CrossRef]
- Klutke, G.-A., Kiessler, P. C. and Wortman, M. A. (2003). A Critical Look at the Bathtub Curve. IEEE Transactions on Reliability, 52(1), 125-129. [CrossRef]
Figure 1.
Event histograms binned by ATSLI with 5h bins, broken down by cause, with the ATSLI axis truncated to 300h for ease of visualization. The top charts describe GA data. The bottom charts, reported only for comparison, represent commercial aviation (Parts 121, 129 and 135).
Figure 1.
Event histograms binned by ATSLI with 5h bins, broken down by cause, with the ATSLI axis truncated to 300h for ease of visualization. The top charts describe GA data. The bottom charts, reported only for comparison, represent commercial aviation (Parts 121, 129 and 135).
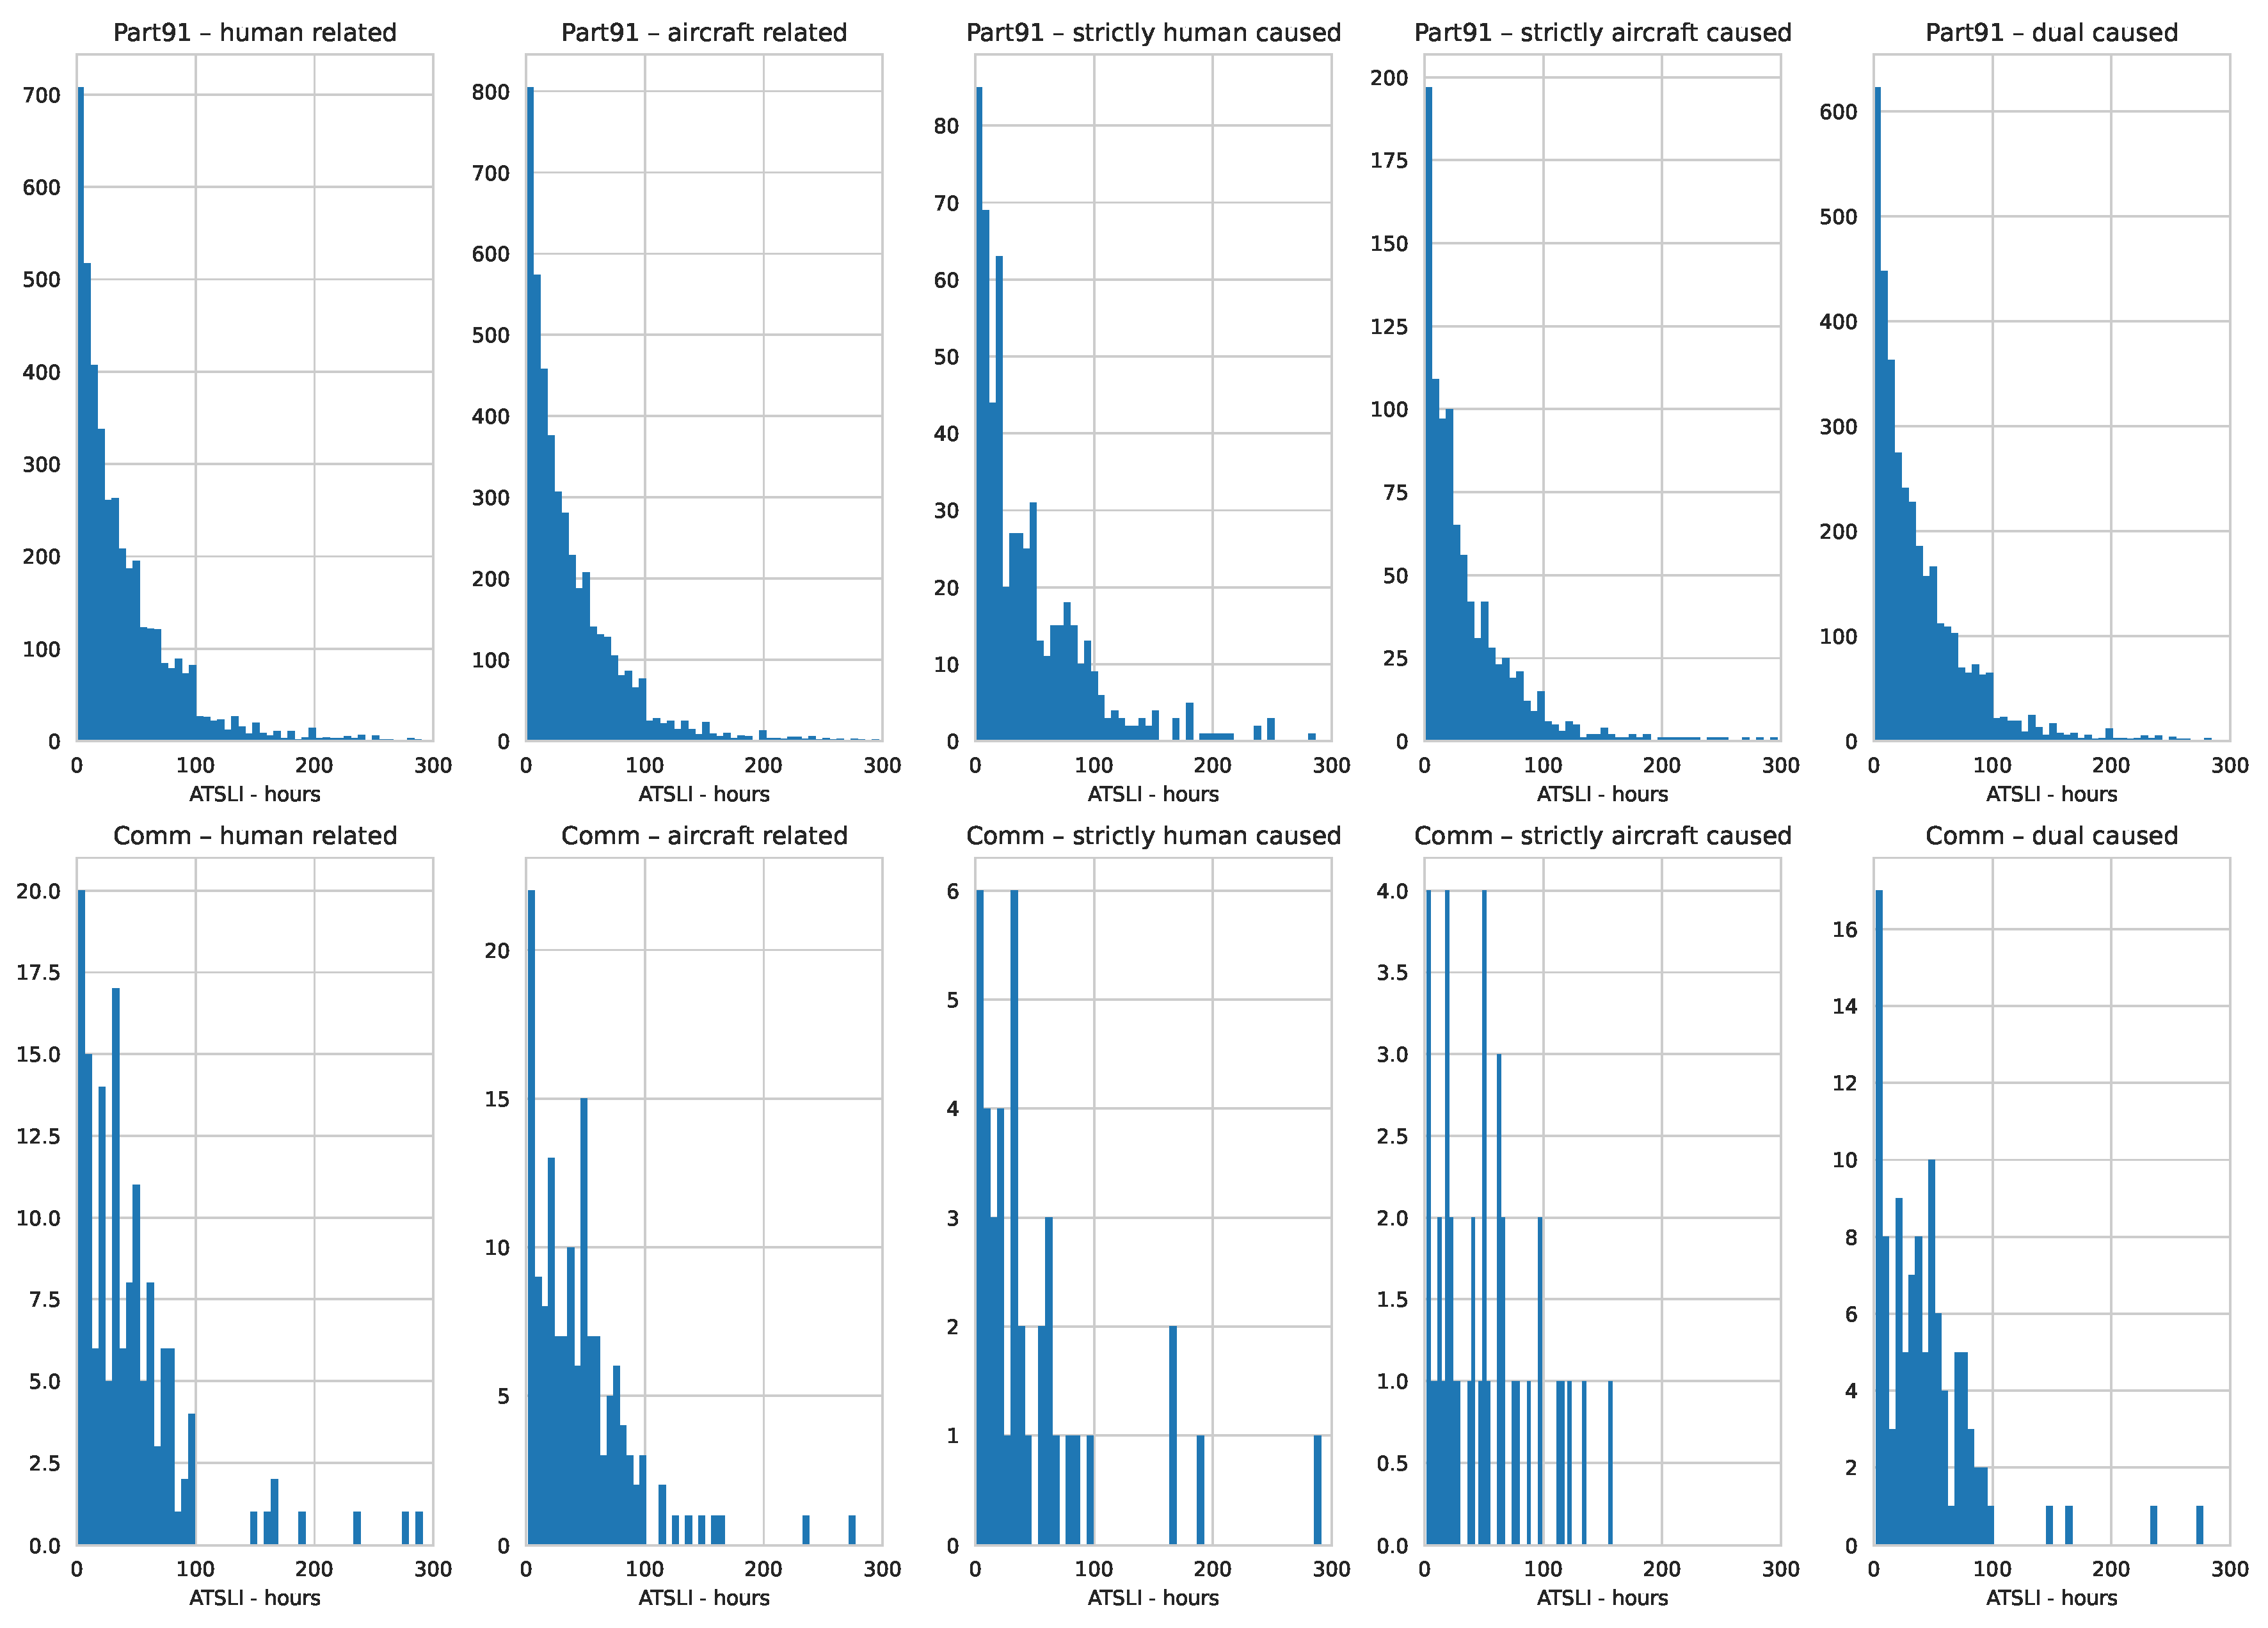
Figure 2.
Visual comparison between the empirical density histogram of strictly aircraft-caused events, in red, and strictly human-caused ones, in green. The left and right charts are the distribution over ATSLI and ETSLI, respectively. Bin width is 5 hours. Green and red histograms are overlapped and semi-transparent: a bin with a "red top" indicates that airplane-caused events exceed pilot-caused ones. The green sample is our over-representation reference. Red bins surpassing green bins in the early (0-25) hours in service indicate that failure rates are higher at low TSLI, even after correcting for sampling bias. TSLI values are truncated at 300h for ease of presentation.
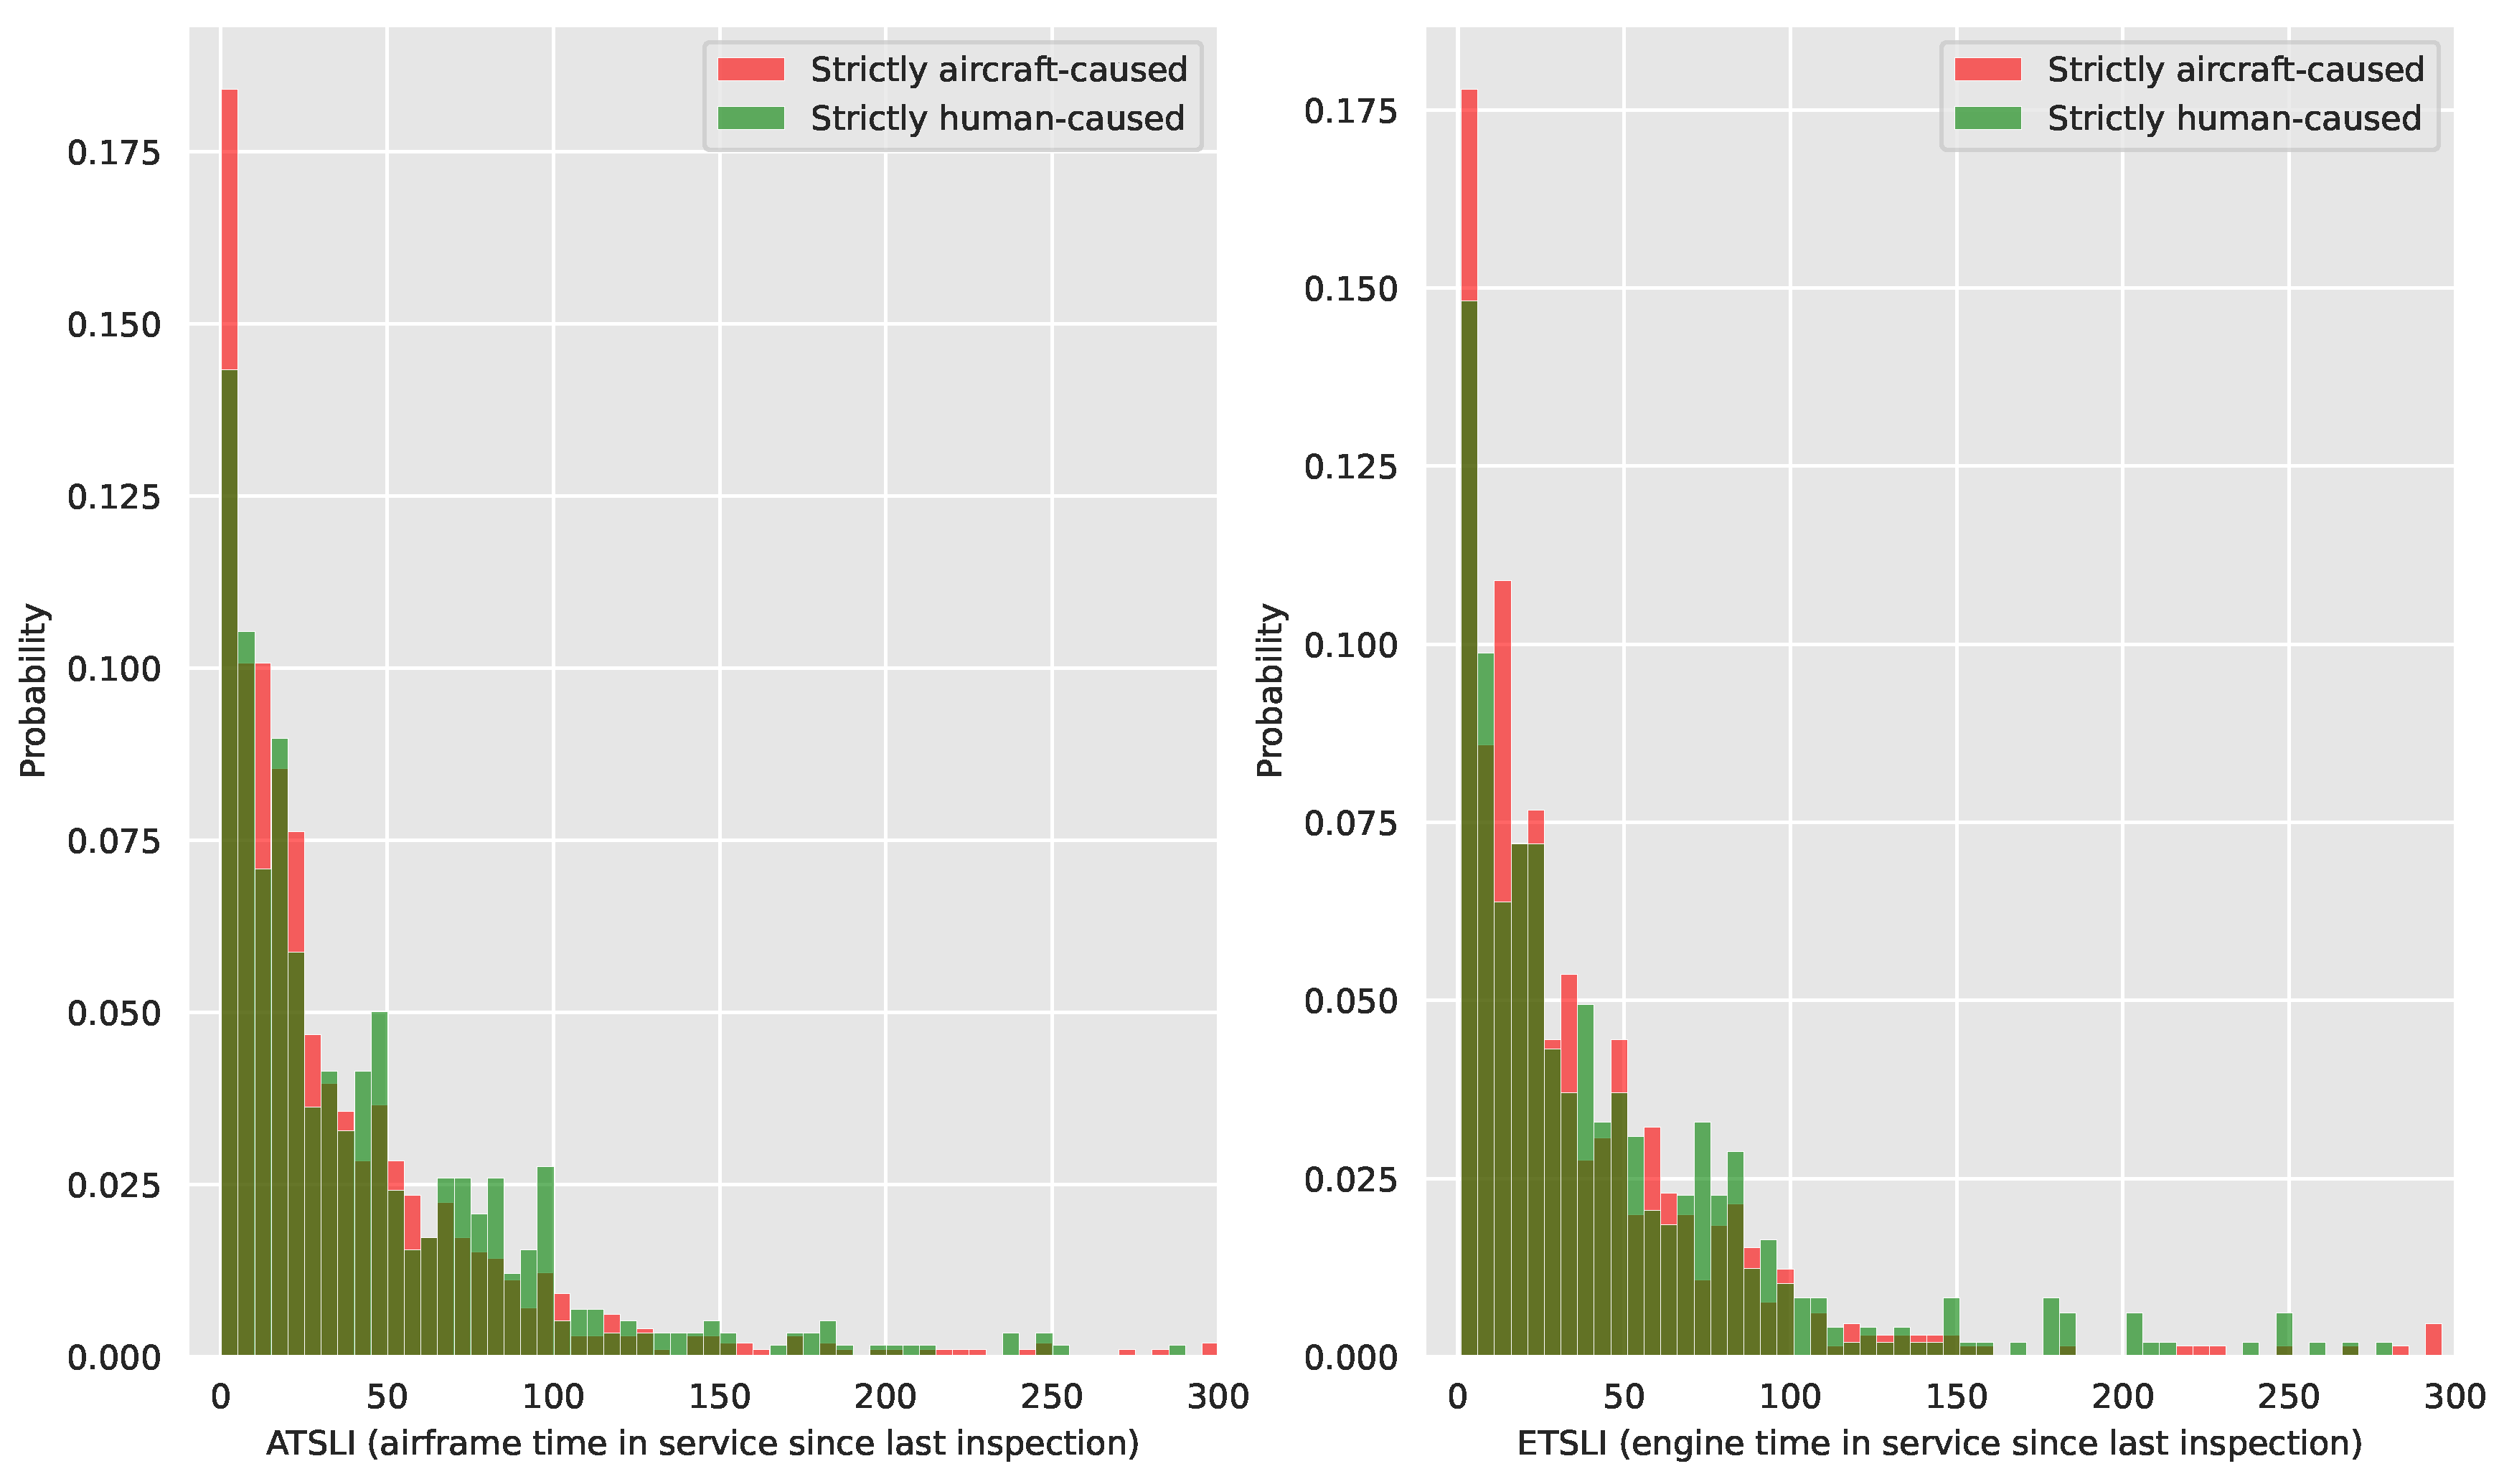
Figure 3.
Empirical survival functions of strictly aircraft-caused events, in red, and strictly human-caused ones, in green. The left and right charts are the distribution over ATSLI and ETSLI, respectively. The green distribution is our chosen measure of over-representation. The chart is limited to 250h for ease of illustration.
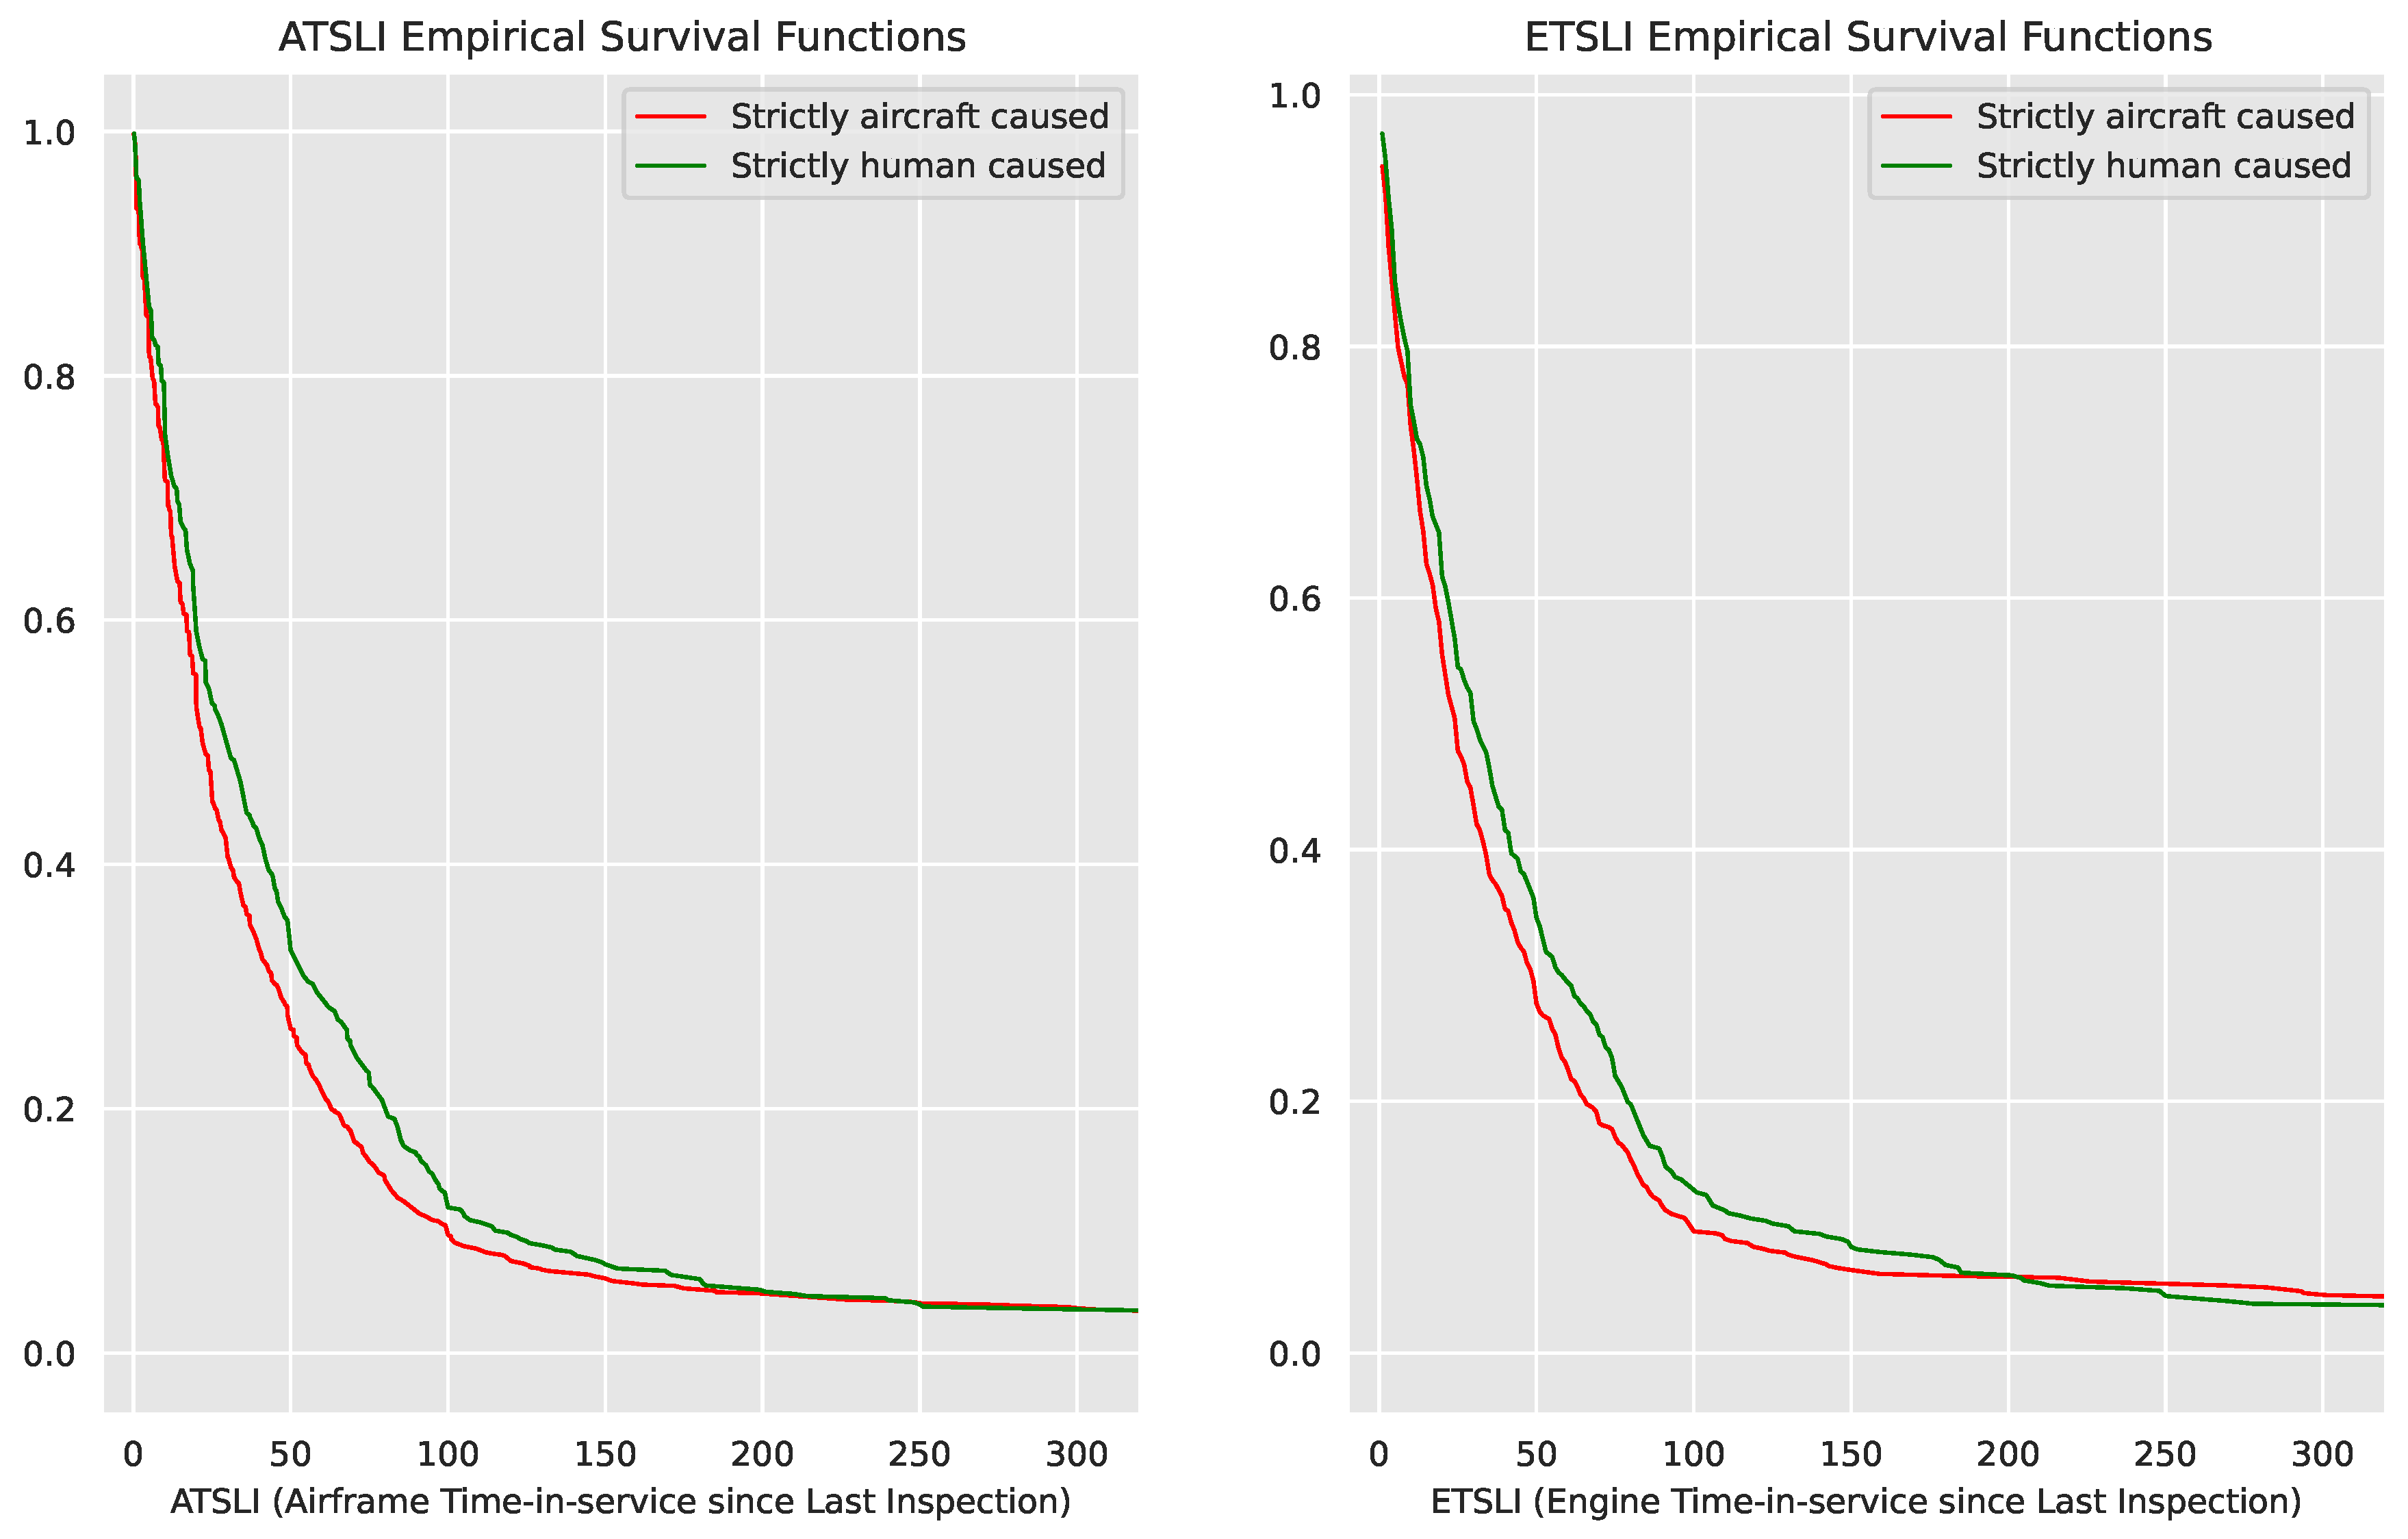
Figure 5.
We use Cox Proportional Hazard (CPH) model fitting to estimate aircraft risk corrected for sampling bias. Visually, the proportional hazard is the vertical distance between the two Cumulative Hazard Functions in log-log space. For ease of comparison, we chart both the empirical CHFs of the actual distributions (discrete points), and the CHFs of corresponding constant-hazard rate , fitted to the data (dashed lines). Green curves are our chosen measure of over-representation.
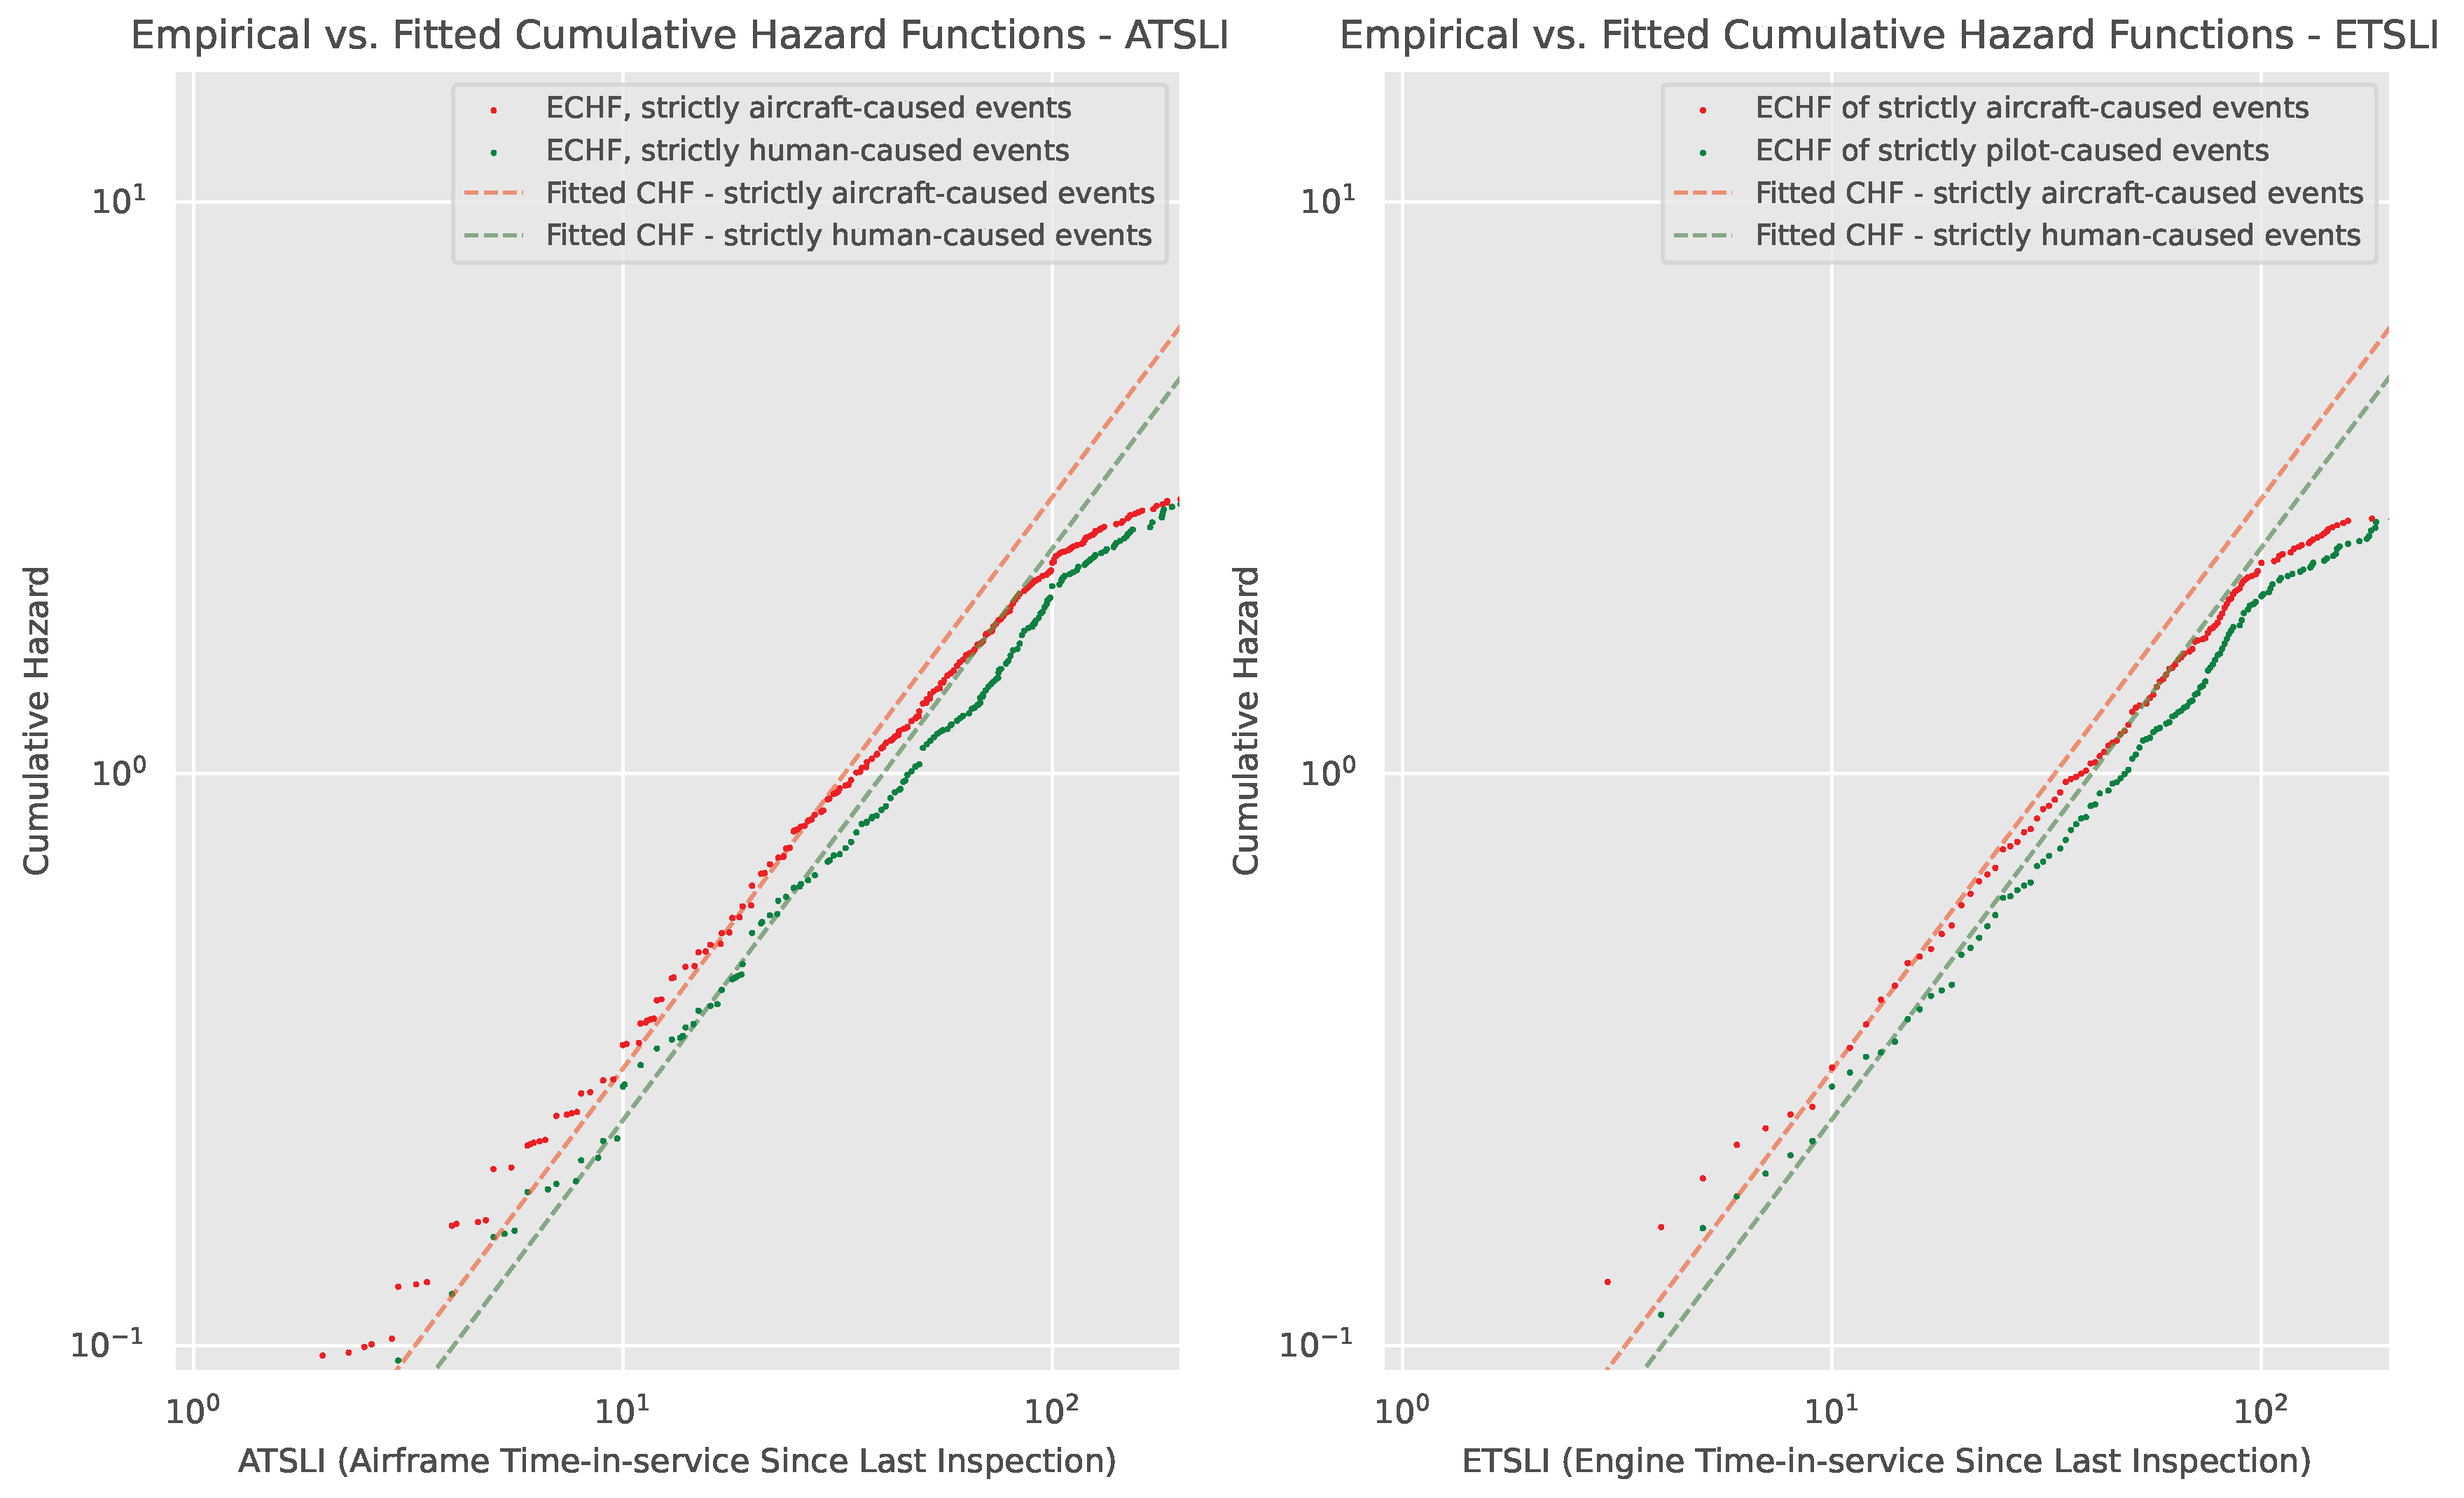
Figure 6.
Failure probability plotted in log-log scale for each fitted distribution: (a) ATSLI of strictly aircraft-caused events; (b) ATSLI of strictly human-caused events; (c) ETSLI of strictly aircraft-caused events; (d) ETSLI of strictly human-caused events. We find a higher quality of fit for ATSLI data than for ETSLI.
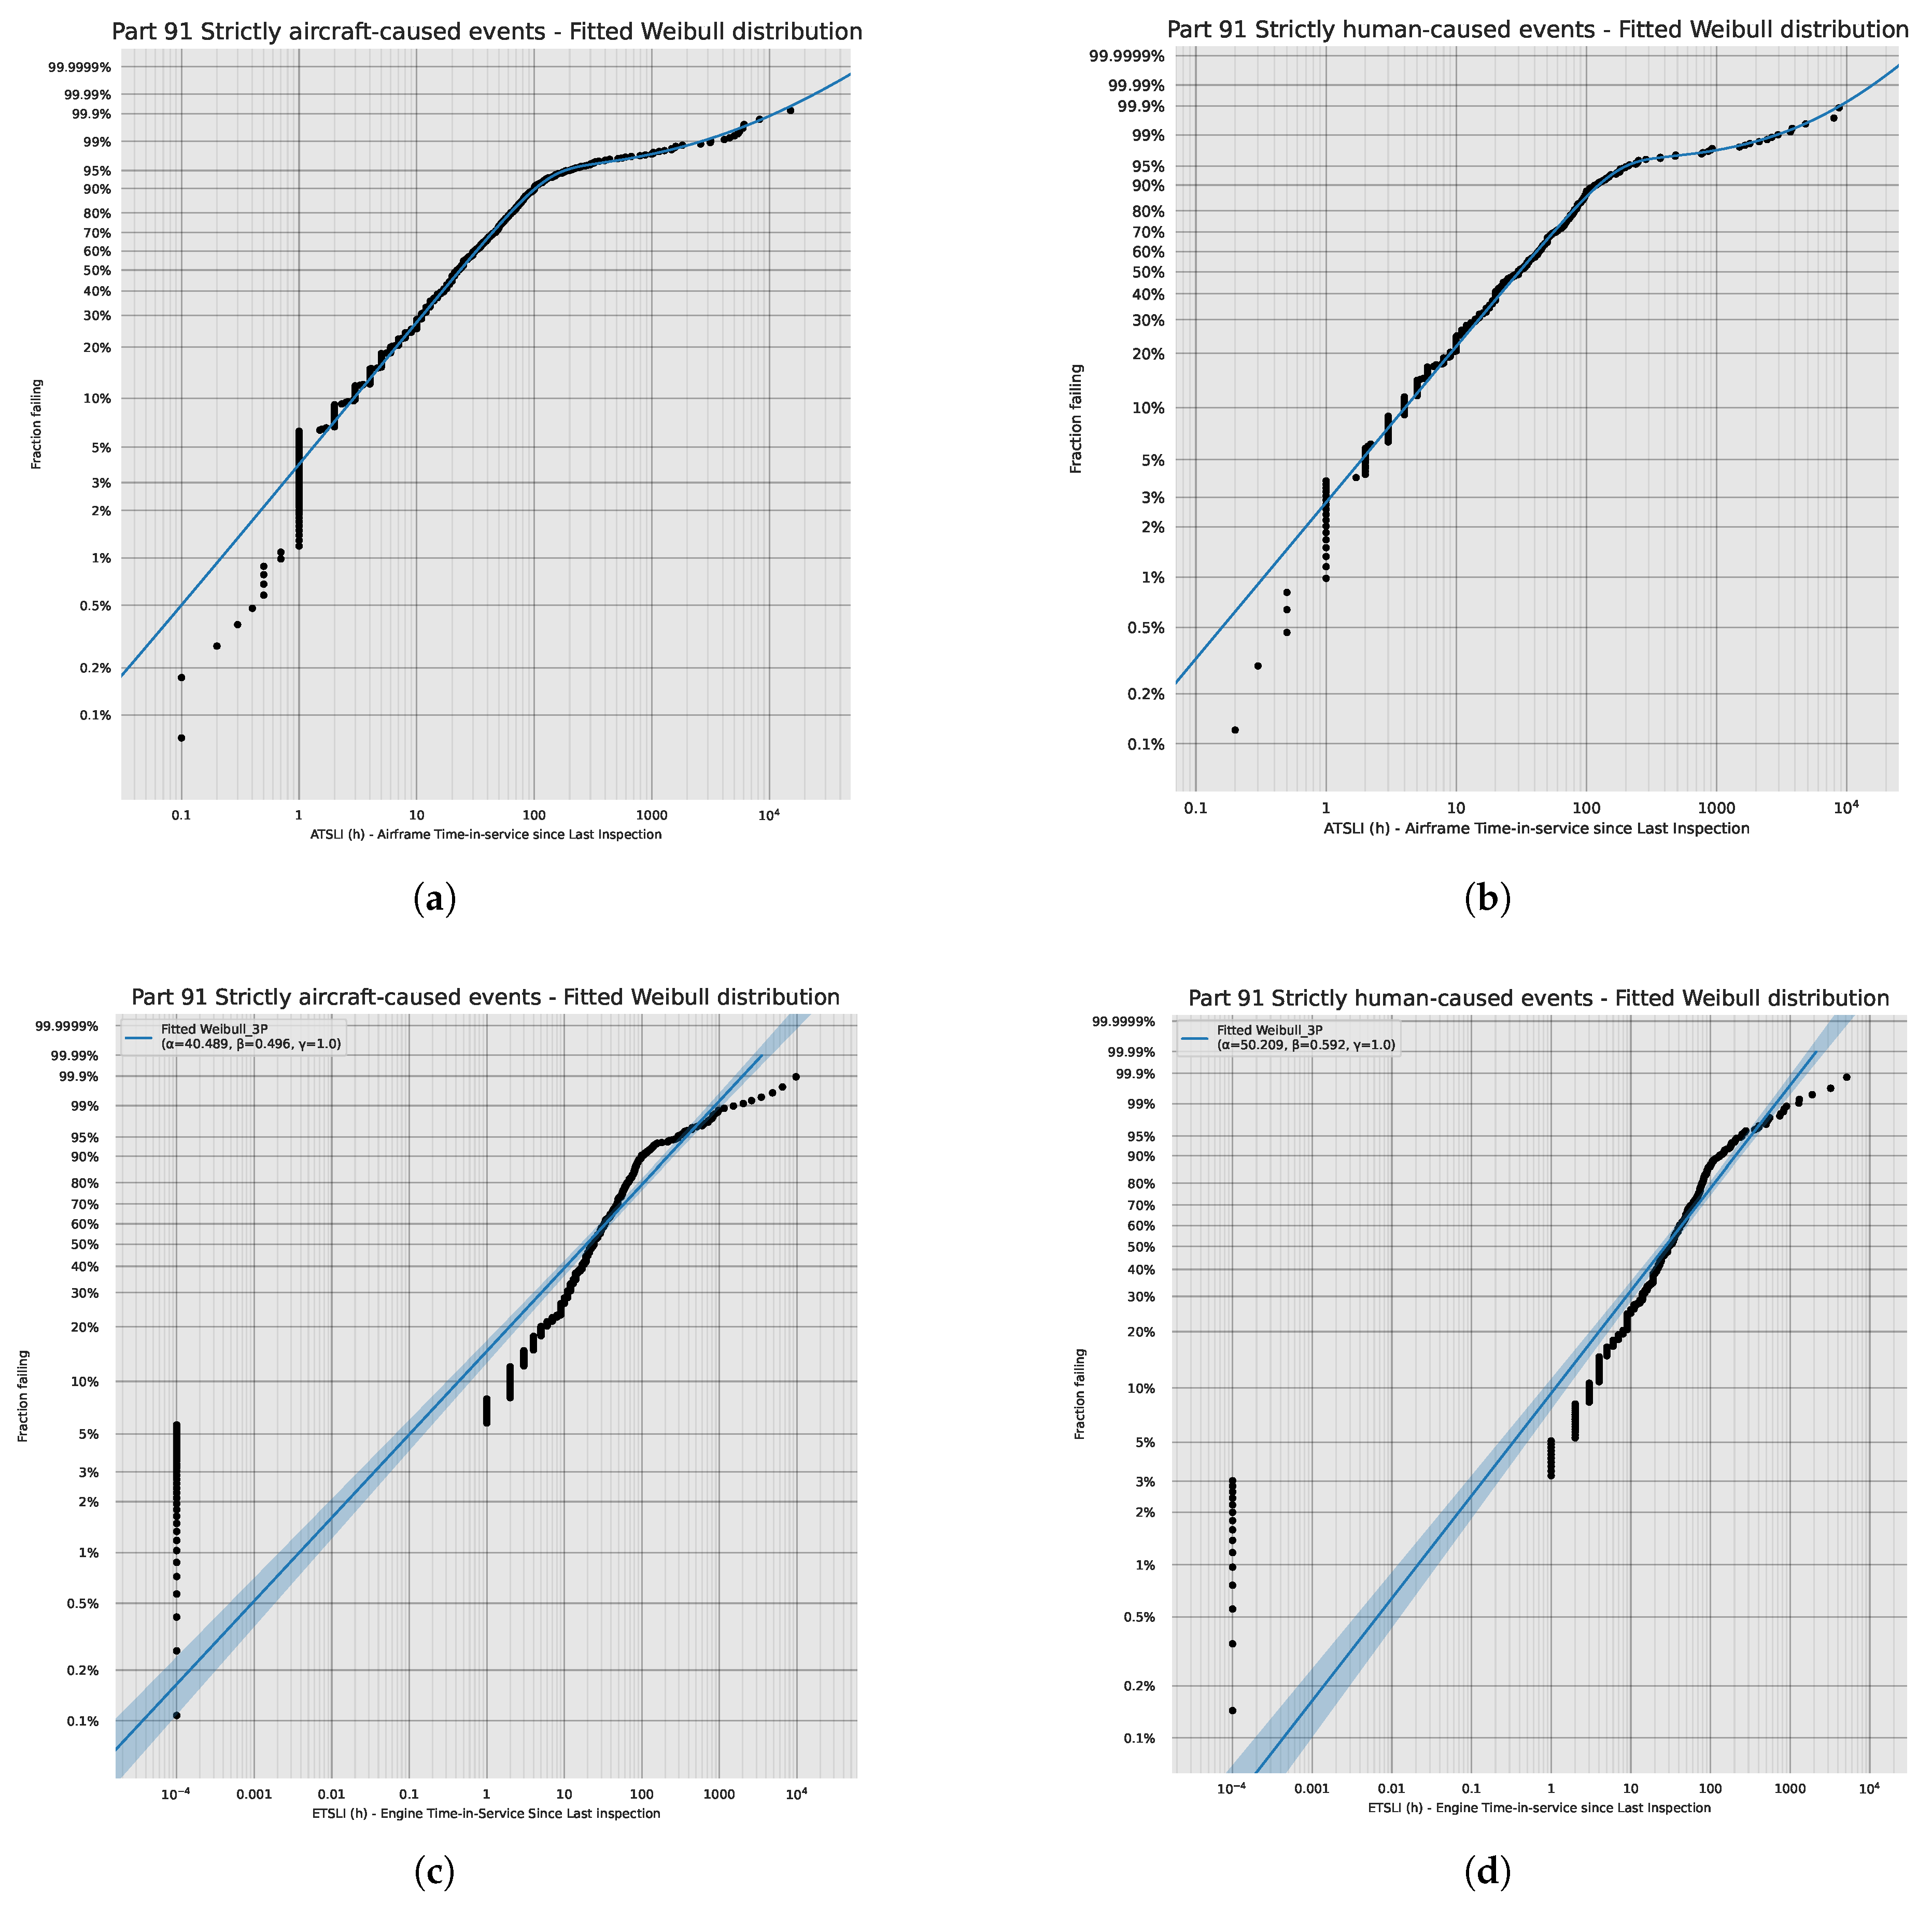
Figure 7.
Relative hazard function for aircraft-caused events, as a function of ATSLI.
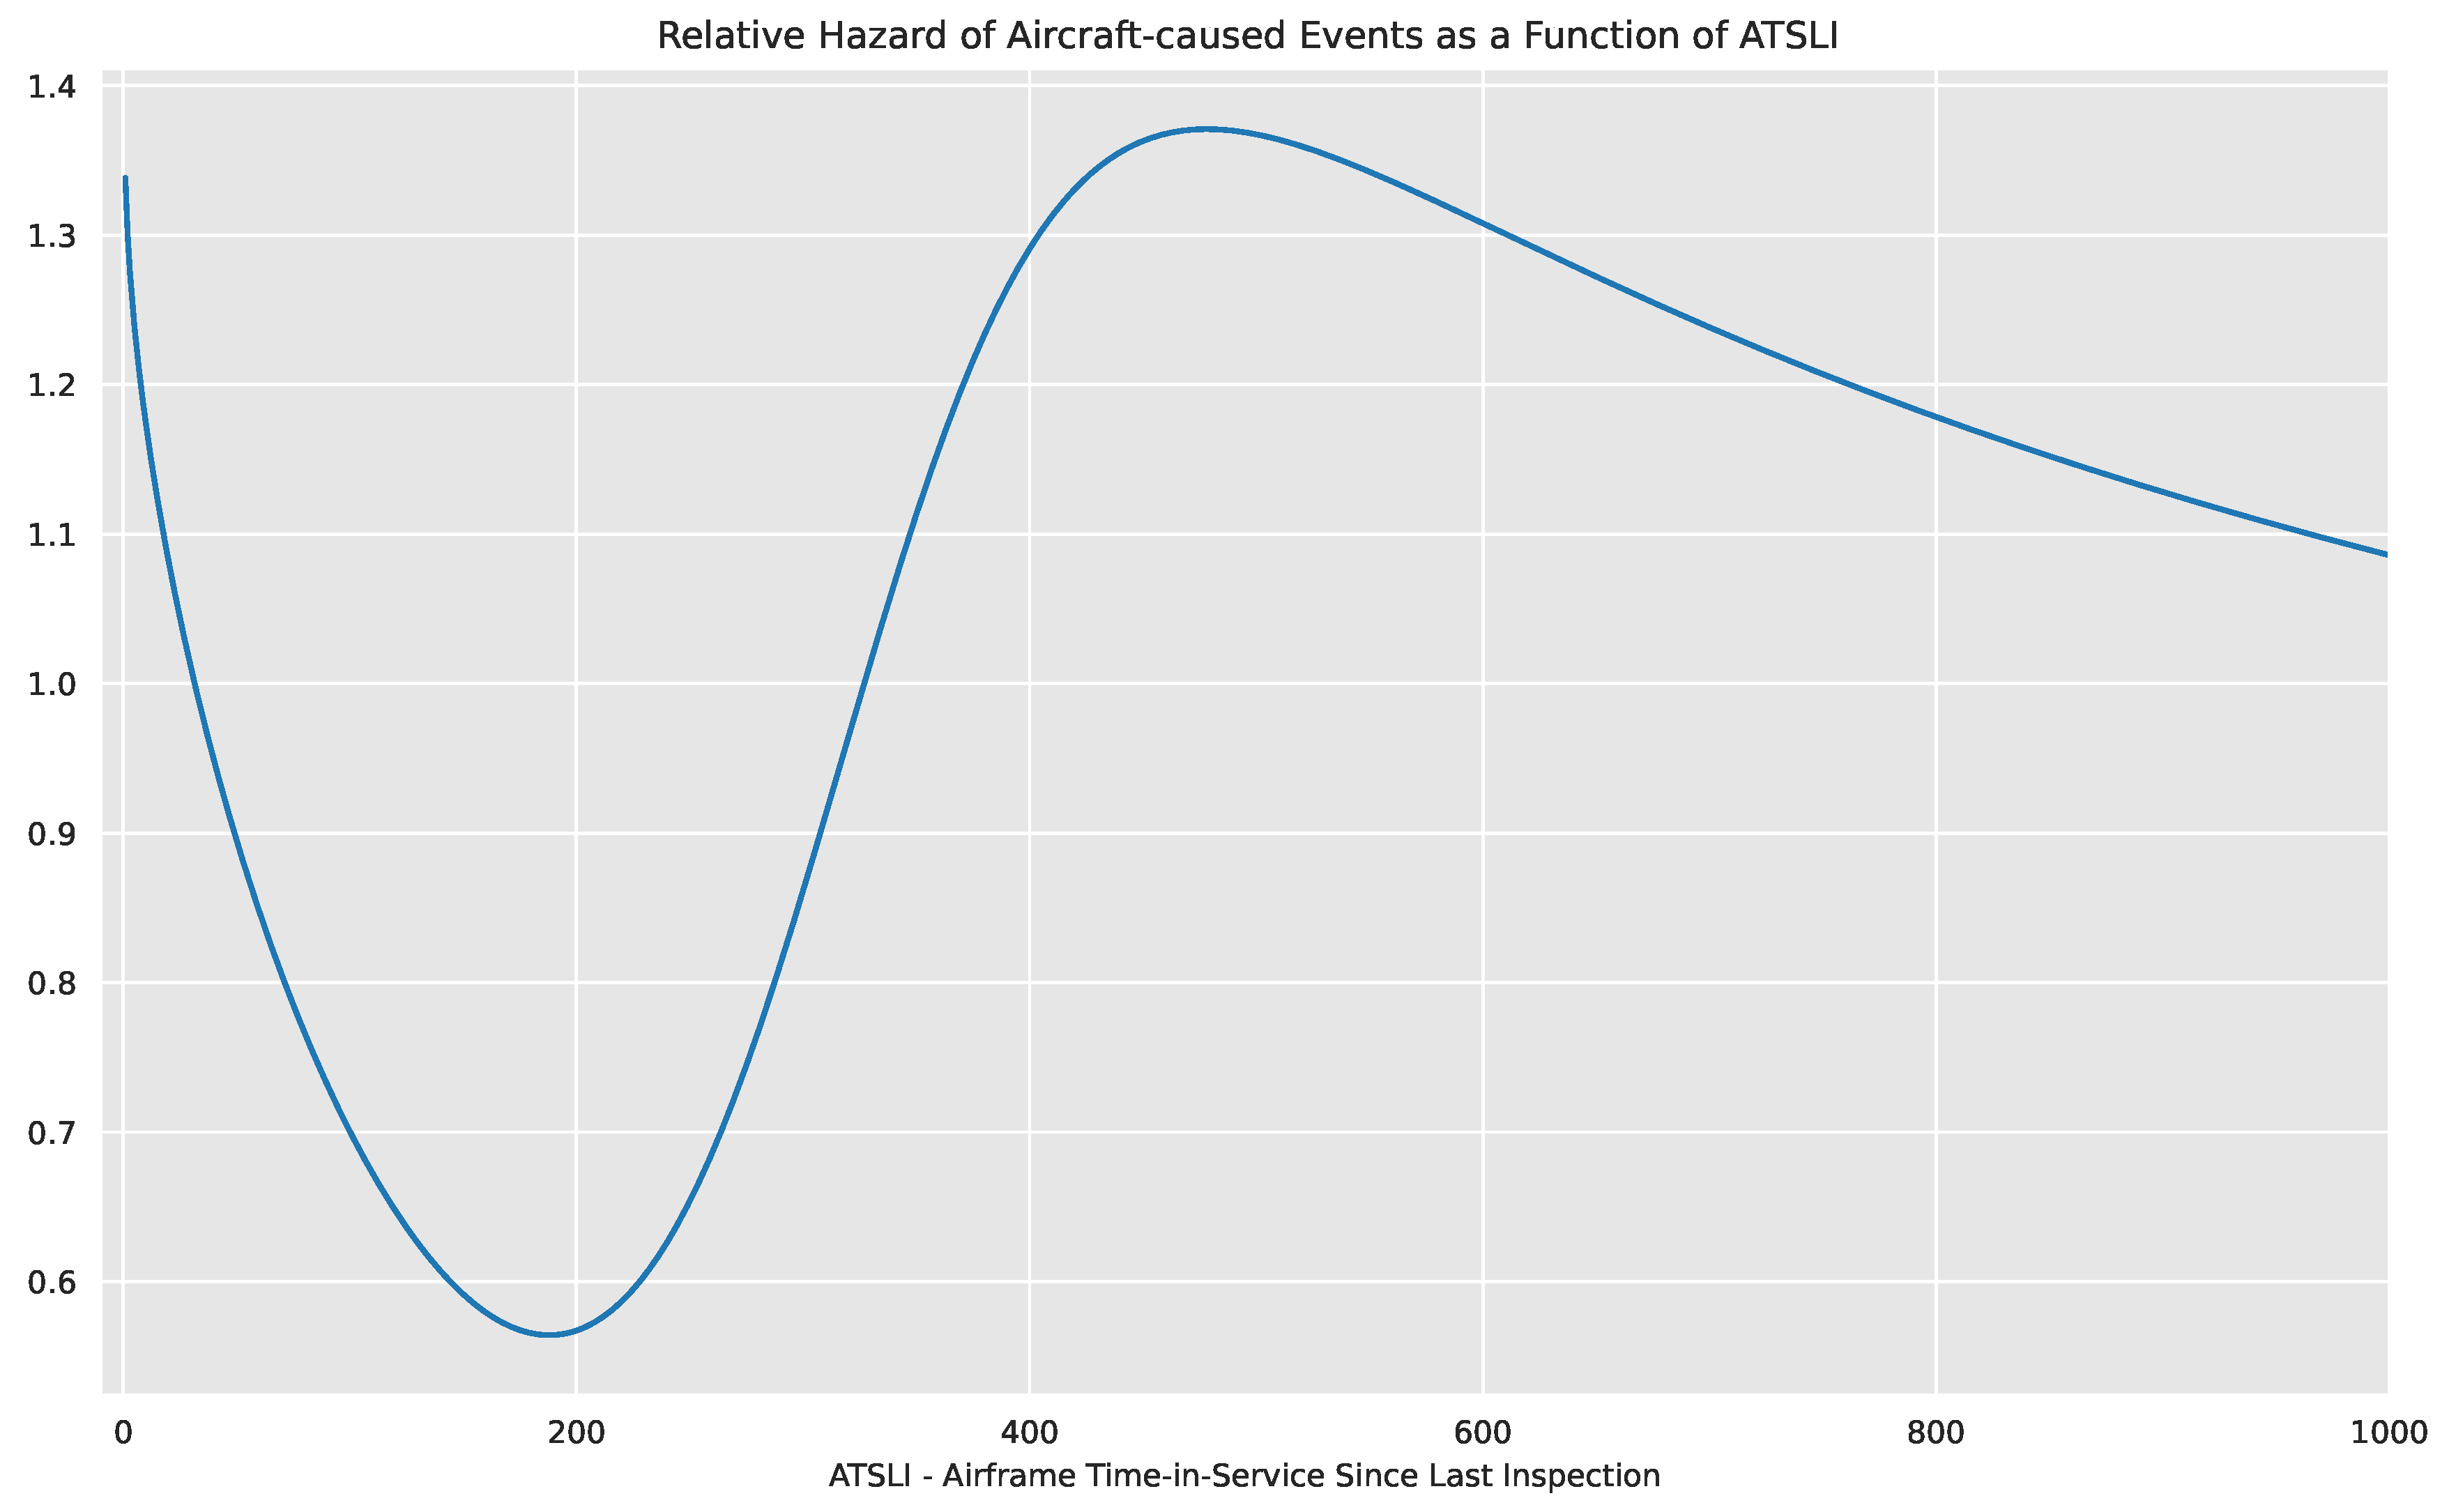
Table 1.
Breakdown of NTSB events (accidents and serious incidents) that occurred 2008-2024 per type of operation, indicated by the Part of CFR, Title 14 governing those operations. (Space and unmanned operations excluded.) General aviation accounts for a large majority of these events.
Table 1.
Breakdown of NTSB events (accidents and serious incidents) that occurred 2008-2024 per type of operation, indicated by the Part of CFR, Title 14 governing those operations. (Space and unmanned operations excluded.) General aviation accounts for a large majority of these events.
| Regulations | Type of Operations | Events |
|---|---|---|
| Part 91 | General aviation | 20,524 |
| Part 137 | Agricultural operations | 1,142 |
| Part 135 | Air taxi and charter operations | 855 |
| Part 121 | Domestic airline transport operations | 849 |
| Part 129 | Foreign airline transport operations | 319 |
| — | Public-use operations | 270 |
| Part 133 | Rotorcraft external load operations | 119 |
| Part 91K | Fractional ownership operation | 14 |
| Part 125 | Private carriage on large airplane | 6 |
| Part 103 | Ultralight vehicles | 5 |
| Other | Other and unknown operations | 3,855 |
| Total | TOTAL | 27,958 |
Table 2.
NTSB event sample sizes involving airplanes with recorded Airframe or Engine Time in Service since Last Inspection (ATSLI and ETSLI, respectively). Breakdown by cause of event. Comparison between GA and Commercial Aviation.
Table 2.
NTSB event sample sizes involving airplanes with recorded Airframe or Engine Time in Service since Last Inspection (ATSLI and ETSLI, respectively). Breakdown by cause of event. Comparison between GA and Commercial Aviation.
| General Aviation | Commercial Aviation | |
|---|---|---|
| Event count | (Part 91) | (Parts 121, 129, 135) |
| NSTB Airplane events | 16,635 | 1,109 |
| NTSB events with ATSLI recorded | 5,696 | 217 |
| Human-related events | 4,298 | 151 |
| Aircraft-related events | 4,702 | 155 |
| Strictly human-caused events | 579 | 42 |
| Strictly aircraft-caused events | 983 | 46 |
| Dual-cause events | 3,719 | 109 |
| NTSB Airplane events with engine time records | 14,815 | 296 |
| NTSB events with ETSLI recorded | 5,181 | 144 |
| Human-related events | 4,196 | 118 |
| Aircraft-related events | 4,361 | 97 |
| Strictly human-caused events | 486 | 39 |
| Strictly aircraft-caused events | 651 | 18 |
| Dual-cause events | 3,710 | 79 |
Table 3.
Absolute baseline hazard rates () and corresponding MTBF for airplane-related and for strictly airplane-caused events, obtained cross-referencing NTSB and FAA statistics over the years 2018-2023. Values of are expressed in events per million hours (pMh) in service.
Table 3.
Absolute baseline hazard rates () and corresponding MTBF for airplane-related and for strictly airplane-caused events, obtained cross-referencing NTSB and FAA statistics over the years 2018-2023. Values of are expressed in events per million hours (pMh) in service.
| Aircraft-related events | Strictly aircraft-caused events | ||||||
|---|---|---|---|---|---|---|---|
| Hours in | Event | MTBF | Event | MTBF | |||
| Service | count | (pMh) | (hours) | count | (pMh) | (hours) | |
| Single Engine | 76,815,154 | 3,964 | 51.6044 | 19,378 | 662 | 8.6181 | 116,035 |
| Twin Engine | 9,179,927 | 292 | 31.8085 | 31,438 | 51 | 5.5556 | 179,999 |
| All Piston | 85,995,081 | 4,256 | 49.4912 | 20,206 | 713 | 8.2912 | 120,610 |
Table 4.
Breakdown of Part 91 NTSB-tracked airplane events by primary purpose of flight. Personal flying is responsible for 75.7% of all tracked events.
Table 4.
Breakdown of Part 91 NTSB-tracked airplane events by primary purpose of flight. Personal flying is responsible for 75.7% of all tracked events.
| Code | Primary Purpose | Events |
|---|---|---|
| PERS | Personal | 12,568 |
| INST | Instructional | 2,451 |
| BUS | Business | 303 |
| POSI | Repositioning | 286 |
| FLTS | Flight Test | 219 |
| AOBV | Aerial Observation | 130 |
| OWRK | Other work use | 115 |
| SKYD | Skydiving | 100 |
| FERY | Ferry | 98 |
| BANT | Banner Tow | 77 |
| EXEC | Executive/ Corporate | 76 |
| BUS | Business | 69 |
| ASHO | Air race / Airshow | 55 |
| UNK | Unknown | 30 |
| GLDT | Glider tow | 29 |
| PUBU | Public Use / Service | 15 |
| AAPL | Aerial Application | 7 |
| ADRP | Air Drop | 4 |
| FIRF | Firefighting | 2 |
| TOTAL | 16,634 |
Table 5.
Results of 2-sample Kolmogorov-Smirnov hypothesis testing.
| ATSLI | ETSLI | |
|---|---|---|
| K-S statistic | 0.09570 | 0.08465 |
| Number of events | 5,696 | 5,181 |
| p-value | 0.00115 | 0.01706 |
| Conclusions | Reject | Reject |
Table 7.
Absolute rates of strictly-aircraft caused and aircraft-related events in the first 15 hours of ATSLI, for single-engine GA airplanes.
Table 7.
Absolute rates of strictly-aircraft caused and aircraft-related events in the first 15 hours of ATSLI, for single-engine GA airplanes.
| Single-Engine Airplanes | |||||
|---|---|---|---|---|---|
| ATSLI | strict | aircraft | MTBF strict | MTBF aircraft | |
| aircraft | related | aircraft | related | ||
| (h) | (pMh) | (pMh) | (h) | (h) | |
| 1 | 1.338 | 11.533 | 69.059 | 86,707 | 14,480 |
| 2 | 1.300 | 11.207 | 67.106 | 89,230 | 14,902 |
| 3 | 1.275 | 10.992 | 65.818 | 90,977 | 15,193 |
| 4 | 1.256 | 10.821 | 64.798 | 92,409 | 15,433 |
| 5 | 1.239 | 10.676 | 63.927 | 93,668 | 15,643 |
| 6 | 1.224 | 10.547 | 63.153 | 94,817 | 15,835 |
| 7 | 1.210 | 10.429 | 62.446 | 95,889 | 16,014 |
| 8 | 1.197 | 10.319 | 61.792 | 96,905 | 16,183 |
| 9 | 1.186 | 10.217 | 61.177 | 97,878 | 16,346 |
| 10 | 1.174 | 10.120 | 60.596 | 98,817 | 16,503 |
| 11 | 1.164 | 10.027 | 60.043 | 99,728 | 16,655 |
| 12 | 1.153 | 9.939 | 59.513 | 100,616 | 16,803 |
| 13 | 1.143 | 9.854 | 59.003 | 101,485 | 16,948 |
| 14 | 1.134 | 9.772 | 58.511 | 102,338 | 17,091 |
| 15 | 1.125 | 9.692 | 58.035 | 103,177 | 17,231 |
Table 8.
Absolute rates of strictly-aircraft caused and aircraft-related events in the first 15 hours of ATSLI, for twin-engine GA airplanes.
Table 8.
Absolute rates of strictly-aircraft caused and aircraft-related events in the first 15 hours of ATSLI, for twin-engine GA airplanes.
| Twin-Engine Airplanes | |||||
|---|---|---|---|---|---|
| ATSLI | strict | aircraft | MTBF strict | MTBF aircraft | |
| aircraft | related | aircraft | related | ||
| (h) | (pMh) | (pMh) | (h) | (h) | |
| 1 | 1.338 | 7.435 | 42.567 | 134,504 | 23,492 |
| 2 | 1.300 | 7.225 | 41.364 | 138,418 | 24,176 |
| 3 | 1.275 | 7.086 | 40.569 | 141,128 | 24,649 |
| 4 | 1.256 | 6.976 | 39.941 | 143,349 | 25,037 |
| 5 | 1.239 | 6.882 | 39.404 | 145,302 | 25,378 |
| 6 | 1.224 | 6.799 | 38.927 | 147,084 | 25,689 |
| 7 | 1.210 | 6.723 | 38.491 | 148,747 | 25,980 |
| 8 | 1.197 | 6.652 | 38.088 | 150,323 | 26,255 |
| 9 | 1.186 | 6.586 | 37.709 | 151,832 | 26,518 |
| 10 | 1.174 | 6.524 | 37.351 | 153,289 | 26,773 |
| 11 | 1.164 | 6.464 | 37.010 | 154,702 | 27,019 |
| 12 | 1.153 | 6.407 | 36.683 | 156,080 | 27,260 |
| 13 | 1.143 | 6.352 | 36.369 | 157,428 | 27,496 |
| 14 | 1.134 | 6.299 | 36.066 | 158,751 | 27,727 |
| 15 | 1.125 | 6.248 | 35.773 | 160,052 | 27,954 |
Table 9.
Absolute rates of strictly-aircraft caused and aircraft-related events in the first 15 hours of ATSLI, for generic piston planes, regardless of engine count.
Table 9.
Absolute rates of strictly-aircraft caused and aircraft-related events in the first 15 hours of ATSLI, for generic piston planes, regardless of engine count.
| Aggregate Piston Airplanes - regardless of engine count | |||||
|---|---|---|---|---|---|
| ATSLI | strict | aircraft | MTBF strict | MTBF aircraft | |
| aircraft | related | aircraft | related | ||
| (h) | (pMh) | (pMh) | (h) | (h) | |
| 1 | 1.338 | 11.096 | 66.231 | 90,126 | 15,099 |
| 2 | 1.300 | 10.782 | 64.358 | 92,749 | 15,538 |
| 3 | 1.275 | 10.575 | 63.122 | 94,565 | 15,842 |
| 4 | 1.256 | 10.411 | 62.144 | 96,053 | 16,092 |
| 5 | 1.239 | 10.271 | 61.309 | 97,361 | 16,311 |
| 6 | 1.224 | 10.147 | 60.566 | 98,555 | 16,511 |
| 7 | 1.210 | 10.033 | 59.889 | 99,670 | 16,698 |
| 8 | 1.197 | 9.928 | 59.261 | 100,726 | 16,874 |
| 9 | 1.186 | 9.829 | 58.672 | 101,737 | 17,044 |
| 10 | 1.174 | 9.736 | 58.115 | 102,713 | 17,207 |
| 11 | 1.164 | 9.647 | 57.584 | 103,660 | 17,366 |
| 12 | 1.153 | 9.562 | 57.075 | 104,583 | 17,521 |
| 13 | 1.143 | 9.480 | 56.587 | 105,487 | 17,672 |
| 14 | 1.134 | 9.401 | 56.115 | 106,373 | 17,821 |
| 15 | 1.125 | 9.324 | 55.659 | 107,245 | 17,967 |
Disclaimer/Publisher’s Note: The statements, opinions and data contained in all publications are solely those of the individual author(s) and contributor(s) and not of MDPI and/or the editor(s). MDPI and/or the editor(s) disclaim responsibility for any injury to people or property resulting from any ideas, methods, instructions or products referred to in the content. |
© 2025 by the authors. Licensee MDPI, Basel, Switzerland. This article is an open access article distributed under the terms and conditions of the Creative Commons Attribution (CC BY) license (http://creativecommons.org/licenses/by/4.0/).
Copyright: This open access article is published under a Creative Commons CC BY 4.0 license, which permit the free download, distribution, and reuse, provided that the author and preprint are cited in any reuse.


