
Submitted:
18 February 2025
Posted:
19 February 2025
You are already at the latest version
Abstract
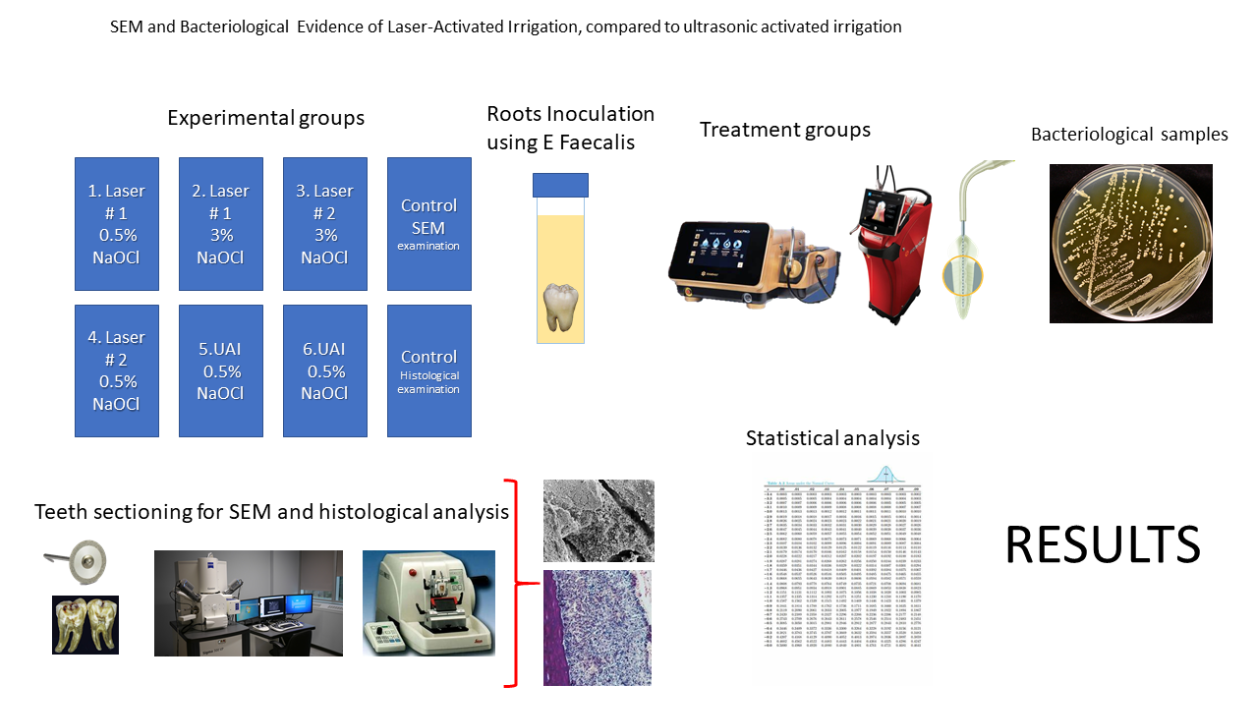
Pulp tissue debridement and eradication of microorganisms from an infected root canal system before obturation is a primary focus of endodontic treatment and the best predictor for the long-term success of endodontic treatment. The purpose of this in vitro laboratory study was to evaluate pulp tissue debridement and the disinfection efficacy of two different Er;Cr:YSGG laser units, with 2790 nm wavelength, compared to Ultrasonic Activated Irrigation (UAI) in root canals infected with Enterococcus faecalis.
The different laser-activated irrigation protocols showed multiple areas of remaining bacteria, biofilm, tissue, and thermal ablation. The laser fiber tips also displayed significant tip degradation after use which might affect efficacy. While UAI showed similar results. In this in-vitro study, laser-activated irrigation using Er;Cr:YSGG technology and UAI were inefficient in eliminating pulp tissue from difficult-to-reach areas and Enterococcus faecalis from infected root canals.
Keywords:
Laser
; Er
; Cr:YSGG
; Ultrasonic Irrigation
; Bacterial count
; Sodium hypochlorite
1. Introduction
Many clinical approaches have been evaluated for disinfection and control of the root canal biofilm as part of endodontic treatment [1,2], as the presence of bacteria in root canals has been reported to be responsible for endodontic treatment failure [1,3]. Eradication of microorganisms from an infected root canal before obturation, therefore, is a primary focus of endodontic treatment [3,4] and may be the best predictor for the long-term success of endodontic treatment [5]. The location and multiplication of bacteria within root canals are the factors most often cited for making disinfection of the root canals a clinical challenge. Bacteria have been found to colonize and survive in dentinal tubules, lateral canal ramifications, canal isthmuses, and other irregularities in the root canal [1,3], thus limiting the effectiveness of a mechanical instrumentation approach unless it is supplemented with antimicrobial solutions intended to help reduce bacterial load [6,7].
Enterococcus faecalis, a persistent Gram-positive facultative anaerobe, can resist and adapt to the harshest environmental conditions; this explains its presence and survival in endodontic infections and periapical lesions [8]. Traditional therapeutic treatments, such as sodium hypochlorite and chlorhexidine (either gel or liquid), or combinations of other irrigation solutions, have been shown to be effective in eliminating or reducing the presence of E. faecalis from root canals and dentinal tubules [9]. Different techniques have been proposed to improve the efficacy of irrigation solutions, including changes in concentration, temperature, surfactant, and agitation [10].
Even though traditional chemo-mechanical cleansing measures have shown acceptable results in endodontic outcomes, several reports suggest that adjunctive use of lasers with the irrigants may improve outcomes where traditional methods may fail to succeed [1,11,12].
Ultrasonic technology plays a pivotal role in enhancing the efficacy of root canal irrigation through mechanisms such as cavitation and acoustic streaming, a principle well-documented in the literature [13,14]
The purpose of this in vitro pilot study was to evaluate the disinfection efficacy of laser-activated irrigation with two different erbium;chromium:ytrrium-scandium-gallium-garnet (Er;Cr:YSGG) lasers and ultrasonic-activated irrigation (UAI) in root canals infected with Enterococcus faecalis.
2. Material and Methods
32 human non-infected mandibular first molars extracted for therapeutic reasons were collected from patients presenting to the UTSHOD urgent care clinic. After an initial evaluation and offered treatment options for their dental condition. Patients who elected to have tooth extractions were included in this study. Following extraction, digital radiographs were obtained of each tooth. Toot canal calcification and curvature were assessed, with root canal curvature classified according to the Schneider [15] classification. Roots with a curvature of less than 20 degrees were selected for inclusion in the study. The teeth were cleaned to remove soft tissue and any other material adhering to the outside of the teeth. The teeth were stored in a phosphate-buffered saline solution and frozen at -80˚C until use. The access cavities were made with a high-speed handpiece with a sterile #3 round carbide bur under constant water spray. The root canal orifices were located with a DG-16 endodontic explorer and a #10 K-file (Kerr, Brea, CA, USA) was used to establish working length by subtracting 1 mm from the length determined when the K-file is seen coming out through the apical foramen.
The canals were instrumented using a conventional sequence of 0.04 taper files up to 30/.04 Vortex Blue® (Charlotte, NC, USA) rotary file. After each file, the root canals were irrigated with 1 mL of 6% NaOCl using a syringe with a 30-gauge side-vented needle. Once the canals were prepared, NaOCl was inactivated with a 5% sodium thiosulfate solution for 5 minutes. The canals were then irrigated with 5 mL of 17% ethylenediaminetetraacetic acid (EDTA) for 5 minutes. The teeth were then placed in a glass flask and sterilized using an autoclave.
Enterococcus Faecalis biofilm formation.
E. faecalis ATCC 4083 was cultured in 1 mL of brain heart infusion broth (BHI) for 16 hours and inoculated into 5 mL of fresh BHI with 2% glucose solution. The molars were placed individually into a 50 mL conical test tube with 10 mL of fresh BHI and inoculated with 100 µL of the suspension of the cultured E. faecalis. The molars were incubated at 37˚C for four weeks. The BHI media was replaced once a week for four weeks of incubation time. The ability to colonize the root canal was verified by the 0.5 McFarland turbidity standard model and by observing the root canal surface of an untreated molar using SEM imaging.
2.1. Preparation of Laser Systems
Before use, each laser system, the smaller laser unit #1 (Albuquerque, NM, USA) and a larger laser unit #2 (Foothill ranch, CA, USA) was inspected per the user manual. The mirror on the fiber optic was inspected for damage to ensure that it was in good condition. The mirror in the handpiece was inspected for damage to ensure it was in good condition. Each fiber tip was inspected per the user manual. A different new tip was used for each tooth. Before and after the use of each new tip, the output power was measured using a Power Max 500D (Molectron, Portland, OR). The expected power output at the fiber tip was calculated considering a 20% power loss during delivery.
2.2. Laser-Activated Irrigation (LAI) Protocols
Two teeth were not treated by LAI and Ultrasonic Irrigation and were placed into a vial containing a 10% formalin solution. It served as a positive control to verify by means of SEM that an Enterococcus faecalis biofilm was established in the root canal system using the inoculation procedure described above. The second tooth was histologically sectioned and stained with H&E and Gram to verify preservation of pulp tissue and bacterial growth.
Thirty teeth were randomly divided into six groups (n = 5). Each group underwent a different laser-activated irrigation protocol or ultrasonic-activated irrigation (UAI): 1) 0.5% NaOCl + EDTA + Laser # 1; 2) 3% NaOCl + 17% EDTA + Laser # 1, and 3) 3% NaOCl + 17% EDTA + Laser # 2, 4) 0.5% NaOCl +Ultrasonic tip for UAI, 5) 0.5% NaOCl + Ultrasonic tip, 6) 3% NaOCl + Ultrasonic tip for UAI. These teeth were examined using SEM images.
| Group | Technique | Irrigation protocol |
| 1 | Laser # 1 | 0.5% Sodium hypochlorite |
| 2 | Laser # 1 | 3% Sodium hypochlorite + EDTA |
| 3 | Laser # 2 | 3% Sodium hypochlorite + EDTA |
| 4 | Laser # 2 | 0.5% Sodium hypochlorite |
| 5 | UAI | 0.5% Sodium hypochlorite |
| 6 | UAI | 3% Sodium hypochlorite |
For 0.5% NaOCl + laser # 1 a RFT (275) tip was used and laser # 2 TIP 2 (320) were used. The laser settings were 10 Hz, 1 W, 100 mJ/pulse, 60 µsec pulse length, with air/water turned off. These custom settings were from the laser disinfection section of the Laser # 1Radial Apical Cleansing Protocol [13]. The settings were programmed into the Laser # 1 by going to Endo Geek Laser Disinfection. The pulp chamber of the tooth was flooded with 0.5% NaOCl, and a number 2 tip (320 µM) was placed above each root canal orifice and activated for 30 seconds while holding the tip in place. After a 30-second rest period, the tip was activated again for 30 seconds. Then the chamber was flooded with distill water, and the tip was activated for 30 seconds over each canal orifice. After the laser-activated irrigation, the teeth were placed into a vial containing a 10% formalin solution.
For 3% NaOCl + 17% EDTA + Laser # 1 (NM), the laser settings were 50 Hz, 0.75 W, 15 mJ/ pulse, 60 µsec pulse length, with the air/water turned off. The pulp chamber of the tooth was flooded with 3% NaOCl. Using consistent irrigation with 3% NaOCl, a number 2 tip (320 µM) was placed mid-root, then the laser was activated, and the fiber tip was withdrawn at 2 mm/sec. There were three passes per canal. Next, the pulp chamber of the tooth was flooded with 17% EDTA. With consistent EDTA irrigation, a number 2 tip (320 µM) was placed mid-root, then the laser was activated, and the fiber tip was withdrawn at 2 mm/sec. There were three passes per canal. The pulp chamber of the tooth was flooded with water, and a number 2 tip (320 µM) was placed in the pulp chamber; the laser was activated for 30 sec using the PostRinse settings (20 Hz, 1.50 W, 75 mJ/ pulse, 60 µsec pulse length, 20% air and 90% water). After the laser-activated irrigation, the teeth were placed into a vial containing a 10% formalin solution.
For 3% NaOCl + 17% EDTA + Laser # 1, the laser settings were 50 Hz, 0.75 W, 15 mJ/ pulse, 60 µsec pulse length, with the air/water turned off. The pulp chamber of the tooth was flooded with 3% NaOCl. Using consistent irrigation with 3% NaOCl, a number 2 tip (320 µM) was placed mid-root, then the laser was activated, and the fiber tip was withdrawn at 2 mm/sec. There were three passes per canal. Next, the pulp chamber of the tooth was flooded with 17% EDTA. With consistent EDTA irrigation, a number 2 tip (320 µM) was placed mid-root, then the laser was activated, and the fiber tip was withdrawn at 2 mm/sec. There were three passes per canal. The pulp chamber of the tooth was flooded with water, and a number 2 tip (320 µM) was placed in the pulp chamber; the laser was activated for 30 sec using the Post-Rinse settings (20 Hz, 1.50 W, 75 mJ/ pulse, 60 µsec pulse length, 20% air and 90% water). After the laser-activated irrigation, the teeth were placed into a vial containing a 10% formalin solution.
For 3% NaOCl + 17% EDTA + Laser # 2, the laser settings were 50 Hz, 1.25 W, 25 mJ/ pulse, 60 µsec pulse length, with air/water turned off. The pulp chamber of the tooth was flooded with 3% NaOCl, and an RFT2 tip was placed 2 mm short of working length; the laser was activated, and the fiber tip was withdrawn at 2 mm/sec. There were three passes per canal. Then the pulp chamber of the tooth was flooded with 17% EDTA, and an RFT2 tip was placed 2 mm short of working length; the laser was activated, and the fiber tip was withdrawn at 2 mm/sec. There were three passes per canal. The pulp chamber of the tooth was flooded with water, and an RFT2 tip was placed 2 mm short of working length; the laser was activated, and the fiber tip was withdrawn at 2 mm/sec. There were three passes per canal. After the laser-activated irrigation, the teeth were placed into a vial containing a 10% formalin solution.
For the 0.5% and 3% NaOCl Irrisafe UAI group, the tip was located 1 mm short of working length and activated at 25% power running 3 cycles of 20 seconds alternating NaOCl, EDTA and NaOCl.
A total of 5 mL of NaOCl and 2 mL of EDTA were used individually in each experimental tooth.
3. Bacteriological Samples
NaOCl was inactivated with irrigation of 1mL of 5% sodium thiosulfate for 1 minute followed by 0.5 mL of sterile saline solution. A sterile size 35 Hedstrom file (Charlotte, NC, USA) was used to collect dentinal shavings by planning the canal walls. A second bacterial sample (S2) was collected with 2 medium sterile paper points. Paper points were left in the canal to absorb the solution for 1 minute each. Both paper points and the Hedstrom file were placed in a micro Eppendorf test tube filled with 0.5 ml of PBS. Teeth were then stored in formalin for SEM evaluation.
3.1. CFU Bacterial Analysis
Sterile micro-Eppendorf tubes per sample were collected and filled with 90 uL of PBS. Micro-Eppendorf tubes with the samples were then vortexed and 10 uL was collected from the original sample then placed into the following micro-Eppendorf tube. This serial dilution continued up to 10^-5 and CFU counts were then completed after 24 hours and statistical analysis was completed thereafter.
3.2. Radiographs
Using a Pennwalt® Intrex JC03772 X-ray machine, radiographs were taken of each tooth before splitting the teeth for SEM.
3.3. Scanning Electron Microscopy
The crown of each treated tooth was removed, the roots were separated, and each root was split in half with the use of low-speed diamond disk under water coolant. The split roots were placed in glutaraldehyde for 48 hours and then samples were dehydrated using the serial ethanol dehydration technique. Roots were mounted on an SEM tab with carbon conductive tape and sputter coated with a 60:40 gold/palladium target using a Sputter Coater (Microsystems, Illinois). Samples were imaged using SEM with a FEI™ Nova NanoSEM 230 (FEI Company, Oregon). Images were taken between 50X and 20,000X magnification. One exact visualization point was selected in each of the three regions of the root (coronal, middle, and apical) within the root canal lumen and isthmus area. When lateral canals were detected, they were explored regardless of their position for exploratory purposes.
3.4. Stereomicroscope Images
For each LAI protocol, the laser fiber tip was saved. Each fiber tip was examined with a stereomicroscope Nikon SMZ800N (Melville, NY, USA), and images were taken and processed (Imaging software NIS/Elements Version 4.13) under the same magnification 5X to document fiber tip condition after use.
3.5. Statistical Analysis
All analyses were performed using R statistical software (R Core Team 2022). To cite R in publications use: R Core Team (2022). R: A language and environment for statistical computing. R Foundation for Statistical Computing, Vienna, Austria. URL https://www.R-project.org/.
Statistical analysis was conducted using the one-way ANOVA to determine whether there were significant differences among groups.
4. Results
Bacteriological Samples
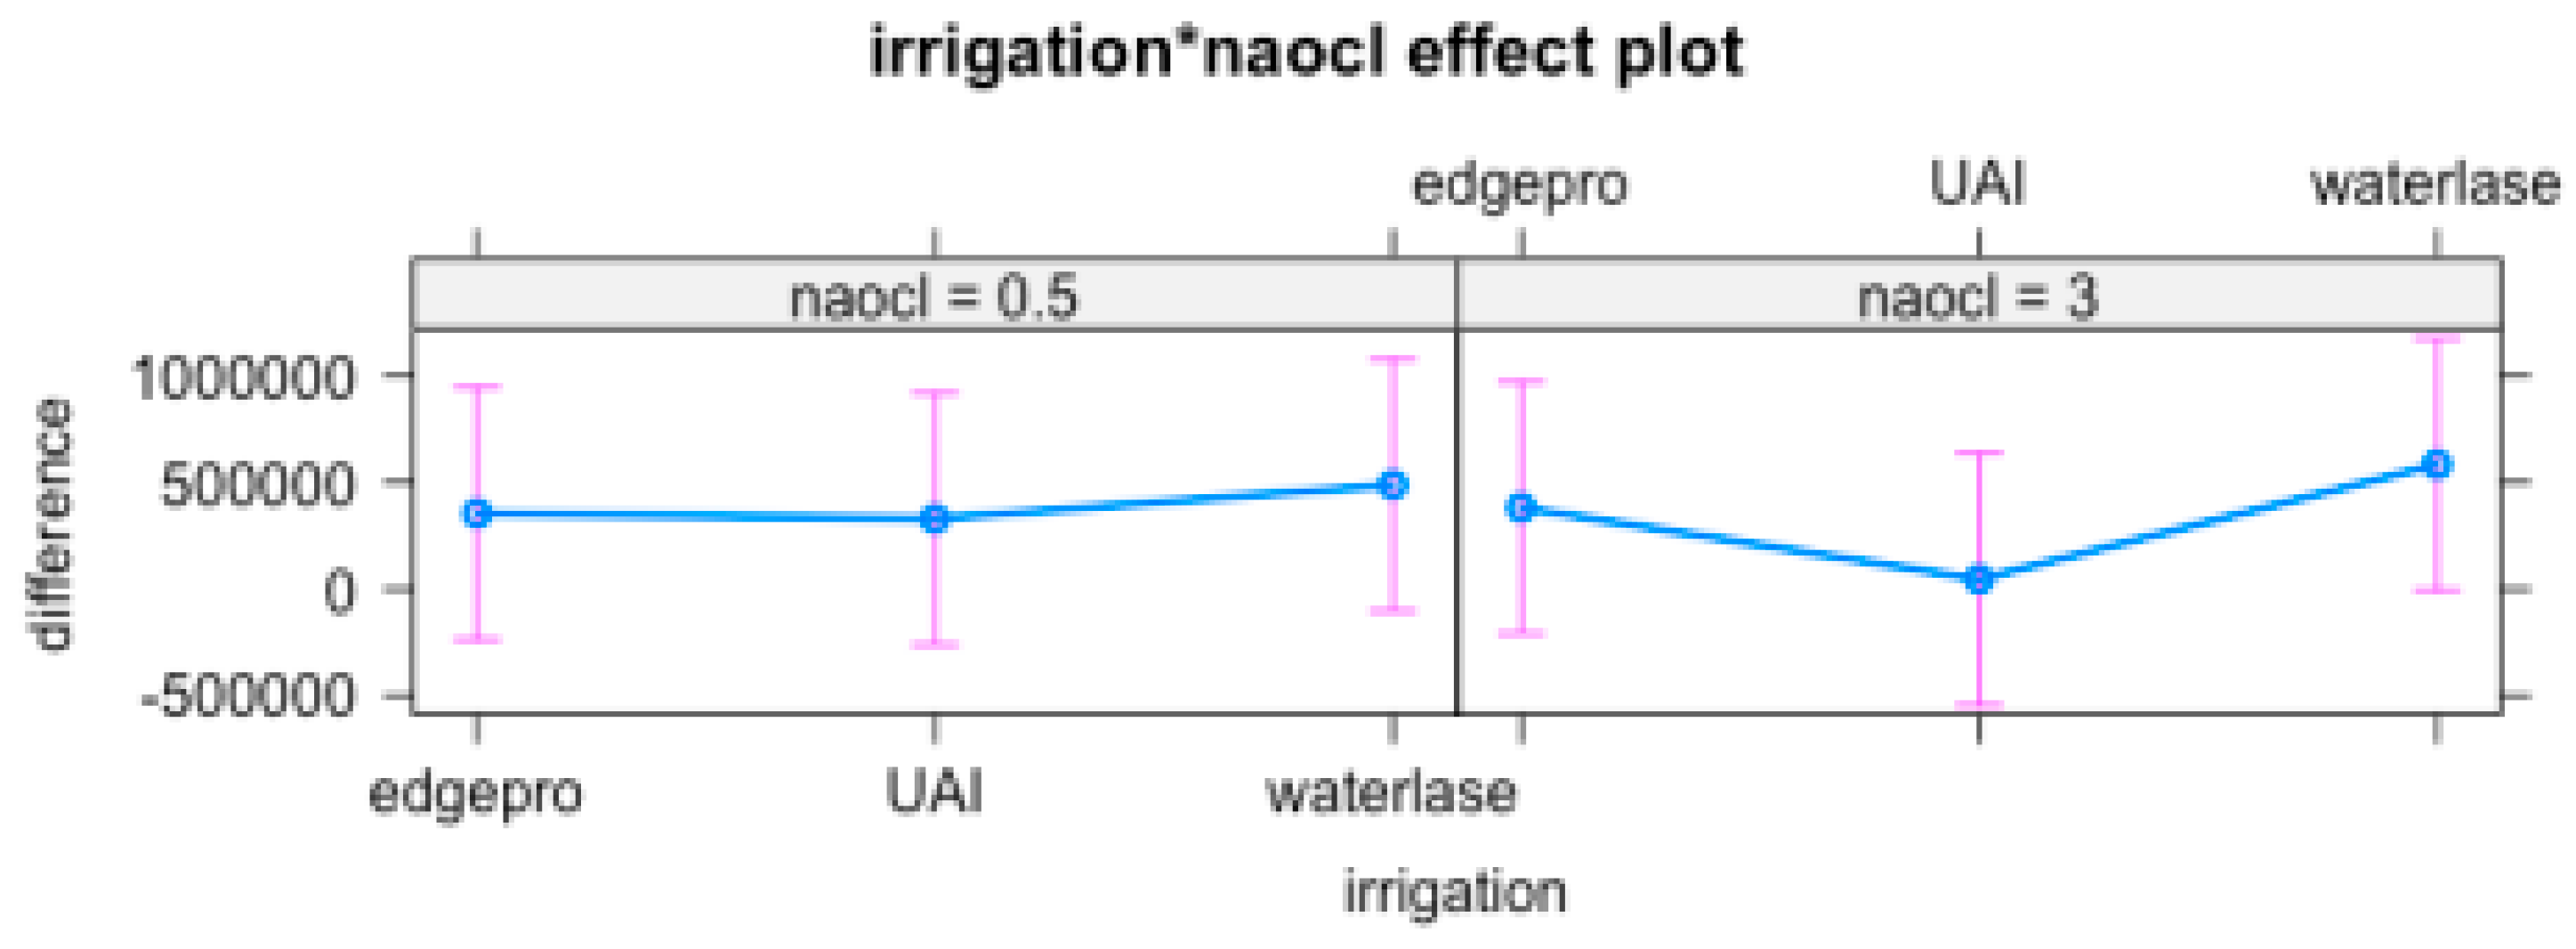
The difference before and after of the irrigation technique and NaOCl concentration, P value demonstrated there was no difference between either treatment performed.
Anova Table.
| LR Chi sq | Df | Pr (>Chi sq) | |
| Irrigation | 1.48497 | 2 | 0.4759 |
| NaOCl | 0.05221 | 1 | 0.8193 |
| Irrigation: NaOCl | 0.49962 | 2 | 0.7789 |
Mean variation among techniques and NaOCl concentration
| 0.5% | 3% | |
| EdgePro | 354212.0 | 381660.0 |
| UA | 328920.8 | 44959.4 |
| WaterLase | 487995.4 | 584121.4 |
Standard deviation among techniques and NaOCl concentration
| 0.5% | 3% | |
| EdgePro | 752692.3 | 741913.43 |
| UA | 500120.5 | 39708.67 |
| WaterLase | 598095.4 | 858527.02 |
Table show no effect among irrigation technique or NaOCl concentration
5. SEM Images
For 0.5% NaOCl + Laser # 1 samples, some debris and bacteria were observed in the mesial canals in the apical, middle, and coronal regions of all three teeth (Figure 2). In addition, tissue, bacteria, and well-organized biofilm were observed in the isthmus region of the mesial canals of all three teeth (Figure 3A-C). In sample #3, significant tissue and bacteria were observed in the middle region of the mesial canal (Figure 3D-F). In the distal canals, some debris and bacteria were observed (Figure 4). Areas of ablation were also observed in the pulp chamber of all three samples (Figure 5).
Figure 1.
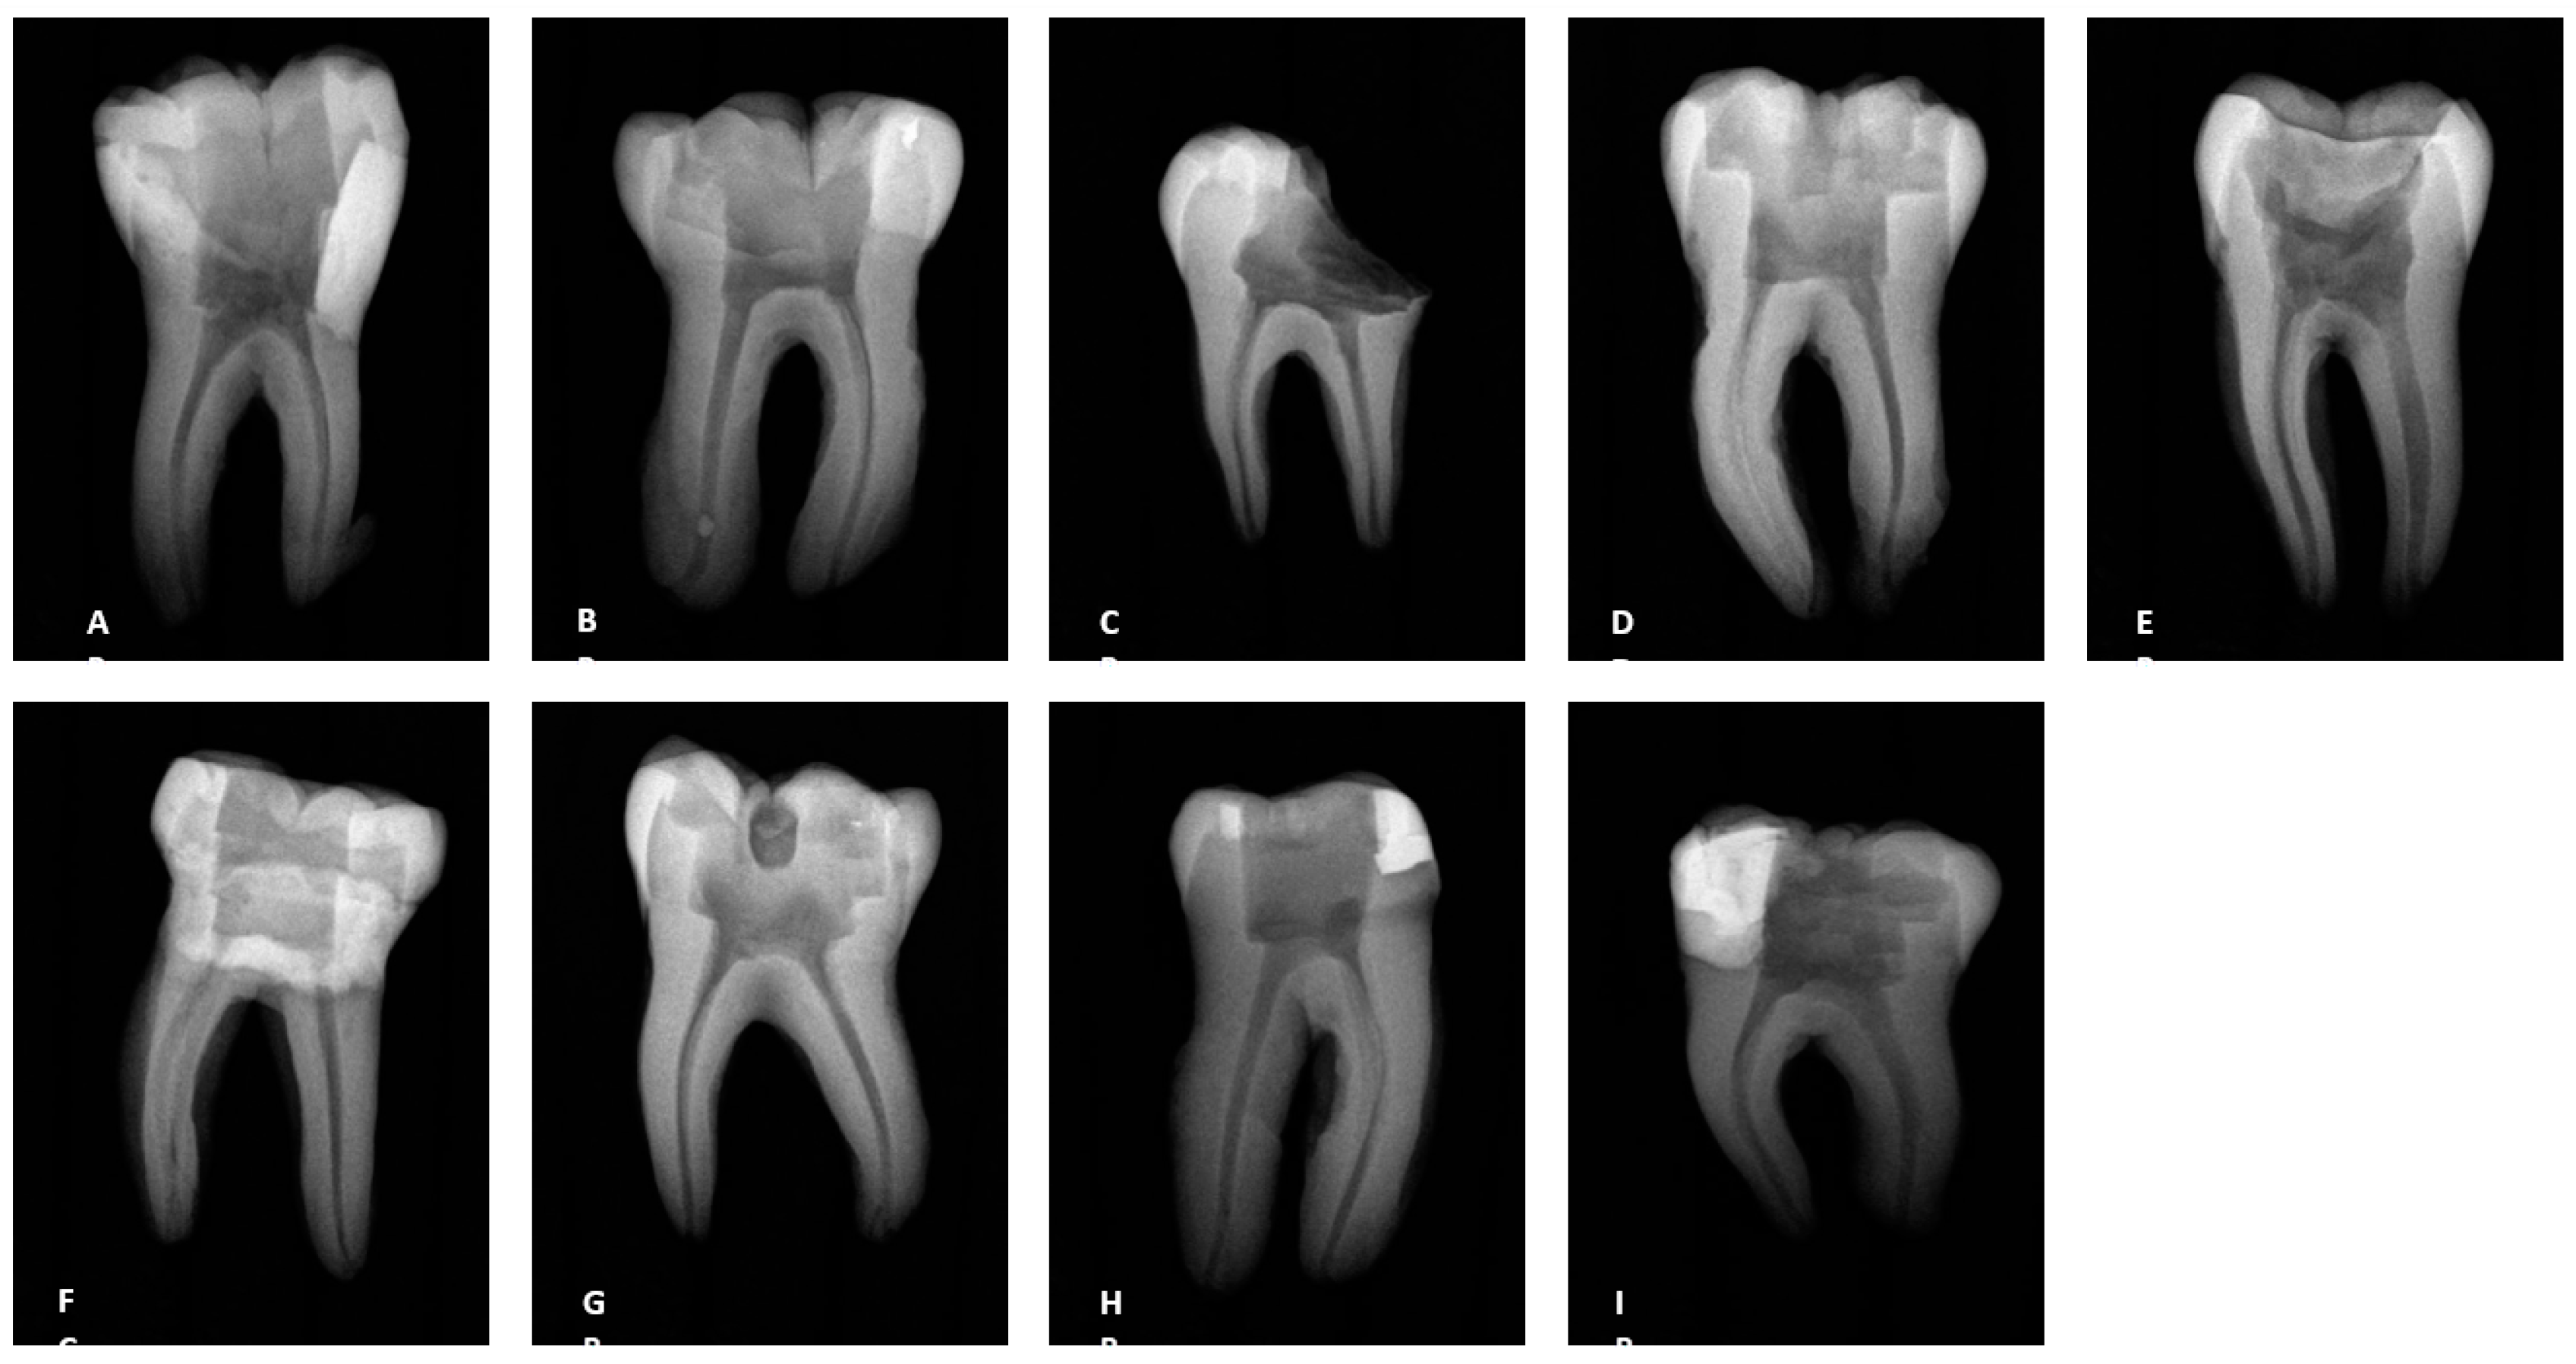
Radiographs of the teeth treated with three different irrigation protocols. A-C Laser #1 (NM). D-F Mid-root-Laser #2 (CA) and G-I UAI.
Figure 1.
Radiographs of the teeth treated with three different irrigation protocols. A-C Laser #1 (NM). D-F Mid-root-Laser #2 (CA) and G-I UAI.
For 3% NaOCl + 17% EDTA + Laser # 2 (CA) and UAI some debris and bacteria were observed in the apical, middle, and coronal regions of the mesial and distal canals (Figure 6 and Figure 7). Areas of ablation were observed in all regions of the canal (Figure 8). In some areas, there were no open dentinal tubules, and some dentinal tubules appeared to be melted together or occluded, indicating possible thermal damage. Additionally, tissue, debris, and bacteria were observed in isthmus areas and lateral canals in the apical, middle, and coronal regions of the mesial and distal canals (Figure 6, Figure 9 and Figure 10).
6. Stereomicroscope Images
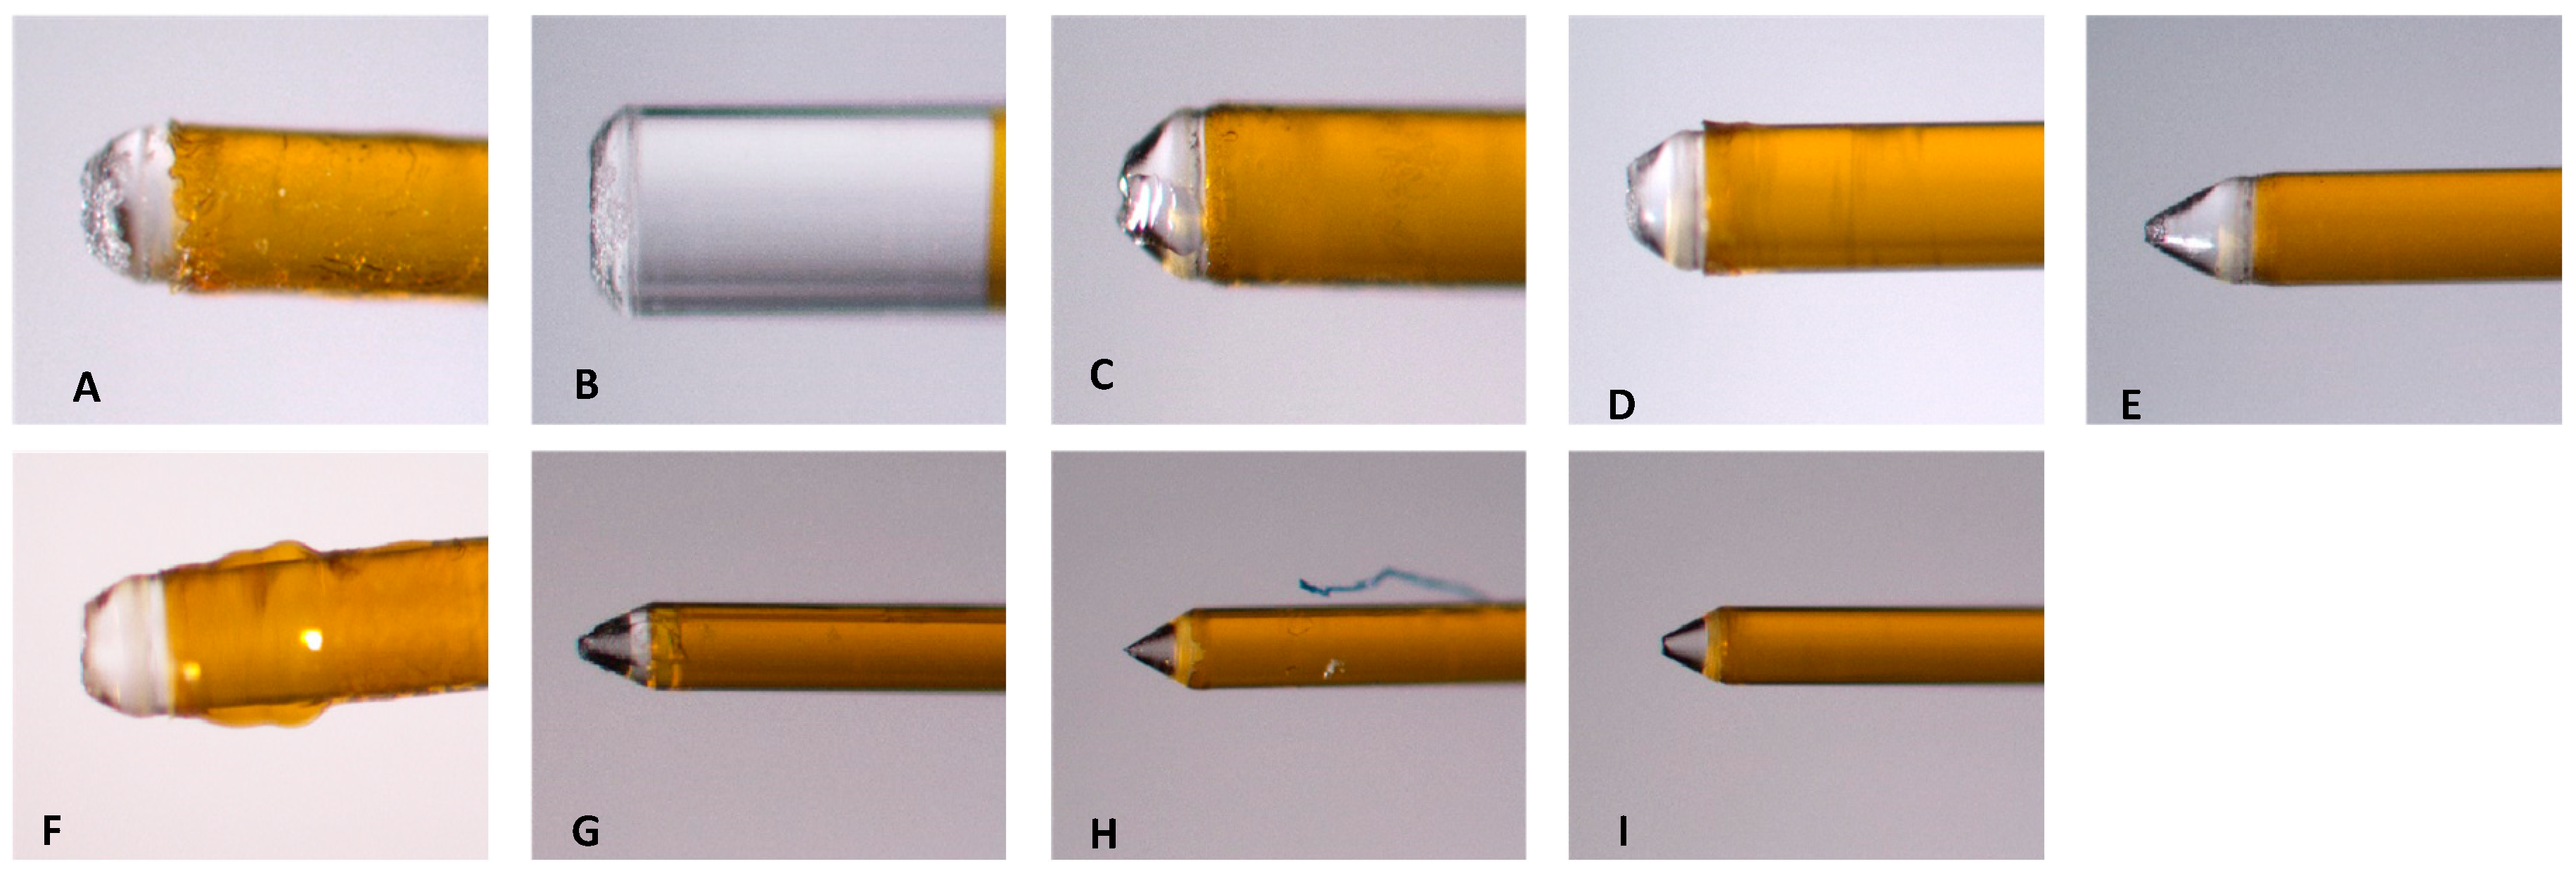
Prior to use, the fiber tips for Laser # 1 and Laser # 2 were inspected using the aiming beam per their respective manuals. Figure 11 shows an example of the shape of the aiming beam of a Laser # 1 fiber tip before and after use, a new RFT2 fiber tip for the Laser # 2, and a new Tip 2 for the Laser # 1. Before use, the fiber tip showed the halo expected for a new tip (Figure 11A). After use, the halo was no longer evident (Figure 11B). For 0.5% NaOCl + Laser # 1 samples, the fiber tips showed that the radial tip was degraded and became blunted (Figure 12A-C). For 3% NaOCl + 17% EDTA + Laser # 1, the fiber tips showed that the radial tip was degraded and become blunted (Figure 12D-F). For 3% NaOCl + 17% EDTA + Laser # 2, the fiber tips showed minimal damage to the radial tip (Figure 12G-I).
7. Discussion
With the introduction of the Laser # 1, there is renewed interest in the performance of Er;Cr:YSGG lasers for root canal treatments. The disinfecting abilities of two laser-activated irrigation (LAI) protocols that use the Er;Cr:YSGG laser were evaluated and compared to UAI by treating teeth inoculated with E. faecalis which is frequently detected in root canal infections, and evaluating the teeth for the presence of bacteria, biofilm, tissue, debris, and smear layer.
Use of the “Laser # 1 Radial Apical Cleansing Protocol” for cleansing and disinfection of root canal systems has been proposed [16] and it is reported to effectively remove bacteria and biofilm from the canals, complex areas, and dentinal tubules. The same report claims that the protocol is safe and minimizes the chance of extrusion because the recommended concentration of NaOCl is low (0.5% NaOCl) and the fiber tip is in the chamber. This study used the laser disinfection step (0.5% NaOCl + Laser # 1) from the above-recommended protocol to treat five mandibular first molars. Using SEM, the teeth were evaluated for the presence of bacteria, biofilm, tissue, debris, and smear layer. In general, some debris and bacteria were observed throughout the canals, particularly in the apical region of the canals (Figure 3 and Figure 5). Although the protocol is designed to clean and disinfect isthmus areas, we observed tissue, bacteria, and biofilm in the isthmus areas between the mesial canals for the five treated teeth. In addition, one tooth had an uninstrumented middle mesial canal in which we observed tissue, bacteria, and biofilm, even though the protocol should have cleaned and disinfected uninstrumented canals such as this one [16]. Furthermore, evidence of ablation was observed in the pulp chamber of each laser treated tooth, possibly due to the laser settings of 100 mJ/Pulse. Previous reports indicated dentine may be ablated or otherwise damaged if exposed to 20 mJ/pulse or higher [17,18].
In this study, the Solutions: Mid-root protocol from the Laser # 1 manual (denoted as 3% NaOCl + 17% EDTA + Laser # 1) was used to treat five mandibular first molars. Based on the Laser # 1 website, the recommended protocols “provide outstanding cleaning, debridement, disinfection by removing infected tissue, biofilm and smear layer, killing up to 99% of bacteria commonly found in the root canal” [19]. In general, some tissue remnants were observed in the mesial and distal canals, as well as areas of debris and bacteria. Tissue, debris, bacteria, and biofilm were observed in the isthmus areas and lateral canals, which are considered the more difficult areas to reach with irrigation systems. In addition, there were areas of ablation in the canals, including locations where the dentinal tubules appeared to look melted together. This possibly indicates that fluid needs to be maintained in the canals while activating the laser to help minimize the likelihood of thermal damage
Laser # 2 recommends RAPIDENDO - Radial Apical Irrigation & Disinfection protocol for use with the Laser # 2. According to the protocol, the smear layer and biofilm are removed, and the dentinal tubules are opened to facilitate deeper cleaning [20]. In general, this study observed debris and bacteria in the apical, middle, and coronal regions of the mesial and distal canals. In some cases, tissue was also observed in the apical region of the canals. Tissue, debris, bacteria, and biofilm were observed in the hard-to-reach areas, such as isthmus areas and uninstrumented lateral canals in all five treated teeth. Furthermore, bacteria were observed in all regions of one distal canal that was very wide. This may indicate that further study is warranted to demonstrate that the laser action is effective in very wide canals. In addition, there were areas where no open dentinal tubules were observed which possibly indicates that the smear layer was not removed.
Ultrasonic activated irrigation (UAI) refers to a technique used in the irrigation of the root canal system, utilizing ultrasonic energy that is employed to enhance irrigation process. The technique [13,14] has gained widespread acceptance and is now commonly regarded as the standard of care in endodontics. Our findings align with previous documented scientific literature.
Before all experiments with LAI, the condition of the tip was evaluated using the system’s aiming beam per the manufacturer’s recommendations. Even though many laser users believe that the fiber tips are reusable [21], the aiming beam test performed per the manufacturer’s manual and the images of the tips (Figure 13) after using them to treat a single mandibular first molar indicated that the tip was broken and was no longer performing optimally after one use.
All these SEM observations are supported by the bacteriological results from sampling the canals.
SEM allows for high-resolution imaging of the surface of samples, providing detailed information about the morphology, structure, and spatial distribution of microorganisms. Using SEM, it is possible to observe the physical characteristics of microbial colonies and tissue remnants. On the other hand, bacteriological results from sampling the canals involve the collection and analysis of microbial samples from the canal system.
By combining SEM observations with bacteriological results, it can be correlate the visual characteristics and presence of microorganisms
8. Conclusions
In the present in-vitro study, laser-activated irrigation using Er,Cr:YSGG technology and UAI were inefficient in eliminating Enterococcus faecalis from infected root canals and tissue, debris, bacteria (dentinal tubules) and biofilm were observed in isthmus areas, lateral canals, and uninstrumented positions of teeth after treatment using the manufacturer recommended protocols. Additional studies are planned to confirm these results.
References
- Meire, M.A.; De Prijck, K.; Coenye, T.; Nelis, H.J.; De Moor, R.J.G. Effectiveness of different laser systems to kill Enterococcus faecalis in aqueous suspension and in an infected tooth model. Int. Endod. J. 2009, 42, 351–359. [Google Scholar] [CrossRef]
- de Paz, L.E.C.; Bergenholtz, G.; Svensäter, G. The Effects of Antimicrobials on Endodontic Biofilm Bacteria. J. Endod. 2010, 36, 70–77. [Google Scholar] [CrossRef] [PubMed]
- Noetzel, J.; Nonhoff, J.; Bitter, K.; Wagner, J.; Neumann, K.; Kielbassa, A.M. Efficacy of calcium hydroxide. Er: YAG laser or gaseous ozone against Enterococcus faecalis in root canals. Am. J. Dent. 2009, 22, 14–18. [Google Scholar] [PubMed]
- Dewsnup, N.; Pileggi, R.; Haddix, J.; Nair, U.; Walker, C.; Varella, C.H. Comparison of Bacterial Reduction in Straight and Curved Canals Using Erbium, Chromium:Yttrium-Scandium-Gallium-Garnet Laser Treatment versus a Traditional Irrigation Technique With Sodium Hypochlorite. J. Endod. 2010, 36, 725–728. [Google Scholar] [CrossRef] [PubMed]
- Franzen, R.; Gutknecht, N.; Falken, S.; Heussen, N.; Meister, J. Bactericidal effect of a Nd:YAG laser on Enterococcus faecalis at pulse durations of 15 and 25 ms in dentine depths of 500 and 1,000 μm. Lasers Med. Sci. 2011, 26, 95–101. [Google Scholar] [CrossRef]
- Mohammadi, Z. Chemo mechanical strategies to manage endodontic infections. Dent. Today 2010, 29, 91-2, 94, 96 passim; quiz 99. [Google Scholar]
- Upadya, M.H.; Kishen, A. Influence of bacterial growth modes on the susceptibility to light-activated disinfection. Int. Endod. J. 2010, 43, 978–987. [Google Scholar] [CrossRef] [PubMed]
- Kayaoglu, G.; Orstavik, D. Virulence factors of Enterococcus faecalis: Relationship to endodontic disease. Crit. Rev. Oral. Biol. Med. 2004, 15, 308–320. [Google Scholar] [CrossRef]
- Stuart, C.H.; Schwartz, S.A.; Beeson, T.J.; Owatz, C.B. Enterococcus faecalis: Its Role in Root Canal Treatment Failure and Current Concepts in Retreatment. J. Endod. 2006, 32, 93–98. [Google Scholar] [CrossRef]
- Stojicic, S.; Zivkovic, S.; Quan, W.; Zhang, H.; Haapasalo, M. Tissue dissolution by sodium hypochlorite: effect of concentration, temperature, agitation, and surfactant. J. Endod. 2010, 3, 1580–1583. [Google Scholar] [CrossRef] [PubMed]
- De Moor, R.J.; Meire, M.; Goharkhay, K.; Moritz, A.; Vanobbergen, J. Efficacy of Ultrasonic versus Laser-activated Irrigation to Remove Artificially Placed Dentin Debris Plugs. J. Endod. 2010, 36, 1580–1583. [Google Scholar] [CrossRef] [PubMed]
- Cunningham, W.T.; Martin, H.; Forrest, W.R. Evaluation of root canal débridement by the endosonic ultrasonic synergistic system. Oral Surgery Oral Med. Oral Pathol. 1982, 53, 401–404. [Google Scholar] [CrossRef] [PubMed]
- Martin, H. Ultrasonic disinfection of the root canal. Oral Surgery Oral Med. Oral Pathol. 1976, 42, 92–99. [Google Scholar] [CrossRef]
- Schneider, S.W. A comparison f canal preparations in stright and curve canals. Oral Surg. Oral Med. Oral Pathol. 1971, 32, 271–275. [Google Scholar] [CrossRef]
- Yavari, H.R.; Rahimi, S.; Shahi, S.; Lotfi, M.; Barhaghi, M.H.; Fatemi, A.; Abdolrahimi, M. Effect of Er, Cr: YSGG laser irradiation on Enterococcus faecalis in infected root canals. Photomed. Laser Surg. 2010, 591–596. [Google Scholar] [CrossRef] [PubMed]
- Kolnick, J. TTP AAE 22 lecture – “The EdgePRO Advantage – Enhanced Efficacy and Streamlined Workflow in Everyday Practice.
- Li, Z.; Code, J.E.; Van De Merwe, W.P. Er: YAG Laser ablation of enamel and dentin of human teeth: determination of the ablation rates at various fluences and pulse repetition rates. Lasers Surg. Med. 1992, 12, 625–630. [Google Scholar] [CrossRef] [PubMed]
- Majaron, B.; Lukac, M.; Sustercic, D.; et al. Threshold and efficiency analysis in Er: YAG laser ablation of hard dental tissue. Proc SPIE 1996, 2922, 233–242. [Google Scholar]
- Home. EdgePro. (2022, October 17). Available online: https://www.edgeproendo.com/ (accessed on 19 October 2022).
- Maupin C TTP AAE 22 lecture, “Safe, Effective, and Easy incorporation of Advanced Microfluidic Laser-assisted Irrigation Technology – The EdgePRO Difference.
Figure 2.
Sample SEM from all regions of the mesial canal treated with 0.5% NaOCl and Laser #1 (NM). Apical Region A) 80X magnification. B) 3000X magnification, debris was observed. C) 13000X magnification, debris and bacteria were observed. Middle region: D) 500X magnification and E) at 11000X magnification, debris and smear layer were observed. Coronal region: F) 400X magnification. G) 4500X magnification, debris and bacteria were observed. H) 7000X magnification, debris was observed. I) 7000X magnification, debris and bacteria were observed.
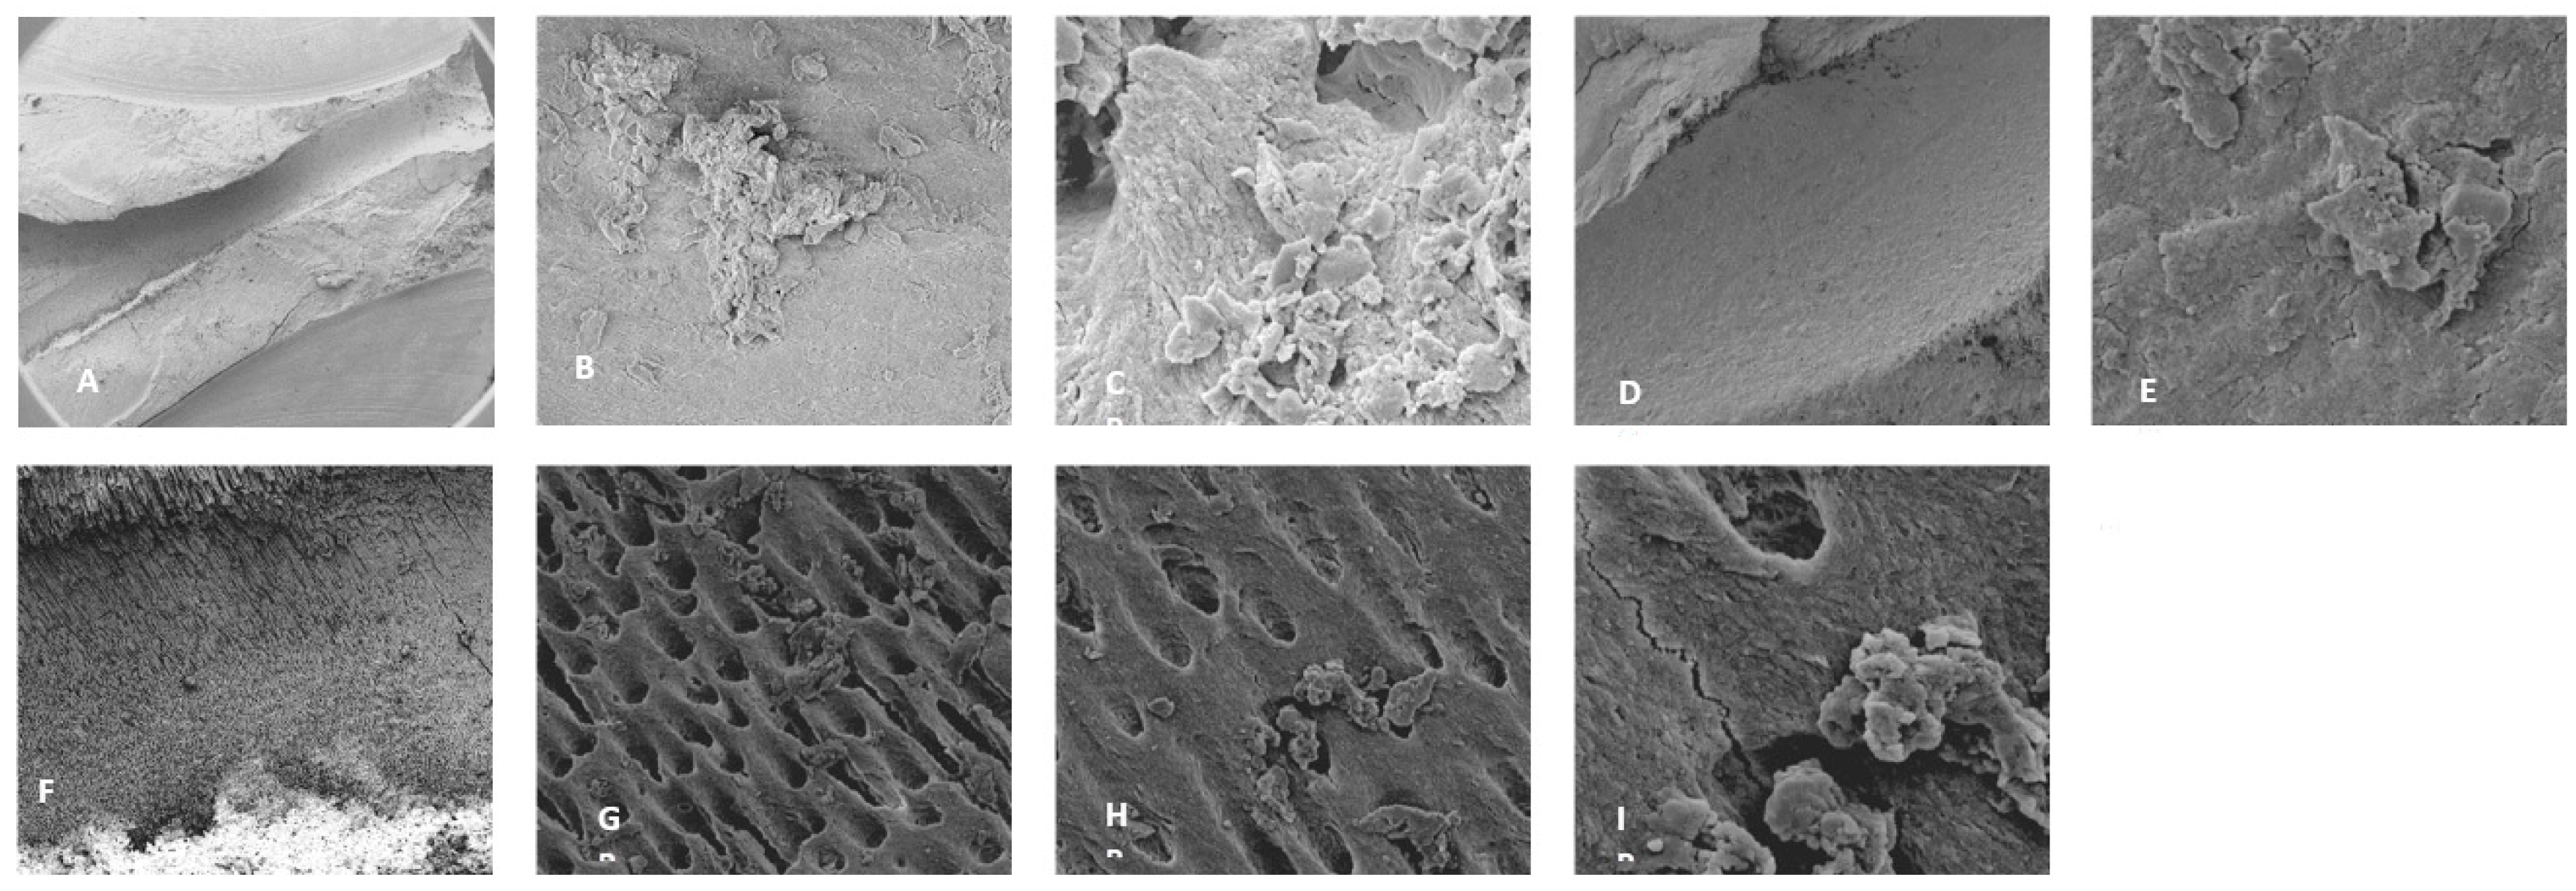
Figure 3.
Sample SEM images from complex areas of the mesial canals treated with 0.5% NaOCl and Laser # 1 (NM). A) 70X magnification of a mesial canal and isthmus. B) 300X magnification, pulp tissue, bacteria and biofilm observe. C) 14000X magnification, pulp tissue fibers, bacteria and biofilm were observed. D) 75X magnification, a middle mesial with tissue was observed in sample 3. E) 2000X magnification, pulp tissue, bacterial biofilm was observed. F) 2500X magnification, Tissue and bacteria were observed.
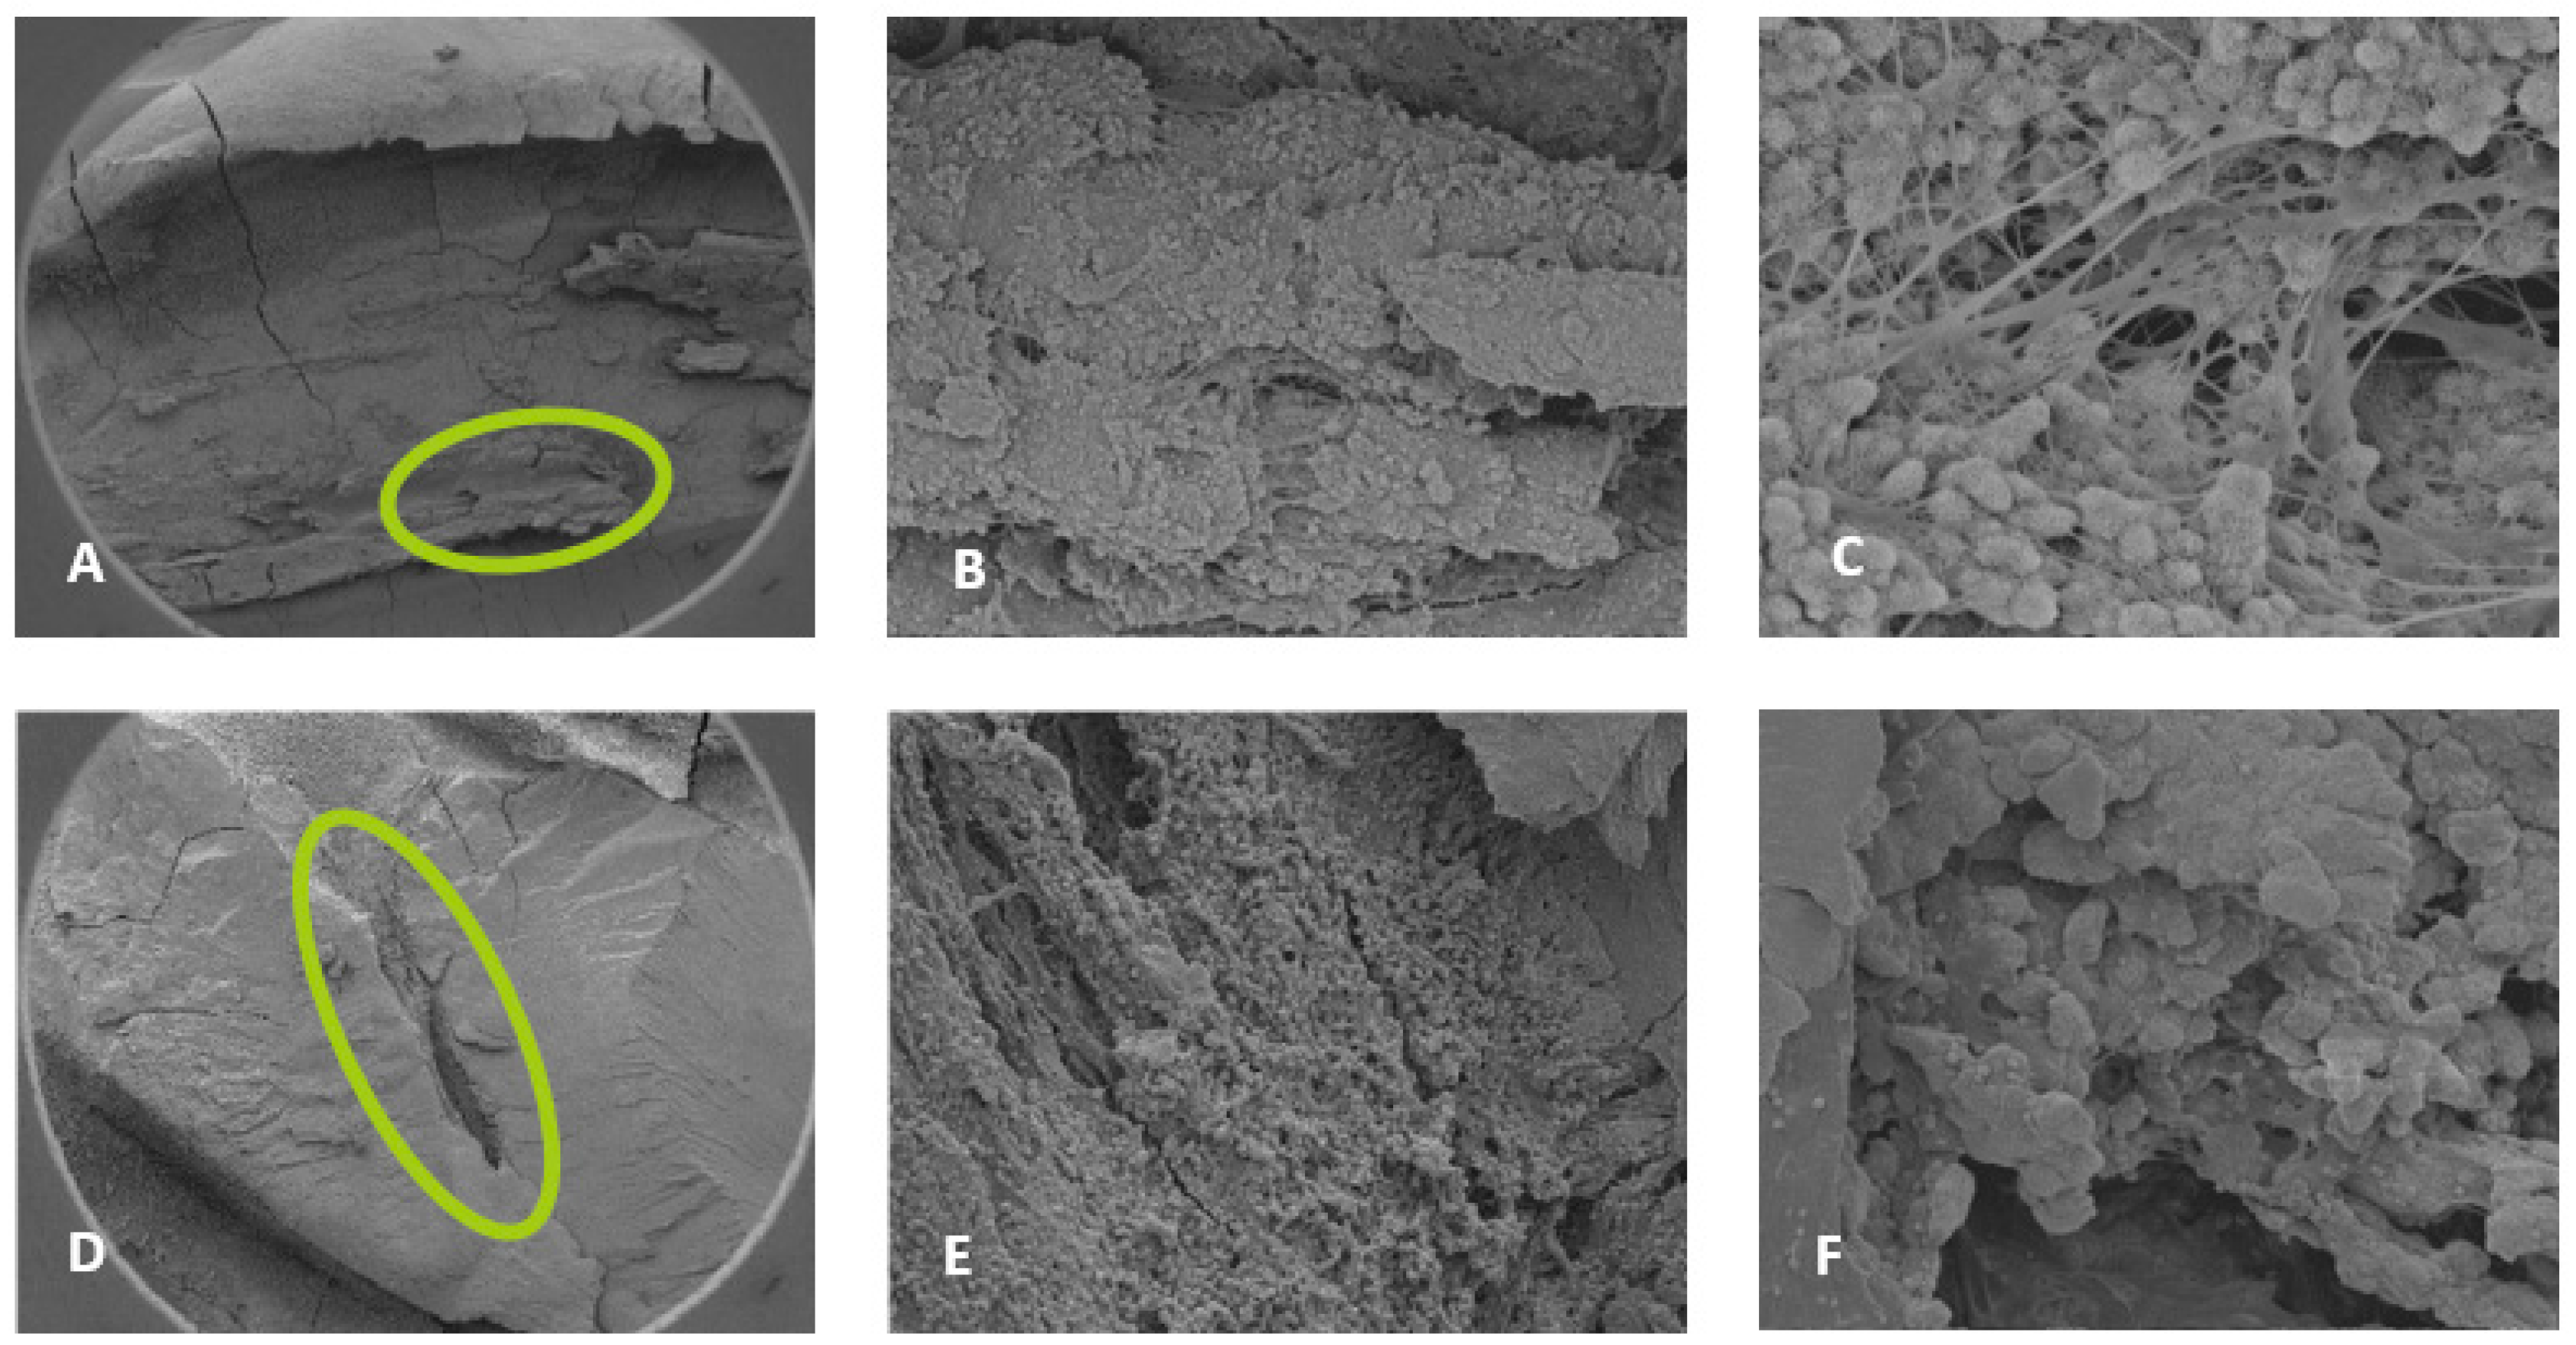
Figure 4.
Representative SEM images of distal canals. Apical regions A) 300X magnification, B) 3000X magnification, debris was observed, and C) 10000X magnification debris and bacteria was observed. Middle region: D) 70X magnification. E) 2000X magnification, debris was observed, F) 11000X magnification, debris was observed in the dentinal tubules. Coronal region: G) 70X magnification, ablation was observed. H) 9000X magnification, debris and damaged dentinal tubules were observed, and I) 12000X magnification, debris and damaged dentinal tubules were observed.
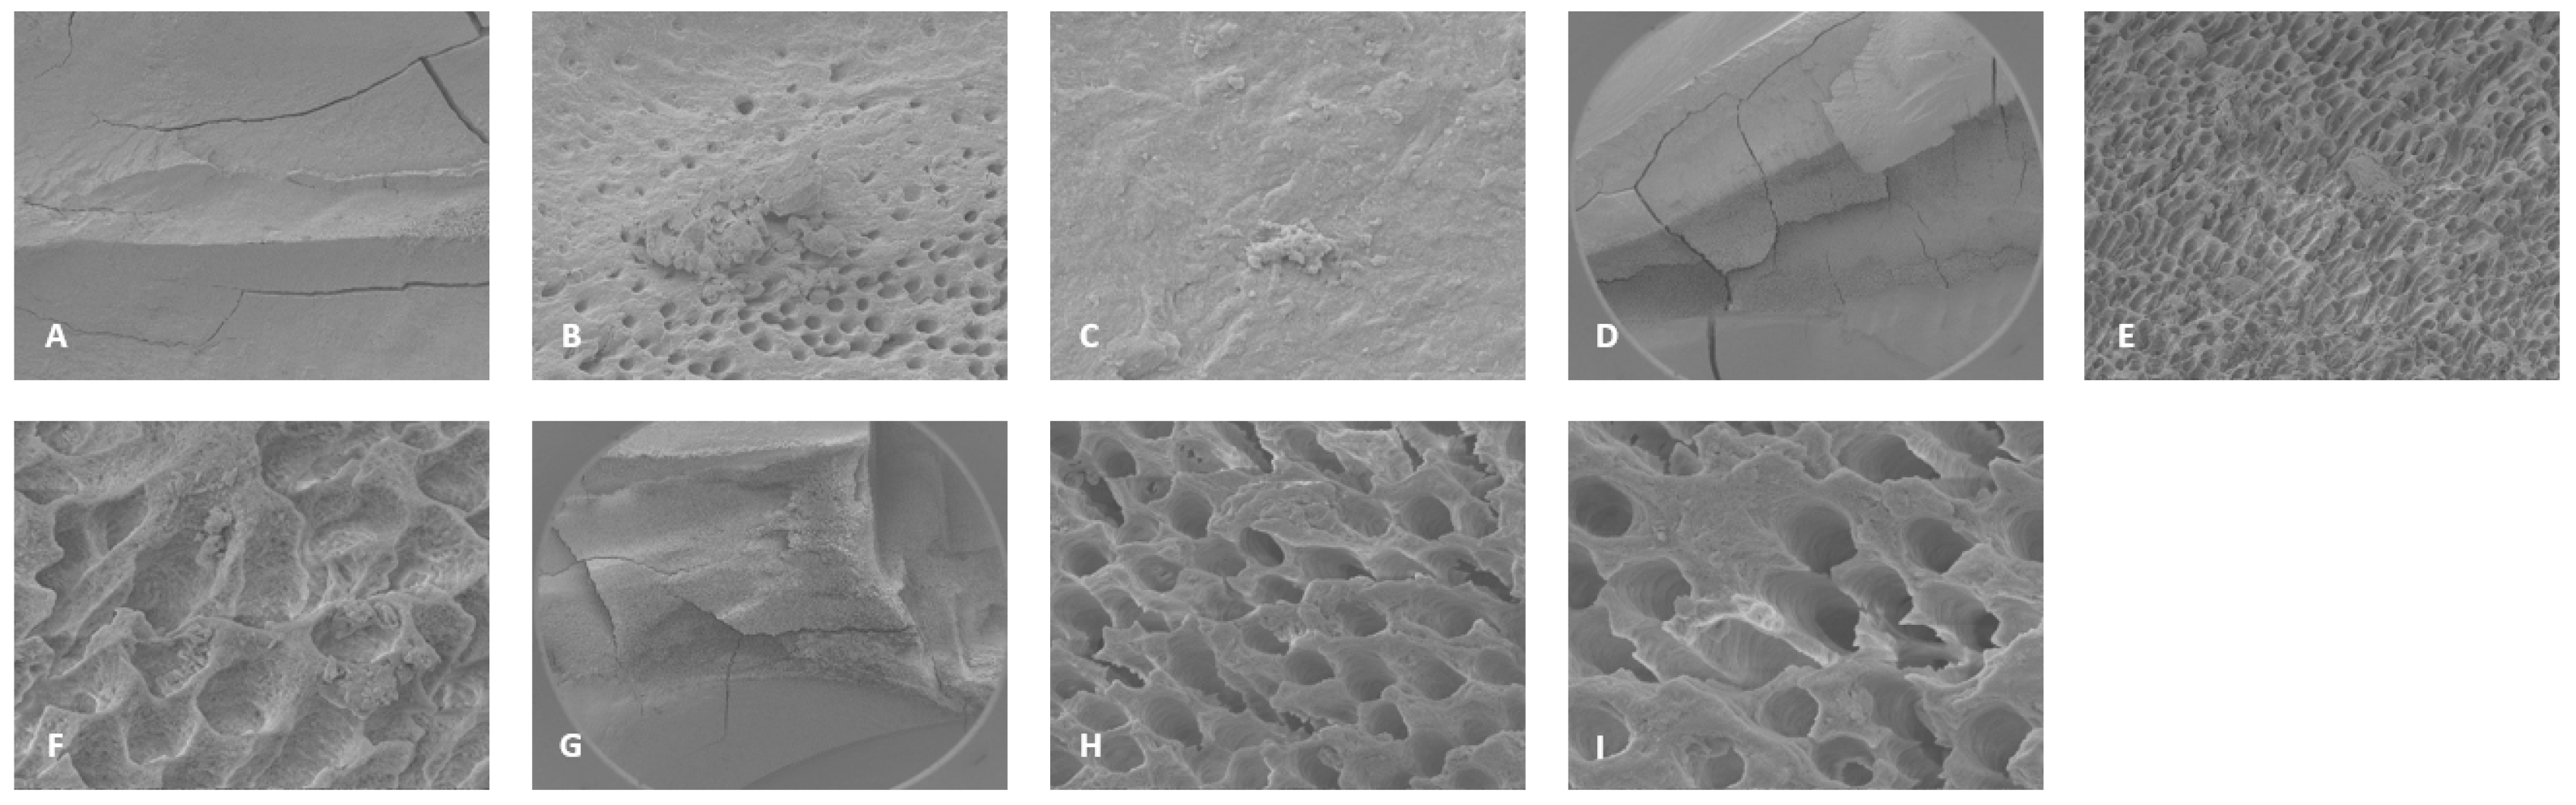
Figure 5.
Sample SEM images form the root canal and pulp chamber showing areas of ablation. A) Root canal 70X magnification, B) 500X magnification, C) pulp chamber 78X magnification and D) 600X magnification.
Figure 5.
Sample SEM images form the root canal and pulp chamber showing areas of ablation. A) Root canal 70X magnification, B) 500X magnification, C) pulp chamber 78X magnification and D) 600X magnification.
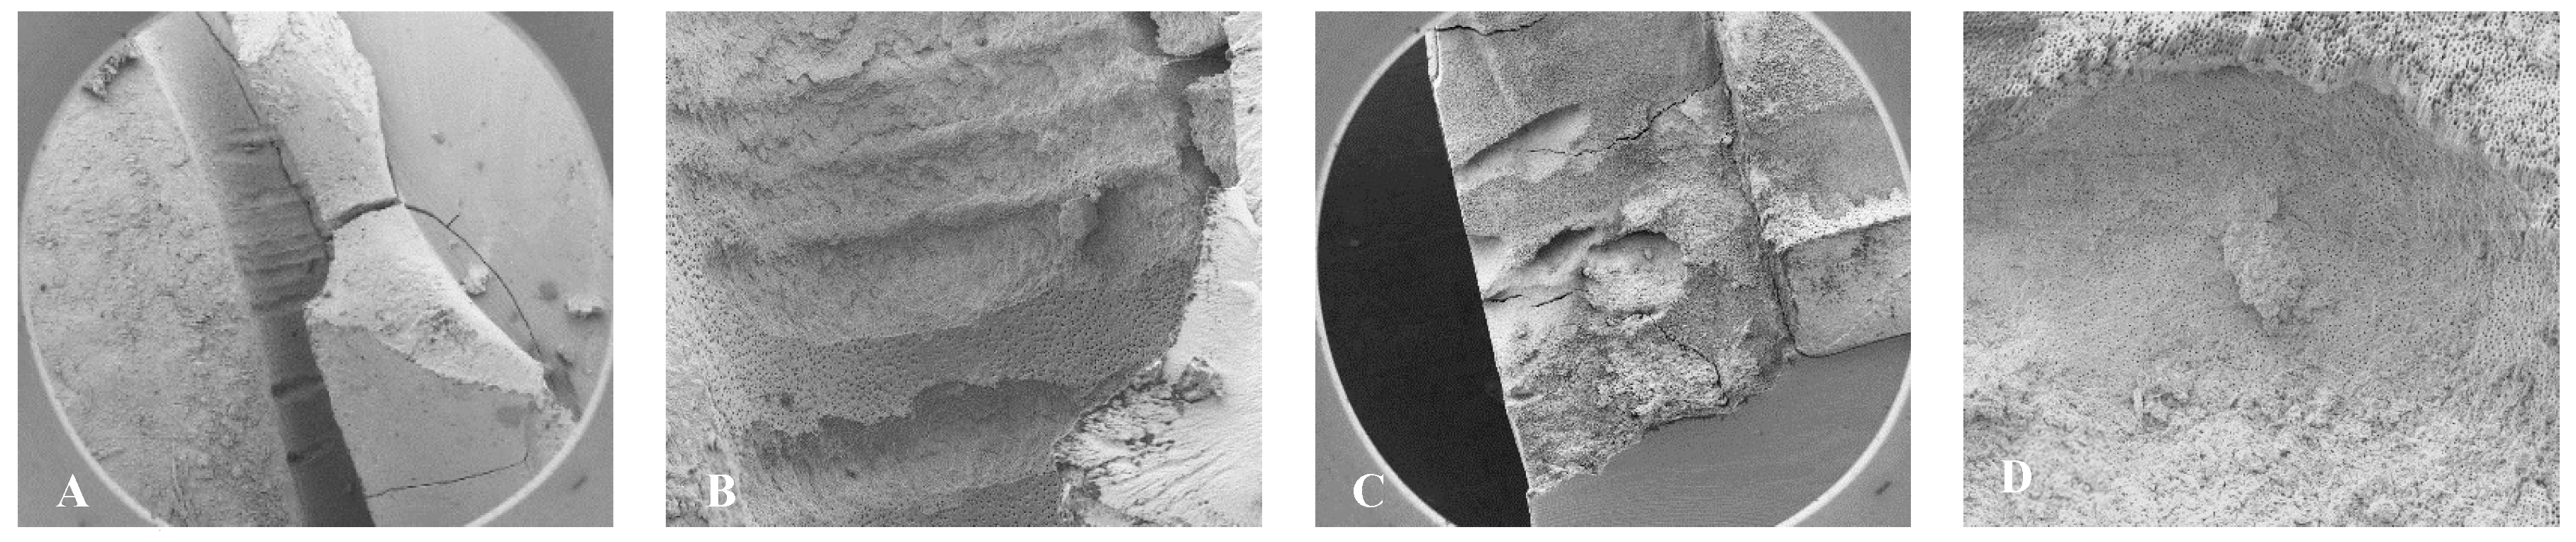
Figure 6.
Sample SEM images of mesial canals treated with 3% NaOCl + 17% EDTA + Laser #1. Apical region: A) 300X magnification, a lateral canal with tissue was observed. B) 3000X magnification, a few bacteria were observed. C) 13000X magnification, debris and bacteria were observed. Middle region: D) 70X magnification, E) 300X magnification, thermal damage was observed, F) 7000X magnification, debris and bacteria were observed. Coronal region: G) 70X magnification, H) 500X magnification, ablation was observed, I) 7000X magnification, debris, bacteria and absence of open dentinal tubules were observe.
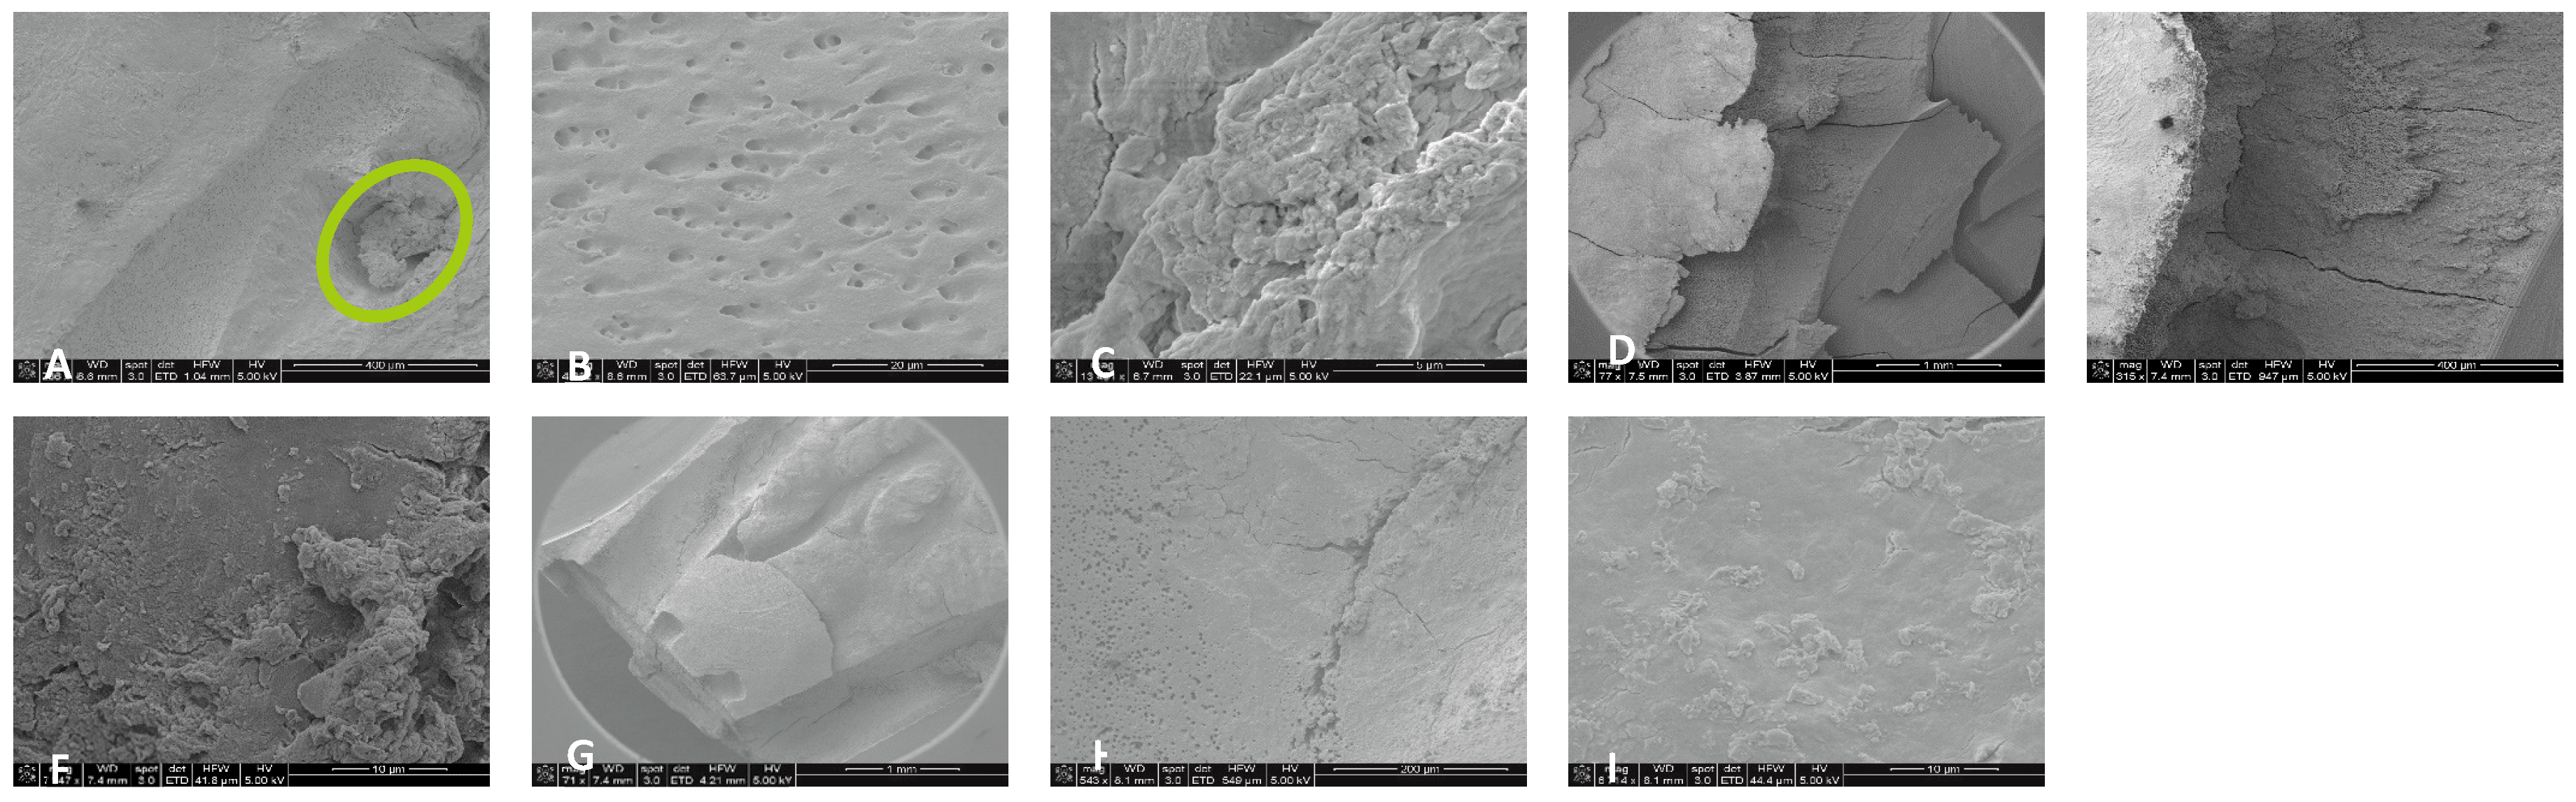
Figure 7.
Representative images of distal canals treated with 3% NaOCl + 17% EDTA + Laser #1. Apical region: A) 71X magnification. B) 1200X magnification, debris was observed in the lateral canal. C) 8000X magnification, debris and bacteria were observed. Middle region: D) 70X magnification, E) 300X magnification, thermal damage was observed, F) 6000X magnification, debris and bacteria were observed. Coronal region: G) 70X magnification, H) 1000X magnification, and I) 7000X magnification, thermal damage was observed. J) 6000X magnification, UAI, bacteria within dentinal tubules in UAI group.

Figure 8.
Representative images of isthmus areas and ablation areas for teeth treated with 3% NaOCl + 17% EDTA + Laser # 1. Apical region: A) 500X magnification, B) 8000X magnification, tissue debris, and bacteria were observed in the isthmus. Coronal region: C) 100X magnification, D) 3000X magnification, collagen fibers and bacteria were observed. Middle region: E) 70X magnification, areas of ablation were observed, and F) 1000XX magnification, some areas of dentinal tubules appeared to be melted together, indicating thermal damage due ablation.
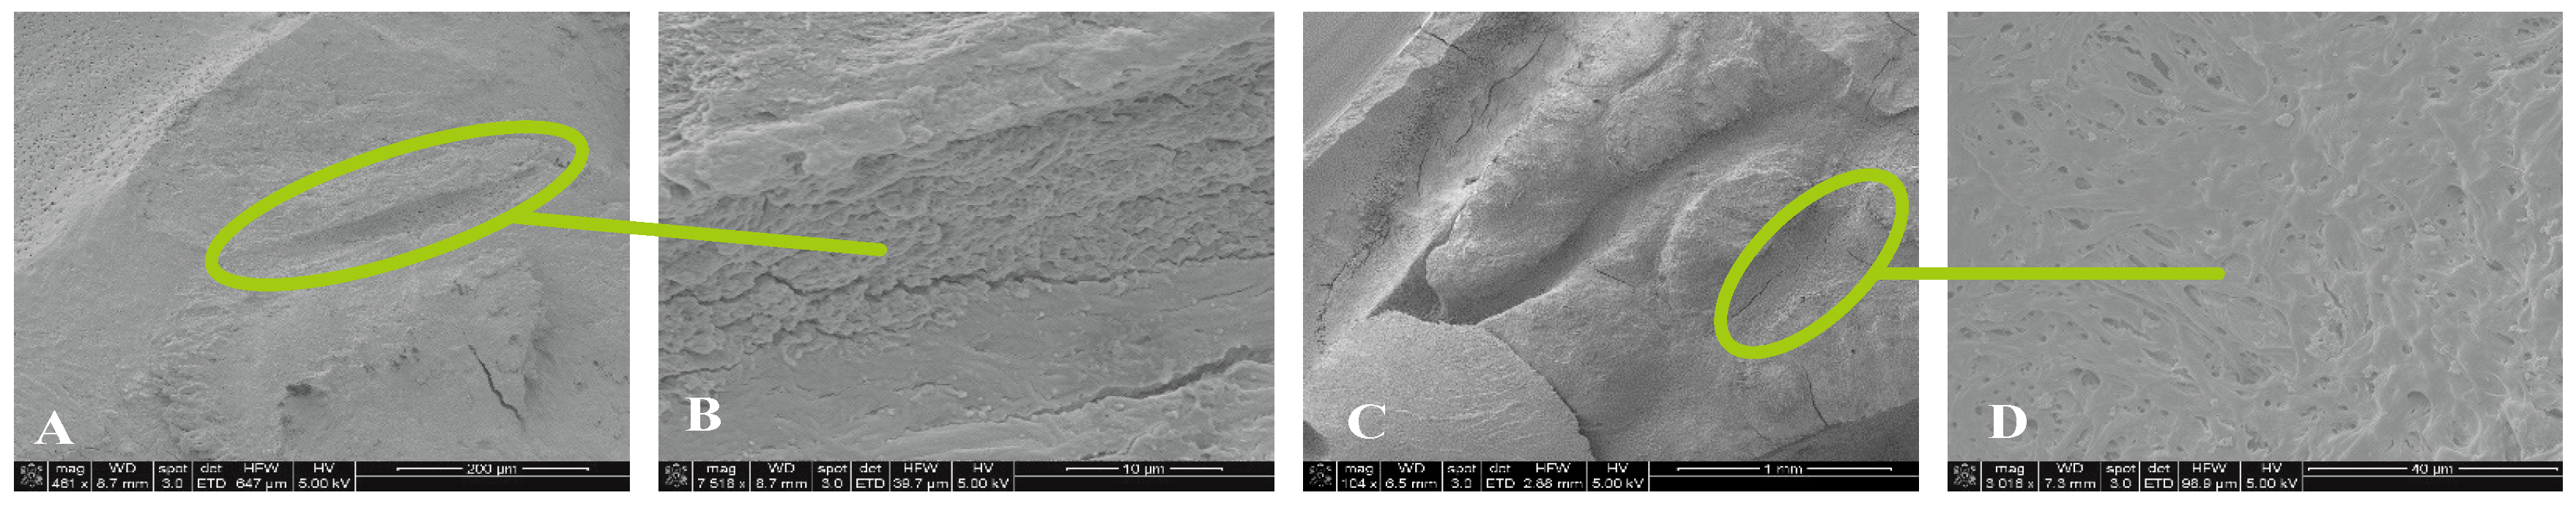
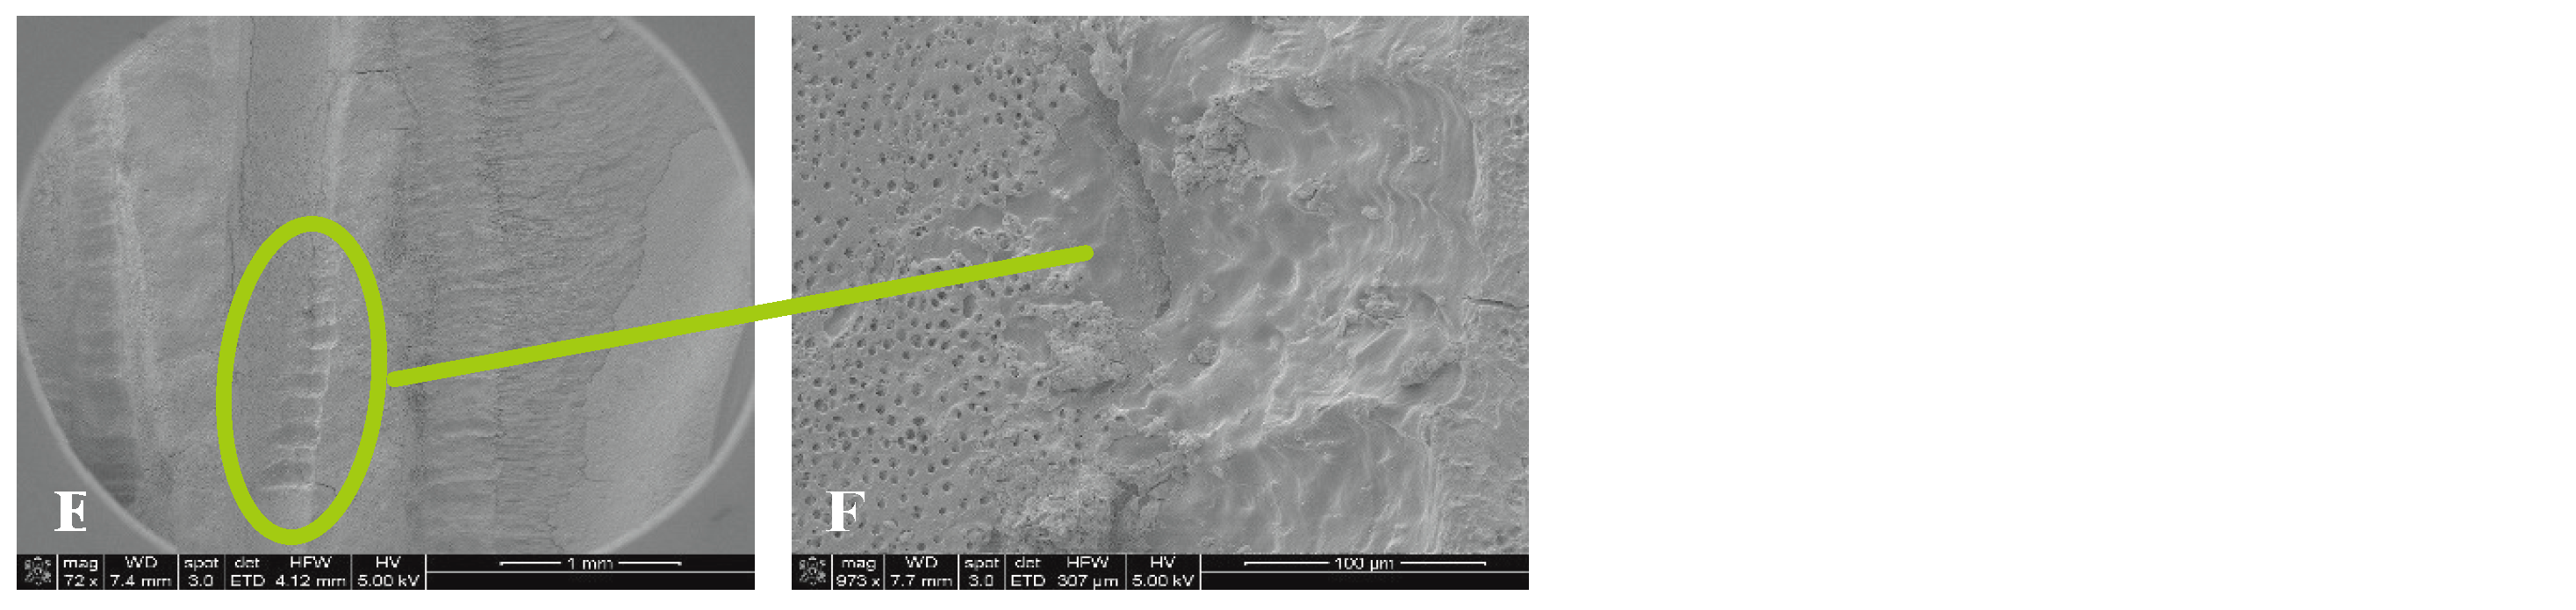
Figure 9.
Representative images of isthmus areas and lateral canals for teeth treated with 3% NaOCl + 17% EDTA + Laser #2. Apical region: A) 80X magnification, B) 5000X, there were areas without open dentinal tubules, C) 9000X, debris and few bacteria were observed (No dentinal tubules visible). Middle region: D) 70X magnification, E) 400X magnification, tissue was observed in the isthmus, F) 3000X magnification, debris and bacteria were observed, G) 70X magnification, H) 400X magnification, areas of ablation were observed, I) 3500X magnification, debris, bacteria and biofilm were observed. Coronal region: J) 90X magnification, K) 7500X magnification, tissue and bacteria were observed, L) 16000X magnification, tissue, bacteria and collagen -like structure were observed.
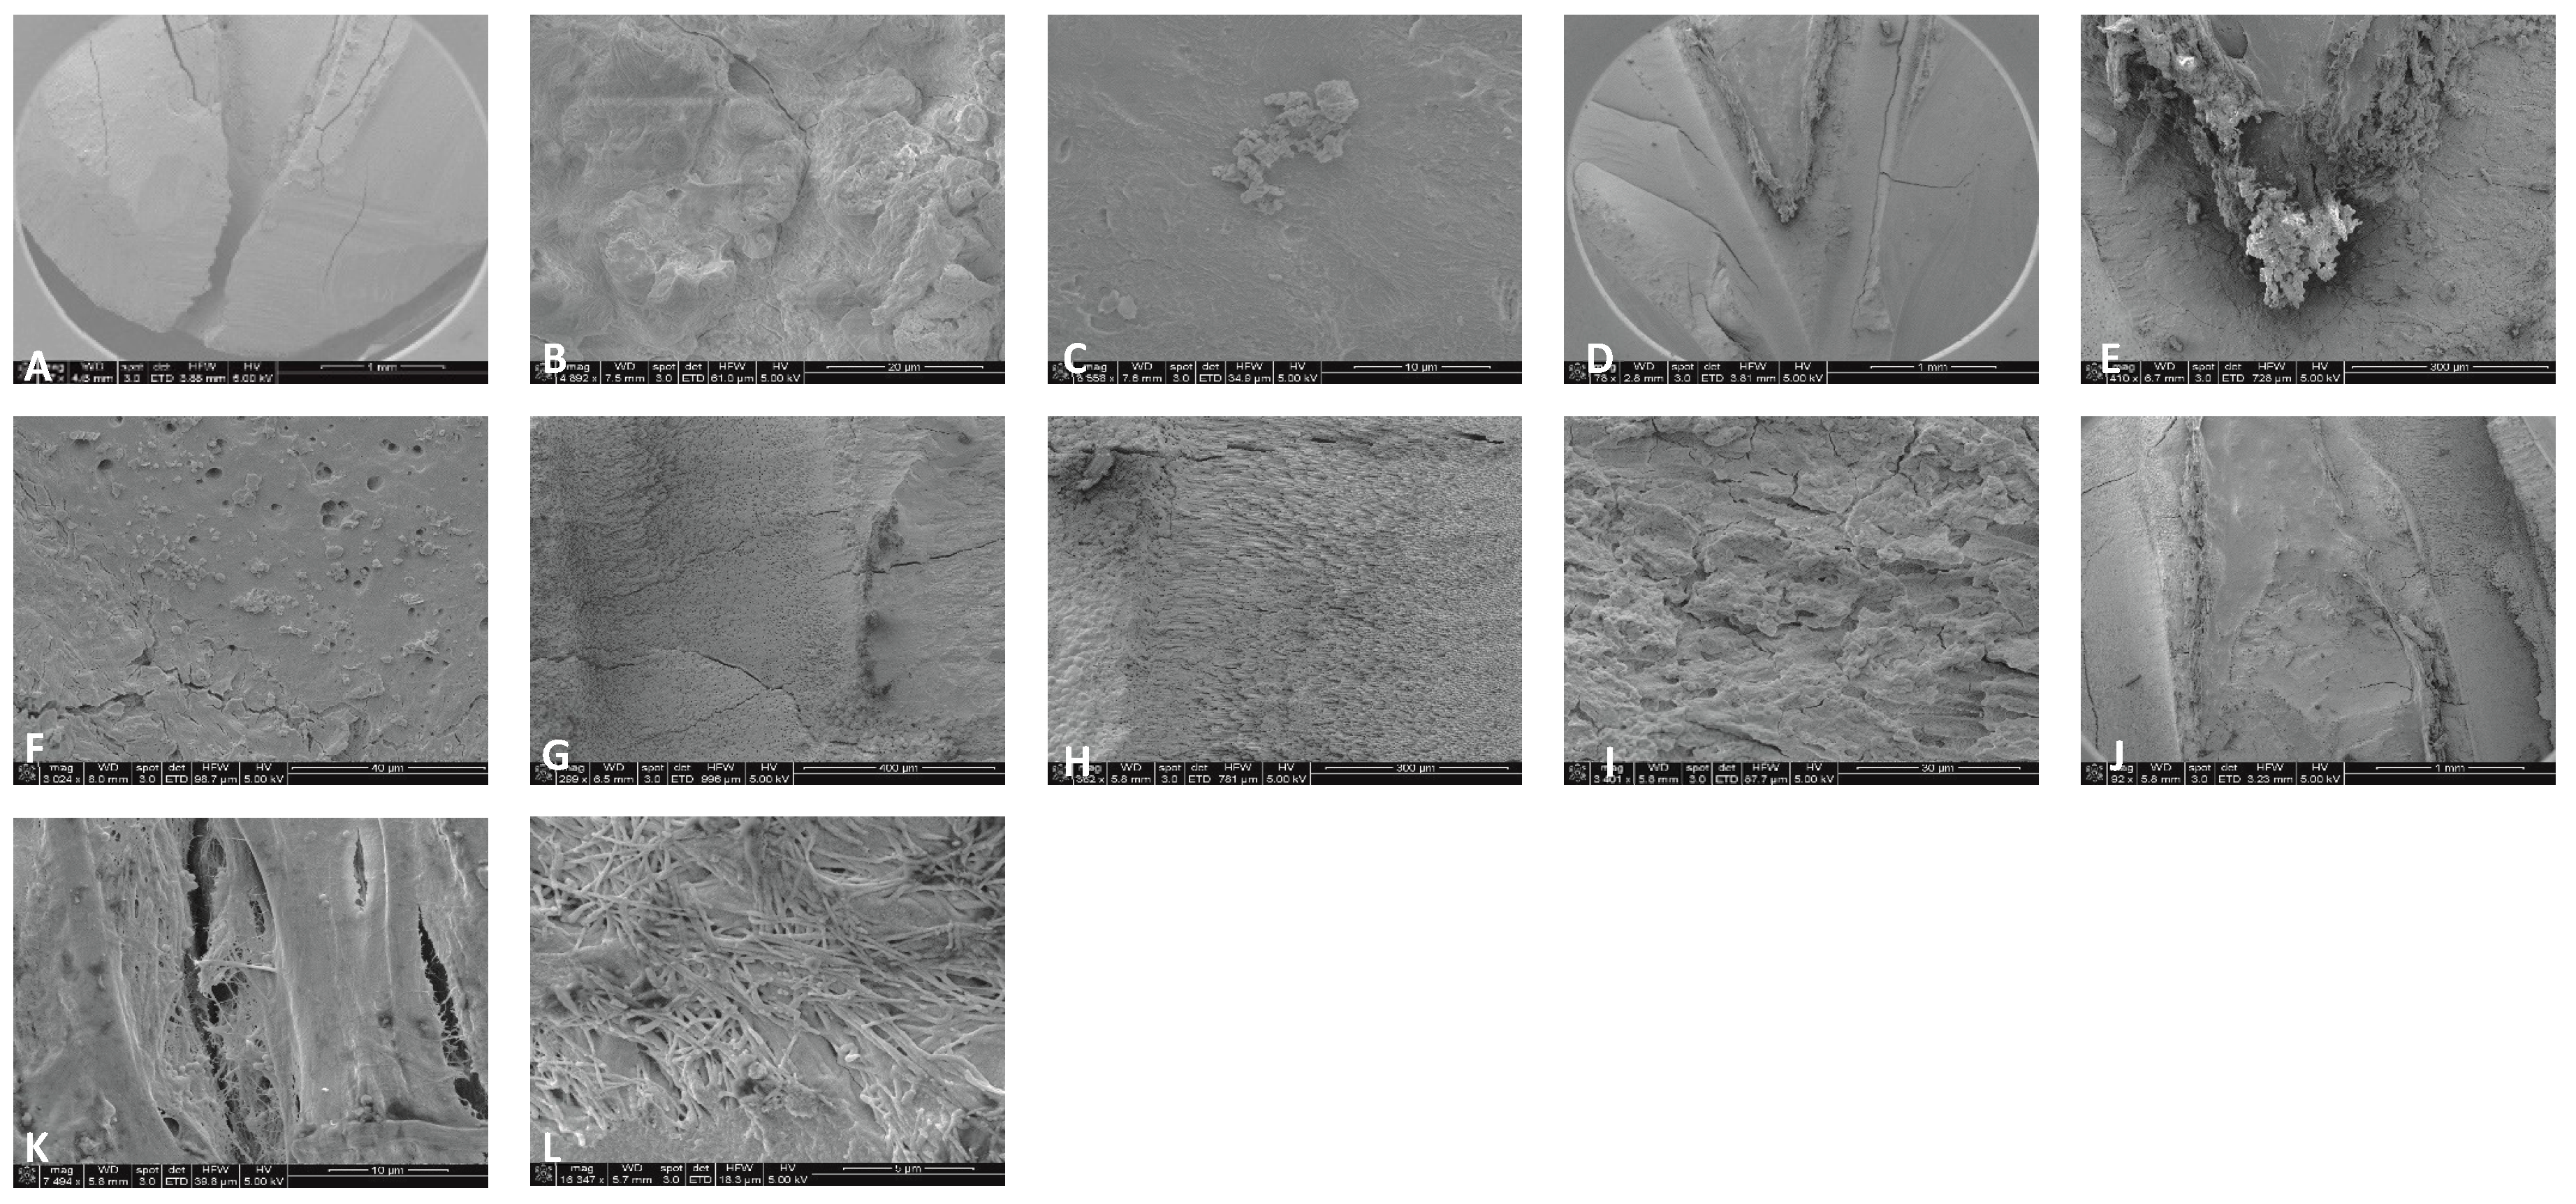
Figure 10.
Sample SEM images of a distal canal treated with Laser #2. A) 70X magnification of apical region showing tissue. B) 80X magnification of the middle region of the distal canal. C) 3500X magnification, biofilm and bacteria were observed. D) 7500X magnification, biofilm and bacteria were observed. E) 70X magnification of the coronal region of the distal canal showing areas of ablation. F) 3500X magnification, bacteria were observed in the predentin area.
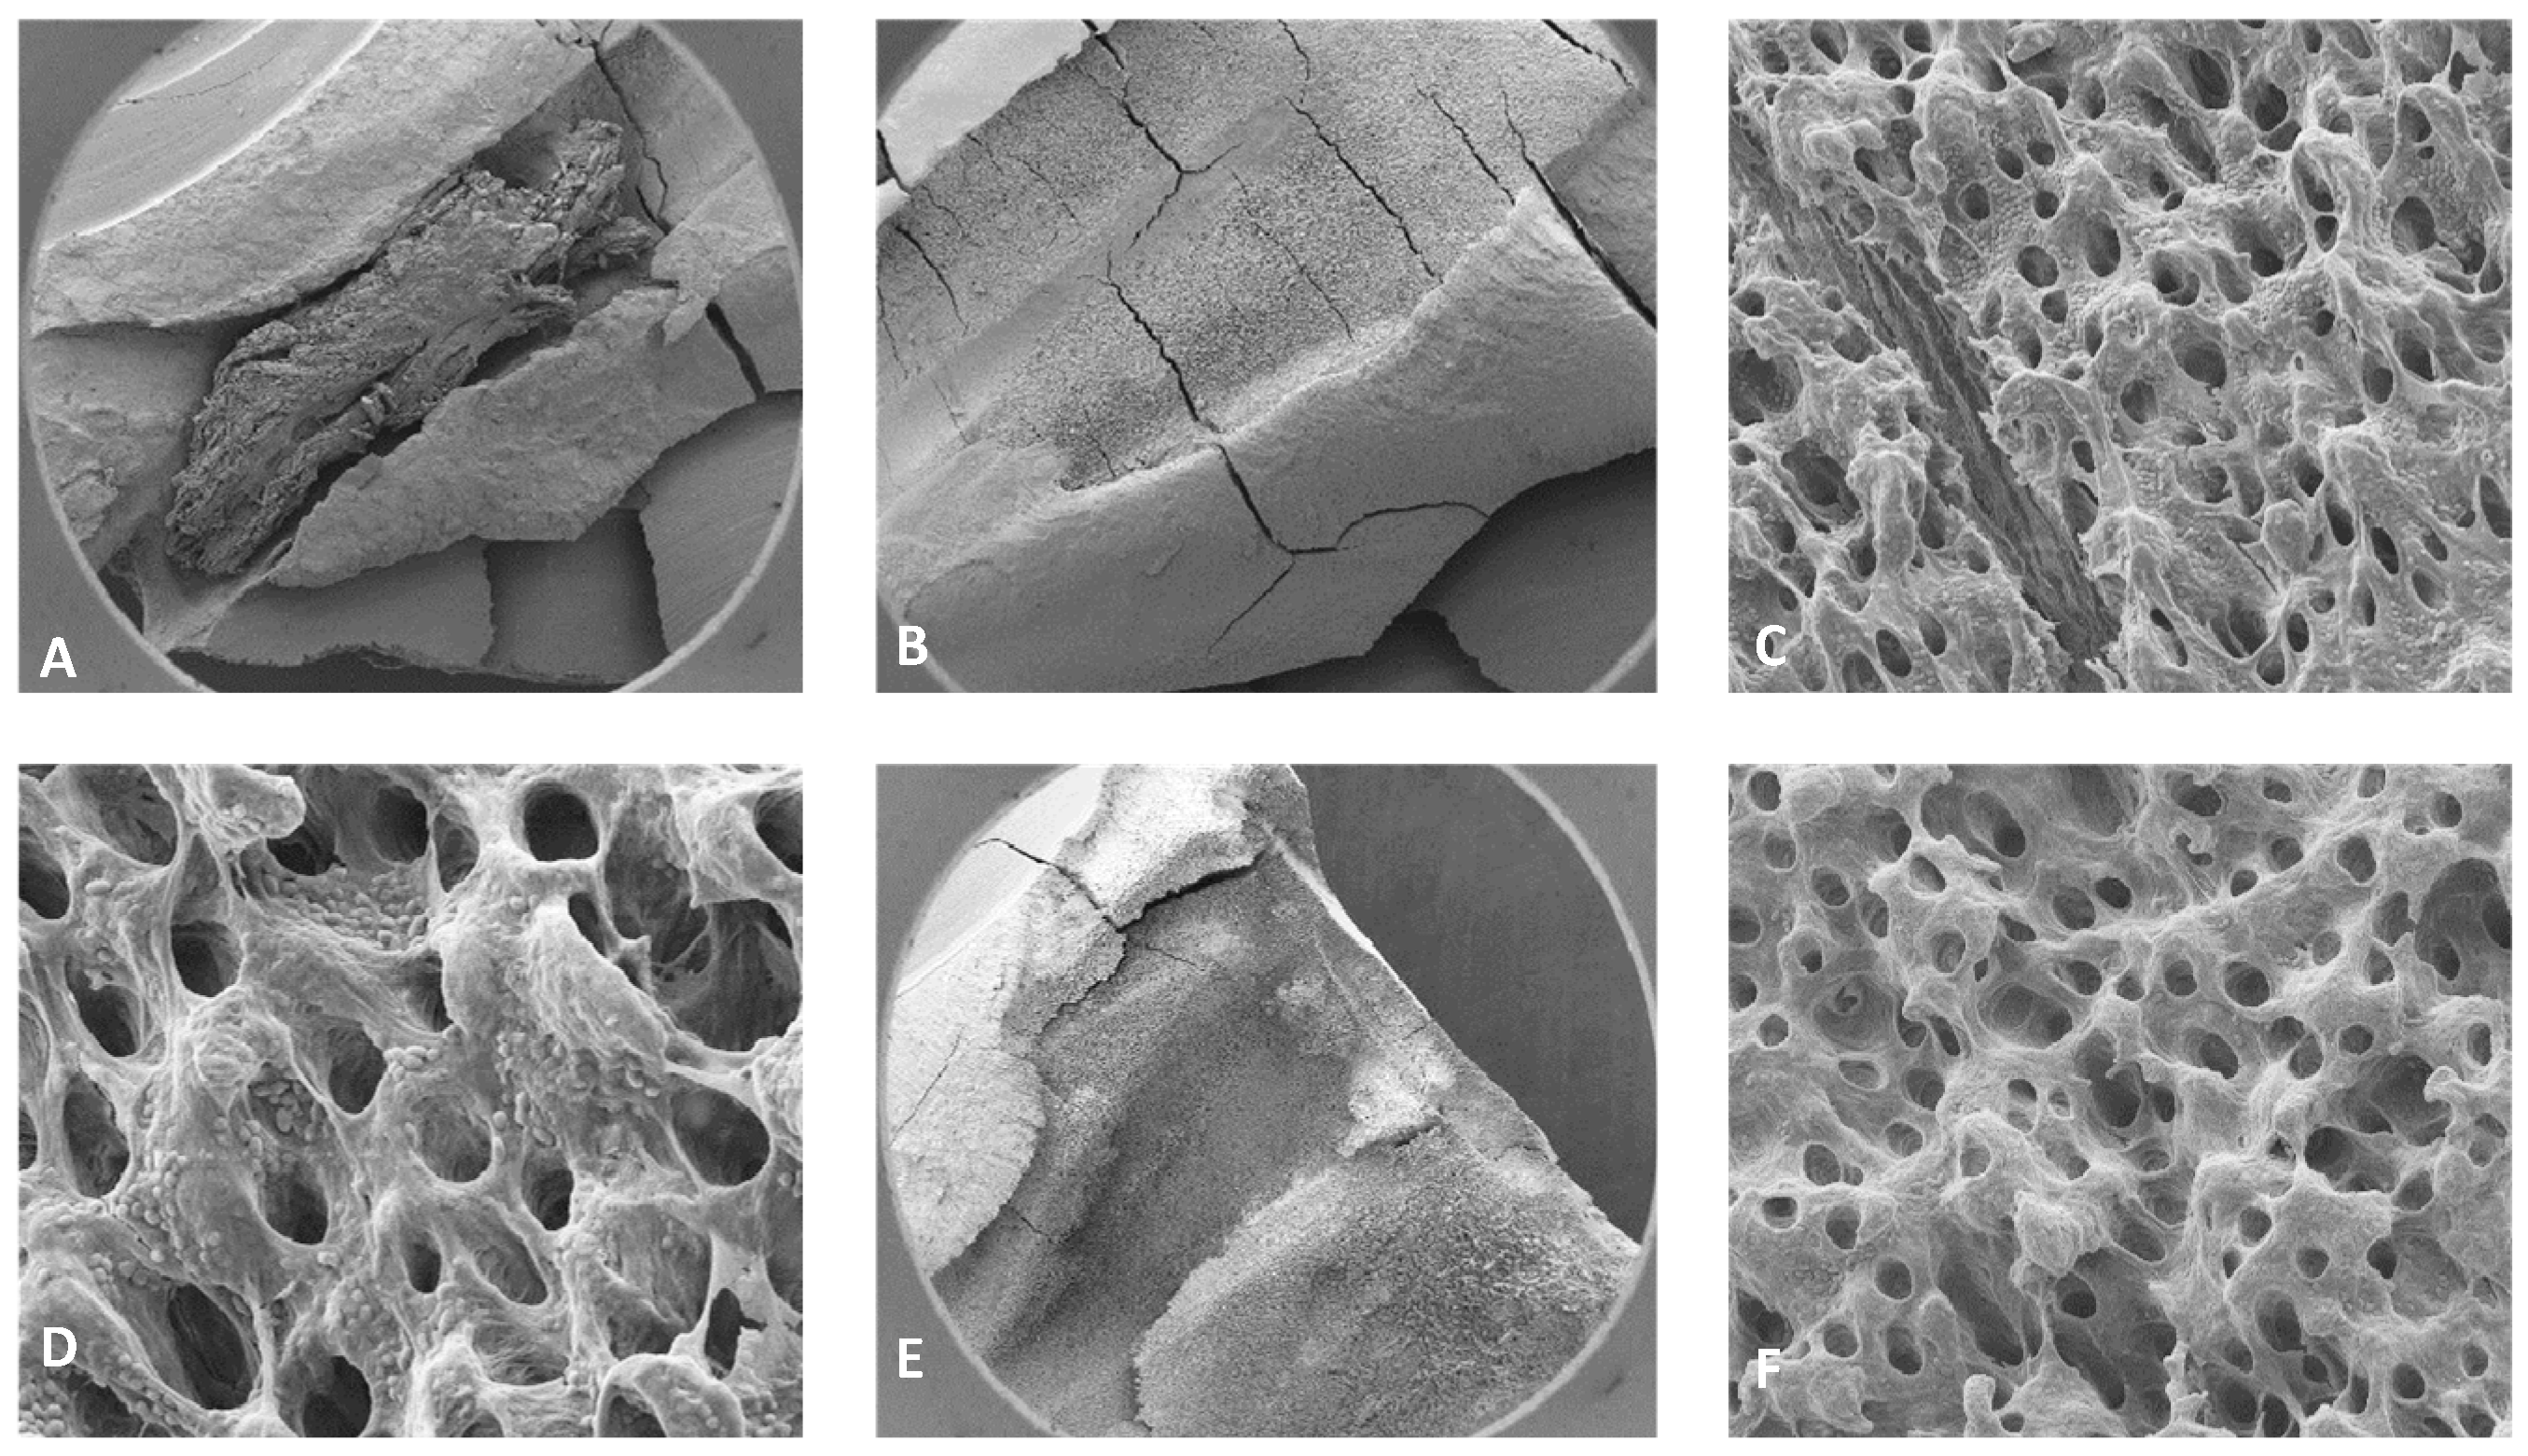
Figure 11.
A) Fiber inspection shows a halo which indicates the fiber is good. B) Fiber inspection shows diffuse dot which indicated that the tip is broken (after single use). C) New RFT2 tip from Laser #2 and D) Tip 2 from Laser #1.
Figure 11.
A) Fiber inspection shows a halo which indicates the fiber is good. B) Fiber inspection shows diffuse dot which indicated that the tip is broken (after single use). C) New RFT2 tip from Laser #2 and D) Tip 2 from Laser #1.

Figure 12.
Images from fiber tips used in experiments. A-C) the three tips used with 0.5% NaOCl + Laser #1 group. D-F) Three tips used with 3% NaOCl + 17% EDTA + Laser #1 group. G-I) The three tips used with 3% NaOCl +17% EDTA + Laser #2 group.
Figure 12.
Images from fiber tips used in experiments. A-C) the three tips used with 0.5% NaOCl + Laser #1 group. D-F) Three tips used with 3% NaOCl + 17% EDTA + Laser #1 group. G-I) The three tips used with 3% NaOCl +17% EDTA + Laser #2 group.
Disclaimer/Publisher’s Note: The statements, opinions and data contained in all publications are solely those of the individual author(s) and contributor(s) and not of MDPI and/or the editor(s). MDPI and/or the editor(s) disclaim responsibility for any injury to people or property resulting from any ideas, methods, instructions or products referred to in the content. |
© 2025 by the authors. Licensee MDPI, Basel, Switzerland. This article is an open access article distributed under the terms and conditions of the Creative Commons Attribution (CC BY) license (http://creativecommons.org/licenses/by/4.0/).
Copyright: This open access article is published under a Creative Commons CC BY 4.0 license, which permit the free download, distribution, and reuse, provided that the author and preprint are cited in any reuse.


