
Submitted:
18 February 2025
Posted:
18 February 2025
You are already at the latest version
Abstract
Pollen is bees' primary source of proteins. Using pollen substitutes could reduce colony losses in areas with limited floral resources. In this study, we compared the effects of pollen substitutes made from intact proteins versus free amino acids on bee survival, as well as the levels of vitellogenin (vg), major royal jelly protein 1 (mrjp1), and deformed wing virus (DWV). Our study revealed no significant differences in vg mRNA levels between bees-fed intact protein and free amino acid diets. However, mrjp1 mRNA levels were higher in bees-fed free amino acid diets, suggesting that the availability of amino acids affects the expression of this nutritionally regulated gene differently. Thus, the combined expression of vg and mrjp1 could be used to assess the nutritional value of different pollen substitutes. Our results also indicate that bees fed diets rich in free amino acids exhibited high levels of DWV and increased mortality during the first week, even though they showed high expression of genes related to good nutrition. In contrast, bees fed an intact protein diet showed the lowest DWV levels during the first two weeks, although viral infection increased afterward. These results suggest that ingested free amino acids are quickly absorbed in the intestine, transported in the hemolymph, and taken up by cells, where they can facilitate viral replication. On the other hand, ingested intact proteins may undergo slower digestion and gradual release of amino acids in the hemolymph, which may not trigger an overt DWV infection. Possible interactions among Varroa mites, DWV infection, and nutrition are also discussed.
Keywords:
pollen substitutes
; nutrition
; vitellogenin
; deformed wing virus
; Apis mellifera
1. Introduction
Around 70% of the plant species used for food production worldwide rely on animal pollination, primarily carried out by bees [1,2]. However, honey bee populations have significantly decreased in the United States and other countries in recent years [3,4,5,6]. On an economic level, the decline in honey bee populations impacts honey production and diminishes the yield of fruit and vegetable crops that rely on bee pollination for fertilization [2]. Several factors have been proposed to explain the loss of honey bee colonies, including the impact of the ectoparasite mite Varroa destructor [7] and its synergistic interactions with highly pathogenic viruses, such as the deformed wing virus (DWV) [8]. Nutritional stress is another factor proposed to contribute to honey bee colony loss. The effect of this factor on colony losses has been demonstrated by studies showing that bees in areas with intensive agriculture have lower levels of physiological biomarkers of nutrition, including storage proteins and lipids, compared with bees maintained in areas of less cultivation [9,10,11,12].
Nutritional resources for honey bees primarily include nectar and pollen, which provide carbohydrates, proteins, lipids, vitamins, and minerals [13,14,15]. Pollen is bees' main source of protein and lipids, and its consumption is essential for their growth and development [13,14,15,16,17]. However, colonies surrounded by monocultures experience pollen shortages before and after flowering [18]. In addition, since the pollen of some plant species is deficient in certain amino acids [19,20,21,22,23,24] and fatty acids [25], bees that consume pollen from a limited number of plants are less likely to have balanced nutrition. Hence, increased evidence shows that reduced floral diversity in regions with intensive agriculture has decreased both the quantity and quality of pollen collected by bees [10,11,18,26]. The amount of protein in pollen from various plants varies [19,27,28]. However, the nutritional value of a particular pollen (“pollen quality”) is mainly determined by its composition of amino acids. Bees, like other animals, cannot produce the ten amino acids essential for their nutrition [29]. These nutritionally essential amino acids must be present in the correct proportions (“de Groot ratio”) in the bees' diet for proper utilization during protein synthesis [30,31]. Pollen also contains several types of lipids that are critical for honey bee physiology [25,32]. The fatty acids are precursors of complex lipids, including phospholipids (e.g., phosphatidylcholine), with vital structural functions in cell membranes [32,33]. Two polyunsaturated fatty acids (PUFAs) are considered essential in insects, including honey bees: alpha-linolenic acid (omega-3) and linoleic acid (omega-6) [34], which the bee must consume in a 1:1 ratio for optimal cognitive performance [35].
Developing artificial diets for bees is needed to address the pollen shortage during cold and dry seasons [36,37,38]. Nutritional supplements for honey bees encompass a wide range of products and strategies [15]. The potential benefits of nutritional supplementation for honey bees include supporting brood rearing, and increasing honey bee colonies' overall productivity [39]. Pollen substitutes can be categorized based on several criteria, including their physical state and constitution. Solid diets often contain intact proteins (IPs) from plants (e.g., soy), yeast, and microalgae [15,39,40]. On the other hand, free amino acids (FAAs) diets are typically prepared as liquid solutions [41]. According to their amino acid composition, they can be classified as diets containing total amino acids (TAA) or essential amino acids (EAA) blends. Solid diets are typically fed to bee colonies as patties placed inside the hive, while liquid diets are fed in top or internal feeders [39,42]. Different studies in mammals have compared the effects of ingesting FAAs and protein hydrolysates versus IPs on nutrient absorption, protein synthesis, and overall metabolic response. FAAs and protein hydrolysates are quickly absorbed in the intestine, increasing plasma amino acid levels and muscle protein synthesis rates [43,44,45]. In contrast, IPs may have a more sustained effect on amino acid availability [45]. On the other hand, evidence from various studies on vertebrates suggests that consuming EAA alone or with IPs can enhance protein synthesis [46,47] and decrease protein degradation [48]. However, there are few studies on the impact of feeding EAA to honey bees [49,50], and no comparisons have been made regarding the effects of consuming FAAs versus IPs or EAA versus TAA blends, highlighting the need for further studies in this area.
Recent research on honey bee physiology has revealed clusters of coregulated genes associated with honey bees' physiological and behavioral development [51]. A group of highly expressed genes in nurses include nutritionally regulated transcripts encoding for vitellogenin (vg) [51,52] and the major royal jelly protein 1 (mrjp1) [51,53]. These findings on physiological research have practical implications for the development of nutrition biomarkers since pollen ingestion has been shown to trigger vg expression both in caged bees [26,54,55,56,57] and colony-level experiments [9,10]. Additionally, diets rich in IPs alone or supplemented with amino acids have also been found to induce vg expression [58,59], making this gene the most widely used molecular biomarker of nutrition in honey bees. On the other hand, while the expression of mrjp1 is associated with the development of the hypopharyngeal glands - another indicator of honey bee health and nutritional status [60] - and is also significantly induced by pollen ingestion [51,57], it has not been used as a molecular biomarker of nutrition. In addition to studying the impact of pollen substitutes on honey bee nutrition, a growing concern in beekeeping involves investigating how nutritional supplementation affects the levels of prevalent pathogens, including DWV [61]. However, previous studies have shown conflicting results [40,51,55,60,61], highlighting the necessity for more studies with multiple factors to consider when evaluating the effect of nutrition on viral infections.
This study aimed to assess the effects of pollen substitutes composed of IPs and/or FAAs on honey bees' nutritional status and health in caged bees. To measure the effects of these diets, we observed bee survival and compared the levels of two molecular biomarkers of nutrition (vg and mrjp1) and DWV. We hypothesized that since FAAs do not need to be digested and are easily absorbed in the intestine, they would quickly affect the levels of nutritionally regulated genes encoding storage proteins.
2. Materials and Methods
2.1. Caged Honey Bees
Experiments were initiated using newly emerged bees from 20 colonies maintained during the summer of 2022 at the experimental fields of the Centro de Investigaciones en Abejas (CIABE) of the University of Guadalajara in Ciudad Guzman Jalisco, Mexico (19.7252, -103.4610, 1507 m above sea level). Bees were then transported to a laboratory and maintained under controlled conditions. Colonies were derived from populations of Apis mellifera carnica and headed by open-mated sister queens. Varroa mite infestation levels were measured two months before the experiment using the alcohol wash technique [62]. Colonies with Varroa infestation levels exceeding 5% were treated with a thymol-based product (Happy Varr®). One month before the experiment, Varroa mite infestation levels were measured again, showing levels not exceeding 1%. We selected two capped brood frames containing bees about to emerge. Each frame was placed in a wire mesh cage built with a 3 mm diameter mesh sieve, measuring 56 cm in length, 6 cm in width, and 29 cm in height. These caged frames were placed in the central part of two standard hives, with one frame in each hive, and left there for two days to allow the bees to emerge. This procedure promotes interactions between newly emerged bees (NEBs) and older colony mates, facilitating the transmission of microbiota and protein-rich secretions. After hatching, NEBs (≈1-day-old) were thoroughly homogenized in a plastic container, and two hundred bees were randomly distributed per cage in triplicate. Additionally, a group of NEBs were frozen and collected as controls before providing any treatment. The remaining NEBs were maintained at 32 °C and 60% relative humidity. For an overview of the experiment, please refer to Figure 1.
2.2. Honey Bee Diets and Age Collections
Bees were provided with different diets across three cage replicates for each treatment, and their survival was monitored over a period of 45 days. The diets included three types of pollen substitutes, along with a control diet consisting of sugar syrup: T1. A liquid, free amino acid diet with total amino acids (TAA), which included all twenty amino acids that make up proteins: T2. A solid, intact protein, soy-based diet: Ultra bee® (UBee): T3. A solid, intact protein, yeast extract-based diet, supplemented with TAA: Apitir®. T4. Sugar syrup 50% (Sugar). We prepared the TAA diet using a blend of commercially available FAAs with 99.94% purity (NeutraBio®), in which the amounts of the essential amino acids [63] (EAA) were adjusted according to de Groot ratios [30]. Each EAA and non-essential amino acid mixture was added at the same molarity to obtain a final concentration of 22 mM. Essential fatty acids were also added using commercially available oils (Edwards, International) (Table S1). To feed the bees, two gravity plastic feeders with a 5 ml capacity were placed on top of the cages. One feeder contained purified water, while the other contained 50% sugar syrup. The group that received FAAs was given the TAA diet instead of sugar syrup. The two groups fed IPs (Apitir, UBee) had sugar syrup added in a 1:1 ratio until the powder reached a paste consistency. Then, 2.5 g of the prepared patty was given per cage. Every two days, the remaining food from each diet was weighed to determine the accumulated consumption, and fresh food was provided. Age collections were performed when the bees were 1-week-old (W1), 2-week-old (W2), and 3-week-old (W3). Three bees were collected per cage and time collection (n=9) (Figure 1). Individual bees were placed in 2 ml plastic tubes containing 1 ml of RNAlater® solution. Samples were stored at -80 °C until they were transported to the USDA Bee Research Laboratory (Beltsville, MD, USA) for molecular analyses.
2.3. Food Consumption and Honey Bee Survival
We measured the food consumed by weighing the feeders before placing them in the cages and then again after filling them with feed. The daily feed consumption was then calculated until the last bee perished. The final weight was adjusted based on the bees' mortality rate per treatment and cage. Bee survival was calculated as the difference between the date of death and the total number of bees, and it was adjusted for treatment and cage. We recorded mortality daily and calculated longevity per treatment once the last bee died. Kaplan-Meier survival analysis was conducted, in which 1 represents the maximum probability of survival and 0 the null probability of life during the days they were alive.
2.4. Hemocytes Measurements
For hemocyte measurement, five surviving bees were collected every week until the end of the experiment. A small puncture was made in each bee's second and third abdominal tergite using a sterile needle, and this area was gently compressed to obtain 4 μl of hemolymph. The hemolymph sample was collected with a micropipette and evenly spread on a microscope slide previously divided into 25 mm2 quadrants for easier hemocyte counting. The sample was air-dried at room temperature for approximately 20 minutes. Once dry, the smear was immersed five times for one second each in a fixative solution composed of 37% formaldehyde, distilled water, monobasic sodium phosphate, and dibasic sodium phosphate and allowed to air dry at room temperature for an hour. After drying, the samples were stained using the HYCEL® Rapid Blood Stain Kit (Cat. No. 548) protocol. Each slide was dipped five times for 2 seconds each in Solution I (Eosin), then rinsed with distilled water to remove excess water. Next, the samples were immersed in Solution II (Methylene Blue) five times for 2 seconds. The slide was rinsed with distilled water and air dried at room temperature, resting at a 60° angle overnight. After staining, the samples were analyzed for hemocytes using an optical microscope at 100X magnification with oil immersion. The number of hemocytes per microliter was calculated using a modification of the method described by Koleoglu et al. (2018) with the following formula: (number of hemocytes counted per slide /16) x (3950)/ 4 [64]. The hemocyte count was not conducted in the group of bees fed with Apitir® because of the limited number of surviving bees.
2.5. RNA Extraction and Quantitative PCR of vg, mrjp1 and DWV
RNA extractions were conducted using individual whole-body bees. Frozen samples stored in RNAlater® solution were thawed on ice and transferred into 2 ml homogenization tubes containing 30 mg of ceramic beads (1.4-1.7 mm Yttria Stabilized Zirconia YSZ, MSE supplies®) and 1 ml of RLT buffer (RNeasy kit, Qiagen®). Bees were homogenized using a fast-prep-24 5G® (MP) sample preparation system at 6.0 m/s for 2 min, two times. Then, 900 μL of chloroform was added to each sample and mixed for 30 s. Half of the volume of the homogenized solution (900 μL) was then transferred to a new tube for further processing. The remaining sample volume was stored at -80 o C as a backup. RNA extraction was continued by adding 900 μL of chloroform to each sample, and then the manufacturer's protocol was followed without further modifications.
The vg, mrjp1, and DWV mRNA levels were analyzed using two-step RT-qPCR using as internal control the gene encoding for the ribosomal protein S5 (rps5). For each sample, cDNA was synthesized using 1 μg of total RNA and Thermo Fisher reagents, including M-MLV Reverse Transcriptase (40U), RNase inhibitor (25U), random hexamers (2.5 μM), and dNTPs (0.8 mM) in a final reaction volume of 25 μL. The thermal profile for cDNA synthesis was as follows: 25 °C (10 min), 48 °C (45 min), and 70°C (5 min). Each cDNA reaction was diluted by adding 100 μL buffer (10 mM Tris HCl pH 8.5). Transcription levels were quantified by qRT-PCR using a Life Technologies Vii7 system, with SYBR green reagents and a two-step thermal profile for amplification (95°C 15 sec, 60 °C 1 min). All qPCR assays were conducted in triplicates with reverse and forward primers (Table S2) having a final concentration of 300 nM in a 10 μL reaction volume. Quantification of mRNA levels was performed by the ΔΔCT method, and relative values were calculated based on the differences (ΔCT) between the CT values of the focal gene/virus and the rps5 control gene. The effect of different diets on the mRNA levels of vg, mrjp1, and DWV was examined in NEBs and W1 workers. Subsequent measurements were only carried out on the diet groups with sufficient surviving bees for molecular analyses (n=9). Bees fed with TAA were excluded from further analyses after 2 and 3 weeks due to the higher mortality observed during the first two weeks.
2.6. Statistical Analysis
The survival rate data were analyzed using Kaplan-Meier analysis. Analysis of normality were conducted using the Shapiro-Wilk test. Non-parametric data were analyzed using the Kruskal-Wallis test, followed by multiple comparison post hoc tests using RStudio (Version 1.3.1056) [65]. The Mann-Whitney U test was used to analyze paired comparisons among treatments.
3. Results
3.1. Bee Survival and Food Consumption
The survival curve reveals a clear contrast between treatments, with bees fed UBee having significantly higher survival rates than those fed other treatments (UBee vs sugar p =0.016), UBee vs. Apitir p = <0.001, UBee vs. TAA p = 0.005) (Figure 2). On the other hand, while the bees fed TAA and sugar syrup had the lowest survival rate during the first ten days, the bees fed with Apitir experienced an accelerated mortality rate after this initial period. Our data also reveals distinct patterns in food, sugar syrup, and water consumption across different types of diets. Bees fed Apitir and TAA consumed the most, while those on the UBee diet consumed the least (Figure 3). There were significant differences in the consumption of diets containing FAAs (Apitir and TAA) and those on diets containing exclusively IPs (UBee) (p < 0.001). In contrast, bees fed UBee had significantly higher sugar syrup consumption than Apitir (p = 0.02). Additionally, our results indicated that bees fed Apitir treatment consumped the highest amount of water, followed by those fed with UBee (Apitir vs. UBee p=0.007).
3.2. Hemocyte Number
The number of hemocytes was high in newly emerged bees but declined in older bees from all the experimental groups (p >0.001) (Figure 4). Bees that were fed with TAA showed a tendency to have more hemocytes compared to those fed with UBee and control sugar syrup, although this difference did not reach statistical significance.
3.3. Analyses of Gene Expression and Viral Levels
3.3.1. Vitellogenin
Comparisons among pollen substitutes after one week (W1) showed that bees fed with UBee had vg levels significantly higher than those with Apitir (p=0.004) but not significantly different than the bees fed with TAA (Table S3). Then, while the vg levels remained constant in the bees fed with UBee, they increased with Apitir in W2 bees. Lastly, vg levels in surviving W3 bees fed with UltraBee dropped to similar levels as those fed only sugar syrup. As expected, vg levels in bees fed only carbohydrates were significantly lower than those of NEBs and bees fed with different pollen substitutes during the first two weeks of chronological age, a period corresponding to the typical nurses' physiological development on a protein or amino acid-rich diet (Figure 5).
3.3.2. Major Royal Jelly Protein 1
In contrast with the vg, the analysis of mrjp1 expression pattern shows that bees fed with the free amino acid diet (TAA) had the highest expression level, with significant differences with UBee (p=0.03), but not with Apitir (Table S3). After two weeks, however, Apitir had the highest mrjp1 levels, with a significant difference with bees fed with UBee (p=0.025). Similar to what was observed with vg, mrjp1 levels dropped after three weeks to levels similar to bees fed only sugar (Figure 6).
3.3.3. Deformed Wing Virus
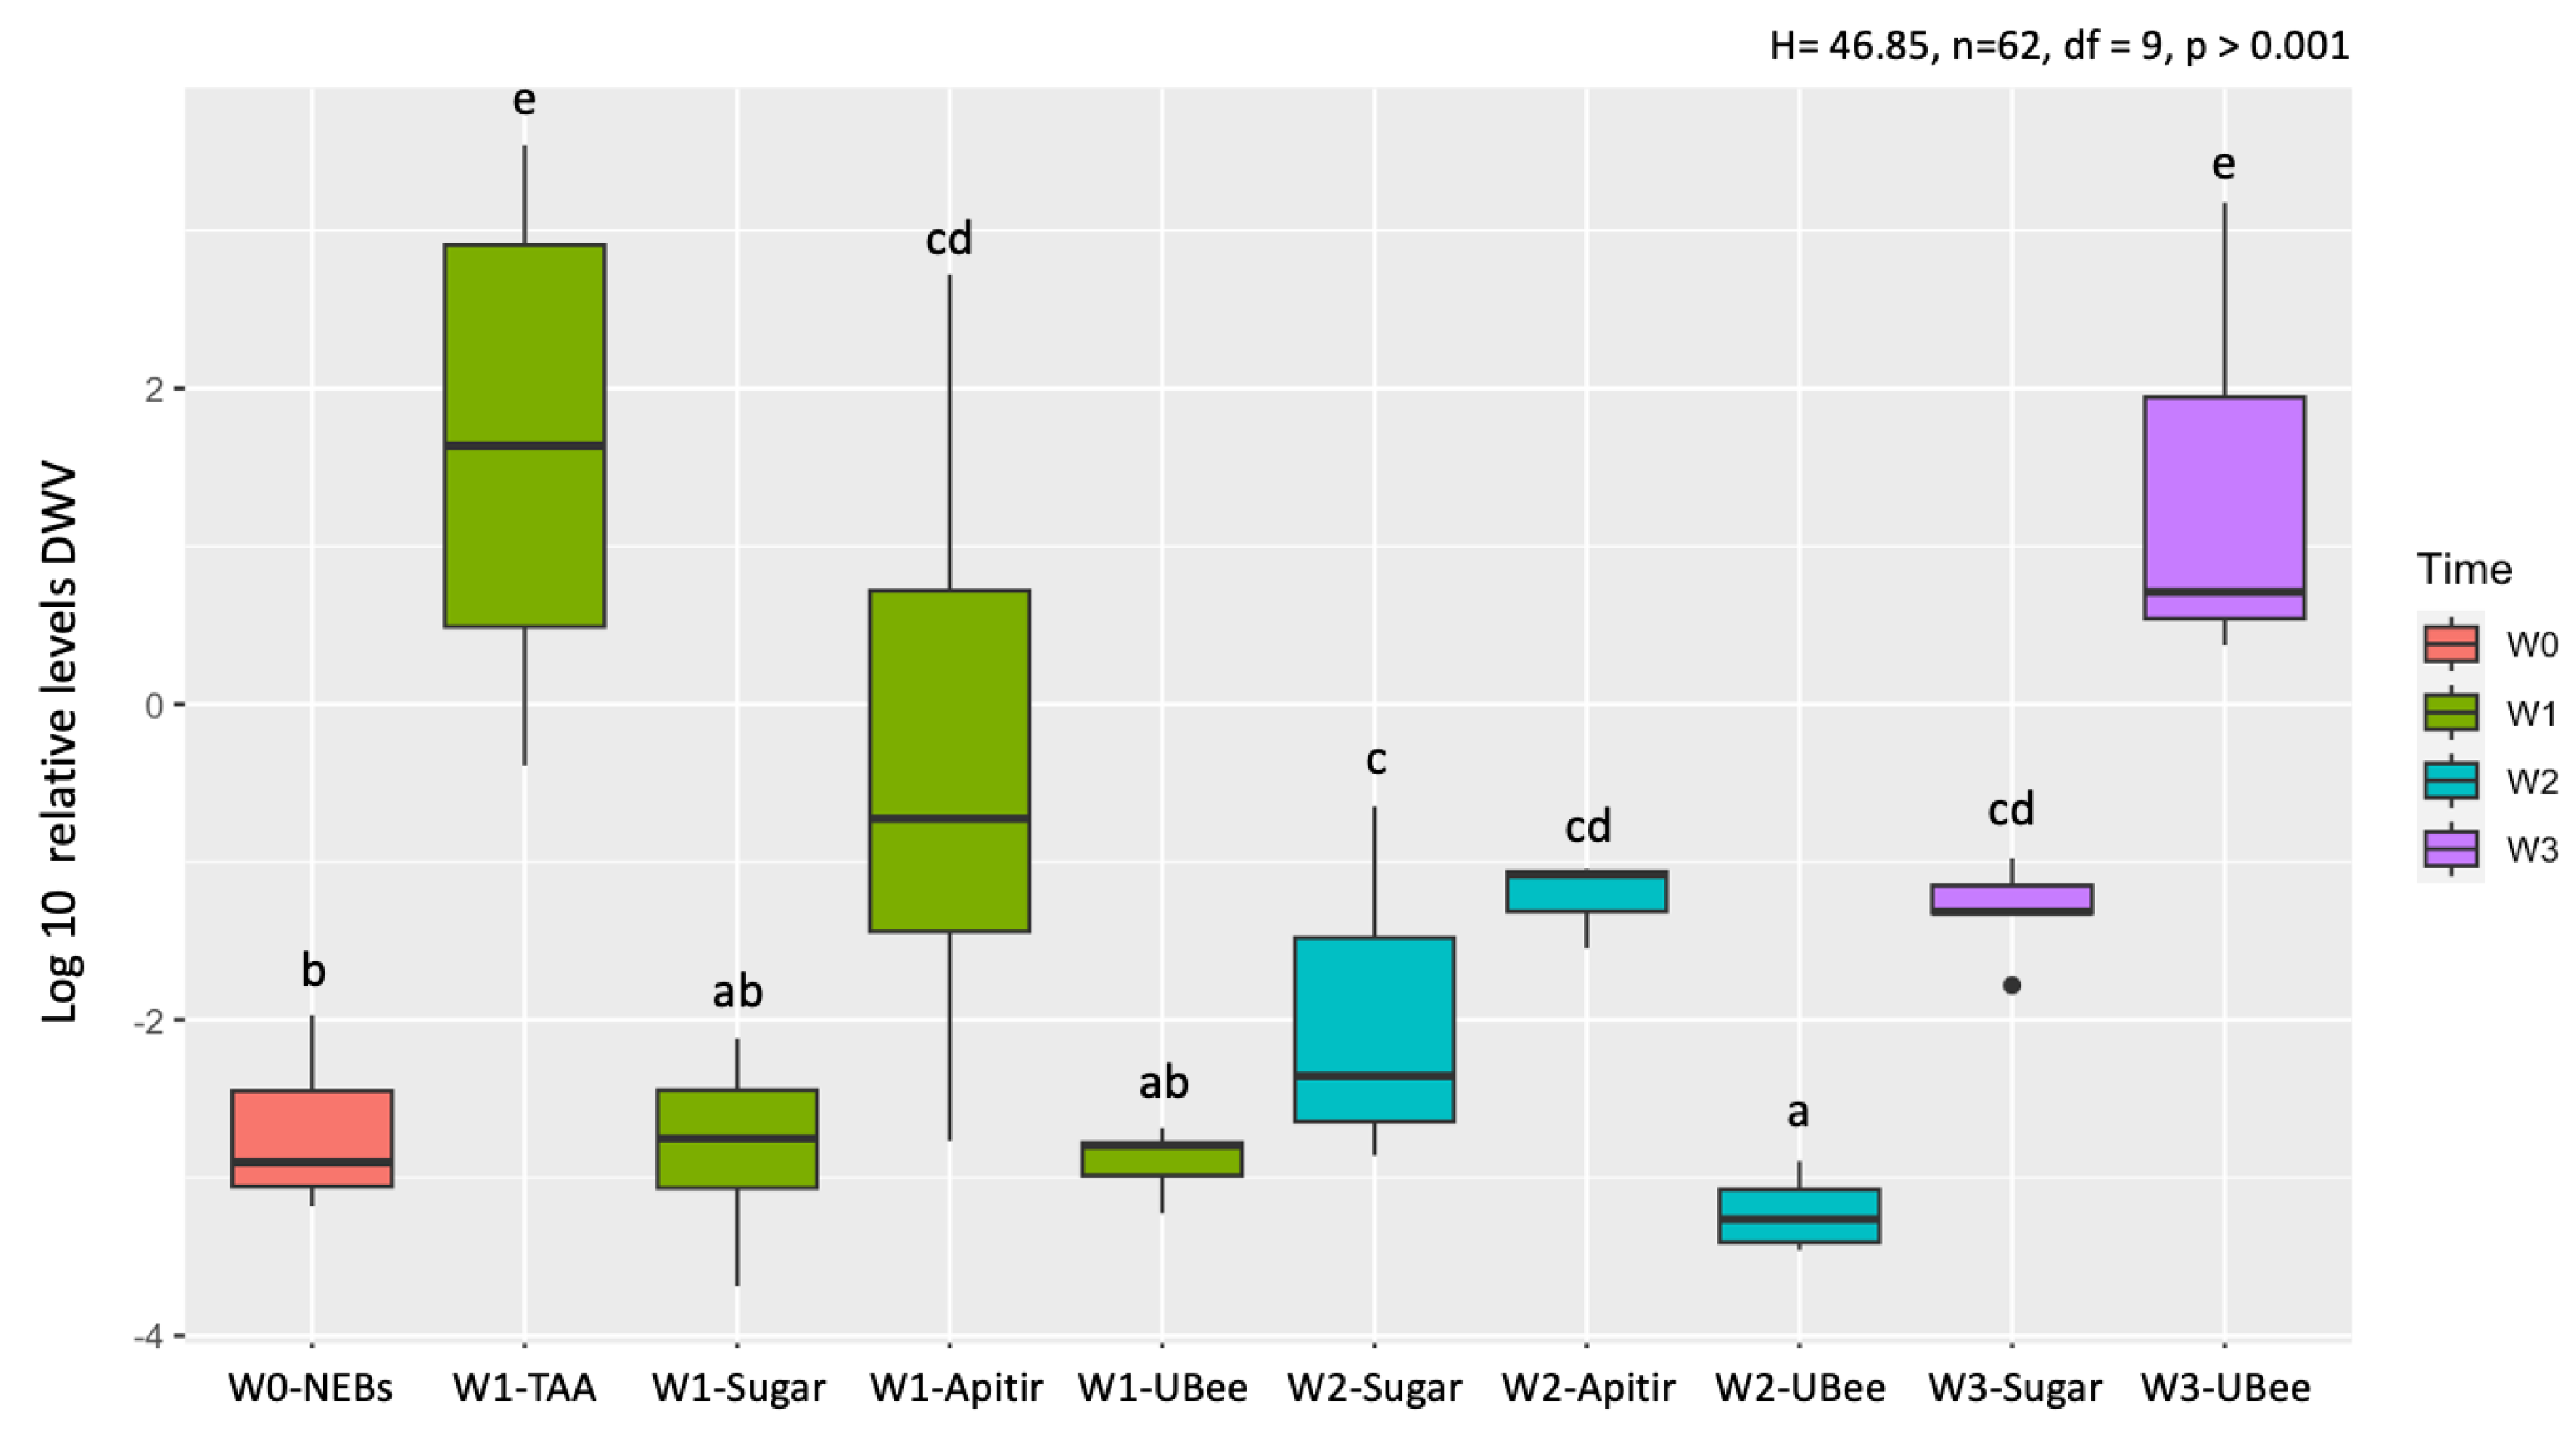
During the first week, the bees that were fed the free amino acid diet (TAA) had the highest levels of DWV, showing significant differences compared to UBee (p=0.006) and Apitir (p=0.002) (Table S3) (Figure 7). In contrast, DWV levels were low in bees that ingested UBee and intermediate in bees that consumed Apitir. In the second week, there were no significant changes between the two groups of surviving bees fed with pollen substitutes compared to the first week. DWV levels in bees fed UBee were the lowest, with significant differences with Apitir (p=0.034). However, during the third week, DWV levels in bees fed UBee showed a significant increase, reaching levels like those observed during the first week with the free amino acid (TAA) diet. On the other hand, it is important to note the DWV levels in bees that were exclusively fed carbohydrates. Bees fed with sugar syrup displayed low DWV levels in the first week, which were significantly lower than those fed with TAA (p <0.001) and Apitir (p=0.003) but were not significantly different from those fed UBee (Table S4). However, the DWV levels continued to increase as the bees reached 2 and 3 weeks old, although they did not exceed the DWV levels of surviving bees fed UBee at three weeks (W3-Sugar vs W3-UBee p=0.014). On the other hand, the initial DWV levels in NEBs were lower compared to bees fed TAA (p <0.0001) and Apitir P=0.003) but were similar to those observed in bees fed sugar syrup or Ubee during the first week. Subsequently, DWV levels were higher in the surviving bees fed sugar and pollen substitutes (Table S3). However, the DWV levels in bees fed UBee during the second week were an exception to this pattern, with lower levels compared to NEBs (p=0.045).
4. Discussion
The present study provides new information on the effect of amino acid availability in pollen substitutes and their effects on bee nutrition and health. We did not find significant differences in vg levels between bees that consumed a diet of FAAs and those that consumed pollen substitutes containing IPs alone or combined with FAAs. However, mrjp1 levels were significantly higher in bees that ingested the FAAs diet compared to those that consumed diets containing IPs. These findings have practical implications for beekeeping and physiological significance. First, they suggest that the combined use of both biomarkers could help characterize the nutritional value of different pollen substitutes more effectively. Second, our results suggest that the availability of amino acids affects the expression of nutritionally regulated genes differently, with mrjp1 being more strongly upregulated by amino acid availability than vg. The physiological mechanisms behind these differences are currently unknown. However, we hypothesize that the levels of amino acids, which serve as nutritional cues, may prompt a quicker production of royal jelly proteins in the hypopharyngeal glands compared to the synthesis of Vg in the fat bodies. This idea is consistent with the proposed role of Vg in storing nutritional resources in the bodies of sterile workers [66].
Our results also showed an important effect of amino acid availability on DWV levels. Bees fed diets containing free amino acids had high DWV levels during the first week. During the second week, DWV levels were not measured in bees fed TAA due to their high mortality, but levels with Apitir were still higher than those fed exclusively IPs (UBee). These results suggest a positive relationship between the availability of free amino acids and a fast increase in viral infection. However, DWV levels increased after three weeks in UBee to levels as high as those with TAA in the first week. Thus, although ingesting all pollen substitutes induced high levels of DWV, this increase was delayed by two weeks in the diet consisting exclusively of IPs. Since high DWV titers are linked to bee mortality [67], this delay could be advantageous in maintaining the colony's population. However, further studies at colony level are required to support this hypothesis.
We found significant differences in the survival of bees fed different pollen substitutes. Bees fed a diet containing only IPs had higher survival than those fed diets containing FAAs. This result suggests a link between the consumption of FAAs and increased mortality. Our study also revealed that these differences in survival were associated with variations in food intake and water consumption: Bees on a diet with IPs ate less food but drank more water than those with a diet containing FAAs. We hypothesize that FAAs have a phagostimulant effect, leading to a higher intake of TAA and Apitir. This proposal is supported by evidence showing that bees can detect changes in the concentration of free amino acids in both liquid [49] and solid solutions [68]. However, it is likely that the increased levels of DWV, rather than the higher food intake, had a more substantial impact on the mortality of the bees fed diets containing FAAs. Further studies are required to uncouple confounding factors in our experimental design, including the effects of the physical state (solid vs. liquid) and composition (IPs vs. FAAs) of the diet tested.
The comparison between the bees fed with sugar syrup and those fed with pollen substitutes reveals valuable insights into the relations between bee nutrition and physiological development. Firstly, consistent with their utilization as nutrition biomarkers, the expression levels of vg and mrjp1 were low in the control group fed only with carbohydrates. Secondly, vg and mrjp1 are also markers of physiological development, which is closely linked to behavioral development [51]. Low levels of these genes in carbohydrate-fed young bees suggest they have experienced an early transition to the physiological foraging state due to acute nutritional stress. In contrast, bees fed with pollen substitutes showed high levels of these genes during the first two weeks, indicating a nurse-like physiological state. Thirdly, DWV levels were low in sugar-fed bees in the first week but increased after two weeks. This pattern partially resembles that reported by DeGrandi-Hoffman et al. (2010), where DWV levels increased with age in sugar-fed bees, although these levels were still lower compared with bees fed pollen or a plant-based pollen substitute in 11-day-old bees [60]. Finally, both the quick age-related increase of DWV levels in bees fed with carbohydrates and the delayed increase in viral levels observed in 3-week-old bees fed IPs pollen substitutes could be influenced by immunological changes associated with the nurse-forager physiological transition, given that foraging is associated with increased DWV levels at colony level [51]. Further studies are needed to understand the effects of amino acid availability and nutritionally induced changes in bees' physiology and immunity.
We are unaware of previous studies reporting increased viral levels after ingesting pollen substitutes. However, other researchers have found increased DWV levels associated with pollen ingestion in cages [55] and colony-level studies [51]. Additionally, Branchiccella et al. (2019) found that bees fed with a high nutritional value polyfloral pollen had higher DWV levels than those fed with a low nutritional value monofloral pollen [61]. The diverse results from studies examining the impact of nutrition on DWV levels suggest the existence of previously overlooked factors. We propose that the effect of nutrition on viral infection may vary depending on the initial levels of DWV in the bees being studied. According to this idea, there would be a threshold of viral infection where moderate and high levels of DWV would lead to increased viral replication if the infected bees ingest food rich in proteins or amino acids. However, the levels of virus in the experimental bees may not be determined solely by the infestation levels of Varroa in the colonies at the time of their use in nutritional treatments, but also by past Varroa infestation levels. Evidence shows that DWV titers in the colony decrease significantly after the acaricide treatment, although viral levels gradually increase without Varroa [69]. In our experiments, the donor colonies had low Varroa infestation levels (<1%) at the beginning of the experiment. However, these colonies had high Varroa levels (>5%) before being treated with a thymol-based acaricide a month before the experiment. Considering that cleaning DWV infection in the colony involves population turnover and takes approximately six weeks [69], it is likely that the bees used in our experiment still have moderate DWV levels. We used in our study a relative quantification method, which prevented us from determining the copy number of DWV in the analyzed samples and its clinical significance. If our hypothesis is correct, the initial levels of DWV in the NEBs used in our study, prior to the application of treatments, may have exceeded the threshold necessary to trigger viral replication when fed a diet rich in protein or amino acids.
5. Conclusions
This study compared how pollen substitutes made from IPs differed from those composed of mixed free amino acids FAAs in terms of their impact on the expression of two genes encoding important nutritionally regulated proteins—vg and mrjp1—as well as a prevalent bee virus (DWV). Regardless of their differences in amino acid availability, we found no significant variations in vg expression in bees fed the different pollen substitutes. However, we did observe significant differences in mrjp1 expression between the diets made from FAAs and those containing IPs. These findings suggest that utilizing a combination of nutritional biomarkers could be beneficial in assessing the nutritional value of different types of pollen substitutes. Similarly to previous reports on pollen ingestion, our findings indicate that consuming pollen substitutes can also lead to elevated DWV levels. However, there were remarkable differences in the timing of when the bees fed the different pollen substitutes exhibited high DWV levels: those consuming a diet of FAAs showed increased DWV levels after one week, while bees fed a diet of IPs exhibited elevated DWV levels after three weeks. Possible explanations for these results include differences among diets in amino acids’ intestinal absorption and nutritionally induced changes in honey bee physiological development. The impact of nutrition on viral infections in bees may differ based on the initial levels of DWV present in the bees being studied.
Supplementary Materials
The following supporting information can be downloaded at the website of this paper posted on Preprints.org., Figure S1: title; Table S1: title; Video S1: title.
Author Contributions
Conceptualization, José Tapia-González, José Macias-Macias and Miguel Corona; Formal analysis, Mohamed Alburaki and Miguel Corona; Funding acquisition, José Tapia-González; Investigation, José Tapia-Rivera and Miguel Corona; Methodology, José Tapia-Rivera, Philene Chan, Rogelio Sanchez and Miguel Corona; Project administration, José Tapia-González and José Macias-Macias; Resources, José Tapia-González; Writing – original draft, José Tapia-Rivera and Miguel Corona; Writing – review & editing, Mohamed Alburaki and José Macias-Macias. All authors have read and agreed to the published version of the manuscript.
Funding
This research received no external funding.
Conflicts of Interest
The authors declare no conflicts of interest.
References
- Klein, A.M.; Vaissière, B.E.; Cane, J.H.; Steffan-Dewenter, I.; Cunningham, S.A.; Kremen, C.; Tscharntke, T. Importance of crop pollinators in changing landscapes for world crops. Proc. Biol. Sci. 2007, 274, 303–313. [Google Scholar] [CrossRef] [PubMed]
- Lorenzo-Felipe, I.; Blanco, C.; Corona, M. Impact of apoidea (Hymenoptera) on the world’s food production and diets. Ann. Entomol. Soc. Am. 2020, 113, 407–424. [Google Scholar] [CrossRef]
- Hristov, P.; Shumkova, R.; Palova, N.; Neov, B. Factors associated with honey bee colony losses: A mini-review. Vet. Sci. 2020, 7, 166. [Google Scholar] [CrossRef]
- Potts, S.G.; Roberts, S.P.M.; Dean, R.; Marris, G.; Brown, M.A.; Jones, R.; Neumann, P.; Settele, J. Declines of managed honey bees and beekeepers in Europe. J. Apic. Res. 2010, 49, 15–22. [Google Scholar] [CrossRef]
- Requier, F.; Leyton, M.S.; Morales, C.L.; Garibaldi, L.A.; Giacobino, A.; Porrini, M.P.; Rosso-Londoño, J.M.; Velarde, R.A.; Aignasse, A.; Aldea-Sánchez, P.; et al. First large-scale study reveals important losses of managed honey bee and stingless bee colonies in Latin America. Sci. Rep. 2024, 14, 10079. [Google Scholar] [CrossRef] [PubMed]
- Kulhanek, K.; Steinhauer, N.; Rennich, K.; Caron, D.; Sagili, R.R.; Pettis, J.S.; Ellis, J.D.; Wilson, M.E.; Wilkes, J.T.; Tarpy, D.R.; et al. A national survey of managed honey bee 2015–2016 annual colony losses in the USA. J. Apic. Res. 2017, 56, 328–340. [Google Scholar] [CrossRef]
- Guzman-Novoa, E.; Eccles, L.; Calvete, Y.; Mcgowan, J.; Kelly, P.G.; Correa-Benítez, A. Varroa destructor is the main culprit for the death and reduced populations of overwintered honey bee (Apis mellifera) colonies in Ontario, Canada. Apidologie 2010, 41, 443–450. [Google Scholar] [CrossRef]
- Martin, S.J.; Highfield, A.C.; Brettell, L.; Villalobos, E.M.; Budge, G.E.; Powell, M.; Nikaido, S.; Schroeder, D.C. Global honey bee viral landscape altered by a parasitic mite. Science 2012, 336, 1304–1306. [Google Scholar] [CrossRef]
- Smart, M.; Pettis, J.; Rice, N.; Browning, Z.; Spivak, M. Linking measures of colony and Individual honey bee health to survival among apiaries exposed to varying agricultural land use. PLoS ONE 2016, 11, e0152685. [Google Scholar] [CrossRef]
- Dolezal, A.G.; Carrillo-Tripp, J.; Miller, W.A.; Bonning, B.C.; L, T.A. Intensively cultivated landscape and Varroa mite infestation are associated with reduced Honey bee nutritional state. PLoS ONE 2016, 11, e0153531. [Google Scholar] [CrossRef]
- Di Pasquale, G.; Alaux, C.; Le Conte, Y.; Odoux, J.F.; Pioz, M.; Vaissière, B.E.; Belzunces, L.P.; Decourtye, A. Variations in the availability of pollen resources affect honey Bee health. PLoS ONE 2016, 11, e0162818. [Google Scholar] [CrossRef] [PubMed]
- Ricigliano, V.A.; Mott, B.M.; Maes, P.W.; Floyd, A.S.; Fitz, W.; Copeland, D.C.; Meikle, W.G.; Anderson, K.E. Honey bee colony performance and health are enhanced by apiary proximity to US Conservation Reserve Program (CRP) lands. Sci. Rep. 2019, 9, 4894. [Google Scholar] [CrossRef] [PubMed]
- Haydak, M.H. Honey bee nutrition Annu. Rev. Entomol. 1970, 15, 143–156. [Google Scholar] [CrossRef]
- Tsuruda, J.M.; Chakrabarti, P.; Sagili, R.R. Honey bee nutrition. Vet. Clin. North Am. Food Anim. Pract. 2021, 37, 505–519. [Google Scholar] [CrossRef] [PubMed]
- Brodschneider, R.; Crailsheim, K. Nutrition and health in honey bees. Apidologie 2010, 41, 278–294. [Google Scholar] [CrossRef]
- Keller, I.; Fluri, P.; Imdorf, I. Pollen nutrition and colony development in honey bees: Part 1. Bee World 2005, 86, 3–10. [Google Scholar] [CrossRef]
- Huang, Z.Y. Pollen nutrition affects honey bee stress resistance. Terr. Arthropod. Rev. 2012, 5. [Google Scholar] [CrossRef]
- Decourtye, A.; Alaux, C.; Odoux, J.-F.; Henry, M.; Vaissière, B.E.; Le Conte, Y. Why enhancement of floral resources in agro-ecosystems benefit honeybees and beekeepers? In Ecosystems Biodiversity; Oscar, G., Gianfranco, V., Eds.; IntechOpen, 2011; p. Ch. 16. [Google Scholar] [CrossRef]
- Weiner, C.N.; Hilpert, A.; Werner, M.; Linsenmair, K.E.; Blüthgen, N. Pollen amino acids and flower specialisation in solitary bees. Apidologie 2010, 41, 476–487. [Google Scholar] [CrossRef]
- Barraud, A.; Barascou, L.; Lefebvre, V.; Sene, D.; Le Conte, Y.; Alaux, C.; Grillenzoni, F.-V.; Corvucci, F.; Serra, G.; Costa, C.; et al. Variations in nutritional requirements across bee species. Front. Sustain. Food Syst. 2022, 6, 824750. [Google Scholar] [CrossRef]
- Yokota, S.C.; Broeckling, C.; A, H.S.S. Pollen foraging preferences in honey bees and the nutrient profiles of the pollen. Sci. Rep. 2024, 14, 15028. [Google Scholar] [CrossRef]
- Höcherl, N.; Siede, R.; Illies, I.; Gätschenberger, H.; Tautz, J. Evaluation of the nutritive value of maize for honey bees. J. Insect. Physiol. 2012, 58, 278–285. [Google Scholar] [CrossRef]
- Nicolson, S.W.; Human, H. Chemical composition of the ‘low quality’ pollen of sunflower (Helianthus annuus, Asteraceae). Apidologie 2013, 44, 144–152. [Google Scholar] [CrossRef]
- Herbert, E.W.; Bickley, W.E.; Shimanuki, H. The brood-rearing capability of caged honey bees fed dandelion and mixed pollen diets. J. Econ. Entomol. 1970, 63, 215–218. [Google Scholar] [CrossRef]
- Manning, R. Fatty acids in pollen: A review of their importance for honey bees. Bee World 2001, 82, 60–75. [Google Scholar] [CrossRef]
- Di Pasquale, G.; Salignon, M.; Le Conte, Y.; Belzunces, L.P.; Decourtye, A.; Kretzschmar, A.; Suchail, S.; Brunet, J.L.; Alaux, C. Influence of pollen nutrition on honey bee health: Do pollen quality and diversity matter? PLoS ONE 2013, 8, e72016. [Google Scholar] [CrossRef]
- Roulston, T.H.; Cane, J.H. Pollen nutritional content and digestibility for animals. Plant Syst. Evol. 2000, 222, 187–209. [Google Scholar] [CrossRef]
- Roulston, T.H.; Cane, J.H.; Buchmann, S.L. What governs protein content of pollen: Pollinator preferences, pollen–pistil interactions, or phylogeny? Ecol. Monogr. 2000, 70, 617–643. [Google Scholar] [CrossRef]
- de Groot, A.P. Amino acid requirements for growth of the honeybee (Apis mellifica L.). Experientia 1952, 8, 192–194. [Google Scholar] [CrossRef]
- De Groot, A.P. Protein and amino acid requirements of the honey bee (Apis mellifera). Physiol. Comp. Oecol. 1953, 3, 197–285. [Google Scholar]
- Hou, Y.; Wu, G. Nutritionally essential amino acids. Adv. Nutr. 2018, 9, 849–851. [Google Scholar] [CrossRef]
- Wegener, J.; Jakop, U.; Schiller, J.; Müller, K. The membrane phospholipid composition of honeybee (Apis mellifera) workers reflects their nutrition, fertility, and vitellogenin stores. Insectes Soc. 2018, 65, 381–391. [Google Scholar] [CrossRef]
- Das, U.N. Essential fatty acids: Biochemistry, physiology and pathology. Biotechnol. J. 2006, 1, 420–439. [Google Scholar] [CrossRef]
- Canavoso, L.E.; Jouni, Z.E.; Karnas, K.J.; Pennington, J.E.; Wells, M.A. Fat metabolism in insects. Annu. Rev. Nutr. 2001, 21, 23–46. [Google Scholar] [CrossRef]
- Arien, Y.; Dag, A.; Shafir, S. Omega-6:3 ratio more than absolute lipid level in diet affects associative learning in honey Bees. Front. Psychol. 2018, 9, 1001. [Google Scholar] [CrossRef]
- Kim, H.; Frunze, O.; Maigoro, A.Y.; Lee, M.L.; Lee, J.H.; Kwon, H.W. Comparative study of the effect of pollen substitute diets on honey bees during early spring. Insects 2024, 15. [Google Scholar] [CrossRef]
- DeGrandi-Hoffman, G.; Chen, Y.; Rivera, R.; Carroll, M.; Chambers, M.; Hidalgo, G.; de Jong, E.W. Honey bee colonies provided with natural forage have lower pathogen loads and higher overwinter survival than those fed protein supplements. Apidologie 2016, 47, 186–196. [Google Scholar] [CrossRef]
- Kumsa Gemeda, T. Testing the effect of dearth period supplementary feeding of honeybee (Apis mellifera) on brood development and honey production. Int. J. of Adv. Res. 2014, 2, 319–324. [Google Scholar]
- Noordyke, E.R.; Ellis, J.D. Reviewing the efficacy of pollen substitutes as a management tool for improving the health and productivity of western honey bee (Apis mellifera) colonies. Front. Sustain. Food Syst. 2021, 5, Review. [Google Scholar] [CrossRef]
- Ricigliano, V.A.; Williams, S.T.; Oliver, R. Effects of different artificial diets on commercial honey bee colony performance, health biomarkers, and gut microbiota. BMC Vet. Res. 2022, 18, 52. [Google Scholar] [CrossRef]
- Lamas, Z.S.; Solmaz, S.; Stevens, C.; Bragg, J.; Ryabov, E.V.; Madella, S.; Corona, M.; Evans, J.D. Nano colonies: Rearing honey bee queens and their offspring in small laboratory arenas. Heliyon 2025, 11, e42042. [Google Scholar] [CrossRef]
- Kartik; Rana, A.; Singh, G. Artificial diet supplementation: A review for sustainable approach to boost honeybee health. J. Sci. Ind. Res. 2024, 83, 914–933. [Google Scholar] [CrossRef]
- Koopman, R.; Crombach, N.; Gijsen, A.P.; Walrand, S.; Fauquant, J.; Kies, A.K.; Lemosquet, S.; Saris, W.H.; Boirie, Y.; van Loon, L.J. Ingestion of a protein hydrolysate is accompanied by an accelerated in vivo digestion and absorption rate when compared with its intact protein. Am. J. Clin. Nutr. 2009, 90, 106–115. [Google Scholar] [CrossRef] [PubMed]
- Weijzen, M.E.G.; van Gassel, R.J.J.; Kouw, I.W.K.; Trommelen, J.; Gorissen, S.H.M.; van Kranenburg, J.; Goessens, J.P.B.; van de Poll, M.C.G.; Verdijk, L.B.; van Loon, L.J.C. Ingestion of free amino acids compared with an equivalent amount of intact protein results in more rapid amino acid absorption and greater postprandial plasma amino acid availability without affecting muscle protein synthesis rates in young adults in a double-blind randomized trial. J. Nutr. 2022, 152, 59–67. [Google Scholar] [CrossRef] [PubMed]
- Eugenio, F.A.; van Milgen, J.; Duperray, J.; Sergheraert, R.; Le Floc'h, N. Feeding intact proteins, peptides, or free amino acids to monogastric farm animals. Amino Acids 2022, 54, 157–168. [Google Scholar] [CrossRef]
- Gwin, J.A.; Church, D.D.; Wolfe, R.R.; Ferrando, A.A.; Pasiakos, S.M. Muscle protein synthesis and whole-body protein turnover responses to ingesting essential amino acids, intact protein, and protein-containing mixed meals with considerations for energy deficit. Nutrients 2020, 12. [Google Scholar] [CrossRef]
- Smith, K.; Reynolds, N.; Downie, S.; Patel, A.; Rennie, M.J. Effects of flooding amino acids on incorporation of labeled amino acids into human muscle protein. Am. J. Physiol. 1998, 275, E73–E78. [Google Scholar] [CrossRef]
- Cleveland, B.M.; Radler, L.M. Essential amino acids exhibit variable effects on protein degradation in rainbow trout (Oncorhynchus mykiss) primary myocytes. Comp. Biochem. Physiol. A Mol. Integr. Physiol. 2019, 229, 33–39. [Google Scholar] [CrossRef]
- Paoli, P.P.; Donley, D.; Stabler, D.; Saseendranath, A.; Nicolson, S.W.; Simpson, S.J.; Wright, G.A. Nutritional balance of essential amino acids and carbohydrates of the adult worker honeybee depends on age. Amino Acids 2014, 46, 1449–1458. [Google Scholar] [CrossRef] [PubMed]
- Hendriksma, H.P.; Pachow, C.D.; Nieh, J.C. Effects of essential amino acid supplementation to promote honey bee gland and muscle development in cages and colonies. J. Insect. Physiol. 2019, 117, 103906. [Google Scholar] [CrossRef]
- Corona, M.; Branchiccela, B.; Alburaki, M.; Palmer-Young, E.C.; Madella, S.; Chen, Y.; Evans, J.D. Decoupling the effects of nutrition, age, and behavioral caste on honey bee physiology, immunity, and colony health. Front. Physiol. 2023, 14, 1149840. [Google Scholar] [CrossRef]
- Piulachs, M.D.; Guidugli, K.R.; Barchuk, A.R.; Cruz, J.; Simões, Z.L.; Bellés, X. The vitellogenin of the honey bee, Apis mellifera: Structural analysis of the cDNA and expression studies. Insect Biochem. Mol. Biol. 2003, 33, 459–465. [Google Scholar] [CrossRef] [PubMed]
- Schmitzová, J.; Klaudiny, J.; Albert, S.; Schröder, W.; Schreckengost, W.; Hanes, J.; Júdová, J.; Simúth, J. A family of major royal jelly proteins of the honeybee Apis mellifera L. Cell. Mol. Life Sci. 1998, 54, 1020–1030. [Google Scholar] [CrossRef] [PubMed]
- Bitondi, M.M.G.; Simões, Z.L.P. The relationship between level of pollen in the diet, vitellogenin and juvenile hormone titres in Africanized Apis mellifera workers. J. Apic. Res. 1996, 35, 27–36. [Google Scholar] [CrossRef]
- Alaux, C.; Dantec, C.; Parrinello, H.; Y., L.C. Nutrigenomics in honey bees: Digital gene expression analysis of pollen's nutritive effects on healthy and varroa-parasitized bees. BMC Genomics 2011, 12, 496. [Google Scholar] [CrossRef]
- Ament, S.A.; Corona, M.; Pollock, H.S.; Robinson, G.E. Insulin signaling is involved in the regulation of worker division of labor in honey bee colonies. Proc. Natl. Acad. Sci. U. S. A. 2008, 105, 4226–4231. [Google Scholar] [CrossRef] [PubMed]
- Li, J.; Heerman, M.C.; Evans, J.D.; Rose, R.; Li, W.; Rodríguez-García, C.; DeGrandi-Hoffman, G.; Zhao, Y.; Huang, S.; Li, Z.; et al. Pollen reverses decreased lifespan, altered nutritional metabolism and suppressed immunity in honey bees (Apis mellifera) treated with antibiotics. J. Exp. Biol. 2019, 222. [Google Scholar] [CrossRef]
- Kim, H.; Frunze, O.; Lee, J.H.; Kwon, H.W. Enhancing honey bee health: Evaluating pollen substitute diets in field and cage experiments. Insects 2024, 15. [Google Scholar] [CrossRef]
- Frunze, O.; Kim, H.; Lee, J.-H.; Kwon, H.-W. The effects of artificial diets on the expression of molecular marker genes related to honey bee health. Int. J. Mol. Sci. 2024, 25, 4271. [Google Scholar] [CrossRef]
- DeGrandi-Hoffman, G.; Chen, Y.; Huang, E.; Huang, M.H. The effect of diet on protein concentration, hypopharyngeal gland development and virus load in worker honey bees (Apis mellifera L.). J. Insect Physiol. 2010, 56, 1184–1191. [Google Scholar] [CrossRef]
- Branchiccela, B.; Castelli, L.; Corona, M.; Díaz-Cetti, S.; Invernizzi, C.; Martínez de la Escalera, G.; Mendoza, Y.; Santos, E.; Silva, C.; Zunino, P.; et al. Impact of nutritional stress on the honeybee colony health. Sci. Rep. 2019, 9, 10156. [Google Scholar] [CrossRef]
- De Jong, D.; Roma, D.D.; Gonçalves, L.S. A comparative analysis of shaking solutions for the detection of Varroa jacobsoni on adult honeybees. Apidologie 1982, 13, 297–306. [Google Scholar] [CrossRef]
- De Groot, A.P. Amino acid requirements for growth of the honeybee (Apis mellifica L.). Experientia 1952, 8, 192–194. [Google Scholar] [CrossRef] [PubMed]
- Koleoglu, G.; Goodwin, P.H.; Reyes-Quintana, M.; Hamiduzzaman, M.M.; Guzman-Novoa, E. Varroa destructor parasitism reduces hemocyte concentrations and prophenol oxidase gene expression in bees from two populations. Parasitol. Res. 2018, 117, 1175–1183. [Google Scholar] [CrossRef]
- RStudio: Integrated Development for R; RStudio, PBC: Boston, MA, 2020. Available online: http://www.rstudio.com/ (accessed on 1 October 2023).
- Amdam, G.V.; Omholt, S.W. The regulatory anatomy of honeybee lifespan. J. Theor. Biol. 2002, 216, 209–228. [Google Scholar] [CrossRef] [PubMed]
- de Miranda, J.R.; Genersch, E. Deformed wing virus. J. Invertebr. Pathol. 2010, 103 Suppl 1, S48–S61. [Google Scholar] [CrossRef]
- Ruedenauer, F.A.; Biewer, N.W.; Nebauer, C.A.; Scheiner, M.; Spaethe, J.; Leonhardt, S.D. Honey Bees Can Taste Amino and Fatty Acids in Pollen, but Not Sterols. Front. ecol. evol. 2021, 9, 684175. [Google Scholar] [CrossRef]
- Locke, B.; Semberg, E.; Forsgren, E.; de Miranda, J.R. Persistence of subclinical deformed wing virus infections in honeybees following Varroa mite removal and a bee population turnover. PLoS ONE 2017, 12, e0180910. [Google Scholar] [CrossRef]
Figure 1.
Timeline of experimental design. The arrows' red lines indicate the ages at which the bees were collected for molecular analysis (n=9) and hemocyte measurements (n=5). Bee survival and food consumption were recorded for 45 days.
Figure 1.
Timeline of experimental design. The arrows' red lines indicate the ages at which the bees were collected for molecular analysis (n=9) and hemocyte measurements (n=5). Bee survival and food consumption were recorded for 45 days.
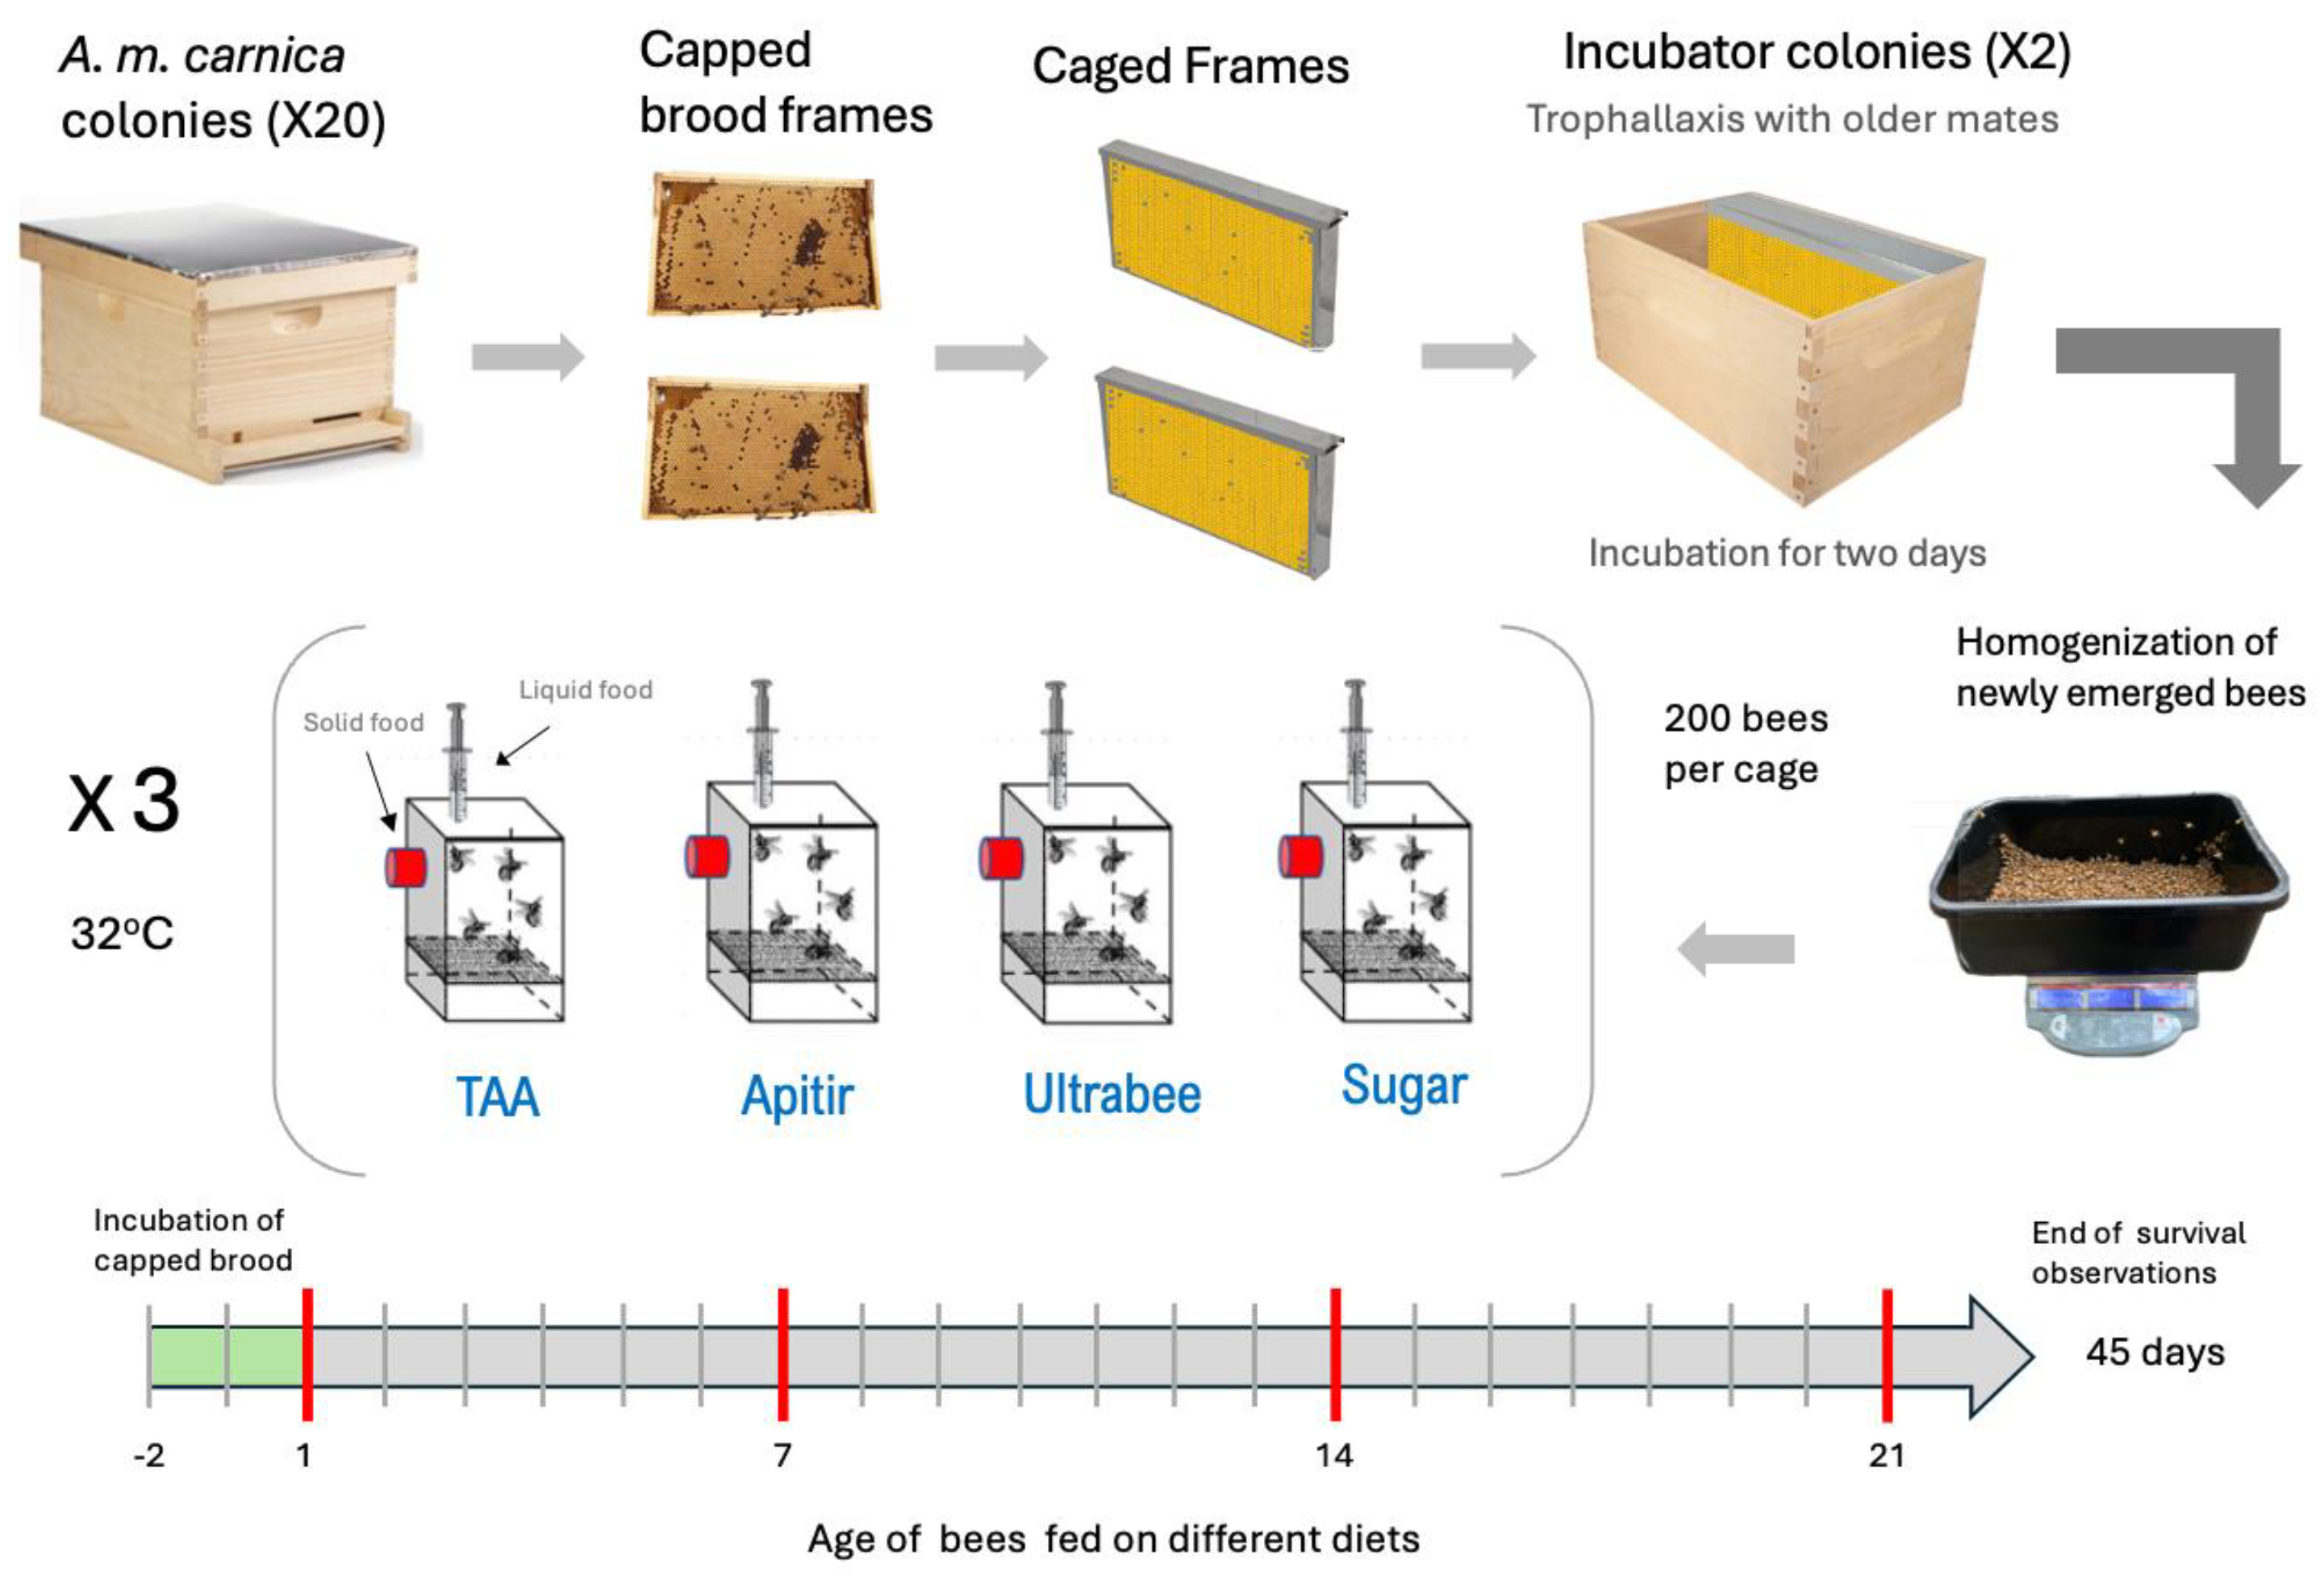
Figure 2.
Survival probability and average mortality of honey bees on different types of pollen substitutes A. Kaplan-Meier survival probability model. The y-axis represents the survival probability, while the x-axis shows the age of the bees. The dotted black lines indicate the day when 50% of the bees died in each treatment (LD50). B. Average mortality of bees given different treatments. Kruskal-Wallis test levels of significance: p < 0.05 (*), p < 0.01 (**), and p < 0.001 (***).
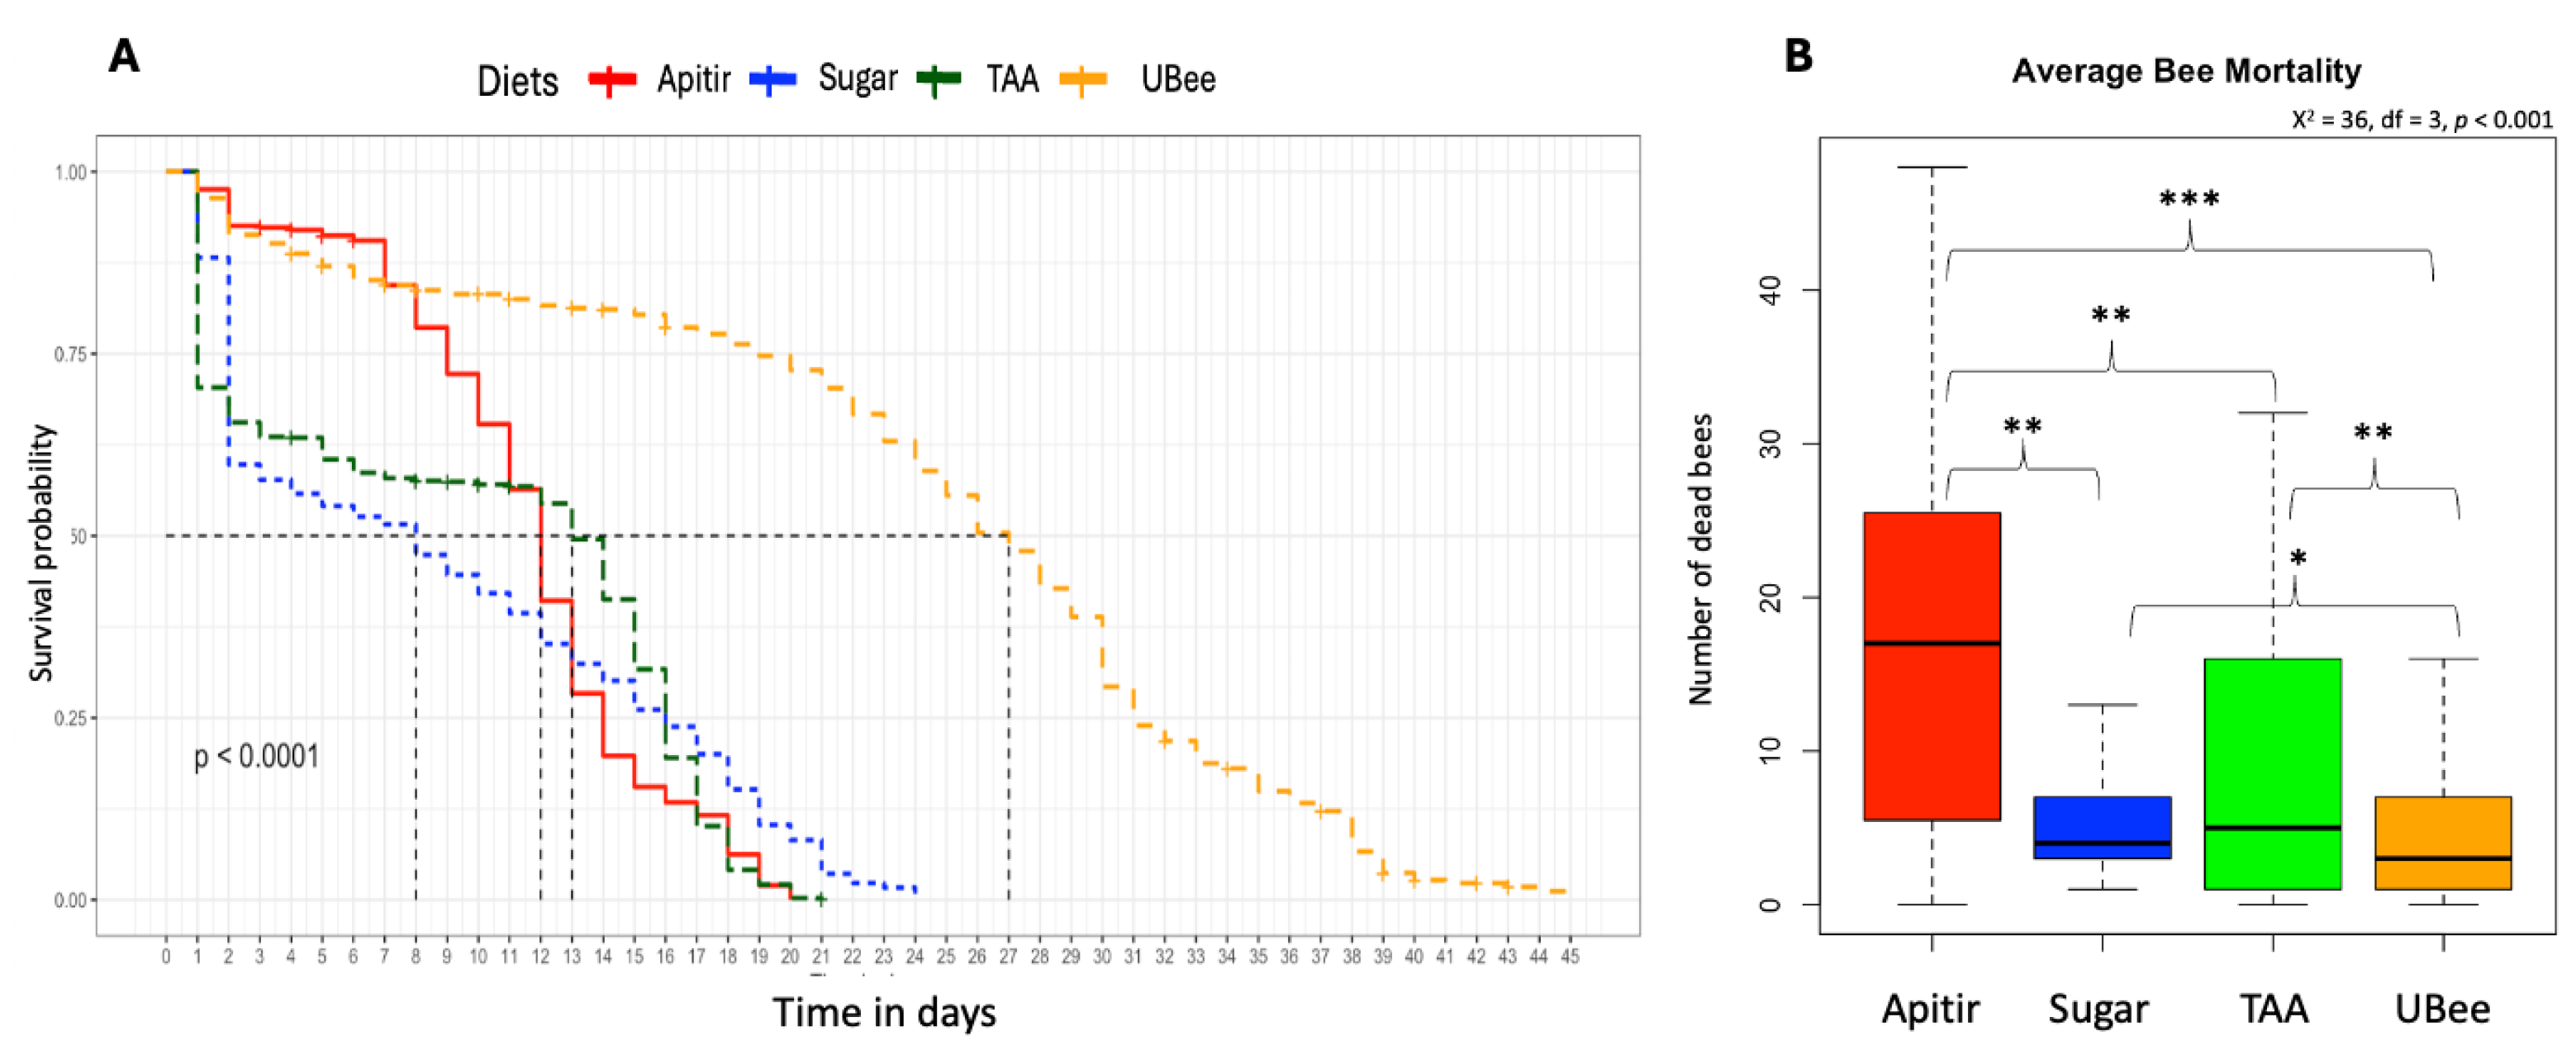
Figure 3.
Honey bee diet consumption. The y-axes indicate diet consumption in grams. Box plots represent the first and third interquartile ranges, with a line representing the median. Whiskers include the values of 90% of the samples. Level of significance: p < 0.05*, p < 0.01**, p < 0.001***.
Figure 3.
Honey bee diet consumption. The y-axes indicate diet consumption in grams. Box plots represent the first and third interquartile ranges, with a line representing the median. Whiskers include the values of 90% of the samples. Level of significance: p < 0.05*, p < 0.01**, p < 0.001***.
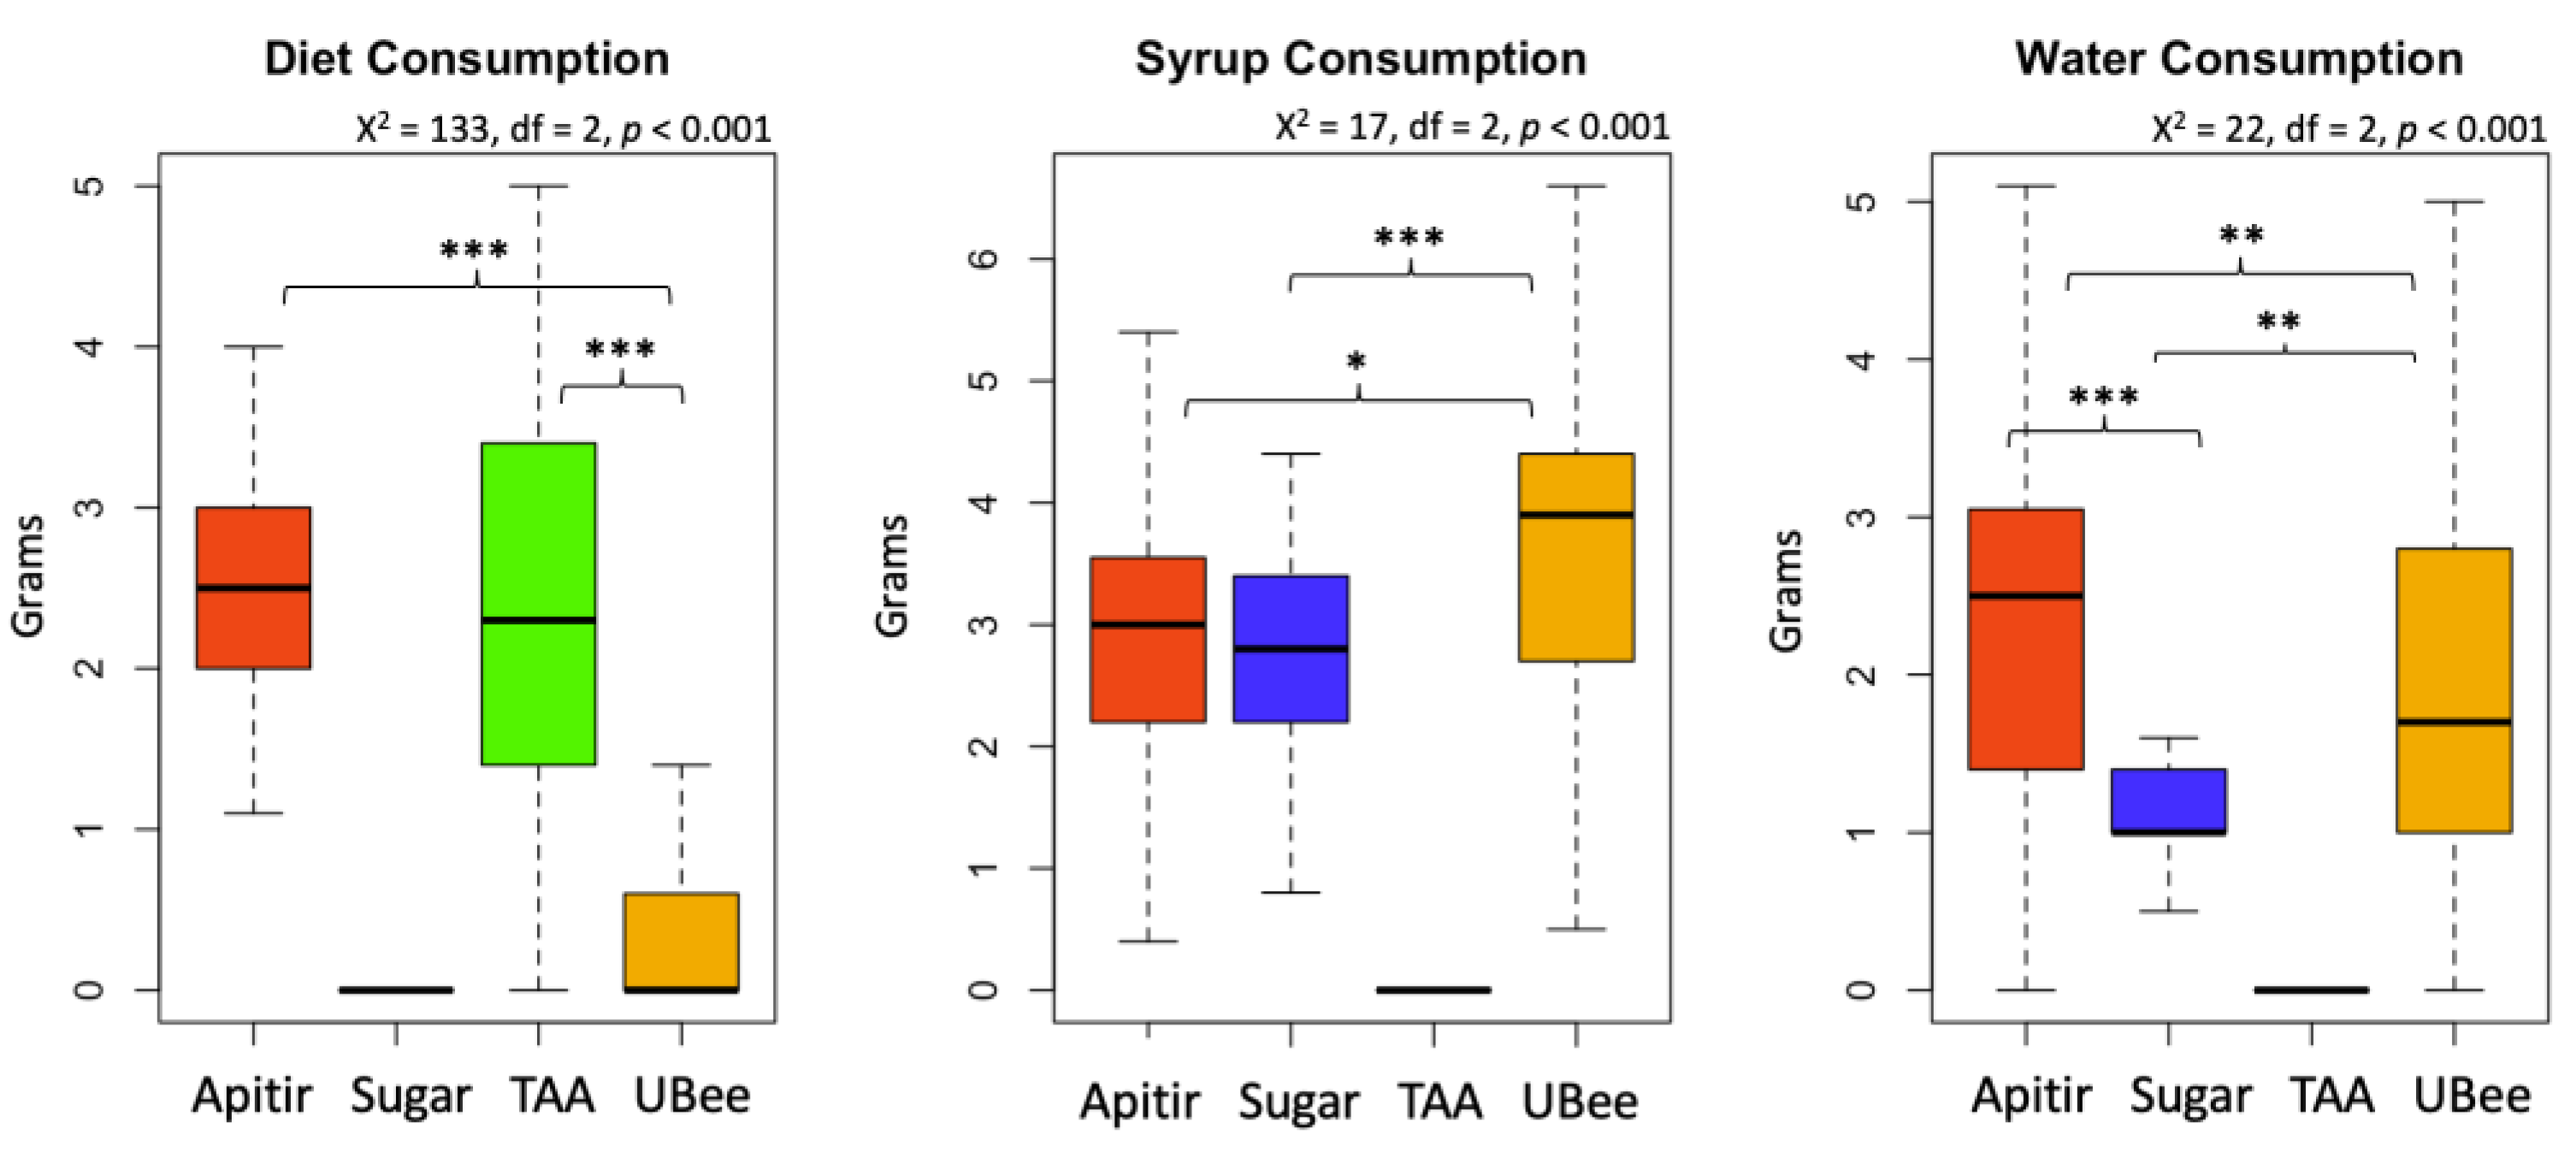
Figure 4.
Average hemocyte number. The y-axis represents the hemocyte count per μl of hemolymph, while the x-axis shows the groups of bees fed with different pollen substitutes in 1-4 week old bees. Hemocyte counts were not conducted for the bees fed with Apitir due to a limited number of surviving individuals. Different letters (a, b) indicate significant differences (Krustal-Wallis test).
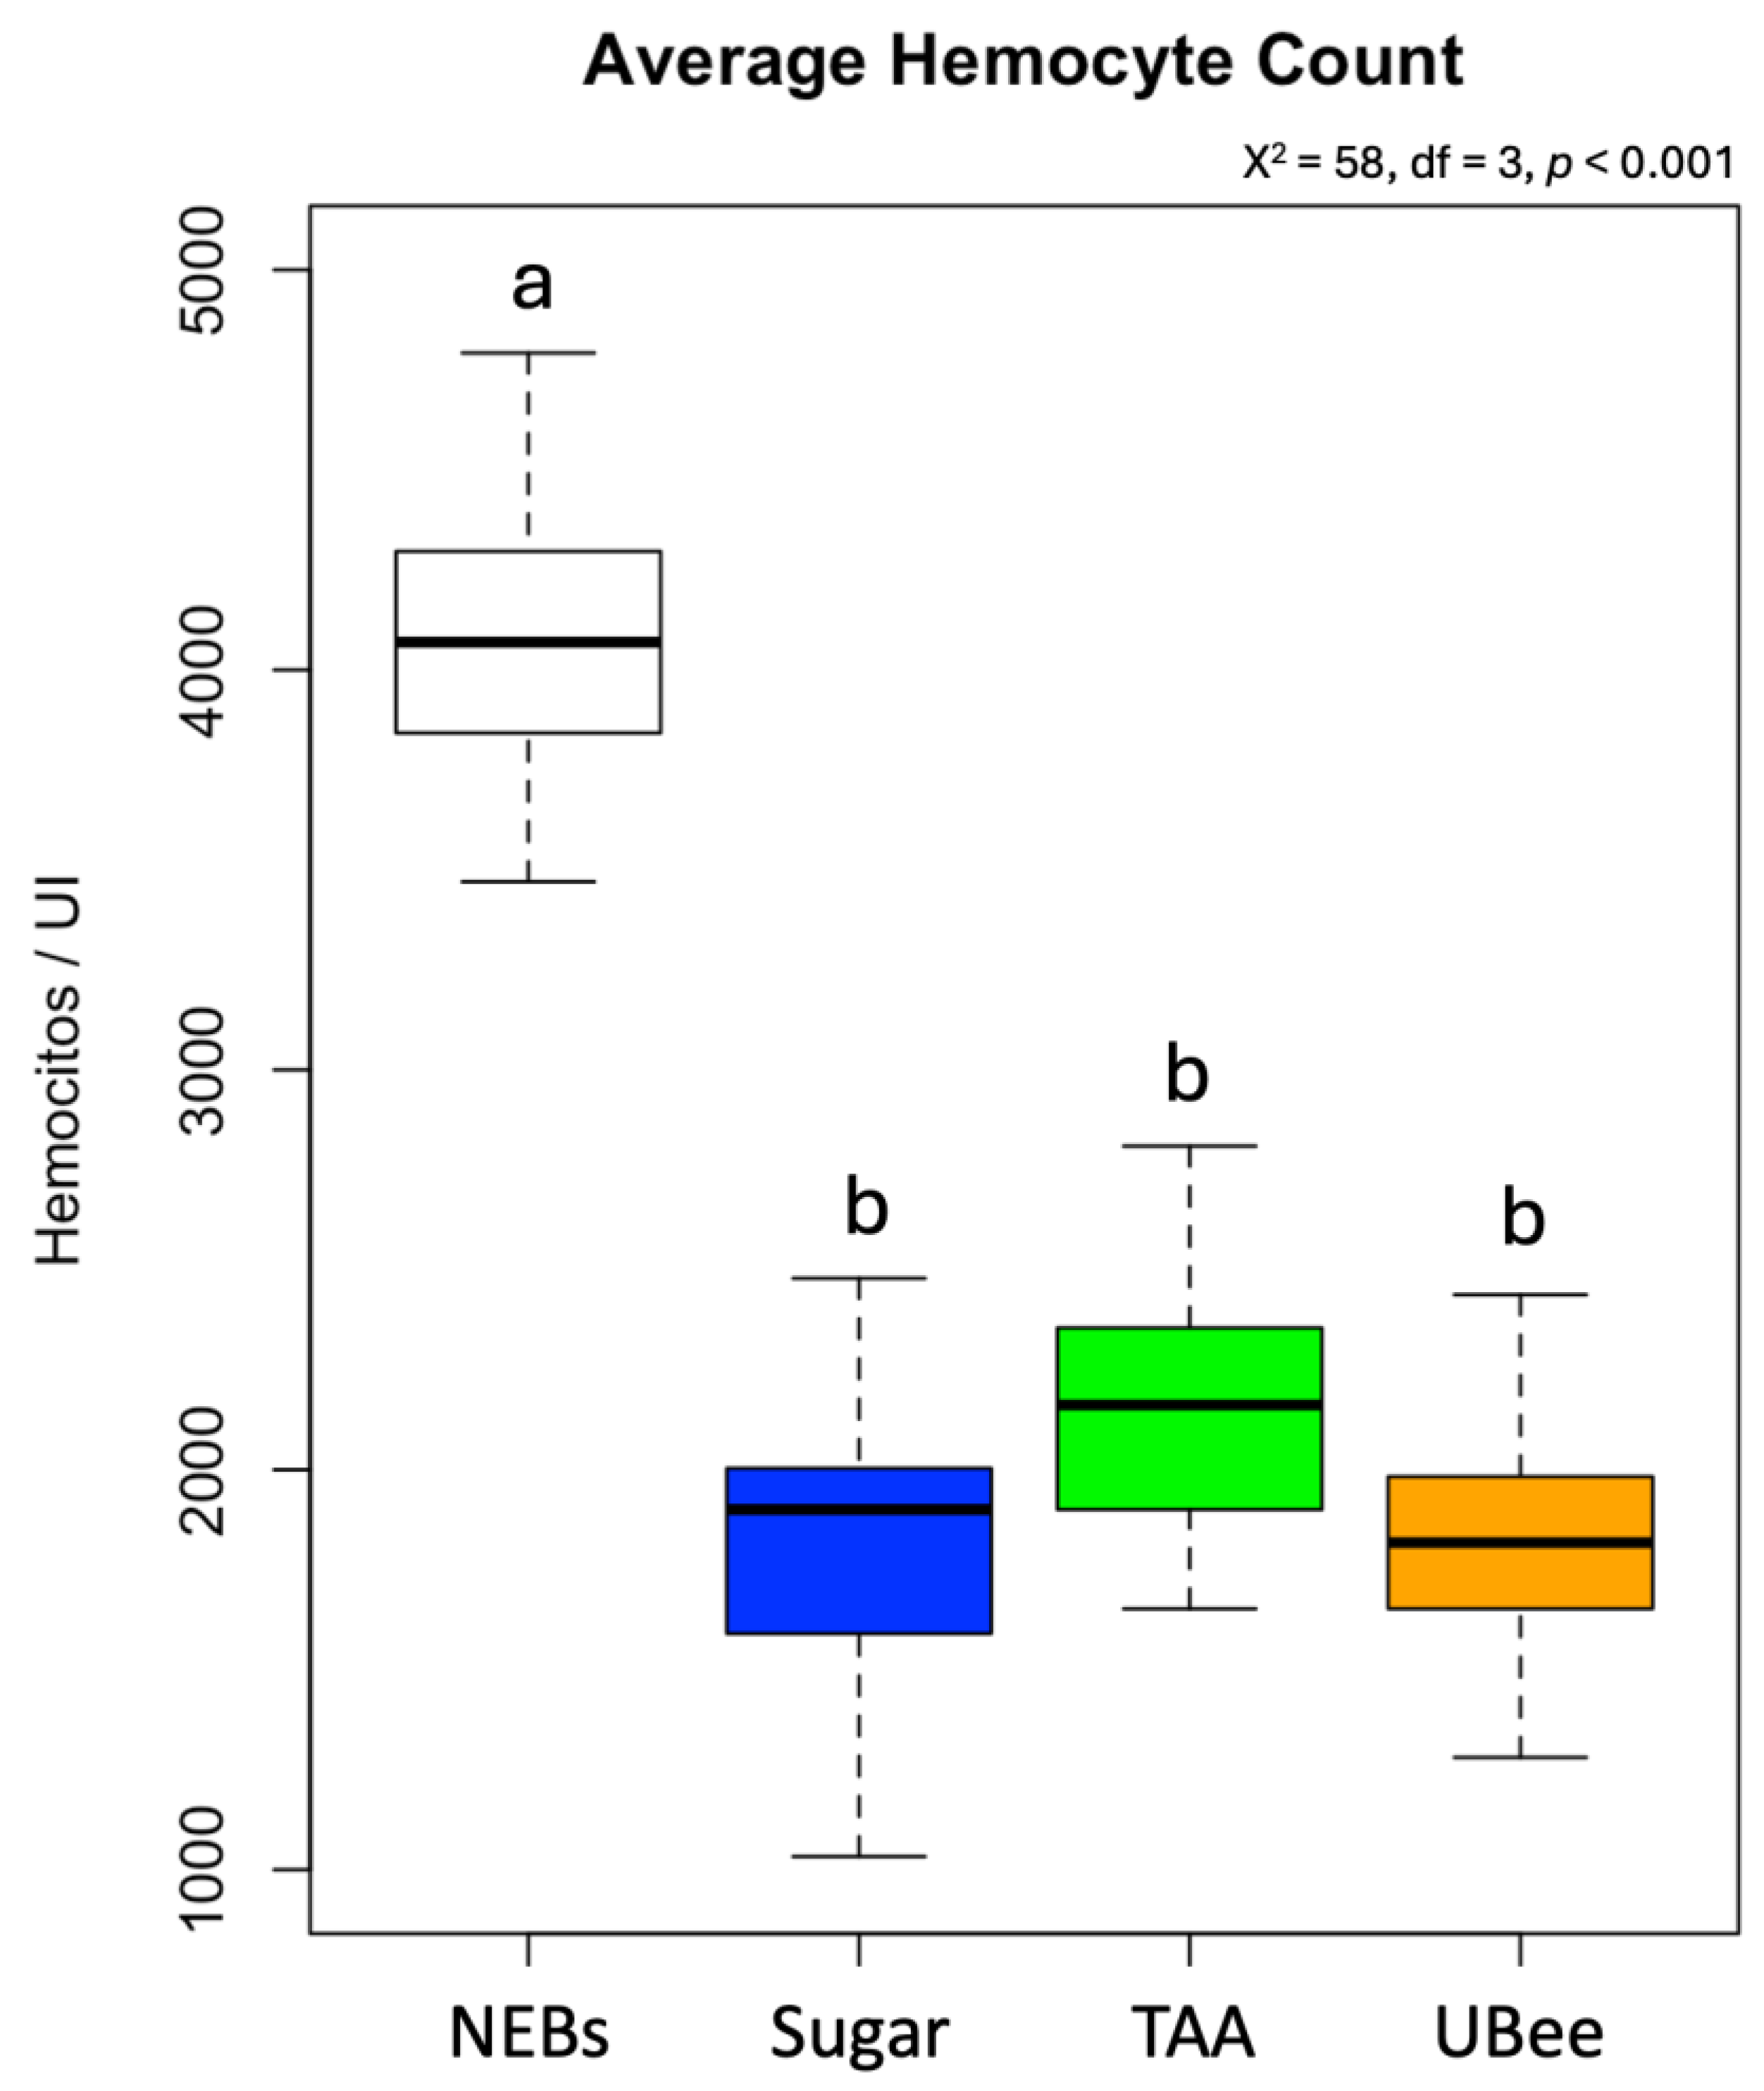
Figure 5.
Relative vg mRNA levels. The y-axis represents log10-transformed relative expression levels, while the x-axis displays the groups of bees fed with different pollen substitutes collected after 1, 2, and 3 weeks (W1-W3). Newly emerged bees (NEBs) were used as a control. The ribosomal protein S5 (rps5) gene was used as an internal control for qPCR measurements. The graphs' boxes show the first and third interquartile ranges, with a line representing the median. The whiskers encompass the values of 90% of the samples. Lowercase letters indicate significant differences between treatments (p < 0.05).
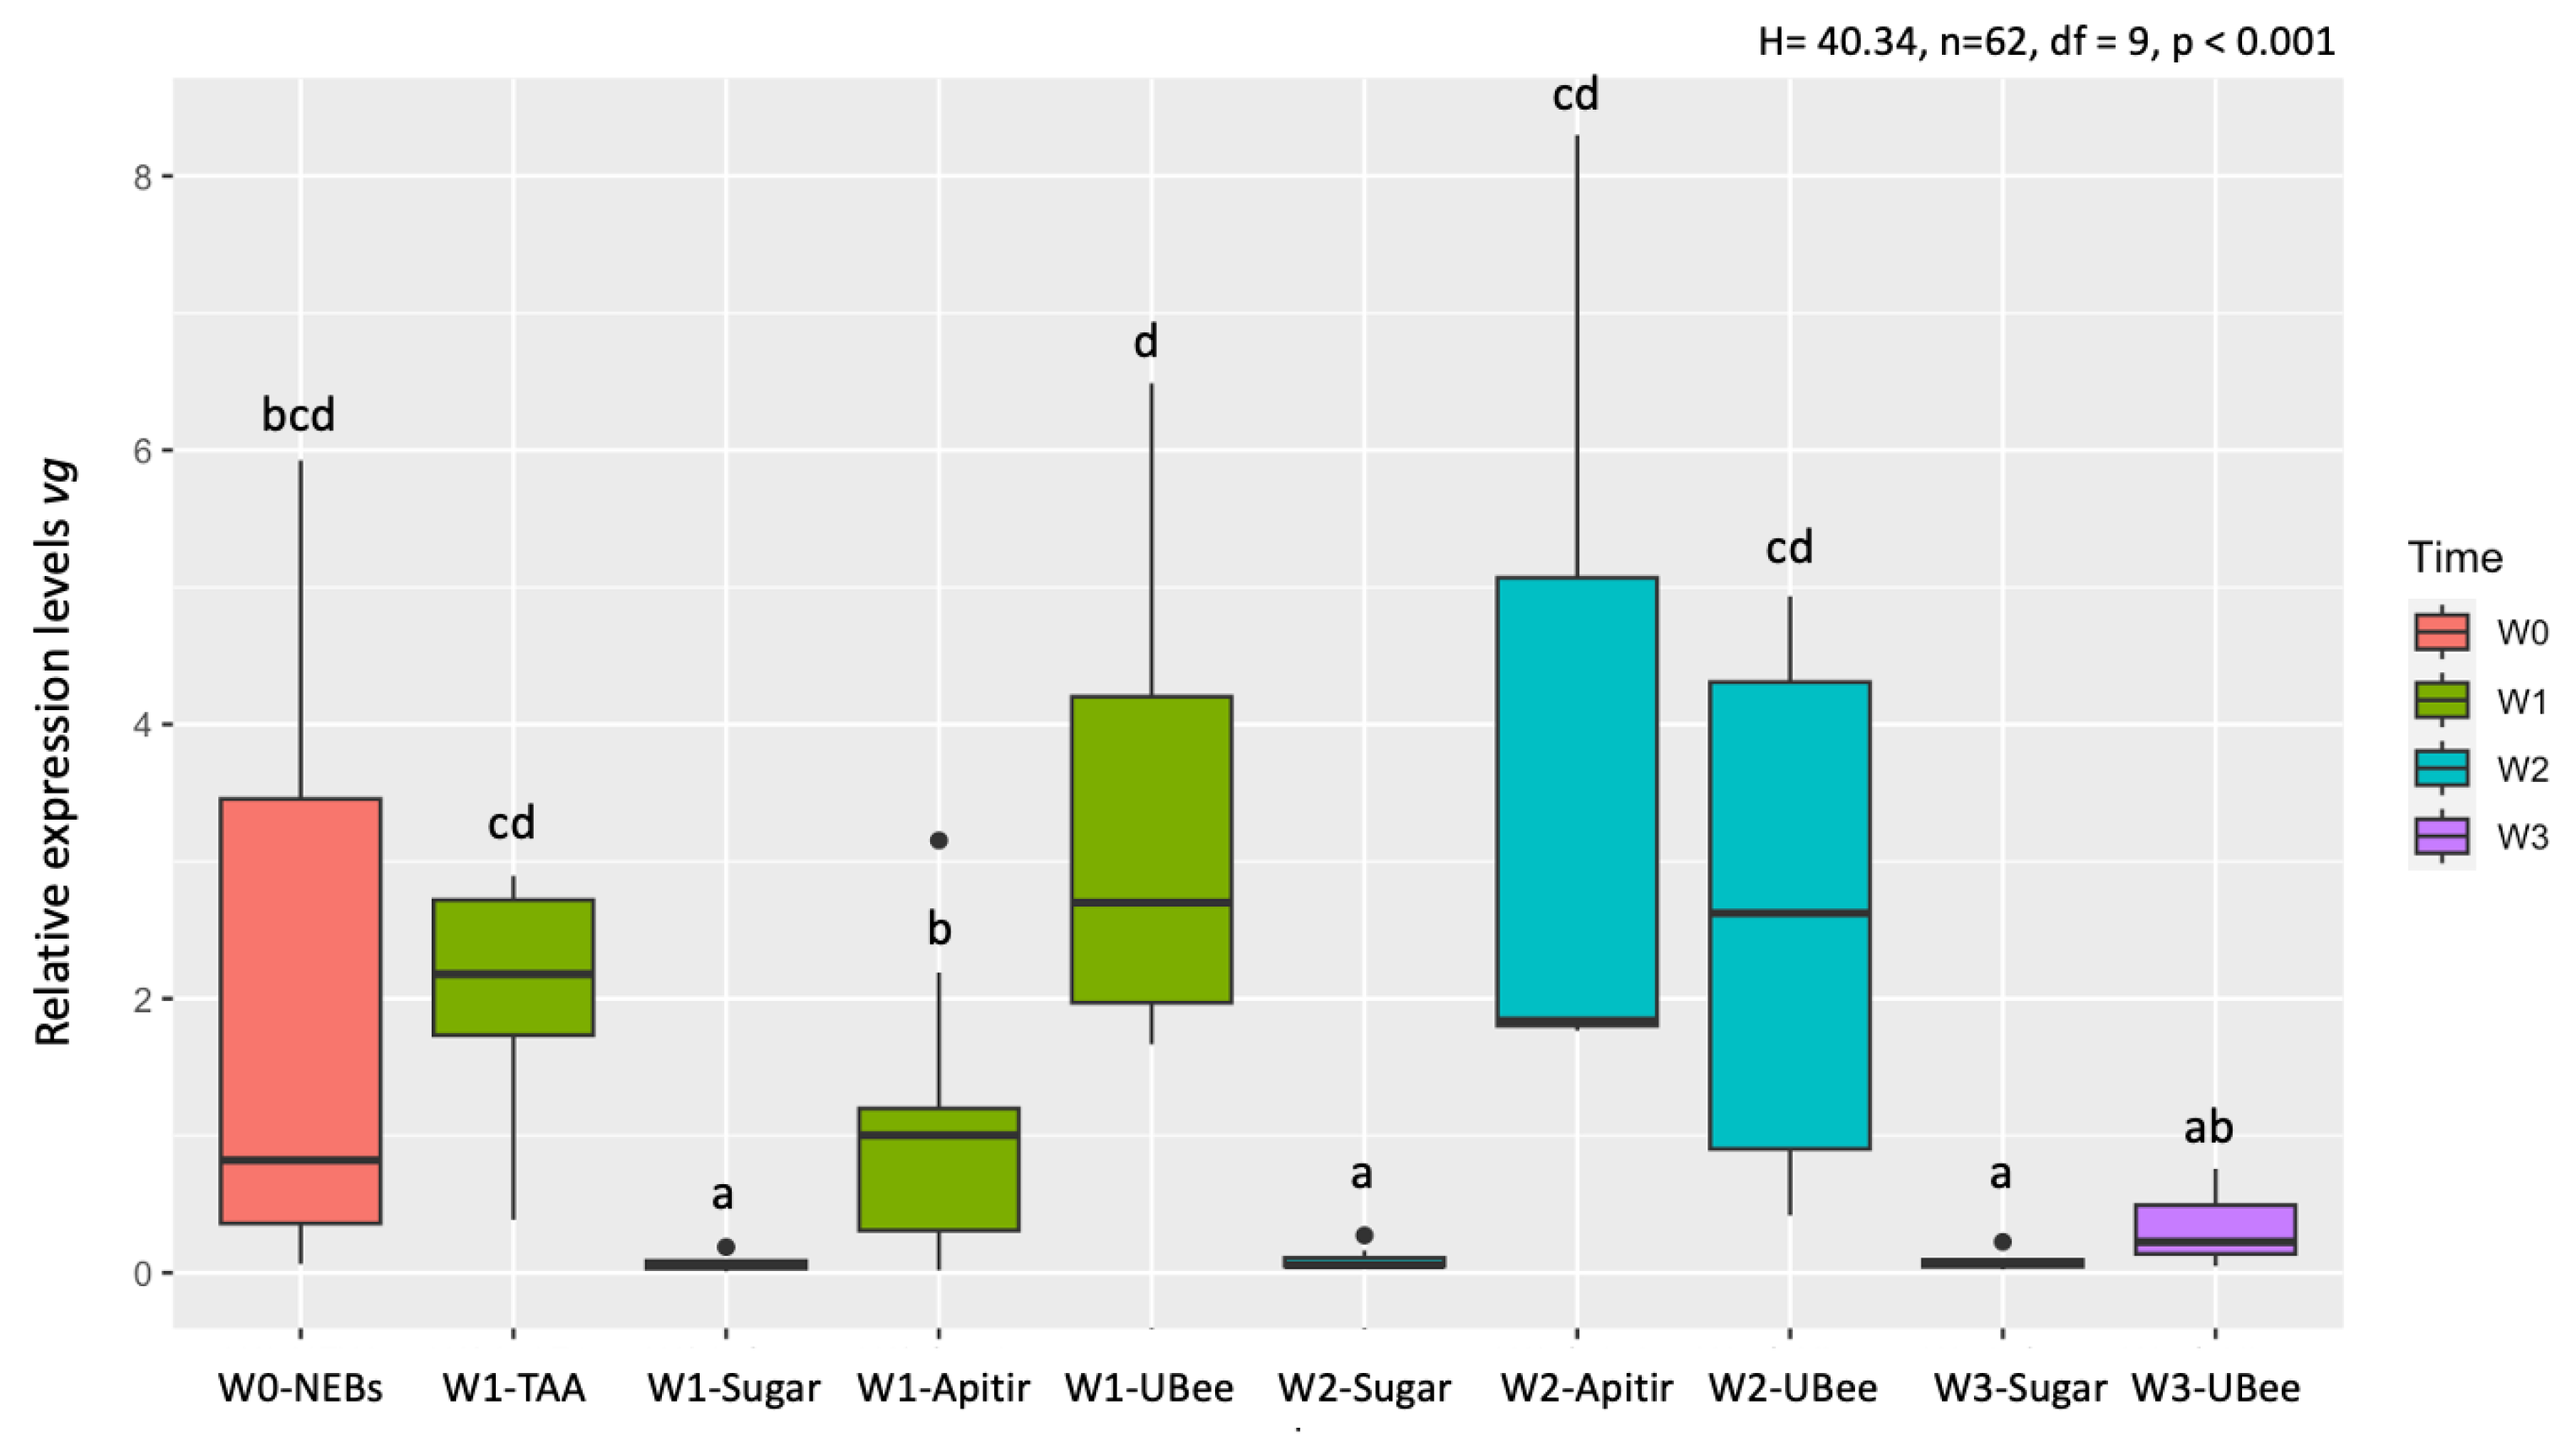
Figure 6.
Relative mrjp1 mRNA levels. The y-axis represents log10-transformed relative expression levels. The x-axis displays the groups of bees fed with different pollen substitutes. Lowercase letters indicate significant differences between treatments (p < 0.05).
Figure 6.
Relative mrjp1 mRNA levels. The y-axis represents log10-transformed relative expression levels. The x-axis displays the groups of bees fed with different pollen substitutes. Lowercase letters indicate significant differences between treatments (p < 0.05).
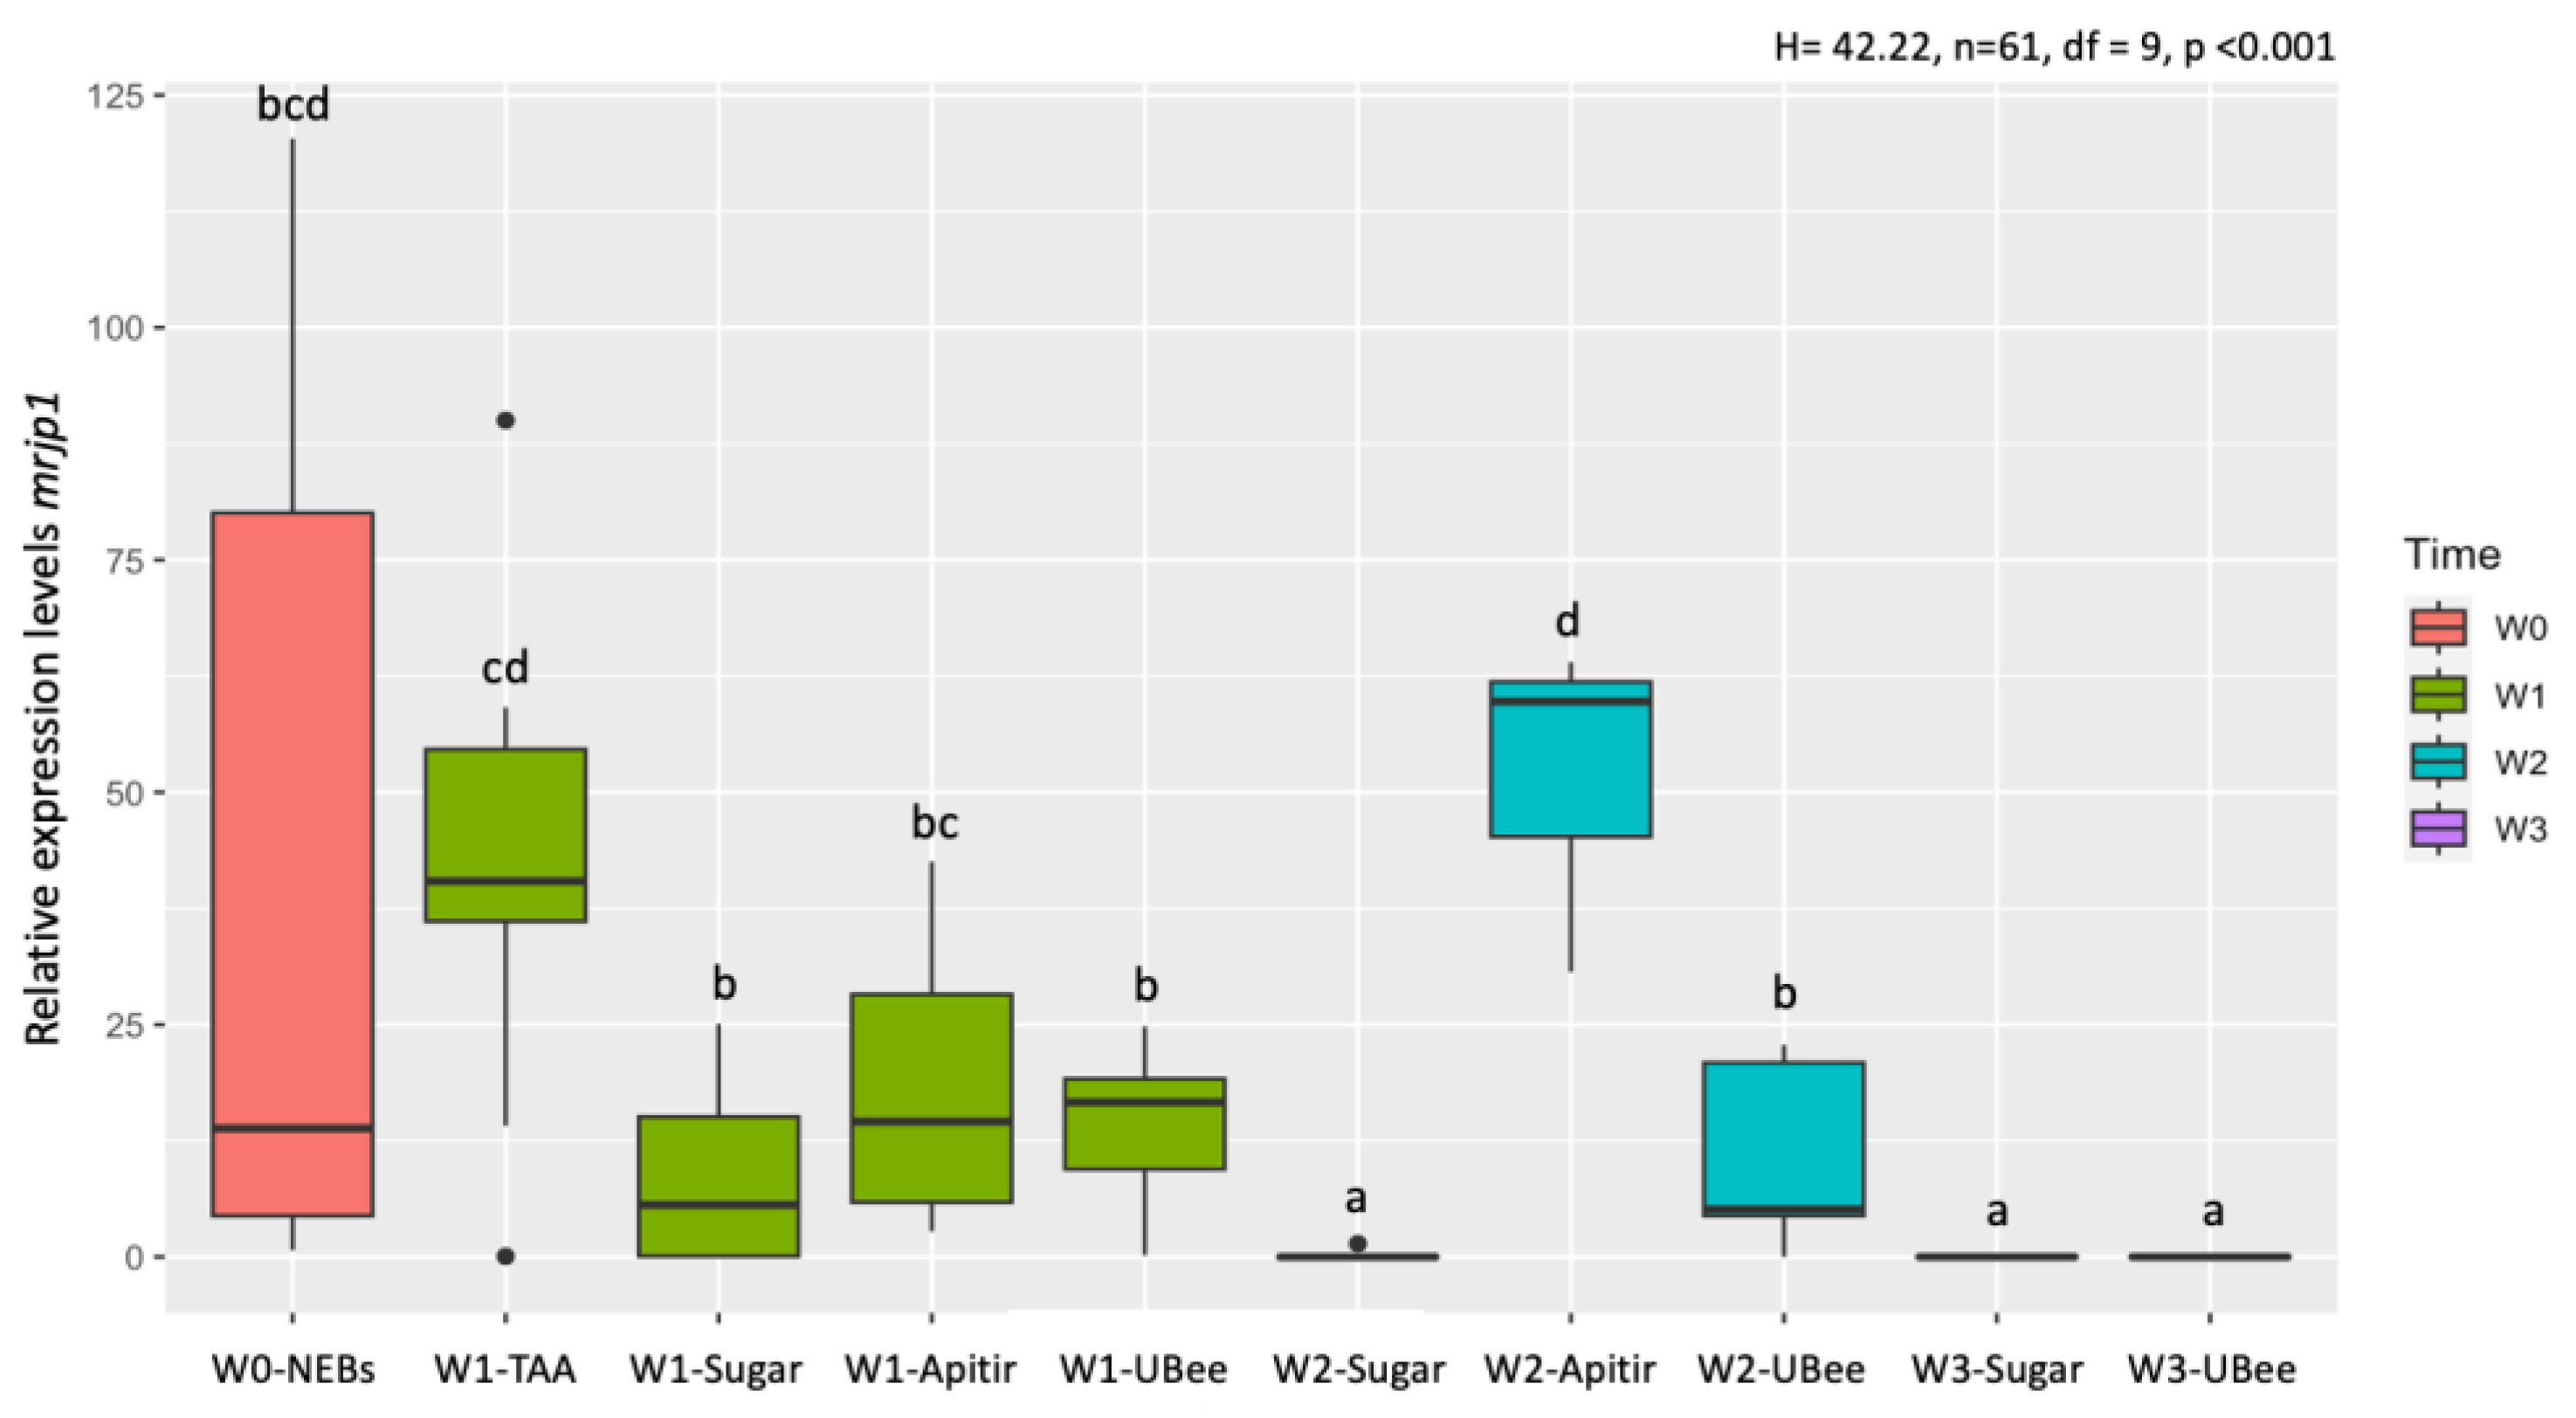
Figure 7.
Relative DWV mRNA levels. The y-axis represents log10-transformed relative expression levels. The x-axis displays the groups of bees fed with different pollen substitutes. Lowercase letters indicate significant differences between treatments (p < 0.05).
Figure 7.
Relative DWV mRNA levels. The y-axis represents log10-transformed relative expression levels. The x-axis displays the groups of bees fed with different pollen substitutes. Lowercase letters indicate significant differences between treatments (p < 0.05).
Disclaimer/Publisher’s Note: The statements, opinions and data contained in all publications are solely those of the individual author(s) and contributor(s) and not of MDPI and/or the editor(s). MDPI and/or the editor(s) disclaim responsibility for any injury to people or property resulting from any ideas, methods, instructions or products referred to in the content. |
© 2025 by the authors. Licensee MDPI, Basel, Switzerland. This article is an open access article distributed under the terms and conditions of the Creative Commons Attribution (CC BY) license (http://creativecommons.org/licenses/by/4.0/).
Copyright: This open access article is published under a Creative Commons CC BY 4.0 license, which permit the free download, distribution, and reuse, provided that the author and preprint are cited in any reuse.


