Submitted:
17 February 2025
Posted:
18 February 2025
You are already at the latest version
Abstract
Sulfur is an essential element for biological molecules, with sulfate as the primary sulfur source for plants. Under sulfate-deficiency, plants undergo physiological, metabolic, transcriptional, and post-transcriptional changes. Although Solanum lycopersicum (tomato) exhibits extensive transcriptome reprogramming during sulfate deficiency, the role of microRNAs (miRNAs) in this response remains poorly explored. In this study, we analyzed miRNAs expression in tomato roots and leaves at 3- and 4-weeks post-sowing under sulfate-sufficient and sulfate-deficient conditions, leveraging a de novo annotation of miRNA genes in the SL4.0 genome. We identified several miRNAs showing tissue- and time-specific expression changes in response to sulfate deficiency, with a potential role in processes such as lignin, chlorophyll, and polysaccharides metabolism. Consistent with other plants, miR395 emerged as a key sulfur metabolism and transport regulator. Notably, we identified a novel miR395 target, SlERF2a, an Ethylene-Responsive Factor predicted to regulate numerous sulfate deficiency-responsive genes, including genes involved in plastid organization, detoxification, sulfur assimilation and starvation response. These results suggest a broader role for miR395 in sulfate-deficiency responses in tomato compared to other plants. This work provides new insights into the post-transcriptional regulation of sulfate-deficiency in tomato, providing an updated miRNA annotation for future studies on miRNA-mediated regulation in this relevant crop.
Keywords:
miRNAs
; Sulfur
; Sulfate deficiency
; Nutritional response
; Transcription factors
; Tomato
1. Introduction
Sulfur (S) is an essential nutrient for all living organisms, and a component of numerous biomolecules. These include the amino acids cysteine and methionine, and other molecules like glutathione, vitamins, cofactors, and secondary metabolites that play pivotal roles in vital cellular processes [1] In soils, sulfate is the primary source of S available to plants [2]. Plants take up sulfate primarily through the high-affinity transporters SULFATE TRANSPORTER1.1 (SULTR1;1) and SULTR1;2, with secondary contributions from SULTR2;1 [3]. The transporters SULTR2;1 and SULTR3;5 facilitate sulfate translocation to aerial tissues [4]. Additionally, transporters SULTR4;1 and SULTR4;2 enable the storage of S compounds in vacuoles, which serve as reservoirs for maintaining S homeostasis [3]. Within leaf tissues, sulfate is transported to chloroplasts, and ATP sulfurylase (ATPS) activates sulfate, producing adenosine 5'-phosphosulfate (APS). APS reductase reduces APS to sulfite, and sulfite reductase further reduces it to sulfide [5]. Then, the enzyme OAS thiol-lyase catalyzes the reaction between O-acetyl serine (OAS) and sulfide to produce cysteine [6].
Current environmental regulations aiming to reduce S emissions and decrease the use of S-containing pesticides have led to a marked decline in S deposition in soils [7]. This has created scenarios where insufficient sulfate is available to meet crop demands [7]. Sulfate deficiency has severe agronomic consequences, which have been extensively documented [8,9,10,11]. Plants experiencing sulfate deficiency exhibit growth repression and reduced crop yields [12]. Moreover, sulfate deficiency negatively impacts photosynthetic efficiency and chlorophyll content, directly affecting plant health and reducing the nutritional quality of harvested crops [7,13].
The sulfate deficiency triggers transcriptomic changes described mainly in the model plant Arabidopsis thaliana and a limited number of crop plants [14]. These studies have uncovered a diverse array of genes involved not only in S-related metabolism but also in processes linked to plant growth, hormonal regulation, defense mechanisms, and response to other nutrients [10,15,16,17,18]. SULFATE LIMITATION 1 (SLIM1) has been identified as a central transcription factor (TF) controlling gene expression changes in response to sulfate deficiency [17]. In addition, several other TFs have been proposed as regulators of sulfate deficiency-responsive genes in A. thaliana, suggesting the role of complex transcriptional networks modulating response to S deficiency [19].
Besides transcriptional regulation, post-transcriptional control of non-coding small RNAs (sRNAs) and microRNAs (miRNAs) serves as a crucial checkpoint in diverse cellular regulatory processes [20]. Post-transcriptional regulation participates in a wide array of biological processes, such as stress adaptation, floral development transitions, and immune responses, underscoring their multifaceted role in plant physiology and development [21,22,23,24]. sRNAs precursors are transcribed in the nucleus by RNA-Polymerase II [25,26]. Precursors are processed in the nucleus by DICER-like RNAse III proteins to produce an sRNA of 21-22 nucleotides of length [27]. sRNAs are exported to the cytoplasm for their functional activity [28,29]. miRNA interacts with ARGONAUTE (AGO) in a complex called the RNA-induced silencing complex (RISC) [30]. miRNA guides RISC to a complementary mRNA, where AGO slices it, triggering the mRNA degradation [31,32,33].
In the sulfate deficiency response, miRNA miR395 plays a critical role in the root and shoot tissues of A. thaliana. miR395 is responsible for modulating the expression of sulfate-responsive genes, including ATPS1, ATPS3, and ATPS4, and the sulfate transporter SULTR2;1 [23,34]. Notably, miR395 exists in multiple isoforms, all upregulated under sulfate-deficiency conditions [23]. The regulatory function of miR395 over these targets extends beyond A. thaliana. It has been observed in other species such as Sorghum bicolor, Brassica napus, Oryza sativa, Medicago truncatula, and Solanum lycopersicum, indicating a conserved regulatory mechanism across diverse plant lineages [35,36,37,38,39]. Additionally, SLIM1 has been identified as a positive regulator of miRNA395 expression, further integrating miR395 into the broader regulatory network governing S homeostasis [40].
In addition to miR395, several other miRNAs respond to S deficiency [41]. However, their roles in regulating gene expression under S deficiency remain less explored. In A. thaliana, miRNAs from miR160, miR167, miR169, miR173, miR319, miR395, miR397, miR398, miR399, miR408, miR771, miR827, miR837, miR841, miR857, miR2111, miR2119, miR5632, miR5638, and miR8172 families are involved in S-response [42]. These families are differentially expressed in response to S deficiency [42]. In B. napus, members of the miR156, miR160, miR164, miR167, miR168, and miR394 families show differentially expression under S-limitation [35]. Interestingly, despite A. thaliana and B. napus belonging to the Brassicaceae family, both show miRNA families in response to S deficiency. The difference between those close species suggests that miRNA-mediated responses to S-deficiency may be plant-specific. The response specificity reflects a difference in evolutionary and/or physiological adaptations. This underscores the importance of conducting further studies to unravel how miRNAs regulate S deficiency across diverse plant species.
Solanum lycopersicum (tomato) is one of the most important vegetable crops globally, with annual human consumption exceeding 38.4 million tons, averaging 4.9 kg per capita [43]. Beyond its agricultural importance, the tomato is widely recognized as a model plant for studying fruit ripening, plant metabolism, and secondary metabolite biosynthesis [44,45]. Studies on sulfate limitation in tomato have revealed its substantial impact on plant growth and physiology. Reduced sulfate availability leads to significant growth reduction, characterized by decreased biomass accumulation, impaired photosynthetic rates, and diminished chlorophyll content [46]. These physiological disruptions are accompanied by the accumulation of reactive oxygen species and a marked decline in fruit yield [11,47,48,49]. To investigate the molecular mechanisms underlying these phenotypic changes, we previously conducted a comprehensive study on the transcriptomic changes induced by sulfate deficiency in tomato [50]. This analysis, which included temporal and organ-specific resolution, revealed important changes in the leaf and root transcriptomes.
Characterizing miRNAs in tomato post-transcriptional regulation remains an evolving field of study. Current studies in tomato have addressed the roles of miRNAs in various biological processes, including fruit ripening [51], drought tolerance [48], salt stress responses [52], and pathogen defense [53,54]. However, the functional characterization of miRNAs in tomato requires a comprehensive and robust annotation of miRNA genes. The latest release of the miRBase database [22.1] holds information on 112 tomato miRNA genes [55]. Besides miRBase, miRNA annotation has been expanded by analyzing available sRNA sequencing data and employing multiple bioinformatic pipelines [56,57,58,59]. However, these studies have gaps in information because they rely on outdated genome assembly versions (e.g., SL2.5, SL3.0, SL3.2). These miRNA annotations lack miRNA-mRNA interactions specific to the updated SL4.0 genome and iTAG4.0 annotation [60]. This underscores the need for further exploration leveraging the updated SL4.0 genome and iTAG4.0 annotation on tomato. The availability of an updated miRNA annotation for the SL4.0 genome is of special relevance to understanding the potential role of miRNAs in regulating sulfate-dependent gene expression in tomato, which remains largely unexplored.
In this study, we developed an updated miRNA annotation for the last tomato genome assembly available. Our results highlight the critical role of miRNAs in controlling sulfate-dependent gene expression. We place miR395 as a central regulator beyond sulfate transport and metabolism. Finally, we open the door to exploring the potential role of miRNAs in regulating other sulfate-dependent processes that are largely unexplored.
2. Results
2.1. Generation of an Updated miRNA Annotation for the SL4.0 Tomato Genome Assembly
Current information on tomato miRNA genes has been reported in different genome assemblies, including the SL2.5, SL3.0, and SL3.2 assemblies (The Tomato Genome Consortium, 2012, solgenomics.net). However, important advancements in sequencing technologies, such as single-molecule sequencing and high-throughput chromosome conformation capture contact maps (Hi-C), have enabled the generation of updated reference genome sequences [60,72]. Among these newer versions, the SL4.0 genome is a chromosome-level assembly produced by the International Tomato Genome Sequencing Project [60], available at the SolGenomics database [73]. Recently, the SL4.0 genome and iTAG4.0 annotation have been widely used in genomic research on tomato [74,75,76]. However, the SL4.0 genome lacks a miRNA annotation. We developed a new, updated, and unified miRNA annotation for the SL4.0 genome to fill this gap in knowledge. We integrated the miRNA described by Cardoso et al. [64] with miRNA from two databases: the miRBase database (available at mirbase.org, [55]) and the Plant smallRNA genes database (available at plantsmallrnagenes.science.psu.edu, [56]). By integrating this data, we generated an updated miRNA resource based on the SL4.0 genome available for further research on tomato.
We found 475 sequences of hairpin precursors among the three sources of miRNAs. These precursors were aligned using BLAST to determine their candidate genomic coordinates (Supplementary Table S1). For miRNA genes common to the three sources, locus IDs were assigned following this priority order: miRBase, Cardoso et al., and Plant smallRNA genes database. Discarding duplicate hairpin precursors, we conserved 347 sequences (Supplementary Table S2). We evaluated the quality of our miRNA annotation through the analysis of sRNA-seq reads mapping patterns to genomic loci (Supplementary Table S3) and aligned the reads to the SL4.0 genome using ShortStack, a de novo sRNA loci discovery tool [62,77,78]. ShortStack identifies miRNA loci based on the alignment patterns of reads to a reference genome [77]. For valid miRNA loci, the alignment should produce a discrete pattern to a single strand, clearly distinguishing a major species (mature miRNA) from the minor species (complementary miRNA), separated by a short distance. Moreover, ShortStack requires that the major species coincide with the typical sizes for DCR-produced miRNAs in plants (21-22 nt). We used Shorstack to discover miRNA from 128 tomato sRNA libraries in public repositories (Supplementary Table S3). We identified 109 miRNA loci de novo, 99 corresponding to previously annotated miRNA (Supplementary Table S4), and 10 first identified. We defined these 10 loci as novel miRNAs and assigned the identifier “sly-b4.0-sRNAcluster#_MIRNA” (Supplementary Table S2). The secondary structure analysis of the predicted precursor sequences for these novel miRNAs supports the presence of a typical stem-loop structure, supporting their potential as bona fide miRNAs (Supplementary Figure S1). Overall, we have developed a comprehensive miRNA annotation for the SL4.0 genome of the tomato genome. This annotation integrated state-of-the-art miRNA databases and de novo miRNA identification with validation of miRNA secondary structure and mature sequences (Supplementary Tables S2, S4, and S5).
2.2. miRNAs Are Regulated in a Tissue- and Time-Specific Manner in the Post-Transcriptional Response of Tomato to S Deficiency
Sulfate deficiency negatively impacts plant growth and development, inducing significant transcriptomic changes in tomato leaves and roots [50]. To understand the role of miRNAs in the post-transcriptional control of gene expression in response to sulfate deficiency, we grew tomato plants under sulfate-sufficient and sulfate-deficient conditions for 3 and 4 weeks. We extracted total RNA from roots and leaves under both conditions and sequenced the sRNA. We aligned sRNA-seq data to the SL4.0 tomato reference genome [60] using ShortStack [62], resulting in the identification of 94,723 sRNA clusters across all samples (Supplementary Table S6). Consistent with previous studies in plants [79,80,81,82], we observed typical sizes of plant sRNAs in our libraries, ranging between 20 and 24 nucleotides (Figure 1). We found similar distributions of reads between sulfate sufficiency and sulfate deficiency conditions in both roots and leaves (Figure 1A). This finding indicates that sulfate deficiency does not impact the size distribution of expressed sRNA species, contrasting to what has been reported under phosphate deficiency, where additional peaks of 19 nt -primarily derived from tRNAs- appear in roots as a response to this nutrient deficiency [83]. Across organs, we observed a shift in the distribution of sRNA reads, with leaves displaying a higher proportion of 22-nt species, whereas roots exhibited a sharp peak at 21-nt. This pattern aligns with findings from previous studies in tomato leaves [53,84,85].
We performed a Principal Component Analysis (PCA) to explore variations in sRNA expression profiles across samples (Figure 1B). For this analysis, we focused on sRNA counts within the 20-24 nt size range, which aligns with the typical size distribution of plant sRNAs. The PCA separates sulfate sufficiency from sulfate deficiency in leaves and roots. In leaves, we observed a further separation of sulfate-deficient samples based on time, distinguishing the 3-week and 4-week treatments. In contrast, root samples from both time points clustered closely together (Figure 1B). These results suggest that aerial tissues exhibit a more pronounced time-dependent response, consistent with previous findings for the mRNA component of the transcriptome [50].
To identify sulfate deficiency-responsive miRNAs in roots and leaves, we analyzed read counts mapped to our miRNA annotation using ShortStack and analyzed differential expression with the DESeq2 R package [63] (Supplementary Table S7). We identified 40 differentially expressed (DE) miRNAs (11.2 % of total annotated miRNAs) corresponding to 25 families (21.9% of total families) that exhibited changes in expression between sulfate sufficiency and deficiency conditions. The number of DE miRNAs varied depending on organ type and time point. Leaves showed a threefold increase in DE miRNAs at four weeks of sulfate deficiency compared to three weeks. Root DE miRNA levels were stable across both time points, matching the levels seen in leaves at three weeks. (Figure 2A). We observed a higher proportion of upregulated miRNA within the DE miRNA in response to S deficiency. This proportion of upregulated miRNA is inverse to the described mRNA repression in response to the S deficiency [50]. This inverse relationship is consistent with the established role of miRNAs as post-transcriptional repressors of gene expression, underscoring their potential involvement in fine-tuning the sulfate deficiency response.
Shared responses between tissues and time are the fewer percentages of DE miRNAs (Figure 2). Between 3 and 4 weeks in tissue-specific, leaves shared the induced sly-miR395b and novel miRNA sly-b4.0r1-14505 (5% of miRNAs). Between time, in 4 weeks tissues shared repressed sly-miR399a-4 and sly-miR408a (5% of miRNAs). In case of miRNA shared between multiple samples, induced sly-miR0472 has shared in leaves 4 weeks and roots 3 and 4 weeks (2.5 % of miRNAs), and repressed sly-miR169e has shared in 3- and 4-weeks leaves, and roots 3 weeks (2.5% of miRNAs). Interestingly, multiples miRNAs of miR395 family, and novel miRNA sly-b4.0r1-14493 has shared between all samples (Figure 2). Importantly, miR395 family is well-known for its role in controlling sulfate transport and metabolism in response to sulfate deficiency [23,38,40,86], suggesting a similar regulation in tomato.
A significant portion (65.9%, 27 miRNAs) of the DE miRNAs were unique to a specific organ and time point, demonstrating a transient and organ-specific response. Of those induced by sulfate deficiency, ten (sly-MIR1128, sly-MIR3627, sly-MIR8032, sly-MIR12519, sly-MIR10531, sly-MIR5302a, sly-MIR5302b, sly-MIR1446a, sly-MIR1446b, and sly-MIR5368) were exclusively found in leaves at four weeks, while one (sly-MIR164c) was found in roots at three weeks (Figure 2C Supplementary Table S7).
Several sulfate deficiency-responsive miRNAs belong to families known to respond to sulfur deficiency in other plants like A. thaliana, Chlamydomonas reinhardtii, Carica papaya, or B. napus [41], including miR395, miR167, miR397, miR408, miR399, miR827, miR164, miR171, and miR172. Some of these miRNAs also respond to other nutrient deficiencies, such as nitrogen (miR169, miR167, miR397, miR408, miR399, miR171, miR172, miR398, miR403, and miR390) or phosphorus (miR399, miR827), reflecting the known interactions between sulfate and these nutrients [39,50], as well as other nutrients like copper, zinc, manganese, iron, and boron (Fig 2C). Importantly, we identified miRNAs from families like miR1129, miR8032, miR12519, miR10531, miR5302, miR5358, miR9472, miR10528, miR12533, and miR10539, which have not been previously linked to sulfate or other nutrient deficiencies in plants (Fig 2C), suggesting novel regulatory roles for these miRNAs in sulfate deficiency responses.
2.3. Target Prediction of Differentially Expressed miRNAs Identifies Novel Pathways Involved in Tomato's Response to Sulfate Deficiency
To elucidate the role of miRNAs in regulating sulfate deficiency-responsive gene expression, we predicted targets for all DE miRNAs using psRNAtarget [68]. This tool employs a scoring schema that integrates complementary matching patterns between miRNAs and mRNAs, alongside an evaluation of target site accessibility through the unpaired energy factor (UPE) [68]. We restricted the analysis to mRNAs that exhibit differential expression by sulfate deficiency in leaves and roots (Supplementary Table S8). For this, we re-analyzed previously published sulfate deficiency datasets from Canales et al., [2020], updating the analysis to the SL4.0 genome and iTAG4.0 annotation, and identified DE genes (DEGs) in roots and leaves at three and four weeks after sowing (Supplementary Table S7). Target analysis resulted in the identification of 344 predicted DEGs for 40 DE miRNAs (27 miRNA families) with UPE </=3.5 to restrict analysis (Supplementary Table S8).
Further analysis revealed miRNA-target interactions with either consistent or inverse expression patterns in both tissues (Supplementary Table S9), enabling the construction of miRNA regulatory networks (Supplementary Figure S2,S3). In leaves, 21 miRNA families targeted 183 genes, including 11 upregulated miRNAs targeting 54 repressed DEGs and 34 induced DEGs, as well as 10 downregulated miRNAs targeting 55 repressed DEGs and 35 induced DEGs (Supplementary Figure S2, Supplementary Table S9). In roots, 7 miRNA families targeted 43 genes, with 3 induced miRNA families targeting 18 repressed DEGs and 13 induced DEGs, while 4 repressed miRNA families targeted 7 induced DEGs and 5 repressed DEGs (Supplementary Figure S3, Supplementary Table S9).
To further investigate the functional implications of these miRNA-target interactions, we performed Gene Ontology (GO) enrichment analysis on the predicted targets (Figure 3, Supplementary Table S10), focusing on global miRNA response between tissues, considering the miRNA and target expression patterns. In leaves, GO analysis of targets of S-induced miRNAs and their repressed DEGs highlighted processes related to DNA biosynthesis, repair, replication, chlorophyll biosynthesis, metabolism, and organelle fusion (Figure 3). Conversely, induced DEGs targeted by miRNAs were enriched in GO terms associated with sulfur starvation, sulfate assimilation, transport, polysaccharide biosynthesis, and mitochondrial transport (Figure 3). For targets of repressed miRNAs and their induced DEGs, enriched GO terms included lignin metabolism, phenylpropanoid metabolism, copper response, and oxygen radical response (Figure 3). In contrast, repressed DEGs were associated with lignin biosynthesis and catabolism, phenylpropanoid biosynthesis, secondary wall biogenesis, and response to jasmonic acid (Figure 3). In roots, targets of induced miRNAs and their repressed DEGs were implicated in cellular detoxification, polysaccharide biosynthesis, mitotic cytokinesis, and glucan metabolism (Figure 3C). Induced DEGs, conversely, were enriched in processes related to sulfate assimilation, cadmium response, and phosphorylation (Figure 3). Targets of repressed miRNAs and their induced DEGs showed GO enrichment for phosphate starvation response, protein-DNA organization, and transcriptional epigenetic regulation (Figure 3). At the same time, repressed DEGs were associated with cell growth, morphogenesis, and ethylene signaling (Figure 3). These results emphasize the complex regulatory roles of miRNAs in modulating diverse biological processes in response to sulfate deficiency in both leaves and roots.
2.4. Ethylene-Responsive Transcription Factor SlERF2a as a Novel Target of miRNA395 in the Tomato Sulfate Deficiency Response
TFs are central regulators of gene expression in organisms. In plants, several miRNAs are described to target members of one or more TF families, increasing the extent of miRNA-mediated expression regulation, moreover, diverse TF-controlling miRNAs are also nutrient-responsive [87]. We filtered miRNA-mRNA prediction analysis (Supplementary Table S8) with TF list in SL4.0 (Solgenomics.net) to aim into miRNA-TF regulation in S-response. Our analysis identified 17 TFs controlled by 15 miRNAs from 8 families in leaves, and 4 TFs controlled by 8 miRNAs from 2 families in roots (Supplementary figure S4A, Supplementary Table S11). Notably, two TF families has shared between tissues: Ethylene-responsive transcription factor (ERF) and nuclear transcription factor Y (NTF-Y). Interestingly, ERF family has described in S-response [14,87], suggesting an involvement in S-response in tomato. In addition, leaves shown TFs of ARF (2 TFs), WRKY (2 TFs), DOF (1 TF), Zinc-fingers (2 TFs), Homeobox (1 TF), Homeodomain (2 TFs), and SCR (1 TF) families, while roots shown one NAC TFs (Supplementary figure S4A, Supplementary Table S11).
To understand the full impact of miRNA regulation, we searched for targets of this group of TFs, using predicted tomato TF-target pairs obtained from the PlantRegMap in the PlantTFDB database [88]. TF-Target information was retrieved for five miRNA-targeted TFs (Supplementary figure S4B). In leaves, miR167 targeted Solyc02g037530 (Auxin response factor 8B), miR397 targeted Solyc09g008810 (Homeobox-leucine zipper protein ATHB-22), miR5302 targeted Solyc10g076460 (Homeodomain-like superfamily protein) (Supplementary Table S11), and miR395 target Solyc02g071130 (WRKY transcription factor [71]). Additionally, miR395 targeted Solyc07g054220 (Ethylene-responsive transcription factor SlERF2a) in both leaves and roots (Supplementary Table S11). GO term analysis was conducted to investigate TF regulation in the S-response (Supplementary Figure 4C-G, Supplementary table S12). Notably, Auxin Response Factor 8B, Homeodomain-like Superfamily Protein, and SlERF2a were identified as regulators of S-response genes. Interestingly, SlERF2a exhibited specific regulation of sulfur assimilation and response to sulfur starvation. Moreover, these TFs were regulated in both tissues. Due to its significant regulatory impact, SlERF2a was selected for further analysis, with predictions indicating it targets 278 DEGs in roots and 455 DEGs in leaves.
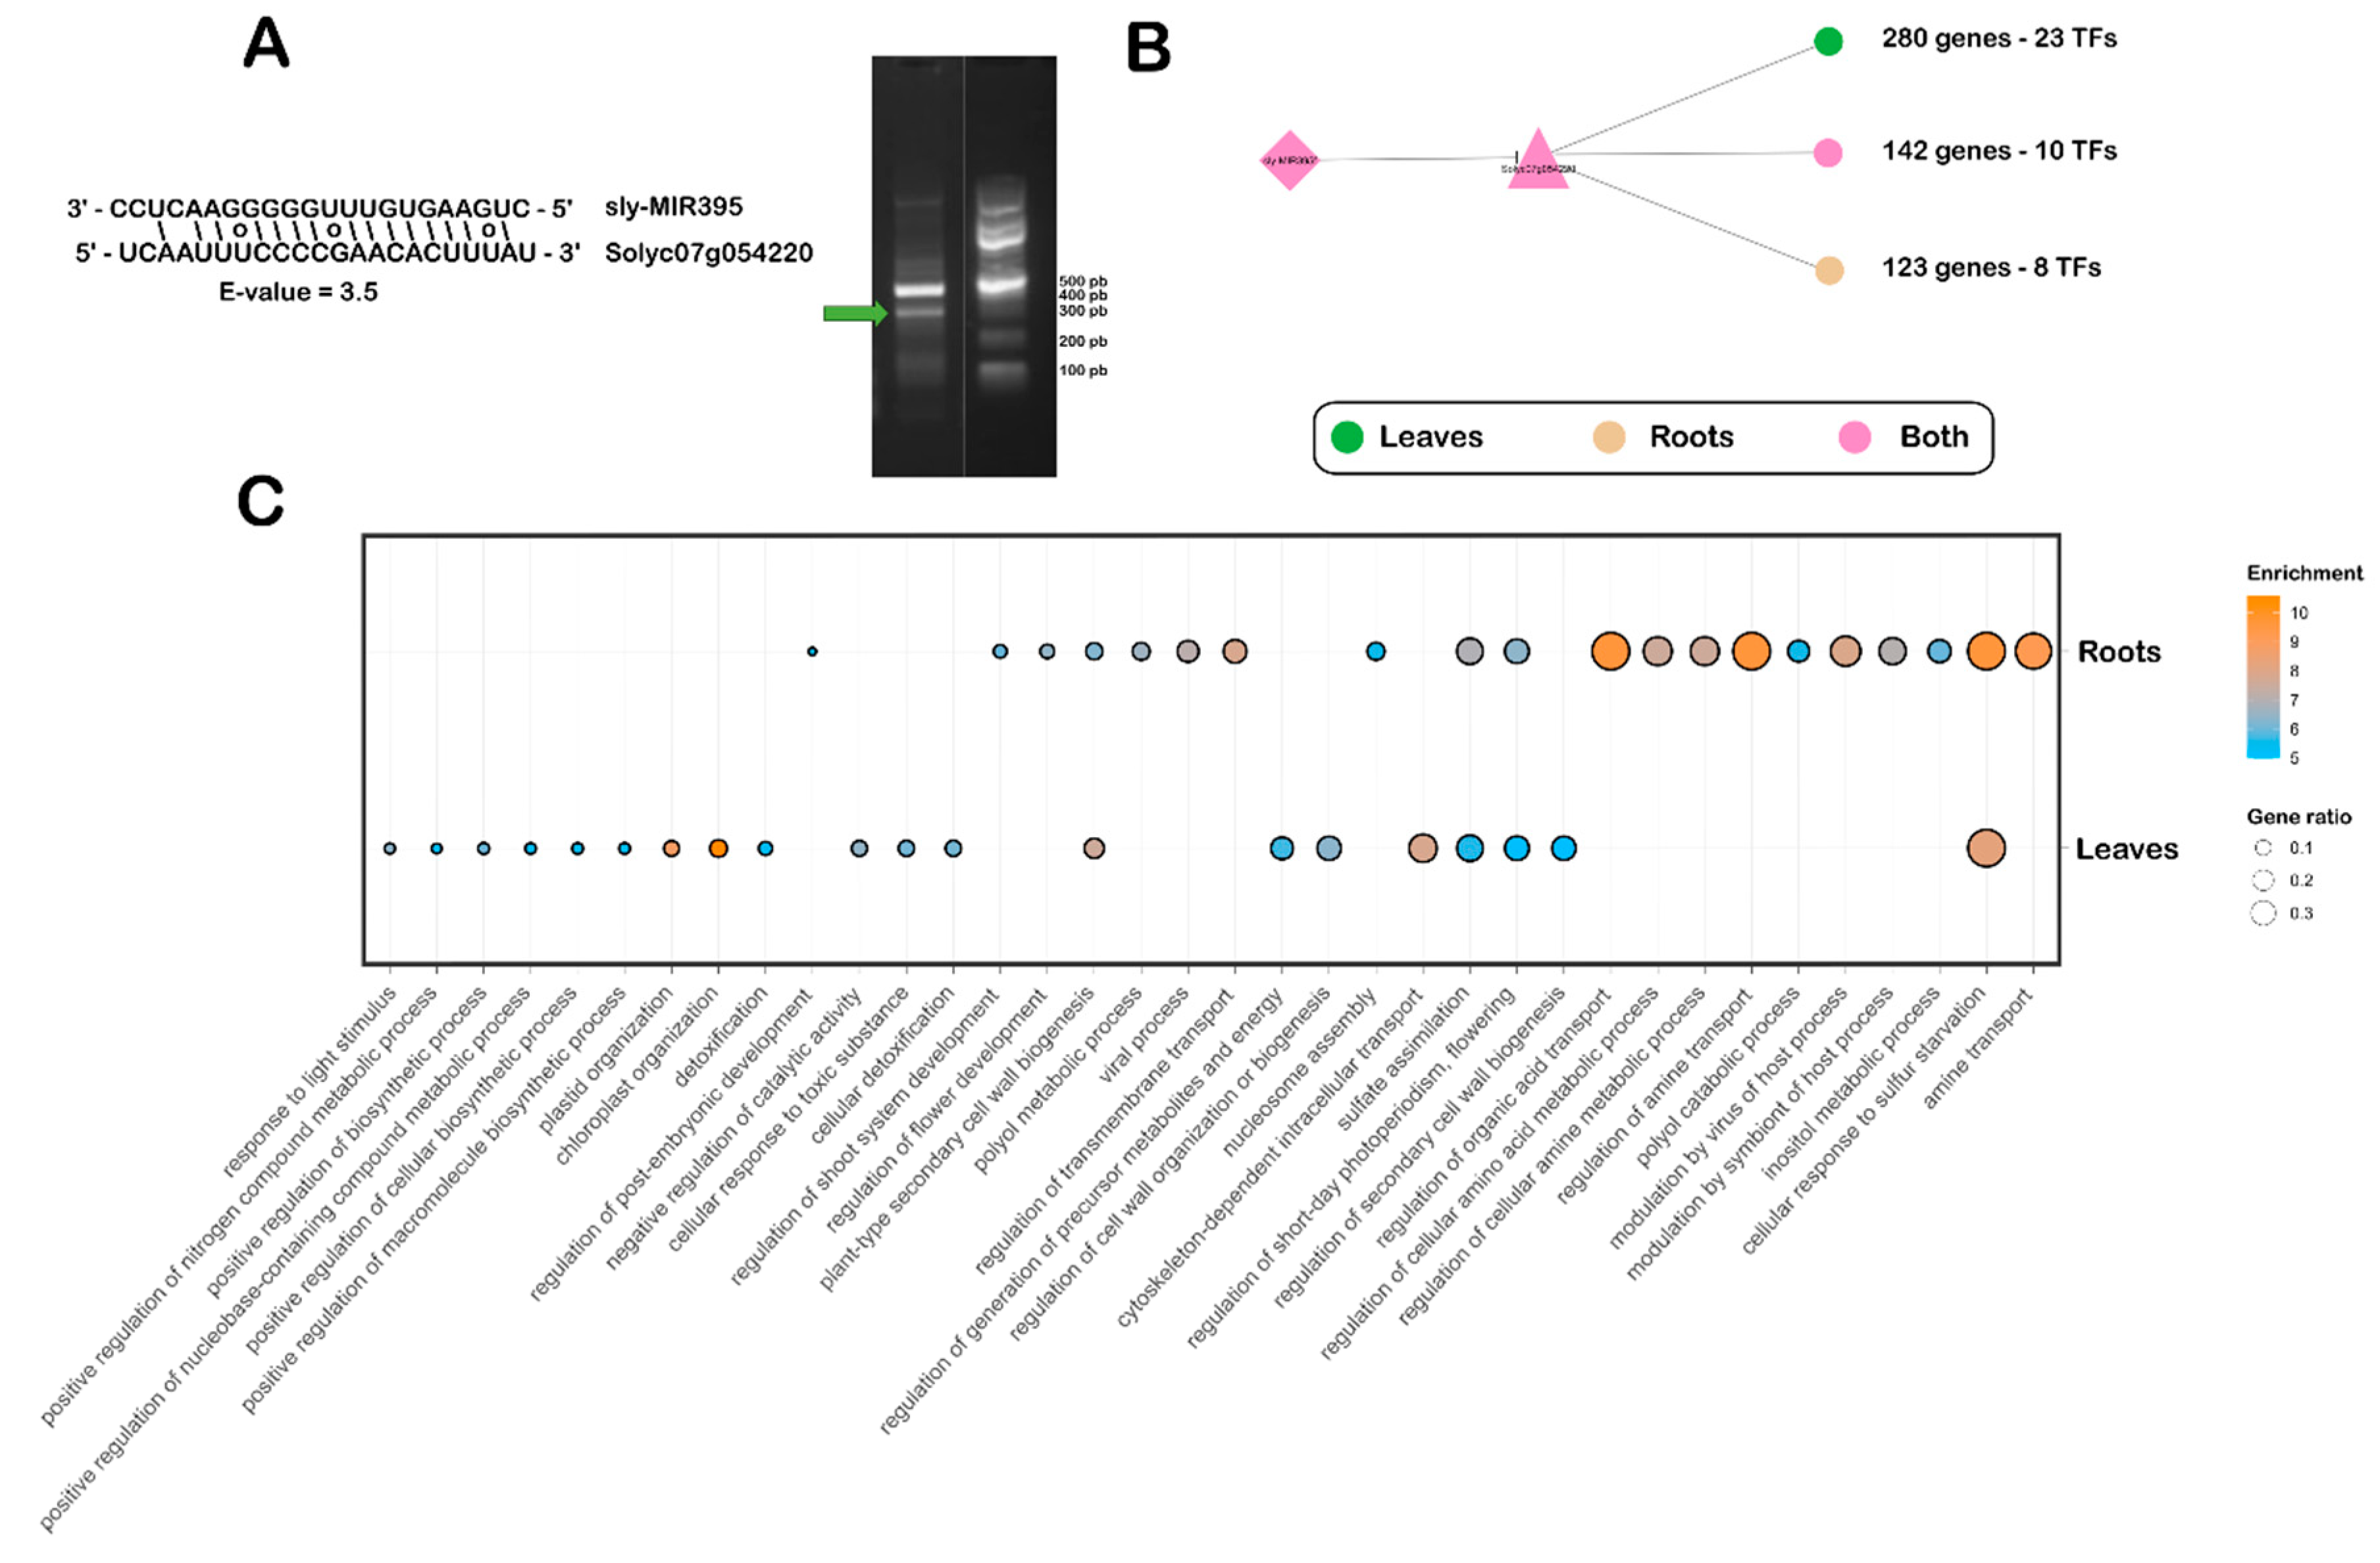
The miR395 family is well-known for regulating the expression of sulfur homeostasis-related genes, including ATPS1, ATPS3, ATPS4, and SULTR2;1 [86]. However, its role in regulating transcription factors has only been documented in Malus x domestica, where it targets a WRKY transcription factor [89]. qPCR analysis revealed that both miR395 and SlERF2a were upregulated under sulfate deficiency (Supplementary figure S5), consistent with the RNA-Seq data. While this finding appears to contradict the typical repressive function of miRNAs on their targets, similar observations have been reported for miR395 targets SULTR2;1 and APS3 in A. thaliana roots [23]. This discrepancy may arise from differences in miRNA and target expression at the cellular level [90]. To experimentally validate the predicted interaction between miR395 and SlERF2a (as identified by psRNATarget), we conducted RLM-RACE using a pooled sample of leaves and roots from plants exposed to sulfate deficiency for four weeks. An amplification product corresponding to the expected size of a miR395-cleaved SlERF2a fragment was successfully detected (Figure 4A).
In order to investigate the role of SlERF2 in S responses, we constructed a miRNA regulatory network focused on SlERF2a. This network revealed SlERF2a's influence on DEGs in both common to leaves and roots, and specific to each organ (Figure 4B, Supplementary tables S13-S14). In leaves, SlERF2a is predicted to control genes involved in plastid organization, abscisic acid signaling, nitrogen compound metabolism, and macromolecule regulation (Figure 4C). In roots, this TF controls genes associated with carbohydrate catabolism, amine metabolism, and multicellular development (Figure 4C). In both leaves and roots, SlERF2a regulates genes involved in sulfate assimilation, cell wall biogenesis, and cellular detoxification (Figure 4C). Overall, this data identifies SlERF2a as a new target of the miR395 family, which responds to sulfate levels. This suggests that SlERF2a plays a key role in managing various metabolic and developmental processes when sulfate is limiting. The discovery of this interaction enhances our understanding of how miRNAs participate in the intricate regulatory networks that control a plant's response to nutrient stress.
3. Discussion
3.1. A Comprehensive miRNA Annotation for Tomato in the SL4.0 Genome
miRNAs are crucial molecules that play a central role in regulating organism growth and development in response to both external and internal signals. Identifying and annotating miRNAs is a critical first step toward understanding their specific biological functions. Over the past two decades, significant efforts have been made to generate sRNA sequencing data, annotation tools, and databases to compile information on miRNA genes. While several databases currently house miRNA gene annotations, these annotations are inconsistently reported across different versions of the tomato reference genome. This inconsistency poses challenges when working with newer and updated genome assemblies. To address this issue, we focused on creating a comprehensive miRNA annotation for the tomato SL4.0 genome, the latest version available in the Sol Genomics Network database (solgenomics.net) [60]. Through our analysis, we annotated a total of 357 miRNAs. This number is in the range of other Solanaceae species, such as Nicotiana benthamiana (440 miRNA genes), Capsicum annuum (330 miRNA genes), Solanum tuberosum (160 miRNA genes), Nicotiana tabacum (191 miRNA genes), and S. lycopersicum (194 miRNA genes) previously reported [57]. In the miRNA annotation from Baldrich et al [57], they described 43 miRNA families common to other Solanum species, and 66 miRNAs families specific to tomato. In contrast we described 69 miRNA families common to other Solanum species and 133 specifics to tomato.
De novo annotation using ShortStack [62] supports the experimental validation of miRNAs, with 29.7% of miRNAs included in the updated annotation. However, many miRNAs exhibit genotype-, tissue-, and treatment-specific expression patterns [92], as observed with miR395 genes, which were validated in this study using sRNA-seq libraries from sulfur-deficient conditions. Additional sRNA-seq libraries are needed to validate more miRNAs in tomato. For novel miRNAs, NCBI BLAST analysis [93] identified 10 miRNAs unique to tomato. Notably, the sequences of these miRNA genes did not match any miRNA sequences in the NCBI database, indicating that they are exclusive to tomato.
3.2. Spatiotemporal miRNA Regulation Reveals Specific Post-Transcriptional Control of Sulfur Deficiency Adaptation in Tomato
We identified 40 S-responsive miRNAs in tomato, 21 induced and 19 repressed. This number is comparable to known miRNA responses in other species, such as A. thaliana (18 induced/19 repressed), C. papaya (27 induced), and C. reinhardtii (24 induced) [37,38,39,42]. Tomato uses a miRNA-mediated response to face biotic and abiotic stimuli, like plant-fungi interaction [94], drought, heat [95], and light [84]. Our work is the first description of a miRNA-mediated response to S deficiency. Notably, the highly conserved miR395 highlights its essential role in S response. Other miRNAs are shared among specific species: miR164 (C. papaya and B. napus), miR171, miR172, miR390, and miR403 (C. papaya), miR169, miR397, miR399, and miR408 (A. thaliana and C. papaya), and miR167 (A.thaliana, B. napus, and C. papaya). These findings suggest that while miR395-mediated post-transcriptional regulation in the S response is highly conserved, other miRNAs are less widely shared across plant species.
Our data reveal both previously reported miRNAs involved in other nutrient responses and a set of novel miRNAs, highlighting the unique nature of sulfur regulation in tomato. These miRNAs have been linked to the regulation of other nutrients, including nitrogen, phosphorus, copper, zinc, magnesium, iron, and boron [41]. For example, miR397 targets the Laccase copper protein LAC2 to maintain copper homeostasis (Abdel-Ghany & Pilon, 2008), miR827 regulates the Ubiquitin E3 ligase NLA/BAH1, which is involved in nutrient recycling, phosphate uptake, and translocation [83], miR172 targets the AP2 transcription factor, which is related to the transition from young to adult plant [96], and miR399 controls Ubiquitin conjugate E2, regulating phosphorus uptake and translocation [97].
Our analysis revealed tissue- and time-specific miRNA expression in tomato. The limited number of shared miRNAs between tissues and treatment times supports previous transcriptomic findings that demonstrated a time-specific sulfur response in leaves [50]. The lower DE miRNA overlap at 3 and 4 weeks post-sowing under sulfur deficiency, compared to tissue-specific responses [50], suggests that post-transcriptional regulation is subject to both tissue and time constraints. Thus, we propose that miR395 and sly-b4.0r1-14493_MIRNA may be involved in a core sulfur deficiency response, and other miRNAs likely fine-tune the response in a tissue- and time-specific way.
3.3. Prediction of Differentially Expressed miRNA Targets Uncovers Novel Regulatory Pathways in Tomato Sulfate Deficiency Response
In our previous work, we identified biological processes involved in the transcriptional response of tomato, highlighting cell-wall biogenesis, hydrogen peroxide catabolic processes, and purine nucleobase transmembrane transport in roots, as well as photosynthesis-related processes, response to chitin, and protein phosphorylation in leaves [50]. Notably, sulfate assimilation, transport, and response to sulfate starvation were enriched in both tissues. Our data also revealed miRNAs that regulate biological processes previously described, such as chlorophyll, lignin, and phenylpropanoid metabolism in leaves, while in roots, miRNAs primarily control polysaccharide-related processes. This indicates several biological processes are regulated by miRNAs in S-response in tomato.
In leaves, stress responses often involve a reduction in photosynthetic rate to prioritize stress adaptation over plant growth [98]. This is consistent with the upregulation of miRNAs that regulate chlorophyll-related processes. Additionally, lignin accumulation, which inhibits growth [84], aligns with the downregulation of miRNAs and upregulation of lignin-related processes. These findings suggest that miRNAs play a key role in regulating vital developmental processes in leaves. Similarly, in roots, we observed the negative regulation of polysaccharide-related processes by induced miRNAs. Polysaccharides are critical for plant structure, providing rigidity and stability to the cell wall [99]. However, under biotic and abiotic stress, the cell wall undergoes degradation, with significant changes in the polysaccharide fraction [100]. This suggests that miRNAs regulate polysaccharide-related processes under sulfur deficiency, contributing to the observed reduction of root growth [50].
Notably, similar to other plants, sulfur deficiency in tomato induces miRNA of the miR395 family [35,36,37,38,39,42]. This miRNA targets sulfate assimilation enzymes ATPS1, ATPS3, and ATPS4, and sulfate transporter SULTR2;1 in A. thaliana [23]. Nevertheless, in other plants, miR395 control orthologues of these genes in S-response, such SULTR2;1 and SULTR3;1 in B. juncea [36], ATPS, SULT2;1, SULTR2, and SULTR3;4 in rice [101], SULTR2 in Nicotiana tabacum [102], and ATPS (Solyc09g082860) and SULT2;1 (Solyc04g054730) in tomato [58]. The role of miRNA395 in these species shows the conservative response and their targets between plants. Interestingly, in the golden delicious apple (Malus x domestica), miR395 targets the WRKY transcription factor to control leaf spot disease [90]. This is the first evidence of a TF regulation by miR395.
Our analysis reveals that in S-response in tomato, miRNA395 targets the TF SLEF2a. ERFs are TFs belonging to the Apetala2/ERF superfamily, characterized by AP2/ERF DNA-binding domains. These TFs regulate genes responsive to ethylene [103,104]. While ERFs are primarily known for their role in fruit ripening [103], they are also involved in abiotic stress responses, such as osmotic stress [105], salt stress [106], and drought [107]. In tomato, two ERF family TFs have been linked to S responses: DREB A-4, which regulates genes responsive to S status [14], and ERF115 [88]. SlERF2a, another ERF, has been associated with tomato fruit ripening [108]. However, our data reveal that SlERF2a is also induced under S-deficiency in both roots and leaves, suggesting a transcriptional regulation of in both tissues.
Ethylene is closely connected to sulfur metabolism through S-adenosyl methionine (SAM), the universal methyl group donor for DNA methylation [109]. S-deficiency increases internal ethylene levels in plants [110], promoting the expression of ethylene-related genes [111]. This includes the activation of ATPs, leading to sulfur accumulation in mustard [112]. However, in tomato and tobacco, only a subset of ethylene-responsive genes is affected by S-deficiency [11], with SlERF2a being one of them. Intriguingly, SlERF2a regulates genes involved in sulfur starvation and sulfur assimilation, highlighting its central role in the adaptive response of tomato to sulfur deficiency. Although both miR395 and SlERF2a are upregulated in both tissues under sulfur-deficient conditions, miR395c exhibits tissue-specific regulation. For instance, miR395c cleaves ATPS genes to modulate secondary xylem development [113], suggesting that the miR395-SlERF2a interaction may also operate in a tissue-dependent manner. While this study identifies SlERF2a as a novel target of miR395, further experimental characterization is required to unravel the specific role of this regulatory network at the tissue-specific level.
4. Materials and Methods
4.1. Plant Material and Growth Conditions
Seeds of Solanum lycopersicum cultivar ‘Moneymaker’ was sown and grown in a hydroponic system containing 0.5X Murashige and Skoog (MS) salts [61] with appropriate sulfate concentration, adjusted to pH 5.7, and Rockwool as support material. Plants were maintained under controlled growth conditions in a Bioref-19 growth chamber (Pitec, Chile) set to 22°C with a 16/8-hour light/dark photoperiod. Illumination was provided by LED lights at an intensity of 200 μmol m− 1 s− 1. For the sulfate-deficiency condition, all sulfate salts in the MS medium were replaced by chloride salts, following the protocol defined by Canales et al. [50]. Plants were grown for 3 or 4 weeks in sulfate sufficiency and deficiency conditions, respectively. Each treatment was conducted in three independent experiments, with each biological replicate consisting of a pooled sample from 5 plants.
4.2. sRNA Library Preparation and Sequencing
Tomato leaves and roots from plants grown under standard MS and sulfate-deficiency conditions were harvested 3 and 4 weeks after sowing and immediately flash-frozen in liquid nitrogen to preserve RNA integrity. Total RNA was extracted using the mirVanaTM RNA Isolation Kit (AM1560, Ambion), following the manufacturer’s instructions for total RNA isolation. sRNA-Seq libraries were prepared using the TruSeqTM Small RNA Library Prep Kit (Illumina). Sequencing was performed on an Illumina NovaSeqTM platform, generating 50 bp single-end reads.
4.3. sRNA-Seq Read Alignment and Differential Expression Analysis
Raw sequenced reads underwent quality assessment using FastQC (v0.11.5). Adapter trimming and removal of low-quality bases (< Q20) were performed with Cutadapt (v1.15), retaining reads with a 5’ adapter and within 18-28 nt. High-quality reads were subsequently aligned to the Solanum lycopersicum SL4.0 reference genome [60] using ShortStack (v.3.8.3) [62] with default parameters. The updated miRNA annotation was used to assign miRNA names to the aligned sRNAs. Differential expression analysis of sRNAs across experimental conditions was conducted using DESeq2 [63]. miRNAs were considered differentially expressed if they exhibited an adjusted p-value < 0.05 and an absolute log2 Fold Change > 0.5.
4.4. miRNA Annotation in the SL4.0 Genome Assembly
miRNA hairpins and mature miRNA sequences for tomato were obtained from miRBase version 22.1 [55], Cardoso et al. [64], and Lunardon et al. [56]. To generate an updated annotation of miRNAs for tomato, hairpin sequences were aligned to the tomato SL4.0 genome using BLAST [65] with alignment parameters set to an identity threshold of > 95% and an e-value < 0.01. Genomic coordinates of aligned sequences were retrieved, and miRNA gene names were assigned based on their designations in the original publications. Priority was given to their miRBase names, followed by names from Cardoso et al. [64] and Lunardon et al. [56]. Mature sequences, including -3p and -5p miRNAs, were consolidated from the three studies. To evaluate the updated miRNA annotations reads from publicly available tomato sRNA-Seq datasets (Supplementary Table S3) were aligned using ShortStack (v3.8.3) with default parameters [62]. Public sRNA-Seq datasets were trimmed with the same parameter as sRNA-Seq performed in this article.
4.5. RNA-Seq Read Alignment and Differential Expression Analysis
RNA-seq data from Canales et al. [50], available in the NCBI Sequence Read Archive (SRA) database under accession PRJNA629977, was retrieved and processed for alignment to the Solanum lycopersicum SL4.0 reference genome [60] using HISAT2 [66]. Gene-level counts were generated using FeatureCounts [67] based on the iITAG4.0 annotation [60]. Differential gene expression analysis between experimental conditions was performed with DESeq2 [63]. Genes were considered differentially expressed if they met the criteria of an adjusted p-value < 0.05 and an absolute log2 Fold Change > 1.
4.6. Identification of mRNA Targets of miRNAs
mRNA targets of miRNAs were predicted using the psRNAtarget online server [68] with Schema V2 (2017 release) and default parameters, except for the expectation value, which was set to 3.5. The Solanum lycopersicum iITAG 4.0 cDNA library was selected as the reference for the analysis.
4.7. Gene Ontology Analysis
Gene Ontology (GO) enrichment analyses were performed using topGO R package (v.2.58.0) [69], with Solanum lycopersicum GO annotations obtained from AgriGO [70]. Fisher test (< 0.05) was applied on the over-represented GO terms obtained in the respective gene set. We filtered out the GO terms with less than 10% of gene ratio and use only GO terms associated to biological processes. To reduce the redundancy between GO terms, we selected the overrepresented GO terms with the six or more level in the hierarchical GO tree.
4.8. Real-Time qPCR Analysis
One microgram of total RNA was treated with DNase I (Thermo Fisher Scientific) to remove genomic DNA contamination, followed by cDNA synthesis with RevertAidTM RT Reverse Transcription Kit and random primers (Thermo Fisher Scientific), according to the manufacturer’s protocol. Each cDNA sample was diluted 1:4 with nuclease-free water before use. The qPCR reactions were prepared using the Brilliant II SYBR Green QPCR Master Mix (Agilent), containing 10 µM of forward primer, 10 µM of reverse primer, ROX dye as a passive reference, template cDNA, and nuclease-free water, in a final volume of 20 µL per reaction. Amplification was performed on a QuantStudioTM 1 Real-Time PCR system. Raw qPCR data was analyzed using the Real-Time PCR Miner 4.0 software [71] to determine cycle threshold (Ct) values and calculate gene amplification efficiencies. The expression levels of target genes were normalized using Actin-7 (Solyc11g005330) as the reference gene. All qPCR experiments were conducted with three biological replicates.
4.9. Stem-Loop qPCR Analysis
200 ng of total RNA was used to cDNA synthesis with Superscript III (ThermoFisher scientific) with specific primer for miRNA sequence (Kramer et al., 2011). The qPCR reactions were prepared using the Brilliant II SYBR Green QPCR Master Mix (Agilent), containing 10 µM of forward primer, 10 µM of reverse primer, ROX dye as a passive reference, template cDNA, and nuclease-free water, in a final volume of 10 µL per reaction. Amplification was performed on a QuantStudioTM 1 Real-Time PCR system. Raw qPCR data was analyzed using the Real-Time PCR Miner 4.0 software[71] to determine cycle threshold (Ct) values and calculate gene amplification efficiencies. The expression levels of target genes were normalized using U-6 non-coding RNA as the reference gene. All qPCR experiments were conducted with three biological replicates.
4.10. Target Validation by RNA Ligase-Mediated Rapid Amplification of cDNA Ends (RLM-RACE)
Poly-A+ mRNA was enriched from 60 ug of total RNA using the DynabeadsTM mRNA Purification Kit (Thermo Fisher Scientific). The GeneRacerTM RNA Oligo adapter (from the GeneRacerTM Kit, Thermo Fisher Scientific) was directly ligated to 250 ng of Poly-A + mRNA, and the GeneRacer OligodT primer was used to synthesize the first strand cDNA. This cDNA was subjected to a PCR amplification procedure with the GeneRacer 5′Primer and the GeneRacer 3′Primer to generate a pool of non-gene-specific RACE products. Gene-specific 5′RACE reactions were performed with the GeneRacer 5′Nested Primer and a reverse gene-specific primer.
5. Conclusions
In summary, our study provides a detailed catalog of sulfur deficiency-responsive miRNAs in Solanum lycopersicum, including the identification of SlERF2a as a novel target of miR395. This discovery underscores key divergences in sulfur response mechanisms between tomato and A. thaliana. We further uncovered temporally dynamic and context-specific miRNA-mediated regulation of processes linked to cell growth and development. These findings increase our understanding of tomato’s adaptation to sulfur deficiency, highlighting tissue-wide and tissue-specific biological processes and proposing post-transcriptional regulatory pathways. Additionally, we present an updated miRNA annotation for the tomato SL4.0 genome, integrating homology-based and sRNA-seq analyses. This resource offers researchers a refined genomic framework for studying miRNA functions, eliminating the need for outdated genome versions.
Supplementary Materials
The following supporting information can be downloaded at the website of this paper posted on Preprints.org.
Author Contributions
Conceptualization, D.L-S and E.A.V; Methodology D.L-S, N.R.J., M.T., J.Mo., C.O-Y., E.S., and J.D.F.; Data curation D.L-S and N.R.J.; Writing – original draft preparation D.L-S; Writing – review and editing J.Mo., J.Me, J.C., and E.A.V; Supervision, E.A.V; Project administration E.A.V.; Resources J.Me, J.C., E.A.V.; Project administration E.A.V; Funding acquisition E.A.V. All authors read and approved the final manuscript.
Funding
This work was supported by grants from Millennium Institute for Integrative Biology – iBio (Iniciativa Científica Milenio – ANID to E.A.V and J.C), Fondo Nacional de Desarrollo Científico y Tecnológico FONDECYT 1211130 to E.A.V, Ministerio de Ciencia e Innovación (MCIN) and the Agencia Estatal de Investigación (grant PID2020-114165RRC21) to J. M, and ANID BECA DE DOCTORADO NACIONAL FOLIO 21230939 to D.L-S. These funding agencies were not involved in the design of the study, collection, analysis, interpretation of data, and in writing the manuscript.
Data Availability Statement
The sRNA-Seq datasets generated and analyzed during the current study are available in the NCBI Sequence Read Archive (SRA) repository, accession PRJNA1214914 , available at https://www.ncbi.nlm.nih.gov/sra/PRJNA1214914. All other data generated during this study are included in this published article and its supplementary information files
Acknowledgments
We sincerely thank the members of the Plant Genomics & Systems Biology Lab for their invaluable support, insightful discussions, and collaborative contributions throughout this study.
Conflicts of Interest
The authors declare that they have no known competing financial interests or personal relationships that could have appeared to influence the work reported in this paper.
Abbreviations
The following abbreviations are used in this manuscript:
| S | Sulfur |
| SULTR | Sulfate transporter |
| ATPS | ATP sulfurylase |
| OAS | O-acetyl serine |
| SLIM1 | Sulfur limitation 1 |
| TF | Transcription factor |
| sRNA | Small RNA |
| miRNA | Micro RNA |
| AGO | Argonaute |
| RISC | RNA-induced silencing complex |
| MS | Murashige and Skoog |
| GO | Gene ontology |
| DE | Differentially expressed |
| DEGs | Differentially expressed genes |
| ERF | Ethylene-responsive factor |
| SAM | S-adenosyl methionine |
References
- Maruyama-Nakashita A. Metabolic changes sustain the plant life in low-sulfur environments. Curr Opin Plant Biol. 2017 Oct 1;39:144–51. [CrossRef]
- 2Kopriva S, Malagoli M, Takahashi H. Sulfur nutrition: impacts on plant development, metabolism, and stress responses. J Exp Bot. 2019 Aug 19;70(16):4069–73. [CrossRef]
- Takahashi H. Sulfate transport systems in plants: functional diversity and molecular mechanisms underlying regulatory coordination. J Exp Bot. 2019 Aug 19;70(16):4075–87. [CrossRef]
- Kataoka T, Hayashi N, Yamaya T, Takahashi H. Root-to-shoot transport of sulfate in Arabidopsis. Evidence for the role of SULTR3;5 as a component of low-affinity sulfate transport system in the root vasculature. Plant Physiol. 2004 Dec;136(4):4198–204. [CrossRef]
- Saito K. Sulfur Assimilatory Metabolism. The Long and Smelling Road. Plant Physiol. 2004 Sep;136(1):2443–50.
- Nakai Y, Maruyama-Nakashita A. Biosynthesis of Sulfur-Containing Small Biomolecules in Plants. Int J Mol Sci. 2020 May 14;21(10):3470. [CrossRef]
- Aula L, Dhillon JS, Omara P, Wehmeyer GB, Freeman KW, Raun WR. World Sulfur Use Efficiency for Cereal Crops. Agron J. 2019;111(5):2485–92. [CrossRef]
- Hawkesford MJ. Plant responses to sulphur deficiency and the genetic manipulation of sulphate transporters to improve S-utilization efficiency. J Exp Bot. 2000 Jan 1;51(342):131–8.
- McNeill A m., Eriksen J, Bergström L, Smith K a., Marstorp H, Kirchmann H, et al. Nitrogen and sulphur management: challenges for organic sources in temperate agricultural systems. Soil Use Manag. 2005;21(1):82–93.
- Zhang L, Kawaguchi R, Morikawa-Ichinose T, Allahham A, Kim SJ, Maruyama-Nakashita A. Sulfur Deficiency-Induced Glucosinolate Catabolism Attributed to Two β-Glucosidases, BGLU28 and BGLU30, is Required for Plant Growth Maintenance under Sulfur Deficiency. Plant Cell Physiol. 2020 Apr 1;61(4):803–13.
- Zuchi S, Cesco S, Varanini Z, Pinton R, Astolfi S. Sulphur deprivation limits Fe-deficiency responses in tomato plants. Planta. 2009 Jun 1;230(1):85–94. [CrossRef]
- Yu X, Gong H, Cao L, Hou Y, Qu S. MicroRNA397b negatively regulates resistance of Malus hupehensis to Botryosphaeria dothidea by modulating MhLAC7 involved in lignin biosynthesis. Plant Sci. 2020 Mar 1;292:110390. [CrossRef]
- Zörb C, Steinfurth D, Seling S, LangenkÄmper G, Koehler P, Wieser H, et al. Quantitative Protein Composition and Baking Quality of Winter Wheat as Affected by Late Sulfur Fertilization. J Agric Food Chem. 2009 May 13;57(9):3877–85. [CrossRef]
- Bielecka M, Watanabe M, Morcuende R, Scheible WR, Hawkesford MJ, Hesse H, et al. Transcriptome and metabolome analysis of plant sulfate starvation and resupply provides novel information on transcriptional regulation of metabolism associated with sulfur, nitrogen and phosphorus nutritional responses in Arabidopsis. Front Plant Sci. 2015 Jan 28;5:805. [CrossRef]
- Henríquez-Valencia C, Arenas-M A, Medina J, Canales J. Integrative Transcriptomic Analysis Uncovers Novel Gene Modules That Underlie the Sulfate Response in Arabidopsis thaliana. Front Plant Sci [Internet]. 2018 Apr 10 [cited 2024 Jul 10];9. Available from: https://www.frontiersin.org/journals/plant-science/articles/10.3389/fpls.2018.00470/full.
- Maruyama-Nakashita A, Inoue E, Watanabe-Takahashi A, Yamaya T, Takahashi H. Transcriptome Profiling of Sulfur-Responsive Genes in Arabidopsis Reveals Global Effects of Sulfur Nutrition on Multiple Metabolic Pathways. Plant Physiol. 2003 Jun;132(2):597–605. [CrossRef]
- Maruyama-Nakashita A, Nakamura Y, Tohge T, Saito K, Takahashi H. Arabidopsis SLIM1 Is a Central Transcriptional Regulator of Plant Sulfur Response and Metabolism. Plant Cell. 2006 Nov;18(11):3235–51. [CrossRef]
- Iyer-Pascuzzi AS, Jackson T, Cui H, Petricka JJ, Busch W, Tsukagoshi H, et al. Cell identity regulators link development and stress responses in the Arabidopsis root. Dev Cell. 2011 Oct 18;21(4):770–82. [CrossRef]
- Fernández JD, Miño I, Canales J, Vidal EA. Gene regulatory networks underlying sulfate deficiency responses in plants. J Exp Bot. 2024 May 20;75(10):2781–98. [CrossRef]
- Zhang B, Pan X, Cobb GP, Anderson TA. Plant microRNA: A small regulatory molecule with big impact. Dev Biol. 2006 Jan 1;289(1):3–16. [CrossRef]
- Axtell MJ. Classification and Comparison of Small RNAs from Plants. Annu Rev Plant Biol. 2013 Apr 29;64(Volume 64, 2013):137–59.
- Song X, Li Y, Cao X, Qi Y. MicroRNAs and Their Regulatory Roles in Plant–Environment Interactions. Annu Rev Plant Biol. 2019 Apr 29;70(1):489–525. [CrossRef]
- Liang G, Yang F, Yu D. MicroRNA395 mediates regulation of sulfate accumulation and allocation in Arabidopsis thaliana. Plant J. 2010;62(6):1046–57. [CrossRef]
- Liu HH, Tian X, Li YJ, Wu CA, Zheng CC. Microarray-based analysis of stress-regulated microRNAs in Arabidopsis thaliana. RNA. 2008 May;14(5):836–43. [CrossRef]
- Achkar NP, Cambiagno DA, Manavella PA. miRNA Biogenesis: A Dynamic Pathway. Trends Plant Sci. 2016 Dec 1;21(12):1034–44.
- Voinnet O. Origin, Biogenesis, and Activity of Plant MicroRNAs. Cell. 2009 Feb 20;136(4):669–87.
- Kurihara Y, Watanabe Y. Arabidopsis micro-RNA biogenesis through Dicer-like 1 protein functions. Proc Natl Acad Sci U S A. 2004 Aug 24;101(34):12753–8. [CrossRef]
- Denli AM, Tops BBJ, Plasterk RHA, Ketting RF, Hannon GJ. Processing of primary microRNAs by the Microprocessor complex. Nature. 2004 Nov;432(7014):231–5. [CrossRef]
- Okada C, Yamashita E, Lee SJ, Shibata S, Katahira J, Nakagawa A, et al. A High-Resolution Structure of the Pre-microRNA Nuclear Export Machinery. Science. 2009 Nov 27;326(5957):1275–9.
- Iwakawa H oki, Tomari Y. Molecular insights into microRNA-mediated translational repression in plants. Mol Cell. 2013 Nov 21;52(4):591–601.
- Yang G, Li Y, Wu B, Zhang K, Gao L, Zheng C. MicroRNAs transcriptionally regulate promoter activity in Arabidopsis thaliana. J Integr Plant Biol. 2019;61(11):1128–33. [CrossRef]
- Dolata J, Bajczyk M, Bielewicz D, Niedojadlo K, Niedojadlo J, Pietrykowska H, et al. Salt Stress Reveals a New Role for ARGONAUTE1 in miRNA Biogenesis at the Transcriptional and Posttranscriptional Levels1[OPEN]. Plant Physiol. 2016 Sep;172(1):297–312.
- Baumberger N, Baulcombe DC. Arabidopsis ARGONAUTE1 is an RNA Slicer that selectively recruits microRNAs and short interfering RNAs. Proc Natl Acad Sci. 2005 Aug 16;102(33):11928–33.
- Li L, Yi H, Xue M, Yi M. miR398 and miR395 are involved in response to SO2 stress in Arabidopsis thaliana. Ecotoxicol Lond Engl. 2017 Nov;26(9):1181–7. [CrossRef]
- Huang SQ, Xiang AL, Che LL, Chen S, Li H, Song JB, et al. A set of miRNAs from Brassica napus in response to sulphate deficiency and cadmium stress. Plant Biotechnol J. 2010;8(8):887–99. [CrossRef]
- Iqrar S, Ashrafi K, Khan S, Saifi M, Nasrullah N, Abdin MZ. Set of miRNAs Involved in Sulfur Uptake and the Assimilation Pathway of Indian Mustard (B. juncea) in Response to Sulfur Treatments. ACS Omega. 2022 Apr 19;7(15):13228–42.
- Shu L, Hu Z. Characterization and differential expression of microRNAs elicited by sulfur deprivation in Chlamydomonas reinhardtii. BMC Genomics. 2012 Mar 22;13(1):108. [CrossRef]
- Liang G, Li Y, He H, Wang F, Yu D. Identification of miRNAs and miRNA-mediated regulatory pathways in Carica papaya. Planta. 2013 Oct 1;238(4):739–52. [CrossRef]
- Liang G, Ai Q, Yu D. Uncovering miRNAs involved in crosstalk between nutrient deficiencies in Arabidopsis. Sci Rep. 2015 Jul 2;5(1):11813.
- Kawashima CG, Matthewman CA, Huang S, Lee BR, Yoshimoto N, Koprivova A, et al. Interplay of SLIM1 and miR395 in the regulation of sulfate assimilation in Arabidopsis. Plant J. 2011;66(5):863–76. [CrossRef]
- Shahzad R, Harlina P, Ayaad M, Nishawy E, Fahad S, Subthain H, et al. Dynamic roles of microRNAs in nutrient acquisition and plant adaptation under nutrient stress: A review. Plant OMICS. 2018 Feb 1;11:58–79. [CrossRef]
- Barciszewska-Pacak M, Milanowska K, Knop K, Bielewicz D, Nuc P, Plewka P, et al. Arabidopsis microRNA expression regulation in a wide range of abiotic stress responses. Front Plant Sci. 2015;6:410. [CrossRef]
- Our World in Data [Internet]. [cited 2025 Feb 16]. Tomato production. Available from: https://ourworldindata.org/grapher/tomato-production.
- Kimura S, Sinha N. Tomato (Solanum lycopersicum): A Model Fruit-Bearing Crop. Cold Spring Harb Protoc. 2008 Nov 1;2008(11):pdb.emo105. [CrossRef]
- Gascuel Q, Diretto G, Monforte AJ, Fortes AM, Granell A. Use of Natural Diversity and Biotechnology to Increase the Quality and Nutritional Content of Tomato and Grape. Front Plant Sci [Internet]. 2017 May 12 [cited 2024 Jul 10];8. Available from: https://www.frontiersin.org/journals/plant-science/articles/10.3389/fpls.2017.00652/full.
- Cerdá A, Martínez V, Caro M, Fernández FG. Effect of sulfur deficiency and excess on yield and sulfur accumulation in tomato plants. J Plant Nutr. 1984 Nov 1;7(11):1529–43.
- Siddiqui MH, Alamri S, Alsubaie QD, Ali HM, Khan MN, Al-Ghamdi A, et al. Exogenous nitric oxide alleviates sulfur deficiency-induced oxidative damage in tomato seedlings. Nitric Oxide. 2020 Jan 1;94:95–107.
- Hasan MK, Liu CX, Pan YT, Ahammed GJ, Qi ZY, Zhou J. Melatonin alleviates low-sulfur stress by promoting sulfur homeostasis in tomato plants. Sci Rep. 2018 Jul 5;8(1):10182. [CrossRef]
- Lopez J, Tremblay N, Voogt W, Dubé S, Gosselin A. Effects of varying sulphate concentrations on growth, physiology and yield of the greenhouse tomato. Sci Hortic. 1996 Dec 1;67(3):207–17. [CrossRef]
- Canales J, Uribe F, Henríquez-Valencia C, Lovazzano C, Medina J, Vidal EA. Transcriptomic analysis at organ and time scale reveals gene regulatory networks controlling the sulfate starvation response of Solanum lycopersicum. BMC Plant Biol. 2020 Aug 24;20(1):385. [CrossRef]
- Moxon S, Jing R, Szittya G, Schwach F, Rusholme Pilcher RL, Moulton V, et al. Deep sequencing of tomato short RNAs identifies microRNAs targeting genes involved in fruit ripening. Genome Res. 2008 Oct;18(10):1602–9. [CrossRef]
- Zhao G, Yu H, Liu M, Lu Y, Ouyang B. Identification of salt-stress responsive microRNAs from Solanum lycopersicum and Solanum pimpinellifolium. Plant Growth Regul. 2017 Sep 1;83(1):129–40. [CrossRef]
- Jin W, Wu F. Characterization of miRNAs associated with Botrytis cinerea infection of tomato leaves. BMC Plant Biol. 2015 Jan 16;15(1):1.
- Yogindran S, Rajam MV. Host-derived artificial miRNA-mediated silencing of ecdysone receptor gene provides enhanced resistance to Helicoverpa armigera in tomato. Genomics. 2021 Jan 1;113(1, Part 2):736–47.
- Kozomara A, Birgaoanu M, Griffiths-Jones S. miRBase: from microRNA sequences to function. Nucleic Acids Res. 2019 Jan 8;47(D1):D155–62.
- Lunardon A, Johnson NR, Hagerott E, Phifer T, Polydore S, Coruh C, et al. Integrated annotations and analyses of small RNA–producing loci from 47 diverse plants. Genome Res. 2020 Mar;30(3):497–513. [CrossRef]
- Baldrich P, Bélanger S, Kong S, Pokhrel S, Tamim S, Teng C, et al. The evolutionary history of small RNAs in Solanaceae. [cited 2025 Jan 15]; Available from: https://dx.doi.org/10.1093/plphys/kiac089.
- Liu J, Liu X, Zhang S, Liang S, Luan W, Ma X. TarDB: an online database for plant miRNA targets and miRNA-triggered phased siRNAs. BMC Genomics. 2021 May 13;22(1):348. [CrossRef]
- Chang L, Zhou G, Soufan O, Xia J. miRNet 2.0: network-based visual analytics for miRNA functional analysis and systems biology. Nucleic Acids Res. 2020 Jul 2;48(W1):W244–51.
- Hosmani PS, Flores-Gonzalez M, van de Geest H, Maumus F, Bakker LV, Schijlen E, et al. An improved de novo assembly and annotation of the tomato reference genome using single-molecule sequencing, Hi-C proximity ligation and optical maps. bioRxiv. 2019 Jan 1;767764.
- Murashige T, Skoog F. A Revised Medium for Rapid Growth and Bio Assays with Tobacco Tissue Cultures. Physiol Plant. 1962;15(3):473–97. [CrossRef]
- Johnson NR, Yeoh JM, Coruh C, Axtell MJ. Improved Placement of Multi-mapping Small RNAs. G3 GenesGenomesGenetics. 2016 Jul 1;6(7):2103–11. [CrossRef]
- Love MI, Huber W, Anders S. Moderated estimation of fold change and dispersion for RNA-seq data with DESeq2. Genome Biol. 2014 Dec 5;15(12):550.
- Cardoso TC de S, Alves TC, Caneschi CM, Santana D dos RG, Fernandes-Brum CN, Reis GLD, et al. New insights into tomato microRNAs. Sci Rep. 2018 Oct 30;8(1):16069.
- McGinnis S, Madden TL. BLAST: at the core of a powerful and diverse set of sequence analysis tools. Nucleic Acids Res. 2004 Jul 1;32(Web Server issue):W20–5.
- Kim D, Paggi JM, Park C, Bennett C, Salzberg SL. Graph-based genome alignment and genotyping with HISAT2 and HISAT-genotype. Nat Biotechnol. 2019 Aug;37(8):907–15. [CrossRef]
- Liao Y, Smyth GK, Shi W. featureCounts: an efficient general purpose program for assigning sequence reads to genomic features. Bioinformatics. 2014 Apr 1;30(7):923–30. [CrossRef]
- Dai X, Zhuang Z, Zhao PX. psRNATarget: a plant small RNA target analysis server (2017 release). Nucleic Acids Res. 2018 Jul 2;46(W1):W49–54.
- Bioconductor [Internet]. [cited 2025 Feb 16]. topGO. Available from: http://bioconductor.org/packages/topGO/.
- Tian T, Liu Y, Yan H, You Q, Yi X, Du Z, et al. agriGO v2.0: a GO analysis toolkit for the agricultural community, 2017 update. Nucleic Acids Res. 2017 Jul 3;45(W1):W122–9. [CrossRef]
- Zhao S, Fernald RD. Comprehensive Algorithm for Quantitative Real-Time Polymerase Chain Reaction. J Comput Biol J Comput Mol Cell Biol. 2005 Oct;12(8):1047–64. [CrossRef]
- Su X, Wang B, Geng X, Du Y, Yang Q, Liang B, et al. A high-continuity and annotated tomato reference genome. BMC Genomics. 2021 Dec 15;22(1):898. [CrossRef]
- Fernandez-Pozo N, Menda N, Edwards JD, Saha S, Tecle IY, Strickler SR, et al. The Sol Genomics Network (SGN)—from genotype to phenotype to breeding. Nucleic Acids Res. 2015 Jan 28;43(Database issue):D1036–41. [CrossRef]
- Bizouerne E, Ly Vu B, Ly Vu J, Verdier J, Buitink J, Leprince O. Dataset for transcriptome and physiological response of mature tomato seed tissues to light and heat during fruit ripening. Data Brief. 2021 Feb 1;34:106671. [CrossRef]
- Wang Q, Xu X, Cao X, Hu T, Xia D, Zhu J, et al. Identification, Classification, and Expression Analysis of the Triacylglycerol Lipase (TGL) Gene Family Related to Abiotic Stresses in Tomato. Int J Mol Sci. 2021 Jan;22(3):1387.
- Wang J, Feng Y, Ding X, Huo J, Nie WF. Identification of Long Non-Coding RNAs Associated with Tomato Fruit Expansion and Ripening by Strand-Specific Paired-End RNA Sequencing. Horticulturae. 2021 Dec;7(12):522. [CrossRef]
- Axtell MJ. ShortStack: Comprehensive annotation and quantification of small RNA genes. RNA. 2013 Jun;19(6):740–51. [CrossRef]
- Shahid S, Axtell MJ. Identification and annotation of small RNA genes using ShortStack. Methods San Diego Calif. 2014 May 1;67(1):20–7. [CrossRef]
- Khatabi B, Arikit S, Xia R, Winter S, Oumar D, Mongomake K, et al. High-resolution identification and abundance profiling of cassava (Manihot esculenta Crantz) microRNAs. BMC Genomics. 2016 Jan 28;17(1):85. [CrossRef]
- Wan LC, Wang F, Guo X, Lu S, Qiu Z, Zhao Y, et al. Identification and characterization of small non-coding RNAs from Chinese fir by high throughput sequencing. BMC Plant Biol. 2012 Aug 15;12(1):146. [CrossRef]
- Won SY, Yumul RE, Chen X. Small RNAs in Plants. In: Howell SH, editor. Molecular Biology [Internet]. New York, NY: Springer; 2014 [cited 2024 Jul 10]. p. 95–127. Available from: . [CrossRef]
- You C, Cui J, Wang H, Qi X, Kuo LY, Ma H, et al. Conservation and divergence of small RNA pathways and microRNAs in land plants. Genome Biol. 2017 Aug 23;18(1):158. [CrossRef]
- Hsieh LC, Lin SI, Shih ACC, Chen JW, Lin WY, Tseng CY, et al. Uncovering Small RNA-Mediated Responses to Phosphate Deficiency in Arabidopsis by Deep Sequencing. Plant Physiol. 2009 Dec 1;151(4):2120–32.
- Dong F, Wang C, Dong Y, Hao S, Wang L, Sun X, et al. Differential expression of microRNAs in tomato leaves treated with different light qualities. BMC Genomics. 2020 Jan 13;21(1):37.
- Wang Z, Hardcastle TJ, Canto Pastor A, Yip WH, Tang S, Baulcombe DC. A novel DCL2-dependent miRNA pathway in tomato affects susceptibility to RNA viruses. Genes Dev. 2018 Sep 1;32(17–18):1155–60. [CrossRef]
- Matthewman CA, Kawashima CG, Húska D, Csorba T, Dalmay T, Kopriva S. miR395 is a general component of the sulfate assimilation regulatory network in Arabidopsis. FEBS Lett. 2012 Sep 21;586(19):3242–8. [CrossRef]
- Apodiakou A, Hoefgen R. New insights into the regulation of plant metabolism by O-acetylserine: sulfate and beyond. J Exp Bot. 2023 Jun 6;74(11):3361–78. [CrossRef]
- Jin J, Tian F, Yang DC, Meng YQ, Kong L, Luo J, et al. PlantTFDB 4.0: toward a central hub for transcription factors and regulatory interactions in plants. Nucleic Acids Res. 2017 Jan 4;45(D1):D1040–5.
- Zhang Q, Li Y, Zhang Y, Wu C, Wang S, Hao L, et al. Md-miR156ab and Md-miR395 Target WRKY Transcription Factors to Influence Apple Resistance to Leaf Spot Disease. Front Plant Sci. 2017 Apr 19;8:526.
- Kawashima CG, Yoshimoto N, Maruyama-Nakashita A, Tsuchiya YN, Saito K, Takahashi H, et al. Sulphur starvation induces the expression of microRNA-395 and one of its target genes but in different cell types. Plant J. 2009;57(2):313–21. [CrossRef]
- Pokoo R, Ren S, Wang Q, Motes CM, Hernandez TD, Ahmadi S, et al. Genotype- and tissue-specific miRNA profiles and their targets in three alfalfa (Medicago sativa L) genotypes. BMC Genomics. 2018 Dec 31;19(10):913. [CrossRef]
- Camacho C, Coulouris G, Avagyan V, Ma N, Papadopoulos J, Bealer K, et al. BLAST+: architecture and applications. BMC Bioinformatics. 2009 Dec 15;10:421.
- Olmo R, Quijada NM, Morán-Diez ME, Hermosa R, Monte E. Identification of Tomato microRNAs in Late Response to Trichoderma atroviride. Int J Mol Sci. 2024 Jan;25(3):1617. [CrossRef]
- Zhou R, Yu X, Ottosen CO, Zhang T, Wu Z, Zhao T. Unique miRNAs and their targets in tomato leaf responding to combined drought and heat stress. BMC Plant Biol. 2020 Mar 6;20(1):107. [CrossRef]
- Wu G, Park MY, Conway SR, Wang JW, Weigel D, Poethig RS. The Sequential Action of miR156 and miR172 Regulates Developmental Timing in Arabidopsis. Cell. 2009 Aug 21;138(4):750–9.
- Chiou TJ, Aung K, Lin SI, Wu CC, Chiang SF, Su C lin. Regulation of Phosphate Homeostasis by MicroRNA in Arabidopsis. Plant Cell. 2006 Feb 1;18(2):412–21. [CrossRef]
- Krieg DR. Photosynthetic activity during stress. Agric Water Manag. 1983 Sep 1;7(1):249–63.
- Pedrosa L de F, Fabi JP. Polysaccharides from Medicinal Plants: Bridging Ancestral Knowledge with Contemporary Science. Plants. 2024 Jan;13(13):1721.
- Kaashyap M, Ford R, Kudapa H, Jain M, Edwards D, Varshney R, et al. Differential Regulation of Genes Involved in Root Morphogenesis and Cell Wall Modification is Associated with Salinity Tolerance in Chickpea. Sci Rep. 2018 Mar 19;8(1):4855. [CrossRef]
- Yang Z, Hui S, Lv Y, Zhang M, Chen D, Tian J, et al. miR395-regulated sulfate metabolism exploits pathogen sensitivity to sulfate to boost immunity in rice. Mol Plant. 2022 Apr 4;15(4):671–88. [CrossRef]
- Yuan N, Yuan S, Li Z, Li D, Hu Q, Luo H. Heterologous expression of a rice miR395 gene in Nicotiana tabacum impairs sulfate homeostasis. Sci Rep. 2016 Jun 28;6(1):28791.
- Liu M, Gomes BL, Mila I, Purgatto E, Peres LEP, Frasse P, et al. Comprehensive Profiling of Ethylene Response Factor Expression Identifies Ripening-Associated ERF Genes and Their Link to Key Regulators of Fruit Ripening in Tomato. Plant Physiol. 2016 Mar 1;170(3):1732–44. [CrossRef]
- Xie X lan, Yin X ren, Chen K song. Roles of APETALA2/Ethylene-Response Factors in Regulation of Fruit Quality. Crit Rev Plant Sci. 2016 Mar 3;35(2):120–30.
- Huang Z, Zhang Z, Zhang X, Zhang H, Huang D, Huang R. Tomato TERF1 modulates ethylene response and enhances osmotic stress tolerance by activating expression of downstream genes. FEBS Lett. 2004 Aug 27;573(1):110–6. [CrossRef]
- Zhang G, Chen M, Li L, Xu Z, Chen X, Guo J, et al. Overexpression of the soybean GmERF3 gene, an AP2/ERF type transcription factor for increased tolerances to salt, drought, and diseases in transgenic tobacco. J Exp Bot. 2009 Sep 1;60(13):3781–96.
- Fukao T, Yeung E, Bailey-Serres J. The Submergence Tolerance Regulator SUB1A Mediates Crosstalk between Submergence and Drought Tolerance in Rice. Plant Cell. 2011 Jan 1;23(1):412–27.
- Gao Y, Fan ZQ, Zhang Q, Li HL, Liu GS, Jing Y, et al. A tomato NAC transcription factor, SlNAM1, positively regulates ethylene biosynthesis and the onset of tomato fruit ripening. Plant J. 2021;108(5):1317–31. [CrossRef]
- Roeder S, Dreschler K, Wirtz M, Cristescu SM, van Harren FJM, Hell R, et al. SAM levels, gene expression of SAM synthetase, methionine synthase and ACC oxidase, and ethylene emission from N. suaveolens flowers. Plant Mol Biol. 2009 Jul 1;70(5):535–46. [CrossRef]
- Moniuszko G, Skoneczny M, Zientara-Rytter K, Wawrzyńska A, Głów D, Cristescu SM, et al. Tobacco LSU-like protein couples sulphur-deficiency response with ethylene signalling pathway. J Exp Bot. 2013 Nov;64(16):5173–82. [CrossRef]
- Lewandowska M, Wawrzyńska A, Moniuszko G, Łukomska J, Zientara K, Piecho M, et al. A Contribution to Identification of Novel Regulators of Plant Response to Sulfur Deficiency: Characteristics of a Tobacco Gene UP9C, Its Protein Product and the Effects of UP9C Silencing. Mol Plant. 2010 Mar;3(2):347–60. [CrossRef]
- Iqbal N, Khan NA, Nazar R, Silva JAT da. Ethylene-stimulated photosynthesis results from increased nitrogen and sulfur assimilation in mustard types that differ in photosynthetic capacity. Environ Exp Bot. 2012 May 1;78:84–90. [CrossRef]
- Liu C, Ma D, Wang Z, Chen N, Ma X, He XQ. MiR395c Regulates Secondary Xylem Development Through Sulfate Metabolism in Poplar. Front Plant Sci. 2022 Jun 9;13:897376. [CrossRef]
Figure 1.
Size distribution and expression patterns of sRNAs in response to sulfate deficiency differ between leaves and roots. (A) Size distribution of sRNA species across organs and time points, highlighting different patterns in leaves and roots. (B) PCA of expression of sRNA cluster expression (20-24 nt) across conditions. PCA was conducted using the pcaExplorer R package (Marini & Binder, 2019) with log2-transformed, normalized expression data. Ellipses represent the 95% confidence interval based on three independent experiments. Replicates of the same experiment are represented with identical colors.
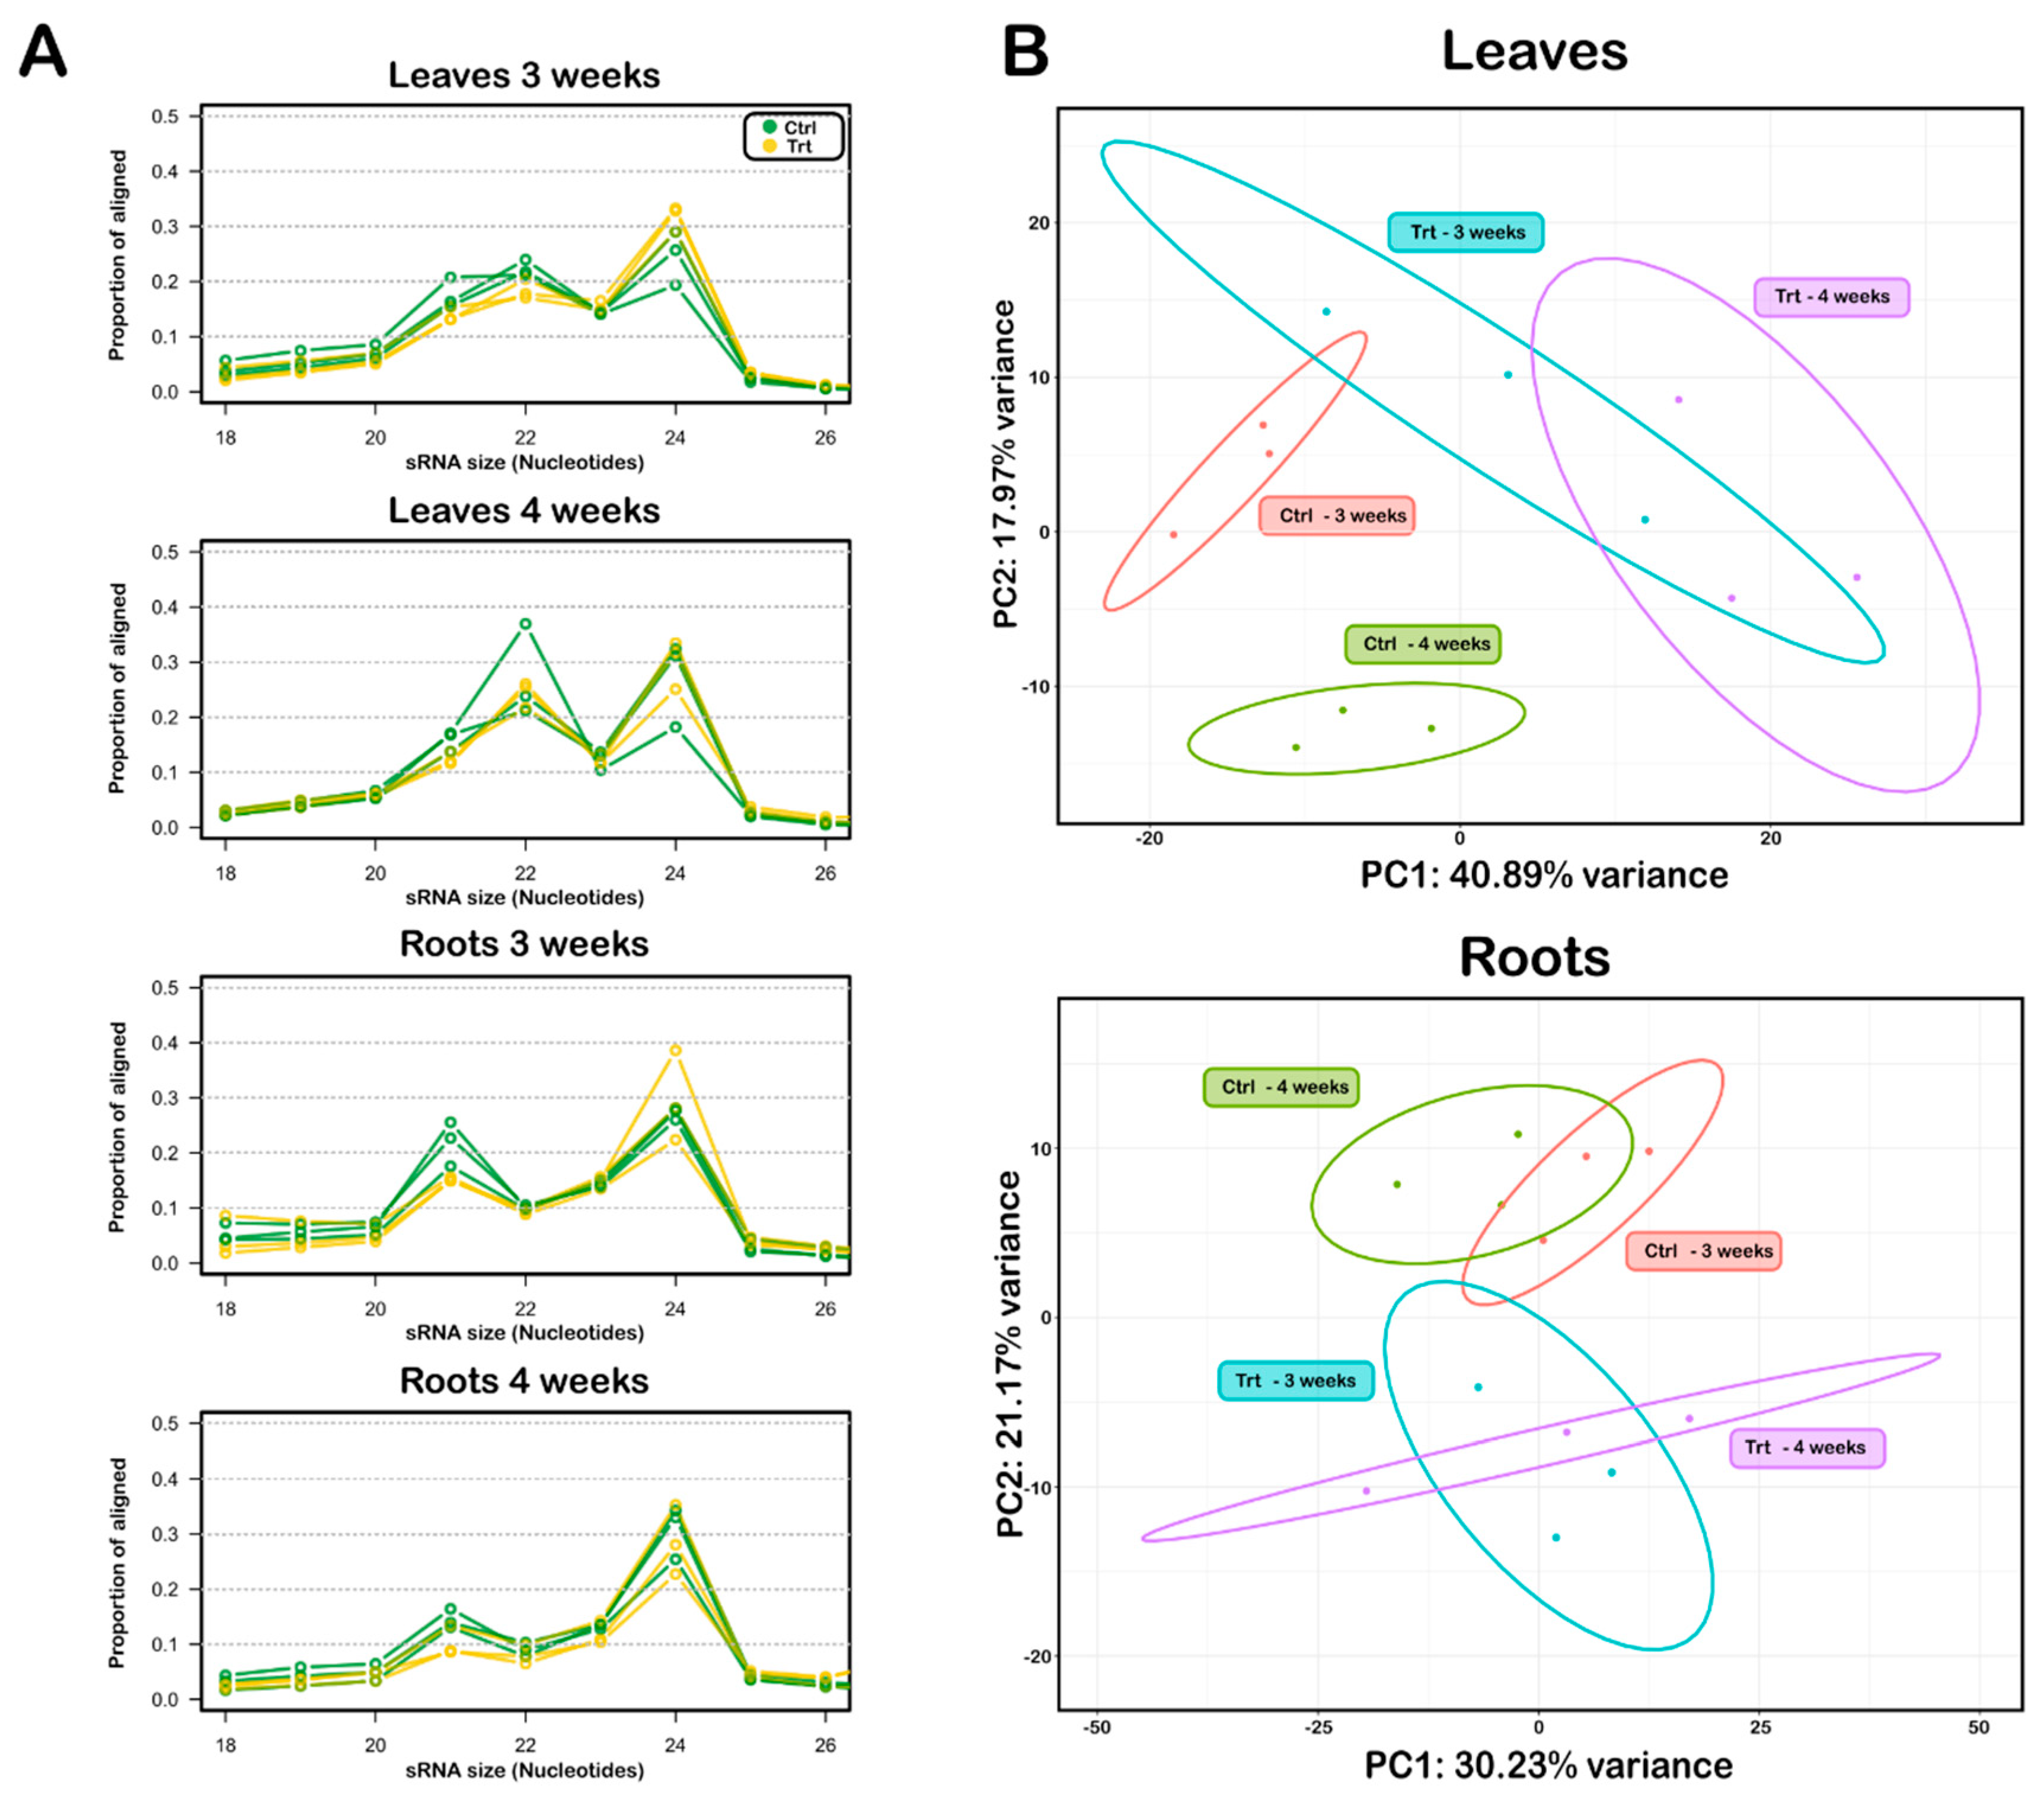
Figure 2.
miRNAs show organ- and time-specific responses to sulfate deficiency in tomato. (A) Bar plot representing the number of DE miRNAs in each sample, highlighting temporal and organ-specific dynamics. (B) Overlap analysis of DE miRNAs between different samples, showing shared and unique responses. (C) Heatmap displaying the log2 fold-change of expression of all DE miRNAs across samples. Yellow asterisks in the center of each cell denote DE miRNAs. Additional information about miRNA responses to other nutrient deficiencies is included in the right-hand cells. The heatmap was generated using the pheatmap R package with log2 fold-change values derived from the DESeq2 R package Love et al., 2014).
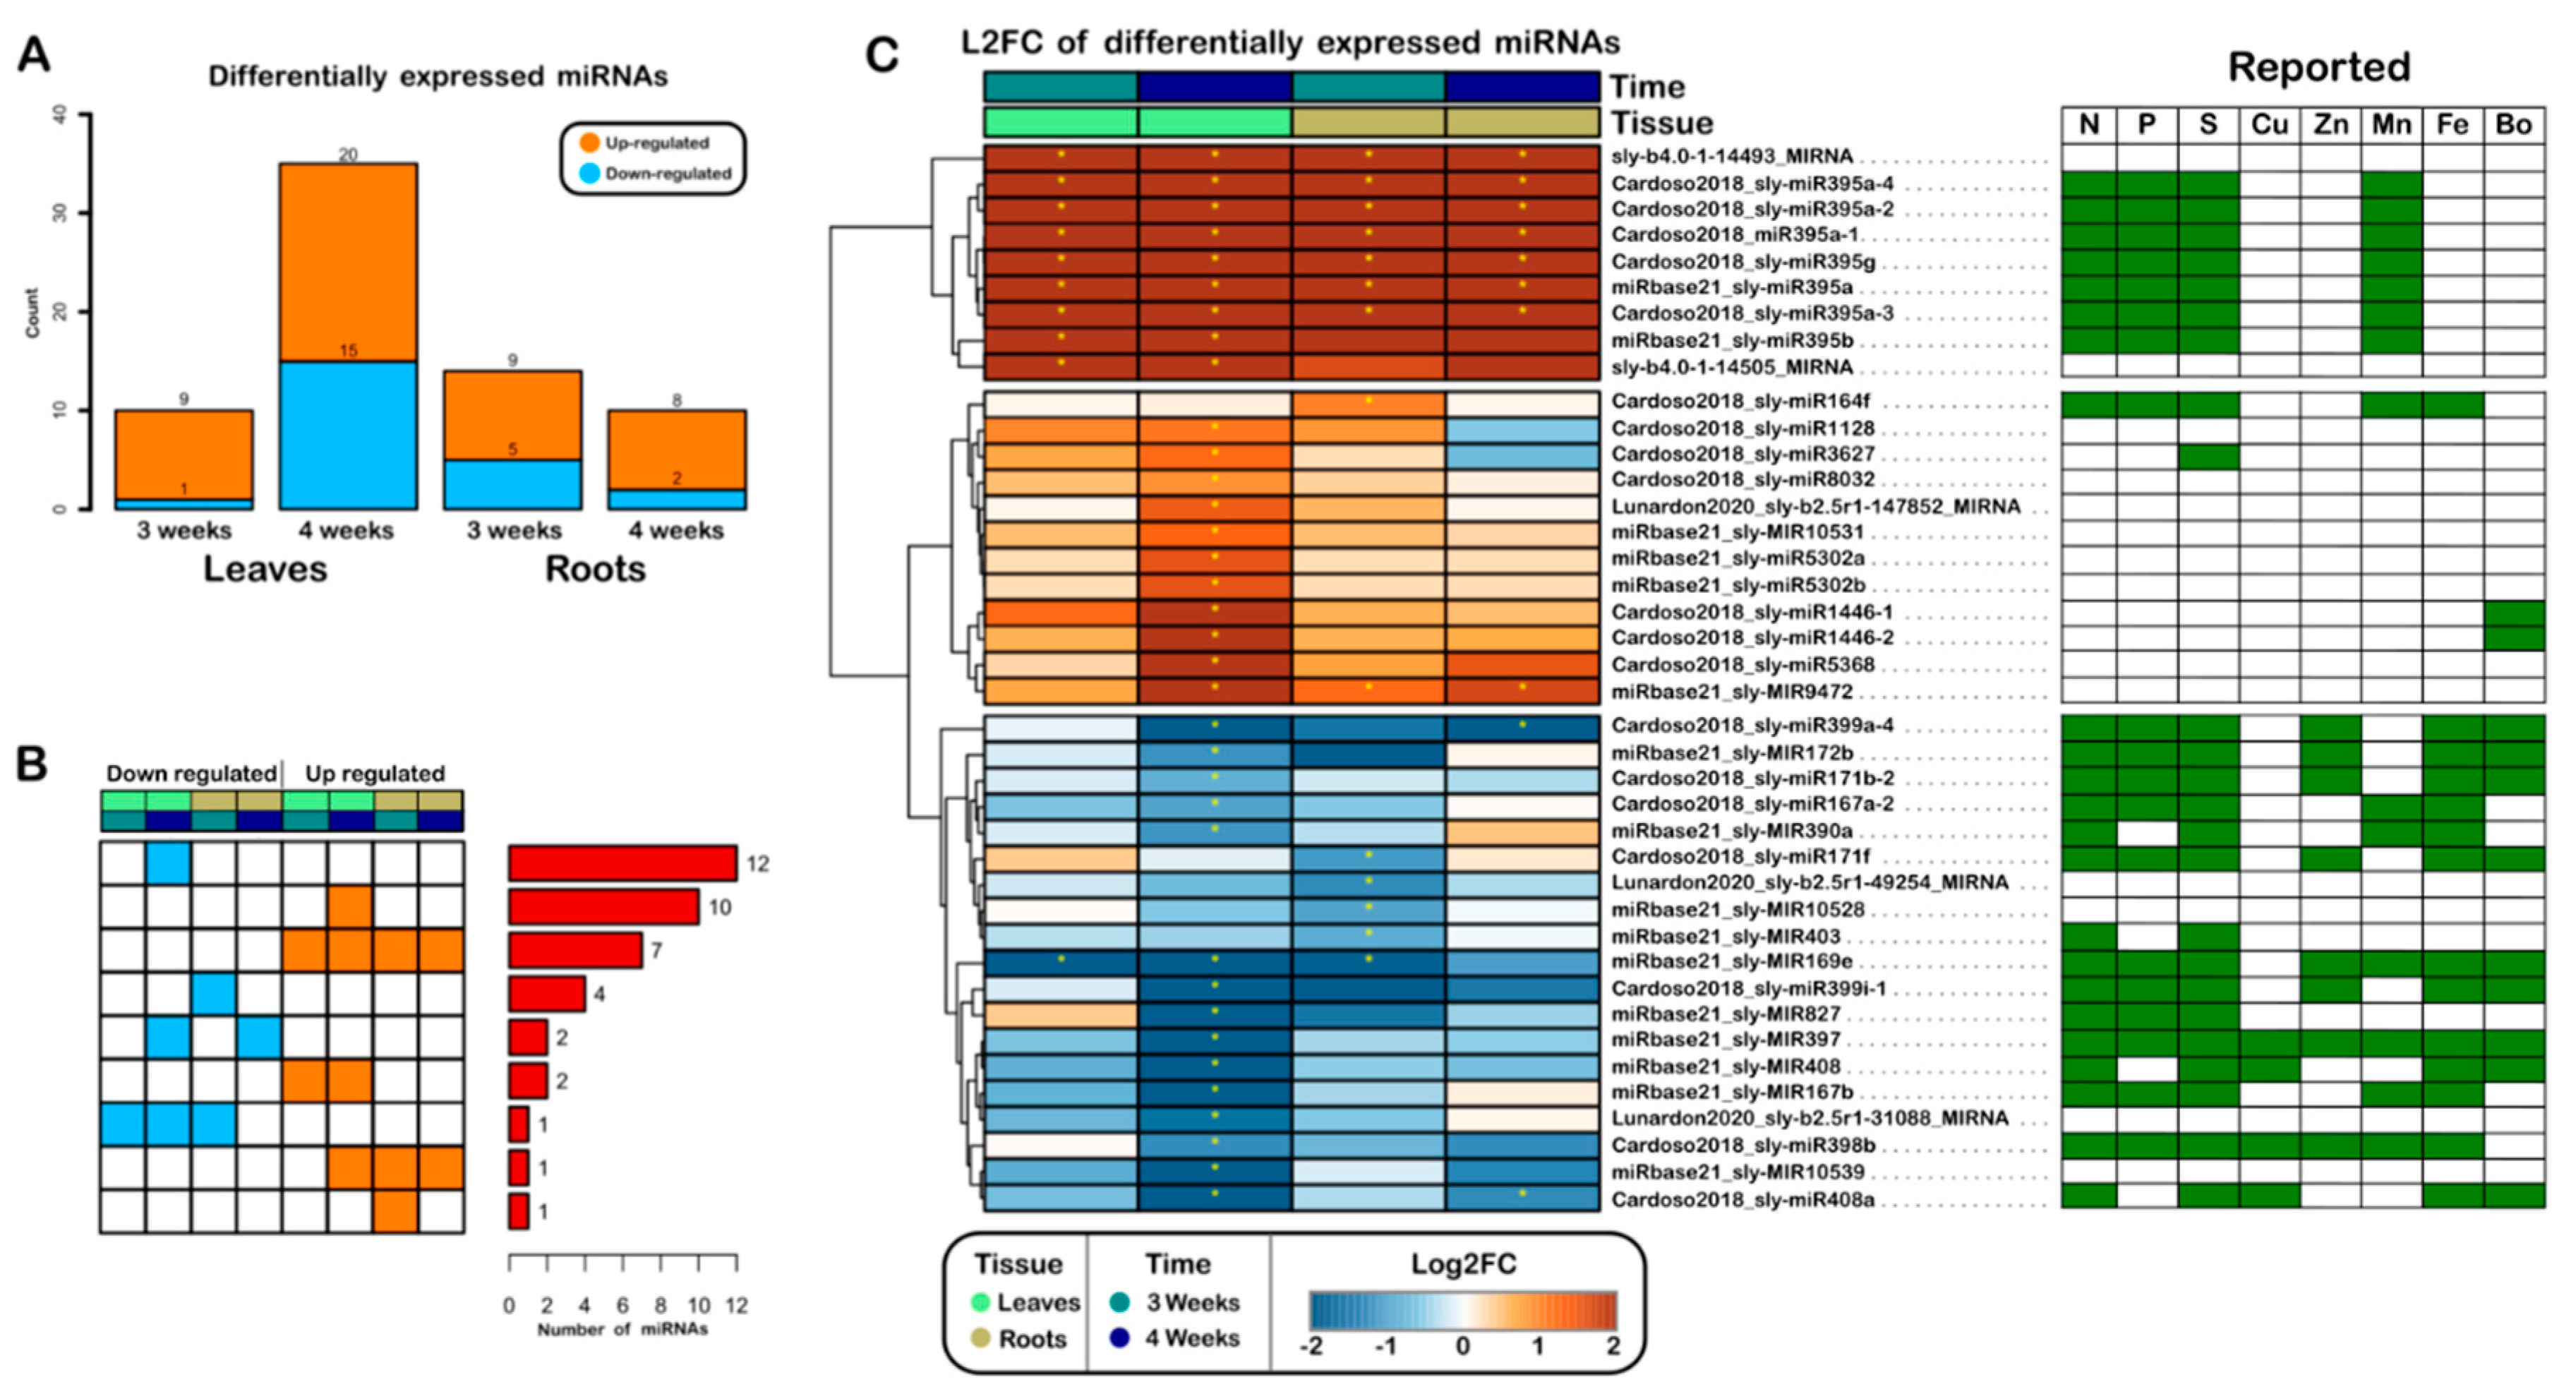
Figure 3.
miRNA-target prediction uncovers tissue-specific responses in sulfate deficiency in tomato. Gene Ontology analysis of DEGs targets by DE miRNAs in sulfate deficiency, showing miRNAs and targets expression patterns in both tissues. GO term enrichment analysis was obtain with topGO R package with GO terms from AgriGO database (Tian et al., 2017). Plot show the top 10 of enriched values in each miRNA-target interaction. Point size is proportional to number of genes that significative in enrichment analysis, while gene ratio was obtain with significative genes / total genes in pathway.
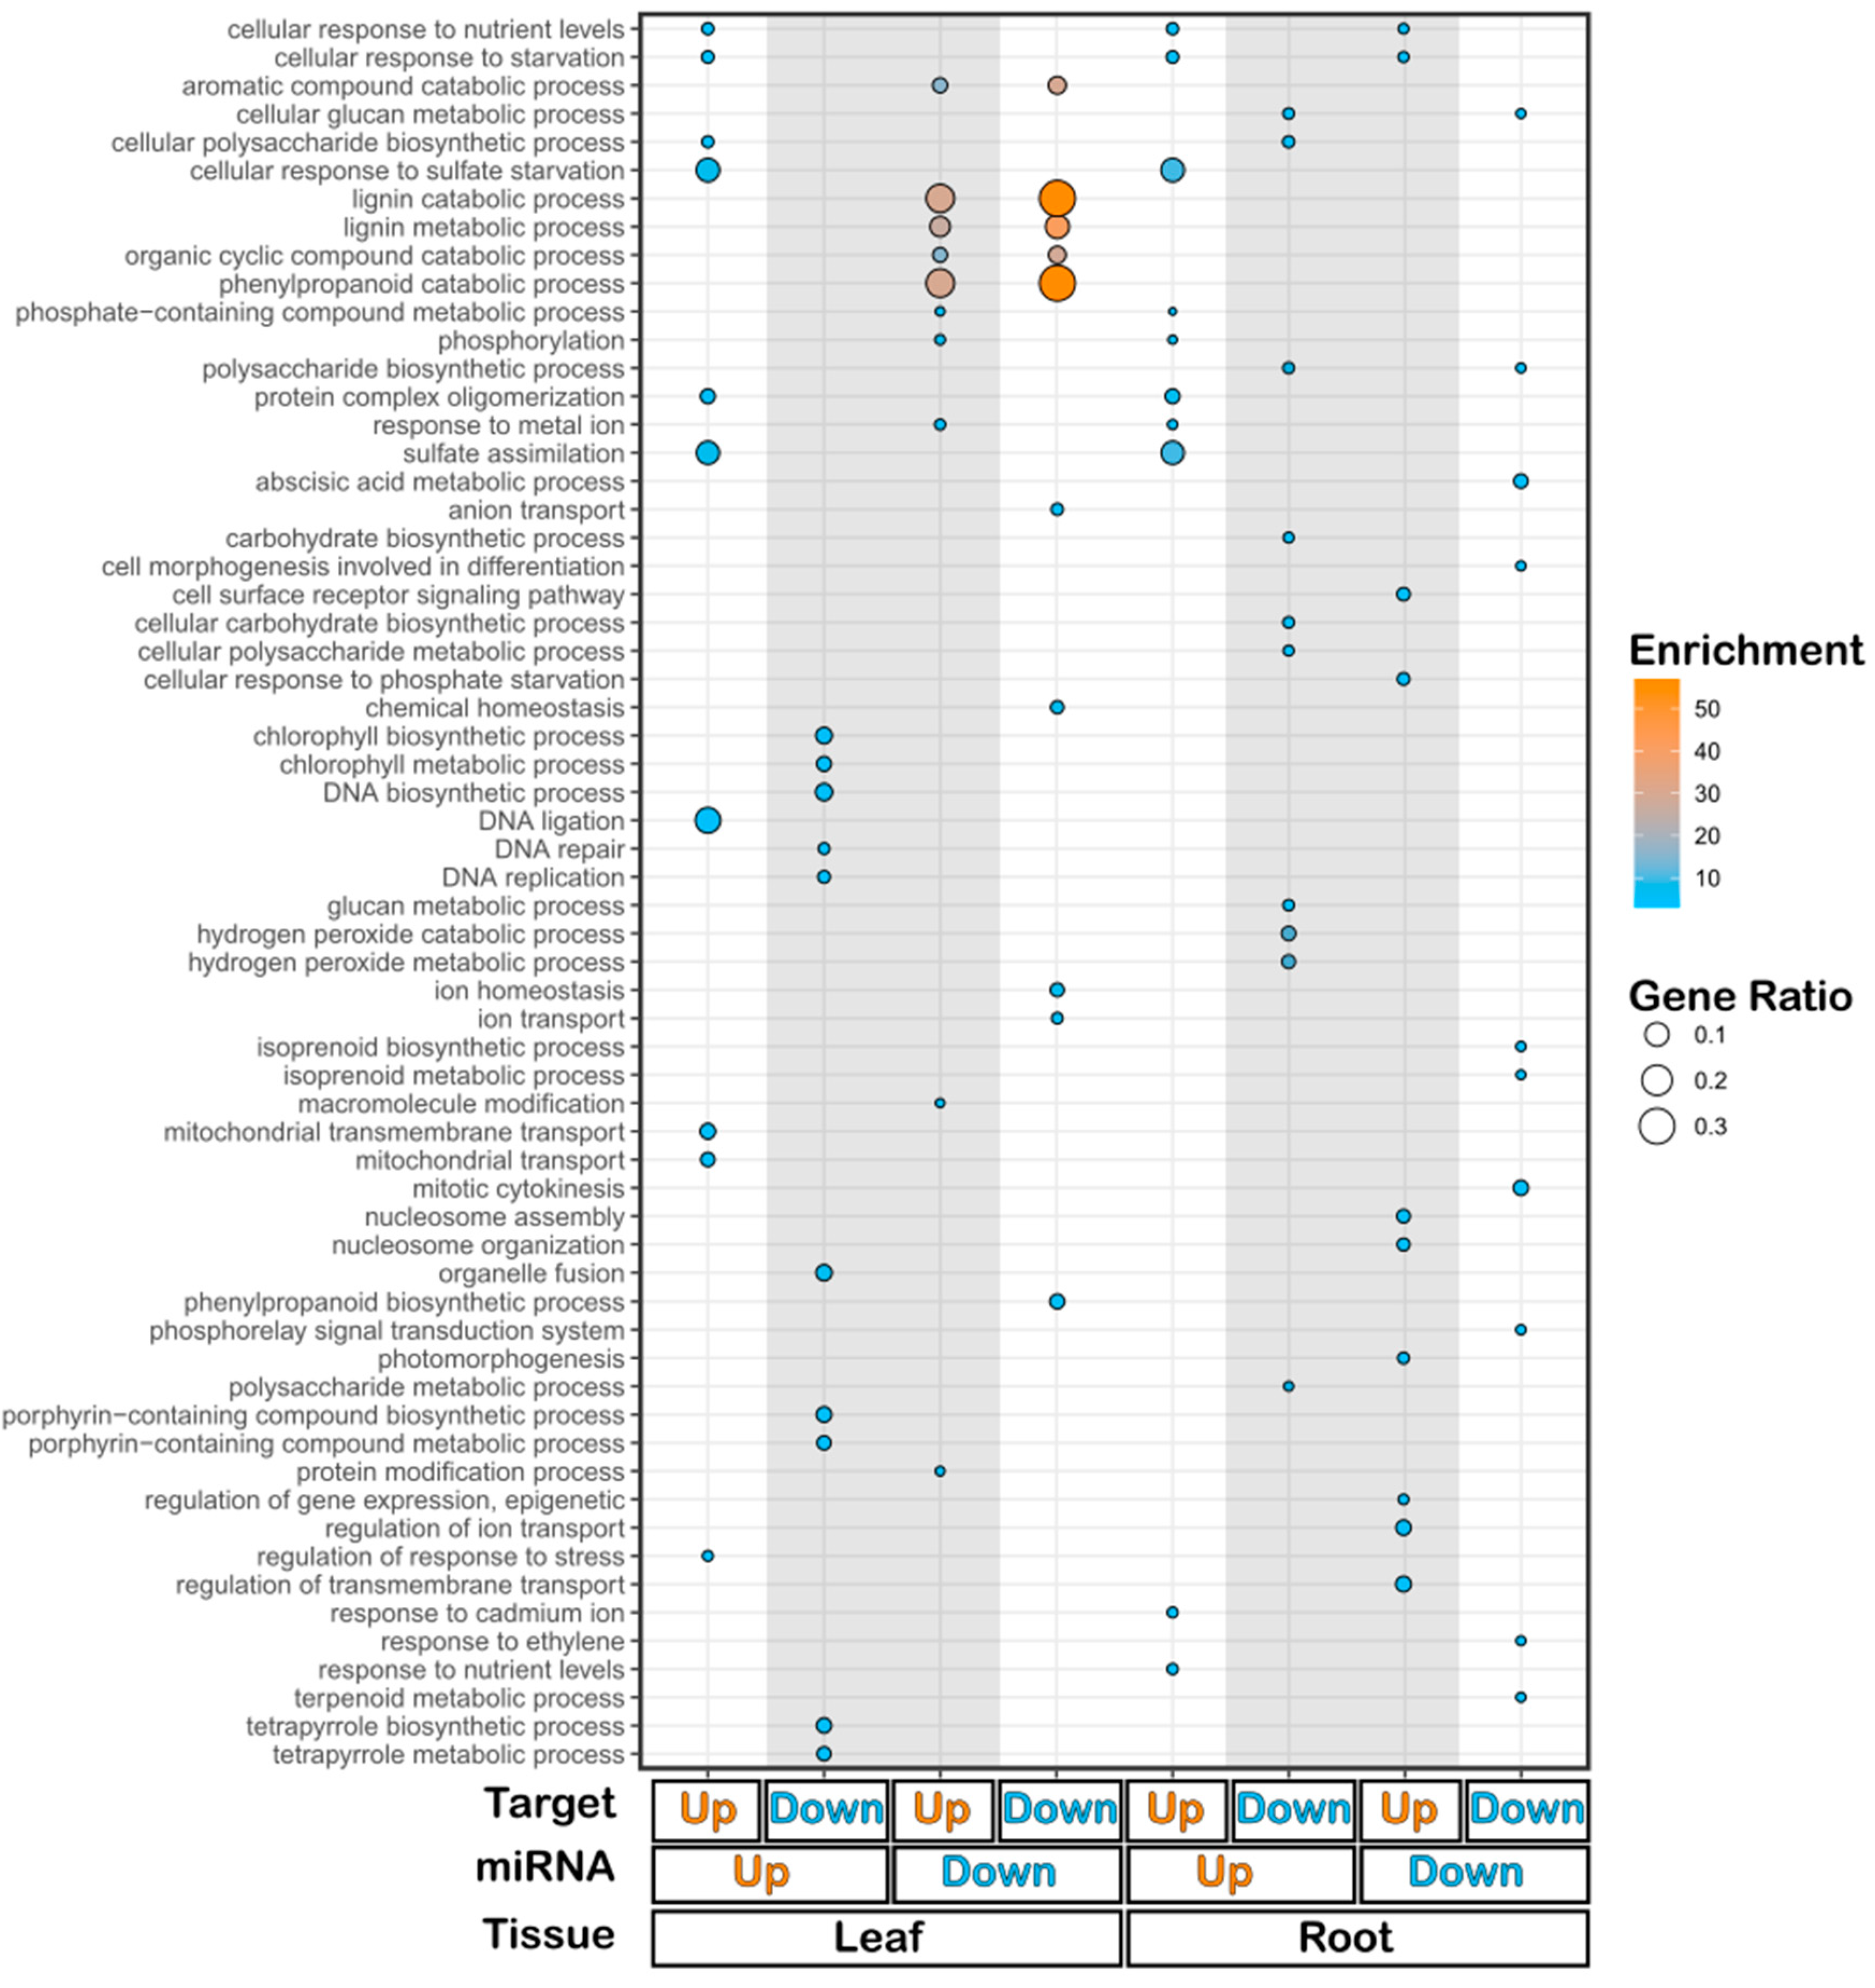
Figure 4.
Tomato miRNA395 targets SlERF2a / Solyc07g054220 in sulfate deficiency response. (A) miR395 cleavage site prediction and gel imagen of 5’-RLM RACE of miRNA395 – SLERF2a. Green arrow shown cleavage SlERF2a fragment. (B) miRNA – TF – target regulatory network was construct with TF – target information from PlantRegMap from PlantTFDB database (Jin et al., 2016), showing specific interaction in leaves, roots, and shared between tissues. (C) GO term enrichment analysis for TF- target interaction in leaves and roots. The enrichment of biological process was obtain with topGO R package with GO terms from AgriGO database (Tian et al., 2017). Plot show the top 20 of enrichment values of each tissue. Point size is proportional to gene ratio of significative vs total genes in pathway.
Disclaimer/Publisher’s Note: The statements, opinions and data contained in all publications are solely those of the individual author(s) and contributor(s) and not of MDPI and/or the editor(s). MDPI and/or the editor(s) disclaim responsibility for any injury to people or property resulting from any ideas, methods, instructions or products referred to in the content. |
© 2025 by the authors. Licensee MDPI, Basel, Switzerland. This article is an open access article distributed under the terms and conditions of the Creative Commons Attribution (CC BY) license (http://creativecommons.org/licenses/by/4.0/).
Copyright: This open access article is published under a Creative Commons CC BY 4.0 license, which permit the free download, distribution, and reuse, provided that the author and preprint are cited in any reuse.


