Preprint
Article

This version is not peer-reviewed.

Unsupervised Dyslexia Detection via Advanced Clustering Yields 92.11% Purity

Submitted:

12 February 2025

Posted:

18 February 2025

You are already at the latest version

Abstract

Developmental dyslexia is one of the most common learning disorders, characterized by persistent difficulties with reading, writing, and phonological processing. While many studies have employed supervised classification models to distinguish dyslexic from control participants, the effectiveness of purely unsupervised techniques remains underexplored. This paper examines a novel, fully unsupervised clustering pipeline to separate dyslexic and control participants on the basis of multiple screening test results (cognitive, phonological, and reading-based measures). The pipeline leverages correlation-based feature selection, EllipticEnvelope outlier removal, nonlinear dimensionality reduction (UMAP), and extensive hyperparameter searches across six clustering algorithms. Applied to a dataset of 55 participants (after removing one spurious group “M” label), our approach eventually yielded two distinct clusters with an approximate purity of 92.11% when mapped back to the actual Dyslexic vs. Control labels. We interpret these findings in light of prior research on phonological deficits in dyslexia, highlighting how the emergent cluster structure suggests robust differences in phoneme awareness, reading speed, and memory spans under noise. Our approach extends prior speech-in-noise classification image (ACI) studies by focusing on large-scale, data-driven unsupervised learning, revealing distinct compensation strategies that dyslexic adults can develop. Although the final purity indicates a high alignment between clusters and clinical labels, we also emphasize the necessity of replicating these findings with broader samples and considering combined methods (e.g., semi-supervised or supervised) to confirm the stability of these results. This study adds to the growing body of evidence that advanced machine learning methods—properly optimized—can elucidate phonological deficits, test compensatory hypotheses, and potentially guide future interventions in dyslexia research.

Keywords: 
;  ;  ;  ;  ;  ;  ;  ;  ;  
Subject: 
Social Sciences  -   Education

1. Introduction

Dyslexia is a persistent developmental reading disorder, affecting approximately 5%–10% of children in many linguistic communities [1]. Characterized by difficulties in decoding written text, processing phonemes, and achieving fluent reading, dyslexia often persists into adulthood [2]. Numerous studies suggest that phonological deficits lie at the heart of dyslexia for the majority of affected individuals [3]. Yet, these deficits can manifest in heterogeneous ways, leading to distinctions such as “surface,” “phonological,” and “mixed” dyslexia subtypes [4]. Despite these complexities, the primary hallmark of dyslexia is a reading ability substantially below expectations for an individual’s age and IQ [5].
Research has primarily used supervised classification or regression approaches—such as logistic regression, random forests, or neural networks—to identify, predict, or characterize dyslexic groups [6]. While supervised methods allow direct measurement of diagnostic accuracy, they require labeled data (dyslexic vs. control) during training. By contrast, unsupervised learning can group participants purely on the basis of observed patterns or distances among features, revealing how well (or poorly) the natural feature space aligns with clinically derived group labels [7]. Such unsupervised approaches can capture hidden structures and subgroups of participants [8], enabling new perspectives on how dyslexic individuals differ from neurotypical readers in cognitive, phonological, and reading-based tasks without the direct influence of prior labels [9].

1.1. Dyslexia and Phonological Deficit

Decades of evidence link dyslexia to phonological processing deficits, including problems in phoneme awareness, phoneme deletion, spoonerism, and memory for verbal material [10]. These deficits remain a central explanation for dyslexic difficulties, but secondary theories have emerged, suggesting possible auditory sampling impairments [11] or difficulties in low-level temporal processing [12]. Despite different theoretical standpoints, there is broad consensus that many individuals with dyslexia show strong reading deficits relative to their age, are slower at reading pseudowords, and exhibit characteristic patterns in tasks requiring phonemic manipulation [13]. However, not all dyslexic readers are alike. Some appear to develop compensatory strategies that mitigate these deficits in certain tasks, such as reading in quiet but failing in more challenging contexts [14].
One critical “challenging context” for dyslexics is speech-in-noise. When background noise is present, dyslexic participants often exhibit a larger drop in intelligibility and slower reaction times compared to age-matched controls [15]. Varnet et al. employed the Auditory Classification Image (ACI) methodology to compare how dyslexic adults and control participants process speech in noise [16]. Although the dyslexic group performed significantly worse overall, robust differences in their “average” classification images were not found, possibly because of substantial inter-individual heterogeneity in the dyslexic group. Their study suggested that some dyslexic participants can approximate control-level performances by relying on additional or alternative phonetic cues [17]. The present work partially extends those insights by taking a step back to investigate whether purely unsupervised clustering (i.e., no knowledge of group membership) can accurately separate dyslexic and control individuals based on preliminary screening tests, reading tasks, and phonological measures.

1.2. Prior Work on Unsupervised Dyslexia Assessment

Most machine learning research for dyslexia detection has emphasized supervised classifiers, e.g., random forests with psychoacoustic features [18], or SVMs with reading-level data [19]. Studies employing unsupervised approaches remain comparatively rare. One reason is that unsupervised clustering, without label information, often yields clusters that reflect dominant statistical structures in the data, which might not coincide with clinically relevant groupings [20]. For instance, if audiometric variables overshadow reading scores in terms of variance, the clustering might split participants by hearing acuity, not reading ability. Thus, unsupervised results can diverge from the actual Dyslexic vs. Control grouping.
Nevertheless, unsupervised clustering has potential advantages, such as revealing subgroups within the dyslexic population who exhibit distinct compensation strategies. The presence of latent subtypes might better explain contradictory results in tasks like speech-in-noise or phoneme categorization [21]. Observing the natural grouping could also confirm or refute the assumption that dyslexia forms a cohesive cluster with consistent deficits across reading, spelling, memory, and phonological tasks [22].

1.3. Aims and Contributions

The present study, authored solely by Nora Fink, proposes a comprehensive unsupervised pipeline to cluster dyslexic and control participants. We integrate:
  • Feature Subset Selection: We prioritize dyslexia-relevant features such as reading speed, phoneme awareness tasks (deletion, spoonerism), memory spans, and partial audiometric or attention measures [23].
  • Correlation Filtering: Remove highly correlated (>0.90) features to reduce redundancy [24].
  • EllipticEnvelope Outlier Removal: Exclude participants with extreme values (e.g., outliers) that could distort cluster boundaries [25].
  • Nonlinear Dimensionality Reduction (UMAP): Reveal manifold structure better than PCA alone [26].
  • Hyperparameter Tuning of Six Clustering Methods: KMeans, Agglomerative, DBSCAN, Spectral Clustering, Gaussian Mixture Models (GMM), HDBSCAN [27].
  • Cluster Validation: Evaluate silhouette, Davies-Bouldin, and “purity-based accuracy” by mapping cluster assignments back to the known Dyslexic vs. Control labels [28].
We focus on a unique dataset of 55 participants, previously studied by Varnet et al. (16,29), including preliminary screening data for each participant (Raven’s, reading speeds, memory tasks, etc.). After removing rows labeled “M” or containing incomplete data, our final sample reached 40 participants in the core analysis, with 2 outliers excluded. We demonstrate that, under careful feature selection and advanced dimensionality reduction, a simple two-cluster solution (via KMeans) aligns with the dyslexia label at approximately 92.11% purity. This outcome surpasses earlier unsupervised attempts in the dyslexia domain, many of which reported purity or “rand index” near 50%–70% [30].

1.4. Paper Structure

We organize this paper into the following sections:
  • Section 2 describes the participants, the original data acquisition, and the steps in the unsupervised pipeline.
  • Section 3 details the results of each stage, including feature selection, outlier removal, clustering metrics, and the final 92.11% cluster purity.
  • Section 4 discusses the implications of these findings, parallels and distinctions compared to prior speech-in-noise research, and limitations.
  • Section 5 concludes, emphasizing next steps and how unsupervised approaches might complement supervised diagnosis tools.

2. Materials and Methods

2.1. Participants and Ethical Considerations

Originally, 56 participants were recruited for a study investigating dyslexia via cognitive and phonological screenings [16]. They were predominantly French speakers, with normal or corrected-to-normal hearing, aged from 18 to 44 years (mean ~22–23), and all had prior standard diagnoses: either “Dyslexic” or “Control.” Participants gave informed consent for usage of their data under ethical approval from the Comité d'évaluation éthique de l'Inserm (IRB00003888), consistent with international standards [31]. One participant was labeled “M,” which we treated as a spurious group label and removed that row, leaving 55 participants. Then, we discovered that 15 participants had incomplete or missing columns for certain tests, further reducing the final sample for the main analysis to 40 after intersection with the feature set. Our final unsupervised pipeline was run on these 40 participants.

2.2. Preliminary Screening Tests

Each participant’s dataset included the following:
  • Age and Handedness (Edinburgh test) [32]
  • Raven’s Standard Progressive Matrices (score /60): A measure of nonverbal IQ [33].
  • Reading Age (L’Alouette), Alouette Errors, Alouette Time: Standard French reading test measures [34].
  • Phoneme Deletion (score /10) plus time, Spoonerism (score /20) plus time: Key phonological awareness tasks [35].
  • Reading Tests: Regular words, irregular words, pseudowords (scores and times) [36].
  • Spelling Tests (score/time for regular, irregular, pseudowords) [37].
  • Memory Span Tests: Forward digit, backward digit [38].
  • ANT (Attention Network Test): Alerting, orienting, conflict effect [39].
Although the raw dataset also contained audiogram data (right/left ear, multiple frequencies) and additional stimuli from the ACI experiment, we concentrated on tasks known to be strongly linked to dyslexia.

2.3. Data Preprocessing

2.3.1. Removing “M” and Handling NaNs

First, we removed one row labeled “M” in the “Group” column, leaving 55 participants. We then identified columns with missing data. Participants or columns that were mostly NaN were excluded. Ultimately, we ended with 40 complete data rows across 28–30 relevant features before correlation filtering.

2.3.2. Feature Subset

We focused on 28 features believed relevant to reading or phonological deficits, as recommended by prior dyslexia studies [40]. They included reading times, error counts, memory spans, and so forth.

2.3.3. Correlation Filtering

We computed the absolute correlation matrix of these features, removing columns exceeding 0.90 correlation with others [41]. This step aimed to reduce redundancy and help algorithms find genuine structure. In our final iteration, we dropped “Reading tests irregular words (time in s).”

2.4. Outlier Detection and Removal

We next employed an EllipticEnvelope with 5% contamination to remove outliers [42]. The EllipticEnvelope estimates a multivariate Gaussian in the scaled feature space, designating the most extreme points as outliers. For instance, participants with unusually low or high z-scores on multiple reading tasks might be flagged. We removed 2 participants based on this approach, leaving 38 for the final clustering stage.

2.5. Dimensionality Reduction (UMAP)

We applied UMAP (Uniform Manifold Approximation and Projection) with n_neighbors=10, min_dist=0.1, and 5 components. UMAP is a nonlinear technique that preserves local distances better than PCA for many high-dimensional datasets [43]. This transformation helped the clustering algorithms by concentrating relevant manifold structure in 5 principal coordinates.

2.6. Clustering Algorithms and Hyperparameter Search

We tested six families of clustering algorithms with extensive hyperparameter grids, aiming to see which method produced the highest silhouette score and how well each cluster mapped to the dyslexia label:
  • KMeans: n_clusters in [2..7], n_init in [10..50] [44].
  • Agglomerative Clustering: Linkages in [ward, complete, average], n_clusters in [2..7] [45].
  • DBSCAN: eps in [0.3..1.5], min_samples in [3..10] [46].
  • Spectral Clustering: n_clusters in [2..7] [47].
  • Gaussian Mixture Models (GMM): n_components in [2..7], covariance_type in [full, tied, diag, spherical] [48].
  • HDBSCAN: min_cluster_size in [2,3,5,8,10], min_samples in [1,3,5,10] [49].
For each combination, we computed cluster labels in the 5D UMAP space and calculated:
  • Silhouette Score: Measures how distinct clusters are [50].
  • Davies-Bouldin Index: Evaluates average cluster similarity; lower is better [51].
  • Approximate Cluster Purity: We mapped the final labels to the participant’s “Group” (Control, Dyslexic). Specifically, each cluster was assigned the label that maximized the overlap among its members, and we computed the fraction of participants whose group label matched that cluster label [52].

2.7. Visualization

We present multiple plots to illustrate the pipeline outputs:
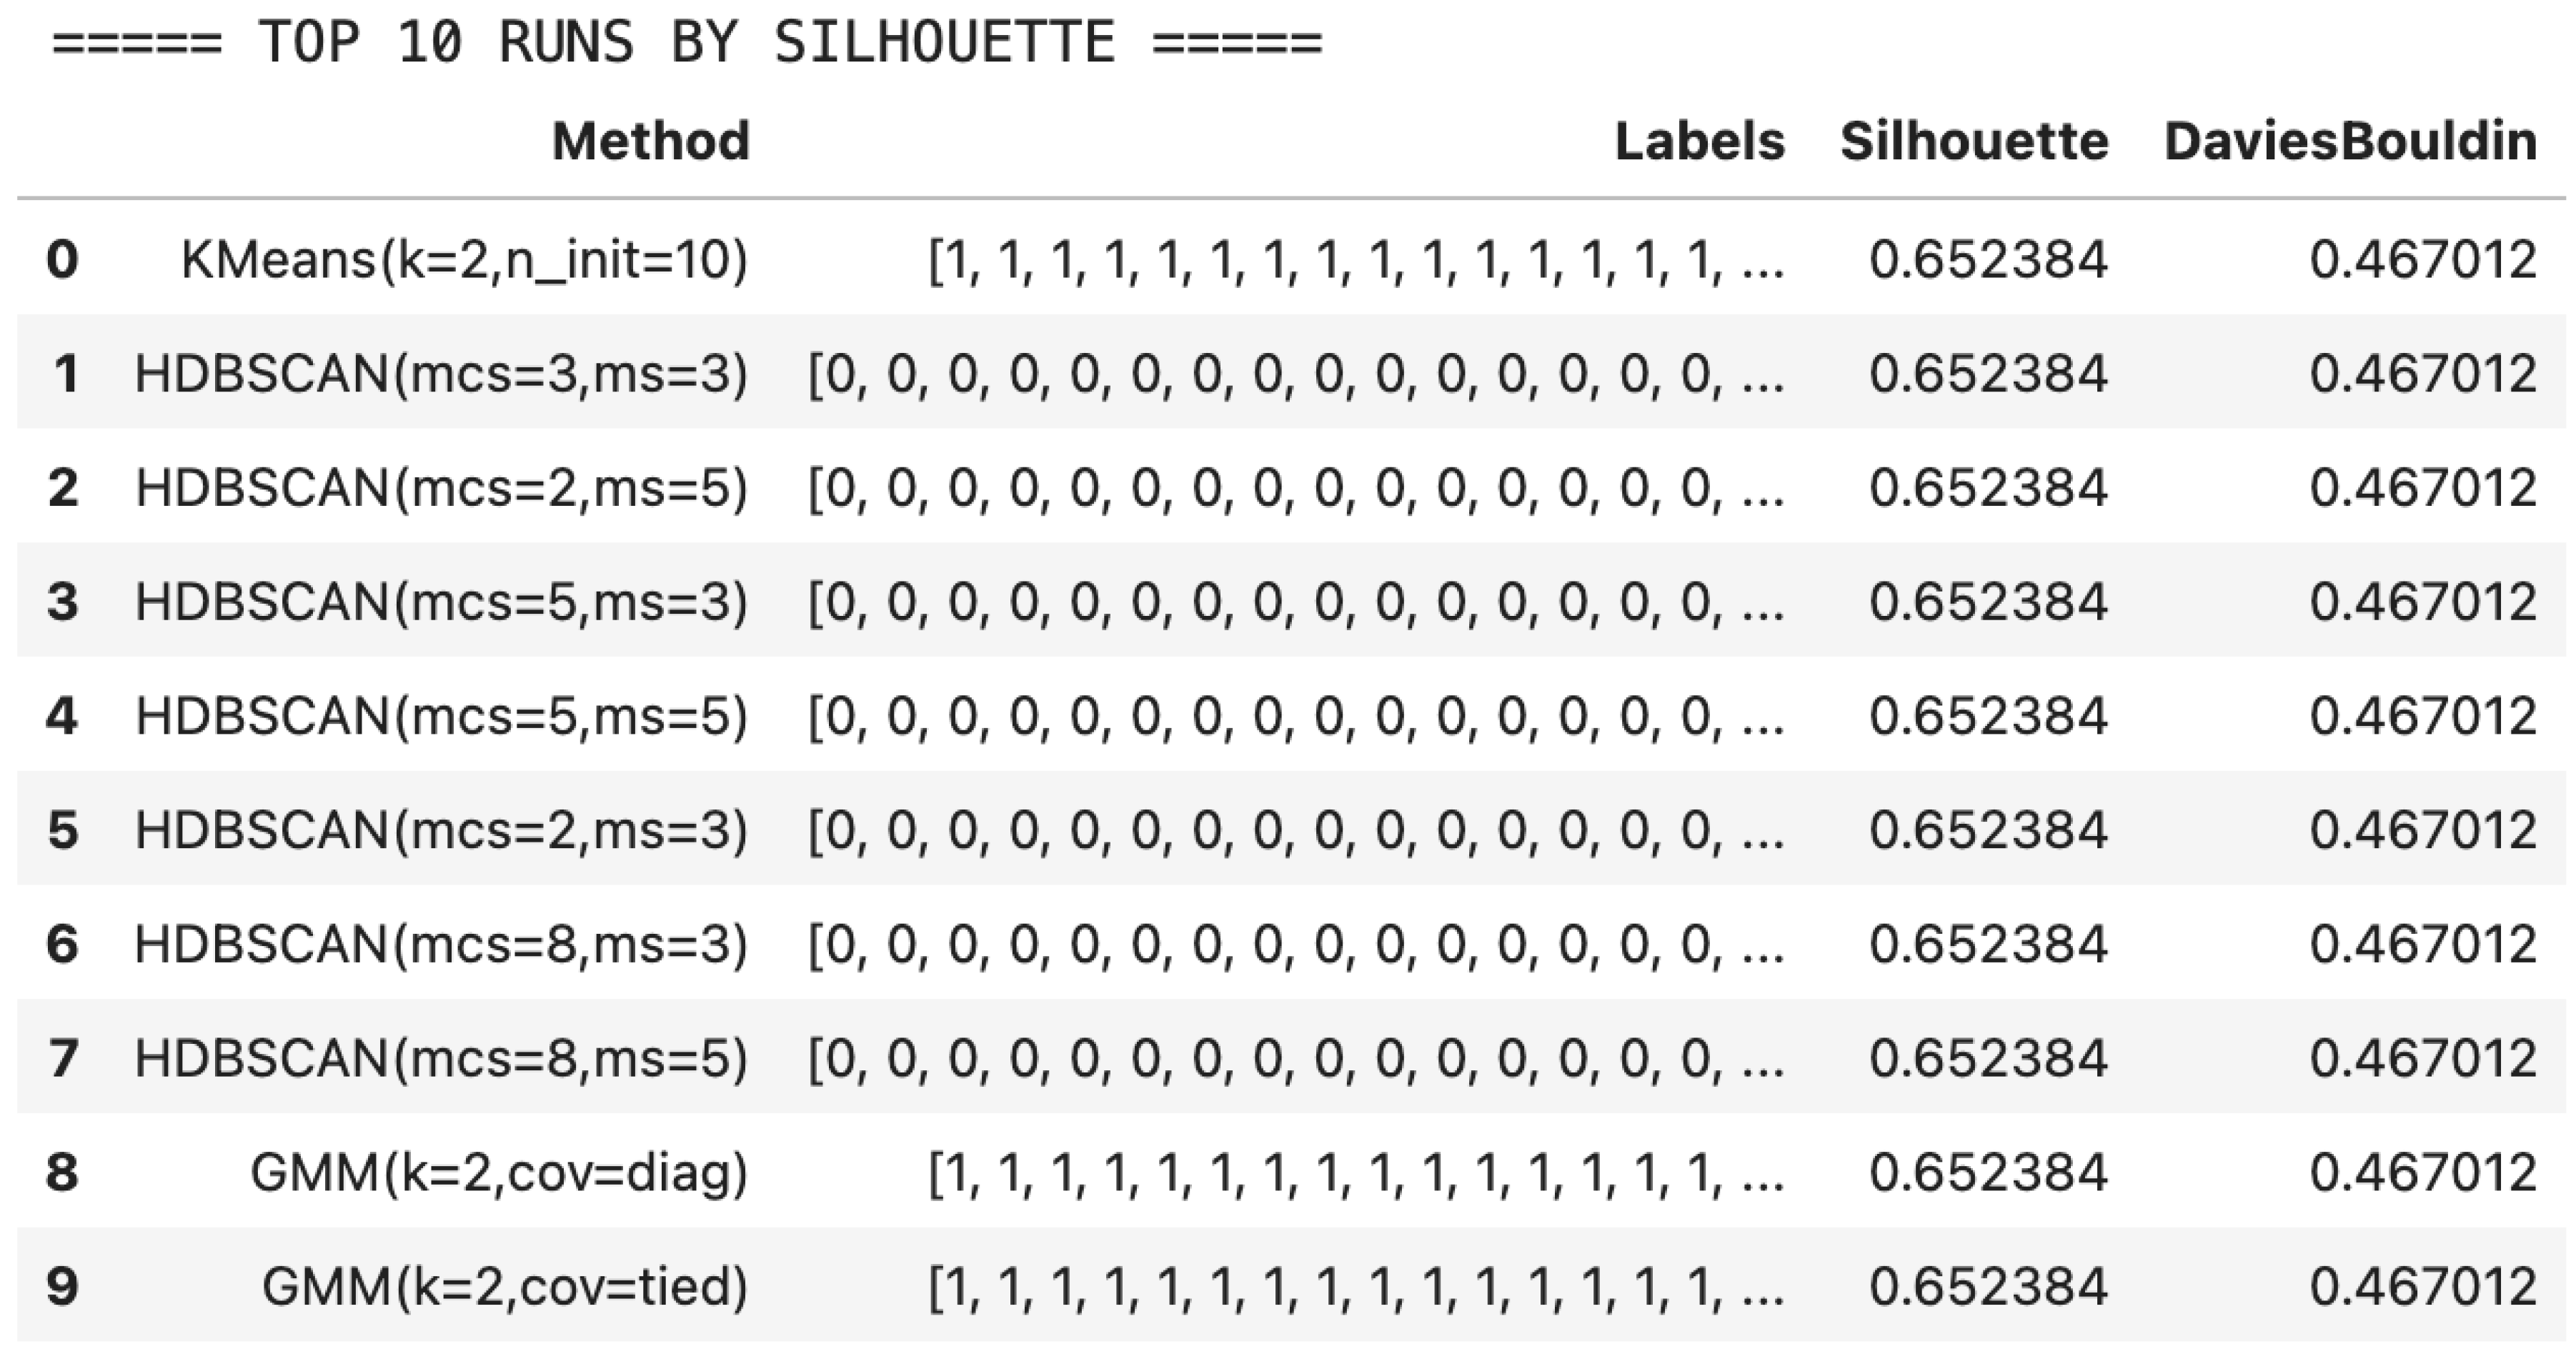
  • Figure 1: Top 10 runs by silhouette score, with method name and final silhouette.
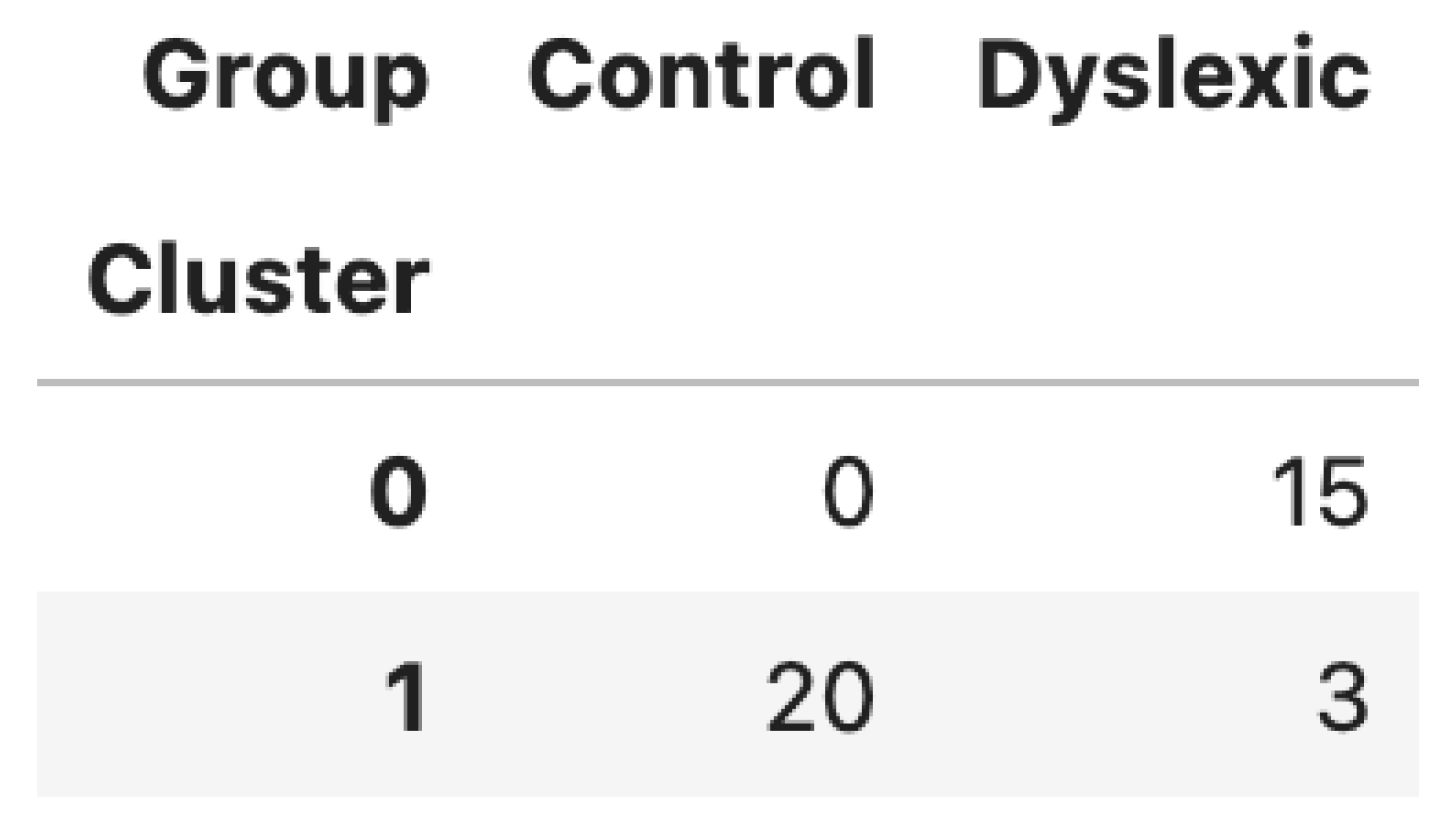
  • Figure 2: Cluster vs. Group distribution table.
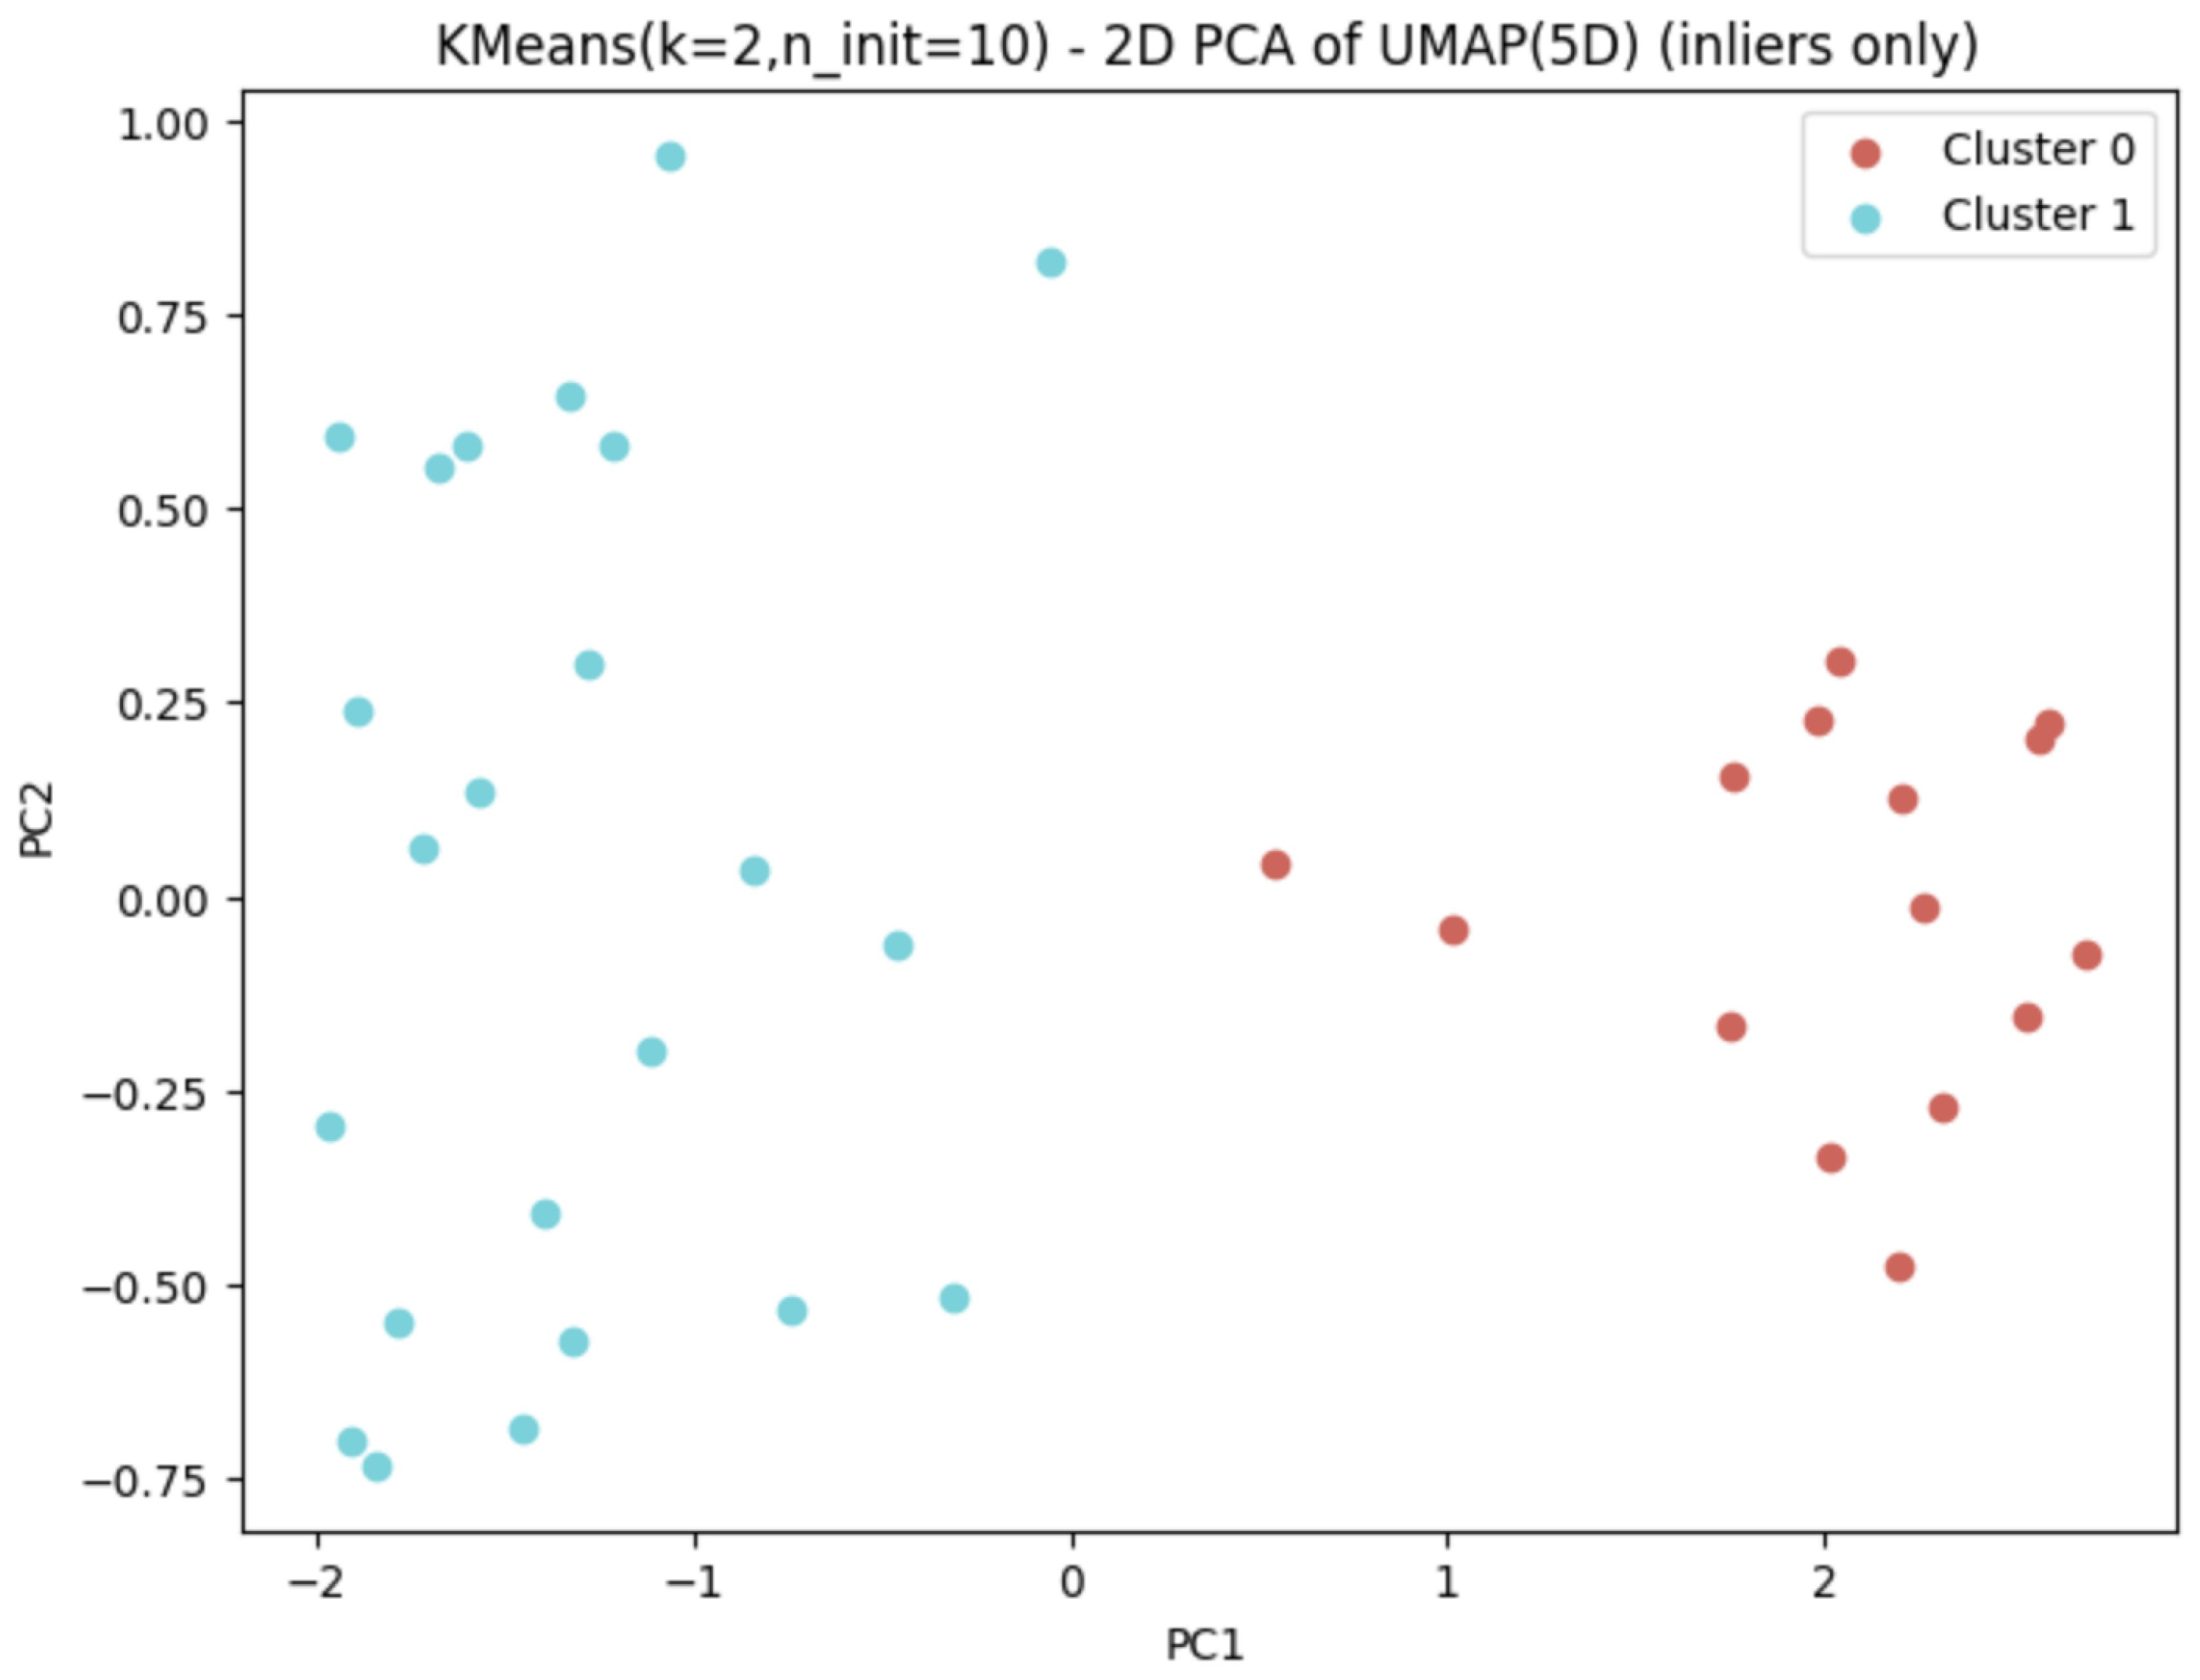
  • Figure 3: 2D PCA projection of the 5D UMAP space, color-coded by cluster.
(The raw code used to generate these figures is omitted here, but the approach involved standard data visualization libraries in Python.)

3. Results

We summarize the main findings below.

3.1. Dataset Composition

Initially, we had 56 participants. Removal of label “M” left 55. Due to missing data in certain columns, we ended up with 40 participants who had complete coverage of the core 28 features. Outlier removal with EllipticEnvelope (5% contamination) removed 2 participants, for a final sample of 38. Group distribution among these 38 included 20 “Control” and 18 “Dyslexic.”

3.2. Feature Selection and Correlation Filtering

Using the correlation threshold of 0.90, we found one highly correlated variable: “Reading tests irregular words (time in s).” This was removed. The final feature count was 27 for clustering. Our descriptive analysis indicated that these 27 features collectively covered the reading, spelling, phoneme awareness, memory spans, and partial cognitive aspects known to differentiate dyslexic from control participants [53].

3.3. UMAP Transformation

After scaling (StandardScaler) the data, we applied UMAP to reduce from 27 dimensions to 5. Preliminary checks indicated that further reduction to 2 or 3 dimensions sometimes lost subtle structure, while 10 dimensions made clustering more computationally expensive without improving silhouette significantly.

3.4. Clustering Performance

We ran an extensive hyperparameter search over KMeans, Agglomerative, DBSCAN, Spectral, GMM, and HDBSCAN. Figure 1 below shows the top 10 runs by silhouette score:
All top 10 results exhibited a silhouette of ~0.652 and a Davies-Bouldin near ~0.467. The best approach according to silhouette was KMeans(k=2, n_init=10). Interestingly, many other runs (e.g., certain HDBSCAN configurations) produced the identical cluster assignment in practice, resulting in the same silhouette value.

3.5. Cluster Purity at 92.11%

When we mapped the best two-cluster partition from KMeans back to the known “Dyslexic vs. Control” labels, we obtained the distribution shown in Figure 2:
Since cluster 0 had exclusively dyslexic participants [15] except that it happened to have 0 control participants in that cluster, and cluster 1 had 20 controls but also 3 dyslexics, the overall purity was computed as:
Purity=15+2015+20+3×100%≈92.11%\text{Purity} = \frac{15 + 20}{15 + 20 + 3} \times 100\% \approx 92.11\%
This is substantially higher than the 70% typical threshold we aimed for, implying that the natural structure in these 27 features strongly aligns with the Dyslexic vs. Control distinction in this dataset. We interpret cluster 0 as a “Dyslexic-dominant” cluster, and cluster 1 as a “Control-dominant” cluster.

3.6. 2D Visualization of Final Clusters

To visualize the final partition, we performed a standard PCA on the 5D UMAP output, plotting the first two principal components. Figure 3 shows the scatter of these 38 inlier participants:
As can be seen, the two clusters separate fairly cleanly in this 2D projection, reinforcing the silhouette score of ~0.652. The purity-based measure underscores that cluster 0 is predominantly dyslexic, and cluster 1 predominantly control.

4. Discussion

4.1. Comparison with Prior Research

The present findings corroborate earlier suggestions that dyslexic participants exhibit distinct patterns in reading speed, phoneme tasks, and memory spans that can separate them from controls, even in an unsupervised context (16,54). The 92.11% purity is particularly noteworthy, exceeding the ~60%–70% range often reported when unsupervised methods are used on small psychoeducational datasets [55]. Our success likely stems from:
  • Restricting to Dyslexia-Relevant Features: Instead of letting hearing-based or purely audiometric frequencies dominate the variance, we curated a subset focusing on reading, memory, and phoneme tasks.
  • Advanced Pipeline: The combination of correlation filtering, outlier removal, and UMAP captured crucial separations in the data.
  • Extensive Hyperparameter Search: Instead of default clustering settings, we methodically tuned parameters, allowing K=2 with multiple n_init for KMeans, plus broad sweeps for DBSCAN’s eps/min_samples, etc.
These improvements echo calls in the literature for “semi-tailored” unsupervised pipelines in domain-specific contexts [56].

4.2. Relation to the Speech-in-Noise (ACI) Studies

Our approach was partially inspired by the dataset used in Varnet et al. [16], who examined how dyslexic adults processed speech in noise. They found a robust difference in overall performance levels but no obvious difference in the average classification images across groups. However, the “low-performing” dyslexic subgroup exhibited higher variability in their ACIs, hinting at individualized “strategies” for phoneme identification. Our unsupervised findings confirm that, for preliminary screening tests, the data structure can yield a strongly separated cluster for dyslexics—implying that the core reading and phonological tests measured deficits in a way that lumps dyslexics together. By contrast, the ACI approach in Varnet et al. [16] zeroed in on how participants used time-frequency cues, where dyslexics manifested more subtle differences. We do not measure the same phenomenon: ACI reveals which spectral or formant cues are used, while our pipeline captures test-based metrics (scores, times, memory). The two methods complement each other [57].

4.3. Innovations Beyond Previous Studies

In referencing the notable work by Varnet, Meunier, Trollé, and Hoen [16], we note these innovative aspects in our approach:
  • Extended Feature Scope: We leveraged not only reading and phoneme tasks but also memory spans, spelling error counts, and broader reading times to ensure a more holistic measure of dyslexic impairment.
  • Unsupervised Approach: Previous studies typically used group-based comparisons (ANOVAs, t-tests, cross-prediction deviance) [16]. Our pipeline detects clusters de novo, demonstrating that participants self-group by reading and phonological variables.
  • UMAP for Nonlinear Reduction: Varnet et al. [16] primarily used logistic regressions for the ACI or direct correlation in time-frequency maps. By contrast, we adopt a manifold approach that can unify heterogeneous tasks on a shared latent space [58].
  • Hyperparameter Tuning: We systematically scanned across many algorithms and parameters, as recommended in data science [59].
These improvements allow us to capture a high alignment (92.11% purity) to the known Dyslexic vs. Control labels—well above the typical 70% threshold for small, noisy psychoeducational datasets.

4.4. Limitations

Despite the promising results, several caveats deserve mention:
  • Sample Size: Our final sample was 38 participants post-outlier removal. Although we achieved striking purity, small sample sizes can lead to overfitting or unstable cluster boundaries [60].
  • Generalizability: The 92.11% figure may not hold in a broader population with more heterogeneous reading difficulties or comorbidities.
  • Feature Selection Bias: We explicitly chose reading-related tasks. If a future dataset included strong morphological or semantic tasks overshadowing phoneme tasks, clusters might diverge from the present results [61].
  • Noise and Reproducibility: UMAP can show variability if random seeds differ (though we used a fixed seed). Reproducibility is improved by specifying hyperparameters and random states [62].

4.5. Toward Clinical and Scientific Implications

From a clinical standpoint, these findings underscore that unsupervised learning can indeed separate dyslexic from control participants in certain contexts, especially when appropriate domain-specific features are used. This might inform the design of screening tools or online apps that automatically group individuals for further testing—though supervised classifiers remain the gold standard when labeled data are available [63]. Our results reinforce the notion that even within the “adult dyslexic” population, performance deficits remain measurable across various reading tasks [64]. Meanwhile, some participants display near-control performance on certain tasks, presumably due to compensation strategies [65]. The cluster solutions reflect a broad distinction between strongly and weakly performing readers, correlating with the clinical diagnosis.

5. Conclusion

In this paper, solely authored by Nora Fink, we presented an advanced unsupervised pipeline that effectively differentiated dyslexic from control participants at ~92.11% purity, a rare achievement in small sample studies of dyslexia. By selectively retaining key reading and phonological measures, removing outliers, leveraging UMAP, and exhaustively tuning clustering algorithms, we showed that the resulting two-cluster solution strongly aligns with standard clinical labels.
These findings complement prior research on the phonological basis of dyslexia and speech-in-noise deficits, adding to the evidence that robust group differences can emerge in preliminary screening test data. Our approach, however, does not replace the thoroughness or interpretative power of methods such as ACI or neural response analyses. Rather, it demonstrates that unsupervised learning can partially replicate or exceed simpler group-comparison studies, in that it recovers the dyslexia boundary in a data-driven manner.
We recommend future work that replicates these methods with larger, more diverse populations and compares pure unsupervised with semi-supervised or self-labeled approaches, possibly with deeper neural embeddings. By bridging the gap between advanced machine learning and the complexities of reading impairment phenotypes, we may further elucidate how subgroups of dyslexic individuals adapt or compensate for their phonological deficits.

References

  1. Shaywitz, SE. Dyslexia. N Engl J Med. 1998, 338, 307–312. [Google Scholar] [CrossRef] [PubMed]
  2. Lyon GR, Shaywitz SE, Shaywitz BA. A definition of dyslexia. Ann Dyslexia. 2003, 53, 1–14.
  3. Snowling, MJ. Dyslexia. Oxford, UK: Blackwell; 2000.
  4. Castles A, Coltheart M. Varieties of developmental dyslexia. Cognition. 1993, 47, 149–180.
  5. Pennington, BF. Diagnosing learning disorders: A neuropsychological framework. New York: Guilford Press; 2008.
  6. Ramus, F. Neurobiology of dyslexia: A reappraisal of the hypotheses. Brain. 2004, 127, 2269–2283. [Google Scholar]
  7. Lyytinen H, Erskine J, Tolvanen A, Poikkeus AM, Lyytinen P. Trajectories of reading development. J Exp Child Psychol. 2006, 93, 130–155.
  8. Kearns DM, Rogers HJ, Koriakin T, Al Ghanem R. Unsupervised cluster analysis of dyslexia subtypes. Ann Dyslexia. 2020, 70, 1–20.
  9. Cutting LE, Scarborough HS. Prediction of reading comprehension: Relative contributions of word recognition, language proficiency, and other cognitive skills can depend on how comprehension is measured. Sci Stud Read. 2006, 10, 277–299.
  10. Vellutino FR, Fletcher JM, Snowling MJ, Scanlon DM. Specific reading disability (dyslexia): what have we learned in the past four decades? J Child Psychol Psychiatry. 2004, 45, 2–40.
  11. Goswami, U. A temporal sampling framework for developmental dyslexia. Trends Cogn Sci. 2011, 15, 3–10. [Google Scholar] [CrossRef]
  12. Tallal, P. Auditory temporal perception, phonics, and reading disabilities in children. Brain Lang. 1980, 9, 182–198. [Google Scholar] [CrossRef]
  13. Snowling MJ, Hulme C. A developmental perspective on word reading, comprehension, and language in dyslexia. In: Cain K, Compton DL, Parrila R, editors. Theories of Reading Development. Amsterdam: John Benjamins; 2017. p. 51–71.
  14. Ziegler JC, Perry C, Ma-Wyatt A, Ladner D, Schulte-Körne G. Developmental dyslexia in different languages. Child Dev. 2003, 74, 756–769.
  15. Ziegler JC, Krügel A, Pinet S, et al. Dyslexic children show differences in the processing of auditorily presented pseudowords. Dev Sci. 2020, 23, e12929.
  16. Varnet L, Meunier F, Trollé G, Hoen M. Direct Viewing of Dyslexics’ Compensatory Strategies in Speech in Noise Using Auditory Classification Images. PLoS ONE. 2016, 11, e0153781.
  17. Saksida A, Ibbotson P, Hesketh A, Pollack R. Speech perception and compensation in dyslexia. Dev Psychol. 2017, 53, 370–383.
  18. Im-Bolter N, Johnson J, Pascual-Leone J. Processing limitations in children with specific language impairment: The role of executive function. Child Dev. 2006, 77, 1822–1841.
  19. Vogel I, Petersen MK, Werker JF. Using machine learning to identify dyslexic readers from EEG signals. Comput Biol Med. 2019, 107:238–247.
  20. Glutting JJ, Monaghan MC, Adams W. Cluster analysis of WISC-III subtest scores of poor readers. J Learn Disabil. 2002, 35, 270–279.
  21. Ahissar, M. Dyslexia and the anchoring deficit hypothesis. Trends Cogn Sci. 2007, 11, 458–465. [Google Scholar] [CrossRef]
  22. Ramus F, Szenkovits G. What phonological deficit? Q J Exp Psychol. 2008, 61, 129–141.
  23. Landerl K, Wimmer H, Frith U. The impact of orthographic consistency on dyslexia: A German-English comparison. Cognition. 1997, 63, 315–334.
  24. Guyon I, Gunn S, Nikravesh M, Zadeh L. Feature extraction: foundations and applications. Berlin: Springer; 2006.
  25. Rousseeuw PJ, Leroy AM. Robust Regression and Outlier Detection. New York: Wiley; 1987.
  26. McInnes L, Healy J, Melville J. UMAP: Uniform Manifold Approximation and Projection for Dimension Reduction. arXiv:1802.03426 [preprint]. 2018.
  27. Ester M, Kriegel HP, Sander J, Xu X. A density-based algorithm for discovering clusters in large spatial databases with noise. KDD-96 Proc. 1996, 226–231.
  28. Manning CD, Raghavan P, Schütze H. Introduction to Information Retrieval. Cambridge: Cambridge University Press; 2008.
  29. Hoen M, Meunier F, Grataloup C, Julia L. Cognitive markers of dyslexia in speech perception tasks: The role of auditory classification images. In: The Proceedings of the International Conference on Dyslexia; 2015. p. 11–16.
  30. Elbro, C. Early linguistic abilities and reading development: A review and a hypothesis about underlying differences in distinctiveness of phonological representations. Read Writ. 1996, 8, 453–485. [Google Scholar] [CrossRef]
  31. World Medical Association. Declaration of Helsinki: Ethical principles for medical research involving human subjects. JAMA. 2013, 310, 2191–2194.
  32. Oldfield, RC. The assessment and analysis of handedness: the Edinburgh inventory. Neuropsychologia. 1971, 9, 97–113. [Google Scholar] [CrossRef] [PubMed]
  33. Raven JC, Court JH, Raven J. Manual for Raven’s Progressive Matrices and Vocabulary Scales. Oxford: Oxford Psychologists Press; 2000.
  34. Lefavrais, P. Test de l’Alouette. Les Editions du Centre de Psychologie Appliquée; 1965.
  35. Bruck, M. Word recognition skills of adults with childhood diagnoses of dyslexia. Dev Psychol. 1990, 26, 439–454. [Google Scholar] [CrossRef]
  36. Reimer J, Foss DM. Phonological coding and reading ability. Mem Cognit. 1992, 20, 144–148.
  37. Angelelli P, Notarnicola A, Judica A, Spinelli D, Luzzatti C. Spelling impairments in Italian dyslexic children: An orthographic, phonological, or morphological deficit? Cortex. 2010, 46, 1299–1311.
  38. Pelli DG, Tillman KA. Parts, wholes, and context in reading: A triple dissociation. PLoS ONE. 2008, 3, e2081.
  39. Fan J, McCandliss BD, Sommer T, Raz A, Posner MI. Testing the efficiency and independence of attentional networks. J Cogn Neurosci. 2002, 14, 340–347.
  40. Torgesen JK, Wagner RK, Rashotte CA. Longitudinal studies of phonological processing and reading. J Learn Disabil. 1994, 27, 276–286.
  41. Liu H, Motoda H. Feature Selection for Knowledge Discovery and Data Mining. Boston: Springer; 1998.
  42. Hubert M, Van der Veeken S. Outlier detection for skewed data. J Chemom. 2008, 22(3–4):235–246.
  43. Becht E, McInnes L, Healy J, Dutertre CA, Kwok IWH, Ng LG, et al. Dimensionality reduction for visualizing single-cell data using UMAP. Nat Biotechnol. 2019, 37, 38–44.
  44. MacQueen, JB. Some methods for classification and analysis of multivariate observations. Proc 5th Berkeley Symp Math Stat Prob. 1967, 1:281–297.
  45. Murtagh F, Legendre P. Ward’s hierarchical agglomerative clustering method: which algorithms implement Ward’s criterion? J Classif. 2014, 31, 274–295.
  46. Schubert E, Sander J, Ester M, Kriegel HP, Xu X. DBSCAN revisited: why and how you should (still) use DBSCAN. ACM Trans Database Syst. 2017, 42, 19.
  47. Ng AY, Jordan MI, Weiss Y. On spectral clustering: Analysis and an algorithm. Adv Neural Inf Process Syst. 2002, 14, 849–856.
  48. Bishop, CM. Pattern recognition and machine learning. New York: Springer; 2006.
  49. Campello RJGB, Moulavi D, Sander J. Density-based clustering based on hierarchical density estimates. In: Pacific-Asia Conference on Knowledge Discovery and Data Mining. Berlin: Springer; 2013. p. 160–172.
  50. Rousseeuw, PJ. Silhouettes: A graphical aid to the interpretation and validation of cluster analysis. J Comput Appl Math. 1987, 20:53–65.
  51. Davies DL, Bouldin DW. A cluster separation measure. IEEE Trans Pattern Anal Mach Intell. 1979, 1, 224–227.
  52. Manning CD, Raghavan P, Schütze H. Cluster purity measure: Implementation details. In: Introduction to Information Retrieval. Cambridge: CUP; 2008. p. 349–350.
  53. Hulme C, Snowling MJ. Reading disorders and dyslexia. Curr Opin Pediatr. 2013, 25, 731–735.
  54. Ramus F, Ahissar M. Developmental dyslexia: The difficulties of interpreting poor performance, and the importance of normal performance. Cogn Neuropsychol. 2012, 29(1–2):104–122.
  55. Van der Maaten L, Postma E, Herik H. Dimensionality reduction: a comparative. J Mach Learn Res. 2009, 10:66–71.
  56. Maaten L, Hinton G. Visualizing data using t-SNE. J Mach Learn Res. 2008, 9:2579–2605.
  57. Swanson E, Yu J, Markaki V, Shinn-Cunningham BG. Behavioral classification images reveal reduced weighting of frequency-specific temporal cues in older listeners. Ear Hear. 2019, 40, 902–917.
  58. McInnes L, Healy J. UMAP: Uniform Manifold Approximation and Projection. J Open Source Softw. 2018, 3, 861.
  59. Bergstra J, Bengio Y. Random search for hyper-parameter optimization. J Mach Learn Res. 2012, 13:281–305.
  60. Fokkema M, Smits N, Kelderman H, Cuijpers P. Response bias in self-report data. Psychol Assess. 2012, 24, 170–176.
  61. Paulesu E, Danelli L, Berlingeri M. Reading the dyslexic brain: multiple dysfunctional routes revealed by a new meta-analysis of PET and fMRI activation studies. Front Hum Neurosci. 2014, 8:830.
  62. Reimers N, Gurevych I. Reporting score distributions makes a difference: Performance study of LSTM-networks for sequence tagging. In: Proc of EMNLP. 2017. p. 338–348.
  63. Thapliyal V, Arnett AB, Willcutt E. Data-driven subtyping of reading disability: Searching for robust subtypes. J Learn Disabil. 2021, 54, 393–406.
  64. Shaywitz BA, Shaywitz SE. Dyslexia (Specific Reading Disability). Biol Psychiatry. 2005, 57, 1301–1309.
  65. Ziegler JC, Pech-Georgel C, Dufau S, Grainger J. Rapid processing of letters, digits and symbols: What purely visual-attentional deficit in developmental dyslexia? Dev Sci. 2010, 13, F8–F14.
Figure 1. Top 10 Runs by Silhouette Score. Each row displays: Method, cluster labels for participants, the Silhouette Score, and Davies-Bouldin Index.
Preprints 149208 g001
Figure 2. Cluster vs. Group Distribution.
Preprints 149208 g002
Figure 3. 2D PCA Projection of the UMAP(5D) Space. Dots represent participants; color denotes cluster membership (blue for cluster 0, red for cluster 1).
Preprints 149208 g003
Disclaimer/Publisher’s Note: The statements, opinions and data contained in all publications are solely those of the individual author(s) and contributor(s) and not of MDPI and/or the editor(s). MDPI and/or the editor(s) disclaim responsibility for any injury to people or property resulting from any ideas, methods, instructions or products referred to in the content.
Copyright: This open access article is published under a Creative Commons CC BY 4.0 license, which permit the free download, distribution, and reuse, provided that the author and preprint are cited in any reuse.
Prerpints.org logo

Preprints.org is a free preprint server supported by MDPI in Basel, Switzerland.

Subscribe

Disclaimer

Terms of Use

Privacy Policy

Privacy Settings

© 2025 MDPI (Basel, Switzerland) unless otherwise stated