
Submitted:
17 February 2025
Posted:
17 February 2025
You are already at the latest version
Abstract
This study presents a techno-economic feasibility of hydrogen transportation via liquid organic hydrogen carriers by road, making a comparison with compressed hydrogen (350 bar) and liquefied hydrogen. The analysis includes the simulation of hydrogenation and dehydrogenation reactors for the dibenzyltoluene/perhydro-dibenzyltoluene system using ASPEN Plus, along with a cost assessment of compression, liquefaction, and trucking. A sensitivity analysis evaluates hydrogen transport at varying daily demand (1 t/d, 2 t/d, and 4 t/d) and transport distances (50, 150, and 300 km). Results indicate that compressed hydrogen is the most cost-effective solution for short distances up to 150 km, with a levelized cost of transported hydrogen ranging from 0.63 to 1.55 €/kg. However, liquid organic hydrogen carrier technology becomes more competitive as transport distance increases, reaching values of 1.37–1.93 €/kg at 300 km for all hydrogen demand levels. Liquefied hydrogen remains the least competitive option, with costs reaching up to 6.48 €/kg, although it requires fewer annual trips by maintaining a fixed annual hydrogen demand.
Keywords:
LOHCs
; hydrogen transportation
; techno-economic analysis
1. Introduction
Hydrogen plays a key role in the transition to a more sustainable energy model. Hydrogen is the fuel with the highest energy content per unit mass (120 MJ/kg), and its utilization releases water and oxygen into the atmosphere [1]. However, due to its low volumetric density under ambient conditions (0.0824 kg/m3), which is one-third that of the natural gas [2], it is not competitive with fossil fuels without altering its state during the transport and storage phase.
High-pressure compression is currently the most developed and widely used method for storing and transporting hydrogen in metallic or composite cylindrical vessels at pressures up to 700 bar [1]. However, it requires significant energy, consuming approximately 13–18% of hydrogen's lower heating value [1]. Alternatively, liquefaction increases volumetric density to 71 kg/m³ at -253 °C and atmospheric pressure [3], but it requires 30–40% of hydrogen’s lower heating value [1]. These extremely low temperatures and high pressures represent significant challenges to large-scale commercialization. Therefore, developing an alternative that enables hydrogen transportation under milder and safer liquid-phase conditions, similar to traditional fuels, is crucial to gain public trust and attracting both private and public investment in the hydrogen supply chain [4].
In recent times, liquid organic hydrogen carriers (LOHCs) have attracted considerable attention as a solution for transporting and storing hydrogen because of their favourable attributes:
a) LOHCs are oil-like organic system that can remain in liquid form under ambient conditions, so they are easy and safe to store and transport. This also facilitates the gradual integration of LOHC systems into existing petroleum-based industries, allowing the utilization of their existing infrastructure in a hydrogen-based economy [5].
b) The concept of LOHC is based on the reversible hydrogenation and dehydrogenation of carbon double bonds through well-known catalytic reactions [5].
c) LOHCs have been shown to have a high hydrogen storage capacity, ranging up to 7.3 wtH2% [6].
Hydrogen reversibly binds to LOHCs through a catalytic hydrogenation process, an exothermic reaction that occurs at moderate temperatures (100–300°C) and pressures (30–50 bar) [5,7,8]. The hydrogenated LOHC exhibit a significant increase in volumetric energy density compared to molecular hydrogen and can be stored under ambient conditions for long periods without energy losses [9]. In contrast, dehydrogenation is an endothermic process that typically occurs at atmospheric pressure and high temperatures (200-400°C) depending on the LOHC-catalyst combination [8,9]. The heat needed for dehydrogenation can be either supplied internally, through partial combustion of the released hydrogen, or externally from available waste heat sources or fuel combustion [5]. In addition, if the two reactors are close together, it may be possible to use the heat produced by the exothermic reactor to power part of the endothermic one.
Over the years, various compounds have been studied, each with distinct chemical properties and significantly different transport and storage performances [5]. Research has predominantly focused on compounds derived from hydrocarbons commonly used in petrochemicals [5]. According to Niermann et al. [9], an ideal LOHC should have the following characteristics: high boiling point, low melting point, high hydrogen storage capacity, wide availability, cost-effectiveness, low dehydrogenation temperature, environmental and human safety, stability, and high technology readiness level (TRL). Many aromatic hydrocarbons, such as benzene, toluene, naphthalene and dibenzyl-toluene can be used as LOHCs due to the interaction of aromatic rings, which makes them more prone to hydrogenation and dehydrogenation than other organic molecules [7]. However, some of the aromatic compounds are carcinogenic or flammable while others are solid at room temperature [10]. Generally, the hydrogen storage capacities of cyclic hydrocarbons are between 6-8 wtH2 %, and the heat required by dehydrogenation is significant (62-71 kJ/mol) [10]. In addition to cyclic aromatic hydrocarbons, N-heterocyclic base compounds [11], such as N-ethyl carbazole, chinolina, indolo, phenazine, 1,2-Dihydro-1,2-Azaborine, have attracted much attention in LOHC research. The incorporation of heteroatoms such as N, P and O into aromatics significantly influence the thermodynamics of dehydrogenation [7]. As shown by Clot et al. [12], the substitution of heteroatoms at specific ring positions can effectively lower the dehydrogenation temperature of LOHCs and considerably reduce the enthalpy of reaction [7,12], resulting in thermodynamic conditions to fully release hydrogen at low temperatures [13]. However, such compounds suffer from low TRL, high toxicity and complicated hydrogenation/dehydrogenation mechanics, which limits their scalability at large scale [14].
Among all the possible aromatic candidates, dibenzyl-toluene (DBT) / perhydro-dibenzyl-toluene (PDBT) and toluene (TOL) / methylcyclohexane (MCH) systems are the most promising candidates for large-scale applications. TOL/MCH benefits from a low cost of 0.3 €/kg and a high mature TRL of 8, making it attractive for large scale applications, particularly in Asia, where pilot projects in Japan and Southeast Asia have demonstrated its viability [15].
Conversely, DBT/PDBT has gained increasing attention in Europe, driven its non-flammability, low toxicity (13.8 TPI/mg), and low vapor pressure, which facilitate hydrogen separation. Its cost, currently ranging between 2-4 €/kg, suggests feasibility for large-scale deployment [6,8,16]. The German company Hydrogenious GmbH has pioneered DBT-PDBT commercialization in Europe, reaching a TRL of 9 and engaging in multiple European hydrogen projects [17]. Given the regional market distinction—TOL/MCH in Asia and DBT/PDBT in Europe—this study focuses on the techno-economic evaluation of the DBT/PDBT system for hydrogen transportation, aligning with the growing European interest in this LOHC technology.
1.1. Objective of the Work
In literature, numerous studies explore the use of LOHCs for transporting hydrogen over long distances by ship from countries rich in renewable energy to those with potentially high future hydrogen demand [18,19]. However, limited research has focused on the use of LOHCs for short-distance transport via road. Hurskainen et al. [20] compared hydrogen road delivery costs via the DBT/PDBT concept and compressed gas. They found that the LOHC concept is more advantageous at higher hydrogen demands, particularly over longer transport distances. However, the analysis focuses on DBT/PDBT without modeling the hydrogenation and dehydrogenation reactors. Additionally, the liquid hydrogen option is not considered.
Therefore, this study presents a techno-economic analysis of hydrogen transportation via LOHCs by road, also simulating hydrogenation and dehydrogenation plants for DBT/PDBT systems in ASPEN Plus. The results are compared with hydrogen transported by using 350-bar compressed and cryogenic vessel tanks, so aiming at having a whole overview of all storage systems. Moreover, a sensitivity analysis evaluates the feasibility of transporting 1 t/d, 2 t/d, and 4 t/d of hydrogen over distances of 50, 150, and 300 km, from the production/hydrogenation site to the dehydrogenation/use point, focusing on the levelized cost of hydrogen (LCOH) and its cost components, particularly the levelized cost of transported hydrogen (LCOTH).
Figure 1 illustrates the three hydrogen transportation options considered in the analysis, in each case, hydrogen is produced by an alkaline electrolyser (AEL) at 15 bars. In the first pathway, hydrogen reacts with the LOHC in the hydrogenation unit after a compression step up to 30 bars. The hydrogenated product is then loaded into an oil tank trailer, transported by road, and unloaded at the dehydrogenation unit, where hydrogen is separated from the LOHC at 1.1 bar. In the second alternative pathway, hydrogen is compressed and loaded into a 350-bar composite tube trailer, transported by road, and unloaded at the destination. In the third pathway, hydrogen is liquefied and loaded into a cryogenic tube trailer. It is then transported by road and delivered to the destination point. As shown in Figure 1, the two physical transportation ways (compressed and liquified) are shorter than the chemical one. Additionally, in physical-based transport, trucks return with an empty trailer, whereas in LOHC-based transport, they return with a full trailer containing the depleted LOHC. Since the analysis focuses on hydrogen transportation, the final user is not considered, and therefore, no further hydrogen transformations are considered once hydrogen reaches the delivery point.
2. LOHC Modeling
Hydrogenation and dehydrogenation reactors for DBT-PDBT system are configured in ASPEN Plus along with the entire balance of plant (BOP), including pumps, heat exchangers, and separators, following the layout presented by Eypasch et al. [21].
As the DBT and PDBT molecules are not present in the ASPEN Plus library, their structure and main properties, summarized in Table 1, were added manually.
Since the ideal gas Gibbs energy of formation is not easily available in literature, a RSTOIC reactor for both hydrogenation and dehydrogenation is implemented using fractional conversion available by kinetic study in literature. Peng-Robinson and UNIQUAC models are used as thermodynamic package.
2.1. Hydrogenation Unit
The hydrogenation process of DBT is simulated using the kinetic model described by Shi et al. [24], in which a catalyst 5 wt% Pt/Al2O3 allowed to achieve complete hydrogen conversion at approximately 200 °C and a pressure ranging between 30 and 40 bar. DBT hydrogenation plant is depicted in Figure 2. The hydrogenation reaction is carried out at 210 °C and 30 bar with a fractional conversion of DBT equal to 99 %. The inlet flow of DBT (DBT-IN) is pumped up to 30 bar and pre-heated before mixing (MIX-REAC) with the pre-heated hydrogen flow (H2-HOT). The hydrogen flow enters compressed at 30 bar (H2-IN). The mixed reactants are then heated (S-HEAT) up to 200 °C. The product flow (PROD-HOT) is entirely composed of PDBT and unreacted DBT. That flow is pre-cooled (DBT-HEAT and H2-HEAT) and sent in an adiabatic flash valve (VALVE) to reduce its pressure up to 4 bar before entering a flash separator (H2-SEP). From the separator a small percentage of gaseous flow is purged while the liquid component is ideally separated (LIQ-SEP) into DBT flow (DBT-RIC), which is recirculated. Finally, the PDBT flow (PDBT-OUT) is loaded into the truck.
The main operating conditions of each streams for DBT hydrogenation plant are shown in Table 2.
2.2. Dehydrogenation Unit
The PDBT dehydrogenation plant is shown in Figure 3 The dehydrogenation reaction of PDBT is simulated using the kinetic model described by Bulgarin et al. [25], in which a commercial catalyst 0.3 wt% Pt/Al2O3 is used achieving a hydrogen yield equal to 70 % at temperature and pressure of 297 °C and 1 bar respectively. The PDBT flow (PDBT-IN) is pumped (PDBTPUMP) and heated (DBT-HEAT) up to a temperature close to the dehydrogenation process (295 °C). The product flow (PROD-HOT) is cooled (DBT-HEAT and CHILLER) while the hydrogen content is separated from the liquid fraction (HEAVY) through a flash separator (H2-SEP). The DBT flow, coming from the outlet of an ideal separator (LIQ-SEP) is loaded into the truck while the PDBT flow is recirculated.
Table 5 summaries the inlet and outlet streams specifications for the PDBT dehydrogenation process while Table 6 and Table 7 summary the thermal and electrical power. The thermal demand of the dehydrogenation reactor can be met either by burning a portion of the released hydrogen or an alternative fuel, such as natural gas. Additionally, the chiller is assumed to be electric with a COP of 4.
3. Method
The levelized cost of hydrogen (LCOH), in €/kg, for each transportation case study is obtained by the following equation:
where LCOHproduction corresponds to the hydrogen production cost and LCOTH represents the levelized cost of transported hydrogen as the sum of the transformation cost required before transportation, and the transportation cost. Transformation includes the hydrogenation and dehydrogenation steps for LOHCs, compression for compressed hydrogen, and liquefaction for liquefied hydrogen.
LCOH = LCOHproduction + LCOTH
Each component of the LCOH is calculated by dividing the total annual costs (the sum of CAPEX, fixOPEX, and VarOPEX) by the annual amount of useful hydrogen delivered (QH2), using the equation:
where j denotes the j-th step of the transportation option. CAPEX is obtained by the annualization of the investment costs (IC) through the capital recovery factor (CRF), assuming an interest rate (i) and a depreciation time (n) by equation:
LCOH = Σ (CAPEXj + fixOPEXj + varOPEXj) / QH2
CRF = ( ( 1 + i )n i ) / ( ( 1 + i )n – 1 )
FixOPEX and varOPEX refer to the fixed operational expenditures of the plant or technology (generally estimated as a percentage of IC) and the variable energy and material costs incurred for annual operation, respectively.
Each stage of the hydrogen chain is analyzed, with all expenditure adjusted to the 2024-euro value.
3.1. Hydrogen Production
Hydrogen is produced using an AEL, currently the most mature technology for large-scale hydrogen production [26].
The main parameters for the AEL are reported in Table 8 [26]. In the study it is assumed that the electrolyser works for 8500 hours per year using renewable resources as energy supply while the national power grid can ensure the continuity of the process when the renewable energy is not sufficient. A dry piston compressor compresses the produced hydrogen to 15 bar. As presented in Table 8, a competitive electricity price of 0.07 €/kWh has been assumed and used to compute the cost of electricity consumption for AEL to produce hydrogen (varOPEXEL).
3.2. Hydrogen Compression
The specific work (wcomp, kWh/kg) required for the compressors is calculated using the following equation [20]:
whose terms are described in Table 9 [20]. The total number of compression stages is determined based on a maximum compression ratio of 2.5 per stage, assuming that the suction temperature remained constant at 313.15 K.
wcomp = [ (Z R T₁ N γ) / ((M η (γ-1)) ] [(p₂ / p₁) ^ ((γ - 1) / (N γ)) - 1]
The compressor investment cost (ICcomp) is calculated using the equation developed in the study carried out by the Fuel Cells and Hydrogen Joint Undertaking [27]:
where A, B, Qref, a, b, c, d and pref are constant [27]. For the compressor CAPEX, a lifetime of 15 years and an interest rate of 8% have been considered. Compressor FixOPEX has been assumed to be 4% of the IC, while the annual electricity consumption associated with the compressor specific work has been included as varOPEXcomp. Electricity costs have been calculated using the electricity price provided in Table 8.
ICcomp = A (Q/Qref)a + B (Q /Qref)b ((p2/p1) /rref)c (p2/pref)d
3.3. LOHC System
The expenditures of the LOHC systems include investment, fixed and variable costs of the compressor to compress hydrogen up to 30 bar, the LOHC reactors, the BOP and the LOHC storage at the hydrogenation and dehydrogenation sites. Since LOHC technology has not yet been fully scaled, significant uncertainties remain regarding the reactor and BOP investment costs. Two different methods have been considered for estimating their value.
Eypasch et al. [21] (method 1) estimated the costs of the DBT hydrogenation and PDBT dehydrogenation reactors along with all additional components by curve fitting their confidential specific system cost at different sizes, obtaining the following equations:
where Pmax, kW, is the maximum power of the hydrogenation and dehydrogenation plants.
IChyd,DBT = 5057.29 Phyd,max-0.424 (€)
ICdehyd,PDBT = 6888.83 Pdehyd,max-0.424 (€)
In contrast, Reuβ et al. [28] (method 2), computed the DBT hydrogenation and PDBT dehydrogenation reactors using the scale factor method through the following equations:
where IChyd,DBT and ICdehyd,PDBT are the investment costs for the installed hydrogenation and dehydrogenation equipment, respectively. ICbase,hyd and ICbase,dehyd are the base costs of hydrogenation and dehydrogenation, respectively; capacity and ICcompare are the design and base capacity, respectively, while ICscale is the scaling factor. Table 10 summarizes the values assumed for the above mentioned parameters. The same values of i and n have been assumed for estimating the CRF used in annualization of IC in method 1.
IChyd,DBT = ICbase,hyd (capacity/ICcompare)ICscale (€)
ICdehyd,PDBT = ICbase,dehyd (capacity/ICcompare)ICscale (€)
The average value derived from the two methods is then assumed for comparison with other transportation ways. The cost of energy requirements, both thermal and electrical have been considered as a variable cost component of the systems (varOPEX).
Regarding the thermal consumption of the dehydrogenation reactor, two scenarios have been considered. The first scenario (green-LOHC) utilizes a portion of the hydrogen released from the dehydrogenation reactor to fuel the reactor itself, approximately 32.15% of the inlet H2 flow. The second scenario (fossil-LOHC) assumes that the reactor's thermal demand is met by burning natural gas. In the case of fossil-LOHC, natural gas is purchased according to the 2024 non-household gas prices in the EU of 0.06 €/kWh [29], excluding value-added tax, but with an additional CO2 emission tax from natural gas combustion of 10.13 €/MWh [30]. The electricity costs have been computed using the electricity price from Table 8.
Finally, two fixed LOHC storage tanks, one at the hydrogenation site and another at the dehydrogenation site, have been considered. The storage CAPEX is obtained by annualization of storage IC using the scale factor method as done by Reuβ et al. [28]. The variable costs include the purchase of the compound and its replacement due to degradation of LOHC over time. Table 11 summarizes the storage parameters for DBT/PDBT storage systems [20,28].
3.4. Hydrogen Liquefaction
The liquefaction IC (ICliq) is calculated using the scale factor method, according to Reuβ et al[28]. The main parameters are presented in Table 12 [28,31]. The annual electricity cost required to liquefy hydrogen, based on the liquify index reported in Table 12 [31], are considered as the annual variable expenditure (VarOPEXliq).
3.5. Transportation
Table 13 summarizes the main parameters used to compute the IC, as well as the annual fixed (fixOPEXtrucking) and variable expenditures (varOPEXtrucking), for the three transportation options. The fuel price and labor costs have been selected based on the average values for Italy in the year 2024 [32,33]. The varOPEXtrucking includes the costs of fuel, personnel and variable maintenance. Further details regarding the formulations used to calculate each cost item can be found in the Supplementary Material.
4. Results and Discussion
4.1. Hydrogen Delivery Logistics
Table 14 summarizes the key parameters of the hydrogen road transportation logistics plan, including the number of trucks and trailers, the fleet IC (M€), the total annualized transformation and transportation costs (M€/yr), the round-trip time (h), the total trip time (h), including loading and unloading time, and the number of trips per year. In this initial analysis, production costs have been neglected, as the focus is only on logistics planning. A further analysis, presented in Paragraph 4.3, will include these costs. In the fleet count, an additional trailer and truck have been included in each scenario to ensure hydrogen delivery in case of an accidental truck breakdown. In addition, it is assumed that a trip is made only when the trailer's capacity exceeds 75% of its nominal capacity. This assumption holds provided that there are no daily constraints from a hypothetical hydrogen user and that only one annual hydrogen delivery requirement must be met
The results in Table 14 show that as the transport distance and the amount of hydrogen to be delivered increase, the number of H2 compressed tube trailers rises significantly. In addition, that number is higher if compared with the liquid carrier option, due to the lower maximum storage capacity (900 kg vs. 2 t and 4.3 t for LOHC and LH2, respectively). For a 50 km distance, at least 2 trucks and 2 H2 compressed tube trailers are required, as the total travel time allows for up to 6 trips per day. At 150 km, and for a daily demand of 4 t/d, the number of trucks and tube trailers increases to 3+3, since the total travel time of 8 hours permits 3 trips per day. At 300 km, each truck can complete only one trip per day due to the total travel time of 14 hours. Consequently, a higher number of trucks and H2 compressed tube trailers are required: 3+3 for 1 t/d, 4+4 for 2 t/d, and 6+6 for 4 t/d, respectively. In the case of transporting liquefied hydrogen and LOHC, a fleet consisting of 1 trailer and 1 truck, plus a reserve, is always sufficient. However, for the fleet with LOHC, the number increases to 2+2 with a reserve in the case of 4 t/d and 300 km.
From an economic point of view, the IC for the LOHC fleet is the lowest, considering all distances and hydrogen daily rates (0.76-1.13 M€). The fleet IC with liquefied hydrogen is 2.04 M€ for all distances and hydrogen demands, as its number remains unchanged within this range. When the fleet carrying compressed hydrogen at 350 bar consists of two trucks and two trailers, its IC is estimated at approximately 1.42 M€. The hydrogen compressed fleet becomes the most expensive (2.12-4.25 M€) at 300 km, and at 150 km when hydrogen demand is 4 t/d.
The annualized transformation cost of the liquefied hydrogen option is the highest across all distances and hydrogen demands (1.92–5.17 M€) due to the high IC and energy requirements of the liquefaction plant. In the LOHC option, a moderate annual transportation expense (0.17-1.04 M€/yr) contrasts with a high and increasing annual transformation expense (0.39-1.11 M€/yr) as the required hydrogen flow rate increases. The transformation expense in the fossil-LOHC scenario is slightly higher than in the green-LOHC scenario due to the cost of purchasing natural gas to fuel the dehydrogenation reactor. In contrast, in the compressed hydrogen scenario, a low annual transformation cost (0.12-0.36 M€/yr) contrasts with a high annual transportation cost (0.38-2.78 M€/yr), which increases as the hydrogen demand and transport distance grow.
In terms of total annual trips, the H2 compressed tube trailer trucks complete 417, 821, and 1642 trips per year for 1, 2, and 4 t/d, respectively. This high number of trips could pose a problem for the trucks' lifespan, leading to increased degradation and a higher probability of truck breakdowns, which would result in higher costs and potential penalties due to failure to deliver hydrogen. Additionally, this could increase traffic, causing delays and disruptions to other services. Conversely, the LOHC fleet requires a maximum of 183, 365, and 760 trips per year for 1, 2, and 4 t/d, respectively. Finally, the cryogenic LH2 fleet requires 121, 182, and 365 trips per year for 1, 2, and 4 t/d, respectively. Therefore, the option of transporting hydrogen in liquid form reduces the number of annual road trips, unless there are no mandatory daily user demands. Except for a 4 t/d demand, deliveries occur every 3 days for 1 t/d and every 2 days for 2 t/d.
4.2. Transportation Cost Breakdown
To provide a comprehensive view of the cost structure for each transportation option and enable a comparative analysis under varying conditions, Figure 4 illustrates the LCOTH as a function of transport distance and daily hydrogen demand.
Figure 4 highlights that as hydrogen demand increases, LCOTH decreases across all transportation options, while increasing transport distance leads to higher costs. The increase in cost with transport distance is primarily driven by the trucking component. Transporting larger quantities results in higher fuel consumption, reduced truck availability for the same day, therefore necessitating additional trucks, and greater personnel utilization. However, this increase is not uniform across all technologies.
Transporting liquified hydrogen results as the most expensive option, with costs reaching up to 6.48 €/kg. Compared to other alternatives, this method is heavily influenced by the IC required for the liquefaction plant and the energy expenditure for liquefying hydrogen, which account for approximately 82% of the total cost. The trucking-related cost is relatively low; however, for these quantities of hydrogen, the technology is unable to compete with its alternatives.
Transporting compressed gaseous hydrogen at 350 bars in tube trailers is the most economical option for distances ranging from 50 to 150 km (0.63-1.25 €/kg and 1.02-1.55 €/kg, respectively). The largest cost component is associated with the purchase of the fleet and O&M expenses, while the cost related to the compressor remains relatively low (less than 0.20 €/kg). At these distances, fossil-LOHC and green-LOHC options are disadvantaged by the costs of the hydrogenation and dehydrogenation plants as well as the associated energy expenditures (0.83-1.20 €/kg and 1.03-1.57 €/kg, respectively).
While this cost gap makes the LOHC option less competitive for distances of 50–150 km, it becomes increasingly less pronounced as the distance increases, since the trucking cost for compressed hydrogen rises significantly compared to that of the LOHC solution. At 300 km, the fossil-LOHC solution becomes the most advantageous (1.37–1.93 €/kg). Its green variant ranges from 1.72 to 2.56 €/kg, becoming more cost-effective than the compressed hydrogen option only when the hydrogen demand is 4 t/d. The green-LOHC scenario is therefore strongly penalized by the reduction in the hydrogen delivered to the final user, which increases its LCOTH.
At the same distance, the cost associated with the compressed hydrogen fleet amounts to 1.73–2.36 €/kg. However, it should be noted that, although the economic advantage of the LOHC solution over the gaseous hydrogen option is modest, its key benefit lies in requiring a substantially smaller fleet, resulting in fewer trucks on the road.
4.3. LCOH
Figure 5 illustrates the LCOH as a function of distance and daily hydrogen demand for the three transportation options. Specifically, the LOHC scenario is divided into a green-LOHC scenario, where the thermal demand of dehydrogenation reactors is met by burning a portion of the hydrogen (green surface), and a fossil-LOHC scenario where natural gas is used as fuel to meet the thermal requirements (red surface). For all distances and H2 daily demand, the liquefied hydrogen option exhibits the highest LCOH (8.31–11.11 €/kg), followed by the green-LOHC option with an LCOH ranging from 7.83 to 9.39 €/kg. In contrast, within the same range, hydrogen transportation via fossil-LOHC and compressed tube trailer trucks appears highly competitive. Specifically, for distances up to 150 km and across all H₂ daily demand levels, compressed hydrogen emerges as the most cost-effective option compared to fossil-LOHC (5.48–6.18 €/kg vs. 5.59–6.38 €/kg). However, beyond 150 km and for all investigated hydrogen demand levels, fossil-LOHC becomes the most economical choice (5.83–6.57 €/kg vs. 6.19–6.99 €/kg).
5. Conclusions
This study provides a comprehensive techno-economic assessment of hydrogen transportation via LOHCs, comparing it with compressed and liquefied hydrogen for daily demands of 1, 2, and 4 t/d over transport distances of 50, 150, and 300 km. The simulation of hydrogenation and dehydrogenation systems in Aspen Plus allowed for an in-depth analysis of operating conditions and the calculation of mass and energy balances. For the LOHC transport option, two scenarios are considered: a fossil-LOHC scenario, where the dehydrogenation reactor is fueled by natural gas combustion, and a green-LOHC scenario, where part of the hydrogen is used to fuel the dehydrogenation reactor.
The results indicate that for short distances (≤150 km), compressed hydrogen is the most economical option, with LCOTH values ranging from 0.63 to 1.55 €/kg. However, at 300 km, the fossil-LOHC scenario becomes the most cost-competitive solution, with LCOTH between 1.37 and 1.93 €/kg, compared to 1.73–2.36 €/kg for compressed hydrogen. While the LOHC system requires additional transformation steps, it benefits from a smaller fleet size and lower trucking costs at longer distances.
In terms of LCOH, liquefied hydrogen remains the least competitive option, with values between 8.31 and 11.11 €/kg due to the high capital and operational expenses associated with liquefaction. Conversely, the green-LOHC scenario exhibits LCOH values between 7.83 and 9.39 €/kg, while fossil-LOHC achieves a more competitive range of 5.83 to 6.57 €/kg beyond 150 km. Despite the additional CO₂ emissions, the fossil-LOHC pathway represents a transitional strategy that could enhance the feasibility of LOHC-based transport in the near term.
Although compressed hydrogen tube trailers remain the most economical solution up to 150 km, the high number of annual trips could lead to traffic congestion and may face public opposition. Therefore, with advancements in DBT/PDBT technology, reductions in capital costs, and improvements in energy efficiency, LOHC technology could become increasingly competitive, reducing the number of required trips while maintaining a fixed transported hydrogen quantity.
Supplementary Materials
The following supporting information can be downloaded at the website of this paper posted on Preprints.org.
Author Contributions
Conceptualization, C.C. and E.P.; methodology, C.C.; software, G.G.G.; validation, C.C., G.G.G. and D.B.; formal analysis, E.P.; investigation, C.C and E.P.; resources, C.C.; data curation, C.C. and G.G.G.; writing—original draft preparation, C.C.; writing—review and editing, G.G.G.; visualization, C.C.; supervision, D.B.; project administration, D.B. All authors have read and agreed to the published version of the manuscript.
Funding
This research received no external funding.
Data Availability Statement
Data are contained within the article.
Acknowledgments
The authors acknowledge the precious contribution of Ms Martina Moro to the success of this work.
Conflicts of Interest
The authors declare no conflicts of interest.
Nomenclature
AEL – Alkaline electrolyser
BOP – Balance of Plant
COP - Coefficient of performance
CRF – Capital recovery factor
DBT – Dibenzyltoluene
IC – Investment cost
LOHC – Liquid organic hydrogen carrier
LCOH – Levelised cost of hydrogen
LCOTH – Levelised cost of transported hydrogen
PDBT- Perhydro-dibenzyltoluene
| 1 | In round brackets is the annual transformation expense for the fossil-LOHC scenario, which includes the cost of natural gas required to power the dehydrogenation reactor. |
References
- Usman, M.R. Hydrogen Storage Methods: Review and Current Status. Renewable and Sustainable Energy Reviews 2022, 167, 112743. [Google Scholar] [CrossRef]
- Mazloomi, K.; Gomes, C. Hydrogen as an Energy Carrier: Prospects and Challenges. Renewable and Sustainable Energy Reviews 2012, 16, 3024–3033. [Google Scholar] [CrossRef]
- Faye, O.; Szpunar, J.; Eduok, U. A Critical Review on the Current Technologies for the Generation, Storage, and Transportation of Hydrogen. Int J Hydrogen Energy 2022, 47, 13771–13802. [Google Scholar] [CrossRef]
- Andersson, J.; Grönkvist, S. Large-Scale Storage of Hydrogen. Int J Hydrogen Energy 2019, 44, 11901–11919. [Google Scholar] [CrossRef]
- Niermann, M.; Timmerberg, S.; Drünert, S.; Kaltschmitt, M. Liquid Organic Hydrogen Carriers and Alternatives for International Transport of Renewable Hydrogen. Renewable and Sustainable Energy Reviews 2021, 135, 110171. [Google Scholar] [CrossRef]
- Modisha, P.M.; Ouma, C.N.M.; Garidzirai, R.; Wasserscheid, P.; Bessarabov, D. The Prospect of Hydrogen Storage Using Liquid Organic Hydrogen Carriers. Energy and Fuels 2019, 33, 2778–2796. [Google Scholar] [CrossRef]
- Chu, C.; Wu, K.; Luo, B.; Cao, Q.; Zhang, H. Hydrogen Storage by Liquid Organic Hydrogen Carriers: Catalyst, Renewable Carrier, and Technology – A Review. Carbon Resources Conversion 2023, 6, 334–351. [Google Scholar] [CrossRef]
- Niermann, M.; Beckendorff, A.; Kaltschmitt, M.; Bonhoff, K. Liquid Organic Hydrogen Carrier (LOHC) – Assessment Based on Chemical and Economic Properties. Int J Hydrogen Energy 2019, 44, 6631–6654. [Google Scholar] [CrossRef]
- Niermann, M.; Drünert, S.; Kaltschmitt, M.; Bonhoff, K. Liquid Organic Hydrogen Carriers (LOHCs)-Techno-Economic Analysis of LOHCs in a Defined Process Chain. Energy Environ Sci 2019, 12, 290–307. [Google Scholar] [CrossRef]
- Aakko-Saksa, P.T.; Cook, C.; Kiviaho, J.; Repo, T. Liquid Organic Hydrogen Carriers for Transportation and Storing of Renewable Energy – Review and Discussion. J Power Sources 2018, 396, 803–823. [Google Scholar] [CrossRef]
- Rao, P.C.; Yoon, M. Potential Liquid-Organic Hydrogen Carrier (Lohc) Systems: A Review on Recent Progress. Energies (Basel) 2020, 13. [Google Scholar] [CrossRef]
- Clot, E.; Eisenstein, O.; Crabtree, R.H. Computational Structure-Activity Relationships in H2 Storage: How Placement of N Atoms Affects Release Temperatures in Organic Liquid Storage Materials. Chemical Communications 2007, 2231–2233. [Google Scholar] [CrossRef] [PubMed]
- Jorschick, H.; Vogl, M.; Preuster, P.; Bösmann, A.; Wasserscheid, P. Hydrogenation of Liquid Organic Hydrogen Carrier Systems Using Multicomponent Gas Mixtures. Int J Hydrogen Energy 2019, 44, 31172–31182. [Google Scholar] [CrossRef]
- Sage, V.; Patel, J.; Hazewinkel, P.; Yasin, Q.U.A.; Wang, F.; Yang, Y.; Kozielski, K.; Li, C. Recent Progress and Techno-Economic Analysis of Liquid Organic Hydrogen Carriers for Australian Renewable Energy Export – A Critical Review. Int J Hydrogen Energy 2024, 56, 1419–1434. [Google Scholar] [CrossRef]
- SPERA HydrogenTM Chiyoda’s Hydrogen Supply Chain Business|CHIYODA CORPORATION. Available online: https://www.chiyodacorp.com/en/service/spera-hydrogen/ (accessed on 11 November 2024).
- Jorschick, H.; Bulgarin, A.; Alletsee, L.; Preuster, P.; Bösmann, A.; Wasserscheid, P. Charging a Liquid Organic Hydrogen Carrier with Wet Hydrogen from Electrolysis. ACS Sustain Chem Eng 2019, 7, 4186–4194. [Google Scholar] [CrossRef]
- Hydrogenious LOHC Technologies. Available online: https://hydrogenious.net/ (accessed on 11 November 2024).
- Godinho, J.; Hoefnagels, R.; Braz, C.G.; Sousa, A.M.; Granjo, J.F.O. An Economic and Greenhouse Gas Footprint Assessment of International Maritime Transportation of Hydrogen Using Liquid Organic Hydrogen Carriers. Energy 2023, 278, 127673. [Google Scholar] [CrossRef]
- Raab, M.; Maier, S.; Dietrich, R.U. Comparative Techno-Economic Assessment of a Large-Scale Hydrogen Transport via Liquid Transport Media. Int J Hydrogen Energy 2021, 46, 11956–11968. [Google Scholar] [CrossRef]
- Hurskainen, M.; Ihonen, J. Techno-Economic Feasibility of Road Transport of Hydrogen Using Liquid Organic Hydrogen Carriers. Int J Hydrogen Energy 2020, 45, 32098–32112. [Google Scholar] [CrossRef]
- Eypasch, M.; Schimpe, M.; Kanwar, A.; Hartmann, T.; Herzog, S.; Frank, T.; Hamacher, T. Model-Based Techno-Economic Evaluation of an Electricity Storage System Based on Liquid Organic Hydrogen Carriers. Appl Energy 2017, 185, 320–330. [Google Scholar] [CrossRef]
- Naseem, M.; Usman, M.; Lee, S. A Parametric Study of Dehydrogenation of Various Liquid Organic Hydrogen Carrier (LOHC) Materials and Its Application to Methanation Process. Int J Hydrogen Energy 2021, 46, 4100–4115. [Google Scholar] [CrossRef]
- Müller, K.; Stark, K.; Emelyanenko, V.N.; Varfolomeev, M.A.; Zaitsau, D.H.; Shoifet, E.; Schick, C.; Verevkin, S.P.; Arlt, W. Liquid Organic Hydrogen Carriers: Thermophysical and Thermochemical Studies of Benzyl- and Dibenzyl-Toluene Derivatives. Ind Eng Chem Res 2015, 54, 7967–7976. [Google Scholar] [CrossRef]
- Shi, L.; Qi, S.; Qu, J.; Che, T.; Yi, C.; Yang, B. Integration of Hydrogenation and Dehydrogenation Based on Dibenzyltoluene as Liquid Organic Hydrogen Energy Carrier. Int J Hydrogen Energy 2019, 44, 5345–5354. [Google Scholar] [CrossRef]
- Bulgarin, A.; Jorschick, H.; Preuster, P.; Bösmann, A.; Wasserscheid, P. Purity of Hydrogen Released from the Liquid Organic Hydrogen Carrier Compound Perhydro Dibenzyltoluene by Catalytic Dehydrogenation. Int J Hydrogen Energy 2020, 45, 712–720. [Google Scholar] [CrossRef]
- Proost, J. State-of-the Art CAPEX Data for Water Electrolysers, and Their Impact on Renewable Hydrogen Price Settings. Int J Hydrogen Energy 2019, 44, 4406–4413. [Google Scholar] [CrossRef]
- FCH Study in Early Business Cases for H2 in Energy Storage and More Broadly Power to H2 Applications; 2017.
- Reuß, M.; Grube, T.; Robinius, M.; Preuster, P.; Wasserscheid, P.; Stolten, D. Seasonal Storage and Alternative Carriers: A Flexible Hydrogen Supply Chain Model. Appl Energy 2017, 200, 290–302. [Google Scholar] [CrossRef]
- Natural Gas Price Statistics - Statistics Explained. Available online: https://ec.europa.eu/eurostat/statistics-explained/index.php?title=Natural_gas_price_statistics (accessed on 26 January 2025).
- Rate of Tax. Available online: https://www.revenue.ie/en/companies-and-charities/excise-and-licences/energy-taxes/natural-gas-carbon-tax/rate-of-tax.aspx (accessed on 26 January 2025).
- K. Stolzenburg, R.M. Hydrogen Liquefaction Report; 2013.
- Fuel Prices in Italy for 29 August 2024 :: Fuelo. Available online: https://it.fuelo.net/prices/date/2024-8-29?lang=en (accessed on 18 January 2025).
- Heavy Truck Driver Salary in Italy. Available online: https://www.erieri.com/salary/job/heavy-truck-driver/italy (accessed on 18 January 2025).
Figure 1.
The three investigated hydrogen transportation options.
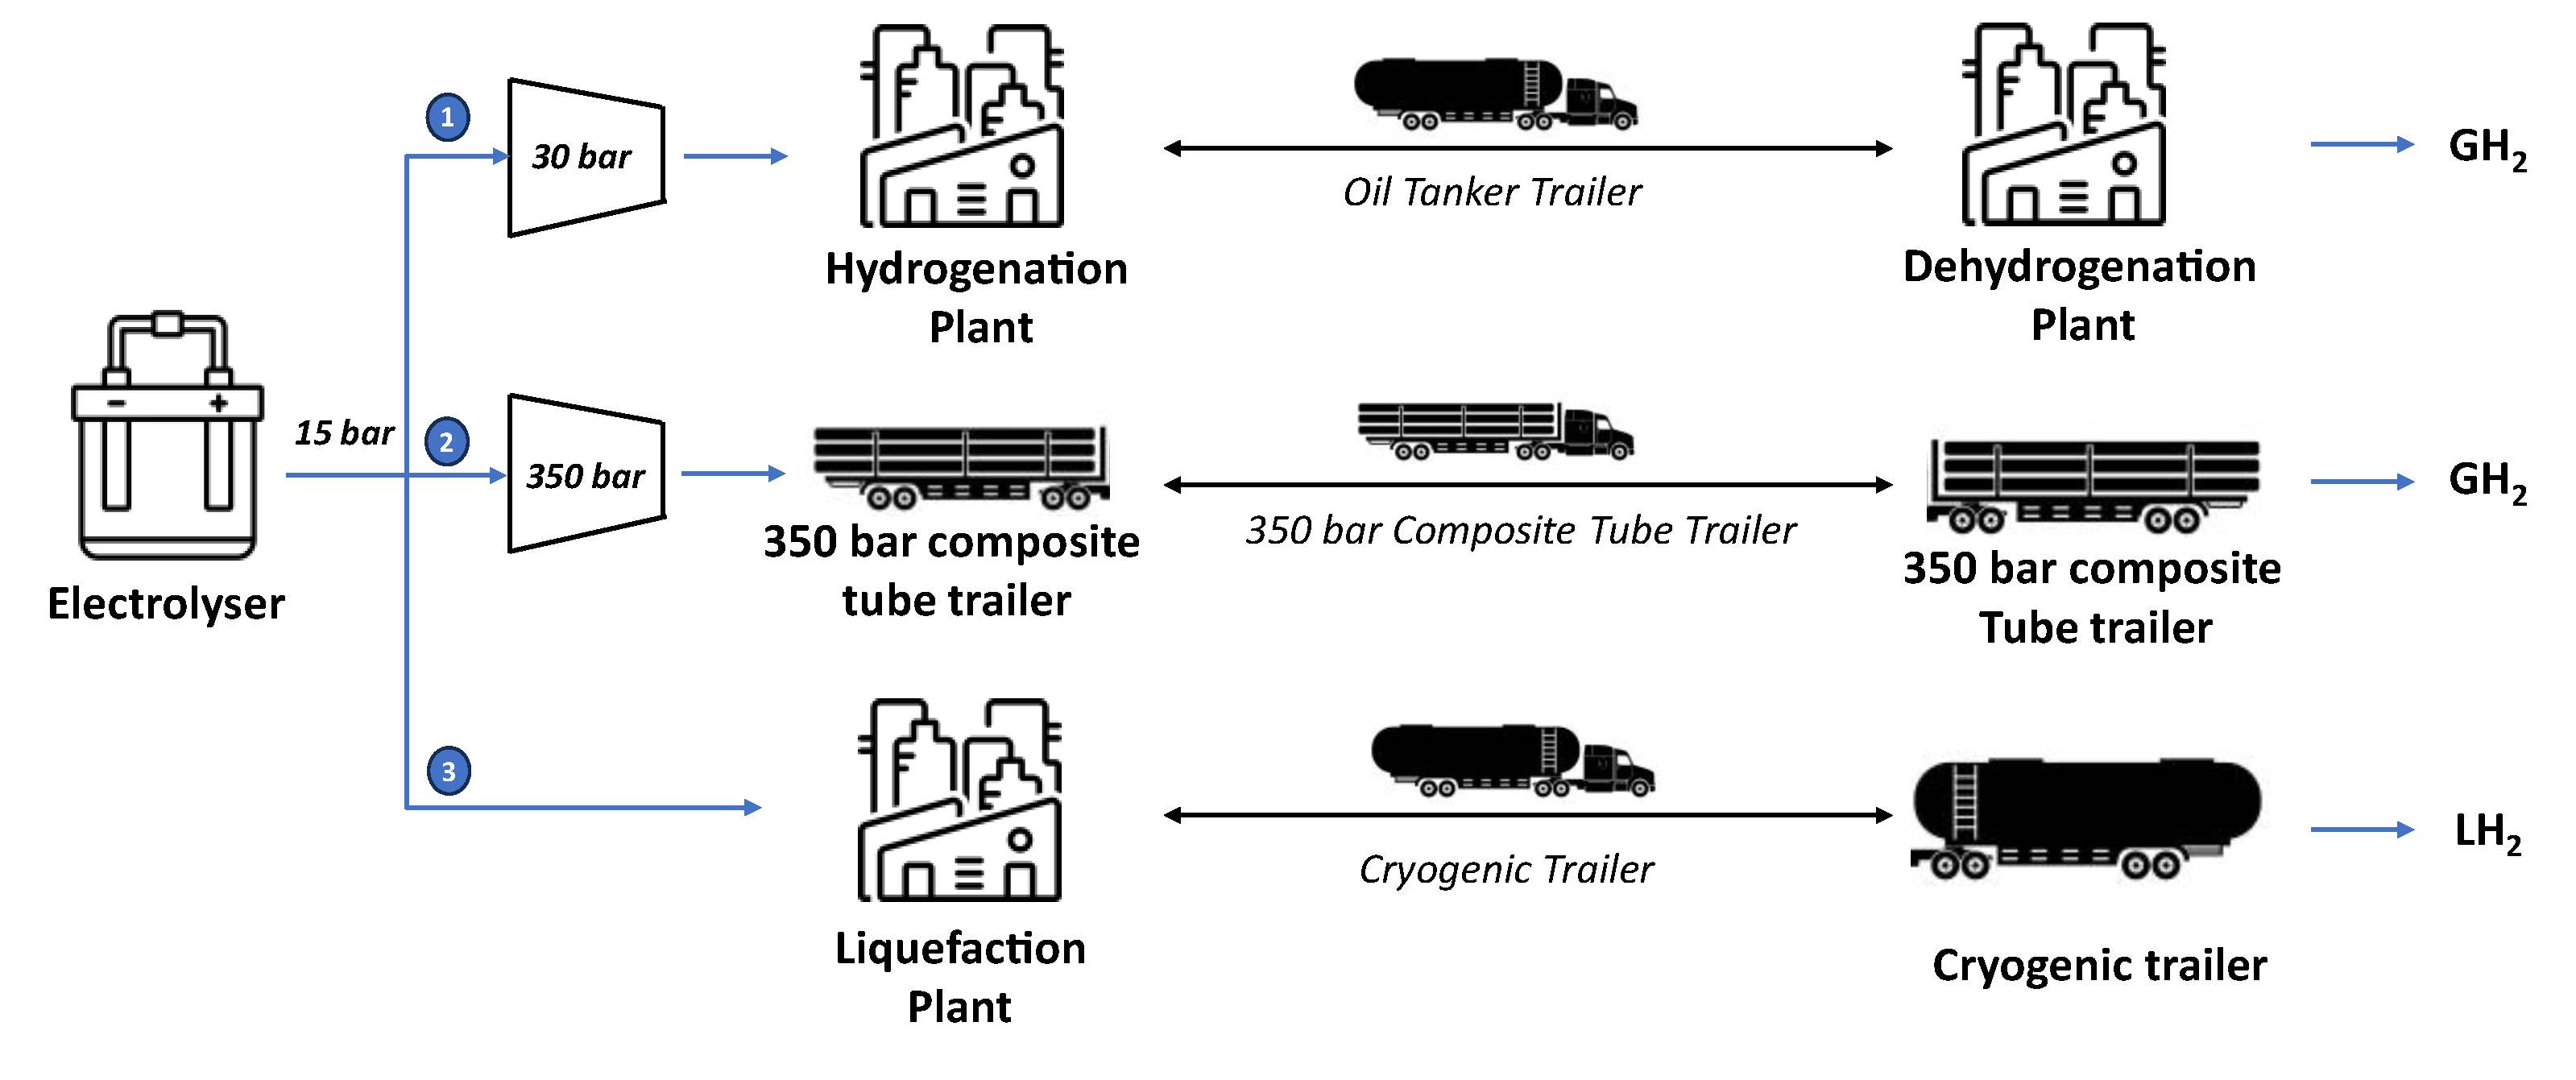
Figure 2.
DBT hydrogenation plant.
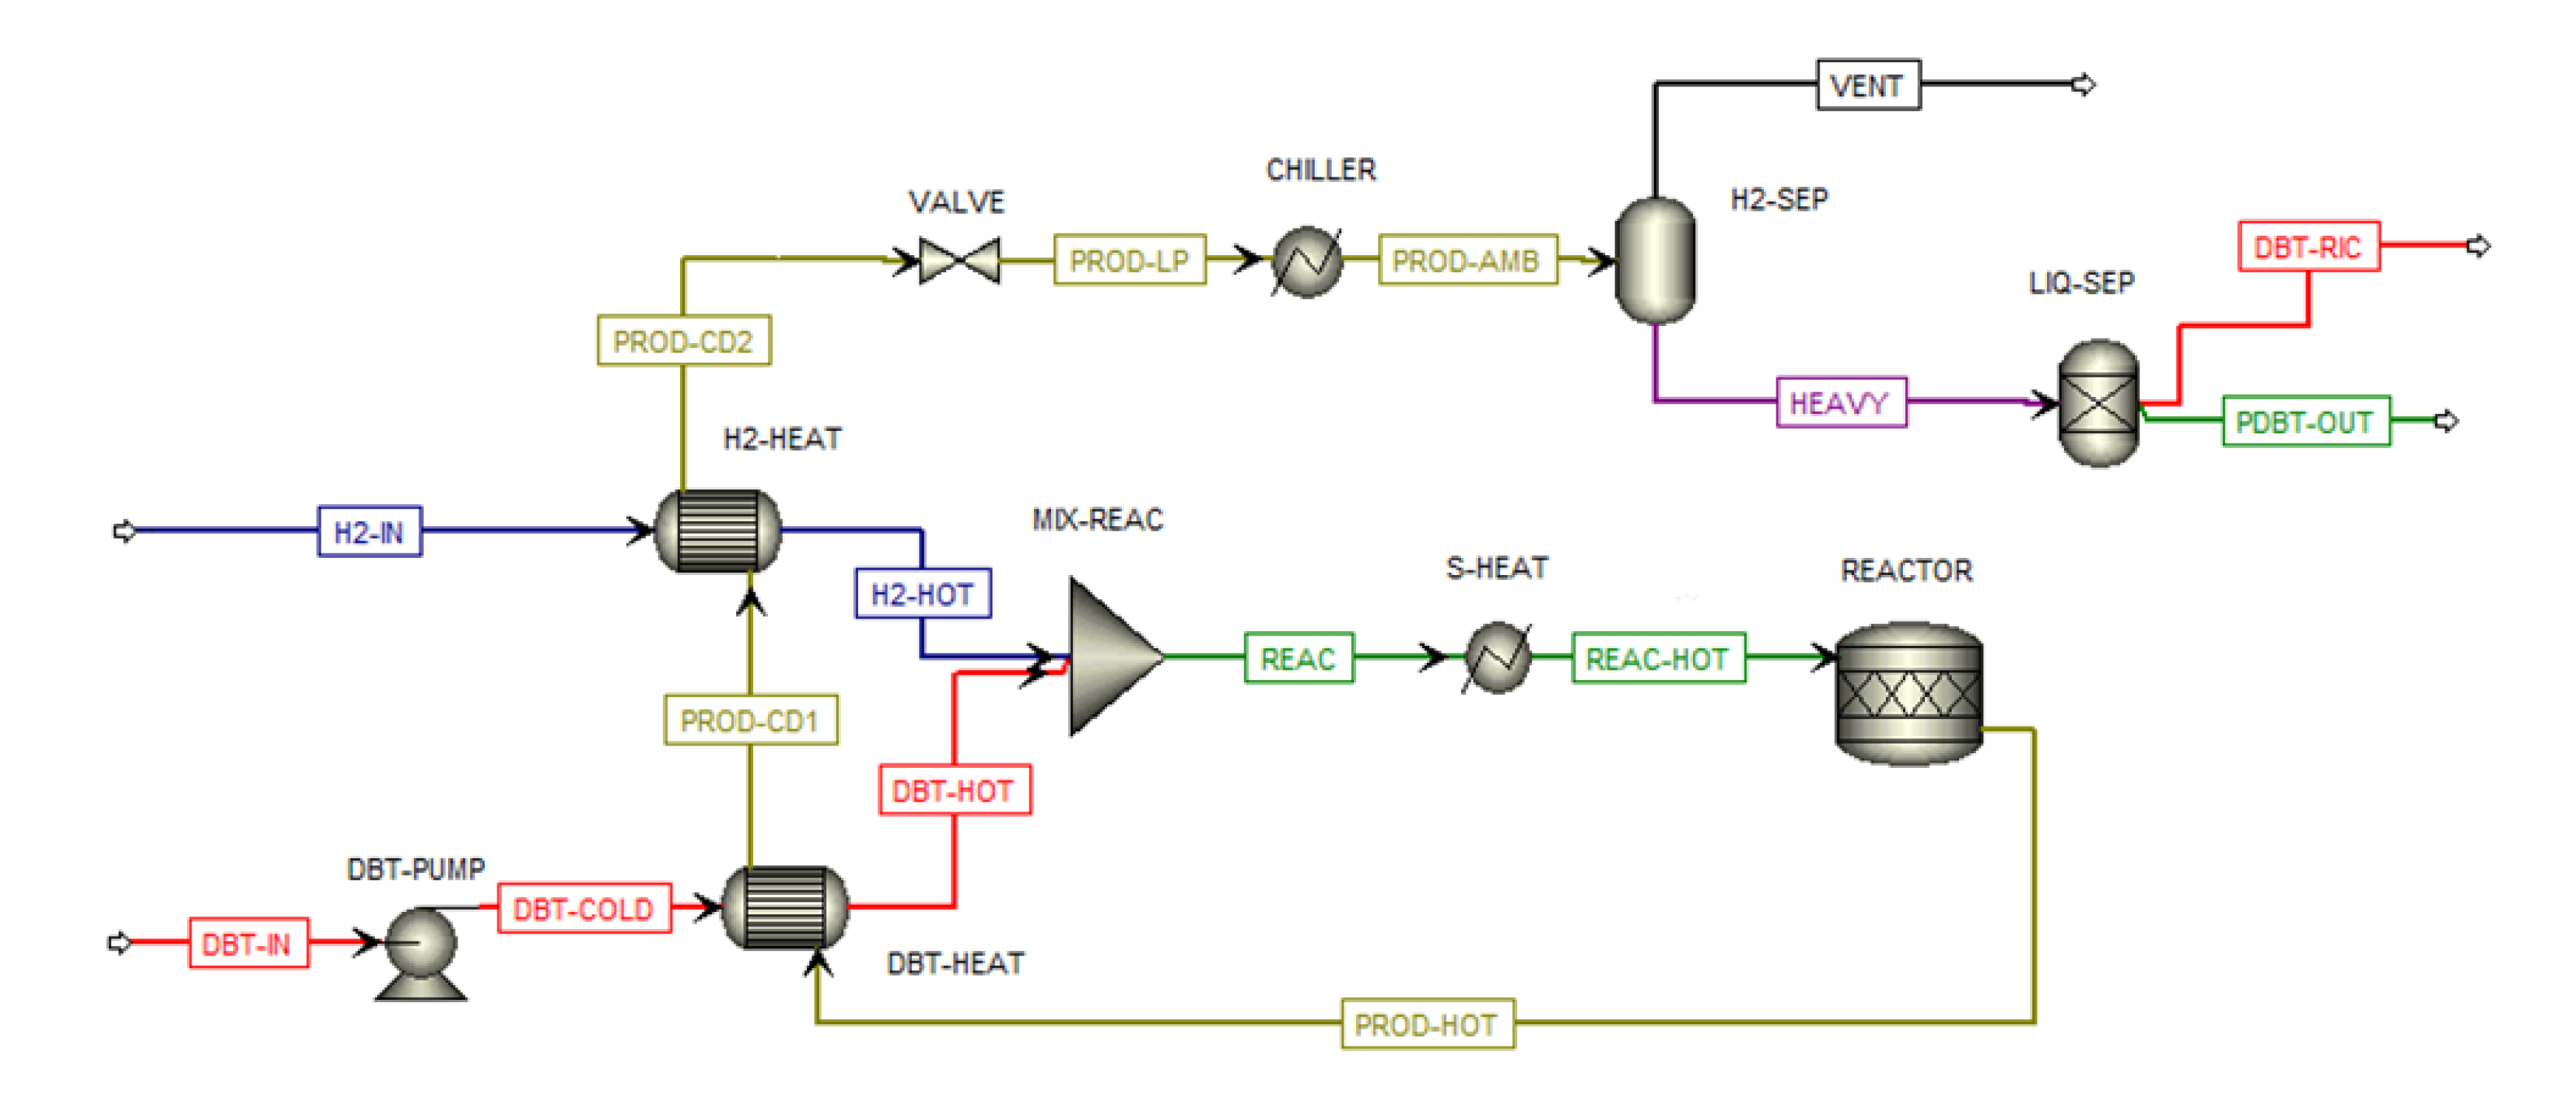
Figure 3.
PDBT dehydrogenation plant.
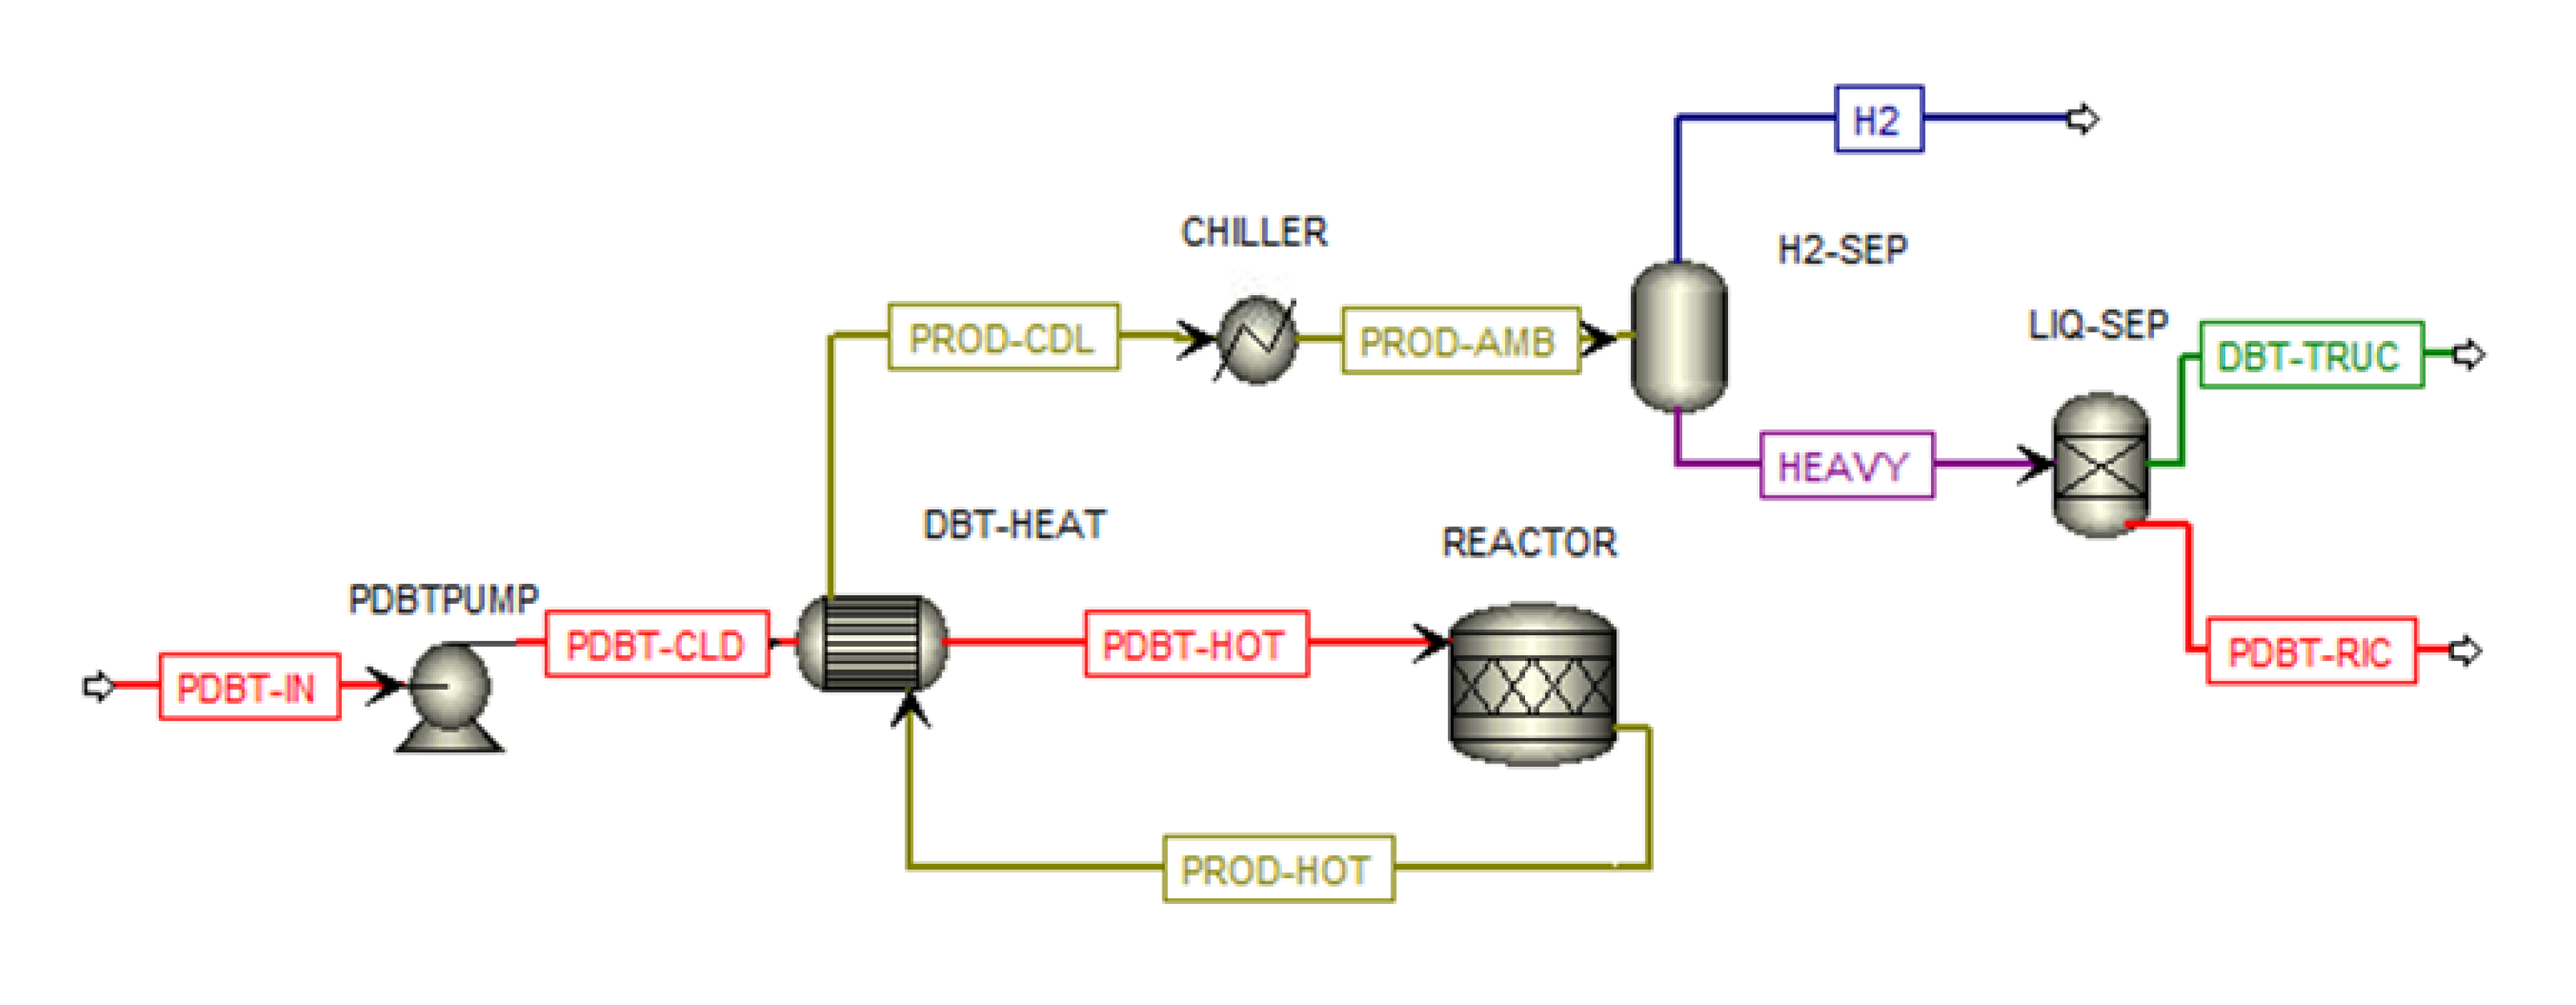
Figure 4.
The LCOTH breakdown as a function of distance and H2 daily demand: a) 50 km, b) 150 km, c) 300 km.
Figure 4.
The LCOTH breakdown as a function of distance and H2 daily demand: a) 50 km, b) 150 km, c) 300 km.
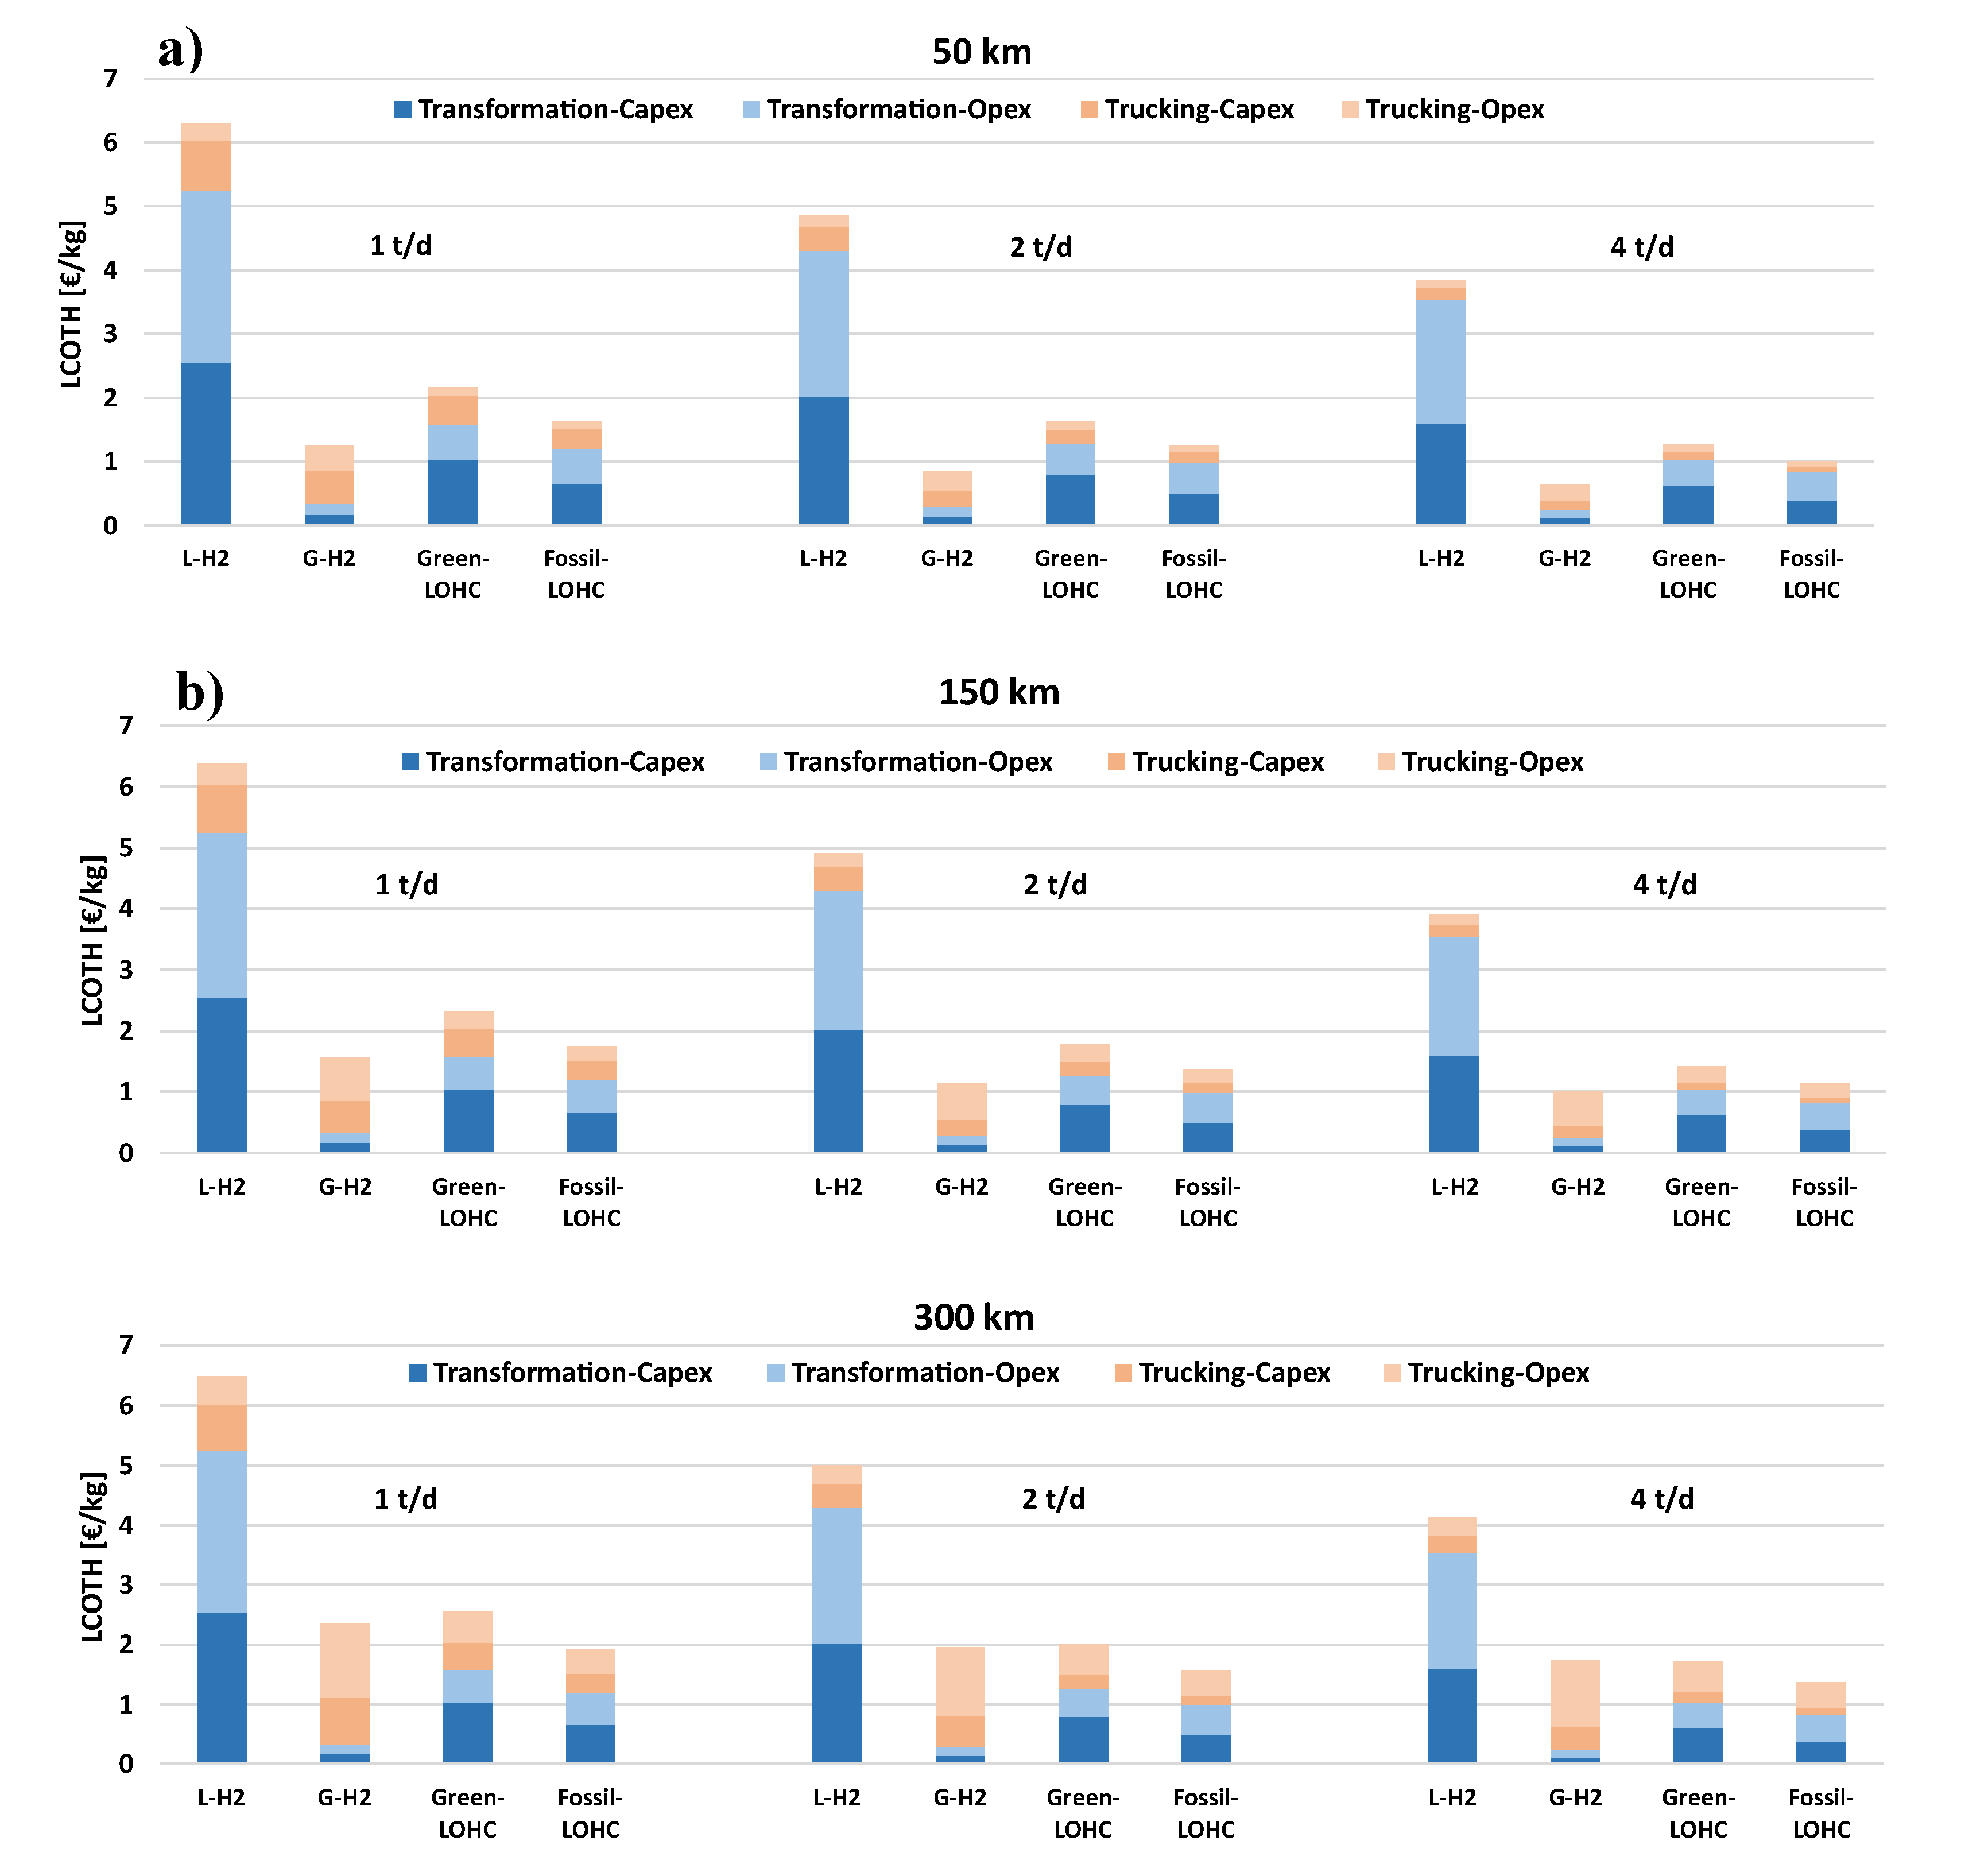
Figure 5.
LCOH as a function of distance and hydrogen demand.
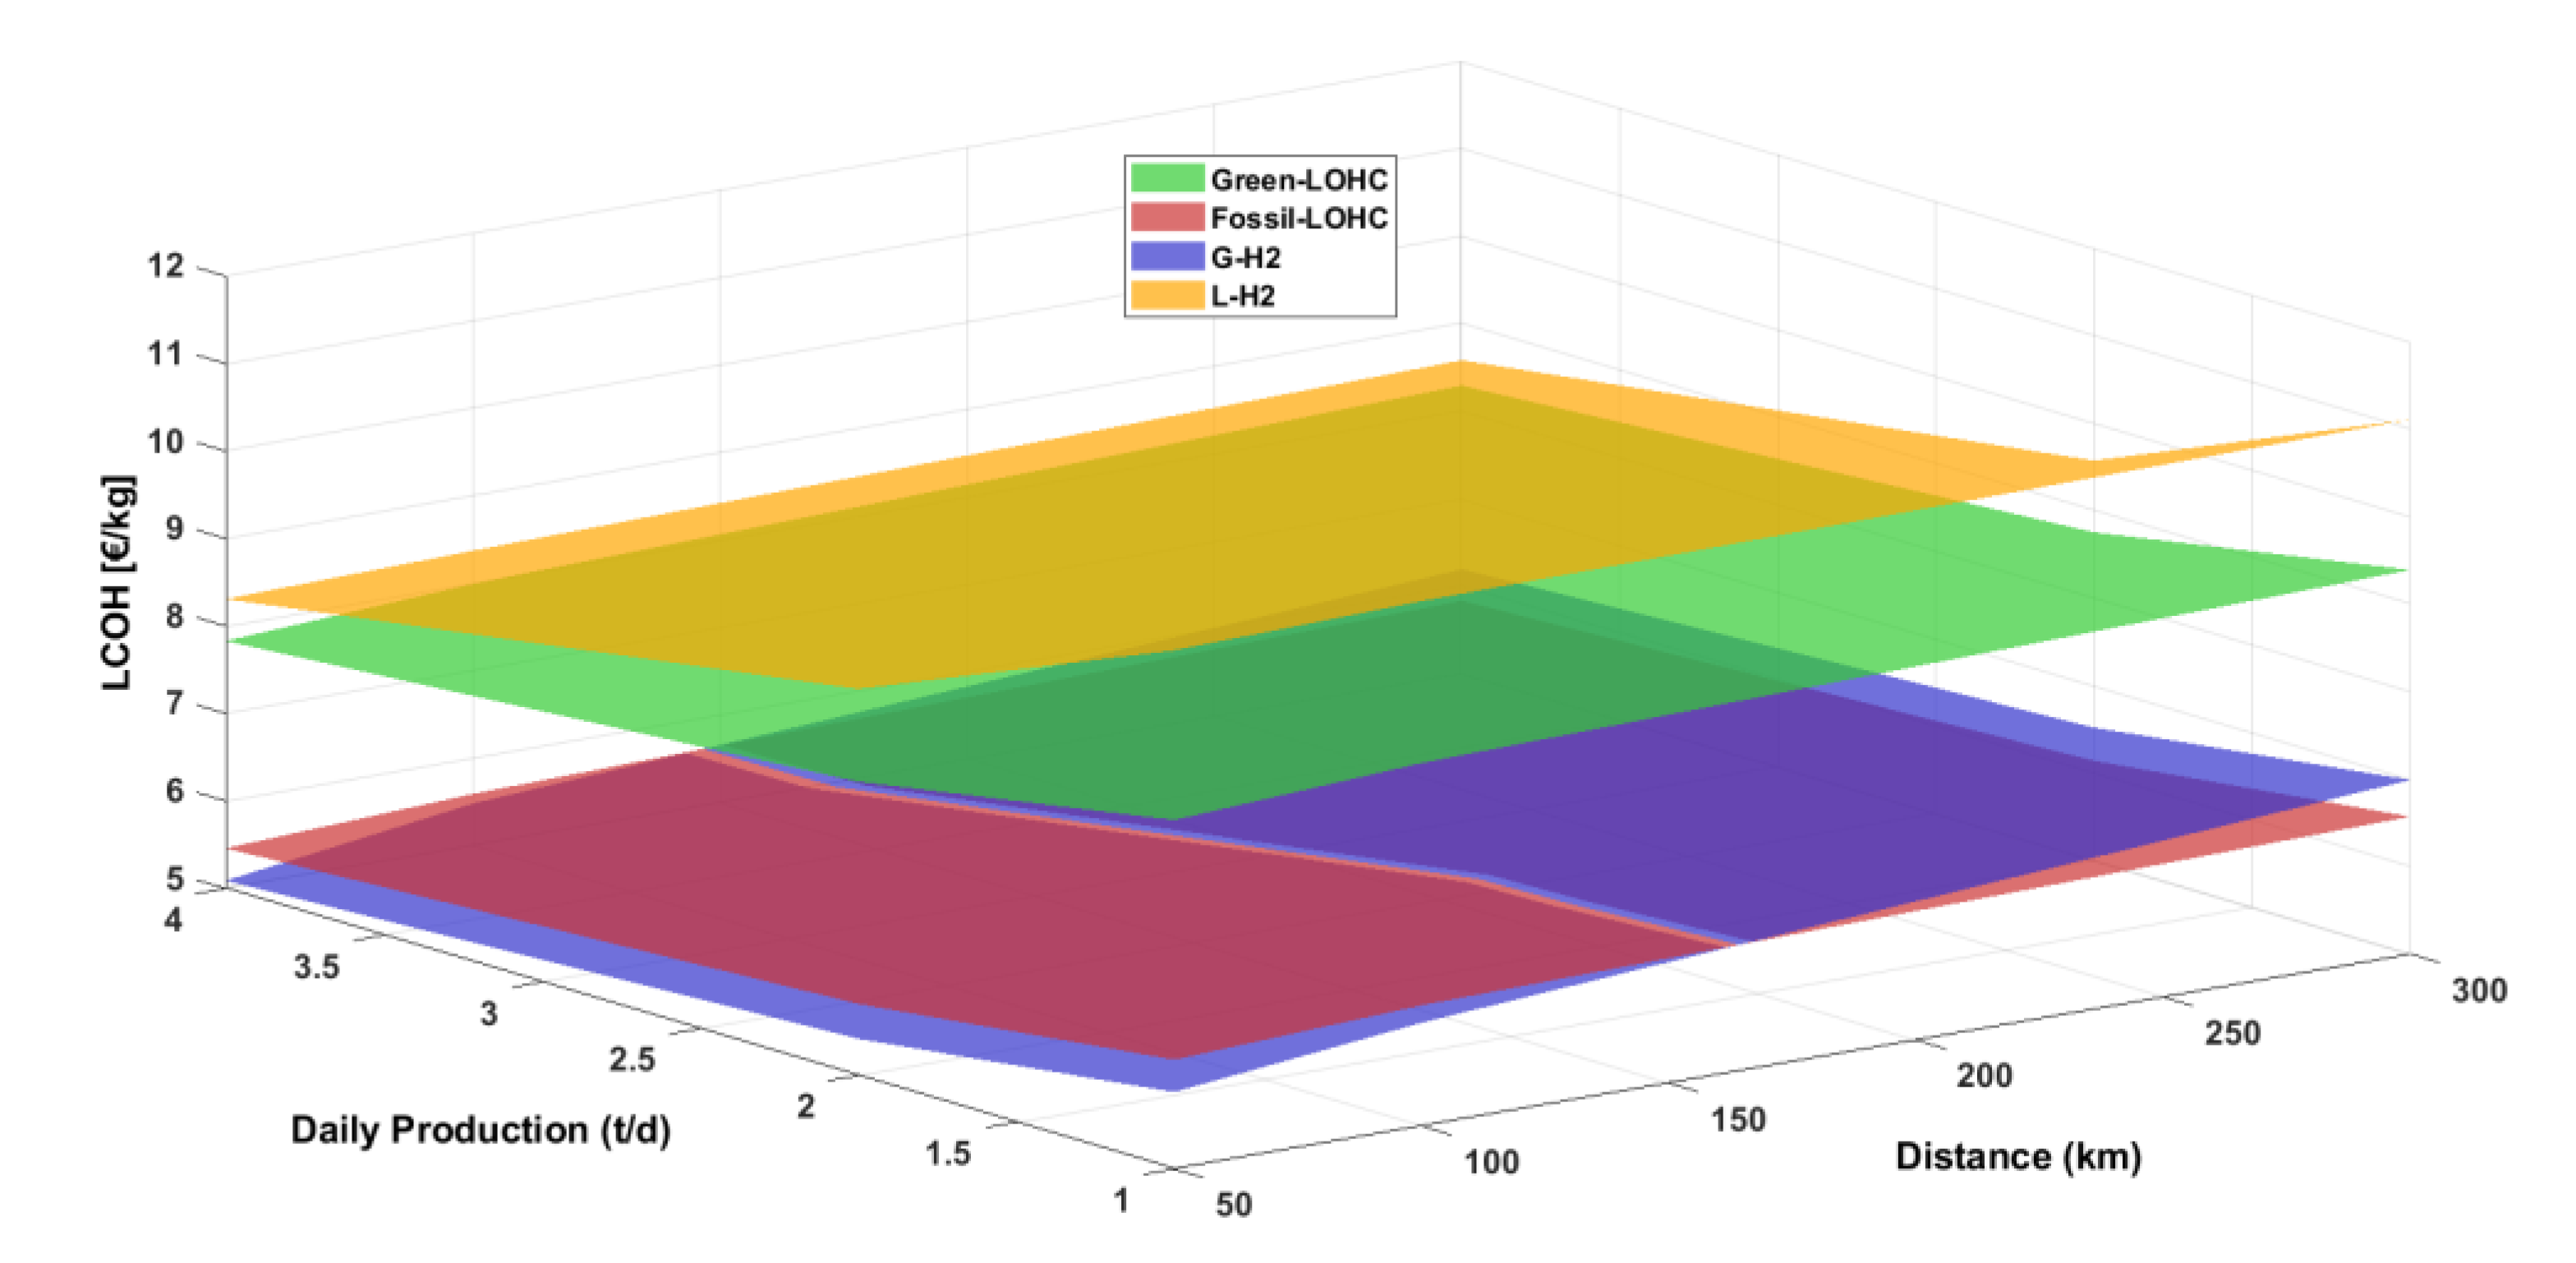

Table 1.
Properties of the DBT and PDBT molecules used in ASPEN Plus simulations.
| Properties | DBT | PDBT | Unit | Ref |
|---|---|---|---|---|
| Molecular weight | 272.39 | 290.54 | g/mol | [22] |
| Boiling point | 679.70 | 628.10 | K | [22] |
| Specific gravity 15°C | 1.13 | 0.98 | - | [22] |
| H2 capacity | 6.25 | - | Wt% | [22] |
| Enthalpy of reaction | 65.64 | - | kJ/mol | [22] |
| Enthalpy of vaporization | 62.50 | - | kJ/mol | [22] |
| Standard molar enthalpies of formation (l) | 112.90 | -475.60 | kJ/mol | [23] |
| Standard molar enthalpies of formation (g) | 225.70 | -387.40 | kJ/mol | [23] |
Table 2.
The inlet and outlet streams specifications for DBT hydrogenation process.
| Stream |
Temperature (°C) | Pressure (bar) | Mass Flow (kg/h) | ||
|---|---|---|---|---|---|
| 1 t/d | 2 t/d | 4 t/d | |||
| DBT-IN | 25 | 1 | 909 | 1818 | 3640 |
| H2-IN | 25 | 30 | 60 | 120 | 240 |
| PDBT-OUT | 25 | 4 | 955 | 1910 | 3825 |
Table 3.
Thermal power for the DBT hydrogenation process.
| Equipment | Tin (°C) | Tout (°C) | Q (MW) | ||
|---|---|---|---|---|---|
| 1 t/d | 2 t/d | 4 t/d | |||
| DBT-HEAT | 25 | 205 | 0.084 | 0.167 | 0.336 |
| H2-HEAT | 25 | 65 | 0.009 | 0.019 | 0.038 |
| REACTOR | 210 | 210 | -0.58 | -1.17 | -2.34 |
Table 4.
Electrical power for the DBT hydrogenation process.
| Equipment | IN | OUT | Pel (kW) | ||
|---|---|---|---|---|---|
| 1 t/d | 2 t/d | 4 t/d | |||
| DBT-PUMP | 1.1 bar | 35 bar | 1.03 | 2.01 | 4.18 |
| S-HEAT | 161 °C | 210 °C | 42.2 | 84.8 | 169.6 |
| CHILLER | 51 °C | 25 °C | 3.1 | 6.2 | 12.3 |
Table 5.
The inlet and outlet streams specifications for the PDBT dehydrogenation process.
| Stream |
Temperature (°C) | Pressure (bar) | Mass Flow (kg/h) | ||
|---|---|---|---|---|---|
| 1 t/d | 2 t/d | 4 t/d | |||
| PDBT-IN | 25 | 1 | 955 | 1910 | 3825 |
| H2 | 25 | 1.1 | 42 | 84 | 167 |
Table 6.
Thermal power for the PDBT dehydrogenation process.
| Equipment | Tin (°C) | Tout (°C) | Q (MW) | ||
|---|---|---|---|---|---|
| 1 t/d | 2 t/d | 4 t/d | |||
| DBT-HEAT | 25 | 290 | 0.164 | 0.327 | 0.654 |
| REACTOR | 297 | 297 | 0.48 | 0.95 | 1.90 |
Table 7.
Electrical power for the PDBT dehydrogenation process.
| Equipment | IN | OUT | Pel (kW) | ||
|---|---|---|---|---|---|
| 1 t/d | 2 t/d | 4 t/d | |||
| PDBTPUMP | 1 bar | 1.1 bar | 0.004 | 0.007 | 0.014 |
| CHILLER | 164 °C | 25 °C | 21.3 | 42.7 | 85.5 |
Table 8.
AEL technology characteristics.
| Parameters | Value | Unit |
|---|---|---|
| ICEL | 708-885 | €/kW |
| i | 8 | % |
| n | 15 | years |
| fixOPEX | 4 | % of ICEL |
| H2,out pressure | 15 | bar |
| Energy consumption | 4.8 | kWh/Nm3 |
| Electricity price | 0.07 | €/kWh |
Table 9.
Main parameters for the specific works of compression.
| Parameters | Description | Value |
|---|---|---|
| Z | H2 compressibility factor | Variable |
| R | Universal gas constant | 8.3145 J/mol K |
| T1 | Suction temperature | 313.15 K |
| M | H2 molar mass | 2.016 g/mol |
| p1 | Suction pressure | 1 atm |
| p2 | Discharge pressure | Variable |
| N | Number of stages | Variable |
| η | Isentropic efficiency | 75 % |
| γ | H2 specific heat ratio | 1.41 |
Table 10.
The hydrogenation and dehydrogenation parameters for DBT-PDBT system.
| Parameters | Value | Unit |
|---|---|---|
| ICbase,hyd | 40 | M€ |
| ICbase,dehyd | 30 | M€ |
| ICcompare | 300 | t/day |
| ICscale | 0.6 | - |
| fixOpex | 4 | % of IC |
| i | 8 | % |
| n | 15 | years |
Table 11.
Storage parameters for LOHCs system.
| Parameters | Value | Unit |
|---|---|---|
| Storage pressure | 1 | bar |
| ICbase,storage | 70.5 | € |
| ICcompare,storage | 1 | € |
| ICscale,storage | 1 | - |
| Compound cost | 4 | €/kg |
| fixOPEX | 2 | % of IC |
| i | 8 | % |
| n | 20 | year |
Table 12.
Main parameters of the liquefaction plant.
| Parameters | Value | Unit |
|---|---|---|
| ICbase,liq | 120.75 | M€ |
| ICcompare,liq | 50 | t/d |
| ICscale,liq | 0.66 | - |
| Liquify index | 10 | kWh/kg |
| FixOPEX | 8 | % of IC |
| i | 8 | % |
| n | 20 | year |
Table 13.
Parameters of trucking for LOHCs, 350 bar compressed and liquified hydrogen.
| Parameters | Truck | LOHC trailer | GH2 350 bar trailer | LH2 trailer | Unit | Reference |
|---|---|---|---|---|---|---|
| ICtrucking | 212 | 165 | 495 | 860 | k€ | [20,28] |
| fixOPEX | 8 | 4 | 4 | 4 | % | [20] |
| n | 8 | 15 | 15 | 12 | year | [20,28] |
| Net H2 payload | - | 2000 | 900 | 4300 | kg | [20,28] |
| Unloading and loading time | - | 1+1 | 1+1 | 3+3 | h | [20,28] |
| Fuel consumption | 0.45 | - | - | - | L/km | [20] |
| Fuel price | 1.77 | - | - | - | €/L | [32] |
| Average speed | 50 | - | - | - | km/h | [20] |
| Labour cost | 17 | - | - | - | €/h | [33] |
| Truck availability | 80 | - | - | - | % | [20] |
Table 14.
The logistic plan, including the required number of trailers and trucks, costs and number of trips.
Table 14.
The logistic plan, including the required number of trailers and trucks, costs and number of trips.
| Parameters | 1 t/d & 50 km | 1 t/d & 150 km | 1 t/d & 300 km | |||||||
|---|---|---|---|---|---|---|---|---|---|---|
| LOHC | GH2 | LH2 | LOHC | GH2 | LH2 | LOHC | GH2 | LH2 | ||
| # trucks + trailers | 2+2 | 2+2 | 2+2 | 2+2 | 2+2 | 2+2 | 2+2 | 3+3 | 2+2 | |
| Truck+trailer IC, M€ | 0.76 | 1.42 | 2.04 | 0.76 | 1.42 | 2.04 | 0.76 | 2.12 | 2.04 | |
| Transf Cost ann, M€/yr1 | 0.39 (0.41) | 0.12 | 1.92 | 0.39 (0.41) | 0.12 | 1.92 | 0.39 (0.41) | 0.12 | 1.92 | |
| Transp Cost ann, M€/yr | 0.17 | 0.38 | 0.39 | 0.23 | 0.54 | 0.42 | 0.33 | 0.90 | 0.47 | |
| Round trip time, h | 2 | 2 | 2 | 6 | 6 | 6 | 12 | 12 | 12 | |
| Tot trip time, h | 4 | 4 | 8 | 8 | 8 | 12 | 14 | 14 | 18 | |
| # trips per year | 183 | 417 | 121 | 183 | 417 | 121 | 183 | 417 | 121 | |
| Parameters | 2 t/d & 50 km | 2 t/d & 150 km | 2 t/d & 300 km | |||||||
| LOHC | GH2 | LH2 | LOHC | GH2 | LH2 | LOHC | GH2 | LH2 | ||
| # trucks + trailers | 2+2 | 2+2 | 2+2 | 2+2 | 2+2 | 2+2 | 2+2 | 4+4 | 2+2 | |
| Truck+trailer IC, M€ | 0.76 | 1.42 | 2.04 | 0.76 | 1.42 | 2.04 | 0.76 | 2.83 | 2.04 | |
| Transf Cost ann, M€/yr1 | 0.63 (0.67) | 0.21 | 3.14 | 0.63 (0.67) | 0.21 | 3.14 | 0.63 (0.67) | 0.21 | 3.14 | |
| Transp Cost ann, M€/yr | 0.22 | 0.50 | 0.41 | 0.35 | 0.80 | 0.45 | 0.54 | 1.52 | 0.52 | |
| Round trip time, h | 2 | 2 | 2 | 6 | 6 | 6 | 12 | 12 | 12 | |
| Tot trip time, h | 4 | 4 | 8 | 8 | 8 | 12 | 14 | 14 | 18 | |
| # trips per year | 365 | 821 | 182 | 365 | 821 | 182 | 365 | 821 | 182 | |
| Parameters | 4 t/d & 50 km | 4 t/d & 150 km | 4 t/d & 300 km | |||||||
| LOHC | GH2 | LH2 | LOHC | GH2 | LH2 | LOHC | GH2 | LH2 | ||
| # trucks + trailers | 2+2 | 2+2 | 2+2 | 2+2 | 3+3 | 2+2 | 3+3 | 6+6 | 2+2 | |
| Truck+trailer IC, M€ | 0.76 | 1.42 | 2.04 | 0.76 | 2.12 | 2.04 | 1.13 | 4.25 | 2.04 | |
| Transf Cost ann, M€/yr1 | 1.02 (1.11) | 0.36 | 5.17 | 1.02 (1.11) | 0.36 | 5.17 | 1.02 (1.11) | 0.36 | 5.17 | |
| Transp Cost ann, M€/yr | 0.32 | 0.74 | 0.46 | 0.58 | 1.48 | 0.55 | 1.04 | 2.78 | 0.86 | |
| Round trip time, h | 2 | 2 | 2 | 6 | 6 | 6 | 12 | 12 | 12 | |
| Tot trip time, h | 4 | 4 | 8 | 8 | 8 | 12 | 14 | 14 | 18 | |
| # trips per year | 730 | 1642 | 365 | 730 | 1642 | 365 | 730 | 1642 | 365 | |
Disclaimer/Publisher’s Note: The statements, opinions and data contained in all publications are solely those of the individual author(s) and contributor(s) and not of MDPI and/or the editor(s). MDPI and/or the editor(s) disclaim responsibility for any injury to people or property resulting from any ideas, methods, instructions or products referred to in the content. |
© 2025 by the authors. Licensee MDPI, Basel, Switzerland. This article is an open access article distributed under the terms and conditions of the Creative Commons Attribution (CC BY) license (http://creativecommons.org/licenses/by/4.0/).
Copyright: This open access article is published under a Creative Commons CC BY 4.0 license, which permit the free download, distribution, and reuse, provided that the author and preprint are cited in any reuse.


