
Submitted:
17 February 2025
Posted:
18 February 2025
You are already at the latest version
Abstract
Novel bread formulation with natural improvers has become an essential part of improving the quality of bakery products. In the present study, the novel bread improvers of the Gagome kelp cellulose (GC) was systemic evaluated, while the Gagome kelp cellulose-improved dough (GC-dough), gluten (GC-gluten), gluten protein and the starch (GC-starch) were all studied. The results indicated that the water and oil holding capacity, cholesterol adsorptive, unsaturated fat and saturated fat adsorptive capacity of the GC were significantly (p< 0.05) increase. The current GC also showed high glucose adsorptive capacity, antiox-idant activity, α-amylase inhibition and glucose diffusion inhibition activity. Furthermore, color of the GC-dough was obvious improved with the addition of the GC, which also significantly (p< 0.05) effect the content of glutenin, water holding capacity in GC-gluten and solubility the GC-starch. In addition, cross-linked network formed by GC could be observed in the GC-bread, and indicating the improved of texture and sensory evaluation. The bread added 1% (m/m) of GC provided the highest sensory character-ization and best cold-stored stability, which were suggesting the best strategy for the further study. The re-sults might show a potential application of the by-product devised from marine origin on the commercial bakery production.
Keywords:
cellulose
; bread
; dough
; gluten
; starch
1. Introduction
Bread is known for the bland flavor and spongy crumb, which are preserved along history. However, technological difficulties frequently appears in improving the nutrition and function of bread. Unexpected appearance and texture may generate with the adding of healthier ingredients to bread formulation, and resulting in a bizarre on the product [1,2].Decreasing content of gluten proteins might weaken the development of gluten network in the bread when replacing wheat flour for other components [3]. Moreover, the air retention and porosity of the bread dough might be negatively affected with the addition of non-gluten ingredient [4,5,6]. Drastic modifications on texture might lead by the addition of non-wheat ingredients to bread formulation, accompanying by the loss of quality [7,8,9]. Therefore, the development of novel functional formulation on bread without quality and texture deficiency was proposed as a nutrition-improving strategy.
Among the different bread improvers, the cellulose has been concerned by the health effects in diverse research [10]. As a dietary fiber source in the human diet, the cellulose is abundant and sustainable materials for the functional food [11]. The bland flavor, white color and food security of the cellulose might be benefit to the product features of bread. Moreover, increasing the viscosity could show in starch-containing food added cellulose, which limited the absorption and diffusion of glucose [12]. Furthermore, decreasing the activity of digestive enzyme might induce by cellulose, and presenting diffusional barriers to the contact of the enzyme with the substrate [11].Therefore, wide array of cellulose ingredients has been applied in cookies and bread, with the purpose of increasing the fiber content or reducing the calorific value. Plants and wood was the normal recourse of cellulose. However, little research has been done with regards to the utilization of the algal cellulose.
As early as 1885, Stanford et al. [13]. proposed the concept of algal cellulose, which is isolated from the insoluble residue after the extraction of alginates from brown algae. In one of the reports, the cellulose of brown algae exhibited superior thickening behavior in protein-rich food through hydrogen bonds to form a weak gel-like structure [13,14]. Thus, a worthwhile endeavor would be to clarify the potential effects of algal cellulose as a dietary fiber source in the human diet, especially for the texture and sensory characterization of food added algal cellulose.
In the view of the effect of cellulose on the bread formulation, the study was focus on the quality of cellulose-improved bread with the cellulose isolated from the Gagome kelp, which is a kind of brown seaweed with more than one million tons harvested each year [15]. The Gagome kelp also been cultivated in China in the northern Yellow Sea due to potential economic value [15]. The characterization of the Gagome kelp cellulose (GC) were studied herein. In addition, the effect of the GC on the characterization of the Gagome kelp cellulose-improved dough (GC-dough), Gagome kelp cellulose-improved gluten (GC-gluten) protein and the Gagome kelp cellulose-improved starch (GC-starch) were discussed at the same time. Furthermore, the GC was added into the bread formulation, and the morphology, texture, sensory characterization and cold-stored stability of the present bread were evaluated, in order to provide a novel formulation for improving the function, texture and sensory characterization of cellulose-improved bread (GC-bread). To the best of our knowledge, no such study on the quality of GC-bread with Gagome kelp has been reported to date.
2. Materials and Methods
2.1. Materials
The Gagome kelp (Kjellmaniella crassifolia), cultivated in the Yellow Sea near Dalian, China and harvested in May 2020, was provided by a local seaweed farm. The obtained Gagome kelp contained water 71.86(0.21)%. The dry basis of raw materials contained ash 1.73(1.16)%, crude protein 0.49(2.04)% and mannitol 0.16(3.50)%, the alginate is not detected in the present samples. The MCC was purchased from Sigma Co., Ltd.
The phthalic acid, sulfuric acid, standard cholesterol solution, glucose, α-amylase, hydrochloric acid, silver nitrate, sodium chloride, sodium hydroxide were all analytical grade and purchased from Macklin Co., Ltd. The ethanol, 2, 2-diphenyl-1-picryhydrazyl (DPPH), L-ascorbic acid, ferroferric oxide, salicylic acid, hydrogen peroxide, potassium iodide, potassium bromide in the present study were all analytical grade and purchased from Sigma-Aldrich Co., Ltd. The ab65333 glucose determination kit was purchased from Abcam Co., Ltd.
In addition, the peanut oil was bought from the Luhua Cereals & Oils Industry Group Co. Ltd. Potato starch and high-gluten flour was purchased from Lam Soon Co., Ltd. Yeast was purchased from Lesaffre Co., Ltd. The salt was purchased from China National Salt Industry Corporation. Sugar was purchased from Taikoo Sugar Co., Ltd. Butter was purchased from Lactalis Co., Ltd. The pig fat and fresh egg yolk were bought from local market in Dalian, China.
2.2. Determination on Water Holding Capacity of the GC
Firstly, the GC was isolated from the seaweed according to a previously reported procedure [16]. The wet sample was then rinsed with t-butanol, freeze-dried, and stored in a desiccator for the further experiments.
For the determination of water holding capacity, 40 mL deionized water was added into 1.0 g cellulose sample, the mixture was stored for 24 h at room temperature. Then, centrifugation was performed for 30 min at 4000 r/min, and the precipitate was dried until constant weight at 105℃. Finally, the water holding capacity was calculated by the following formula (1):
where the ma represents the weight of precipitate after centrifugation (g); mb represents the final weight after drying (g).
2.3. Determination on oil Holding Capacity of the GC
For the determination of oil holding capacity, a 150 mm quantitative filter paper was soak in peanut oil for 20 min, and hanging for 30 min until constant weight. Then, 0.2 g of cellulose samples were wrapped with the present quantitative filter paper, and soaking in peanut oil for 20 min. Thereafter, hanging process was performed for 30 min until constant weight. The oil holding capacity was calculated by the following formula (2):
where m represents the weight of cellulose sample (g); ma represents the weight of quantitative filter paper adsorbed peanut oil (g); mb represents the total weight of the cellulose sample wrapped with quantitative filter paper (g).
2.4. Determination on Unsaturated fat and Saturated fat-Adsorptive Capacity of GC
For the determination of adsorptive capacity on unsaturated fat, 3.0 g of cellulose samples were added in 24 g peanut oil, and the mixture was stored at 37 ℃ for 2 h. Thereafter, the mixture was centrifuged for 15 min at 4000 r/min. The dissociated peanut oil upon the precipitate was remove by a filter paper. Then, the adsorptive capacity on unsaturated fat was calculated by the following formula (3):
where the mc represents the weight of cellulose sample (g); mau represents the weight of cellulose sample adsorbed peanut oil (g).
For the determination of adsorptive capacity on saturated fat, the peanut oil was replaced by pig fat. After the same store and centrifugation process, the adsorptive capacity on saturated fat of the cellulose samples were calculated by the following formula (4):
where mau represents the weight of cellulose sample adsorbed pig fat (g).
2.5. Determination on Cholesterol Adsorptive Capacity of the GC
The cholesterol adsorptive capacity was determined by the method reported by Angioloni et al. [17]. Briefly, fresh egg yolk was ten times diluted with deionized water, and homogenizing into the emulsion. Then, 2.0 g cellulose samples were added into 50 mL egg yolk emulsion. The pH value of the mixture was adjusted to 2.0 and 7.0 with acetic acid, respectively. After the two hours-store at 37℃, the mixture was centrifuged for 20 min at 4000 r/min. Five milliliters of supernatant was mix with 15 mL 0.1 mg/mL phthalic acid solution and 10 mL sulfuric acid, and the mixture was stored at room temperature for 10 min. Finally, the absorbance value of the mixture was record at 505 nm, the standard cholesterol solution was performed for the calibration. The cholesterol adsorptive capacity was calculated by the following formula (5):
WHERE m1 represents the cholesterol weight of egg yolk emulsion (mg); m2 represents the cholesterol weight of supernatant (mg); m represents the weight of cellulose sample (g).
2.6. Determination on α-Amylase Inhibition Activity of the GC
In order to evaluating the α-amylase inhibition activity of the cellulose, 40 g potato starch was added into 1000 mL 50 mM phosphate buffer (pH 6.5). After stirring for 30 min at 65 ℃, 1 g cellulose sample and 0.004 g α-amylase was added into the potato starch solution. The mixture was shaking for 1 h at 37 ℃, and centrifuging for 20 min at 3000 r/min. The α-amylase inhibition activity of the cellulose samples were calculated by the following formula (6):
where A represents the absorbance value of the blank; A1 represents the absorbance value of the cellulose sample.
2.7. Determination on Glucose Adsorptive Capacity of the GC
For the determination of glucose adsorptive capacity, 1.0 g cellulose samples were added into 100 mL 5, 10, 50 and 100 mM glucose solution, respectively. The mixture was stirred for 6 h at 37 ℃, and centrifuged for 20 min n at 4000 r/min. Then, the absorbance value of the supernatant was record at 505 nm, and the standard glucose solution was performed for the calibration. The glucose adsorptive capacity was calculated by the following formula (7):
where Co represents the glucose concentration of glucose solution (mM); C1 represents the glucose concentration of supernatant (mM); m represents the weight of cellulose sample (g).
2.8. Determination on Glucose Diffusion Capacity and the Glucose Dialysis Retardation index (GDRI) of the GC
Before the determination of the glucose diffusion capacity, the cellulose samples were washed twice by ethanol to remove the soluble components [11]. Then, 0.5 g washed cellulose samples were added into 15 mL 100 mM glucose solution. After stirring for 1 h, the mixture was remove to a dialysis bag (Mw =1000) [18]. In order to stimulating intestine peristalsis, the dialysis bag was shaking in 200 mL deionized water for 3 h min at 37℃, and repeating the shaking process for 3 h after a 3 h rest.
For the determination of the GDRI value, the glucose content at 30, 60 and 90 min was record by the glucose determination kit. Finally, the glucose dialysis retardation index (GDRI) was calculated by the following formula (8):
where C represents the glucose concentration of the cellulose sample (mM); Cd represents the glucose concentration of the blank; Co represents the glucose concentration of initial glucose solution.
In addition, for the determination of glucose diffusion capacity, the glucose content on 30, 60, 90, 120, 180, 240, 360, 540, 720 and 1440 min was determined by a glucose determination kit.
2.9. Determination on Cation-Exchange Capacity of the GC
Before the determination of the cation-exchange capacity, the cellulose samples were soak into 30 mL 0.1 mM hydrochloric acid solution for 24 h, and the sample was washed with deionized water to pH 7.0. Then, the cellulose samples were titrated with 10% (m/v) silver nitrate solution until no white precipitation, and that precipitation was collected and dried. Next, 100 mL 0.15 g/mL sodium chloride solution was mix with 0.25 g dried cellulose sample. The mixture was titrated with 0.1 M sodium hydroxide solution (0.2 mL for each time) until pH remained unchanged. The cation-exchange capacity of the cellulose samples were calculated by the following formula (9):
where C represents the pH value at the end of titration; V1 represents the volume of sodium hydroxide solution in the titration on cellulose sample (mL); V0 represents the volume of sodium hydroxide solution in the titration on the blank (mL); m represents the weight of cellulose sample (g).
2.10. Determination on DPPH Free-Radical Scavenging Activity of the GC
The determination of DPPH free-radical scavenging activity of the cellulose samples were performed as described by Li et al. [19]. with minor modifications. Briefly, 2.0 g cellulose samples were dissolved in 30 mL 70% ethanol, and then 2 mL of the mixture was added to 2 mL DPPH solution (0.4 mM). The mixture was centrifuged at 5000 r/min for 10 min after 30 min of incubation in darkness, and the absorbance of the supernatant was detected at 517 nm. The L-ascorbic acid was used as control. The DPPH radical scavenging activity (%) was determined using the following equation (10):
where Ab represents the absorbance of the blank; As represents the absorbance of the cellulose sample; Ac represents the absorbance of the control.
2.11. Determination on Hydroxyl Radical Scavenging Activity of the GC
For the determination of hydroxyl radical scavenging activity, 2.0 g cellulose samples were dissolved in 30 mL 70% ethanol. Then, 0.2 mL cellulose ethanol solution was mix with 1 mL 0.15 mM ferroferric oxide solution, 0.4 mL 2 mM salicylic acid solution, 1 mL 6 mM hydrogen peroxide solution and 0.4 mL deionized water. After 30 min of incubation at 37 ℃, the mixture was centrifuged for 5 min at 5000 r/min, and the absorbance of the supernatant was detected at 510 nm. The L-ascorbic acid was used as control. The hydroxyl radical scavenging activity (%) was determined using the following equation (11):
where Ab represents the absorbance of the blank; As represents the absorbance of the cellulose sample; Ac represents the absorbance of the control.
2.12 Determination on the Volume, pH and Color of the GC-Dough
During the preparation of the GC-bread, the properties of the GC-dough, GC-gluten and the GC-starch was evaluated. Firstly, the GC-dough was prepared with the GC and flour. Briefly, 2.00 g cellulose samples were mix with 18.00 g high-gluten flour. Then, 5.9 mL 20 mg/mL sodium chloride solution was added into the mixture with continuous stirring, until the GC-dough was obtained. The raw GC-dough was fermented at 40 ℃ with 80% of humidity for 20, 40 and 60 min, respectively, and the volume of final GC-dough was determined. Then, the fermented GC-dough was added in 90 mL deionized water, and the pH of the mixture was determined.
In addition, the quantitative evaluation of the color changes in fermented GC-dough sample was performed using a colorimeter (HunterLab D65 UltraScan PRO, USA). The colorimeter was calibrated against a standard calibration plate with a white surface and set to CIE Standard Illuminant C before each measurement series. The color brightness coordinate L* (from white at 0 to black at 100) and the chromaticity coordinates a* (green when positive and red when negative) and b* (yellow when positive and blue when negative) were measured [18]. The assay was repeated three times. Then, the color difference (ΔE) of the dough was determined using the following equation (13, Arslan & Musa Özcan, 2008)
2.13. Separation of the GC-Gluten and GC-Starch
The separation of GC-gluten and GC-starch were performed as described by Chinese standard [20]. Firstly, 50 g of the GC-dough was fermented for 30 min at 25 ℃. Then, the fermented GC-dough was washed with 20 mg/mL sodium chloride solution, and the wet GC-gluten obtained was detected by potassium iodide solution until no change of color could be observed. Additionally, the eluate was collected and sieved by a 200 mesh, and the filtrate was centrifuged for 30 min at 5000 r/min. After drying for 24 h at 55 ℃, the precipitate was sieved by a 100 mesh to obtain the GC-starch.
2.14. Determination on the Solubility and Swelling of GC-Starch
Twenty-five milliliter of the deionized water was added into 0.5 g GC-starch sample, and boiling for 20 min. After cooling to room temperature by the ice-bathing, the mixture was centrifuged for 15 min at 3000 r/min. The supernatant and precipitate was dried, respectively, until no change in weight could be observed. The solubility (14) and swelling (15) of the GC-starch sample was determined using the following equation:
where ms represents the starch weigh of supernatant (g); mi represents the initial weigh (0.5 g) of starch (g); mp represents the starch weigh of precipitate (g); s represents the solubility of the GC-starch sample determined using the equation (14, %).
2.15. Determination of the Content and Water Holding Capacity of GC-Gluten
For the determination of the gluten content, the wet GC-gluten was centrifuged at 6000 r/min for 10 min, and the gluten content in the dough was determined using the following equation (12):
where C represents the gluten content of cellulose dough (%); m1 represents the weight of cellulose sample (g); m2 represents the weight of gluten in cellulose dough (g).
After the determination on the content of GC-gluten, the water holding capacity was evaluated with the method described in the 2.1, while the cellulose sample was replaced with the GC-gluten sample.
2.16. The Secondary Structure of GC-Gluten Protein
The secondary structure of gluten protein was determined by the fourier transform infrared (FTIR) spectroscopy. Before the determination, 0.001 g freezing-dried GC-dough powder was ground and sieving with an 80-mesh sieve, the powder mixed with 0.1 g potassium bromide powder, and the mixture was pressed into cylindrical tables. The FTIR spectroscopy was record by a fourier transform infrared spectrometer (Frontier, PerkinElmer, USA) with wavelength of 400 cm-1 ~ 4000 cm-1.
2.17. Determination on the Content of Glutenin and Gliadin
For the determination on the content of glutenin and gliadin, 5.00 g freezing-dried GC-dough powder was dissolved in 75 mL 70% ethanol solution. The mixture was centrifuged for 10 min at 5000 r/min after 2 h of magnetic stirring. The precipitate was added into 75 mL 70% ethanol solution, and the same stirring and centrifugation process was performed. After washing by deionized water, the precipitate was freeze-dried to obtain the glutenin. At the same time, both supernatant in the centrifugation was collected, followed by vacuum concentrating and freeze-drying to obtain the gliadin.
2.18 Preparation of the Cellulose Bread
For the preparation of the cellulose bread powder, the cellulose samples were added into high-gluten flour with the ratio of 0, 1%, 3%, 5% and 7% (m/m, calculated with the weight of high-gluten flour), respectively. Then, 165 g water and 4 g yeast were added into 280 g above cellulose bread powder, mixing for 2 min. Next, 3 g salt and 30 g sugar was added into the mixture. After 2 min of mixing, 25 g butter was added into the mixture, followed by 12 min of mixing. After 20 min of fermentation at 30 ℃, the final mixture was divided into 50 g of dough, and those doughs were stored for 15 min at room temperature. The second fermentation was performed for 30 min at 40 ℃ with 80% of humidity. Finally, the doughs were baking by an oven for 15 min at 180 ℃ (top temperature) /200 ℃ (bottom temperature).
2.19. The scanning Electron Microscopy (SEM) Observation of the Cellulose Bread
The morphology of the cellulose bread was observed by SEM (SU1510, HITACHI, Japan) as the described by Li et al. [21]. with minor modifications. Briefly, the freeze-dried cellulose bread (cellulose content of 1%, 3%, 5% and 7%) samples were ground, and the powder was put on a specimen stage equipped with conductive adhesive. After coating with a gold-palladium alloy for 60 s at 10 mA, the cellulose bread samples were observed by a SEM. The images were processed using a SEM series software (Tokyo, HITACHI).
2.20. Determination on Texture Profile of the Cellulose Bread
The texture of cellulose bread (cellulose content of 1%, 3%, 5% and 7%) was determined as described by Li et al. [21]. with minor modifications. For the texture profile analysis (TPA), the top and bottom of the fresh cellulose bread was removed, and the center of cellulose bread was cut into 3.0 cm×3.0 cm× 3.0 cm sample. The TPA was performed by a texture analyzer with a P/0.5S probe (TA-XT2i plus C, Stable Micro Systems, Surrey, UK). Then, the determination was performed for 2-cycle sequence with 1.5 N of strain, 50 mm/min of test speed and 25% of deformation.
2.21. Sensory Evaluation of the Cellulose Bread
The present GC-bread were evaluated by a trained sensory group of ten educated panelists (five females/five males, aged between 25 and 50 years), and the evaluation was similar to that described by Akyüz et al. [22]. Attributes agreed by the assessors are listed with a sensory analysis form of 15 scaled descriptive profile analysis form [23].
2.22. Determination on the Moisture Content and Hardness of the Cold-Stored GC-Bread
The moisture content of the cellulose bread was determined as described by Chinese standard GB/T 5009.3 [24]. Briefly, the cellulose bread was grounded into the powder. Then, five gram of the bread powder was put into a weighing bottle, and drying into constant weight in a 105℃ hot-air drier (FD-S56, Binder, Germany). And the moisture content (M) of the cellulose bread was canulated using the following equation (13):
where m1 represents the weight of weighing bottle and bread sample (g); m2 represents the weight of weighing bottle and bread sample after drying (g); m3 represents the weight of weighing bottle (g).
The hardness of the cold-stored GC-bread was determined as described by Carlos et al. [25]. The cellulose bread (cellulose content of 1%, 3%, 5% and 7%) was stored for 1, 3, 5 and 7 days at 4℃, and then the same TPA was performed. The hardness of stored cellulose bread was fit into the Avrami formula (16):
where Fs represents the hardness of the stored cellulose bread sample (N); F0 represents the hardness of the fresh cellulose bread without store (N); k represents the rate constant; t represents the store time (d); n represents the Avrami index.
Fs - F0 = 1 – exp (-ktn)
2.23. Statistical Analysis
All measurements in the present study were performed thrice, and the MCC was used as control. The mean and standard deviation of the data were calculated for each treatment. Analysis of variance (ANOVA) was carried out to determine any significant differences (p<0.05) among the applied treatments by the SPSS software package (SPSS 16.0 for Windows).
3. Results and Discussion
This section may be divided by subheadings. It should provide a concise and precise description of the experimental results, their interpretation, as well as the experimental conclusions that can be drawn.
3.1. Water and Oil Holding Capacity of the GC
The water and oil holding capacity of GC would affect the water availability in of the protein in bread, and delaying the development of gluten. As shown in Table 1, the water and oil holding capacity of GC was significantly (p<0.05) higher than those of MCC, suggesting an improved texture of bread added GC. The results might be attribute to the porous structure of GC, which could adsorb the water and oil droplets in a cross-linking network by steric hindrance [26]. In addition, the hydrophilic hydroxyl group of the cellulose might also increase the water holding capacity of the GC [26].
3.2. Interaction Between the GC and Lipid
The lipid-lowering effect of the cellulose has been widely reported in recent years. For the illumination of interaction between the GC and lipid, the adsorptive capacity of the GC on unsaturated fat and saturated fat was evaluated. As shown in Table 1, the unsaturated fat and saturated fat adsorptive capacity of the GC was 1.39±0.03 mg/g and 1.73±0.26 mg/g, respectively, which were significantly (p<0.05) higher than those of MCC.
Moreover, the adsorptive capacity on saturated fat of the GC and MCC was higher than the results on unsaturated fat (Table 1), and the steric hindrance induced by double-bonded electronic cloud of the unsaturated fat might attribute to the results [27]. The steric hindrance reduce with the reducing diameter of unsaturated fat molecule, and weakening the unsaturated fat adsorptive capacity of the present cellulose sample.
3.3. Cholesterol Adsorptive Capacity of the GC
The cellulose-enhanced food could be facile to the formation of the mucous upon the inner wall of small intestine, which might attribute to the cholesterol-lowering effect in vivo [28]. In addition, the gel cross-linked by cellulose might also be the barrier layer to limit the absorption of cholic acid, which could increase the consumption of cholesterol. In order to evaluating the cholesterol-lowering effect in vitro, the cholesterol adsorptive capacity of the GC was determined. The results showed the obvious effect on the adsorptive capacity of the GC (Table 1). The cholesterol adsorptive value of the GC at pH 7.0 (5.47±0.38 mg/g) was higher than those of pH 2.0 (4.48±0.14 mg/g), indicating the improved cholesterol adsorptive capacity in small intestine rather than stomach [28].
3.4. The α-Amylase Inhibition Activity of the GC
The α-amylase was found in saliva and pancreatic juice, hydrolyzing starch into maltose [11]. Recent studies showed that the α-amylase inhibition activity had varied depending on the cellulose sources, concentration and purity [11]. Results in Table 1 indicated the efficient α-amylase inhibition activity of the GC and MCC. Although lower than inhibition activity of MCC, the GC showed 14.31±0.21% of α-amylase inhibition activity. Such results were supported by the reports of Liu et al. [11], who indicated that diet including 20% purified cellulose showed efficient α-amylase activity in vivo, and suggesting the hypoglycemic effect of cellulose-enhanced food.
3.5. Interaction Between the GC and Glucose
The cellulose have potential application in food system as dietary fiber, which could limit the absorption and diffusion of glucose [11]. For the illumination of the interaction between the GC and glucose, the glucose adsorptive capacity, GDRI and diffusion capacity was determined. The GC showed a concentration-dependent glucose adsorptive capacity as shown in Figure 1A. The glucose adsorptive capacity of the present GC ranged from 1.23±0.02 mM to 7.27±0.37 mM, increasing with the increased content of glucose (from 5 to 100 mM). Moreover, the present GC showed a stronger glucose adsorptive capacity than the MCC. When the content of glucose increase to 100 mM, the glucose adsorptive capacity value of the GC was above 3 times higher than those of MCC. Similar trends have been observed for cellulose-rich fractions from citrus peel [29], which suggested saturated concentration of glucose was nearly 324 μmol/g. The large surface area of cellulose induced by cross-linking network might attribute to such high glucose adsorptive capacity, and increasing the binding force on glucose molecular with high steric hindrance [29]. Furthermore, the high steric hindrance of cellulose might inhibit the diffusion of glucose in vivo [29].
The GDRI value had been used as an indicator of the retardation effect of the cellulose on glucose absorption in jejunum [11], As shown in Figure 1B, the GDRI value of the GC showed the highest GDRI value of 14.18±0.04% after 30 min-dialysis, and significantly (p<0.05) reducing with the increasing dialysis time. Additionally, the MCC showed the highest GDRI value of 15.89±0.13%.after 60 min-dialysis. The results indicated that both GC and MCC showed obvious effect on the inhibition of glucose diffusion, which was supported by the results of Figure 3-2. Several studies had reported the glucose adsorptive capacity of the cellulose, and retard the glucose absorption in vivo by three main mechanisms [30,31]. Firstly, cellulose would increase the viscosity of liquids in digestive system, and inhibiting the diffusion of glucose in the intestinal lumen. Secondly, large molecules in cellulose could bind with glucose, and limiting the diffusion which is needed for facilitated transport in intestine. Finally, dietary fiber may inhibit the activity of α-amylase enzymes that convert starch to glucose. Such mechanisms was in agreement with the results of the present GC, suggested that the GC exerts hypoglycemic potential attributed to the glucose adsorptive capacity and diffusion-inhibition capacity.
Results of Figure 3C showed that addition of the GC contribute to reduced glucose diffusion. When the diffusion time increased to 240 min, the glucose concentration of the GC was lower than those of blank control, suggesting the glucose diffusion capacity of the GC, which was in agreement with the high GDRI value. In addition, no significant difference on glucose diffusion capacity were observed between the GC and MCC. The results were similar to the study of rice bran cellulose on glucose diffusion reported by Qi et al. [30], who studied glucose diffusion in rice bran cellulose over 12 h, and indicated that maximum glucose levels were reached after 300 min.
3.6. Cation-Exchange Capacity of the GC
Acidulous cation, such as Ca2+, Zn2+, Cu2+ and Pb2+, could effect on the hydroxyl and carboxyl groups of cellulose molecular. The results might suggest that the gastrointestinal buffering capacity might induce by the cellulose in food, which improved the osmotic pressure in vivo. As shown in Figure 2A. Moreover, the high cation-exchange capacity could be observed in the present GC. The pH value of the GC mixture increased with the addition NaOH solution, and reaching saturation at pH 9.78. The results showed that cation-exchange capacity of GC and MCC was 383.35±10.89 mmol/g cellulose and 147.41±4.88 mmol/g cellulose, respectively.
3.7. Antioxidant Activity of the GC
The antioxidant activity of the GC was evaluated by the DPPH and hydroxyl radical scavenging activity. As shown in Figure 2B. The DPPH radical scavenging activity of the GC (67.93±0.19%) was significantly (p<0.05) higher than that of MCC (15.66±0.09%).
In addition, the high antioxidant activity of the GC might in agreement with high hydroxyl radical scavenging activity, which was related to senescence and peroxidate metabolism in vivo. The hydroxyl radical scavenging activity of GC was 78.62±1.92%, and those of the MCC (42.18±0.59%) was significantly (p<0.05) lower than GC..
3.8. Effect of the GC on Dough of Bread
In order to evaluating the effect of GC on dough characterization, the volume (Figure 3A), pH (Figure 3B) and color (Table 2) of the GC-dough with different fermented time were determined. As shown in Figure 3A, the significantly (p<0.05) increase on volume of GC-dough could be observed with the increase of fermented time. After 40 min-fermentation, the volume of GC-dough was significantly (p<0.05) smaller than those of blank. The results might indicated that addition of the present GC could significantly (p<0.05) reduced the volume of dough within 20-60 min fermentation. A rigid dough enhanced by the GC was indicated that highly resistant to deformation, which limits the expansion of gas cells in the GC-dough during proofing [12]. Moreover, the effect of GC on proofing behavior of GC-dough might be also assigned to the strengthening effects on the texture of present bread.
The effect of GC on pH of GC-dough was shown in Figure 3B. Although reduce on pH value could be observed on GC-dough, there was no significant (p<0.05) difference on dough either with or without GC in 20-60 min fermentation. Such results might attribute to the esters, which could neutralized the lactic acid in dough fermentation, and buffering the pH fermented GC-dough. Moreover, such buffering capacity of the GC might be related to the high cation-exchange capacity shown in Figure 2A.
The color quality of bread could greatly affect their acceptance by consumers. In this study, the significant (p<0.05) effect of the GC on color of GC-dough could be observed in Table 2. The light values of GC-dough was significant (p<0.05) higher than those of blank control, and the fermented GC-dough for 40 min showed the highest light values of 321.39±17.09. The results suggested that addition of the GC might improve the color of the fermented dough, which might indicated the potential application of the GC on the commercial production.
3.9. Effect of the GC on Gluten of Bread
The gluten, which consist of glutenin and gliadin, evidently effect on the structure and texture of the fermented dough. To evaluate the effect of the GC on the content and water holding capacity (Figure 3C). The significant (p<0.05) reduce could be observed on gluten content of GC-dough (24.96±1.22%) as compared to blank control (31.50±0.89%). Besides reduced content of high-gluten flour, the high water holding capacity of GC (Table 1) might also attribute to such results, and inhibiting the formation of gluten in dough [32].
Moreover, such high water holding capacity of GC was further supported by similar high water holding capacity of the GC-gluten [33]. As shown in Figure 3C, the water holding capacity of the GC-gluten was 1.71±0.08 g/g, which was significant (p<0.05) higher than those of blank control. The results were related to of high water holding capacity of the GC showed in Table 1. In the previous studies, the cellulose was reported to affect protein water availability, and delaying the development of gluten [9]. Therefore, the high water holding capacity of the GC-gluten would suggested that the gluten network was differently developed [9].
3.10. Structure of the Protein in GC-Gluten
In addition, the water holding capacity of GC-gluten has a critical influence on the secondary structure of gluten protein. The secondary structure of protein in GC-gluten was further studied, and the results were showed in Table 3. Firstly, the content of glutenin in GC-gluten was significantly (p<0.05) more than those of blank control, while significant (p<0.05) reduce on gliadin in GC-gluten could also be observed. Furthermore, both content of glutenin and gliadin in the GC-gluten was significantly (p<0.05) more than those gluten of the MCC, though no significant difference could be observed on their fraction. Carlos et al. [25]. indicated that the addition of cellulose allowed the formation of a resistant gluten network, which lies in a large number of interactions between glutenin and gliadin.
Then, the content of α-helix, β-sheet and random of the GC-gluten significantly (p<0.05) increased as compared with blank control (Table 3), while those of β-turns was significantly (p<0.05) reduced. High holding capacity of GC-gluten might attribute to such results. Previous studies had suggested that water molecules could held between protein chains, and weakening the hydrogen bonding among glutenin and gliadin. The elasticity of the gluten network might decreasing with viscous behavior in a Maxwell representation for dough relaxation [34].
3.11. Effect of the GC on Starch of Bread
For the further evaluation on effect of GC in structure of present bread, the solubility and swelling of starch was determined. As shown in Table 4, the solubility and swelling of starch was significantly (p<0.05) lower than the dough without GC. Correa et al. [35]. proposed that hydrocolloids, which formed by the cellulose, could modify the pasting profiles of wheat flour by means of hindering the hydration of starch granules or the lixiviation of amylose. Therefore, the hydrocolloids formed by the GC in GC-dough might attribute to such poor solubility and swelling of the starch.
3.12. Characterization of Bread Added GC
The morphology and texture of the present bread added GC was determined in this study. The images of SEM investigated the structure of GC-bread (Figure 4). A cross-linked network formed by gluten protein could be observed in the present bread. The intermolecular covalent cross-linking by disulfide bond of GC-gluten protein might attribute to such morphology. Moreover, the concentration-depended destruction of the network could be obviously observed with the addition of the GC in the present bread, the granules of GC might hindered the proper arrangement of the gluten proteins [36]. With the increasing ratio of the GC from 1% to 7%, the smoothing surface of cross-linked network was developed. The GC-bread observed the presence of a network mostly composed of gluten films, showing a more closed and less cross-linked appearance, but also a more orientated network. Such microstructure of GC-bread was related to previous studies [36], which suggested that dough prepared with hydroxypropyl methylcellulose presented an open and cross-linked gluten network.
The TPA further confirmed the effect of GC on the texture of the present bread (Figure 5A). With the addition of the GC, significantly effect (p<0.05) could be observed on the hardness, adhesiveness and chewiness as compared with the blank control . Moreover, the hardness of the present bread significantly (p<0.05) increased with the increasing content of the GC. Ren et al. [12]. had reported similar results in the study of gluten free bread enhanced by cellulose. Such study speculated that both flour and cellulose particles were rigid fillers. The cellulose particles are more rigid than the hydrated flour particles in the bread, competing for water and further increases the rigidity of the dough. Therefore, the bread are strengthened by the addition of cellulose [7]. Furthermore, the bread added 5% of GC showed the highest adhesiveness of the present bread, while he highest chewiness could be observed in the bread added 7% of GC. The GC enhanced bread showed a desirable textual property in the manufacture [3], where it is also beneficial to the handling property for the storage. Such results might support by the cross-linking morphology showed in Figure 4, suggesting the enhanced quality of the bread induced by improved characterization of GC-dough and GC-gluten.
The improved texture were further confirmed by the sensory evaluation of the bread added of GC (Figure 4B). With the compared to the bread without GC, significantly (p<0.05) increased value of aroma, tactility, state, shape, texture and acceptability could be observed in in the bread added 1% of GC. Furthermore, the concentration-dependent reduce on the value of tractility and shape was shown with the addition of GC (1%~7%). The wheat bread is expected to have softer and more elastic texture, and providing the comfortable taste [37]. Therefore, the increasing hardness with the addition of GC might related to the results, which resulted in the poor sensory characterization. The results indicated that the bread added 1% of GC provided the highest sensory characterization, suggesting the best strategy for the further study.
3.13. Cold-Stored Stability of the GC- Bread
For the further evaluation of the stability of the present bread, the core moisture and hardness were studied in 7-days cold-storage at 4℃. As shown in Figure 6A, significant effect of the GC on the core moisture of the present bread could be observed in the 1~7 days cold-storage. In the 3-days storage, the core moisture of bread added 1%~5% of GC was higher than those without GC. In addition, with the increasing stored time from 5 to 7 days, the bread added 5% and 1% of GC showed the highest value of core moisture, respectively. The high water holding capacity of the GC might attributed to such high core moisture in the present bread, which was in agreement with the results in Table 1 and Figure 3C. In addition, the denser crumb structure might also be related to such high core moisture, where water evaporation within the gas cells was restrained, and the water diffusion in the GC-bread became more dominant [12]. The results were supported by the studies by Nie et al. [38], which reported that the cellulose-enhanced bread increased the freezable water of the system, and improving the molecular mobility of water molecules.
As shown in Figure 6B, the hardness of the bread significantly (p<0.05) increased with the increasing stored time in 1~7 days. Moreover, after 5~7 day cold-storage, the hardness of the bread added 1%~5% of GC were significantly (p<0.05) lower than those of bread without GC. Furthermore, the bread added 1% of GC showed the lowest hardness in 7-days cold-storage, which supported the TPA and best sensory characterization shown in Table 4-7 and 4-8.
As shown in Table 5, the hardness of the present bread in 7-days cold-storage was further studied by the kinetic Avrami formula. As compared to the bread without GC, the low Avrami index and K values could be observed in the bread added 1%~7% GC, and increasing with the addition of GC. Furthermore, the bread added 1% of GC showed the lowest Avrami index and K values in 7-days cold-storage, suggesting the best cold-stored stability in the present bread. The results were in agreement with the TPA and sensory characterization, further confirmed the significant effect of the GC on the stored stability of the present bread.
In the present work, the bread added 1% of GC provided the highest sensory characterization and best cold-stored stability, which were suggesting the best strategy for the further study. The results of GC had made them a good candidate as an effective bread improvers. Even when the interaction between the characterization of the GC and the texture of the GC-bread has not completely understood, which should be further addressed.
4. Conclusions
In conclusion, the water and oil holding capacity, cholesterol adsorptive, unsaturated fat and saturated fat adsorptive capacity of the GC were significantly (p<0.05) increase than those of MCC. The GC also showed concentration-dependent glucose adsorptive capacity, and high α-amylase inhibition activity, cation-exchange capacity, DPPH radical scavenging activity and hydroxyl radical scavenging activity. In addition, the GC indicated obvious inhibition capacity of the glucose diffusion and GDRI value. The GC showed significantly effect on the GC-dough, GC-gluten, GC-starch and GC-bread. The volume of the GC-dough was less than those of MCC, and the light values of GC-dough of improved. Furthermore, the water holding capacity and content of glutenin in GC-gluten was significantly (p<0.05) increase than those of MCC, while the gluten content in GC-gluten was significantly (p<0.05) decrease. The significantly effect of GC on the secondary structure could be observed in GC-gluten protein, while in solubility and swelling of GC-starch could also be showed. The cross-linked networks could be observed in the GC-bread, while the texture of the were obviously improved. The bread added 1% (m/m) of GC provided the highest sensory characterization and best cold-stored stability, which were suggesting the best strategy for the further study. Significantly (p<0.05) increased of sensory evaluation values could be observed in in the bread added 1% of GC. In addition, the hardness of the bread added 1%~5% of GC were significantly (p<0.05) lower than those of bread without GC. The bread added 1% of GC showed the best Avrami index and K values in 7-days cold-storage. Above all, the GC derived from the Gagome kelp were biocompatible bread improvers, which would be expected to lead potential applications as a natural bread formulation.
Author Contributions
Conceptualization, Xiang Li; methodology, Heqi Yang; software, Xiaohui Yu; validation, Ying Tuo; formal analysis, Hui Zhou; investigation, Yidi Cai; funding acquisition, Long Wu. All authors have read and agreed to the published version of the manuscript.
Declaration of competing interest
The authors declare that they have no known competing financial interests or personal relationships that could have appeared to influence the work reported in this paper.
Funding
This work was supported by the Technology Foundation of the Dalian Jinshiwan Laboratory (Dljswgj202404), the Liaoning Provincial Department of Education China (JYTQN2023136), Collaborative Project of the Liaoning Provincial Science and Technology Program (2024JH2/102600080) and the China Agriculture Research System (No: CARS-50).
Acknowledgments
This work was supported by the Technology Foundation of the Dalian Jinshiwan Laboratory (Dljswgj202404), the Liaoning Provincial Department of Education China (JYTQN2023136), Collaborative Project of the Liaoning Provincial Science and Technology Program (2024JH2/102600080) and the China Agriculture Research System (No: CARS-50). The authors thank Lvshun Bolanzi Aquatic Farm (Dalian, China) for kindly providing the feedstock for this study.
References
- Gabriel, C. A.; Jimena, M. C.; Cristina, F. High-Amylose Resistant Starch as a Functional Ingredient in Breads: a Technological and Microstructural Approach. Food and Bioprocess Technology 2018, 11, 2182–2193. [Google Scholar]
- Paula, G.; Andrés, B.; Francisca, E.; et al. A Feasible Approach to Developing Fiber-Enriched Bread Using Pomegranate Peel Powder: Assessing Its Nutritional Composition and Glycemic Index. Foods 2023, 12, 2798–2802. [Google Scholar] [CrossRef] [PubMed]
- Collar, C.; Villanueva, M.; Ronda, F. Structuring Diluted Wheat Matrices: Impact of Heat-Moisture Treatment on Protein Aggregation and Viscoelasticity of Hydrated Composite Flours. Food and Bioprocess Technology 2020, 13, 475–487. [Google Scholar] [CrossRef]
- Xu, J.; Wang, W.; Li, Y. Dough Properties, Bread Quality, and Associated Interactions with added Phenolic Compounds: A review. Journal of Functional Foods 2019, 52, 629–639. [Google Scholar] [CrossRef]
- Jaksics, E.; Paszerbovics, B.; Egri, B.; et al. Complex Rheological Characterization of Normal, Waxy and High-amylose Wheat Lines. Journal of Cereal Science 2020, 93, 102982. [Google Scholar] [CrossRef]
- Komeroski, M.R.; Oliveira, V.R. Influence of the Amount and Type of Whey Protein on the Chemical, Technological, and Sensory Quality of Pasta and Bakery Products. Foods 2023, 12, 2801–2809. [Google Scholar] [CrossRef]
- Bigne, F.; Puppo, M.C.; Ferrero, C. Fibre Enrichment of Wheat Flour with Mesquite (Prosopis spp. ): Effect on Breadmaking Performance and Staling. LWT - Food Science and Technology 2016, 65, 1008–1016. [Google Scholar]
- Alba, K.; Rizou, T.; Paraskevopoulou, A.; et al. Effects of Blackcurrant Fibre on Dough Physical Properties and Bread Quality Characteristics. Food Biophysics 2020, 15, 313–322. [Google Scholar] [CrossRef]
- Arp, C.G.; Correa, M.J.; Ferrero, C. Improving quality: Modified Celluloses Applied to Bread Dough with High Level of Resistant Starch. Food Hydrocolloids 2020, 112, 106302. [Google Scholar] [CrossRef]
- Dai, Y.; Tyl, C. A Review on Mechanistic Aspects of Individual Versus Combined uses of Enzymes as Clean Label-friendly Dough Conditioners in Breads. Journal of Food Science 2021, 86, 1583–1598. [Google Scholar] [CrossRef]
- Liu, L.; Kerr, W.L.; Kong, F.; et al. Influence of Nano-fibrillated Cellulose (NFC) on Starch Digestion and Glucose Absorption. Carbohydrate Polymers 2018, 196, 146–153. [Google Scholar] [CrossRef] [PubMed]
- Ren, Y.; Linter, B.R.; Foster, T.J. Starch Replacement in Gluten Free Bread by Cellulose and Fibrillated Cellulose. Food Hydrocolloids 2020, 107, 105957. [Google Scholar] [CrossRef]
- Stanford EC, C. Stanford's New Method of Treating Seaweed. The Journal of the Society of Chemical Industry 1885, 518–520. [Google Scholar]
- Gao, H.; Duan, B.; Lu, A.; et al. Fabrication of Cellulose Nanofibers from Waste Brown Algae and their Potential Application as Milk Thickeners. Food Hydrocolloids 2018, 79, 473–481. [Google Scholar] [CrossRef]
- Song, Y.; Wang, Q.; Wang, Q.; et al. Structural Characterization and Antitumor Effects of Fucoidans from Brown Algae Kjellmaniella crassifolia Farmed in Northern China. International Journal of Biological Macromolecules 2018, 119, 125–133. [Google Scholar] [CrossRef] [PubMed]
- Tang, S.; Dong, X.; Ma, Y.; et al. Highly Crystalline Cellulose Microparticles from Dealginated Seaweed Waste Ameliorate High Fat-sugar Diet-induced Hyperlipidemia in Mice by Modulating Gut Microbiota. International Journal of Biological Macromolecules 2024, 263, 130485. [Google Scholar] [CrossRef]
- Angioloni, A.; Collar, C. Physicochemical and Nutritional Properties of Reduced-Caloric Density High-fibre Breads. LWT - Food Science and Technology 2011, 44, 747–758. [Google Scholar] [CrossRef]
- Arslan, D.; Özcan, M.M. Evaluation of Drying Methods with Respect to Drying Kinetics, Mineral Content and Colour Characteristics of Rosemary Leaves. Energy Conversion and Management 2008, 49, 1258–1264. [Google Scholar] [CrossRef]
- Li, X.; Song, L.; Xu, X.; et al. One-step Coextraction Method for Flavouring Soybean Oil with the Dried Stipe of Lentinus edodes (Berk.) sing by Supercritical CO2 Fluid Extraction. LWT-Food science and Technology 2020, 120, 108853. [Google Scholar] [CrossRef]
- Chinese Standard GB/T 5006.1. Determination of Moisture in Food (in Chinese), 2008, Beijing(China) Standard Press of China.
- Li, X.; Xu, X.; Song, L.; et al. High Internal Phase Emulsion for Food-Grade 3D Printing Materials. ACS applied materials & interfaces 2020, 12, 45493–45503. [Google Scholar]
- Akyüz, G.; Mazı, B.G. Physicochemical and Sensory Characterization of Bread Produced from Different Dough Formulations by Kluyveromyces lactis. Journal of Food Processing and Preservation 2020, 44, e14498. [Google Scholar] [CrossRef]
- Haglund, Å.; Johansson, L.; Dahlstedt, L. Sensory Evaluation of Wholemeal Bread from Ecologically and Conventionally Grown Wheat. Journal of Cereal Science 1998, 27, 199–207. [Google Scholar] [CrossRef]
- Chinese Standard GB/T 5009.3. Determination of Moisture in Food (in Chinese), 2016, Beijing(China) Standard Press of China.
- Arp, C.G.; Correa, M.J.; Ferrero, C. Improving quality: Modified Celluloses Applied to Bread Dough with High Level of Resistant Starch. Food Hydrocolloids 2021, 112, 106302. [Google Scholar] [CrossRef]
- Tang, S.; Ma, Y.; Dong, X.; et al. Enzyme-assisted Extraction of Fucoidan from Kjellmaniella crassifolia Based on Kinetic Study of Enzymatic Hydrolysis of Algal Cellulose. Algal Research 2022, 66, 102795. [Google Scholar] [CrossRef]
- Van Dokkum, W.; Pikaar, N.A.; Thissen, J. Physiological Effects of Fibre-rich Types of Bread. Dietary Fibre from Bread: Digestibility by the Intestinal Microflora and Water-holding Capacity in the Colon of Human Subjects. The British Journal of Nutrition 1983, 50, 61–74. [Google Scholar] [PubMed]
- Yan, L.; Liu, B.; Liu, C.; et al. Preparation of Cellulose with Controlled Molecular Weight via Ultrasonic Treatment Improves Cholesterol-binding Capacity. Journal of Food Processing and Preservation 2019, 44, e14340. [Google Scholar] [CrossRef]
- Chau, C.F.; Huang, Y.L.; Lee, M.H. In Vitro Hypoglycemic Effects of Different Insoluble Fiber-Rich Fractions Prepared from the Peel of Citrus Sinensis L. cv. Journal of Agricultural and Food Chemistry 2003, 51, 6623–6626. [Google Scholar] [CrossRef]
- Qi, J.; Li, Y.; Masamba, K.G.; et al. The Effect of Chemical Treatment on the in vitro Hypoglycemic Properties of Rice Bran Insoluble Dietary Fiber. Food Hydrocolloids 2016, 52, 699–706. [Google Scholar] [CrossRef]
- Fabek, H.; Messerschmidt, S.; Brulport, V.; et al. The Effect of in vitro Digestive Processes on the Viscosity of Dietary Fibres and their Influence on Glucose Diffusion. Food Hydrocolloids 2014, 35, 718–726. [Google Scholar] [CrossRef]
- He, N.; Pan, Z.; Li, L.; et al. Improving the Microstructural and Rheological Properties of Frozen Unfermented Wheat Dough with Laccase and Ferulic Acid. Foods 2023, 12, 2772–2779. [Google Scholar] [CrossRef]
- Gutiérrez Á, L.; Villanueva, M.; Rico, D.; et al. Valorisation of Buckwheat By-Product as a Health-Promoting Ingredient Rich in Fibre for the Formulation of Gluten-Free Bread. Foods 2023, 12, 2781–2789. [Google Scholar] [CrossRef] [PubMed]
- Kontogiorgos, V. Linear Viscoelasticity of Gluten: Decoupling of Relaxation Mechanisms. Journal of Cereal Science 2017, 75, 286–295. [Google Scholar] [CrossRef]
- Correa, M.J.; Añon, M.C.; Perez, G.T.; et al. Effect of Modified Celluloses on Dough Rheology and Microstructure. Food Research International 2010, 43, 780–787. [Google Scholar] [CrossRef]
- Arp, C.G.; Correa, M.J.; Ferrero, C. High-Amylose Resistant Starch as a Functional Ingredient in Breads: a Technological and Microstructural Approach. Food and Bioprocess Technology 2018, 11, 2182–2193. [Google Scholar] [CrossRef]
- Scanlon, M.G.; Zghal, M.C. Bread Properties and Crumb Structure. Food Research International 2001, 34, 841–864. [Google Scholar] [CrossRef]
- Xin, C.; Nie, L.; Chen, H.; et al. Effect of Degree of Substitution of Carboxymethyl Cellulose Sodium on the State of Water, Rheological and Baking Performance of Frozen Bread Dough. Food Hydrocolloids 2018, 80, 8–14. [Google Scholar] [CrossRef]
Figure 1.
Glucose adsorption capacity (A), GDRI value (B) and inhibition of glucose diffusion capacity(C) of the GC. The deionized water was used as the blank control. The lowercase letters in the table indicate a significant difference (p<0.05).
Figure 1.
Glucose adsorption capacity (A), GDRI value (B) and inhibition of glucose diffusion capacity(C) of the GC. The deionized water was used as the blank control. The lowercase letters in the table indicate a significant difference (p<0.05).
Figure 2.
Cation exchange capacity and antioxidant activity of the GC. A: Cation exchange capacity of the GC; B: DPPH free radical and hydroxyl radical scavenging rate (B) of the GC. The L-ascorbic acid was used as the control. The lowercase letters in the table indicate a significant difference (p<0.05).
Figure 3.
Effect of the GC on the dough and gluten. A. Volume of the GC-dough; B. pH of the GC-dough. The lowercase letters in the table indicate a significant difference (p<0.05); C. Wet gluten content and water holding capacity of the GC-gluten. The gluten without cellulose was used as blank control.
Figure 4.
SEM images of the GC-bread.Ⅰ: the GC-bread; Ⅱ: the MCC-bread; A: bread without GC; B: bread added 1% of cellulose; C: bread added 3% of cellulose; D bread added 5% of cellulose; E: bread added 7% of cellulose. The observations were performed at an accelerating voltage of 5.00 kV. The scale bars of the big figure is 5 μm(10.0 K), while of the small is 10 μm(3.00 K).
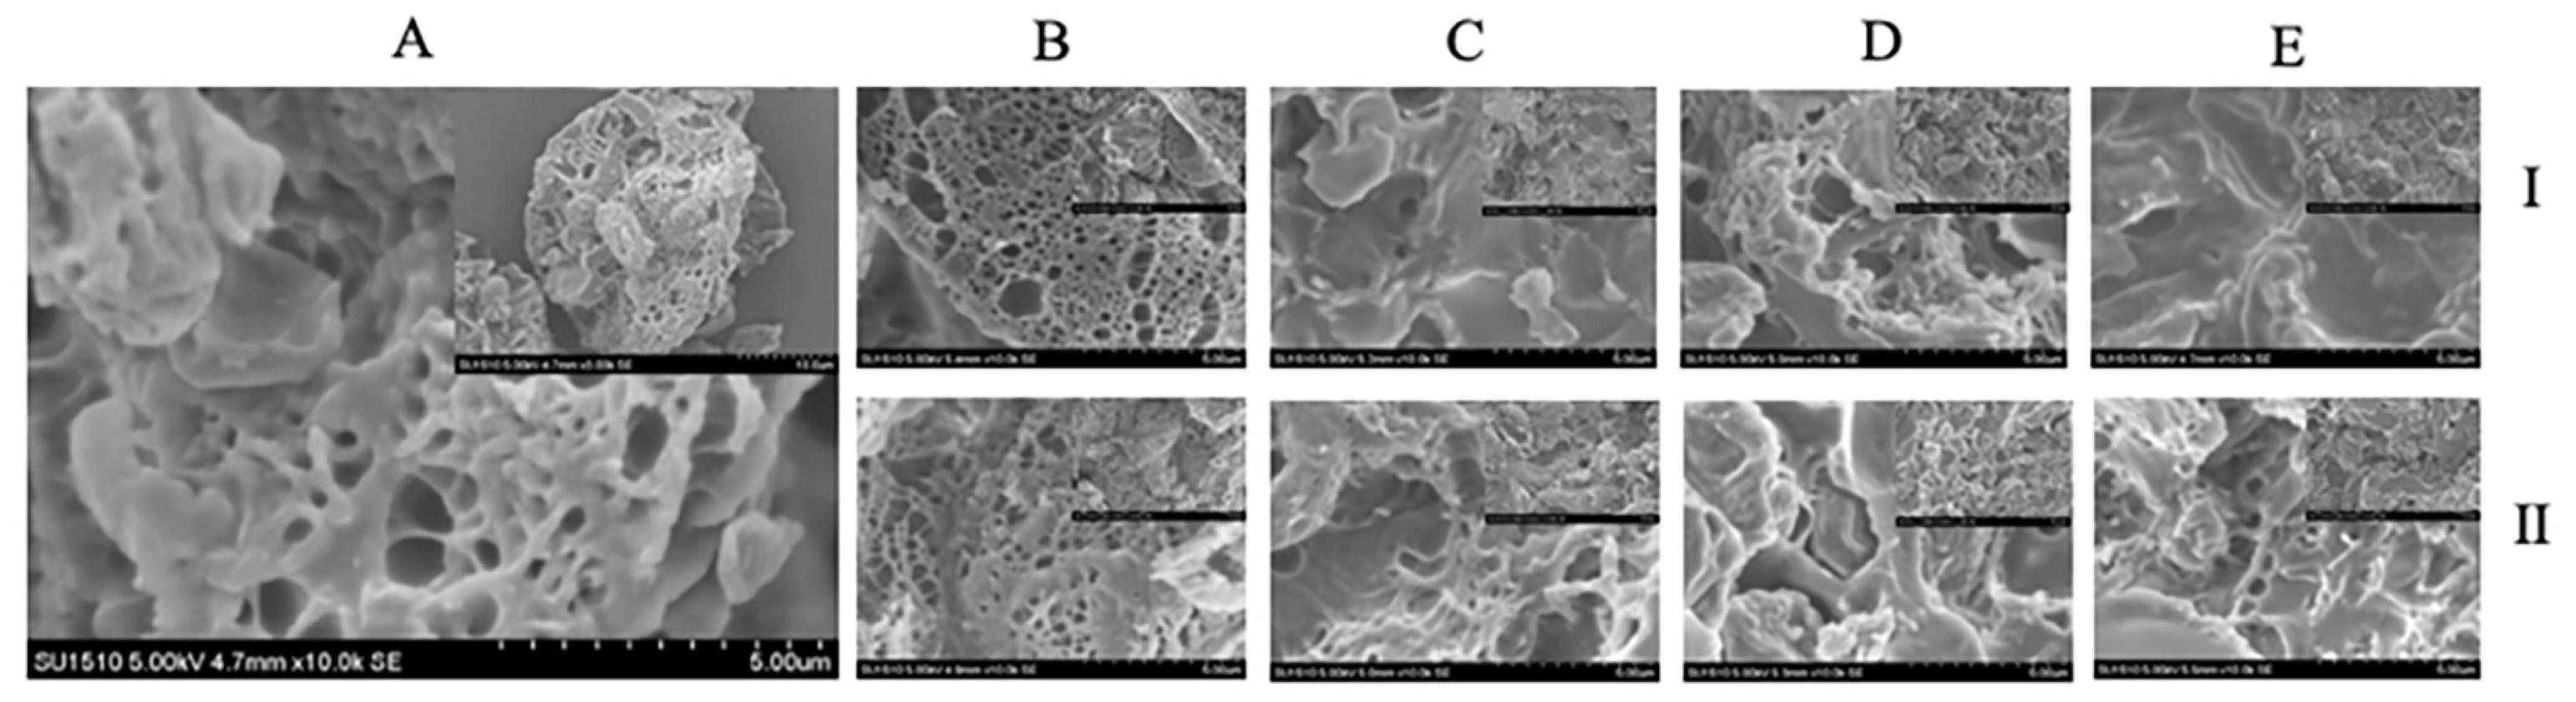
Figure 5.
TPA and Sensory evaluation of the GC-bread. A: TPA of the GC-bread; B Sensory evaluation value of the GC-bread. The left figure was the radar map, while the right was the heatmap. Results were expressed as mean ± std., where std. is the standard deviation, n = 3. The lowercase letters in the table indicate a significant difference (p<0.05).
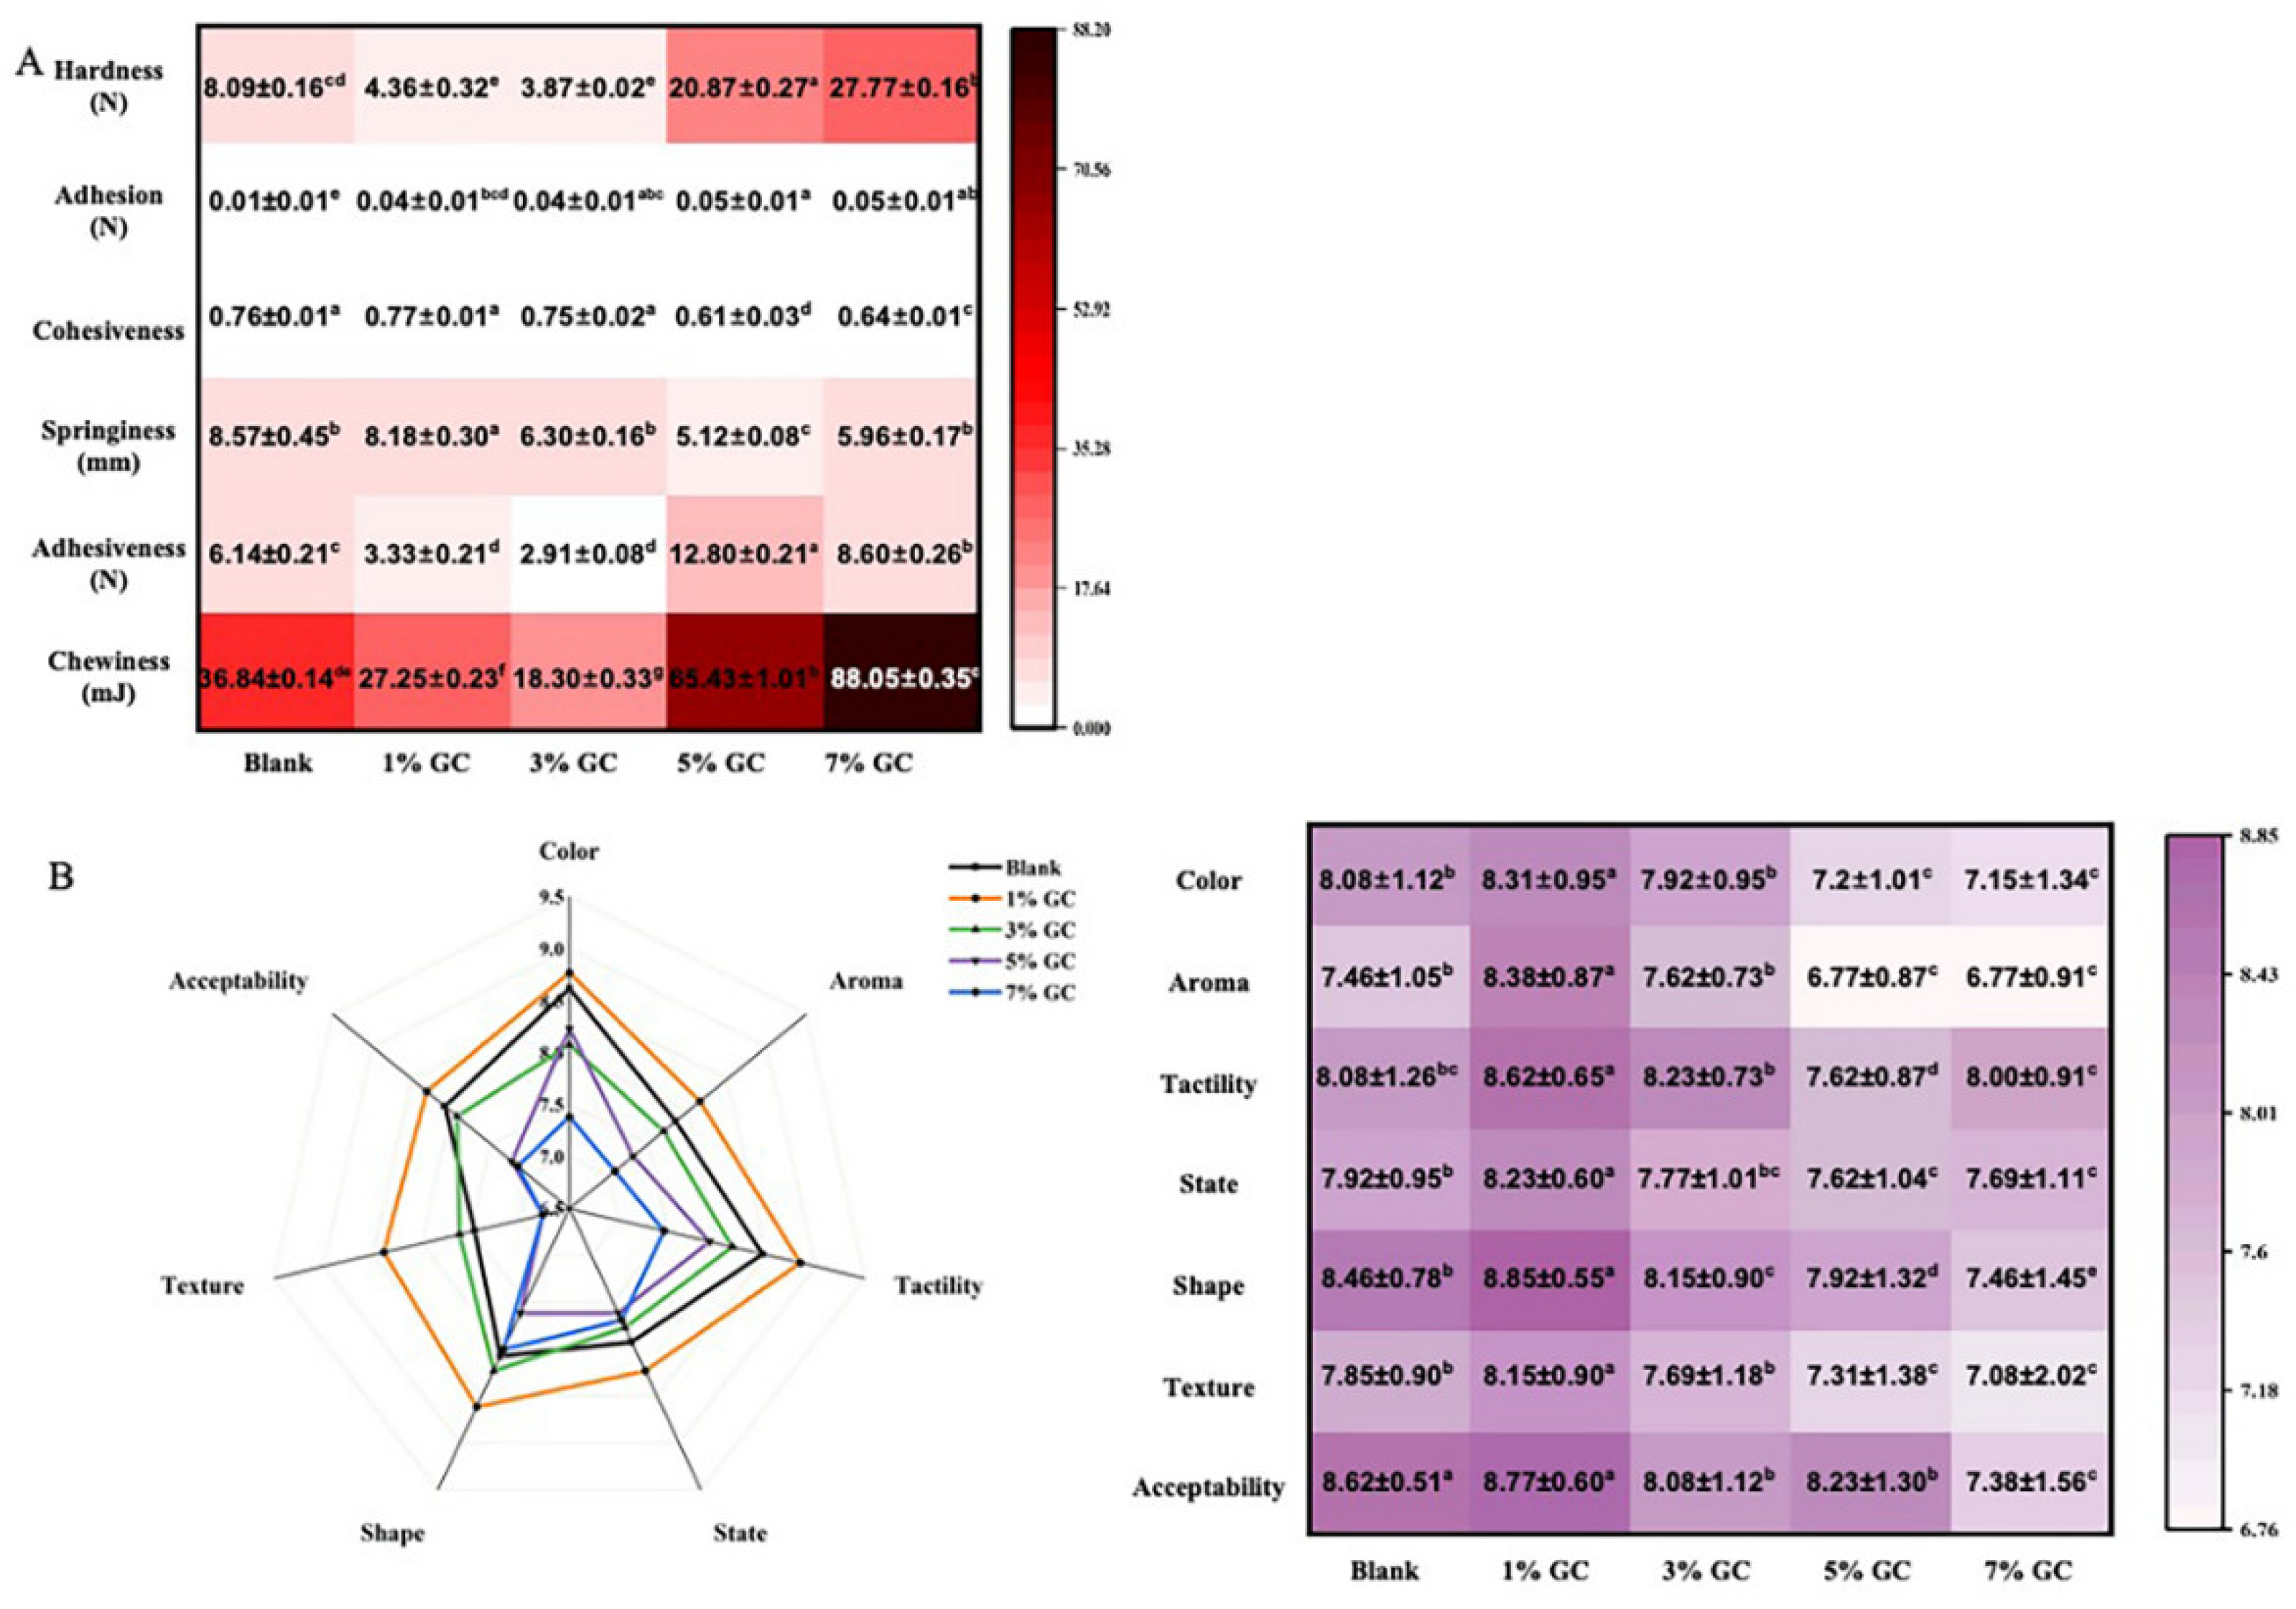
Figure 6.
Cold-storage stability of the GC-bread. A: The bread core moisture of cold-storage GC-bread; The lowercase letters in the table indicate a significant difference (p<0.05). B: The hardness of cold-storage GC-bread.
Figure 6.
Cold-storage stability of the GC-bread. A: The bread core moisture of cold-storage GC-bread; The lowercase letters in the table indicate a significant difference (p<0.05). B: The hardness of cold-storage GC-bread.
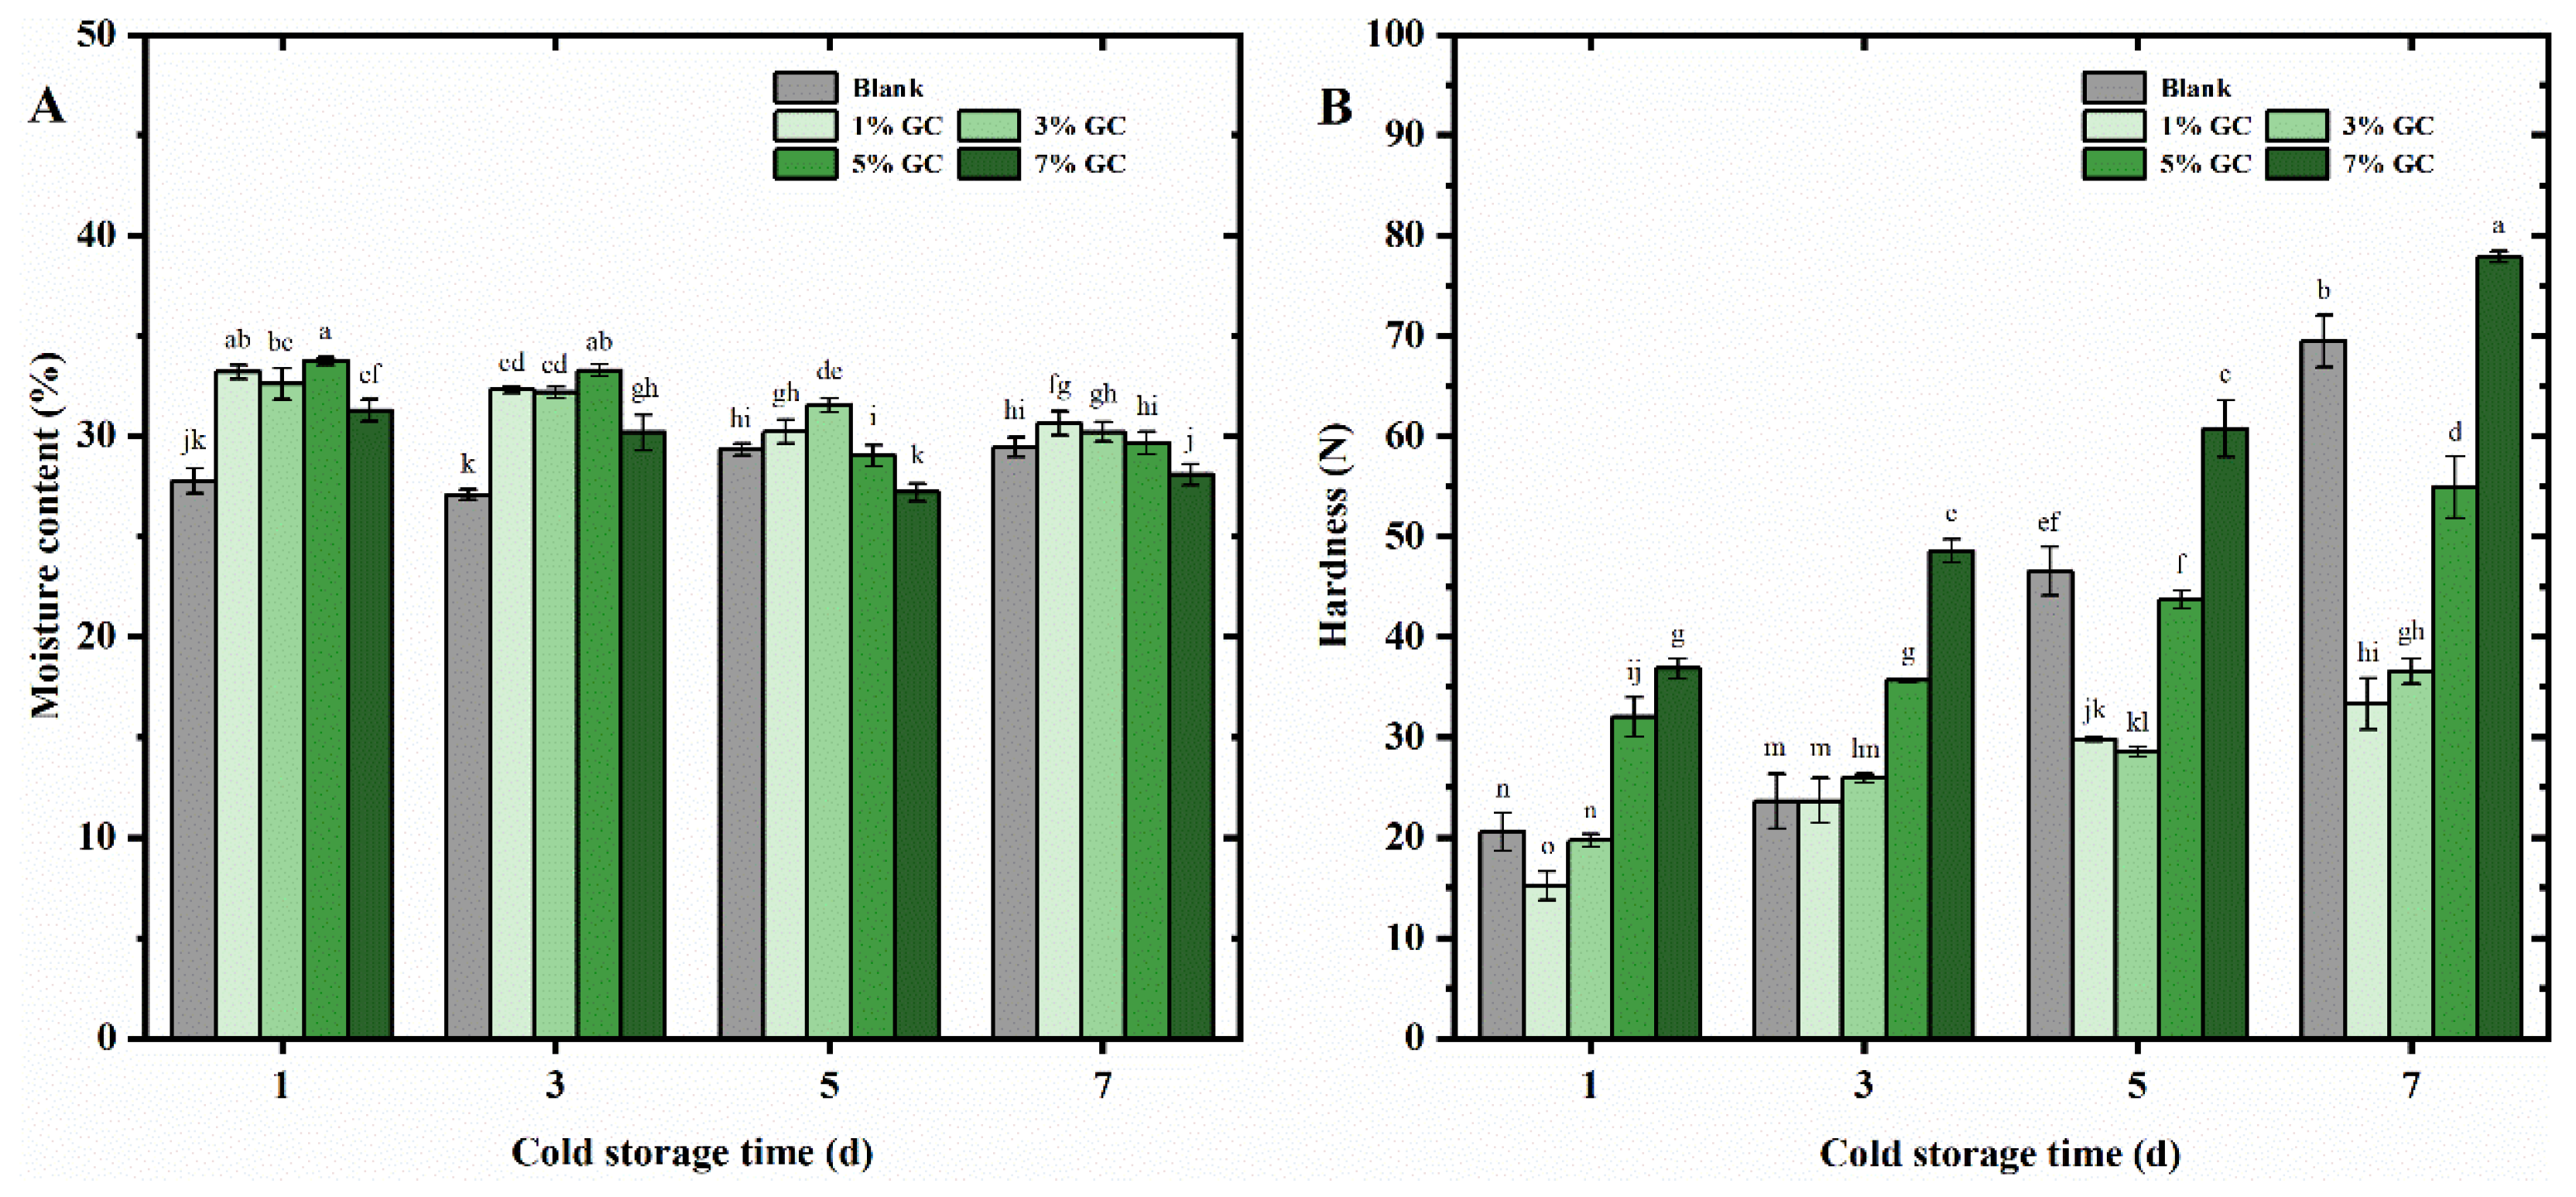

Table 1.
Characterizations of the GC and MCC.
| Characterizations | MCC | GC | |
|---|---|---|---|
| Water holding capacity (g/g) |
2.92±0.23 | 3.30±0.10* | |
| Oil holding capacity (g/g) |
3.73±0.44 | 4.01±0.48* | |
| Unsaturated lipids adsorptive capacity (mg/g) |
1.26±0.06 | 1.39±0.03* | |
| Saturated lipids adsorptive capacity (mg/g) |
1.59±0.17 | 1.73±0.26* | |
| Cholesterol-absorbing capacity (mg/g) |
pH 2.0 | 5.88±0.42 | 4.48±0.14* |
| pH 7.0 | 7.60±0.37 | 5.47±0.38* | |
| α-Amylase inhibitory activities (%) | 24.71±0.20 | 14.31±0.21* | |
# Results were expressed as mean ± std., where std. is the standard deviation, n = 3. The mark “*” in the table indicate a significant difference (p < 0.05).
Table 2.
The color of the GC-dough.
| Sample | 20 min | 40 min | 60 min |
|---|---|---|---|
| Blank | 304.41±3.45 d | 294.02±0.92 f | 311.62±1.74 c |
| GC | 299.83±2.73 e | 321.39±1.80 a | 316.14±1.02 b |
# Results were expressed as mean ± std., where std. is the standard deviation, n = 3. The loercase letters in the table indicate a significant difference (p < 0.05).
Table 3.
Composition of the GC-gluten and the secondary structure of the gluten-protein.
| Content | Blank | GC | MCC |
|---|---|---|---|
| Glutenin (%) | 66.54±0.02 c | 71.76±0.05 a | 69.05±0.06 b |
| Gliadin (%) | 36.56±0.01 a | 30.62±0.01 b | 29.33±0.01 c |
| Glutenin / Gliadin | 1.82±0.02 b | 2.34±0.25 a | 2.36±0.28 a |
| α-helix (%) | 15.31±6.23 c | 18.51±4.82 b | 20.35±6.28 a |
| β-sheet (%) | 36.80±6.23 c | 40.92±1.69 b | 47.16±6.88 a |
| β-turn (%) | 32.15±7.50 a | 24.65±2.07 b | 24.65±2.07 b |
| Random coil (%) | 15.58±0.21 b | 18.98±2.02 a | 15.68±0.01 b |
# Results were expressed as mean ± std., where std. is the standard deviation, n = 3. The lowercase letters in the table indicate a significant difference (p < 0.05).
Table 4.
Effect of the GC on the solubility and swelling capacity of starch.
| Sample | Solubility (%) | Swelling capacity (%) |
|---|---|---|
| Blank | 33.91±0.63 a | 13.95±0.09 a |
| GC | 23.83±0.36 c | 12.73±0.05 b |
| MCC | 28.45±0.48 b | 14.18±0.44 a |
# Results were expressed as mean ± std., where std. is the standard deviation, n = 3. The lowercase letters in the table indicate a significant difference (p < 0.05).
Table 5.
Kinetic parameters of hardness changes on the GC-bread.
| Content of the GC | F0 | F7 | Avrami index (n) | K (d-1) | R2 |
|---|---|---|---|---|---|
| 0 | 4.67 | 69.47 | 1.3733 | 8.6245 | 0.9534 |
| 1% GC | 3.87 | 33.33 | 1.0802 | 3.9544 | 0.9107 |
| 3% GC | 4.36 | 36.57 | 1.0594 | 3.8974 | 0.857 |
| 5% GC | 13.43 | 54.90 | 1.1596 | 5.0819 | 0.8996 |
| 7% GC | 23.13 | 77.83 | 1.3109 | 7.3289 | 0.9863 |
# Results were expressed as mean ± std., where std. is the standard deviation, n = 3. The lowercase letters in the table indicate a significant difference (p < 0.05).
Disclaimer/Publisher’s Note: The statements, opinions and data contained in all publications are solely those of the individual author(s) and contributor(s) and not of MDPI and/or the editor(s). MDPI and/or the editor(s) disclaim responsibility for any injury to people or property resulting from any ideas, methods, instructions or products referred to in the content. |
© 2025 by the authors. Licensee MDPI, Basel, Switzerland. This article is an open access article distributed under the terms and conditions of the Creative Commons Attribution (CC BY) license (http://creativecommons.org/licenses/by/4.0/).
Copyright: This open access article is published under a Creative Commons CC BY 4.0 license, which permit the free download, distribution, and reuse, provided that the author and preprint are cited in any reuse.


