Submitted:
13 February 2025
Posted:
14 February 2025
You are already at the latest version
Abstract
Excessive fat deposition in the liver of poultry due to high-fat diets eventually leads to hepatic steatosis and is a matter of concern for the industry and consumers. To avoid disease establishment and progression, dietary compounds with anti-hyperlipidemic benefits are usually supplemented. In the present study, the effects of providing 30-weeks-old laying hens with marine-derived sulfated polysaccharides (MSPs) on the levels of low-density lipoprotein receptor (LDLR) and chicken peroxisome proliferator-activated receptor gamma (cPPAR?) in lymphocytes and hepatocytes were evaluated and compared to those obtained for hens supplemented with a choline-sorbitol complex or not supplemented. Overall, MSPs-supplemented hens consistently showed lower levels of LDLR in both cell types and lower levels of cPPAR? in hepatocytes than hens in the other two groups indicating that MSPs may regulate LDLR and cPPAR? transcription in both cell types and/or compete with triglycerides and cholesterol for the same cellular receptors., ultimately preventing the risk of hepatic steatosis. Levels of hepatic inflammation markers corroborated these results, as did liver histological analysis. As the levels of cPPARγ and LDLR in lymphocytes were good indicators of the levels of these markers in hepatocytes, hens’ liver health may be assessed and monitored using blood samples avoiding more invasive procedures.
Keywords:
Seaweed extract
; hepatic Steatosis
; laying hens
1. Introduction
High-fat diets are crucial to improve poultry growth performance and meet the high demands of egg production. However, they also lead to excessive fat deposition in the animal’s liver and abdominal cavity, which reduces survival rate and carcass yield [1]. This is driven by the de novo lipid synthesis (lipogenesis) that occurs mostly (90%) in the liver of poultry, where dietary carbohydrates are metabolized into fatty acids (FAs); these are then incorporated into triglycerides (TGs), which are the main products of lipogenesis [2]. After being drained directly into the blood system as very-low-density lipoproteins (VLDLs) [3] and delivered to target tissues, TGs can accumulate (e.g., in the adipose tissue) or be hydrolyzed by lipoprotein lipases (LPLs) to VLDLs or low-density lipoproteins (LDLs) for immediate use (e.g., in the ovary for egg yolk production). However, when fat uptake and lipogenesis exceed VLDLs/LDLs production and lipid metabolism, TGs accumulate in the liver and abdominal cavity leading to the development of hepatic steatosis. This non-infectious disease is often observed in laying hens fed high energy diets and is associated with an imbalance between the energy needed and the energy consumed. In its various degrees of severity, hepatic steatosis can cause inflammation, tissue lesions, hemorrhage, and even sudden death due to liver rupture. Because there is no effective drug for treating hepatic steatosis in poultry, it is of utmost importance to monitor lipid metabolism and fat deposition in the liver to improve the wellbeing of animals as well as the economic efficiency and sustainability of poultry production by preventing disease progression.
Scientific research has shown that marine-derived sulfated polysaccharides (MSPs) extracted from algae have anti-hyperlipidemic properties because they regulate bile acids (BAs) and lipid metabolism. Pengzhan et al. [4] were the first to highlight the anti-hyperlipidemic capacity of the MSPs extracted from Ulva sp. (i.e., ulvans) in animals fed high-lipid diets. Later, it was reported [5,6] that ulvans significantly decreased the levels of TGs, total cholesterol (TC), and LDLs while increasing those of high-density lipoproteins (HDLs). Researchers further demonstrated that these effects resulted from the upregulation of cell receptors linked to the metabolism of lipids and BAs exerted by MSPs. Being exclusively synthesized from cholesterol in the liver, BAs play a key role in the catabolism and elimination of cholesterol from the body and are crucial for the intestinal absorption of lipids [7]. Altogether, MSPs contribute to lower hyperlipidemia via two major pathways: (1) by increasing BAs production from TGs and cholesterol and BAs excretion, by stimulating the activity of hepatocytes and enterocytes; and (2) by improving lipid digestion via increasing lipid emulsification in the liver and lipase lipoprotein (LPL) activity [8] (Jiao et al. 2011). Supplementing MSPs to poultry might thus improve liver function by reducing fat accumulation in the liver and preventing hepatic steatosis.
The main molecular pathways in the regulation of lipid metabolism in poultry are the peroxisome proliferator-activated receptors (PPARs) signaling pathway and the cholesterol synthesis pathway [2]. PPARs are intracellular (nuclear) receptor proteins that function as transcription factors regulating the expression of genes. In chicken, PPAR gamma (cPPARγ) is the key regulator of adipogenesis [9], i.e., the process by which adipocytes develop and accumulate as adipose tissue. Increased expression of the cPPARγ gene has been observed in adipose and ovarian tissues in response to a hyperlipidemic diet and onset of egg laying [10]. As for the cholesterol synthesis pathway, the level of free intracellular cholesterol regulates the transcription of cell-surface LDL receptor (LDLR), which in turn mediate the endocytosis of cholesterol-rich LDLs to maintain the plasma level of these molecules. Briefly, if free intracellular cholesterol is in excess toward cell needs, the LDLR gene is not transcribed [11] to avoid the intake of cholesterol-rich LDLs. Monitoring the expression of PPARγ and LDLR transcripts in liver cells (hepatocytes) as well as in peripheral blood mononuclear cells (PBMCs), such as lymphocytes, might thus inform on the regulatory effect of MSPs on lipid metabolism.
Therefore, in the present study, the anti-hyperlipidemic benefits of MSPs were evaluated by measuring the transcript levels of cPPARγ and LDLR in the lymphocytes and hepatocytes of laying hens by flow cytometry, using primary and secondary antibodies directed at these specific cell receptors. Measuring cPPARγ and LDLR transcripts in both cell types also allowed verifying if the response of these cell receptors is comparable between PBMCs and hepatocytes. If so, these specific cell receptors can be monitored using a blood sample only, without sacrificing the animals. To verify that MSPs supplementation has no negative impact on the growth performance of animals and no inflammatory effect, the weight gain and levels of haptoglobin related protein (HPR) and C-reactive protein (CRP) in the plasma were monitored throughout the trial. A histopathological analysis was also conducted to assess lipid and glycogen overloads in liver tissue as indicators of hepatic steatosis.
2. Materials and Methods
2.1. Ethics Approval
All animal experiments were performed in accordance with the regulations and guidelines required by Directive 2010/63/EU.
2.2. Hens and Treatments
Forty-five, 30-weeks-old Isa Brown laying hens were randomly divided into three groups (negative control, positive control, and test), distributed across nine pens (three pens for each group), and maintained at normal rearing conditions (volary system). Upon arrival at the experimental facility, all hens were fed an hyperlipidemic diet mainly composed of barley supplemented with 8% corn. Animals were provided with drinking water ad libitum during the trial. The water given to the negative control group (C) was left non-supplemented, while that of the positive control group (B) was supplemented with a choline and sorbitol complex (CSC; 2/3 sorbitol + 1/3 choline) at 0.1 L/L. Choline and sorbitol are frequently administered to the drinking water and/or feed of production animals to prevent metabolic disorders because both compounds have lipotropic properties [12]. The test group (D) was supplemented with DigestSea® [sorbitol + algae-derived MSPs (MSP®LIPIDS) + hydroxy analogue of methionine + artichoke extract + milk thistle extract; Olmix SA, Brehan, France] at 0.3 mL/L. CSC and DigestSea® supplementation were performed for 5 days (from 18/11/2021 to 22/11/2021), and drinking water was checked daily to verify that the concentrations of CSC and DigestSea® were kept stable. Feed was provided ad libitum to each pen daily and animals were followed individually throughout the trial period. At each blood sampling time point (T0 to T5), hens within each group were weighted (g) to evaluate weight gain throughout the trial period.
2.3. Isolation of Lymphocytes and Hepatocytes
Blood samples (3.5 to 4 mL) were collected from the brachial vein of each hen into EDTA tubes (Greiner Bio-One GmbH, Kremsmunster, Austria) the day before supplementing the drinking water of B and D groups (T0; 17/11/2021), at the day of supplementation (T1; 18/11/2021), at the end of the supplementation period (T2; 22/11/2012), and at one (T3; 29/11/2021), two (T4; 06/12/2021), and three (T5; 13/12/2021) weeks after supplementation. At T4, 50% of the hens in each pen were euthanized and dissected for liver perfusion and sampling; the remaining hens were euthanized at T5 for the same purposes. After perfusion, one liver lobe was preserved in a physiologic serum solution containing antibiotics (1% penicillin + streptomycin) for hepatocyte isolation and another in formaldehyde for histological analysis. Immediately after collection, blood and liver samples were transferred to ProfileHIT (Saint-Herblain, France) for immunological analysis and Atlantic Bones Screen (Saint-Herblain, France) for histological analysis.
For lymphocyte isolation, blood samples were first diluted with an equal volume of phosphate-buffered saline (PBS) and then centrifuged at 720 ×g in a Ficoll gradient (1.072 g/L; Roche, Basel, Switzerland) for 20 min at 20 °C without break or acceleration. The supernatant containing both monocytes and lymphocytes was collected into a new tube and washed with PBS before further analyses. Lymphocytes were then separated from monocytes according to their size and structure using flow cytometry (FACS CANTO II, Becton Dickinson, San Jose, CA, USA), counted, and fixed overnight in 1% paraformaldehyde (PFA) (Thermo Fisher Scientific, Waltham, MA, USA).
Liver samples were first dissociated in gentleMACSTM C tubes (Miltenyi Biotec, Bergisch Gladbach, Germany) to obtain single-cell suspensions with a high viability rate, and then digested in an enzymatic solution (Collagenase D 0.5 mg/mL + DNAse I 0.1 mg/mL; both Merck, Darmstadt, Germany) for 30 min at 37 °C. The obtained cell suspension was passed through a 100 μm filter and centrifuged at 100 ×g to recover as many hepatocytes as possible; these were then counted and fixed overnight in 1% PFA (Thermo Fisher Scientific).
Plasma (~1.3 mL) was isolated from each blood sample by centrifugation at 2000 ×g at 4 °C for 10 min and stored at –20 °C until enzyme-linked immunosorbent assay (ELISA).
2.4. Labeling of Lymphocytes and Hepatocytes
Lymphocytes and hepatocytes were immunolabelled for each specific receptor (PPARγ or LDLR) in 96-well plates for 60 min at 4 °C in PBS supplemented with 2% fetal calf serum (FCS) and a 0.1% Triton (FACS buffer) solution comprising the corresponding primary antibody (dilution 1:250): rabbit anti-PPARγ (Cat# bs-0530R) or rabbit anti-LDLR (Cat# bs-0705R-TR) (both Bioss Inc., Woburn, MA, USA). After incubation, cells were washed twice in FACS buffer and labeled with goat anti-rabbit Alexa 647 (dilution 1:2000; Thermo Fisher Scientific), which was used as the secondary antibody. A final wash in PBS was performed to remove any unbound secondary antibody. At least 1000 lymphocytes and 5000 hepatocytes were acquired on a FACS Canto II flow cytometer (Becton Dickinson, San Jose, CA, USA).
2.5. ELISA
The plasma levels of HPR and CRP were measured using corresponding ELISA kits for chicken (HPR, #MBS2507668; CRP, #MBS2708034; both MyBioscource Inc., San Diego, CA, USA). Briefly, 100 μL of the sample or standard was loaded into each well of the microplate provided with each kit, which had been pre-coated with an antibody specific to each marker (i.e., HPR or CRP). After combination with the specific antibody for 90 min at 37 °C, the liquid was removed and 100 μL of a biotinylated detection antibody specific for the marker was added. Following incubation for 1 h at 37 °C and three cycles of aspiration and washing, 100 μL of Avidin-Horseradish peroxidase conjugate was added for 30 min at 37 °C. After five cycles of aspiration and washing, 90 μL of substrate solution was added to each well and incubated for 15 min at 37 °C. The reaction was terminated by adding 50 μL of the stop solution and the optical density (OD) of each sample was immediately measured on a spectrophotometer (Multiskan, LifeTechnologies, Singapore) at a wavelength of 450 nm. The levels of HPR and CRP were calculated by comparing the values of samples to the standard curve of each marker, and the higher the OD value the higher the level of HPR or CRP.
2.6. Histological Analyses
Liver tissue was fixed in formalin and embedded in paraffin for microtome sectioning (Leica Biosystems, Wetzlar, Germany). Sections (3−4 μm) were stained with hematoxylin and eosin and periodic acid Shiff and mounted in Pertex mounting medium. Sections from T4 and T5 were pooled within each group to determine the extent of lipid and glycogen surcharge in the hepatocytes (SLH and SGH, respectively). These were scored as absent (0), minimal (1), light (2), moderate (3), marked (4), or severe (5).
2.7. Statistical Analyses
Differences between sampling times and between the three groups (negative control, positive control, and test) were evaluated for the two specific receptors (PPARγ and LDLR) in the two cell types (lymphocytes and hepatocytes) using analysis of variance (ANOVA) followed by Tuckey’s test. Data are shown as median ± standard deviation. Values were considered significant at p < 0.05. All statistical analyses and plots were produced in R (https:///www.r-project.org/).
3. Results
3.1. Weight Gain
The average weight of hens allocated to each group differed slightly at the onset of the trial (T0), with those allocated to group D (DigestSea®-supplemented) being 18.6 g and 21.4 g lighter than that allocated to the control groups C and B, respectively (Table 1). The weight of hens in the negative control group (C) first slightly decreased (T0 to T1), then steadily increased from T1 to T4. In group B (positive control group), the weight of hens increased from T0 to T4 but then decreased from T4 to T5. In group D, hens’ weight first increased from T0 to T1, then decreased from T1 to T3, and then markedly increased by 126.8 g in the last two weeks of trial (T3 to T5). Overall, although hens in group D gained less weight than those in groups C and B, these hens gained 126.8 g after the supplementation period ended while those in groups C and B gained only 90.9 g and 30.2 g, respectively.
3.2. LDLR and cPPARγ Levels in Lymphocytes
At T0, no significant differences in the lymphocyte levels of LDLR and cPPARγ were found between the three groups, indicating that all animals were in the same condition at the onset of the trial. However, at the day of supplementation (T1), LDLR levels (Figure 1a) of negative control hens (group C) were higher than those of hens supplemented with CSC (group B; p < 0.05) or DigestSea® (group D, p < 0.001), which presented the lowest value. Although median levels of LDLR were also higher in hens of group C than in hens of groups B and D at T2 and T3, there were no significant differences between the three groups at T2 and only groups D and C differed significantly (p < 0.01) at T3. At T4 and T5, the pattern slightly changed with hens in group B presenting the highest median values of LDLR, although these differences were not significant.
As for the median levels of cPPARγ (Figure 1b), these were not significantly different between the three groups at T1 but at the end of supplementation (T2) the level in group D was significantly higher than that in groups C and B (p < 0.05). From T2 to T3, the cPPARγ levels in groups C and B increased and decreased slightly, respectively, whereas that in group D decreased notably; nevertheless, no significant differences were found between groups. At T4, cPPARγ levels decreased in all groups and those of groups B and D became significantly lower than that of group C (B vs. C, p < 0.01; D vs. C, p < 0.001). At T5, levels increased in all groups and there were no significant differences between them.
3.2. LDLR and cPPARγ Levels in Hepatocytes
At T4 and T5, LDLR (Figure 2a) and cPPARγ (Figure 2b) levels in the hepatocytes were higher in group C than in groups B and D. Moreover, median values at T5 were generally lower than those at T4 for both markers and groups. Although DigestSea®-supplemented hens always presented the lowest values of both markers at both time points, significant differences were only found between the LDLR levels of groups C and D at T5 (p < 0.05).
3.3. CRP and HPR Levels in the Plasma
At T0 the plasma level of CRP was much lower in group C than in groups B and D (Figure 3a). However, it steadily increased until T4 while that of hens in group B decreased from T0 to T1, increased in the following period, and then decreased abruptly from T2 to T4. In group D, CRP level increased from T0 to T1, decreased from T1 to T2, and then increased from T2 to T3, and then decreased slightly from T3 to T5. At T5, hens in group D presented the highest value of CRP (2.14 ng/mL) whereas hens in groups C and B presented similar levels (1.67 ng/mL and 1.42 ng/mL, respectively).
As for HPR levels (Figure 3b), these were similar in the plasma of hens in all groups at the onset of the trial (T0) but at the day of supplementation (T1) they were lower in group B than in groups C and D, with the latter presenting the highest level. At the end of the supplementation period (T2), hens in group D showed the lowest level of HPR, and this increased steadily until T4 but not to a level as high as that observed in group C hens. Hens in group B showed stable HPR levels until T4 but it increased greatly from T4 to T5. At this time point, group B hens showed the highest HPR level (2.72 ng/mL) whereas hens in groups C and D presented similar levels (1.67 ng/mL and 1.68 ng/mL, respectively).
3.4. Histological Analyses
At T4, lipid and glycogen overloads (SLH and SGH, respectively) were lower in group D than in the other two groups (Figure 4), although none of the groups evidenced marked or severe steatosis (average scores of both indices < 3 in all groups). These results agree with the trend found for LDLR and PPARγ levels in the hepatocytes of hens at T4, which were always lower in hens supplemented with DigestSea® than in the other two groups (see Figure 2).
4. Discussion
Consumer demand for food safety and animal wellbeing, together with increasing antibiotic resistance and its associated public health problems, has led to changes in the livestock industry. Although fat deposition is crucial during poultry growth, excessive adiposity negatively affects the health of farmed animals and consumers. Therefore, regulating fat deposition is a major concern in poultry production. In this context, several studies have revealed the anti-hyperlipidemic effects of MSPs in several animals including poultry [4,6,8,12,13,14,15,16]. Results of the present study support these effects in laying hens.
Laying hens supplemented with MSPs, i.e., those in group D, presented lower levels of LDLR in the lymphocytes and hepatocytes than non-supplemented (negative control, group C) or CSC-supplemented (group B) hens both during and after the supplementation period. These low levels of LDLR in both cell types indicate decreased capacity to uptake cholesterol-rich LDLs and are likely due to a posttranscriptional regulation of LDLR activity [17]. Hence, DigestSea acted as a regulator of cholesterol accumulation in the plasma and hepatocytes to reduce hyperlipidemia. Moreover, levels of LDLR were consistently lower in laying hens supplemented with DigestSea than in those supplemented with CSC; this was most noticeable in the weeks following supplementation when CSC-supplemented hens displayed LDLR levels higher than those of control hens. In addition, significantly higher levels of cPPARγ were found in the leucocytes of DigestSea-supplemented hens than on those of non-supplemented or CSC-supplemented hens at the end of the supplementation period; however, in hepatocytes, cPPARγ levels were lower in DigestSea-supplemented hens than in those of the other two groups indicating a decrease in adipogenesis in the liver tissue. cPPARγ is a key regulator in adipose tissue and upregulates the expression of several genes involved in adipogenesis including LPL [18]. Indeed, several studies in chicken have demonstrated that the upregulation of cPPARγ in liver leads to increased synthesis of FAs and TGs and accumulations of hepatic lipids, while its downregulation leads to enhanced plasma cholesterol and TGs and reduced abdominal fat deposition [19,20,21,22,23]. Overall, these results indicate that DigestSea has the ability to regulate LRLR and cPPARγ transcription in both leucocytes and hepatocytes and can do it differentially to improve lipid metabolism in both blood and liver, as evidenced by cPPARγ upregulation in the blood, to quickly release the FAs from the TGs in the diet for adipose tissue deposition in the body, and downregulation in hepatocytes, to decrease in adipogenesis in the liver.
Moreover, the beneficial effects of the MSPs in DigestSea were superior to that of the commonly supplied CSC. Dietary choline is known to reduce the gain of body fat, reduce plasma cholesterol, prevent adipocyte enlargement, and attenuate hepatic steatosis and damage by upregulating the genes involved in fatty acid oxidation [24]. It is also an important methyl donor for VLDL secretion and therefore its deficiency leads to fat accumulation [25]. A recent study in laying hens [26] concluded that after 30 days of using hepatoprotectors containing sorbitol and choline chloride, the serum concentrations of cholesterol, HDLs, and LDLs decreased by at least 50%, 33%, and 40%, respectively, confirming the beneficial effects of these compounds in lipid metabolism. Although the levels of cholesterol, VLDLs, LDLs, HDLs, and LDLs were not quantified in the present study, DigestSea-supplemented hens presented lower LDLR levels in both cell types, higher levels of cPPARγ in leucocytes, and lower levels of the latter marker in hepatocytes than CSC-supplemented hens indicating a better performance for the MSPs in DigestSea than for the choline and sorbitol in CSC. In addition, a long-lasting effect of these benefits was observed in the hepatocytes of DigestSea-supplemented hens, where low levels of both LDLR and cPPARγ were maintained in the three weeks after supplementation ended. When supplementation stopped, cPPARγ in the leucocytes of DigestSea-supplemented hens greatly decreased and returned to the levels observed at T0, indicating that the MSPs in DigestSea only affect cPPARγ transcription while being provided, therefore not presenting the risk of accelerating lipid metabolism in the plasma on the long-term leading to weight loss and lower health and performance of laying hens. This is supported by the improved weight gain observed in hens supplemented with DigestSea after supplementation ended when compared to those in groups C and B (126.8 g vs. 90.9 g and 30.2 g, respectively) and by the lower scores of SLH and SGH in the hepatocytes of DigestSea-supplemented hens than in control and CSC-supplemented hens. Nevertheless, the scores obtained in all groups were compatible with light to moderate steatosis (values between 2 and 3), and are in agreement with the results of our previous study on turkey [12].
Higher levels of HPR and CRP were found in the plasma of DigestSea-supplemented hens than in the plasma of control and CSC-supplemented hens at the day of supplementation. However, those levels decreased notably toward the end of supplementation (T1 to T2) in DigestSea-supplemented hens while those of hens in the other two groups either increased (CRP) or slightly decreased (HPR). These results suggest that DigestSea modulates the inflammatory process by reducing the secretion of CRP and HPR in the liver, likely via regulation of interleukins 6 and 8 [27], as well as their release into the plasma. This effect is corroborated by the increase observed for both biomarkers in DigestSea-supplemented hens after supplementation is ended. The fact that CSC has choline in its composition and CRP binds to phosphocholine and related molecules [28] may explain the decrease observed in CSC-supplemented hens. Nevertheless, the highest levels of CRP and HRP observed here, respectively 3.10 ng/mL and 3.36 ng/mL for control hens, 2.25 ng/mL and 2.72 ng/mL for CSC-supplemented hens, and 2.84 ng/mL and 2.62 ng/mL for DigestSea-supplemented hens, were not nearly as high as those registered in chicken infected with bursal disease virus (CRP: 1770 ng/mL; HRP: 150,000 ng/mL [29]).
5. Conclusions
Overall, the results of the present study demonstrate that the MSPs contained in DigestSea had beneficial effects on the lipid metabolism and hepatic inflammation of 30-weeks-old laying hens that continued to be exerted up to 3 weeks after the end of supplementation. Although weight gain was lower in DigestSea-supplemented hens than in CSC-supplemented or control hens, this outcome is not relevant, given the primary commercial interest in egg production (laying hens) and the short duration of the study (three weeks and only 5 days of supplementation). Blood and liver chemistry analyses revealed decreased levels of LRLR and cPPARγ, most likely associated with the reduced transcription of the genes coding for these markers, in lymphocytes and hepatocytes. As cPPARγ and LDLR are crucial for adipogenesis and cholesterol uptake, respectively, these results indicate that the MSPs in DigestSea might compete with TGs and cholesterol for the same cellular receptors. This competitive inhibition can lead to quicker receptor saturation, decreasing adipogenesis and cholesterol uptake, which ultimately prevents excessive fat deposition within cells thereby decreasing the risk of hepatic steatosis. Hence, DigestSea has the potential to prevent fatty liver disease by maintaining a balance between de novo lipogenesis and TGs oxidation. Additionally, the levels of hepatic inflammation markers, HPR and CRP, generally decreased in the DigestSea group (except on the day of supplementation), indicating a positive modulation of inflammation. Histological assessment of liver tissue corroborated these findings, showing a lower severity of steatosis in the DigestSea group, which aligns with improved TGs and cholesterol metabolism. Results of the present study also suggest the potential of using cPPARγ and LDLR levels in lymphocytes as biomarkers for liver status and fat deposition. This approach may enhance the assessment and monitoring of liver health in hens without the need for invasive procedures.
Author Contributions
Conceptualization, Pi Nyvall and Frédérick Bussy; Data curation, Fransisco Rocha Pinto, Frédérick Bussy and Mathias Chatelais; Formal analysis, Mathias Chatelais; Methodology, Pi Nyvall, Frédérick Bussy, Mathias Chatelais and Olivier Mathiaud; Writing – original draft, Pi Nyvall and Frédérick Bussy; Writing – review & editing, Pi Nyvall, Fransisco Rocha Pinto and Anne Morvan. All authors have read and agreed to the published version of the manuscript.
Funding
This research received no external funding.
Institutional Review Board Statement
Ethical review and approval were waived for this study as tissues (blood as well as liver tissue) were collected in the course of the regular veterinary management process of the farm.
Informed Consent Statement
Not applicable.
Data Availability Statement
The datasets used and/or analysed during the current study are available from the corresponding author on reasonable request.
Acknowledgments
The authors would like to acknowledge the Atlantic bonescreen for the histopathology analysis and Joana Marques and Miguel Leal for comments to improve the manuscript.
Conflicts of Interest
Authors Fransisco Rocha Pinto, Frédérick Bussy, Pi Nyvall and Anne Morvan were employed by the company Olmix. Mathias Chatelais works for ProfileHIT, an innovative profiling company involved in vascular and immunology crosstalk research field in humans. The remaining authors declare that the research was conducted in the absence of any commercial or financial relationships that could be construed as a potential conflict of interest.
References
- Jia, M.; Xiao, Y.; Zhang, C.; Jiang, T.; Huang, Y.; Gao, J.; Li, Y.; Zhou, L. Mitoxantrone Alleviates Hepatic Steatosis Induced by High-Fat Diet in Broilers. Biochem. Biophys. Res. Commun. 2022, 627, 52–59. [Google Scholar] [CrossRef]
- Nematbakhsh, S.; Pei Pei, C.; Selamat, J.; Nordin, N.; Idris, L.H.; Abdull Razis, A.F. Molecular Regulation of Lipogenesis, Adipogenesis and Fat Deposition in Chicken. Genes 2021, 12. [Google Scholar] [CrossRef] [PubMed]
- Bensadoun, A.; Rothfeld, A. The Form of Absorption of Lipids in the Chicken, Gallus Domesticus. Proc. Soc. Exp. Biol. Med. 1972, 141, 814–817. [Google Scholar] [CrossRef] [PubMed]
- Pengzhan, Y.; Ning, L.; Xiguang, L.; Gefei, Z.; Quanbin, Z.; Pengcheng, L. Antihyperlipidemic Effects of Different Molecular Weight Sulfated Polysaccharides from Ulva Pertusa (Chlorophyta). Pharmacol. Res. 2003, 48, 543–549. [Google Scholar] [CrossRef]
- Qi, H.; Huang, L.; Liu, X.; Liu, D.; Zhang, Q.; Liu, S. Antihyperlipidemic Activity of High Sulfate Content Derivative of Polysaccharide Extracted from Ulva Pertusa (Chlorophyta). Carbohydr. Polym. 2012, 87, 1637–1640. [Google Scholar] [CrossRef]
- Qi, H.; Sheng, J. The Antihyperlipidemic Mechanism of High Sulfate Content Ulvan in Rats. Mar. Drugs 2015, 13, 3407–3421. [Google Scholar] [CrossRef] [PubMed]
- Lai, W.; Cao, A.; Li, J.; Zhang, W.; Zhang, L. Effect of High Dose of Bile Acids Supplementation in Broiler Feed on Growth Performance, Clinical Blood Metabolites, and Organ Development. J. Appl. Poult. Res. 2018, 27, 532–539. [Google Scholar] [CrossRef]
- Jiao, G.; Yu, G.; Zhang, J.; Ewart, H.S. Chemical Structures and Bioactivities of Sulfated Polysaccharides from Marine Algae. Mar. Drugs 2011, 9, 196–223. [Google Scholar] [CrossRef]
- Wang, G.; Kim, W.K.; Cline, M.A.; Gilbert, E.R. Factors Affecting Adipose Tissue Development in Chickens: A Review. Poult. Sci. 2017, 96, 3687–3699. [Google Scholar] [CrossRef]
- Sato, K.; Fukao, K.; Seki, Y.; Akiba, Y. Expression of the Chicken Peroxisome Proliferator-Activated Receptor-Gamma Gene Is Influenced by Aging, Nutrition, and Agonist Administration. Poult. Sci. 2004, 83, 1342–1347. [Google Scholar] [CrossRef]
- Pioche, T.; Skiba, F.; Bernadet, M.-D.; Seiliez, I.; Massimino, W.; Houssier, M.; Tavernier, A.; Ricaud, K.; Davail, S.; Skiba-Cassy, S.; et al. Kinetic Study of the Expression of Genes Related to Hepatic Steatosis, Glucose and Lipid Metabolism, and Cellular Stress during Overfeeding in Mule Ducks. American Journal of Physiology-Regulatory, Integrative and Comparative Physiology 2020, 318, R453–R467. [Google Scholar] [CrossRef]
- Bussy, F.; Goff, M.L.; Biesse, M.; Guriec, N.; Delarue, J.; Mathiaud, O.; Collén, P.N. An Algal Extract Improves Liver Function and Laying Performance of Turkey Breeders. J. US China Med. Sci. 2020, 17. [Google Scholar] [CrossRef]
- Qi, H.; Liu, X.; Zhang, J.; Duan, Y.; Wang, X.; Zhang, Q. Synthesis and Antihyperlipidemic Activity of Acetylated Derivative of Ulvan from Ulva Pertusa. Int. J. Biol. Macromol. 2012, 50, 270–272. [Google Scholar] [CrossRef] [PubMed]
- Wang, L.; Wang, X.; Wu, H.; Liu, R. Overview on Biological Activities and Molecular Characteristics of Sulfated Polysaccharides from Marine Green Algae in Recent Years. Mar. Drugs 2014, 12, 4984–5020. [Google Scholar] [CrossRef] [PubMed]
- Kidgell, J.T.; Magnusson, M.; de Nys, R.; Glasson, C.R.K. Ulvan: A Systematic Review of Extraction, Composition and Function. Algal Research 2019, 39, 101422. [Google Scholar] [CrossRef]
- Hassan, S.; El-Twab, S.A.; Hetta, M.; Mahmoud, B. Improvement of Lipid Profile and Antioxidant of Hypercholesterolemic Albino Rats by Polysaccharides Extracted from the Green Alga Ulva Lactuca Linnaeus. Saudi J. Biol. Sci. 2011, 18, 333–340. [Google Scholar] [CrossRef] [PubMed]
- Zanoni, P.; Panteloglou, G.; Othman, A.; Haas, J.T.; Meier, R.; Rimbert, A.; Futema, M.; Abou Khalil, Y.; Norrelykke, S.F.; Rzepiela, A.J.; et al. Posttranscriptional Regulation of the Human LDL Receptor by the U2-Spliceosome. Circ. Res. 2022, 130, 80–95. [Google Scholar] [CrossRef] [PubMed]
- Royan, M.; Navidshad, B. Peroxisome Proliferator-Activated Receptor Gamma (PPARγ), a Key Regulatory Gene of Lipid Metabolism in Chicken. Worlds. Poult. Sci. J. 2016, 72, 773–784. [Google Scholar] [CrossRef]
- Khalaji, S.; Zaghari, M.; Ganjkhanloo, M.; Ghaziani, F. Arginine, Soy Isoflavone and Hydroxypropylmethylcellulose Have Protective Effects against Obesity in Broiler Breeder Hens Fed on High-Energy Diets. Br. Poult. Sci. 2013, 54, 766–779. [Google Scholar] [CrossRef]
- Lu, T.; Harper, A.F.; Zhao, J.; Dalloul, R.A. Effects of a Dietary Antioxidant Blend and Vitamin E on Growth Performance, Oxidative Status, and Meat Quality in Broiler Chickens Fed a Diet High in Oxidants. Poult. Sci. 2014, 93, 1649–1657. [Google Scholar] [CrossRef] [PubMed]
- Lee, B.K.; Kim, J.S.; Ahn, H.J.; Hwang, J.H.; Kim, J.M.; Lee, H.T.; An, B.K.; Kang, C.W. Changes in Hepatic Lipid Parameters and Hepatic Messenger Ribonucleic Acid Expression Following Estradiol Administration in Laying Hens (Gallus Domesticus). Poult. Sci. 2010, 89, 2660–2667. [Google Scholar] [CrossRef] [PubMed]
- Ramiah, S.K.; Meng, G.Y.; Sheau Wei, T.; Swee Keong, Y.; Ebrahimi, M. Dietary Conjugated Linoleic Acid Supplementation Leads to Downregulation of PPAR Transcription in Broiler Chickens and Reduction of Adipocyte Cellularity. PPAR Res. 2014, 2014, 137652. [Google Scholar] [CrossRef] [PubMed]
- Royan, M.; Meng, G.Y.; Othman, F.; Sazili, A.Q.; Navidshad, B. Effects of Conjugated Linoleic Acid, Fish Oil and Soybean Oil on PPARs (α & γ) MRNA Expression in Broiler Chickens and Their Relation to Body Fat Deposits. Int. J. Mol. Sci. 2011, 12, 8581–8595. [Google Scholar] [CrossRef]
- Liu, C.; Song, Z.; Li, Z.; Boon, M.R.; Schönke, M.; Rensen, P.C.N.; Wang, Y. Dietary Choline Increases Brown Adipose Tissue Activation Markers and Improves Cholesterol Metabolism in Female APOE*3-Leiden.CETP Mice. Int. J. Obes. (Lond) 2023. [Google Scholar] [CrossRef]
- Corbin, K.D.; Zeisel, S.H. Choline Metabolism Provides Novel Insights into Nonalcoholic Fatty Liver Disease and Its Progression. Curr. Opin. Gastroenterol. 2012, 28, 159–165. [Google Scholar] [CrossRef] [PubMed]
- Slivinska, L.G.; Yaremchuk, V.Y.; Shcherbatyy, A.R.; Gutyj, B.V.; Zinko, H.O. Efficacy of Hepatoprotectors in Prophylaxis of Hepatosis of Laying Hens. Regul. Mech. Biosyst. 2022, 13, 287–293. [Google Scholar] [CrossRef]
- Nawaz, S.; Asif, M.; Bhutta, Z.A.; Kulyar, M.F.; Hussain, R.; Ramzan, A.; Shafeeq, S.; Shakir, M.Z.; Sarfaraz, M.T.; Li, K. A Comprehensive Review on Acute Phase Proteins in Chicken. Arch. Gefluegelkd. 2021, 85. [Google Scholar] [CrossRef]
- Marnell, L.; Mold, C.; Du Clos, T.W. C-Reactive Protein: Ligands, Receptors and Role in Inflammation. Clin. Immunol. 2005, 117, 104–111. [Google Scholar] [CrossRef]
- Seifi, S.; Alian Samakkhah, S.H.; Absalan Fard, K. Acute Phase Response in Experimentally Infected Broilers with Avian Infectious Bronchitis Virus Serotype 4/91. J. Hell. Vet. Med. Soc. 2017, 65, 17. [Google Scholar] [CrossRef]
- O’Reilly, E.L.; Eckersall, P.D. Acute Phase Proteins: A Review of Their Function, Behaviour and Measurement in Chickens. Worlds. Poult. Sci. J. 2014, 70, 27–44. [Google Scholar] [CrossRef]
- Thompson, D.; Pepys, M.B.; Wood, S.P. The Physiological Structure of Human C-Reactive Protein and Its Complex with Phosphocholine. Structure 1999, 7, 169–177. [Google Scholar] [CrossRef] [PubMed]
Figure 1.
LDLR (a) and cPPARγ (b) levels (as median intensity fluorescence, MFI) in the lymphocytes of hens subject to the three different treatments: non-supplemented (C, negative control group); supplemented with CSC (B, positive control group); and supplemented with DigestSea® (D, test group). Boxes represent the 25% quartile, median, and 75% quartile.
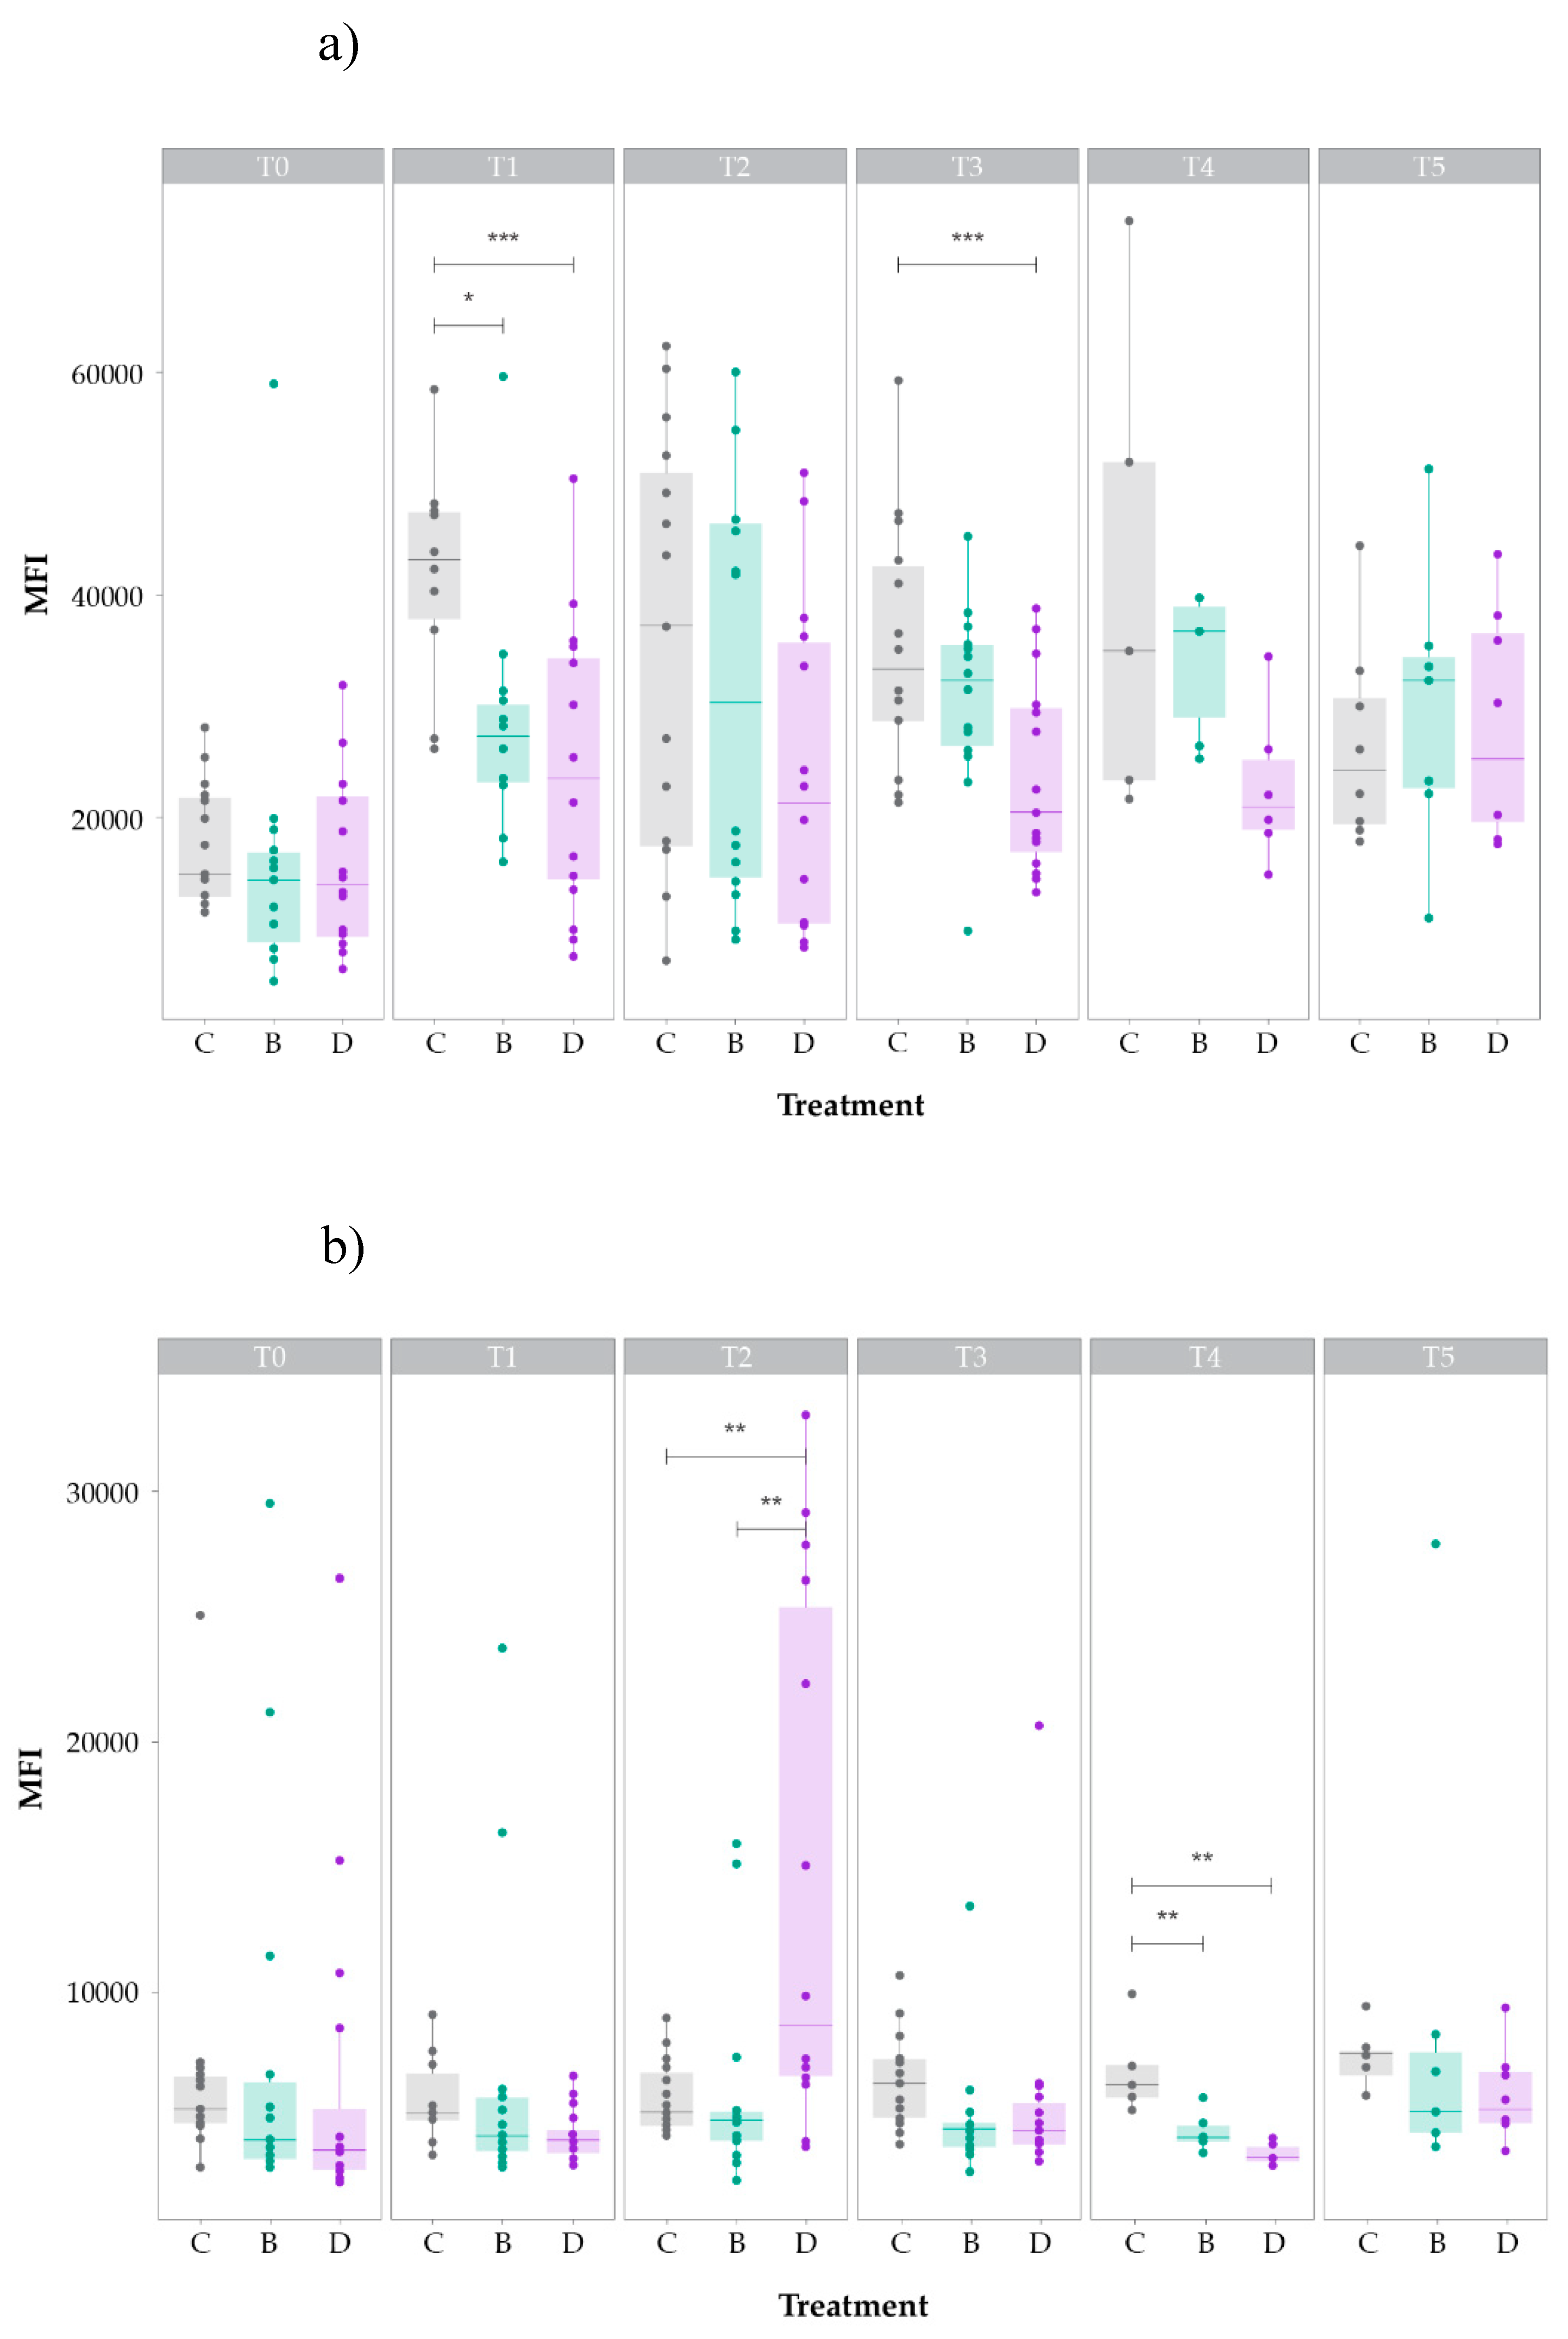
Figure 2.
LDLR (a) and cPPARγ (b) levels (as median intensity fluorescence, MFI) in the hepatocytes of hens subject to the three different treatments: non-supplemented (C, negative control group); supplemented with CSC (B, positive control group); and supplemented with DigestSea® (D, test group). Boxes represent the 25% quartile, median, and 75% quartile.
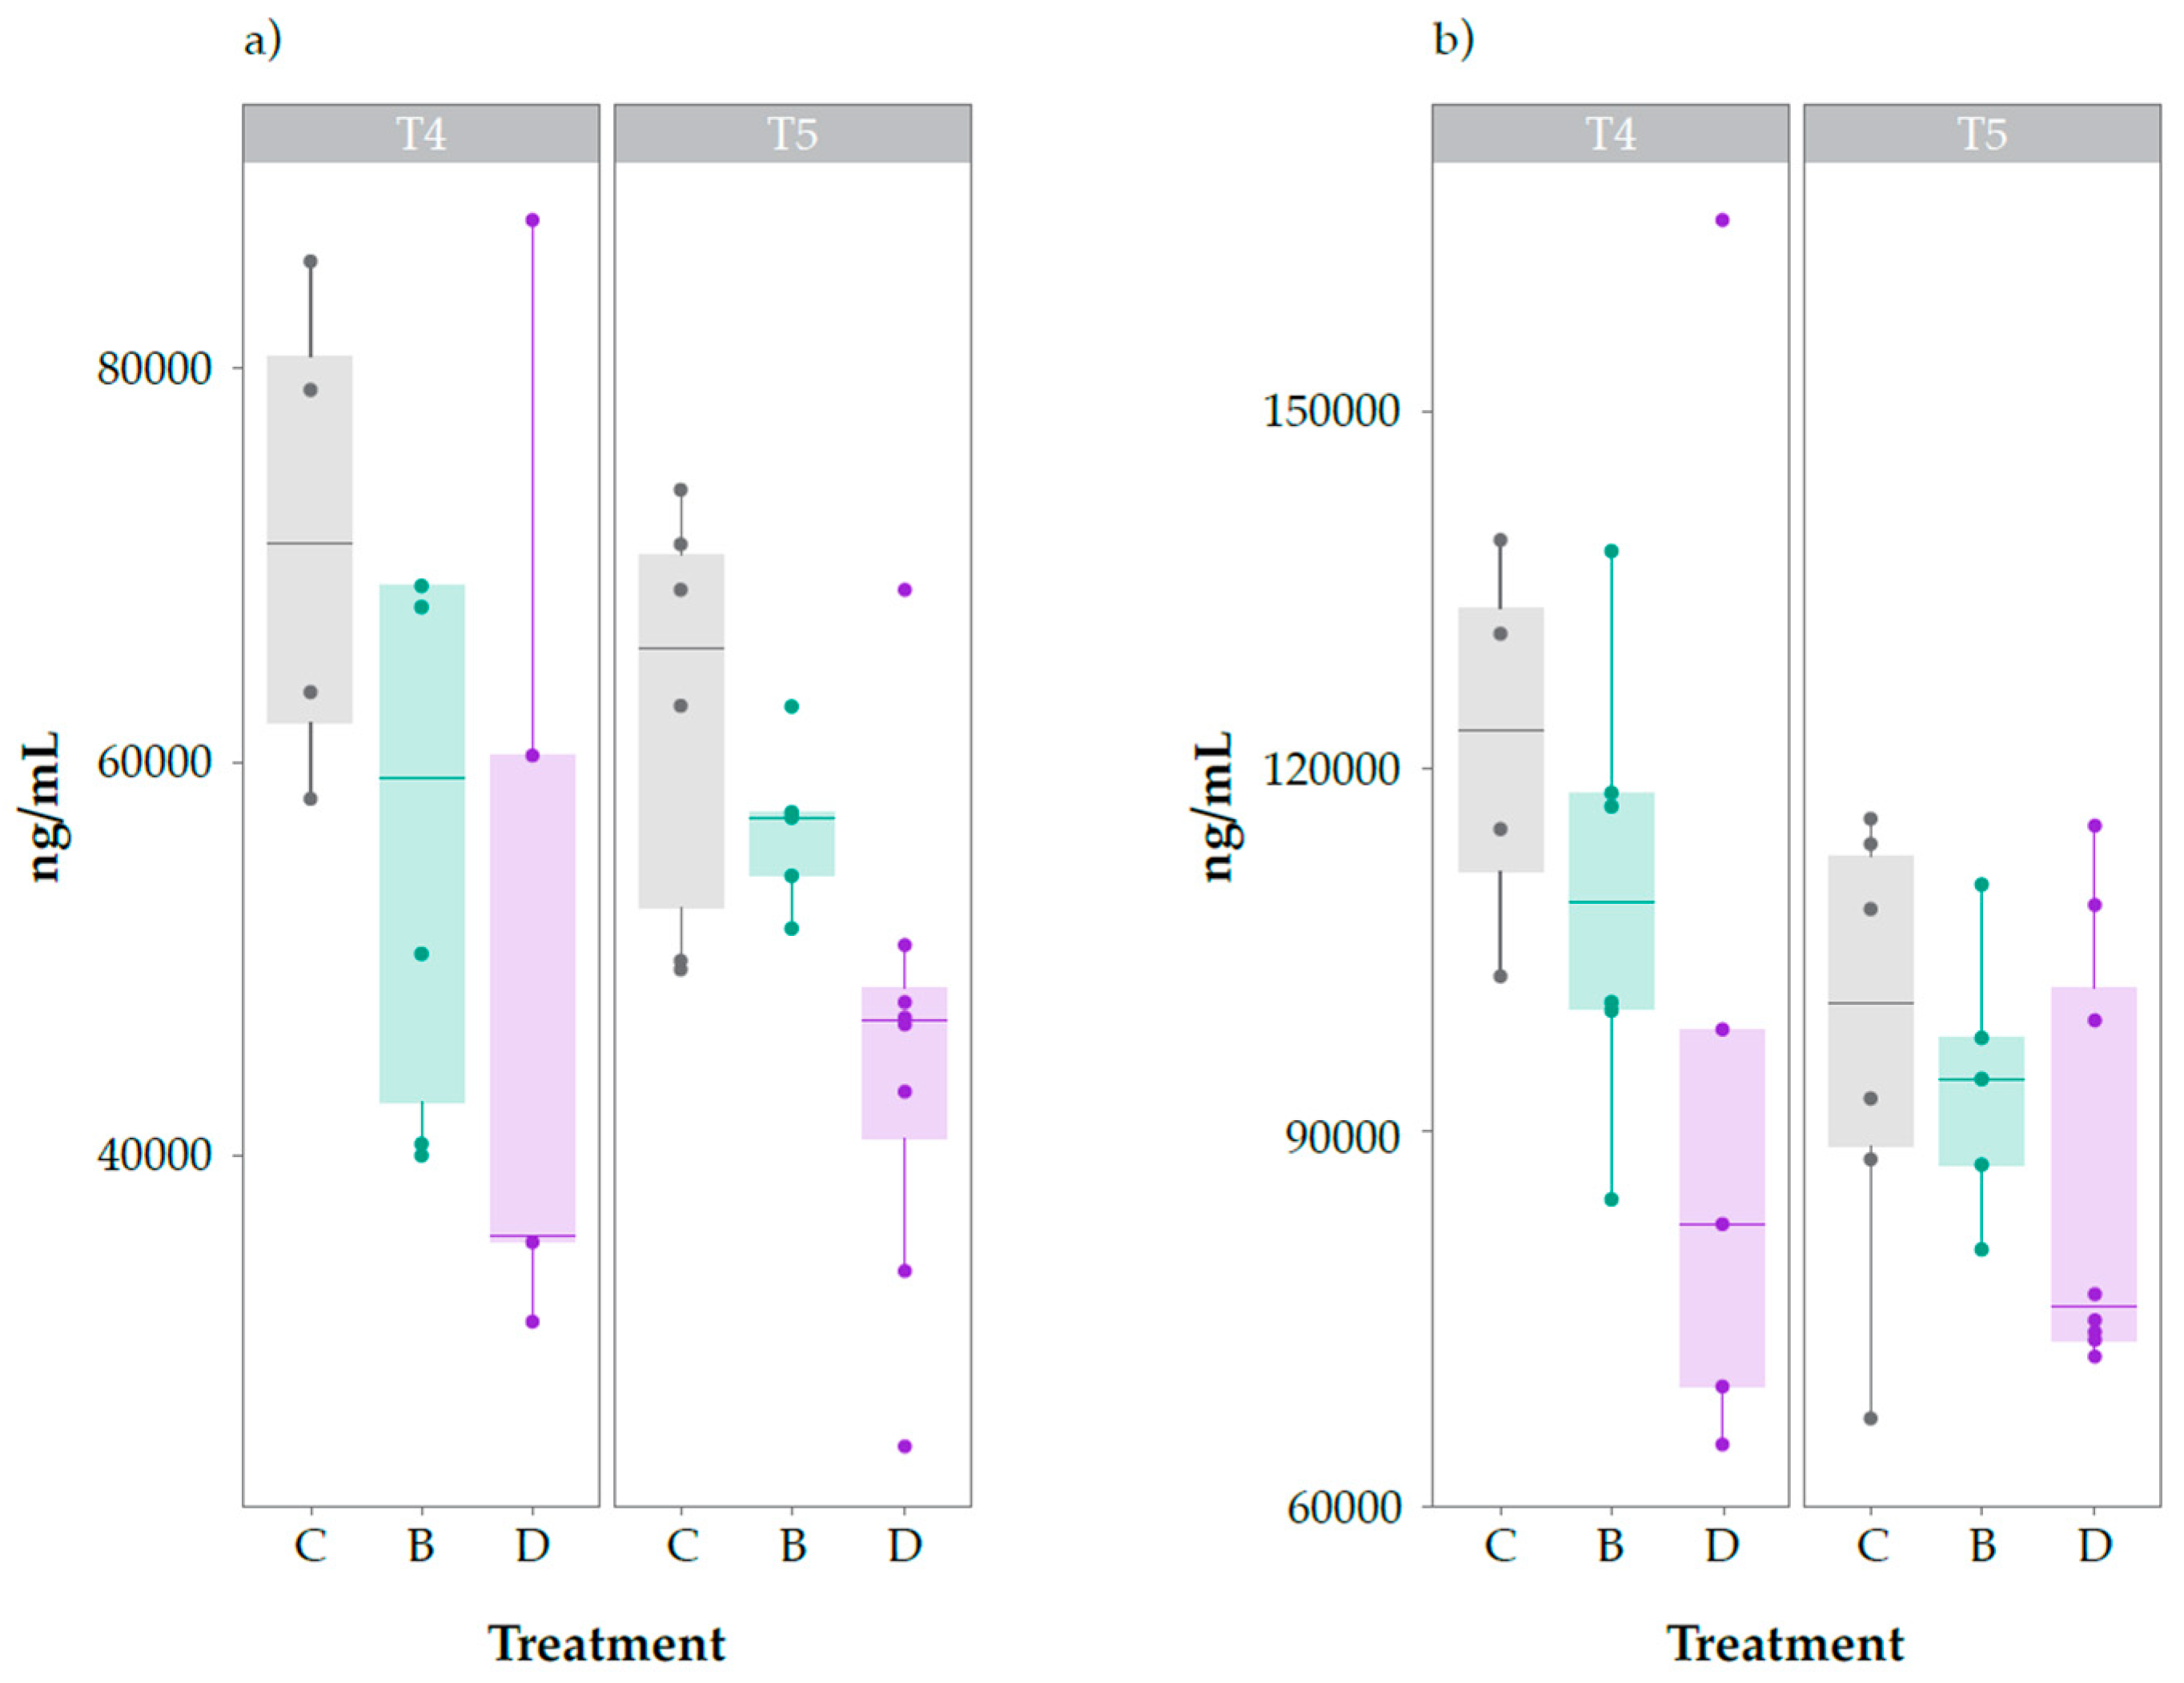
Figure 3.
C-reactive protein (CRP) (a) and haptoglobin related protein (HPR) (b) levels (ng/mL) in the plasma of hens subject to the three different treatments: non-supplemented (C, negative control group); supplemented with CSC (B, positive control group); and supplemented with DigestSea® (D, test group). Values are group means.
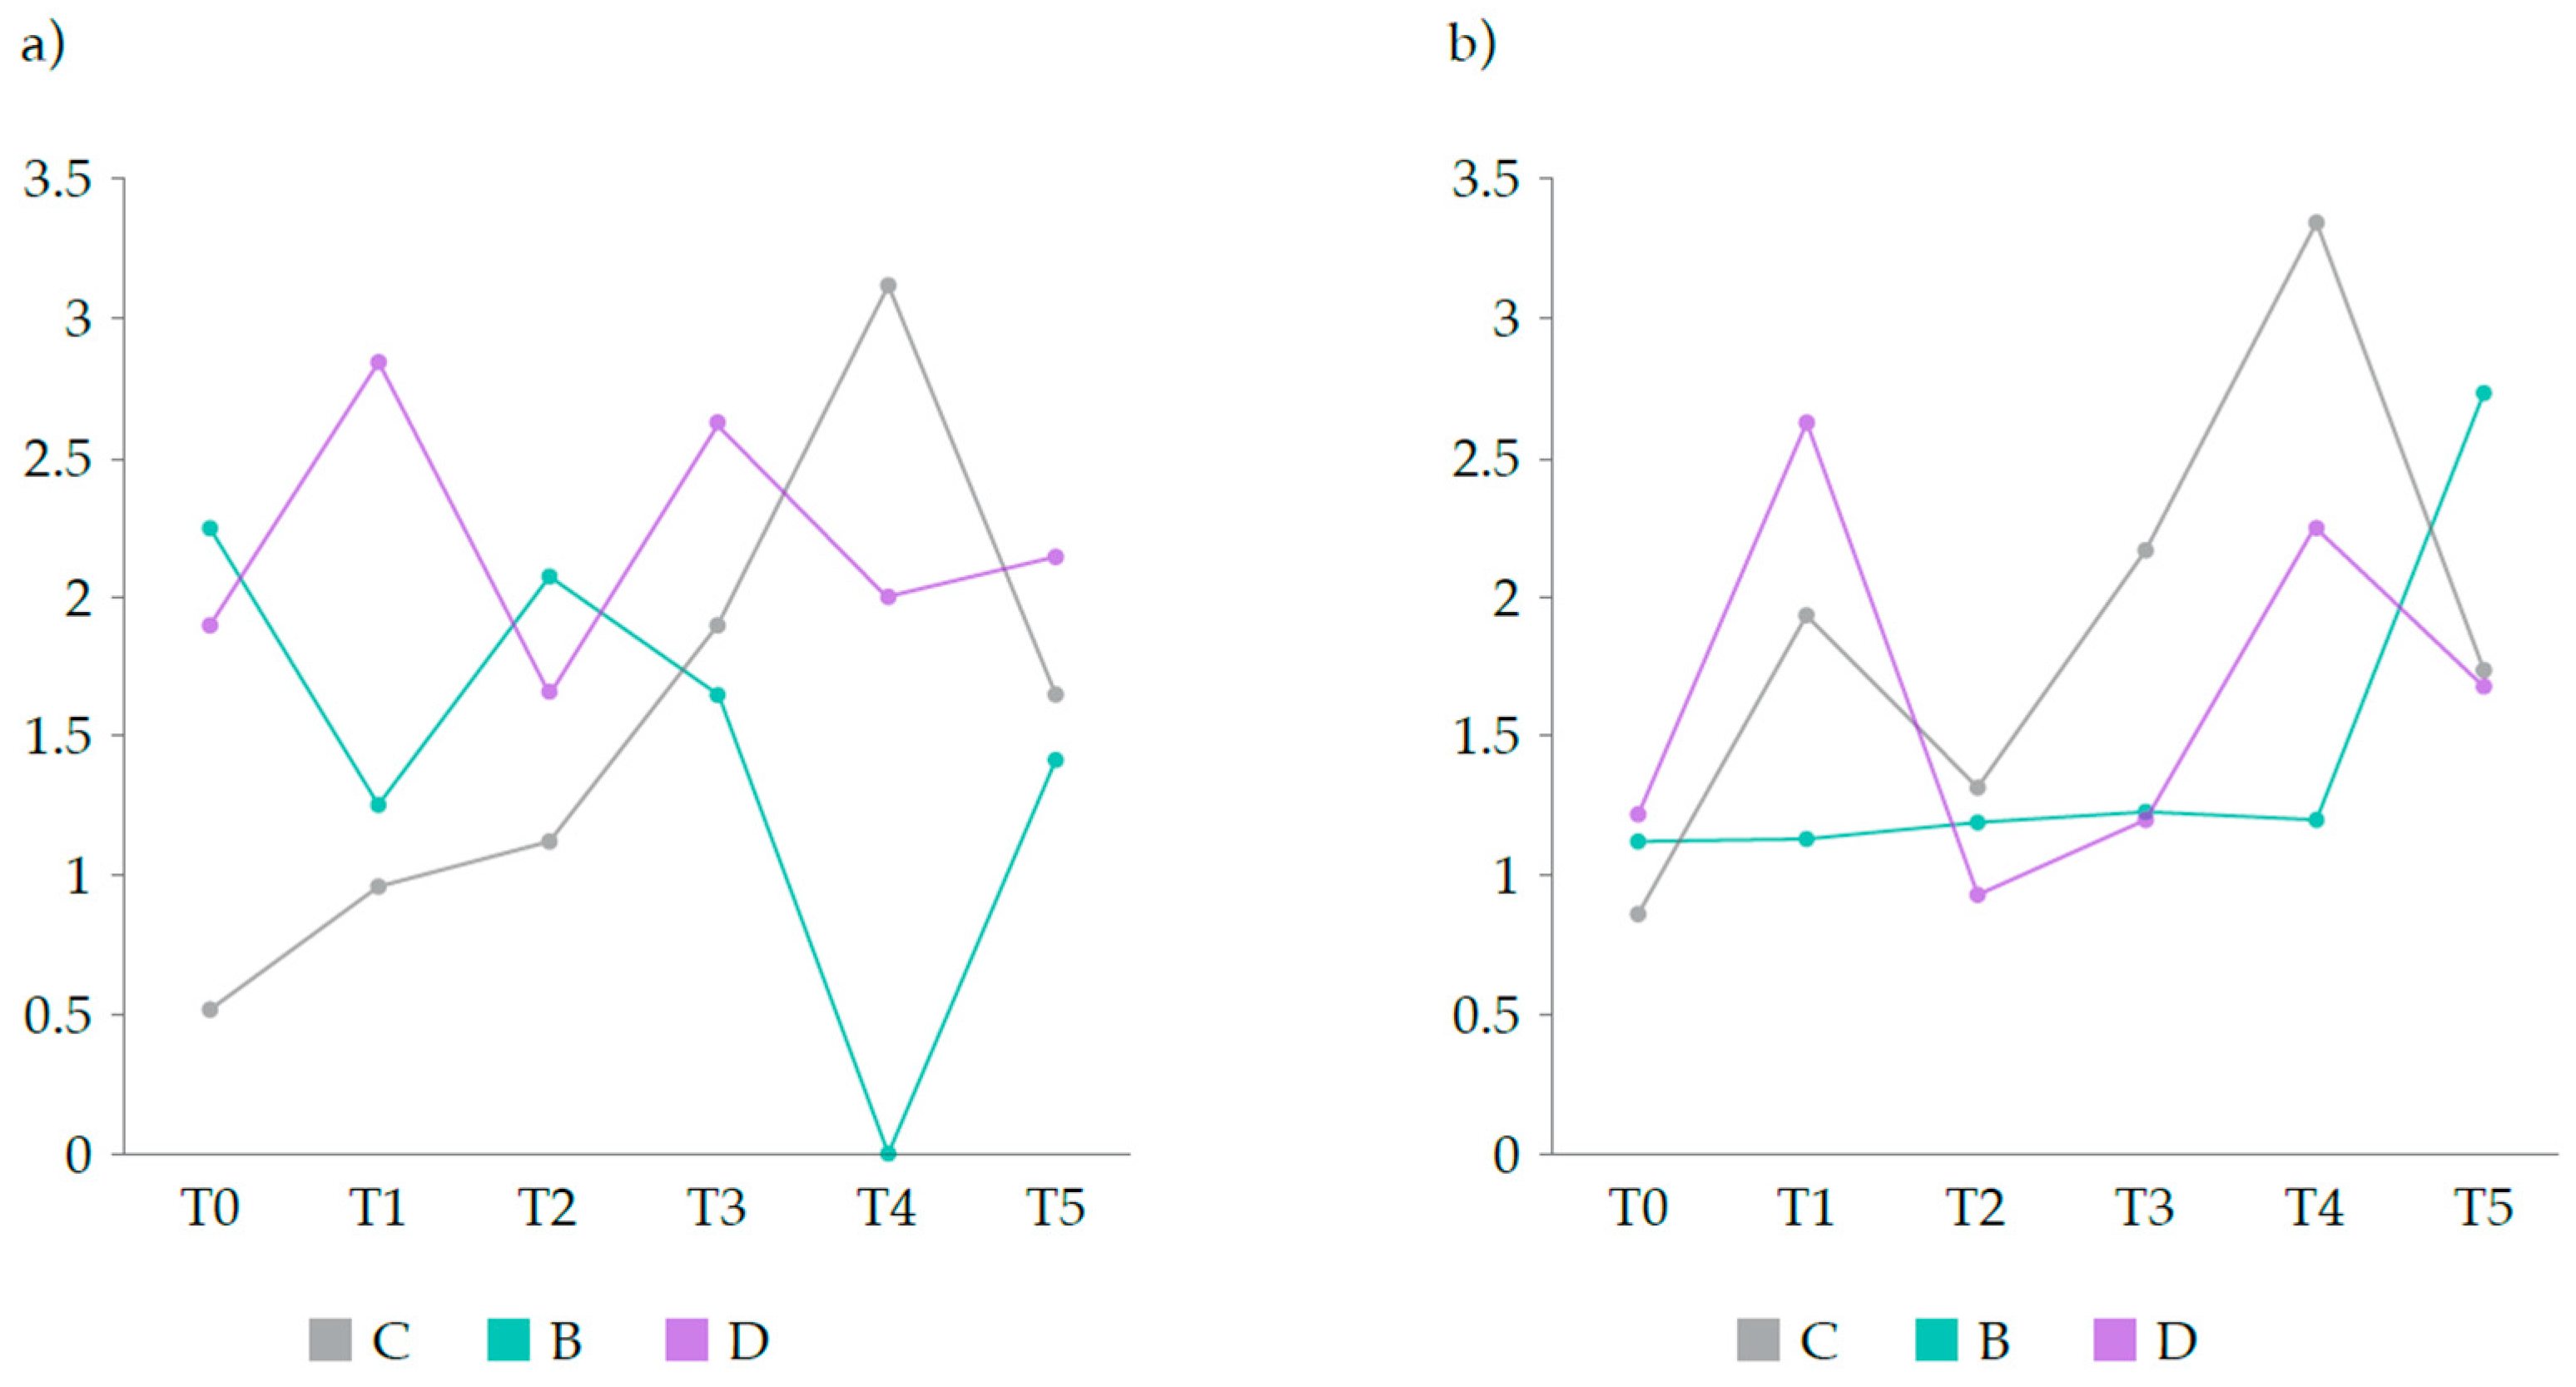
Figure 4.
Average scores of lipid and glycogen surcharges in the hepatocytes (SLH and SGH, respectively) of hens in each treatment group: non-supplemented (C, negative control group); supplemented with CSC (B, positive control group); and supplemented with DigestSea® (D, test group).
Figure 4.
Average scores of lipid and glycogen surcharges in the hepatocytes (SLH and SGH, respectively) of hens in each treatment group: non-supplemented (C, negative control group); supplemented with CSC (B, positive control group); and supplemented with DigestSea® (D, test group).
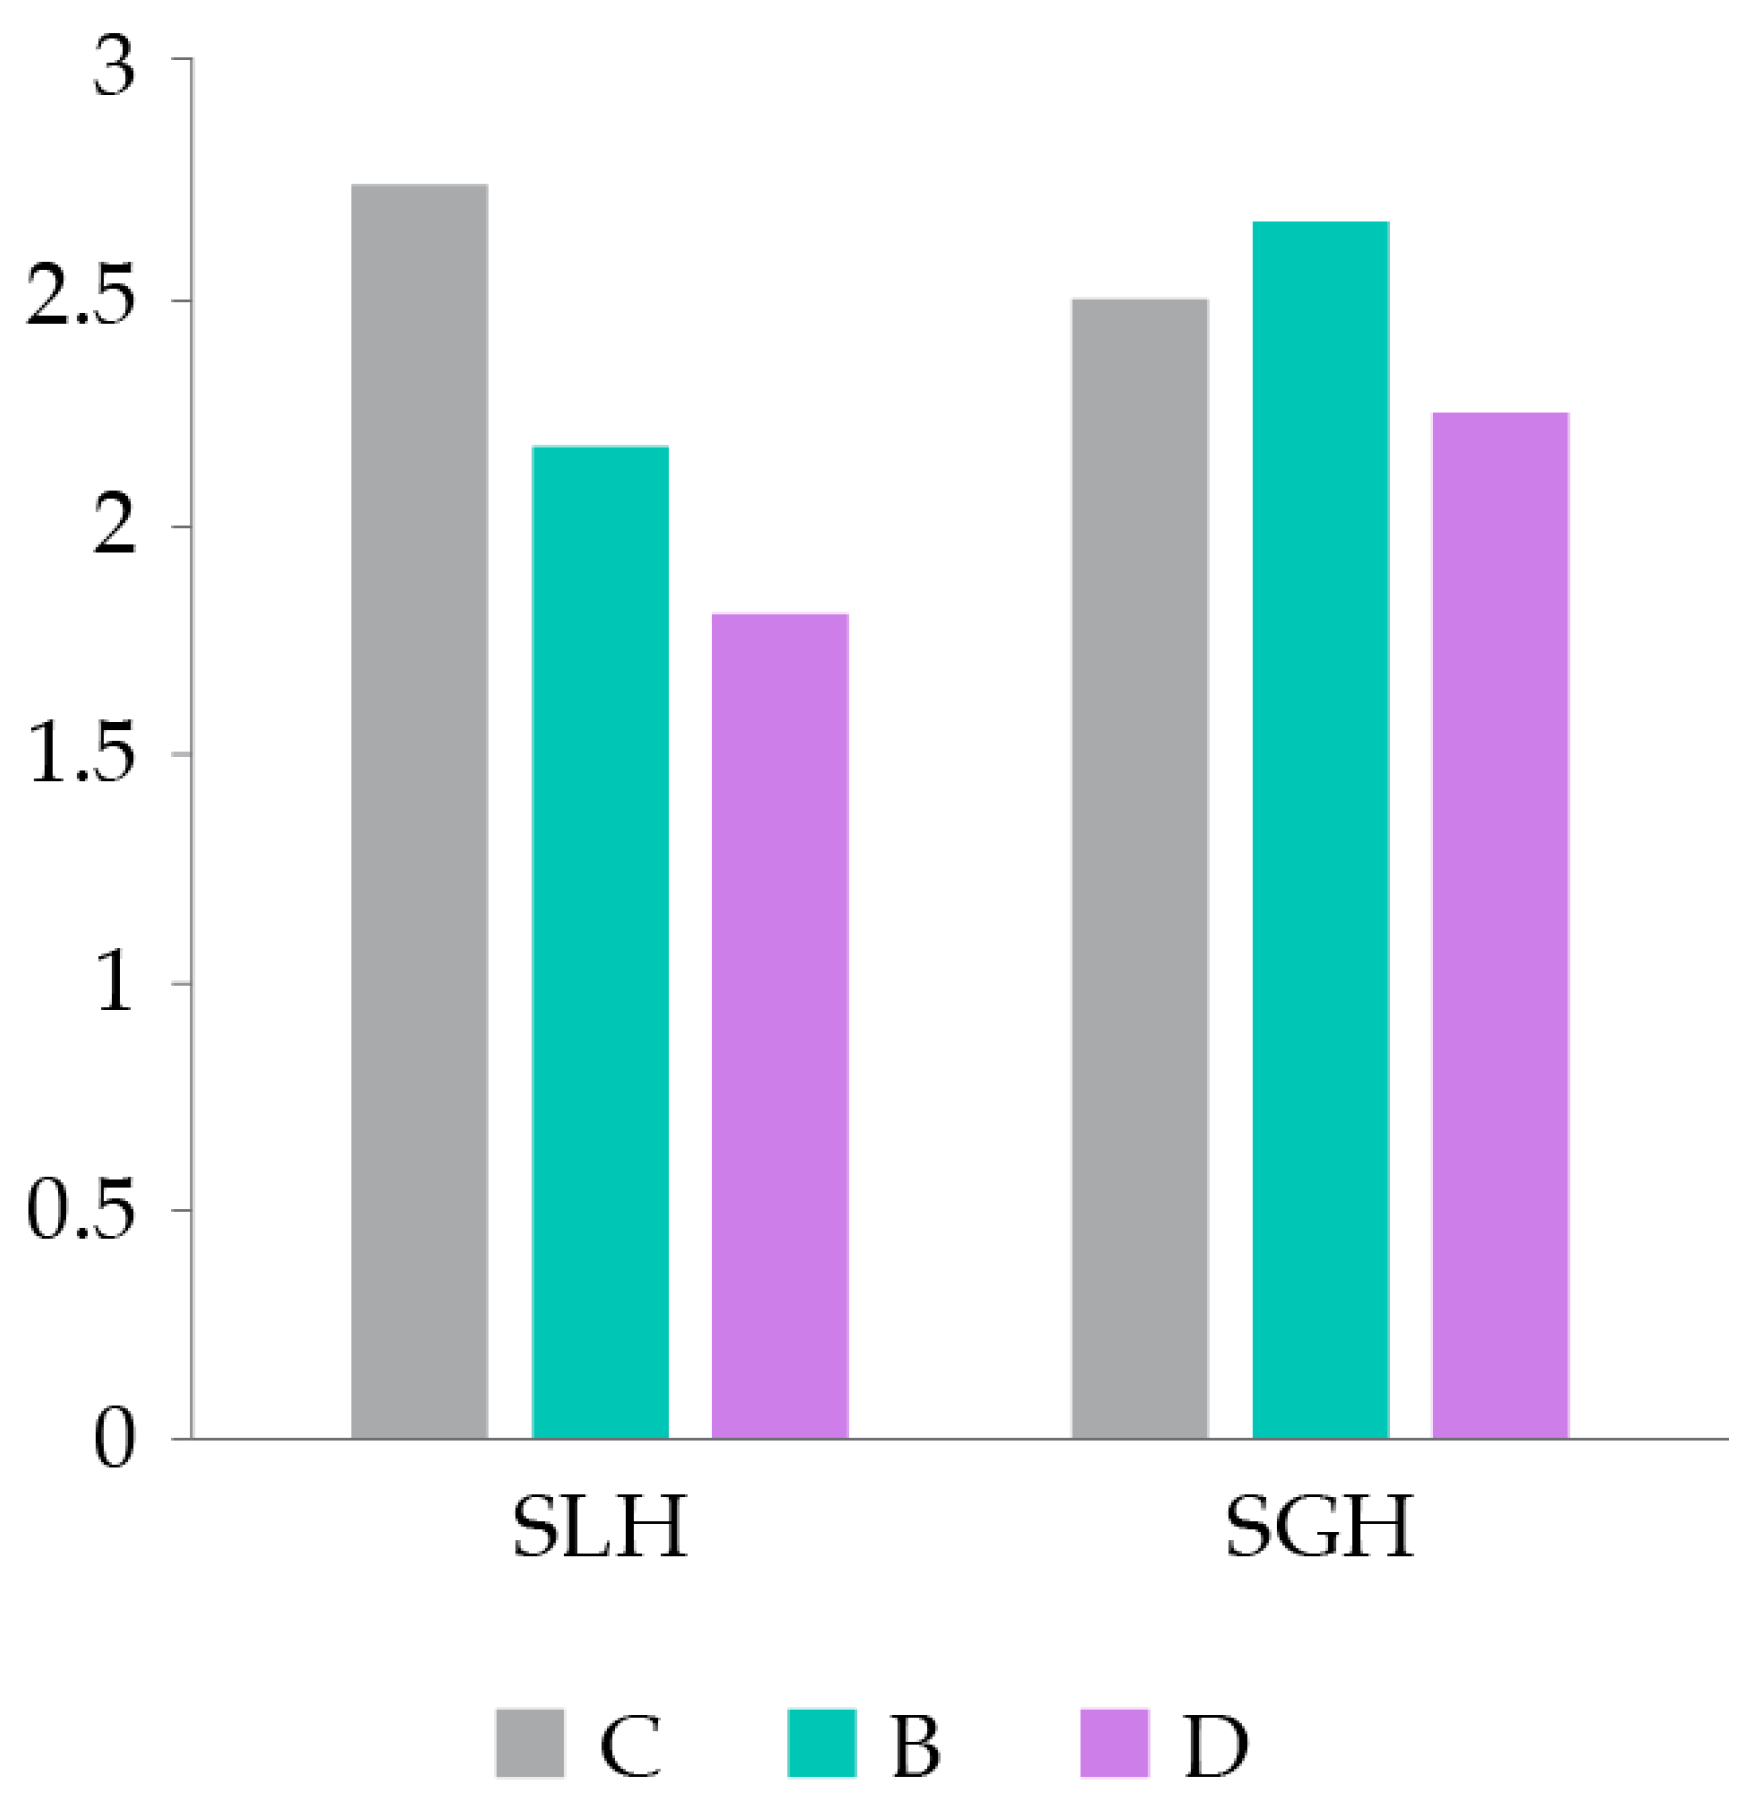

Table 1.
Average weight (g) of hens in the negative control (C), CSC-supplemented (B), and DigestSea®-supplemented (D) groups at the different sampling time points and their weight gain at the end of the trial period.
Table 1.
Average weight (g) of hens in the negative control (C), CSC-supplemented (B), and DigestSea®-supplemented (D) groups at the different sampling time points and their weight gain at the end of the trial period.
| Sampling time | C | B | D |
|---|---|---|---|
| T0 (day before supplementation) | 1877.7 ± 119.4 | 1879.8 ± 78.0 | 1847.8 ± 112.5 |
| T1 (day of supplementation) | 1877.4 ± 109.8 | 1941.4 ± 109.5 | 1897.8 ± 101.6 |
| T2 (end of supplementation) | 1894.0 ± 108.1 | 1941.5 ± 86.7 | 1844.9 ± 113.8 |
| T3 (one week after supplementation) | 1901.1 ± 132.0 | 1966.7 ± 109.3 | 1816.6 ± 134.9 |
| T4 (two weeks after supplementation) | 1982.3 ± 151.2 | 2004.0 ± 112.7 | 1896.1 ± 139.5 |
| T5 (three weeks after supplementation) | 1992.0 ± 177.4 | 1996.9 ± 121.2 | 1943.4 ± 110.2 |
| Weight gain | 114.3 | 117.1 | 95.7 |
Disclaimer/Publisher’s Note: The statements, opinions and data contained in all publications are solely those of the individual author(s) and contributor(s) and not of MDPI and/or the editor(s). MDPI and/or the editor(s) disclaim responsibility for any injury to people or property resulting from any ideas, methods, instructions or products referred to in the content. |
© 2025 by the authors. Licensee MDPI, Basel, Switzerland. This article is an open access article distributed under the terms and conditions of the Creative Commons Attribution (CC BY) license (http://creativecommons.org/licenses/by/4.0/).
Copyright: This open access article is published under a Creative Commons CC BY 4.0 license, which permit the free download, distribution, and reuse, provided that the author and preprint are cited in any reuse.


