
Submitted:
01 October 2023
Posted:
04 October 2023
You are already at the latest version
Abstract
Excess weight, which is seen as the background cause of most diseases, is gradually becoming the most important problem in the world. The cafeteria diet is robust diet that mimics the western diet and provides rapid weight gain associated with the obesity, diabetes, and cancer. The relationship between obesity and cancer is well known. For this reason, it is of great importance to reveal the first molecular and metabolic alterations that occur before entering the obesity process with any factor to understand the pathology of many diseases and to treat them in the early period. The beneficial effects of probiotics are attributed to their metabolite content with antioxidant properties or the postbiotic metabolites produced by them. In this study, the effects of different dietary practices on the hepatic antioxidant system of rats in developmental period were investigated by real-time PCR, enzyme activity measurements, and quantitative measurements of metabolites. After all, it was observed that CAF caused serious impairments by affecting the hepatic antioxidant system at gene and protein levels, and these impairments were relatively reversed with SCD Probiotics supplementation. In addition, regardless of the CAF diet, the regulatory effect of SCD Probiotics supplementation on the hepatic antioxidant system is remarkable.
Keywords:
antioxidant system
; cafeteria diet
; SCD probiotics
; gene expression
; enzyme activity
1. Introduction
Overweight or obese people has been increasing dramatically in recent years [1]. Nutritional culture is one of the main reasons that cause cardiovascular diseases and cancer types even at young ages [1,2]. The Western diet is an unhealthy diet promoting weight gain with nutritional diversity, flavor, and energy value [1]. CAF diet is a good imitation of western diet and is a robust alternative to induce rapid weight gain by promoting sustained hyperphagia [3]. Also, some genetic and spontaneous mutations are known to be phenomena in the background of obesity [4]. The CAF diet is also known to support refined carbohydrate intake, ROS production, and expression of some inflammatory cytokines [5]. As a result, obesity or weight gain can occur the effects of different ways and the metabolism can be affect at gene and protein levels [1]. E.g, the CAF diet has been reported to reduce the phosphorylation of nitric oxide synthase and increase plasma coagulation activity [6]. Within the scope of the relationship between obesity and metabolism, the formation of cardiovascular diseases, kidney diseases, and some types of cancer based on obesity are constantly emphasized [2,7]. With the prevalence of obesity, there are dramatic increases in various diseases such as type 2 diabetes, hypertension, and non-alcoholic fatty liver disease [8]. Lipid metabolism abnormalities based on adipose tissue proliferation [9], inflammation, ROS-mediated oxidative stress, and intense insulin production and resistance are among the problems caused by obesity [2,10,11]. CAF diet also increases the production of ROS in rat gastrointestinal tract [11] and reduces significantly the diversity of gut microbiota [12] and it is stated that long-term exposure with the ROS leads to the dysbiosis in intestinal microbiota by causing intestinal injury, colorectal cancers, enteric infections, and inflammatory bowel diseases [11,13].
Probiotics are known as the best regulators of the gastrointestinal tract, and this effect is attributed to the postbiotic metabolites, most of which are antioxidant molecules and powerful ROS regulators [14]. According to the in vivo and animal model studies, food-derived antioxidants such as probiotics have a protective effect against oxidative stress in gut microbiota [13].
Since the intestinal tract is the primary interlocutor of food taken orally, the relationship between diet and intestinal metabolism has been extensively studied. However, obtaining data on their effects outside of intestinal tract provides the ideas about the metabolic changes in the early stages of possible diseases related to weight gain in the long term. This data is of great importance for the prevention and early treatment of diseases. In this study, the damage of CAF diet on the hepatic antioxidant system were investigated in the rats at developmental period. In addition, the capacity of SCD Probiotics on the prevention of possible damage and, regardless of CAF diet, the effects of SCD Probiotics supplementation were investigated by qPCR and kinetic enzyme activity measurements.
2. Material and methods
2.1. Experimental design and animal care
21-days old male wistar rats at developmental period were used as the model organism in this study. The weaned rats were randomly divided into four groups. The control group was fed only rodent diet (n=7), the CAF group fed with cafeteria (CAF) diet and normal rodent diet (n=7), the combined (Prob+CAF) group was fed a combined diet consisting of CAF and SCD Probiotics (n=7), and the Prob group was fed standard rodent diet and SCD Probiotics supplementation (n=7). SCD Probiotics is a product of a food manufacturing company and is used as a food supplement (Essential Probiotics XI – 500mL H.S. Code: 2206.00.7000). The treatments continued until day 56, considered the end of the development period. The SCD Probiotics supplement was given by oral gavage at a dose of 3/2mL (1 x 10⁸ CFU) per day [15]. SCD Probiotics contains Bacillus subtilis, Bifidobacterium bifidum, Bifidobacterium longum, Lactobacillus acidophilus, Lactobacillus bulgaricus, Lactobacillus casei, Lactobacillus fermentum, Lactobacillus plantarum, Lactococcus lactis, Saccharomyces cerevisiae, and Streptococcus thermophilus species. Animals were fed ad libitum with a standard rodent diet and the cafeteria diet was provided in addition to the normal ad libitum feeding. Throughout the experiment, the animals’ weights, weekly food consumption, the cafeteria diet content, and provided total energy values were recorded (Table 1). On the 56th day of administration, the animals were sacrificed immediately after being dazed slightly using ether treatment. The liver tissues were extracted, shocked on dry ice, and stored in a -80°C deep freezer until the time of analysis. All animals were housed following standard animal care protocols. This study was carried out with the approval of the Ethics Committee (meeting date: 29.06.2021, approval number: 2021/03) from the Bingöl University Animal Experiments Local Ethics Committee.
2.2. Determination of the quantitative GSH level and GSH/GSSG ratio
The quantitative GSH level was determined according to the method of Griffith (1980), modified slightly by Sonmez Aydin, et al. [16]. The principle of this method is based on the oxidation of GSH by sulfhydryl reagent DTNB at a wavelength of 412 nm. First, a standard GSSG graph was created using 10 different GSSG solutions prepared from pure GSSG molecule between 1µg/mL and 10µg/mL. Total quantitative GSH and GSSG levels were calculated using the GSSG standard curve. The GSH/GSSG ratio was then calculated. Homogenization of samples was performed using TissueLyser LT (Qiagen) homogenizer in trichloroacetic acid (TCA) solution (5% m/v) and the homogenates were centrifuged at 13000rpm for 10 min at 4 oC and divided into two parts to measure total quantitative GSH and GSSG levels. GSSG measurement was performed after derivatization of the current GSH using 2-vinylpyridine (QP2VP) for 1 hour at room temperature. Quantitative GSH and GSSG levels were recorded by measuring kinetically at 412 nm [16].
2.3. Determination of lipid peroxidation (MDA)
Malondialdehyde concentrations were determined according to the method of Ohkawa, et al. [17]. To increase the effective adhesion to thiobarbituric acid (TBA), the proteins were precipitated using 10mL of KCl solution (1.15% m/v) for each 0.1 absorbance value observed in Bradford results. Homogenates were centrifuged at 16000rpm for 3 min and precipitation was discarded. Absorbance values were read using a microplate reader (Multiscan GO, Thermo Scientific, USA) at 532 nm.
2.4. RNA isolation and cDNA synthesis
RNA isolation was carried out following the instructions of the ThermoFisher-labeled PureLink RNA Mini Kit protocol (Catalog Number: 12183018A). The purity and concentration of the product were checked using the NanoDrop QC software feature of the 96-well plate spectrophotometer (Multiskan GO, Thermo Scientific USA). cDNA synthesis was carried out following the instructions of the ProtoScript First Strand cDNA Synthesis Kit (E6300L, BioLabs). The thermal cycle was performed as follows; denaturation (5 min at 70 oC), incubation (1 h at 42 oC), and enzyme inactivation (5 min at 80 oC) using Sensoquest Thermocycler Labcycler w/ Thermoblock 96 Gold Plated Silver 012-103 and cDNA was stored at -20 oC.
2.5. Primers and gene expression analysis
The Primers were designed with the help of the National Center for Biotechnology Information (NCBI) database. The gapdh gene was used as a reference gene in the qPCR application. The alterations in antioxidant system genes were determined by SYBR Green Qpcr method (quantitative real-time polymerase chain reaction). qPCR reactions were carried out on the Rotor-Gene Q instrument (QIAGEN, Inc., Hilden, Germany) in strip tubes (0.1mL 4-Well). The final volume of the reaction mixture for a single strip tube was prepared as 10μL. 1 cycle (50 °C for 2 min, 95 °C for 1 min) and 40 cycle (95 °C for 10 s, 60 °C for 30 s) were used as thermal profile. qPCR CT values were converted to the relative mRNA expressions using the 2-ΔΔCT calculation method proposed by Livak and Schmittgen [18]. NCBI accession numbers and primer sequences are shown in Table 2.
2.6. Homogenate preparation and protein determination assay
Homogenization was performed using TissueLyser LT (Qiagen) homogenizer at 50 Hz for 3+3 min periods in 50 mM Tris-HCl buffer (pH:7.6). Samples were centrifuged at 13000rpm and precipitations were discarded. Quantitative amounts of proteins in supernatants were determined by Bradford’s protein assay [19]. By diluting 1mg/mL stock bovine serum albumin (BSA), standard samples were prepared at 10 different concentrations (20 µg/mL - 200 µg/mL) and standard curve was prepared to calculate quantitative protein amounts. Absorbance values were recorded at 595 nm. Quantitative protein amounts in the samples were determined using the standard curve equation.
2.7. Enzyme activity assays
Homogenization was performed in 50 mM potassium phosphate buffer (pH: 7.4) using TissueLyser LT (Qiagen) homogenizer at 50 Hz for 3+3 min periods. Homogenates were centrifuged at 10000rpm for 1 hour and transparent homogenates were used to determine the activities of SOD and CAT enzymes. CAT enzyme activity was measured at 240 nm and 15 second intervals for 1 min [20]. SOD enzyme activity was measured at 560 nm as fixed wavelength [21]. Tissues were homogenized again for GR, GPx, and GST enzyme activity measurements in 50 mM Tris-HCl (pH:7.6) including 1 mM DDT (dithiothreitol), 1 mM EDTA (ethylenediaminetetraacetic acid), and 1 mM PMSF (phenylmethanesulfonylfluoride). Lysate was centrifuged at 13000xg for 1 hour and obtained supernatants were used in the measurements of GR, GPx, and GST activity. GR activity was measured using the method of Carlberg and Mannervik [22] at 340 nm for 3 min. GPx activity was measured spectrophotometrically according to the Sigma Aldrich experimental protocol (Cat. No: SPGLUT02). According to the protocol, the reaction mixture was first incubated until the absorbance value stabilized. After adding H2O2 to the reaction mixture, GPx activity was measured at 340 nm for 5 min. GST activity was measured at 340 nm for 3 min using the method of Habig, et al. [23]. Enzyme activities were first calculated as EU/mL and the specific activities were then calculated as EU/mg protein by proportioning to the results of Bradford’s assay (Equation 1). The components of equation 1 are expressed as follows; A: absorbance changes for per min., Ɛ: extinction value of the substrate, VT: total volume, VS: sample volume, DF: dilution factor.
2.8. Data collection from databases and the validation of obtained data
The Gene Expression Profiling Interactive Analysis (GEPIA) is an interactive web server that provides normal and tumor samples data via Genotype-Tissue Expression (https://www.gtexportal.org/) and the University of Alabama at Birmingham Cancer data analysis Portal (UALCAN) (https://ualcan.path.uab.edu/) databases. Excess weight is associated with many diseases, and the CAF diet is a robust and reliable way to create weigh gain and obesity. The data on how the human antioxidant system is regulated in obesity mediated hepatocellular carcinoma was expressed using GEPIA [24] and UALCAN [25] databases. First, the gene expression profile of hepatic antioxidant system was reached in human liver hepatocellular carcinoma (LIHC) by linking (http://gepia.cancer-pku.cn/) and how the human antioxidant system proteins are regulated in hepatocellular carcinoma (HCC) was accessed via the link (https://ualcan.path.uab.edu/). According to database data, rat liver hepatic antioxidant system gene and protein expressions were interpreted.
2.9. Statistical analysis
All measurements were repeated at least 3 times. The results obtained from different diet groups were statistically compared with the results of the control groups. All statistical data were shown as Mean ± SEM (standard Error Mean). Statistical comparison of the results was performed according to Tukey’s Multiple Comparisons Test of One-way ANOVA, and P < 0.05 was considered significant. Correlation of mRNA expression levels and enzyme activity levels depending on the average body weight change (AWC) was evaluated using the nonparametric Spearman’s correlation analyses. Correlation compatibility and the direction of correlation were expressed by calculating the p and r values, respectively. Statistically significant differences were represented in the following way: nsP>0.05 (not significant); *P<0.05 (significant); **P<0.01 (very significant); ***P<0.001 and ****P<0.0001 (extremely significant).
3. Results
3.1. Effects of different diet combinations on quantitative hepatic metabolite levels
MDA is an important marker showing the level of lipid peroxidation in a cell. Therefore, investigation of MDA level is important to obtain data on various problems such as cellular oxidative stress, toxicity, and cancer [26]. Different combinations of diets were applied to male rats at the developmental period for 5 weeks, and the primary effects on the hepatic antioxidant system before obesity were investigated. Quantitative cellular malondialdehyde (MDA) concentrations and Foxo1 mRNA expression levels were investigated. Accordingly, the CAF diet significantly increased MDA levels and with SCD Probiotics, a dramatic reduction to lower than control group was observed. In addition, the MDA level of Prob group was detected as relatively lower than control group. A relative decrease in Foxo1 gene expression was observed with the CAF diet, and SCD probiotic supplementation failed to regulate this effect (Figure 1A).
Reduced glutathione (GSH) and oxidized glutathione (GSSG), which are determinants of cellular redox status, are important metabolites to maintain the reduced environment in a cell. Based on the importance of the reduced environment, GSH generation is the cell’s primary choice to maintain the cellular glutathione pool. Therefore, the cellular glutathione system regulates GSH and GSSG levels, and the firmly regulation of GSH/GSSG ratio is essential to keep the antioxidant system in balance. Deviations in cellular GSH concentration and GSH/GSSG ratio are associated with oxidative stress and cancer [26]. For this reason, the effects of different diets combinations on GSH and GSSG concentrations were investigated. Strikingly, statistically significant increases were observed in the GSH and GSSG levels and the GSH/GSSG ratio in the CAF group (Figure 2A, 2B, and 2C, respectively). While the GSH level of the combined diet group was decreased with the SCD Probiotics supplementation, the GSH level was increased when SCD Probiotics applied alone (Figure 2A). Ultimately, all metabolite levels were increased in CAF group and SCD Probiotics supplementation fully reversed the effect of CAF diet. SCD Probiotics showed a more pronounced effect in the combined diet compared to administration alone.
3.2. Effect of diet practices on hepatic antioxidant gene expressions
The alterations occurred by dietary practices in gene expressions of the hepatic antioxidant system were measured by quantitative real-time PCR (qPCR). Despite the increase in Gst gene expression, statistically significant decreases were observed in other gene expressions (Figure 3). The gene expression levels of Cat, Gpx, and Gr were relatively reversed by SCD Probiotics in the combined diet group (Figure 3B, 3C and 3D, respectively). However, reregulated gene expressions were insufficient in the combined diet group compared to controls. Except for the increase in Cat mRNA expression, statistically significant change was not observed when SCD Probiotics was applied alone (Figure 3).
3.3. The effect of dietary practices on the enzyme activities of hepatic antioxidant system
Enzyme activities of the hepatic antioxidant system members localized in the cytoplasm including SOD, CAT, GPx, GR, and GST were spectrophotometrically measured in control and experimental groups. Except for GR activity, other enzyme activity results were found to be largely compatible with gene expression results (Figure 4). In contrast to the significant increases in GR and GST activities (Figure 4D,E), significant decreases in SOD, CAT and GPx activities were recorded in the CAF groups (Figure 4A, 4B and 4C). Except for GST activity, the activities of the other proteins were relatively regulated with the SCD Probiotics in combined diet groups. However, the regulation seems to be insufficient compared to the controls. Strikingly, a dramatic decrease to lower level than the control group was observed in the GST enzyme activity (Figure 4E). When SCD Probiotics was applied alone, the activities of CAT and GPx increased significantly, but there was no significant change in SOD, GR, and GST activities (Figure 4).
3.4. Correlation of hepatic antioxidant system based on AWC
The comparative interpretation of gene expressions and enzyme activities is required to better understand the indirect relationship between weight gain and HCC. To this end, the correlations of up or down changes in the gene expressions and enzyme activities based on weight gain were analyzed by nonparametric Spearman’s correlation test. The strength and direction of correlation were displayed by calculating p and r values. r value close to -1 and +1 indicate the presence of negative and positive correlation, respectively. Except for Gst, inverse correlation based on AWC was observed with the decreases in other gene expressions. In addition, less significant correlations were observed in the combined diet group. Administration of SCD Probiotics alone resulted in positive correlation due to the increases in some enzyme activities, or insignificant correlations (Figure 5).
3.5. Identification of LIHC prevalence based on the obesity
The CAF diet is an unhealthy diet that includes fried, processed food, and fast food. For this reason, it promotes more rapid weight gain than traditional diets and is widely used to create the animal model with obesity [1,7]. It is well known that there is a relationship between obesity and cancer. Therefore, the expression profiles of the antioxidant system were defined in healthy and liver hepatocellular carcinoma (LIHC) using the GEPIA and the UALCAN databases [24,25]. According to this, the decreases in Foxo1 and Cat gene expressions and the increases in the other gene expressions were identified in LIHC. The decreases in the protein expressions of all hepatic antioxidant system were identified in GEPIA and UALCAN databases. The results of current study were evaluated based on the data provided from GEPIA and UALCAN databases (Figure 6).
3.6. Identification of LIHC prevalence based on patient weight
The gene expression profile of hepatic antioxidant system in LIHC associated with patient weight was established with the UALCAN database [25]. Except for Gpx and Gr, general decreases in the expression levels of other genes were identified using UALCAN database (Figure 7). In the current study, the effects of dietary practices on hepatic antioxidant system were investigated in male rats at developmental period. To interpret the effects of dietary practices more clearly, the results of present study were compared with database data. Accordingly, except for the expression levels of Gpx and Gst, a great deal of similarity was observed in other gene expression changes.
4. Discussion
The effects of dietary practices, including cafeteria (CAF) diet and SCD Probiotics, on the hepatic antioxidant system of rats at the developmental period were investigated. In the current research, some metabolite levels, the gene expressions, and the enzyme activities were determined in the liver of rats at developmental period. CAF diet was observed to cause varying statistically significant increases in metabolite levels (MDA, GSH and GSSG), and SCD Probiotics largely reversed the effect of CAF. MDA and GSH are the markers of lipid peroxidation and cancerization based on oxidative stress, respectively [26,27]. The removing of lipid peroxidation caused by CAF with the aggressive response of SCD Probiotics, and the reduction of MDA level with the administration of SCD Probiotics alone were shown (Figure 1B). According to the current study, CAF diet may be a peroxidation agent and SCD Probiotics may be a good peroxidation suppressant or regulator.
GSH production is the cell’s primary choice to support the cellular glutathione pool and to maintain the redox balance by keeping the reduced environment [28,29]. The alterations in cellular GSH and GSH/GSSG ratio are also associated with the presence of oxidative stress and the cancerization process [26]. Previous studies report that the elevated GSH level usually provides the resistance to oxidative stress by increasing antioxidant capacity and is observed in some cancer types [27]. The elevations in GSH, GSSG, and GSH/GSSG ratio in the current study may be evidence of this (Figure 2A, 2B, and 2C, respectively). That is, the reason for the increase in GSH level may be a response to prevent the possibility of HCC based on obesity by removing the effects caused by CAF. The increase in the MDA caused by CAF supports this idea. The effect of CAF diet was eliminated by the addition of SCD Probiotics, and GSH pool seems to be supported when SCD Probiotics applied alone. The elevation of GSH may also be a response to reduce the MDA concentration occurred by CAF.
CAF diet is a robust and reliable diet to induce obesity in animals [4]. and HCC risk is known to increase in obesity [30,31]. [30] emphasized that the expression levels of total 33 genes changes in obesity and HCC, and a series of gene, including Foxo, are associated with each other. Foxo1 is known to contribute the apoptosis by inducing apoptosis markers and apoptosis is a blocker of cancerization process [30]. Foxo1 expression has also been reported to be decreased in HCC [32]. Therefore, the effects of dietary practices on Foxo1 expression were investigated in the present study, and CAF diet was observed to cause reduction in Foxo1 expression (Figure 1A). Upward or downward changes in Sod and Cat expressions have been reported depending on the cancer type [33,34]. For this reason, the effects of dietary practices on hepatic antioxidant system genes were investigated and statistically significant decreases were observed in Sod and Cat expressions of CAF group (Figure 3A and 3B, respectively). According to the present research, CAF diet may increase the potential for cancer formation in the livers of rat at developmental period. SCD Probiotics supplementation had no significant effect of Foxo1 but were able to relatively reverse the expressions of Sod and Cat (Figure 1A, and Figure 3A and 3B, respectively). Significant reductions in Gpx and Gr expressions and a relative increase in Gst expression were observed in CAF group (Figure 3C,D,E). With the addition of SCD Probiotics, the effect of CAF diet was fully removed, but the expressions of Gpx and Gst were reregulated relatively. When SCD Probiotics was applied alone, the gene expressions of hepatic antioxidant system were not affected. The reductions in antioxidant protein expressions based on oxidative stress are emphasized in previous studies [35,36]. The overall reduction of hepatic antioxidant system gene expressions in CAF group may be evidence of cancerization induced by CAF diet. According to the current study, SCD Probiotics can also be a blocker of cancerization process.
The effects of diet practices on hepatic antioxidant system enzyme activities were also investigated in present study. Significant elevations in the activities of GR and GST, and statistically significant reductions in the other enzyme activities were observed in the CAF groups. With the SCD Probiotics supplementation, the activities of all antioxidants were reregulated at different rates. That is, the new regulation was fully realized in GST activity, but the other enzyme activities were relatively reregulated. When SCD Probiotics was applied alone, SOD, GR and GST activities were not affected, but CAT and GPx activities increased (Figure 4). Despite the aggressive response of SCD Probiotics to CAF diet, its benign behavior is remarkable when applied alone. This may be due to the regulatory effects of postbiotic metabolites in SCD Probiotics content. It was also supported by kinetic activity studies that CAF diet could be a peroxidation producer and SCD Probiotics could be a peroxidation scavenger.
To better evaluate the effects of dietary practices on hepatic antioxidant system, the changes in human hepatic antioxidant system gene and protein expressions based on HCC were identified using GEPIA and UALCAN databases, respectively (Figure 6). GEPIA database shows that Foxo1 and Cat expressions increased, and the other gene expressions decreased in LIHC. The expression changes of Cat, Gst and Foxo1 observed in current study are in line with the results of GEPIA. It is also clear from the UALCAN database that hepatic antioxidant system protein expressions decreased in HCC. The activity results of SOD, CAT, and GPx in the current study support the UALCAN data.
Because of the role of CAF diet on obesity, human hepatic antioxidant gene expressions in LIHC based on patient’s weight were identified using the UALCAN database [25]. It is clear from the UALCAN data that the increases in Gpx and Gr expressions, and the decreases in the other gene expressions were defined in patients with LIHC depend on body weight (Figure 7). Interestingly, the decreases in Gpx and Gr expressions were detected in the results of current study. This may be a genetic primary response, or the change before the formation of HCC in the liver of rat at developmental period.
To monitor the gradual regulation of hepatic antioxidant system, the correlation graph based on average weight change (AWC) were designed (Figure 5). High parallelism in the gene expression and enzyme activities of the hepatic antioxidant system was observed in CAF group. The natural regulation that occurs at the genetic level is essential for the continuation of a cell’s optimal life against cancer and various neurodegenerative diseases. The changes in gene expressions by a factor as endogenous or exogenous may affect the regulation of cellular metabolic reactions through posttranslational modifications. In that case, the reductions in SOD and CAT activities observed in the current study carry the possibility of HCC formation. However, the regulations observed in GPX and GR activities support the production of GSH and is consistent with metabolite results (Figure 4 and Figure 2A, respectively). Also, the elevation in the GST activity may be a sign of possible toxicity based on the CAF diet. In other words, alterations in GR, GPX, and GST activities may be a new regulation to remove the effects of CAF diet.
In conclusion, CAF diet led to the decreases in hepatic antioxidant system expressions, except for GST expressions and GR activity. It is well known that the expressions of Foxo1, Sod, and Cat are decreased in HCC. UALCAN database shows that the expressions of Foxo1, Sod, Cat, and Gst were decreased in LIHC depend on body weight. According to this, the reductions in Foxo1, Sod, and Cat expressions of current research may be the first barrier affected before HCC formation and CAF diet may be responsible for primary changes before HCC formation by decreasing Foxo1, Sod, and Cat gene expressions. However, the regulation supporting the production of GSH may be a resistance to HCC formation in the hepatic antioxidant system of rats at developmental period. The results observed in kinetic enzyme activities support this idea more clearly. Regardless of metabolic regulation, SCD Probiotics supplementation relatively reduced the damages of CAF overall but did not fully restore it. It is noteworthy that SCD probiotic supplementation alone has a relative beneficial effect and regulatory role on both gene expressions and enzyme activities.
Highlights
CAF diet has the potential to form Hepatocellular Carcinoma (HCC) by affecting the expressions of Foxo1, Sod, and Cat in the juvenile rats.
SCD Probiotics can eliminate the effects of CAF diet at different rates, independent of the metabolic response.
According to the database and current study, the reductions in Foxo1, Sod, and Cat expressions may be first barrier affected before HCC induced by weight gain.
Hepatic glutathione system may have response to the effect of CAF diet by promoting GSH production in the juvenile rat livers at developmental period.
SCD Probiotics did not generally affect the hepatic antioxidant system when applied alone. This may be related to the regulatory effects of probiotics.
Author Contributions
Author abbreviations are as follows; Enver Fehim Koçpınar (E.F.K), Nurdan Aba (N.A), and Taha Ceylani (T.C). The authors’ responsibilities were as follows T.C.: Animal design and separation into groups, Animal care and nutritional application to animals; E.F.K. and N.A.: performing tests in the study, statistical analysis, and interpreting the results; T.C., N.A., and E.F.K.: checking the manuscript and making necessary updates. All authors have read and agreed to the published version of the manuscript.
Funding
This research received no external funding.
Informed Consent Statement
Not applicable.
Data Availability Statement
Not applicable.
Conflicts of Interest
The authors declare no conflict of interest.
References
- Lalanza, J.F.; Snoeren, E.M.S. The cafeteria diet: A standardized protocol and its effects on behavior. Neurosci Biobehav Rev 2021, 122, 92–119. [Google Scholar] [CrossRef]
- La Russa, D.; Giordano, F.; Marrone, A.; Parafati, M.; Janda, E.; Pellegrino, D. Oxidative Imbalance and Kidney Damage in Cafeteria Diet-Induced Rat Model of Metabolic Syndrome: Effect of Bergamot Polyphenolic Fraction. Antioxidants (Basel) 2019, 8. [Google Scholar] [CrossRef]
- Buyukdere, Y.; Gulec, A.; Akyol, A. Cafeteria diet increased adiposity in comparison to high fat diet in young male rats. PeerJ 2019, 7, e6656. [Google Scholar] [CrossRef]
- Subias-Gusils, A.; Boque, N.; Caimari, A.; Del Bas, J.M.; Marine-Casado, R.; Solanas, M.; Escorihuela, R.M. A restricted cafeteria diet ameliorates biometric and metabolic profile in a rat diet-induced obesity model. Int J Food Sci Nutr 2021, 72, 767–780. [Google Scholar] [CrossRef]
- de Oliveira, F.A.; Costa, W.S.; FJ, B.S.; Gregorio, B.M. Resveratrol attenuates metabolic, sperm, and testicular changes in adult Wistar rats fed a diet rich in lipids and simple carbohydrates. Asian journal of andrology 2019, 21, 201–207. [Google Scholar] [CrossRef]
- Lang, P.; Hasselwander, S.; Li, H.; Xia, N. Effects of different diets used in diet-induced obesity models on insulin resistance and vascular dysfunction in C57BL/6 mice. Sci Rep 2019, 9, 19556. [Google Scholar] [CrossRef]
- Bortolin, R.; Vargas, A.; Gasparotto, J.; Chaves, P.; Schnorr, C.E.; Martinello, K.B.; Silveira, A.; Rabelo, T.K.; Gelain, D.; Moreira, J. A new animal diet based on human Western diet is a robust diet-induced obesity model: comparison to high-fat and cafeteria diets in term of metabolic and gut microbiota disruption. International Journal of Obesity 2018, 42, 525–534. [Google Scholar] [CrossRef]
- Gual-Grau, A.; Guirro, M.; Mayneris-Perxachs, J.; Arola, L.; Boque, N. Impact of different hypercaloric diets on obesity features in rats: a metagenomics and metabolomics integrative approach. J Nutr Biochem 2019, 71, 122–131. [Google Scholar] [CrossRef]
- Crew, R.C.; Waddell, B.J.; Mark, P.J. Maternal obesity induced by a ‘cafeteria’diet in the rat does not increase inflammation in maternal, placental or fetal tissues in late gestation. Placenta 2016, 39, 33–40. [Google Scholar] [CrossRef]
- do Bonfim, T.H.F.; Tavares, R.L.; de Vasconcelos, M.H.A.; Gouveia, M.; Nunes, P.C.; Soares, N.L.; Alves, R.C.; de Carvalho, J.L.P.; Alves, A.F.; de Alencar Pereira, R. Potentially obesogenic diets alter metabolic and neurobehavioural parameters in Wistar rats: A comparison between two dietary models. Journal of Affective Disorders 2021, 279, 451–461. [Google Scholar] [CrossRef]
- Gil-Cardoso, K.; Gines, I.; Pinent, M.; Ardevol, A.; Terra, X.; Blay, M. A cafeteria diet triggers intestinal inflammation and oxidative stress in obese rats. The British journal of nutrition 2017, 117, 218–229. [Google Scholar] [CrossRef] [PubMed]
- Beilharz, J.; Kaakoush, N.; Maniam, J.; Morris, M. Cafeteria diet and probiotic therapy: cross talk among memory, neuroplasticity, serotonin receptors and gut microbiota in the rat. Molecular psychiatry 2018, 23, 351–361. [Google Scholar] [CrossRef]
- Rajoka, M.; Thirumdas, R.; Mehwish, H.; Umair, M.; Khurshid, M.; Hayat, H.; Phimolsiripol, Y.; Pallarés, N.; Martí-Quijal, F. Role of Food Antioxidants in Modulating Gut Microbial Com-Munities: Novel Understandings in Intestinal Oxidative Stress Damage and Their Impact on Host Health. food science and nutrition 2019, 59, 1927–1936. [Google Scholar]
- Alan, Y.; Savcı, A.; Koçpınar, E.F.; Ertaş, M. Postbiotic metabolites, antioxidant and anticancer activities of probiotic Leuconostoc pseudomesenteroides strains in natural pickles. Archives of Microbiology 2022, 204, 571. [Google Scholar] [CrossRef] [PubMed]
- Ceylani, T. Effect of SCD probiotics supplemented with tauroursodeoxycholic acid (TUDCA) application on the aged rat gut microbiota composition. J Appl Microbiol 2023, 134. [Google Scholar] [CrossRef]
- Sonmez Aydin, F.; Hukkamli, B.; Budak, H. Coaction of hepatic thioredoxin and glutathione systems in iron overload-induced oxidative stress. J Biochem Mol Toxicol 2021, 35, e22704. [Google Scholar] [CrossRef]
- Ohkawa, H.; Ohishi, N.; Yagi, K. Assay for lipid peroxides in animal tissues by thiobarbituric acid reaction. Anal Biochem 1979, 95, 351–358. [Google Scholar] [CrossRef]
- Livak, K.J.; Schmittgen, T.D. Analysis of relative gene expression data using real-time quantitative PCR and the 2(-Delta Delta C(T)) Method. Methods 2001, 25, 402–408. [Google Scholar] [CrossRef]
- Bradford, M.M. A rapid and sensitive method for the quantitation of microgram quantities of protein utilizing the principle of protein-dye binding. Anal Biochem 1976, 72, 248–254. [Google Scholar] [CrossRef]
- Aebi, H. Catalase in vitro. Methods in enzymology 1984, 105, 121–126. [Google Scholar] [CrossRef]
- Sun, Y.; Oberley, L.W.; Li, Y. A simple method for clinical assay of superoxide dismutase. Clinical chemistry 1988, 34, 497–500. [Google Scholar] [CrossRef] [PubMed]
- Carlberg, I.; Mannervik, B. Glutathione reductase. Methods in enzymology 1985, 113, 484–490. [Google Scholar] [CrossRef] [PubMed]
- Habig, W.H.; Pabst, M.J.; Jakoby, W.B. Glutathione S-transferases. The first enzymatic step in mercapturic acid formation. The Journal of biological chemistry 1974, 249, 7130–7139. [Google Scholar] [CrossRef] [PubMed]
- Tang, Z.; Kang, B.; Li, C.; Chen, T.; Zhang, Z. GEPIA2: an enhanced web server for large-scale expression profiling and interactive analysis. Nucleic acids research 2019, 47, W556–W560. [Google Scholar] [CrossRef]
- Chandrashekar, D.S.; Bashel, B.; Balasubramanya, S.A.H.; Creighton, C.J.; Ponce-Rodriguez, I.; Chakravarthi, B.; Varambally, S. UALCAN: A Portal for Facilitating Tumor Subgroup Gene Expression and Survival Analyses. Neoplasia 2017, 19, 649–658. [Google Scholar] [CrossRef]
- Kocpinar, E.F.; Baltaci, N.G.; Akkemik, E.; Budak, H. Depletion of Tip60/Kat5 affects the hepatic antioxidant system in mice. J Cell Biochem 2023, 124, 103–117. [Google Scholar] [CrossRef]
- Dequanter, D.; Dok, R.; Nuyts, S. Basal oxidative stress ratio of head and neck squamous cell carcinomas correlates with nodal metastatic spread in patients under therapy. Onco Targets Ther 2017, 10, 259–263. [Google Scholar] [CrossRef]
- Alkazemi, D.; Rahman, A.; Habra, B. Alterations in glutathione redox homeostasis among adolescents with obesity and anemia. Scientific Reports 2021, 11, 3034. [Google Scholar] [CrossRef]
- Wang, Y.; Yen, F.S.; Zhu, X.G.; Timson, R.C.; Weber, R.; Xing, C.; Liu, Y.; Allwein, B.; Luo, H.; Yeh, H.W.; et al. SLC25A39 is necessary for mitochondrial glutathione import in mammalian cells. Nature 2021, 599, 136–140. [Google Scholar] [CrossRef]
- Ceylan, H. Identification of hub genes associated with obesity-induced hepatocellular carcinoma risk based on integrated bioinformatics analysis. Medical Oncology 2021, 38, 63. [Google Scholar] [CrossRef]
- Brahma, M.K.; Gilglioni, E.H.; Zhou, L.; Trépo, E.; Chen, P.; Gurzov, E.N. Oxidative stress in obesity-associated hepatocellular carcinoma: Sources, signaling and therapeutic challenges. Oncogene 2021, 40, 5155–5167. [Google Scholar] [CrossRef] [PubMed]
- Wang, S.; Song, Z.; Tan, B.; Zhang, J.; Zhang, J.; Liu, S. Identification and Validation of Hub Genes Associated With Hepatocellular Carcinoma Via Integrated Bioinformatics Analysis. Frontiers in oncology 2021, 11, 614531. [Google Scholar] [CrossRef] [PubMed]
- Galasso, M.; Gambino, S.; Romanelli, M.G.; Donadelli, M.; Scupoli, M.T. Browsing the oldest antioxidant enzyme: catalase and its multiple regulation in cancer. Free radical biology & medicine 2021, 172, 264–272. [Google Scholar] [CrossRef]
- Zhang, Y.; Zhang, Y.; Wang, S.; Li, Q.; Cao, B.; Huang, B.; Wang, T.; Guo, R.; Liu, N. SP1-induced lncRNA ZFPM2 antisense RNA 1 (ZFPM2-AS1) aggravates glioma progression via the miR-515-5p/Superoxide dismutase 2 (SOD2) axis. Bioengineered 2021, 12, 2299–2310. [Google Scholar] [CrossRef] [PubMed]
- El-Benhawy, S.A.; Morsi, M.I.; El-Tahan, R.A.; Matar, N.A.; Ehmaida, H.M. Radioprotective Effect of Thymoquinone in X-irradiated Rats. Asian Pacific journal of cancer prevention : APJCP 2021, 22, 3005–3015. [Google Scholar] [CrossRef]
- Umar Ijaz, M.; Rauf, A.; Mustafa, S.; Ahmed, H.; Ashraf, A.; Al-Ghanim, K.; Swamy Mruthinti, S.; Mahboob, S. Pachypodol attenuates Perfluorooctane sulphonate-induced testicular damage by reducing oxidative stress. Saudi J Biol Sci 2022, 29, 1380–1385. [Google Scholar] [CrossRef]
Figure 1.
Hepatic malondialdehyde (MDA) level and relative mRNA expression of Foxo1 in control and experimental groups. (A) Relative mRNA expression level of hepatic Foxo1. (B) MDA levels of control and experimental groups. All data are shown as Mean ± SEM; P values are derived using Tukey’s Multiple Comparisons Test of One-way ANOVA. Statistically significant differences were indicated in following way: nsP > 0.05 (not significant); *P < 0.05 (significant); **P < 0.01 (very significant); ***P < 0.001 and lower values (extremely significant).
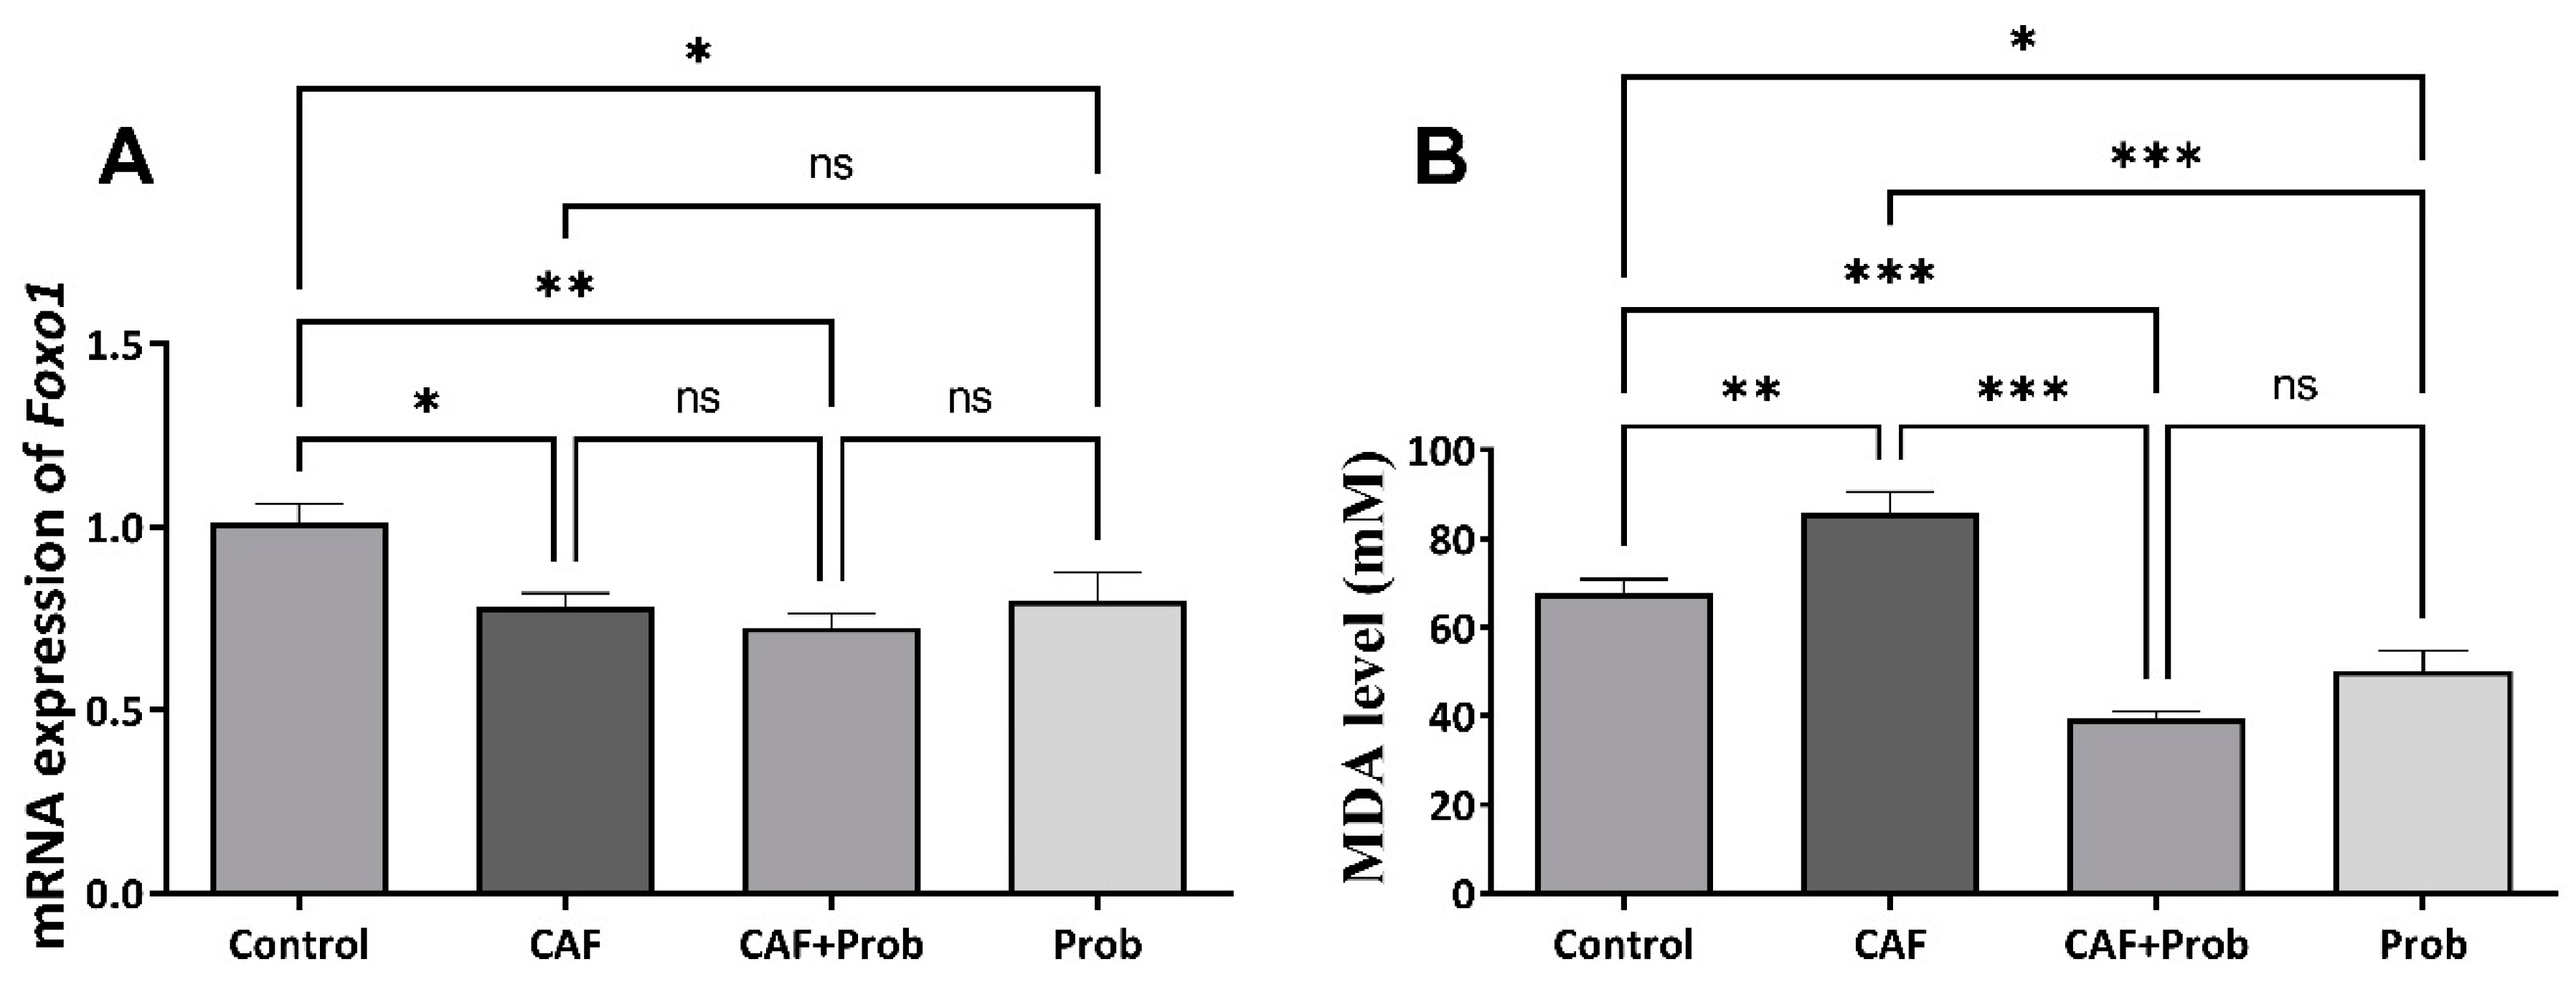
Figure 2.
Hepatic metabolite levels and statistical evaluation of the results. (A) Reduced glutathione (GSH) level. (B) Oxidized glutathione (GSSG) level. (C) Ratio of reduced glutathione to oxidized glutathione (GSH/GSSG). All data are shown as Mean ± SEM; p values are derived using Tukey’s Multiple Comparisons Test of One-way ANOVA. Statistically significant differences were indicated in following way: nsP > 0.05 (not significant); *P < 0.05 (significant); **P < 0.01 (very significant); ***P < 0.001 and lower values (extremely significant).
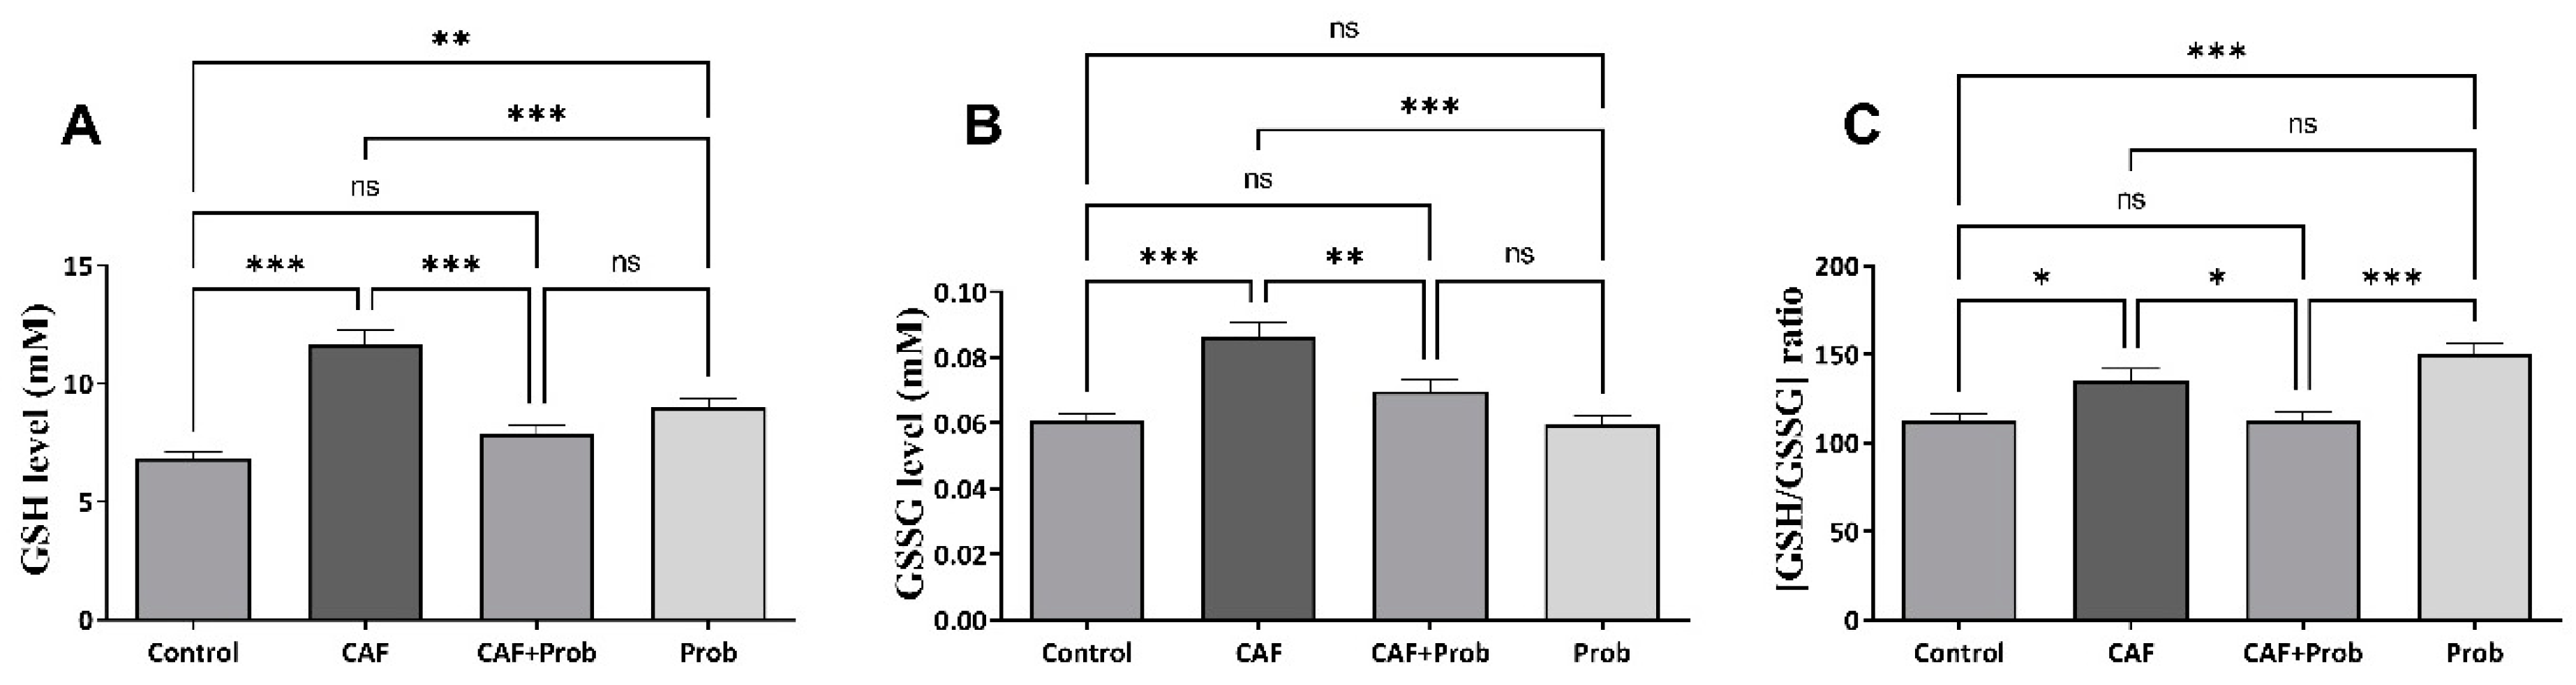
Figure 3.
Relative mRNA expression levels of the hepatic antioxidant system genes. mRNA, messenger RNA; Sod, superoxide dismutase; Cat, catalase; Gpx, Glutathione peroxidase; Gr, Glutathione reductase; and Gst, Glutathione S-transferase. (A) mRNA expression levels of Sod, (B) mRNA expression levels of Cat, (C) mRNA expression levels of Gpx, (D) mRNA expression levels of Gr, and (E) mRNA expression levels of Gst. All data are shown as Mean ± SEM; P values are derived using Tukey’s Multiple Comparisons Test of One-way ANOVA. Statistically significant differences were indicated in following way: nsP > 0.05 (not significant); *P < 0.05 (significant); **P < 0.01 (very significant); ***P < 0.001 and lower values (extremely significant).
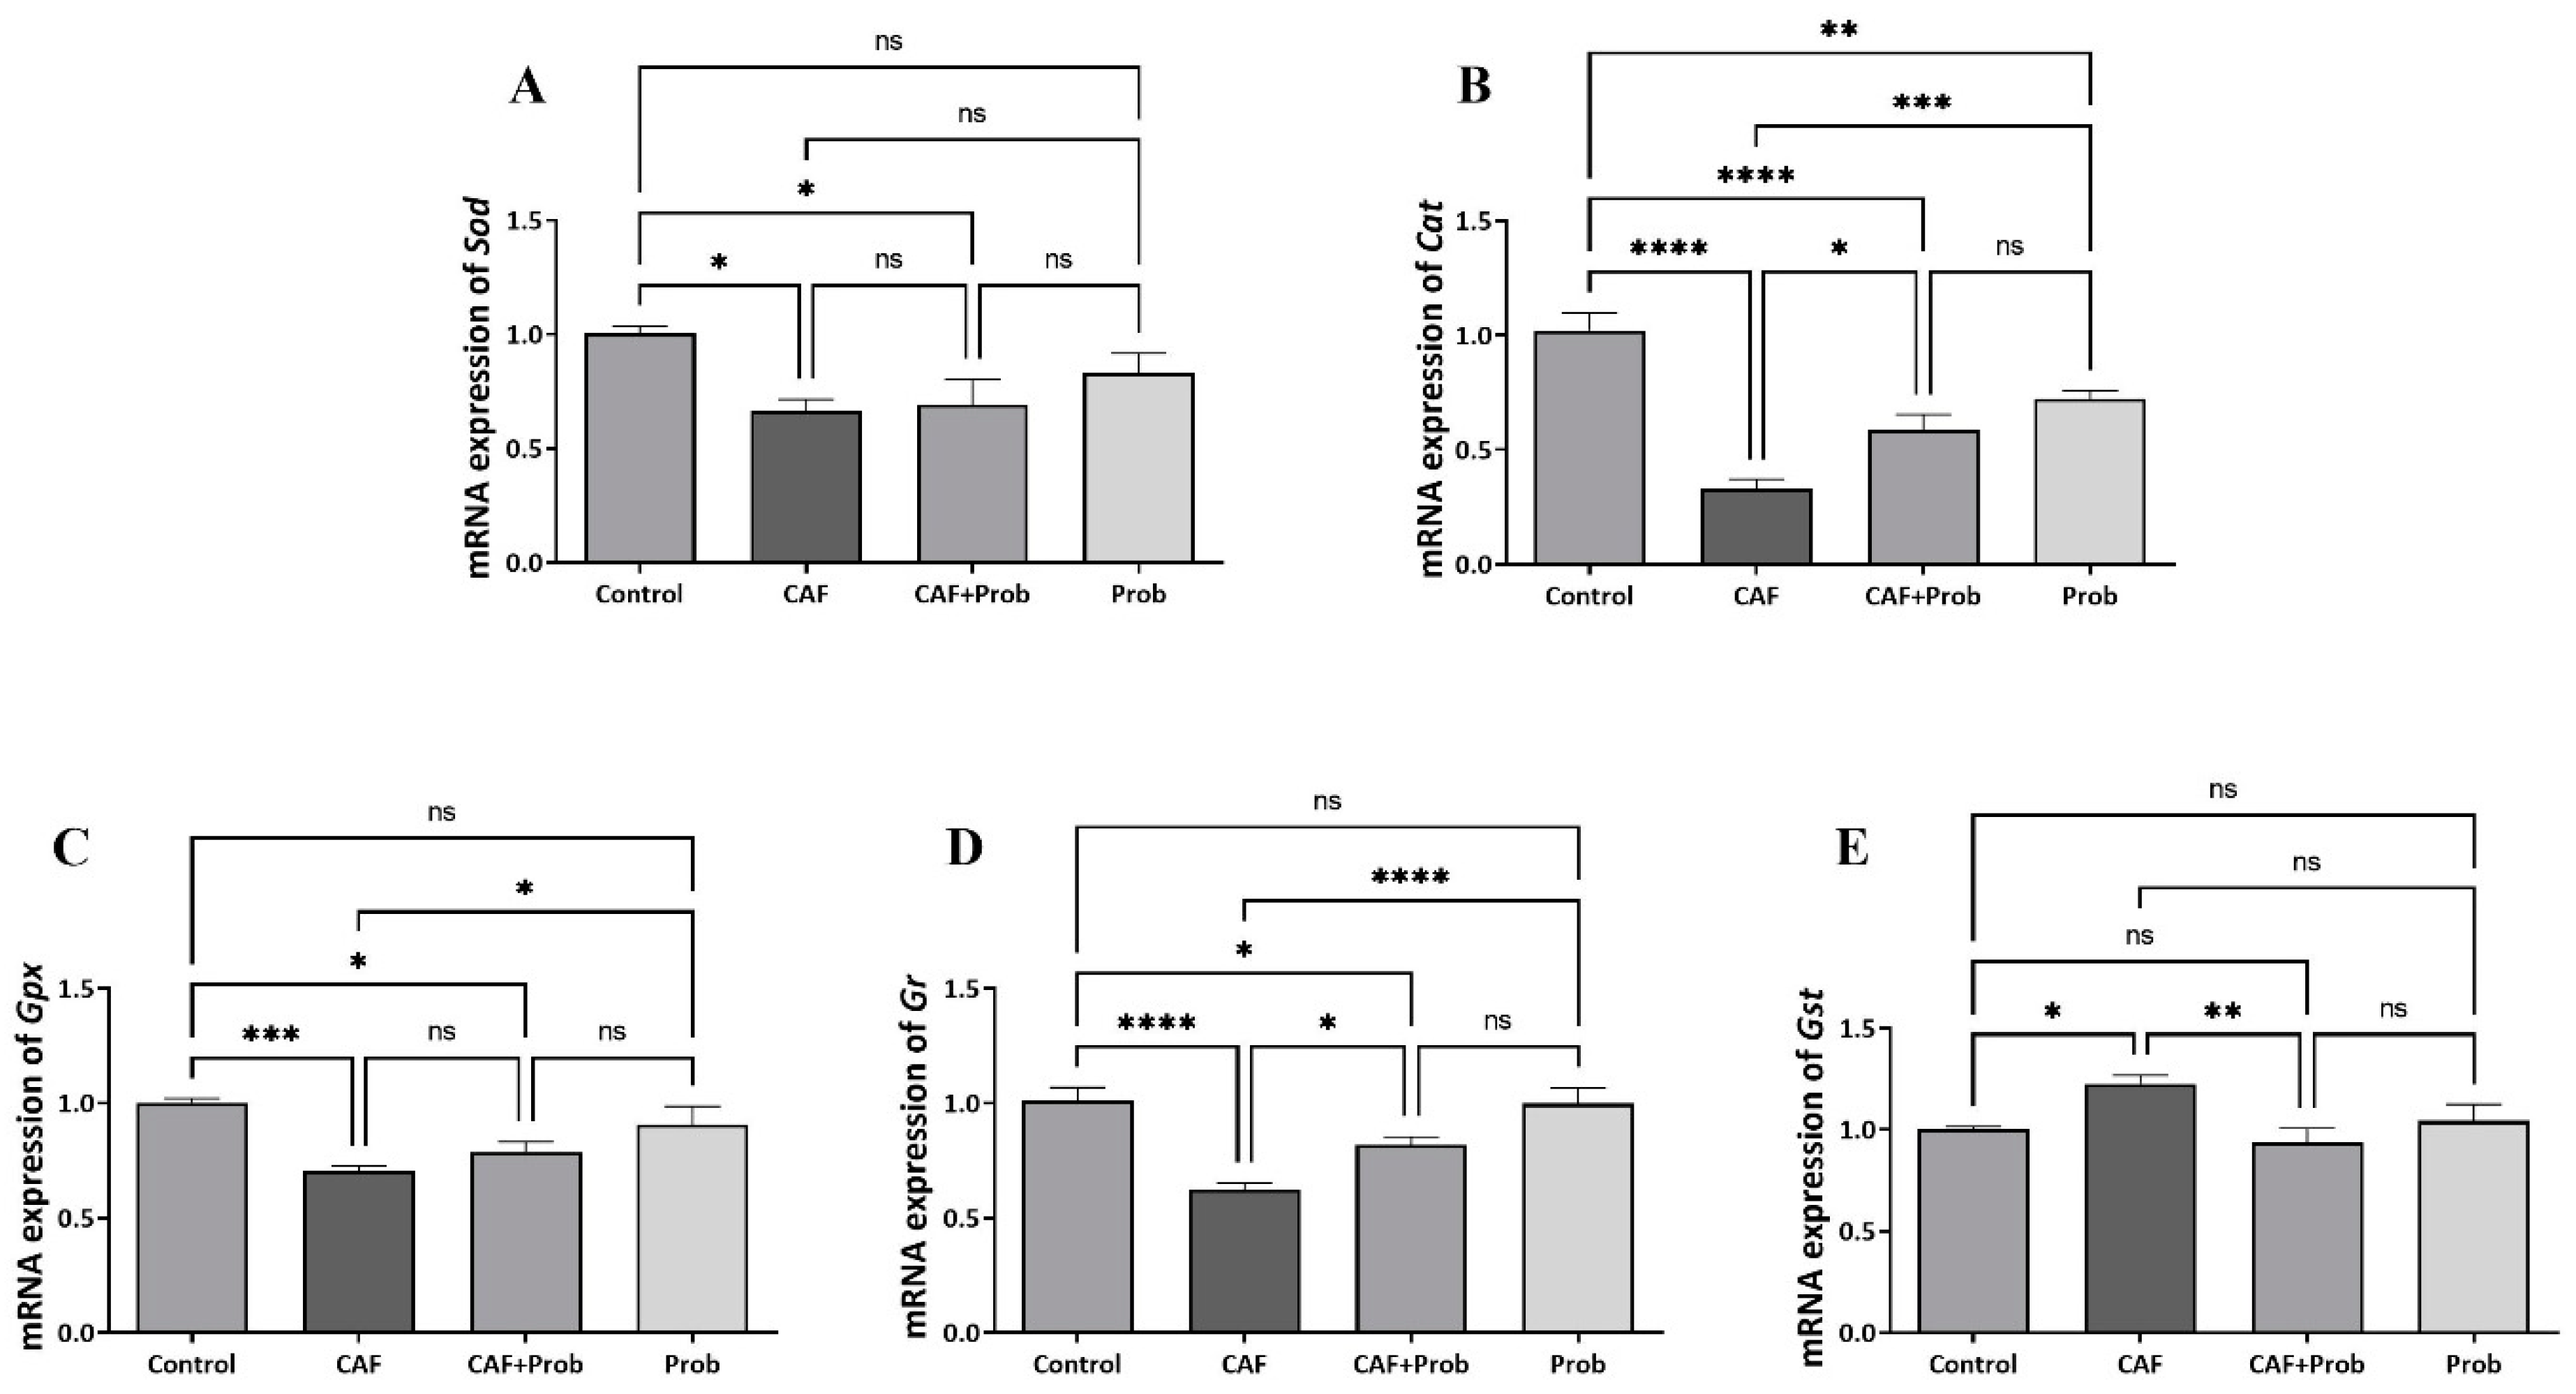
Figure 4.
Kinetic enzyme activity results of hepatic antioxidant system. (A) Specific enzymatic activity of SOD, (B) Specific enzymatic activity of CAT, (C) Specific enzymatic activity of GPx, (D) Specific enzymatic activity of GR, and (E) Specific enzymatic activity of GST. SOD, superoxide dismutase; CAT, catalase; GPx, glutathione peroxidase; GR, glutathione reductase; and GST, glutathione S-transferase. All data are shown as Mean ± SEM; P values are derived using Tukey’s Multiple Comparisons Test of One-way ANOVA. Statistically significant differences were indicated in following way: nsP > 0.05 (not significant); *P < 0.05 (significant); **P < 0.01 (very significant); ***P < 0.001 and lower values (extremely significant).
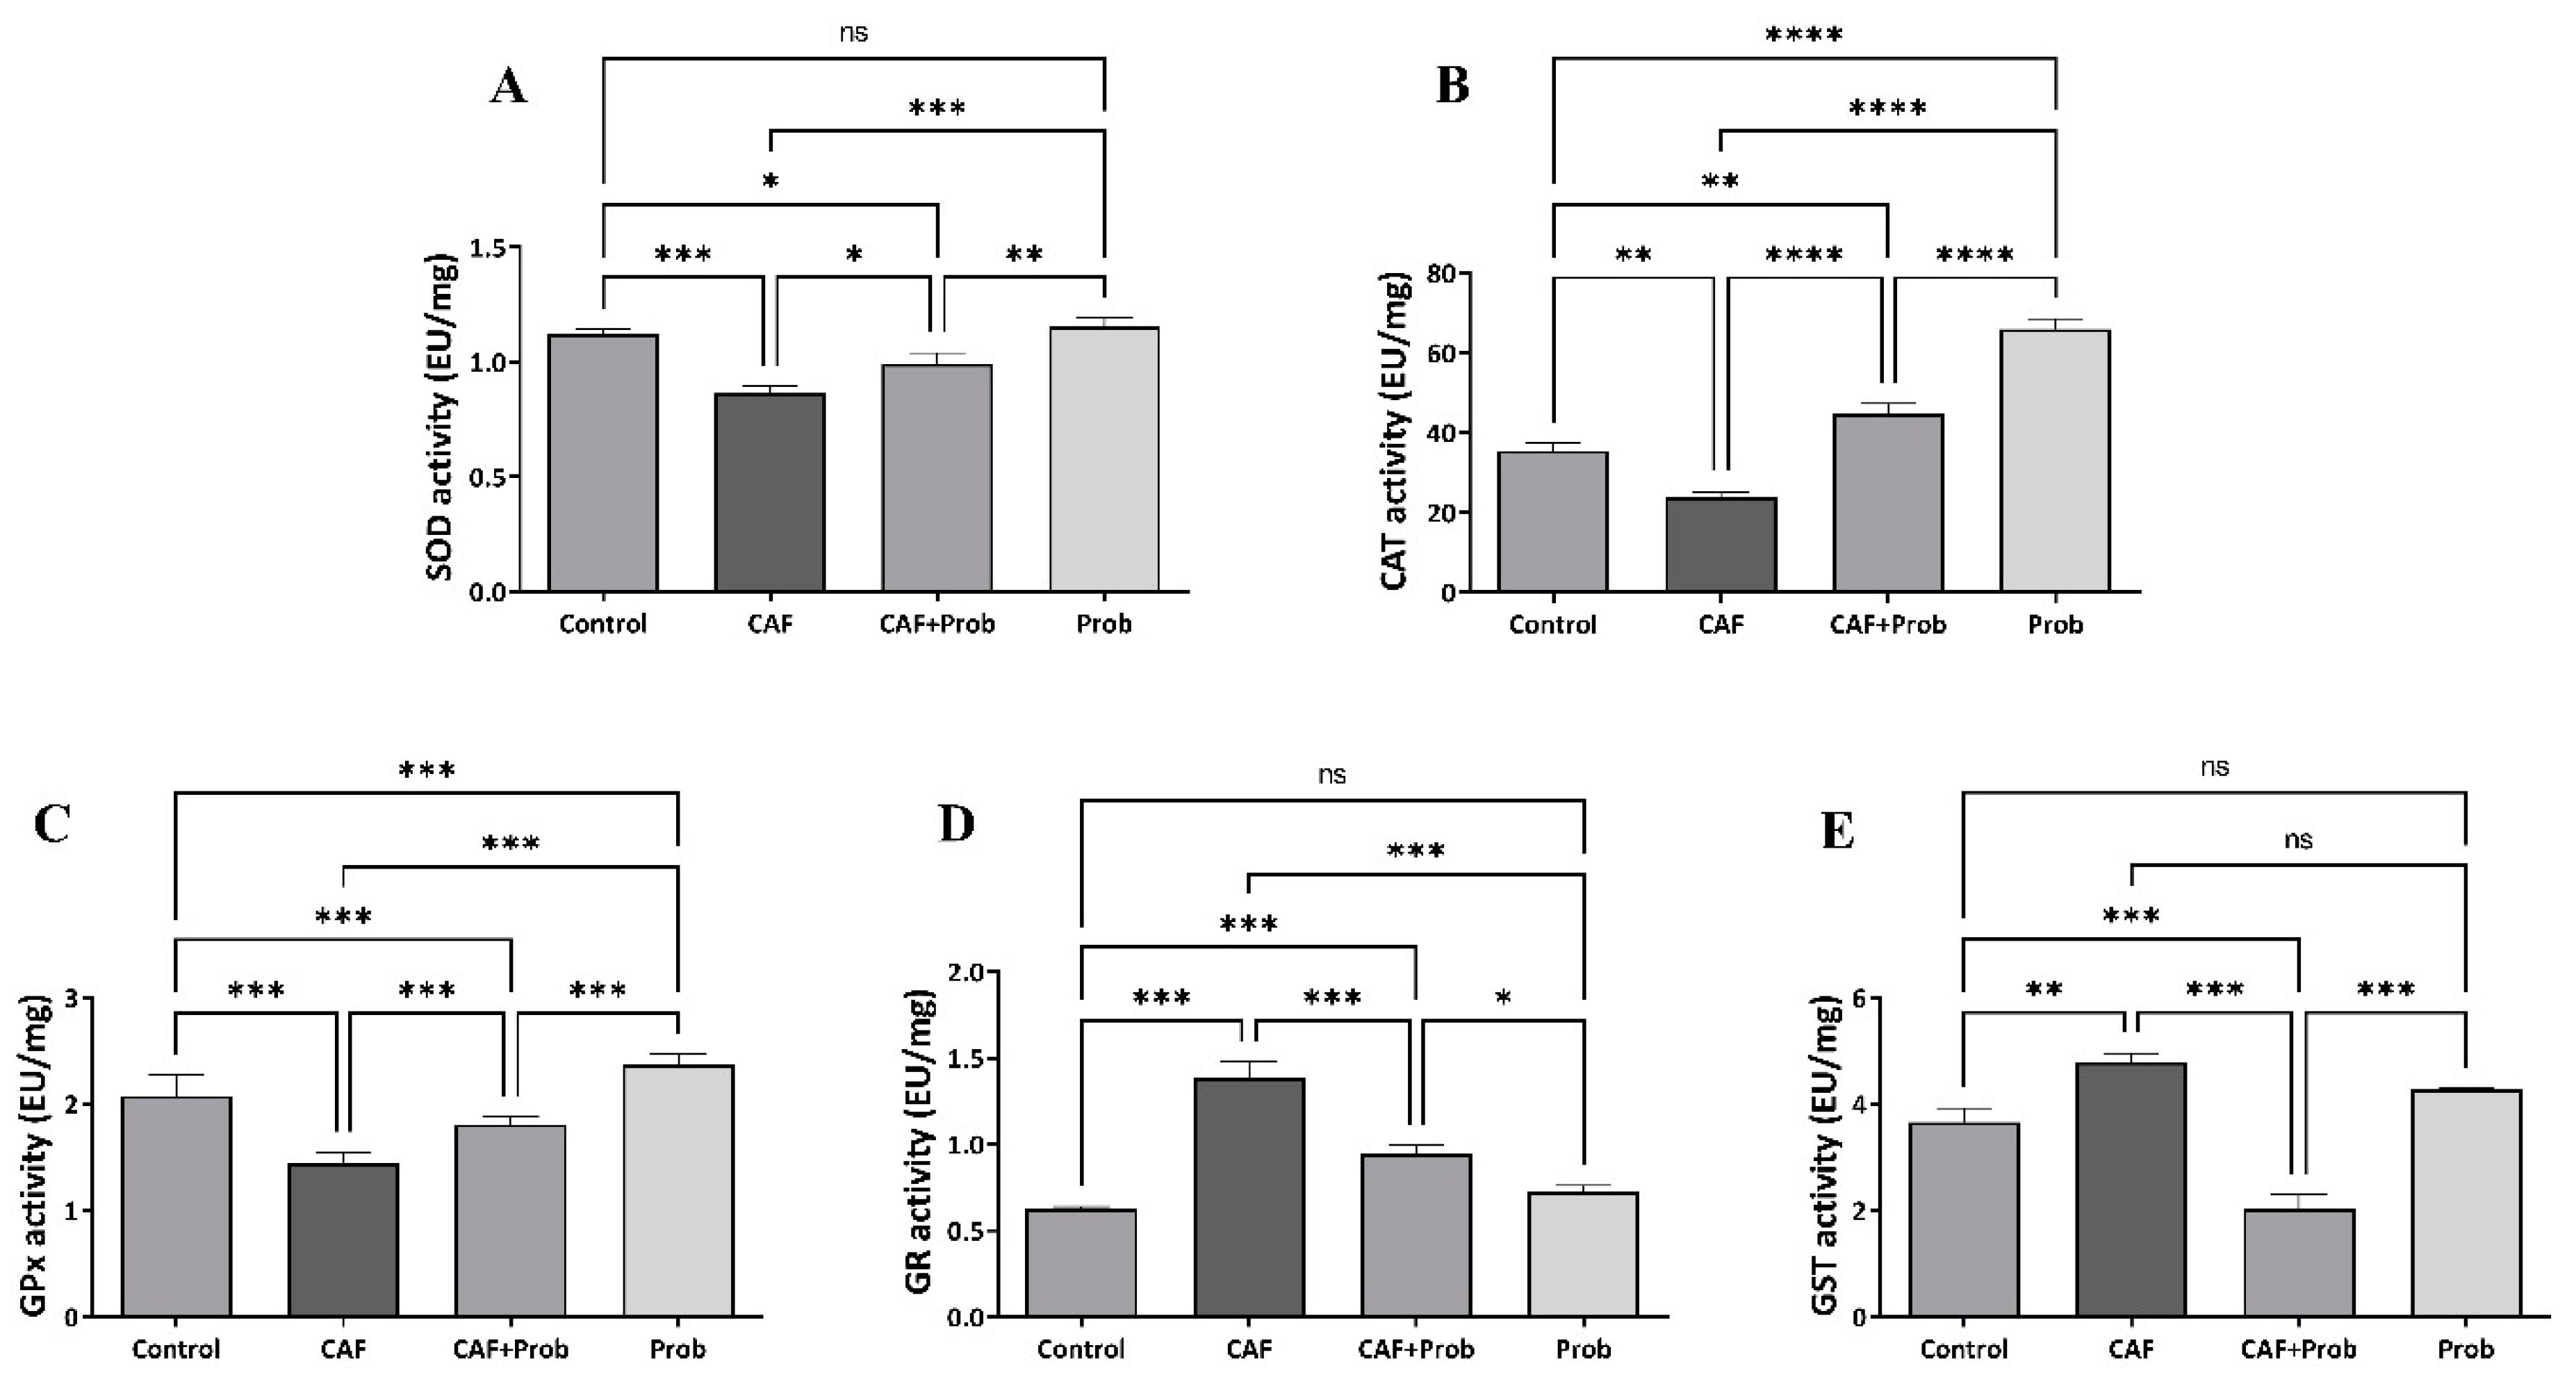
Figure 5.
Correlative evaluation of hepatic antioxidant system gene expressions and enzymatic activities based on average weight change. The X-axis represents the Average Weight Change (AWC) of the body over 5 weeks. The Y axis represents the changes of the relative mRNA expressions and the specific enzyme activities (EU/mg). (•); is the symbol of AWC in statistical evaluation. Group A graphs show the expression changes observed in the CAF group, group B graphs show the expression changes observed in Prob group (SCD Probiotics), and group C graphs show the expression changes observed in combined diet (CAF+Prob). The changes in relative mRNA expressions based on AWC and specific enzyme activities based on AWC were evaluated with nonparametric Spearman’s correlation test. r and P values were shown on the correlation graphs.
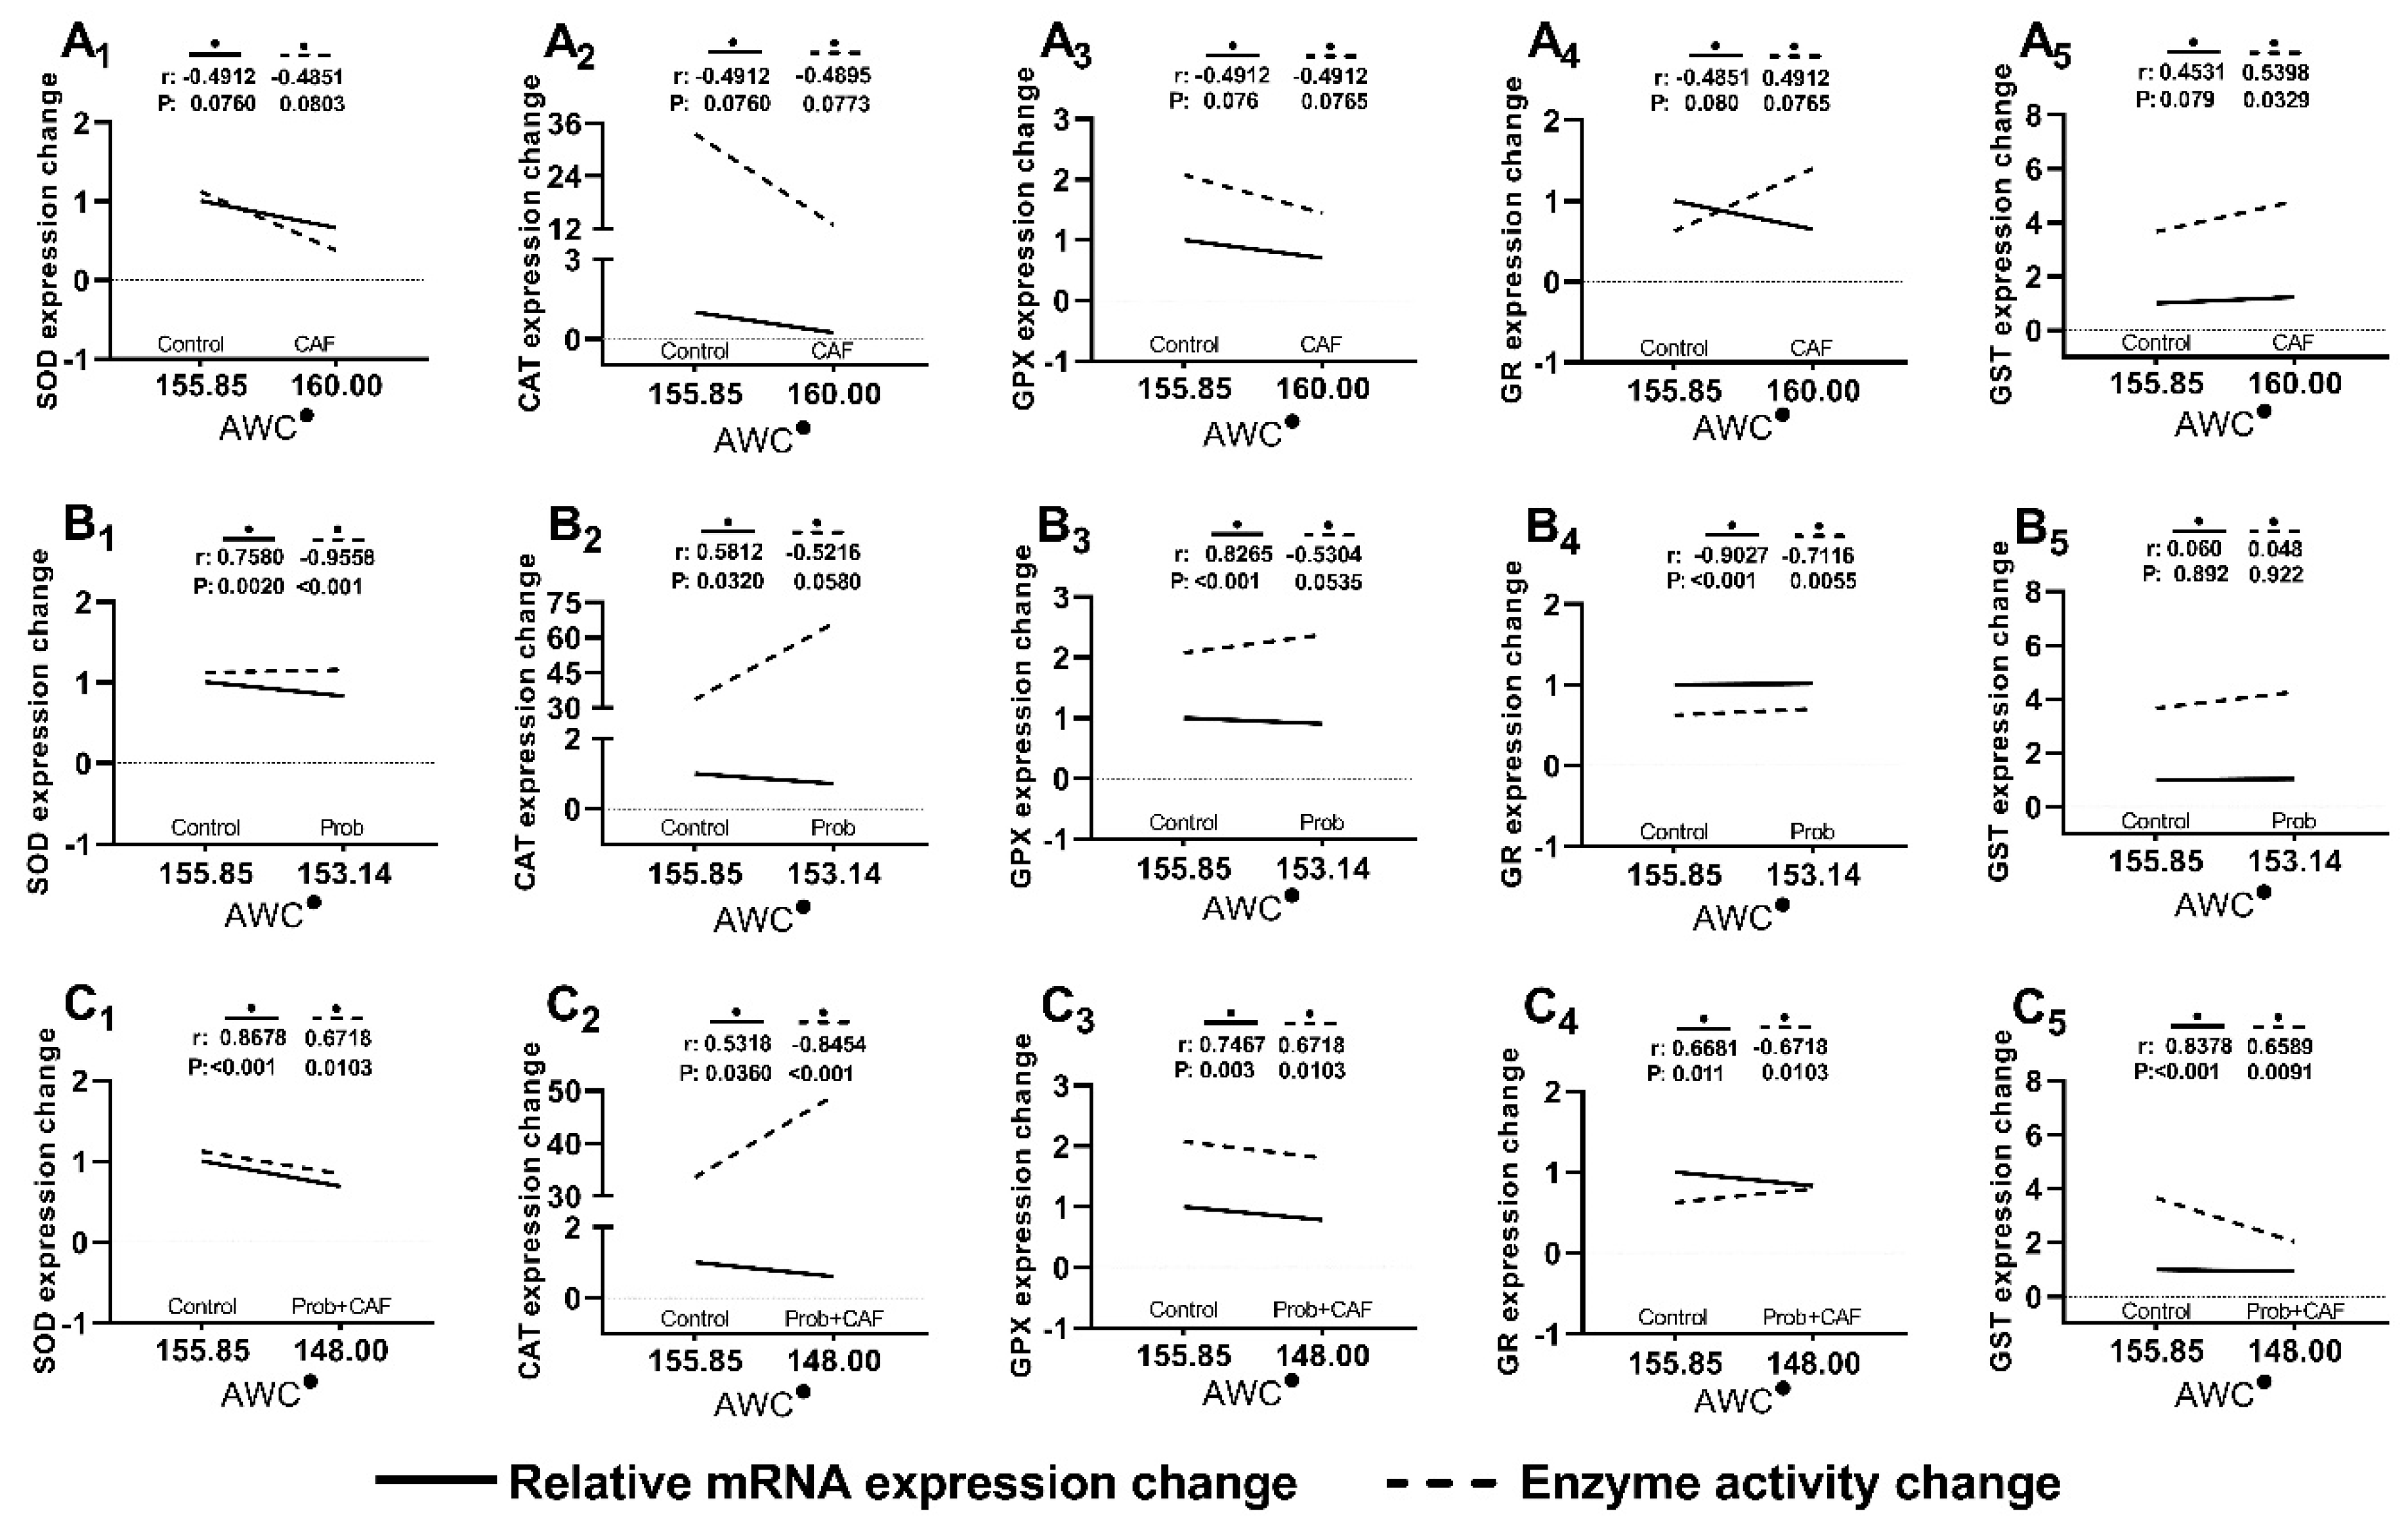
Figure 6.
mRNA and protein expressions in HCC according to the GEPIA and UALCAN datebases. The mRNA and protein expressions of Foxo1 (A1 and A2, respectively), Sod (B1 and B2, respectively), Cat (C1 and C2, respectively), Gpx (D1 and D2, respectively), Gsr (E1 and E2, respectively), and GstA1 (F1 and F2, respectively) in normal and Liver Hepatocellular Carcinoma (LIHC) tissues from GEPIA and UALCAN databases. The gray bars in boxplots represent normal samples and the red bars in boxplots represent tumor samples.
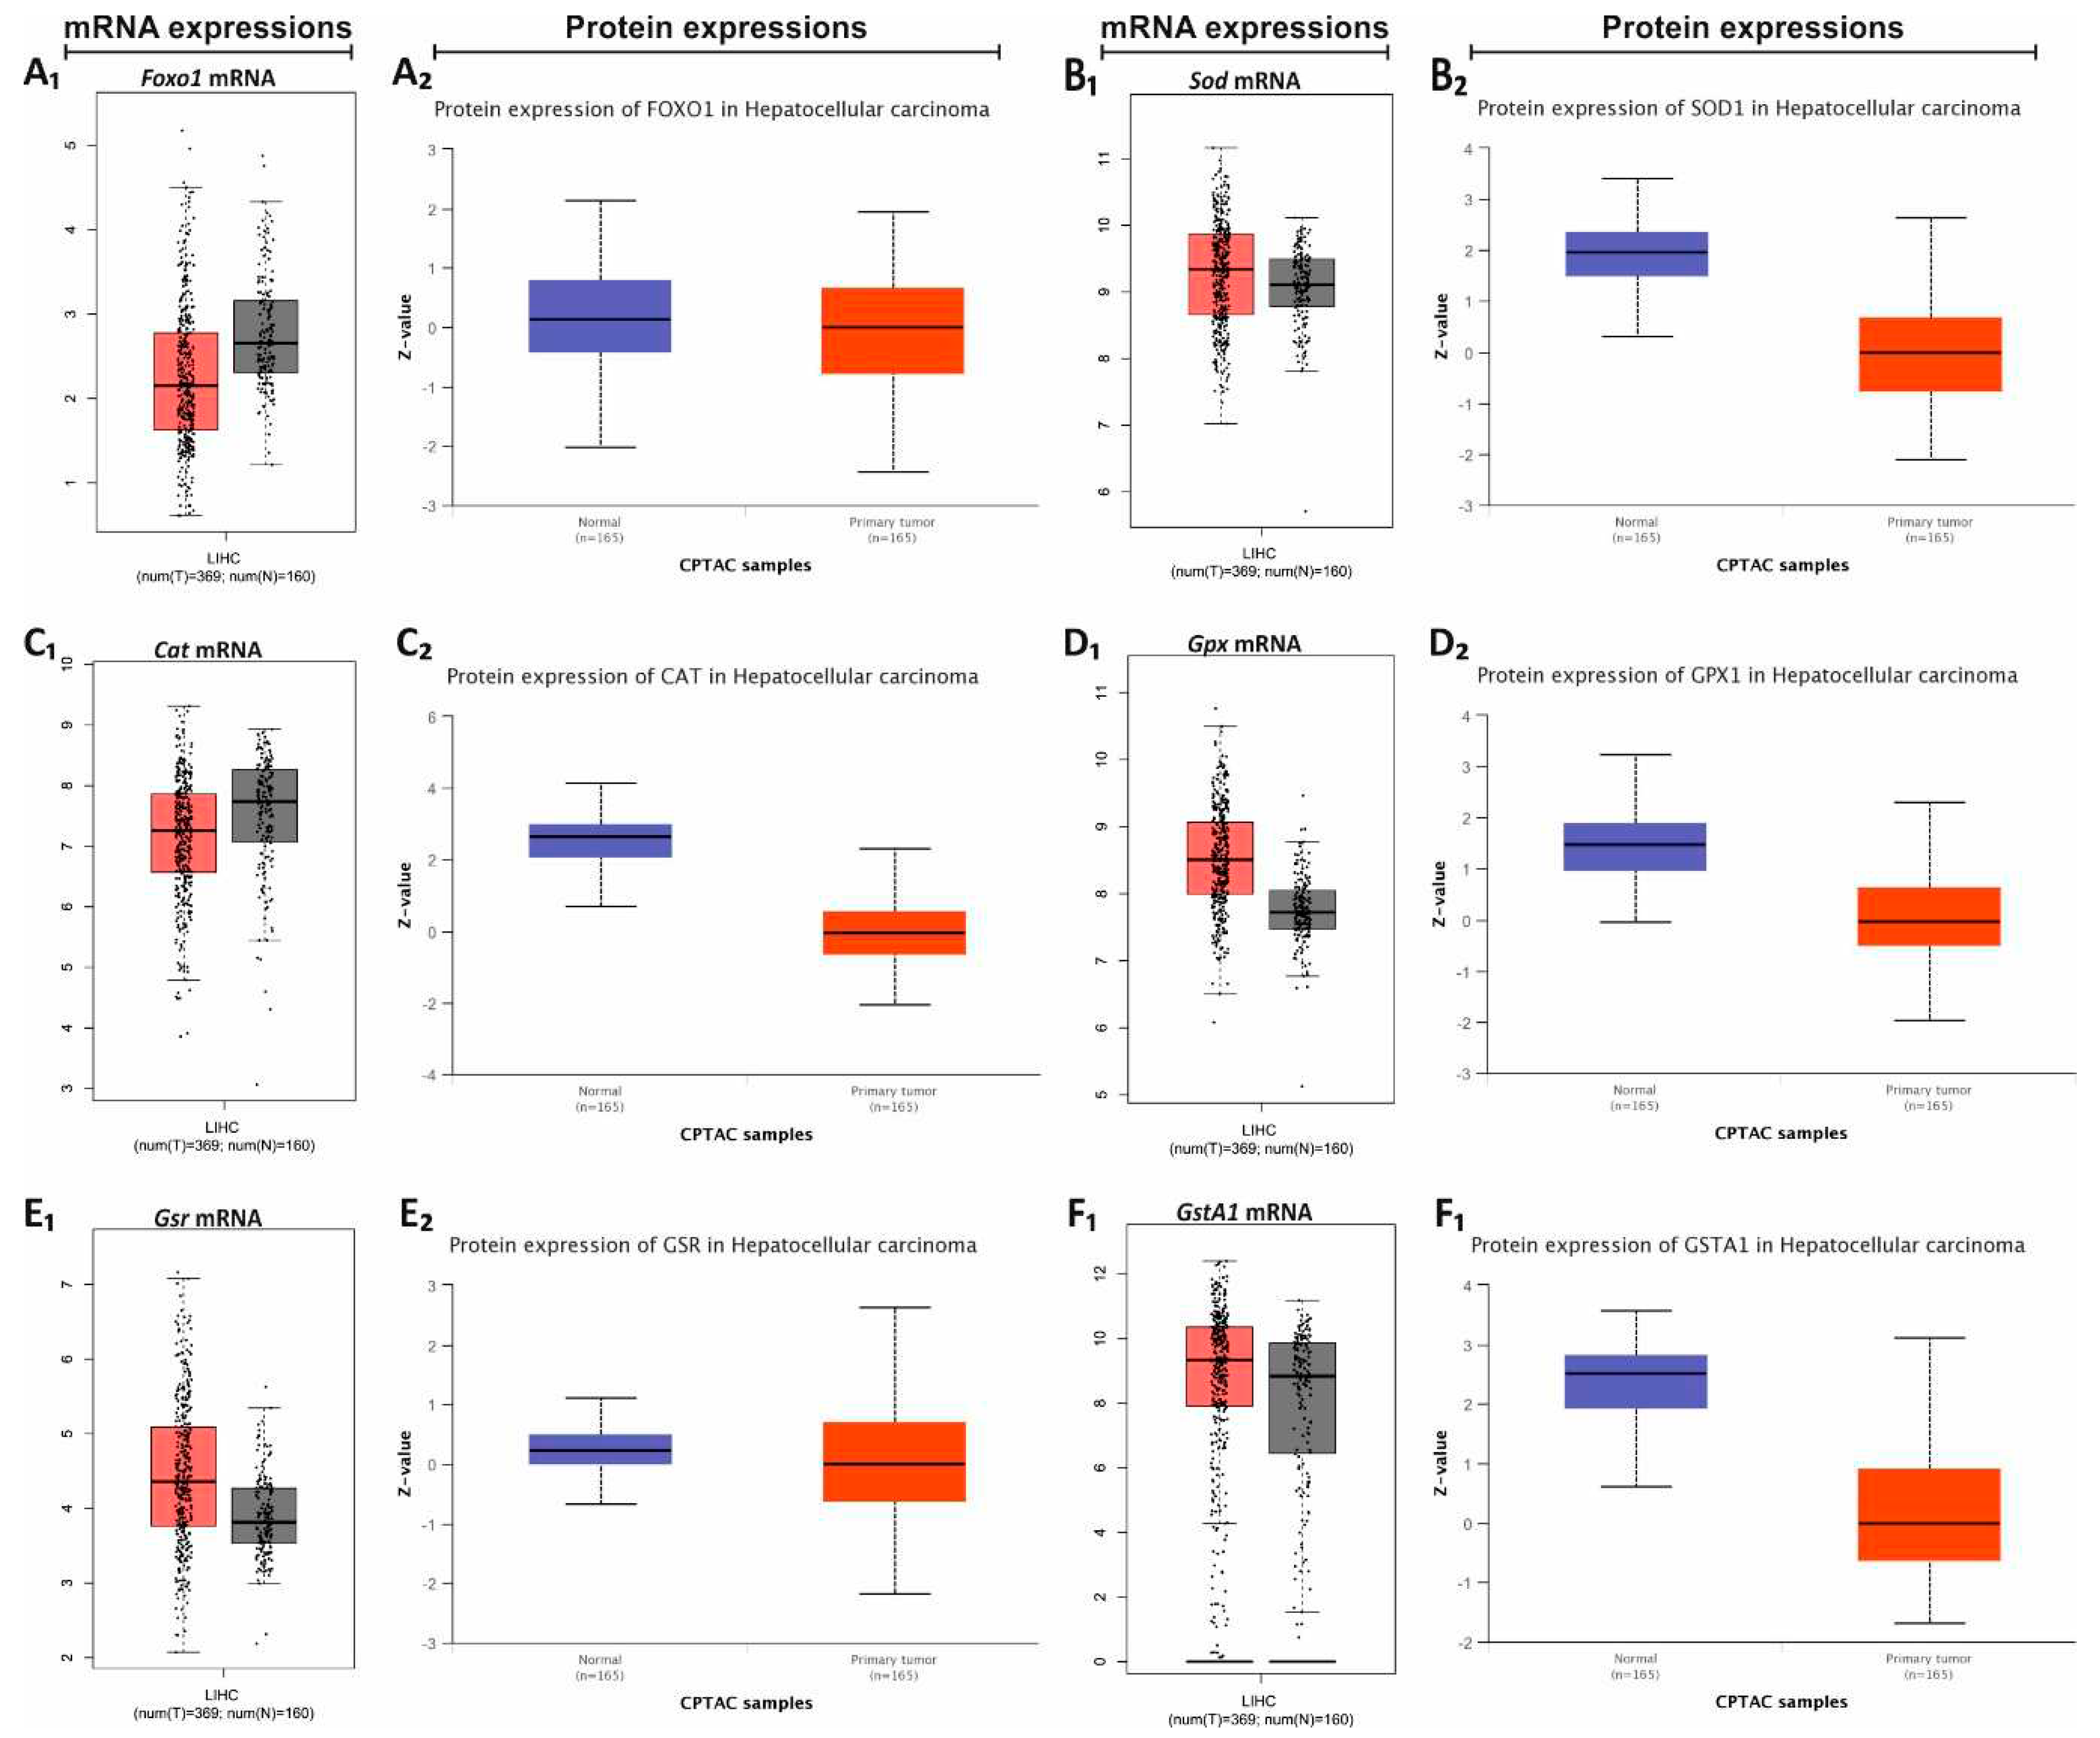
Figure 7.
Expression changes of antioxidant genes in Liver Hepatocellular Carcinoma (LIHC) based on patient’s weight using UALCAN database. mRNA expression changes of Foxo1(A), Sod(B), Cat(C), Gpx(D), Gr(E), and GstA1 (F) based on patient’s weights in normal and LIHC. The blue bars in boxplots represent normal samples and the other colored bars in boxplots represent tumor samples based on patient’s weight.
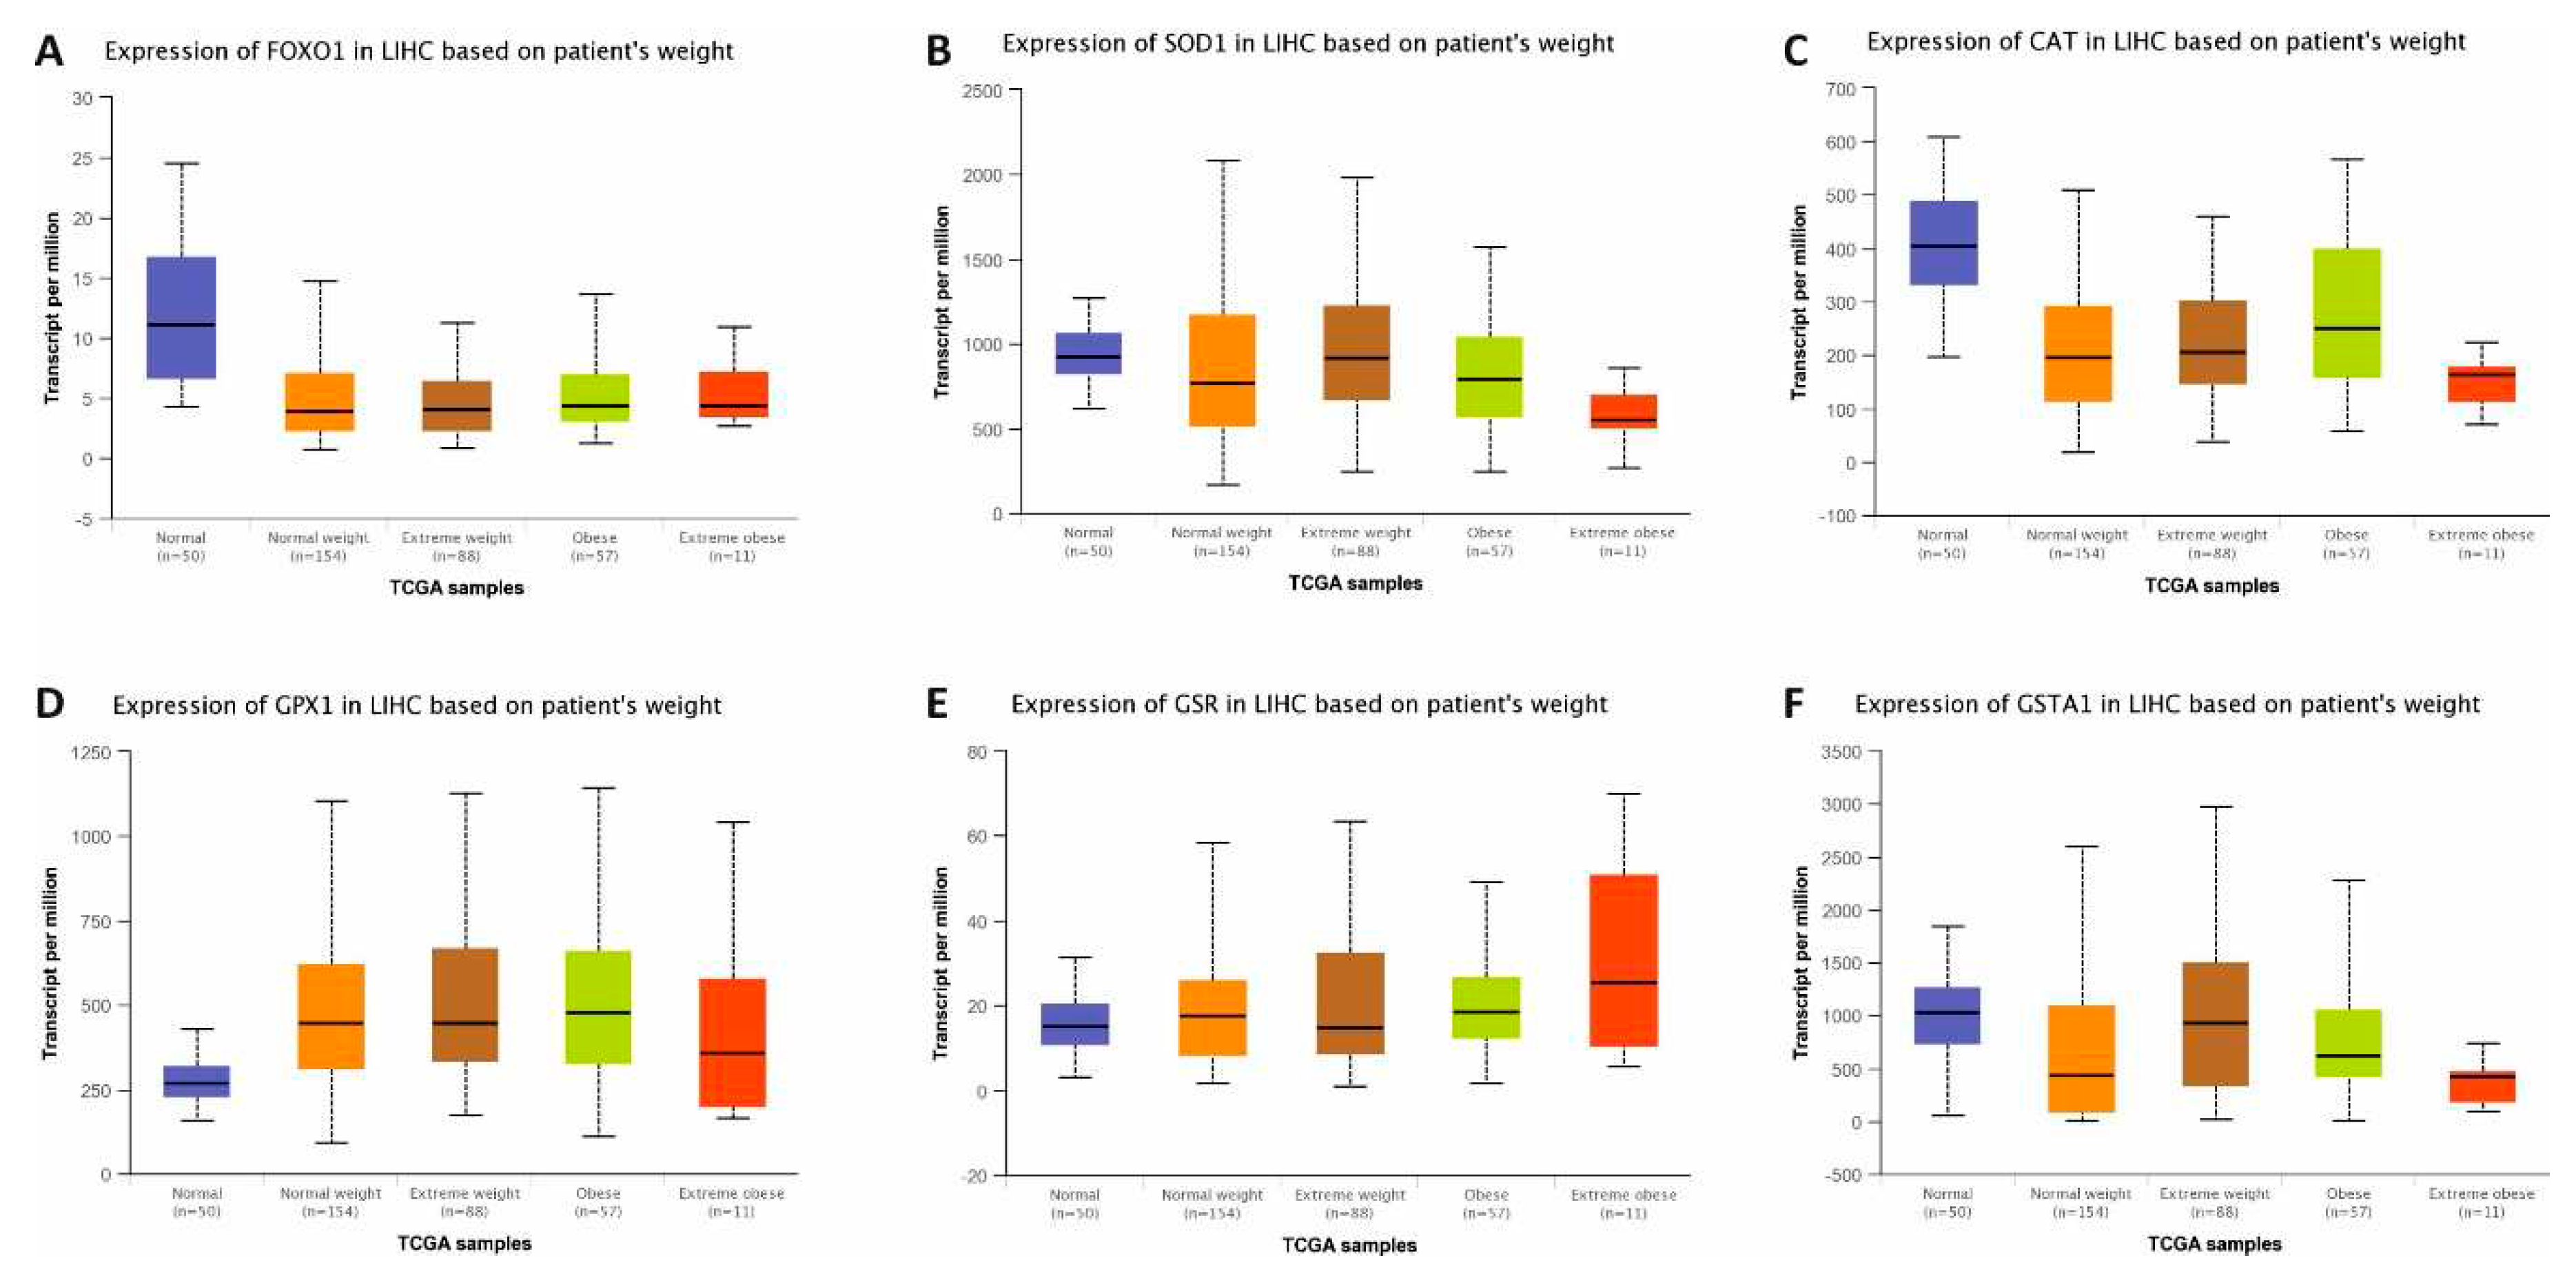

Table 1.
The amount of food applied, energy values, and weight changes of the rats in 5-week period.
Table 1.
The amount of food applied, energy values, and weight changes of the rats in 5-week period.
| Onset | Week1 | Week2 | Week3 | Week4 | Week5 | ||
|---|---|---|---|---|---|---|---|
| Energy (kcal) | Control | 1792 | 1803 | 2483 | 3247 | 3686 | 3476 |
| CAF | 1792 | 2354 | 3740 | 5848 | 6471 | 6312 | |
| Prob+CAF | 1792 | 3264 | 3669 | 5863 | 5110 | 6140 | |
| Prob | 1792 | 2093 | 3056 | 3629 | 3575 | 3285 | |
| Rodent nutrition (g) | Control | 67 | 67 | 93 | 121 | 138 | 130 |
| CAF | 67 | 61 | 89 | 136 | 134 | 123 | |
| Prob+CAF | 67 | 38 | 55 | 57 | 50 | 65 | |
| Prob | 67 | 41 | 53 | 58 | 39 | 47 | |
| AWC | Control | 79.9±5.24 | 105.8±5.61 | 134.8±7.91 | 165.6±7.87 | 196.7±7.26 | 235.7±6.98 |
| CAF | 79.3±5.24 | 105.1±5.43 | 128.6±5.76 | 173.7±5.96 | 207.8±7.84 | 239.3±9.36 | |
| Prob+CAF | 79.3±5.69 | 106.1±5.65 | 133.1±6.69 | 172.7±6.05 | 203.4±7.06 | 227.3±6.24 | |
| Prob | 79.7±5.39 | 108.1±5.26 | 130.6±5.87 | 165.6±7.51 | 203.7±10.09 | 232.8±8.78 |
Table 2.
Sequences and accession numbers of specific primers.
| Gene Symbols | Accession Number | Elongation position | Sequence (5’-3’) |
|---|---|---|---|
| Sod | NM_017050.1 | Forward | 5′-GCTTCTGTCGTCTCCTTGCT-3′ |
| Reverse | 5′-CTCGAAGTGAATGACGCCCT-3′ | ||
| Cat | NM_012520.2 | Forward | 5′-GCGAATGGAGAGGCAGTGTA-3′ |
| Reverse | 5′-GTGCAAGTCTTCCTGCCTCT-3′ | ||
| Gr | NM_053906.2 | Forward | 5′-AGTTCACTGCTCCACACATCC-3′ |
| Reverse | 5′-TCCAGCTGAAAGAACCCATC-3′ | ||
| Gpx | NM_183403.2 | Forward | 5′-TGGCTTACATCGCCAAGTC-3′ |
| Reverse | 5′-CCGGGTAGTTGTTCCTCAGA-3′ | ||
| Gst | NM_017013.4 | Forward | 5′-AGACGGGAATTTGATGTTTGAC-3′ |
| Reverse | 5′-TGTCAATCAGGGCTCTCTCC-3′ | ||
| Foxo1 | NM_001285835.1 | Forward | 5′-ACCGTATCTGTGTGTGTGTGTG-3′ |
| Reverse | 5′-ACAGCCAAGTCCATCAAGAC-3′ | ||
| Gapdh | NM_007393.5 | Forward | 5′-TGGACCTCATGGCCTACATG-3′ |
| Reverse | 5′-AGGGAGATGCTCAGTGTTGG-3′ |
Note: Gapdh was used as a reference.
Disclaimer/Publisher’s Note: The statements, opinions and data contained in all publications are solely those of the individual author(s) and contributor(s) and not of MDPI and/or the editor(s). MDPI and/or the editor(s) disclaim responsibility for any injury to people or property resulting from any ideas, methods, instructions or products referred to in the content. |
© 2023 by the authors. Licensee MDPI, Basel, Switzerland. This article is an open access article distributed under the terms and conditions of the Creative Commons Attribution (CC BY) license (http://creativecommons.org/licenses/by/4.0/).
Copyright: This open access article is published under a Creative Commons CC BY 4.0 license, which permit the free download, distribution, and reuse, provided that the author and preprint are cited in any reuse.


