
Submitted:
14 February 2025
Posted:
14 February 2025
You are already at the latest version
Abstract
In recent years, intensification of aquaculture production in the Lake Victoria Crescent, Uganda has resulted in increased parasitic disease occurrences. However, despite the efforts made, the parasite burden has continued to cause fish mortality. Notably, the different production systems provide different habitats and environmental conditions for the parasites and understanding of the parasite infestation dynamics in these culture systems may provide better sanitary and farm management strategies for the parasite burden. Therefore, the study compared the parasite prevalence and mean intensity of pond and cage cultured Nile tilapia and also identified statistical associations between parasitic infestation and farm management practices. Across the Crescent, a high infestation rate of 65% (418/640) with Trichodina spp. being most prevalent and abundant, and a 16 parasite taxa; 6 protozoa, 2 monogenea, 2 digenea, 1 crustacea, 3 cestode, and 1 acanthocephala was obtained. Furthermore, nearly all parasites were recovered in 3 fish organs; gills harboring 50% (8/16), intestines with 31% (5/16) and skin with 25% (4/16) of the parasite genera. Fish from Pond grow-out and Hatchery farming system harboured ≥ 11 parasite genera while ≤ 5 parasite genera were found in Cage grow-out (lake) and Cage grow-out (reservoir) farms namely; Pond grow-out: 5 protozoa, 1 monogenea, 2 digenea, 1 crustacea, 2 cestode; Cage grow-out (lake): 2 protozoa, 1 monogenea, 2 digenea; Cage grow-out (reservoir): 2 protozoa, 1 monogenea, and Hatchery: 3 protozoa, 2 monogenea, 2 digenea, 1 crustacea, 2 cestode, and 1 acanthocephala. Definitely, Trichodina spp. and Dactylogyrus spp. were recorded in all culture systems but with Trichodina spp. having the highest prevalence and mean intensity in Cage grow-out (reservoir). After classification of infestation, the comparative assessment between Pond grow-out and Cage grow-out (lake) farming systems revealed that 66 % (12/18) of Pond grow-out farms had normal/ frequent infestation and with one farm having very severe/ severe infestation whereas, 33 % (3/9) of Cage grow-out (lake) had gradual/ rare infestation yet with no farm having very severe/ severe infestation. The Fisher's exact test revealed that in Pond grow-out, the relatively high infestation was significantly associated with all the farm management practices: fish seed source, stocking density, feeding and nutrition, disinfection, control of intermediate hosts, and control of wild fish entry, while in Cage grow-out (lake), the relatively low infestation was only significantly associated with stocking density, feeding and nutrition, and control of wild fish entry. Therefore, the findings from the study suggest that proper farm management practices will reduce on the parasite proliferation in the Crescent.
Keywords:
farmed fish
; parasites
; farm management
; ponds
; cages
1. Introduction
Aquaculture production has steadily increased worldwide to approximately 130.9 million tonnes in 2022 [1], in response to the increasing demand for the fish protein amidst reduced supply from capture fisheries. Similarly, Africa’s aquaculture production increased, contributing to 7 per cent of the total fish production in 2022 [1]. More over, in Uganda, fish production presented an estimated total production of 95,000 tonnes in 2010 to 139,000 tonnes in 2021 [1]. Surely, the increase in fish production is attributed to Nile tilapia (Oreochromis niloticus), a commonly cultured species, that contributes approximately 49% of national annual aquaculture production [2]. Notably, the species has intrinsic favourable attributes that promote its rearing not only in Uganda but the world over. These include; the high nutritional value that promotes customer acceptance and marketability, easy managerial protocol, highly productive, indiscriminate appetite and tolerance to poor water quality [3]. Furthermore, the culture of Oreochromis niloticus contributes to improved food and nutrition security, economic growth, trade and living standards of the human populations [4]. However, it has been documented that fish production in Uganda is faced by a number of challenges such as limited land for culture, lack of feeds, predators, poor fish seeds, competition from other agricultural sectors, lack of access to financial support, environmental pollution, and poor fish disease management [5,6].
Currently, intensification of aquaculture production in Uganda has been identified as the cause of increased occurrence of disease out-breaks [7]. Definitely, fish parasites have been registered as the main disease burdens in the country [7,8]. In pond and cage culture systems, the parasites co-exist with farmed fish if the host-pathogen interaction is not disrupted [9]. Nevertheless, rapid changes in water quality and farm management practices may result in an increase in the parasite populations [9,10,11]. Parasites proceed to attack fish’s external surface (skin, eyes, fins) or internal organs (gills, gut, gonads, kidney, liver, swim bladder, muscle tissue, intestines) [12]. As a result, serious economic losses through morbidity, loss of productivity and treatment costs may occur on a farm [13,14]. Therefore, in order to control the direct and indirect effects of these parasites, functional aquatic health management and biosecurity systems need to be established and yet they are still poorly developed in the country [15]. For instance, farmers often have little knowledge of biosecurity measures and good farm management practices [16]. The few available agricultural extension workers who would provide technical support to farmers are hardly knowledgeable in disease management [15,17]. Additionally, there have been few disease surveillance programs, lack of well-equipped diagnostic laboratories, shortage of fish health experts, high costs of diagnosis, and absence of disease outbreak reports due to poor record keeping by farmers [15,18]. For that reason, employment of better aquatic animal health strategies are needed in place to strengthen the existing aquatic health management and bio-security systems [19,20].
Parasitological studies in Uganda have recorded relatively higher parasite frequency and abundance in farmed fish in the Lake Victoria Crescent than in any other agro-ecological zone in the country [ 7,8,15]. Notably, the high parasite burden is due to the aquaculture intensification in this region, which aquaculture is largely characterized by many commercial fish farms, management of stocked water bodies and adoption of high stocking density fish culture technologies [5], which makes fish vulnerable to increased parasitic attacks [21]. However, despite the various efforts made by farmers, scientists and policy makers to control the parasite burden, there has been increased parasite proliferation and associated mortality on fish farms over the years [15,18]. Therefore, in order check these parasite populations, there is need of understanding the parasite infestation dynamics in the commonly used production systems in the Crescent, in order to come up with better sanitary and farm management strategies for parasite burden [15]. However, there are hardly assessment studies on parasite infestation dynamics in Uganda’s aquaculture [11]. Indubitably, these different culture systems provide different habitats and environmental conditions for the parasites, which induces diseases in the confined aquaculture environment [22]. For example, [23] recorded a higher parasite prevalence in pond cultured Nile tilapia than that in cage cultured one. Elsewhere, [24] noted that there was higher parasitic infections in Nile tilapia reared in ponds than those reared in floating cages. Therefore, this study was intended to; 1) provide insight into the occurrence, distribution, prevalence and intensity of parasites infesting pond and cage cultured Nile tilapia (Oreochromis niloticus) in the Lake Victoria Crescent, Uganda, 2) to compare the prevalence and mean intensity of fish parasites in the four culture systems; Pond grow-out, Cage grow-out (lake), Cage grow-out (reservoir) and Hatchery, and 3) to analyse the potential statistical associations between the parasitic infestation and farm management practices.
2. Materials and Methods
2.1. Study Area and Sample Collection
According to the Ministry of Agriculture, Animal Industry and Fisheries, Uganda, aquaculture production in Lake Victoria Crescent is relatively developed as compared to the other agro-ecological zones [3,5]. The development is due to the favourable altitude of 1,000 – 1,800 m ASL, tropical climate with a bi-modal rainfall pattern ranging from 1,200 – 1,450 mm per year and temperature range between 15 – 30 oC throughout the year which support fish production [3,5,25]. However, the aquaculture intensification has led to increased occurrence of fish disease outbreaks [5,8,15]. Therefore, a survey was carried out in thirty-two (32) fish farms, consisting of 18 Pond grow-out, 9 Cage grow-out (lake), 2 Cage grow-out (reservoir) and 3 Hatchery farms, from 10 districts, eight farms from Buikwe (C), five from Wakiso (A), four from Bugiri (G), three from Masaka (E) and Mukono (B), two from Mpigi (D), Busia (J), Tororo (K), and Namayingo (H), and one from Jinja (F) within the Crescent (Figure 1) and fish examined for parasites. Fish farms within the selected districts were chosen using block sampling techniques i.e., 5% of the total number of fish farms in the district, in order to not only overcome denominators between selected districts but also have a fair representation of fish farms from each district. A total of 640 live specimens of Nile tilapia, 20 samples per fish farm (from different farming units on each farm) were collected once between mid October and early December, 2019, a period in which the Crescent receives near normal to above normal rainfall [25]. The one and half month sampling period was adopted in order to understand the occurrence, distribution, prevalence and intensity of the parasites of farmed fish in the Crescent and to also avoid temporal effects on parasite burden. The live fish was collected randomly by fishing with seine nets in ponds or cast nets in cages in all the study sites before the fish were identified as Oreochromis niloticus. The collected fish weighed between 56 and 328 g and were between 11 and 23 cm long. The live fish were later transported in separate labeled plastic bags (with source water) to the Parasitology Laboratory at Aquaculture Research and Development Centre, National Agricultural Research Organization for parasitological examination.
2.2. Examination of Fish for Different Parasites
2.2.1. Macroscopic Examination
In the laboratory, harvested live fish specimens were sacrificed and the external body surface including scales, gills, fins and operculum were examined with the use of the naked eye and a dissecting microscope for the presence of external parasites. The scales were crushed carefully by a scalpel to identify any macroscopic lesions or cysts [26]. In addition, the fish were dissected from anus ventrally along the middle of abdomen to mouth as described by [27] in order to expose the internal organs. Two lateral incisions were done in order to expose the body cavity, alimentary canal and other internal organs and all were examined for presence of macroscopic adult parasites and encysted metacercariae [28].
2.2.2. Microscopic Examination
Scrapings from the body surface, fins and gills of the fish were taken with a cover slip and were smeared onto clean microscope slides and examined microscopically [29]. Later on, the digestive tract was dissected along its length using scissors and investigated by parts and its content was emptied into a petri dish and diluted with physiological saline; the films were then prepared and examined [28]. Adult trematodes and cestodes were collected, washed with physiological saline to remove mucus and debris, and left in a refrigerator at 4 °C until complete relaxation. Then, they were fixed according to [30] and stained in acetic acid alum carmine according to [31]. The nematodes were collected in warm 70% ethyl alcohol solution and cleaned in lactophenol for 12 to 24 hours. They were then preserved in 70% alcohol plus 5% glycerin solution [32]. All of the prepared slides were examined to identify the parasite genera basing on morphological features such as shape and size, and predilection sites in the fish host as described elsewhere by [33,34,35,36,37,38,39,40,41,42,43,44].
2.3. Collection of Water Quality and Farm Management Practices
2.3.1. Water Quality
The physio-chemical parameters were measured once at each fish farm between 09:00 am and 12:00 noon on the day of fish sampling. At pond fish farms, measurements were taken at several different areas in the pond as far from the bank as possible, whereas at cage fish farms, measurements were taken within and outside the cages at different depths ranging from 1 m to 6 m below the water surface. Temperature, pH, salinity, dissolved oxygen, conductivity and total suspended solids were measured using VuSitu Digital Water Testing Device (In-Situ Inc., United States), while ammonia, nitrite, chloride and hardness were measured using Fresh Water Aquaculture Kit AQ-2 (LaMotte Company, United States) as guided by [45].
2.3.2. Farm Management Practices
Data were collected through direct observation, qualitative open-ended questionnaires and interviews given to farm managers. Management factors; fish seed source, stocking density, feeding and nutrition status (i.e., amount of feed, frequency of feeding, time intervals of feeding and quality of feed) and disinfection were ascertained by questionnaires and interviews while factors such as control of wild fish entry and intermediate hosts were established by direct observation as recommended by [46].
2.5. Statistical Analysis
2.5.1. Parasite Diversity and Infestation Levels
The parasite diversity in the study was established by parasite diversity estimators; Chao and Jackknife. The Shannon– Wiener Index (H′) and evenness (E), and the Berger–Parker Dominance Index (d) (a quantification of the most abundant parasite types in a given sample) were determined as described by [47]. Infestation levels were analyzed by prevalence, mean intensity and mean abundance using the guidelines outlined by [48].
2.5.2. Prevalence and Mean Intensities of Parasites Recovered from Oreochromis niloticus in the Different Culture Systems
Chi-square test of association was used to compare parasite prevalence and mean intensities among the culture systems. Statistical analyses were performed using the R Foundation Software Version 4.2.1 at p ≤ 0.05.
2.5.3. Relationship Between Parasitic Infestation and Farm Management Practices
The parasite prevalence recorded in fish farms was categorized into classes according to a criteria by [49,50]. In order to cater for the variable prevalence levels in the study, the prevalence was categorized into 5 classes instead of 10 classes as presented in Table 1. The Fisher’s exact test was then used to determine if there was any significant association between the two categorical variables (classified parasite prevalence and farm management practices). Statistical analyses were performed using the R Foundation Software Version 4.2.1 at p ≤ 0.05.
3. Results
3.1. Composition and Levels of Parasitic Infestation in the Lake Victoria Crescent
Out of 640 fish samples, 418 (65%) were infested with a single or multiple parasites belonging to one or many different genera with some shown in Figure 2. A total of 16 different parasite types were identified to genera level. Parasite diversity indices; Shannon index (H′) of 0.961, Evenness (E) of 0.347, Berger–Parker Dominance index (d) of 0.79 and diversity estimators; Chao = 16.125 and Jackknife = 16.998 were obtained as shown in Table 2.
Table 3 presents Trichodina spp. as the most prevalent parasite genera recovered from fish, with a prevalence of 23.4%, followed by Dactylogyrus spp. with a prevalence of 14.2%. In the same way, Trichodina spp. had the highest mean abundance of 9.66 individuals, in contrast to the other parasite genera with mean abundance less than 1 individual. Overall considering parasite genera collected, 7 parasite genera comprised mean intensities greater than ten individuals per fish. Furthermore, nearly all parasites were recorded in the skin, gills and intestines with a few found in the fins, intestines, muscle, viscera, gonads, liver, gas bladder, stomach, and spleen. The gills independently harbored 50% (8/16) of the parasite genera recovered, followed by the intestines with 31% (5/16), and skin with 25% (4/16) of the parasite genera. Particularly, the Trichodina spp. was the most dominant in both the skin and gills whereas the Myxobolus spp. was restricted to more organs than any other parasite genera (9 organs). Unlike other parasite genera, Dactylogyrus, Clinostomum, Ergasilus, Eimeria, Gyrodactylus, Chilodonella, Ichthyobodo and Ambiphrya species were isolated from one organ, either the skin, gills or intestine.
3.2. Prevalence and Mean Intensities of Parasite Recovered from Oreochromis niloticus in the Different Culture Systems
Comparison of the prevalence among the culture systems revealed a highly significant difference (p ≤ 0.05) as shown in Table 4. In terms of parasite genera numbers, fish samples examined from Pond grow-out and Hatchery farming systems harboured ≥ 11 parasite genera, against the ≤ 5 parasite genera found in Cage grow-out (lake) and Cage grow-out (reservoir) farming system. Certainly, Trichodina spp. and Dactylogyrus spp. were recorded in all of the four culture systems. In addition, the Trichodina spp. was not only found to have the highest prevalence in Cage grow-out (reservoir) (45%) but also its prevalence was repetitively high across other culture systems; Pond grow-out (23.9%), Cage grow-out (lake) (17.2%), and Hatchery farming systems (25%).
As revealed in Table 5, the mean intensities of parasites in the culture systems differed with a highly significant variation (p ≤ 0.05). Definitely, Trichodina spp. was found in all in the four culture systems with high mean intensities namely; Cage grow-out (reservoir) 121.1±29.5), Cage grow-out (lake) (41.5±16.7), Hatchery (22±9.5) and Pond grow-out farming systems (15.6±10.4) in that order. Likewise, mean intensities of Myxobolus species were moderately high in Pond grow-out (13.1±16.9), Cage grow-out (reservoir) (13.1±16.9) and Hatchery farming systems (11.9±7.7) with ≥ 11 mean intensities. Additionally, parasite genera such Eimeria, Chilodonella, Ambiphrya and Diphyllobothrium species, which were found in either Hatchery or Pond grow-out farming systems, had relatively high mean intensities as indicated in Table 5.
3.3. Water Quality, Farm Management Practices and Parasitic Infestation
3.3.1. Water Quality and Farm Management Practices in the Different Culture Systems
The water quality parameters and farm management practices against recommended limits for fish culture varied from one culture system to another as recorded (Table 6). Clearly, all the culture systems had levels of pH, salinity, total dissolved solids, hardness, nitrite and chloride fall within the optimal range for fish culture apart from ammonia. Additionally, dissolved oxygen was within accepted levels in only Cage grow-out (lake) and Hatchery systems. Temperatures were within recommended limits only in the Cage grow-out (lake) culture system. Unlike in other culture systems, conductivity fell out of the recommended limits in Cage grow-out (lake) and Cage grow-out (reservoir) systems. Almost all Cage grow-out (lake) and Hatchery farming systems outsourced fish seed from certified hatcheries. Except for Pond grow-out and Cage grow-out (lake) systems, stocking density in Hatchery and Cage grow-out (reservoir) was within the required numbers. However, feeding was appropriate in Cage grow-out (lake) and Hatchery systems only. Notably, disinfection was only present in Cage grow-out (lake) and Hatchery culture systems. Lastly, wild fish entry was present in Pond grow-out, Cage grow-out (lake) and Cage grow-out (reservoir) while intermediate hosts were observed in Cage grow-out (reservoir) and Hatchery systems.
3.3.2. Relationship Between Parasitic Infestation and Farm Management Practices
As shown in Figure 3, all fish farms in the study irrespective of the culture system, were infested with parasites. Notably, very severe/ severe parasitic infestation was recorded in one farm in each of the Pond grow-out, Cage grow-out (reservoir) and Hatchery farming systems. Certainly, intermediate/ very frequent infestation was found in all of the culture systems with Pond grow-out system having the highest number of farms. Additionally, normal/ frequent parasitic infestation was documented in both Pond grow-out and Cage grow-out (lake) farming systems with Pond grow-out culture system still having the highest number of farms. Lastly, gradual/ rare infestation was recorded in only the Cage grow-out (lake) farming system.
Generally, parasite prevalence in farmed fish sampled in the Lake Victoria Crescent was significantly associated with fish seed source (p = .002), stocking density (p = .003), feeding and nutrition (p = .000), control of intermediate hosts (p = .02), and control of wild fish entry (p = .046). Unfortunately, disinfection had no significant relationship with parasite prevalence (Table 7).
In regard to culture systems, only Pond grow-out and Cage grow-out (lake) farming systems were considered for further Fisher’s exact test analysis due to the fact that sufficient data was available i.e., 18 Pond grow-out and 9 Cage grow-out (lake) farms were visited during the survey, compared to the 3 Hatchery and 2 Cage grow-out (reservoir) farms. With the Pond grow-out farming system, parasite prevalence was significantly associated with all the farm management practices; fish seed source (p = .002), stocking density (p = .013), feeding and nutrition (p = .001), disinfection (p = .036), control of intermediate hosts (p = .013), and control of wild fish entry (p = .018) (Table 8). For the case of Cage grow-out (lake) farming system, parasite prevalence was significantly associated with stocking density (p = .036), feeding and nutrition (p = .014), and control of wild fish entry (p = .036).
4. Discussion
4.1. Composition and Levels of Parasitic Infestation in the Lake Victoria Crescent
The high infestation rate of 65% (418/640) reported in the study was lesser than the 89% (124/140) rate recorded earlier by [8] in fish farms along the Lake Victoria Crescent. Similarly, the 16 species richness in the study was higher than the 11 species richness obtained by [8] in the Lake Victoria Crescent. Additionally, 8.2% (2/11) of the parasites recorded by [8] had a mean intensity of five or more individuals per fish, contrary to the 43.8% (7/16) of the parasite genera recorded in the present study that had a mean intensity exceeding 10 individuals per fish. Certainly, the difference in infestation rate and species richness in the two studies may be due to the different fish sampling efforts used. About 140 fish samples were collected from only 25 fish farms, five from each of the districts of Masaka, Mpigi/Mityana, Wakiso, Mukono and Kampala and examined for parasites by [8], while in the present study, 640 fish samples were collected from 32 fish farms, eight farms from Buikwe, five from Wakiso, four from Bugiri, three from Masaka and Mukono, two from Mpigi, Busia, Tororo, and Namayingo, and one from Jinja and examined for parasites. However, the high infestation rate recorded in the present study may be largely caused by intensification of aquaculture along the Lake Victoria Crescent [3]. Particularly, about 46% (15/32) of fish farms visited during the study were characterized by high stocking densities as seen in Table 6 and this was also evidenced by [54,55]. The increased fish biomass stocked disrupts the parasite-fish interaction [9] by causing stress, poor feeding ability and injuries, thereby increasing the fish’s susceptibility to parasitic attack [56]. Notably, the prevalence and mean abundance for Trichodina spp. obtained in the study agrees with [8], who recorded the protozoan as the most prevalent parasite. In addition to the high prevalence and mean abundance documented in the current study, a high Berger–Parker Dominance index (d) of 0.79 for Trichodina spp. was recorded, which revealed the continued poor water quality in fish farms in the Lake Victoria Crescent over the years, as Trichodina spp. are commonly associated with heavy parasitic infestations of fish under stress due to poor water quality [43]. The persistent poor water quality may be associated with overstocking, uncontrolled addition of livestock and poultry manure in ponds, low water exchange, poor siting of cages, and overfeeding. For that reason, parasite diversity and high infestation rates reported in the study depict an increasing parasite burden in the Lake Victoria Crescent which needs urgent attention.
4.2. Prevalence and Mean Intensities of Parasites Recovered from Oreochromis niloticus in the Different Culture Systems
The current study made a comparative assessment of the prevalence and mean intensities of parasite genera of farmed Nile tilapia in the different culture systems in the Lake Victoria Crescent. The Pond grow-out and Hatchery farming systems had higher numbers of parasite genera recovered as compared to Cage grow-out (lake) and Cage grow-out (reservoir) culture systems. The Pond grow-out farms were characterized by low dissolved oxygen, high ammonia levels, poor feeding, high stocking densities, use of wild fish catch as seed for stocking, absence of disinfection and wild fish entry as documented in Table 6. Likewise, Hatchery farms in the study had high ammonia levels and presence of intermediate hosts (Table 6). Therefore, the poor water quality and farm management systems recorded in these two culture systems affect the fish physiological functions and metabolic rate hence increasing their vulnerability to different parasitic attack [23,57,58,59]. Unlike cages in the lake, cages in the reservoirs and hatchery ponds especially in the out-door hatchery system provide better environmental conditions and habitat for intermediate hosts like copepods, snails and fish-eating birds which are essential for the life cycles of Neascus, Clinostomum, Contracaecum, Amirthalingamia and Diphyllobothrium species. More so, these different parasite types may be introduced in the cages in the reservoirs and hatchery ponds through; transfer of infected live brood fish, transfer of eggs from infected to uninfected farm, movement of birds or faeces of infected birds, human movement from infected farms to uninfected hatcheries, movement of wild fish and infected water in case of flooding [60].
The protozoan parasite Trichodina spp. was recorded in all the four fish culture systems with prevalence and mean intensities being much higher in Cage grow-out (reservoir) farms. Definitely, the high prevalence of Trichodina spp. and Dactylogyrus spp. and high mean intensities of Trichodina spp. in Cage grow-out (reservoir) farming system is caused by poor water quality as evidenced in Table 6. Cage grow-out (reservoir) farmers tend to utilize sand mining holes filled with water for fish culture yet they are small and have no inlets and outlets, contrary to the large and open reservoirs with many inlets and outlets utilized elsewhere [61]. Additionally, the Pond grow-out farming system had prevalence of Trichodina spp. higher than that of the Cage grow-out (lake) farming system and this is similar to an earlier report by [23], who described Trichodina spp. prevalence in pond farmed fish being higher than that in cage (lake) cultured fish. The higher Trichodina spp. prevalence in ponds than cages (lake) in both studies is linked to the fish stress caused by poor water quality, thus, resulting heavy infestations [23]. Other than the Dactylogyrus and Trichodina species, parasite genera such as Eimeria, Chilodonella , Ambiphrya and Diphyllobothrium species were also documented with relatively high mean intensities in fish farmed in either Hatchery or Pond grow-out farming systems, and this indicated that these two culture systems provided a better habitat for a good number of parasites genera as earlier discussed [22].
4.3. Water Quality, Farm Management Practices and Parasitic Infestation
4.3.1. Water Quality and Farm Management Practices in the Different Culture Systems
Water quality and farm management practices are important factors when it comes to aquatic animal health management [15]. Of the water quality parameters assessed in the different culture systems, ammonia fell out of the recommended limits in all. The high ammonia levels in the culture systems may be attributed to the high stocking densities in some fish farms as identified in Table 6. The increased stocked biomass is always associated with increased amounts of uneaten feed and decrease in dissolved oxygen concentration from the fish waste produced, thus leading to increased ammonia concentrations [62]. In the same way, the higher ammonia levels in the Cage grow-out (lake) farms may be brought about by overfeeding, use of protein rich feed, excess feed decays and excreted ammonia from fish as reported by [63]. Furthermore, the high ammonia levels in Cage grow-out (reservoir) farms maybe caused by inadequate water filtration or circulation as they were found to have no inlets and outlets [61]. Other than Cage grow-out (lake) farms, the temperatures recorded were outside the recommended limits for Nile tilapia farming. Surely, the lower temperatures were brought about by the rains since the study was carried out in the rainy season. Definitely, water temperatures in Cage grow-out (lake) farms are usually stable due to the large water mass while Pond grow-out, Cage grow-out (reservoir) and Hatchery farms are exposed to seasonal temperature variation [64]. Furthermore, high conductivity levels were evidenced in Cage grow-out (lake) and Cage grow-out (reservoir). However, the high conductivity in these cage farms indicates possible water pollution from either agricultural runoff or industrial waste leak, which brings along high concentration of dissolved ions, thus the increased conductivity concentration [65]. Therefore this calls for proper sitting of cages in the lake or reservoirs in areas far away from these anthropogenic activities [66]. As shown in Table 6, most cage grow-out (lake) and Hatchery farmers obtained fish seed from certified hatcheries, fed fish adequately and carried out disinfection. Certainly, most of these farms were located in Wakiso, Mukono and Buikwe districts with a high GDP per capita of ($2496), ($1653) and ($769) respectively as compared to other districts [67]. This meant that fish farmers were financially capable of buying fish seed from certified hatcheries, commercial fish feed and disinfectants. Furthermore, wild fish and intermediate hosts were observed in a few farms in all farming systems. This maybe due to the fact that some farmers hardly install inlet and outlet pipes in the ponds, screen the inlet and outlet pipes in ponds, build high pond dykes to prevent flash floods, clear grasses around ponds, remove debris at the pond bottom, repair the old or worn out fish cage nets, or disinfect the farm equipment and culture systems. In addition, these fish farmers were found in districts outside the central region of Uganda, which districts are characterized by a lower financial status and farmers usually rely on government for support [67,68], therefore, they couldn’t afford practising the mentioned good farm management practices.
4.3.2. Relationship Between Parasitic Infestation and Farm Management Practices
This study evaluated parasitic infestation and farm management practices in the Lake Victoria Crescent and any link between the practices and parasite prevalence. All fish farms in the study irrespective of the culture system, were infested with parasites and infestation levels ranged from very severe/ severe, intermediate/ very frequent, normal/ frequent to gradual/ rare infestation as seen in Figure 3. We could link these infestation dynamics to the management practices; fish seed source, feeding and nutrition, control of intermediate hosts and control of wild fish entry as reported earlier in the study, as they had a significant association with parasite prevalence. Similarly, an earlier report from [7] revealed that most farmers had little knowledge of good farm management practices and biosecurity measures, thus the relatively high parasitic infestation in the Crescent. Furthermore, it was established that disinfection was not statistically associated with the general parasitic infestation in the Crescent, since 47% of the fish farmers hardly practise it on the farm as indicated in Table 6. This agrees with a previous study by [15] which showed that only Hatchery farmers disinfected the farm equipment and culture facilities routinely unlike Grow-out farmers.
The study further evaluated the relationship between parasitic infestation with farm management practices in Pond grow-out and Cage grow-out (lake) farming system. Parasite prevalence in Pond grow-out farming system was significantly associated with all the farm management practices in the study. Of all the Pond grow-out farms visited, 72% (13/18), 61% (11/18), 67% (12/18), 56% (10/18), 39% (7/18) and 56% (10/18) obtained fish seed from wild catch or from fellow farmers; overstocked the ponds; fed fish inappropriately; hardly disinfected farm equipment and ponds; hardly controlled the proliferation of intermediate hosts; hardly controlled wild fish entry into culture systems respectively. This therefore explains the severe and very frequent infestation recorded in this culture system (Figure 3). Certainly, fish seed obtained from wild catch or fellow fish farmers by Pond grow-out farmers other than from certified hatcheries will always carry parasites along with them, which in turn increases the parasite populations in the production system [60,69]. Additionally, the inappropriate feeding of farmed fish has an impact on the growth and health of fish since an adequate supply of fish nutrient requirements is not met [70], thus increasing the fish’s susceptibility to parasitic attack [21]. Furthermore, the increased stocked biomass in the ponds decreases dissolved oxygen concentration in water and increases ammonia accumulation, fish stress and waste from fecal and uneaten feed, hence reducing the fish immune system making it vulnerable to parasites [58]. Moreover, disinfection is a common disease management tool used to reduce or eradicate parasites in aquaculture [71]. For this case, Pond grow-out farmers may apply these chemicals on the farm equipment and pond facilities in sufficient concentrations and for sufficient periods to kill all pathogenic organisms including parasites that would otherwise gain access to the ponds [72]. Definitely, control the intermediate hosts’ population is crucial to pond farmers since intermediate hosts like copepods, snails and fish-eating birds are essential for the life cycles of some parasites recorded in the study such as Neascus, Clinostomum, Contracaecum, Amirthalingamia and Diphyllobothrium species [73]. Surely, these farmers may need to remove excess algae on water surfaces, decaying plant matter in the pond and debris at the pond bottom since all these provide food for snails and copepods. Furthermore, pond farmers may as well as cover the ponds with overhead wire, line, screen, or netting to prevent access of the birds. Finally, in regard with wild fish entry into ponds, farmers should screen all the inlet pipes because these wild fish not only increase the carrying capacity of the culture system, compete for feed and dissolved oxygen with farmed fish but also spread the parasites to the farmed fish [74].
Unlike for the Pond grow-out farming system, there was no very severe/ severe parasitic infestation in Cage grow-out (lake) farming system. Notably, 67% (6/9) of the Cage grow-out (lake) farms had either normal/ frequent or gradual/ rare infestation while the remaining few had intermediate/ very frequent infestation (Figure 3). This could be linked to the following farm management practices; stocking density, feeding and nutrition and control of wild fish entry which were significantly associated with the parasite prevalence as shown in Table 8. According to [68], Cage grow-out (lake) farmers are usually of a better financial status than Pond grow-out farmers in Uganda and therefore, they are able to not only access public but private agricultural extension workers who provide technical support to them in terms of proper stocking densities, feeding and feed management and measures to control entry and populations of intermediate hosts. Assuredly, optimum stocking density in fish cages not only prevents accumulation of fish waste and uneaten feed at the cage bottom, fish stress due to crowding, water quality deterioration but also increases feed conversion ratio [75], thus increasing the fish resistance to parasitic attack [21]. Furthermore, the provision of good quality feed having high nutritional value in proper feeding regimes and feed composition impacts on the farmed fish health [70], which also increases the fish resistance to parasitic attack [21]. Notably, Cage grow-out (lake) farmers should always use cages made of durable material such as galvanized and plastic coated welded wire mesh, plastic and nylon netting with an additional larger mesh and stronger twine built around nylon netting. Certainly, this kind of cage design will be able to prevent the wild fish, that gets attracted to waste feed from the cages, from accessing fish inside in the cage, thus preventing parasite transmission from the wild fish to the farmed fish [69].
5. Conclusions
The results obtained in the current study revealed a high parasitic infestation in the Lake Victoria Crescent with Trichodina spp. being the most prevalent and abundant of all parasite genera recovered in all the farming systems. This indicates the poor water quality in the Crescent and therefore, farmers need to adopt the water quality management measures since water is essential for the health and growth of fish. Furthermore, Fish from Pond grow-out and Hatchery farming system harboured ≥ 11 parasite genera while ≤ 5 parasite genera were found in Cage grow-out (lake) and Cage grow-out (reservoir) farms. This indicates distinct parasite diversity of farmed fish between the land and water based aquatic environments as each provides different habitat and environmental conditions for the different parasites. Further comparative assessments between Pond grow-out and Cage grow-out (lake) systems revealed that higher parasitic infestation was exhibited in Pond grow-out and was statistically associated with all the farm management practices unlike in Cage grow-out (lake). Therefore, it is important to educate the pond fish farmers on better sanitary and farm management strategies in order to control the parasite burden on their farms.
Author Contributions
N.L: Conceptualization, Data Curation, Formal Analysis, Investigation, Methodology, Validation, Visualization, Writing—Original Draft, Writing—Review and Editing; J.J.K.: Conceptualization, Investigation, Methodology, Supervision, Validation, Visualization, Writing—Review and Editing; T.M.: Conceptualization, Data Curation, Formal Analysis, Investigation, Methodology, Supervision, Validation, Visualization; C.A.: Conceptualization, Data Curation, Formal Analysis, Investigation, Methodology, Resources; M.S.: Conceptualization, Data Curation, Formal Analysis, Methodology; J.W.: Conceptualization, Data Curation, Investigation, Methodology, Resources, Supervision, Funding Acquisition, Project Administration. All authors have read and agreed to the published version of the manuscript.
Funding
This work was funded by National Fisheries Resources Research Institute - National Agricultural Research Organization, Uganda (NARO/CCGS/5/18/18)
Institutional Review Board Statement
Permission was sought and gotten from the Directorate of Fisheries Resources, Ministry of Agriculture, Animal Industry and Fisheries, Entebbe, Uganda, to collect and use live fish samples. All procedures were conducted within the provisions of Section 12 of The Animals (Prevention of Cruelty) Act [76]. Based on these provisions there were no limitations for performing the investigations under this paper.
Informed Consent Statement
Not Applicable
Data Availability Statement
The data presented in this study are available on request from the corresponding author
Acknowledgments
The authors are grateful to National Fisheries Resources Research Institute - National Agricultural Research Organization for the research funding.
Conflicts of Interest
The authors disclosed no conflict of interest to anybody or any organization
References
- FAO. The State of World Fisheries and Aquaculture 2024. Food and Agriculture Organization: Rome, Italy, 2024. Available online: https://openknowledge.fao.org/items/ef79a6ba-d8df-41b9-9e87-2b6edd811511 (accessed on 30 August 2024).
- Magunda, M. Situational analysis study of the agriculture sector in Uganda CCAFS Report, CGIAR Research Program on Climate Change, Agriculture and Food Security (CCAFS).CCAFS: Wageningen,Netherlands, 2020. Available online: https://hdl.handle.net/10568/111685 (accessed on 16 August 2024).
- MAAIF. Annual performance report of financial year 2019/2020; Ministry of Agriculture, Animal Industry and Fisheries: Entebbe, Uganda, 2020. [Google Scholar]
- FAO. The state of Food and Agriculture 2007. Food and Agriculture Organization: Rome, Italy, 2007. Available online: https://openknowledge.fao.org/server/api/core/bitstreams/d0c64d8e-f537-40a7-970e-bb89733fc54d/content (accessed on 30 August 2024).
- Adeleke, B.; Robertson-Andersson, D.; Moodley, G.; Taylor, S. Aquaculture in Africa: A comparative review of Egypt, Nigeria, and Uganda vis-a-vis South Africa. Rev. Fish. Sci. Aquac. 2021, 29, 167–197. [Google Scholar] [CrossRef]
- Kasozi, N.; Rutaisire, J.; Nandi, S.; Sundaray, J.K. A review of Uganda and India’s freshwater aquaculture: Key practices and experience from each country. J. Ecol. Nat. Environ. 2017, 9, 15–29. [Google Scholar]
- Walakira, J.; et al. Common fish diseases and parasites affecting wild and farmed tilapia and catfish in central and western Uganda. Uganda J. Agric. Sci. 2014, 15, 1–11. [Google Scholar]
- Akoll, P.; Konecny, R.; Mwanja, W.; Nattabi, J.K.; Agoe, C.; Schiemer, F. Parasite fauna of farmed Nile tilapia (Oreochromis niloticus) and African catfish (Clarias ariepinus) in Uganda. Parasitol. Res. 2011, 110, 315–323. [Google Scholar] [CrossRef] [PubMed]
- Mishra, S.S.; Dhiman, M.; Swain, P.; Das, B.K. Fish diseases and health management issues in aquaculture ICAR-CIFA Training manual No.18; Central Institute of Freshwater Aquaculture: Bhubaneswar, India, 2015. [Google Scholar]
- Modu, B.M.; Zaleha, K.; Shaharom-Harrison, F.M. Water quality assessment using monogenean gill parasites of fish in Kenyir Lake, Malaysia. Nig. J. Fish. Aquac. 2014, 2, 37–47. [Google Scholar]
- Delwar, M.; Kabil, M.; Habibur, M. Water quality parameters and incidence of fish diseases in some water bodies in Natore, Bangladesh. J. Earth Sci. 2011, 2, 27–30. [Google Scholar]
- Abowei, J.F.; Briyai, O.F.; Bassey, S.E. A Review of Some Basic Parasite Diseases in Culture Fisheries Flagellids, Dinoflagellides and Ichthyophthriasis, Ichtyobodiasis, Coccidiosis Trichodiniasis, Heminthiasis, Hirudinea Infestation, Crustacean Parsite and Ciliates. Br. J. Pharmacol. 2011, 2, 213–226. [Google Scholar]
- Md. Ali, R.F. Fish parasite: infectious diseases associated with fish parasite; Department of Aquaculture, Bangladesh Agricultural University: Mymensingh, Bangladesh, 2018. [Google Scholar]
- Shinn, A.P.; Pratoomyot, J.; Bron, J.; Brooker, A. Economic impacts of aquatic parasites on global Finfish production; Global Aquaculture Advocate: Australia, 2015. [Google Scholar]
- Akoll, P.; Mwanja, W.W. Fish health status, research and management in East Africa: past and present. Afr. J. Aquat. 2012, 37, 117–129. [Google Scholar] [CrossRef]
- Chenyambuga, S.W.; Mwandya, A.; Lamtane, H.A.; Madalla, N.A. Productivity and marketing of Nile tilapia (Oreochromis niloticus) cultured in ponds of small-scale farmers in Mvomero and Mbarali districts, Tanzania. Livest. Res. Rural Dev. 2014, 26, 3–12. [Google Scholar]
- Ragasa, C.; Ulimwengu, J.; Randriamamonjy, J.; Badibanga, T. Factors affecting performance of agricultural extension: Evidence from Democratic Republic of Congo. J. Agric. Educ. Ext. 2016, 22, 113–143. [Google Scholar] [CrossRef]
- Maulu, S.; Munganga, B.; Hasimuna, O.; Hambiya, L.; Seemani, B. A Review of the Science and Technology Developments in Zambia’s Aquaculture Industry. J. Aquac. Res. Dev. 2019, 10, 2. [Google Scholar]
- Giana, B.G.; Kate, S.H., Jose, S.D.; Catherine, C.; Scott, H.; Terrence, L.M.; Dean, R.J. Predicting parasite outbreaks in fish farms through environmental DNA; Global Aquaculture Advocate: Queensland, Australia, 2018.
- Juhásová, L.; Králová-Hromadová, I.; Zeleňáková, M.; Blišťan, P.; Bazsalovicsová, E. Transmission risk assessment of invasive fluke Fascioloides magna using GIS-modelling and multicriteria analysis methods. Helminthologia 2017, 54, 119–131. [Google Scholar] [CrossRef]
- Paladini, G.; Longshaw, M.; Gustinelli, A.; Shinn, A.P. Parasitic diseases in aquaculture: their biology, diagnosis and control. In Diagnosis and control of diseases of fish and shellfish, 1st ed.; Austin, B.A., Newaj-Fyzul, A., Eds.; John Wiley and Sons Limited: New Jersey, USA, 2017; pp. 37–107. [Google Scholar]
- Roberts, R.J. The parasitology of teleosts. In Fish pathology, 4th ed.; Roberts, R.J., Ed.; Blackwell Publishing Limited: Oxford, United Kingdom, 2012; pp. 292–338. [Google Scholar]
- Florio, D.; Gustinelli, A.; Caffara, M.; Turci, F.; Quaglio, F.; Konecny, R.; Fioravanti, M.L. Veterinary and public health aspects in Nile tilapia (Oreochromis niloticus) aquaculture in Kenya, Uganda and Ethiopia. Ittiopatologia 2009, 6, 51–93. [Google Scholar]
- Paredes-Trujillo, A.; Mendoza-Carranza, M.; Río-Rodriguez, R.E.D; Cerqueda-García, D. Comparative assessment of metazoans infestation of Nile tilapia (Oreochromis niloticus) (L.) (Perciformes: Cichlidae) in floating cages and ponds from Chiapas, Mexico. Vet Parasitol Reg Stud Reports, 2022; 34, 100757. [Google Scholar]
- UNMA. September to December 2019 seasonal rainfall outlook over. Uganda National Meteorological Authority: Kampala, Uganda, 2019. Available online: https://reliefweb.int/report/uganda/september-december-2019-seasonal-rainfall-outlook-over-uganda (accessed on 14 August 2024).
- Saad, S.M.; Salem, A.M.; Mahdy, O.A.; Ibrahim, E.S. Prevalence of metacercarial infection in some marketed fish in Giza Governorate, Egypt. J. Egypt. Soc. Parasitol. 2019, 49, 129–134. [Google Scholar] [CrossRef]
- Mitiku, M.A.; Konecny, R.; Haile, A.L. Parasites of Nile tilapia (Oreochromis niloticus) from selected fish farms and Lake Koftuin, Central Ethiopia. Ethiop. Vet. J. 2018, 22, 65–80. [Google Scholar] [CrossRef]
- El-Shahawy, I.; El-Seify, M.; Metwally, A.; Fwaz, M. Survey on endoparasitic fauna of some commercially important fishes of the River Nile, southern of Egypt (Egypt). Rev. De Med. Vet. 2017, 168, 126–134. [Google Scholar]
- Reavill, D.; Roberts, H. Diagnostic cytology of fish. Vet. Clin. Exot. Anim. Pract. 2007, 10, 207–234. [Google Scholar] [CrossRef]
- Garcia, L.S.; Procop, G.W. Diagnostic medical parasitology. Man. Commer. Methods Clin. Microbiol. Int. Ed. 2016, 284. [Google Scholar]
- Soulsby, E.J.L. Helminths, Arthropods and Protozoa of Domesticated Animals, 7th ed.; Bailliere Tindall: London, UK, 1982; p. 42–50, 800–809. [Google Scholar]
- Fleck, S.L.; Moody, A.H. Diagnostic Techniques in Medical Parasitology ELBS; Butterworth-Heinemann: London, UK, 1993. [Google Scholar]
- Ali, M.A.; Al-Rasheid, K.A.; Sakran, T.; Abdel-Baki, A.-A.; Abdel-Ghaffar, F.A. Some species of the genus Myxobolus (Myxozoa: Myxosporea) infecting freshwater fish of the River Nile, Egypt, and the impact on their hosts. Parasitol. Res. 2002, 88, 9–15. [Google Scholar] [CrossRef]
- Elseify, M.; El Shihawy, I.; Metwally, A.; Fawaz, M. Studies on nematode parasites infecting freshwater fish in Qena governorate, Kafrelsheikh. Vet. Med. J. 2015, 13, 19–34. [Google Scholar]
- Hoogendoorn, C.; Smit, N.J.; Kudlai, O. Resolution of the identity of three species of Diplostomum (Digenea: Diplostomidae) parasitising freshwater fishes in South Africa, combining molecular and morphological evidence. Int. J. Parasitol. Parasites Wildl. 2020, 11, 50–61. [Google Scholar] [CrossRef] [PubMed]
- Li, F.; Liu, X.-H.; Ge, H.-L.; Xie, C.-Y.; Cai, R.-Y.; Hu, Z.-C.; Zhang, Y.-G.; Wang, Z.-J. The discovery of Clinostomum complanatum metacercariae in farmed Chinese sucker, Myxocyprinus asiaticus. Aquaculture 2018, 495, 273–280. [Google Scholar] [CrossRef]
- Mansour, R.M. First record of Euclinostomum heterostomum from the naturally-infected heron “Ardeola ralloides” in Egypt: A light and scanning electron microscopy study. Egypt. J. Zool. 2019, 72, 22–31. [Google Scholar] [CrossRef]
- Muller, R.; Baker, J.R. Advances in Parasitology; Elsevier Science: Amsterdam, Netherlands, 1993. [Google Scholar]
- Sayed, E.; Abdallah, H.; Mohamed, A. Acanthogyrus Tilapiae Infections in Wild and Cultured Nile Tilapia Oreochromis Niloticus. Assiut Vet. Med. J. 2017, 63, 44–50. [Google Scholar]
- Sohn, W.-M. Fish-borne zoonotic trematode metacercariae in the Republic of Korea. Korean J. Parasitol. 2009, 47, S103–13. [Google Scholar] [CrossRef]
- Waikagul, J.; Thaenkham, U. Approaches to research on the systematics of fish –borne trematodes. Elsevier Inc.: Amsterdam, Netherlands, 2014, pp. 49–60.
- Hamada, S.; Arafa, S.; El-Naggar, M. A new record of the cestode Monobothrioides chalmersius (Caryophyllidea, Lytocestidae) from the catfish Clarias gariepinus in Egypt, with a note on the cholinergic components of the nervous system. J. Egypt. Ger. Soc. Zool. 2004, 43, 159–176. [Google Scholar]
- Abd-ELrahman, S.M.; Gareh, A.; Mohamed, H.I.; Alrashdi, B.M.; Dyab, A.K.; El-Khadragy, M.F.; Khairy Elbarbary, N.; Fouad, A.M.; El-Gohary, F.A.; Elmahallawy, E.K.; et al. Prevalence and Morphological Investigation of Parasitic Infection in Freshwater Fish (Nile Tilapia) from Upper Egypt. Animals 2023, 13, 1088. [Google Scholar] [CrossRef] [PubMed]
- Theodore, M.; Tamara, B.; Collette, B.; Jayde, F.; Davis, S.; Norman, S. Diseases of Wild and Cultured Fishes in Alaska. Alaska Fish and Game: Alaska, United States, 2019. Available online: https://www.adfg.alaska.gov/static/species/disease/pdfs/fishdiseases/trichophry (accessed on 15 August 2024).
- LaMotte. Fresh Water Aquaculture. Test Kit Instruction Manual Code 3633-05 2024. LaMotte Company Inc.: Maryland, United States, 2024. Available online: https://lamotte.com/amfile/file/download/file/729/product/178/ (accessed on 15 December 2024).
- Mishra, S.S.; Das, R.; Dhiman, M.; Choudhary, P.; Debbarma, J. Present status of fish disease management in freshwater aquaculture in India: State-of-the-art-review. Int. J. Fish. Aquac. 2017, 1, 003. [Google Scholar]
- Magguran, A.E. Measuring biodiversity; Blackwell Publishing: Oxford, United Kingdom, 2004. [Google Scholar]
- Bush, A.O.; Lafferty, K.D.; Lotz, J.M.; Shostak, A.W. Parasitology meets ecology on its own terms. J. Parasitol. 1997, 83, 75–583. [Google Scholar] [CrossRef]
- Williams, E.H.; Williams, L.B. Parasites off shore big game fishes of Puerto Rico and the Western Atlantic. Puerto Rico. Department of Natural Environmental Resources, University of Puerto Rico; Rio Piedras, Puerto Rico, 1996.
- Minggawati, I.; Agustinus, F.; Augusta, T.S.; Pahawang, C.P.; Francisco,T. Identification and prevalence of ectoparasites and endoparasites in Kerandang fish Channa pleurophtalma and Catfish Clarias batrachus captured from Sebangau River. Indones. Aquac. J. 2022, 21, 152–160. [Google Scholar] [CrossRef]
- NaFIRRI. Guidelines for Cage Fish Farming in Uganda. National Fisheries Resources Research Institute: Jinja, Uganda, 2018. Available online: https://www.firi.go.ug/PESCA/Outputs/Cage%20Fish%20farming%20Brochure%20July%202018.pdf (accessed on 25 August 2024).
- Stone, N.M.; Thormforde, H.K. Understanding your fish pond water analysis report. University of Arkansas Co-operative Extension Printing services: Arkansas, USA, 2003.
- Davis, J. Survey of Aquaculture effluents permitting and 1993 standards in the South. Southern Regional Aquaculture Centre, SRAC publication no 465 USA, 4PP; Southern Regional Aquaculture Centre: Mississippi, United states, 1993. [Google Scholar]
- Owani, S.; Hishamunda, N.; Cai, J. Report of the capacity building workshop on conducting aquaculture as a business in Mukono, Uganda. In Commission, Report/Rapport: SF-FAO/2012/06. October/Octobre 2012: Ebene, Mauritius, Food and Agriculture Organization of the United Nations: Rome, Italy, 2012;pp. 10 – 25.
- Isyag, N.; Atukunda, G.; Aliguma, L.; Ssebisubi, M.; Walakira, J.; Kubiriza, G.; Mbulameri, E. Assessment of national aquaculture policies and programmes in Uganda; SARNISSA: Kampala, Uganda, 2009. [Google Scholar]
- Rukera-Tabaro, S.; Mutanga, O.; Rugege, D.; Micha, J. Rearing rabbits over earthen fish ponds in Rwanda: Effects on water and sediment quality, growth, and production of Nile Tilapia Oreochromis niloticus. J. Appl. Aquac. 2012, 24, 170–181. [Google Scholar] [CrossRef]
- Molnár, K.; Székely, C.; Láng, M. Field guide to the control of warmwater fish diseases in Central and Eastern Europe, the Caucasus and Central Asia. FAO Fisheries and Aquaculture Circular No.1182. Ankara; Food and Agriculture Organization of the United Nations: Rome, Italy, 2019; p. 124. [Google Scholar]
- Paredes-trujillo, A.; Velázquez-abunader, I.; Torres-irineo, E.; Romero, D.; Vidal-martínez, V.M. Geographical distribution of protozoan and metazoan parasites of farmed Nile tilapia, Oreochromis niloticus (L.) (Perciformes : Cichlidae) in Yucatán, México. Parasit. Vectors 2016, 9, 1–16. [Google Scholar]
- Mahmoud, A.E.; Mona, S.Z.; Abdel, R.Y.; Hossam, H.A.; Osman, K.A.; Attia, A.A. Seasonal variations and prevalence of some external parasites affecting freshwater fishes reared at upper Egypt. Life Sci. 2011, 8, 397–400. [Google Scholar]
- Oidtmann, B.C.; Crane, C.N.; Thrush, M.A.; Hill, B.J.; Peeler, E.J. Ranking freshwater fish farms for the risk of pathogen introduction and spread. Prev. Vet. Med. 2011, 102, 329–340. [Google Scholar] [CrossRef] [PubMed]
- Moura, R.S.T.; Valenti, W.; Henry-Silva, G.G. Sustainability of Nile tilapia net-cage culture in a reservoir in a semi-arid region. Ecol. Indic. 2016, 66, 574–582. [Google Scholar] [CrossRef]
- Meidiana, A.; Prayogo, B.S.; Rahardja, B. The effect of different stocking densities on ammonia (NH3 ) and nitrate (NO3) concentration on striped snakehead (Channa striata) culture in the bucket. IOP Conf. Ser. Earth Environ. Sci. 2022, 1036. [Google Scholar] [CrossRef]
- Onada, O.A. Study of interrelationship among water quality parameters in earthen pond and concrete tank. MSc. Thesis, University of Ibadan, Ibadan, Nigeria, February, 2015. [Google Scholar]
- Besson, M.; Vandeputte, M.; van Arendonk, J.A.M.; Aubin, J.; de Boer, I.J.M.; Quillet, E.; Komen, H. Influence of water temperature on the economic value of growth rate in fish farming: The case of sea bass (Dicentrarchus labrax) cage farming in the Mediterranean. Aquaculture 2016, 462, 47–55. [Google Scholar] [CrossRef]
- Wetzel, R.G. Limnology: Lake and River Ecosystems (3rd ed.). Academic Press: San Diego, United States, 2001. Available online: https://books.google.co.ug/books/about/Limnology.html?id=no2hk5uPUcMC&redir_esc=y (accessed on 10 December 2024).
- Kasozi, N.; Opie, H.; Degu, G.I.; Enima, C.; Nkambo, M.; Turyashemererwa, M.; Naluwayiro, J.; Kassim, S. Site suitability assessment of selected bays along the Albert Nile for Cage Aquaculture in West Nile region of Uganda. Int. J. Fish. Aquac. 2016, 8, 87–93. [Google Scholar]
- Wang, X.; Rafa, M.; Moyer, J.D.; Li, J.; Scheer, J.; Sutton, P. Estimation and Mapping of Sub-National GDP in Uganda Using NPP-VIIRS Imagery. Remote Sens. 2019, 11, 163. [Google Scholar] [CrossRef]
- NEA. Aquaculture Road Map Uganda Opportunities in the aquaculture value chain. Netherlands Enterprise Agency: Prinses Beatrixlaan, Netherlands, 2022. Available online: https://www.rvo.nl/sites/default/files/2022-05/Aquaculture-Road-Map-Uganda-Opportunities-in-the-aquaculture-value-chain.pdf (accessed on 26 August 2024).
- Shamsi, S.; Day, S.; Zhu, X.; McLellan, M.; Barton, D.P.; Dang, M.; Nowak, B.F. Wild fish as reservoirs of 239 parasites on Australian Murray cod farms, Aquaculture 2021, 539, 736584.
- Yousif, O.M. The effects of stocking density, water exchange rate, feeding frequency and grading on size hierarchy development in juvenile Nile tilapia, Oreochromis niloticus L. Emir. J. Food Agric, 2002; 14, 45–53. [Google Scholar]
- Assefa, A.; Abunna, F. Maintenance of fish health in aquaculture: Review of epidemiological approaches for prevention and control of infectious disease of fish. Vet. Med. Int. 2018, 10. [Google Scholar] [CrossRef]
- WOAH. Manual of Diagnostic Tests for Aquatic Animals. Methods for disinfection of Aquaculture establishments; World Organization for Animal Health: Paris, france, 2009; Available online: 249 https://www.woah.org/fileadmin/Home/eng/Health_standards/aahm/2009/1.1.3_DISINFECTION.pdf. [Google Scholar]
- Otachi, E.O. Studies on occurrence of protozoan and helminth parasite in Nile tilapia (Oreochromis niloticus, L.) from Central and Eastern provinces. MSc. Thesis, Egerton University, Njoro, Kenya, July, 2009. [Google Scholar]
- Uglem, I.; Karlsen, Ø.; Sanchez-Jerez, P.; Sæther, B. Impacts of wild fishes attracted to open-cage salmonid farms in Norway. Aquac. Environ. Interact. 2014, 6, 91–103. [Google Scholar] [CrossRef]
- Espinoza-Ramos, L.A.; Quispe-Mayta, J.M.; Chili-Layme, V.; Nande, M. Effect of stocking density on growth, feed efficiency, and survival in Peruvian Grunt Anisotremus scapularis (Tschudi, 1846): From fingerlings to juvenile. Aquac. J. 2022, 2, 13–22. [Google Scholar] [CrossRef]
- ULII. Animals (Prevention of Cruelty) Act. Uganda Legal Information Institute: Kampala, Uganda, 2000. Available online: https://ulii.org/akn/ug/act/ord/1957/25/eng@2000-12-31 (accessed on 17 August 2024).
Figure 1.
Map showing fish farms visited in selected districts in the Lake Victoria Crescent.
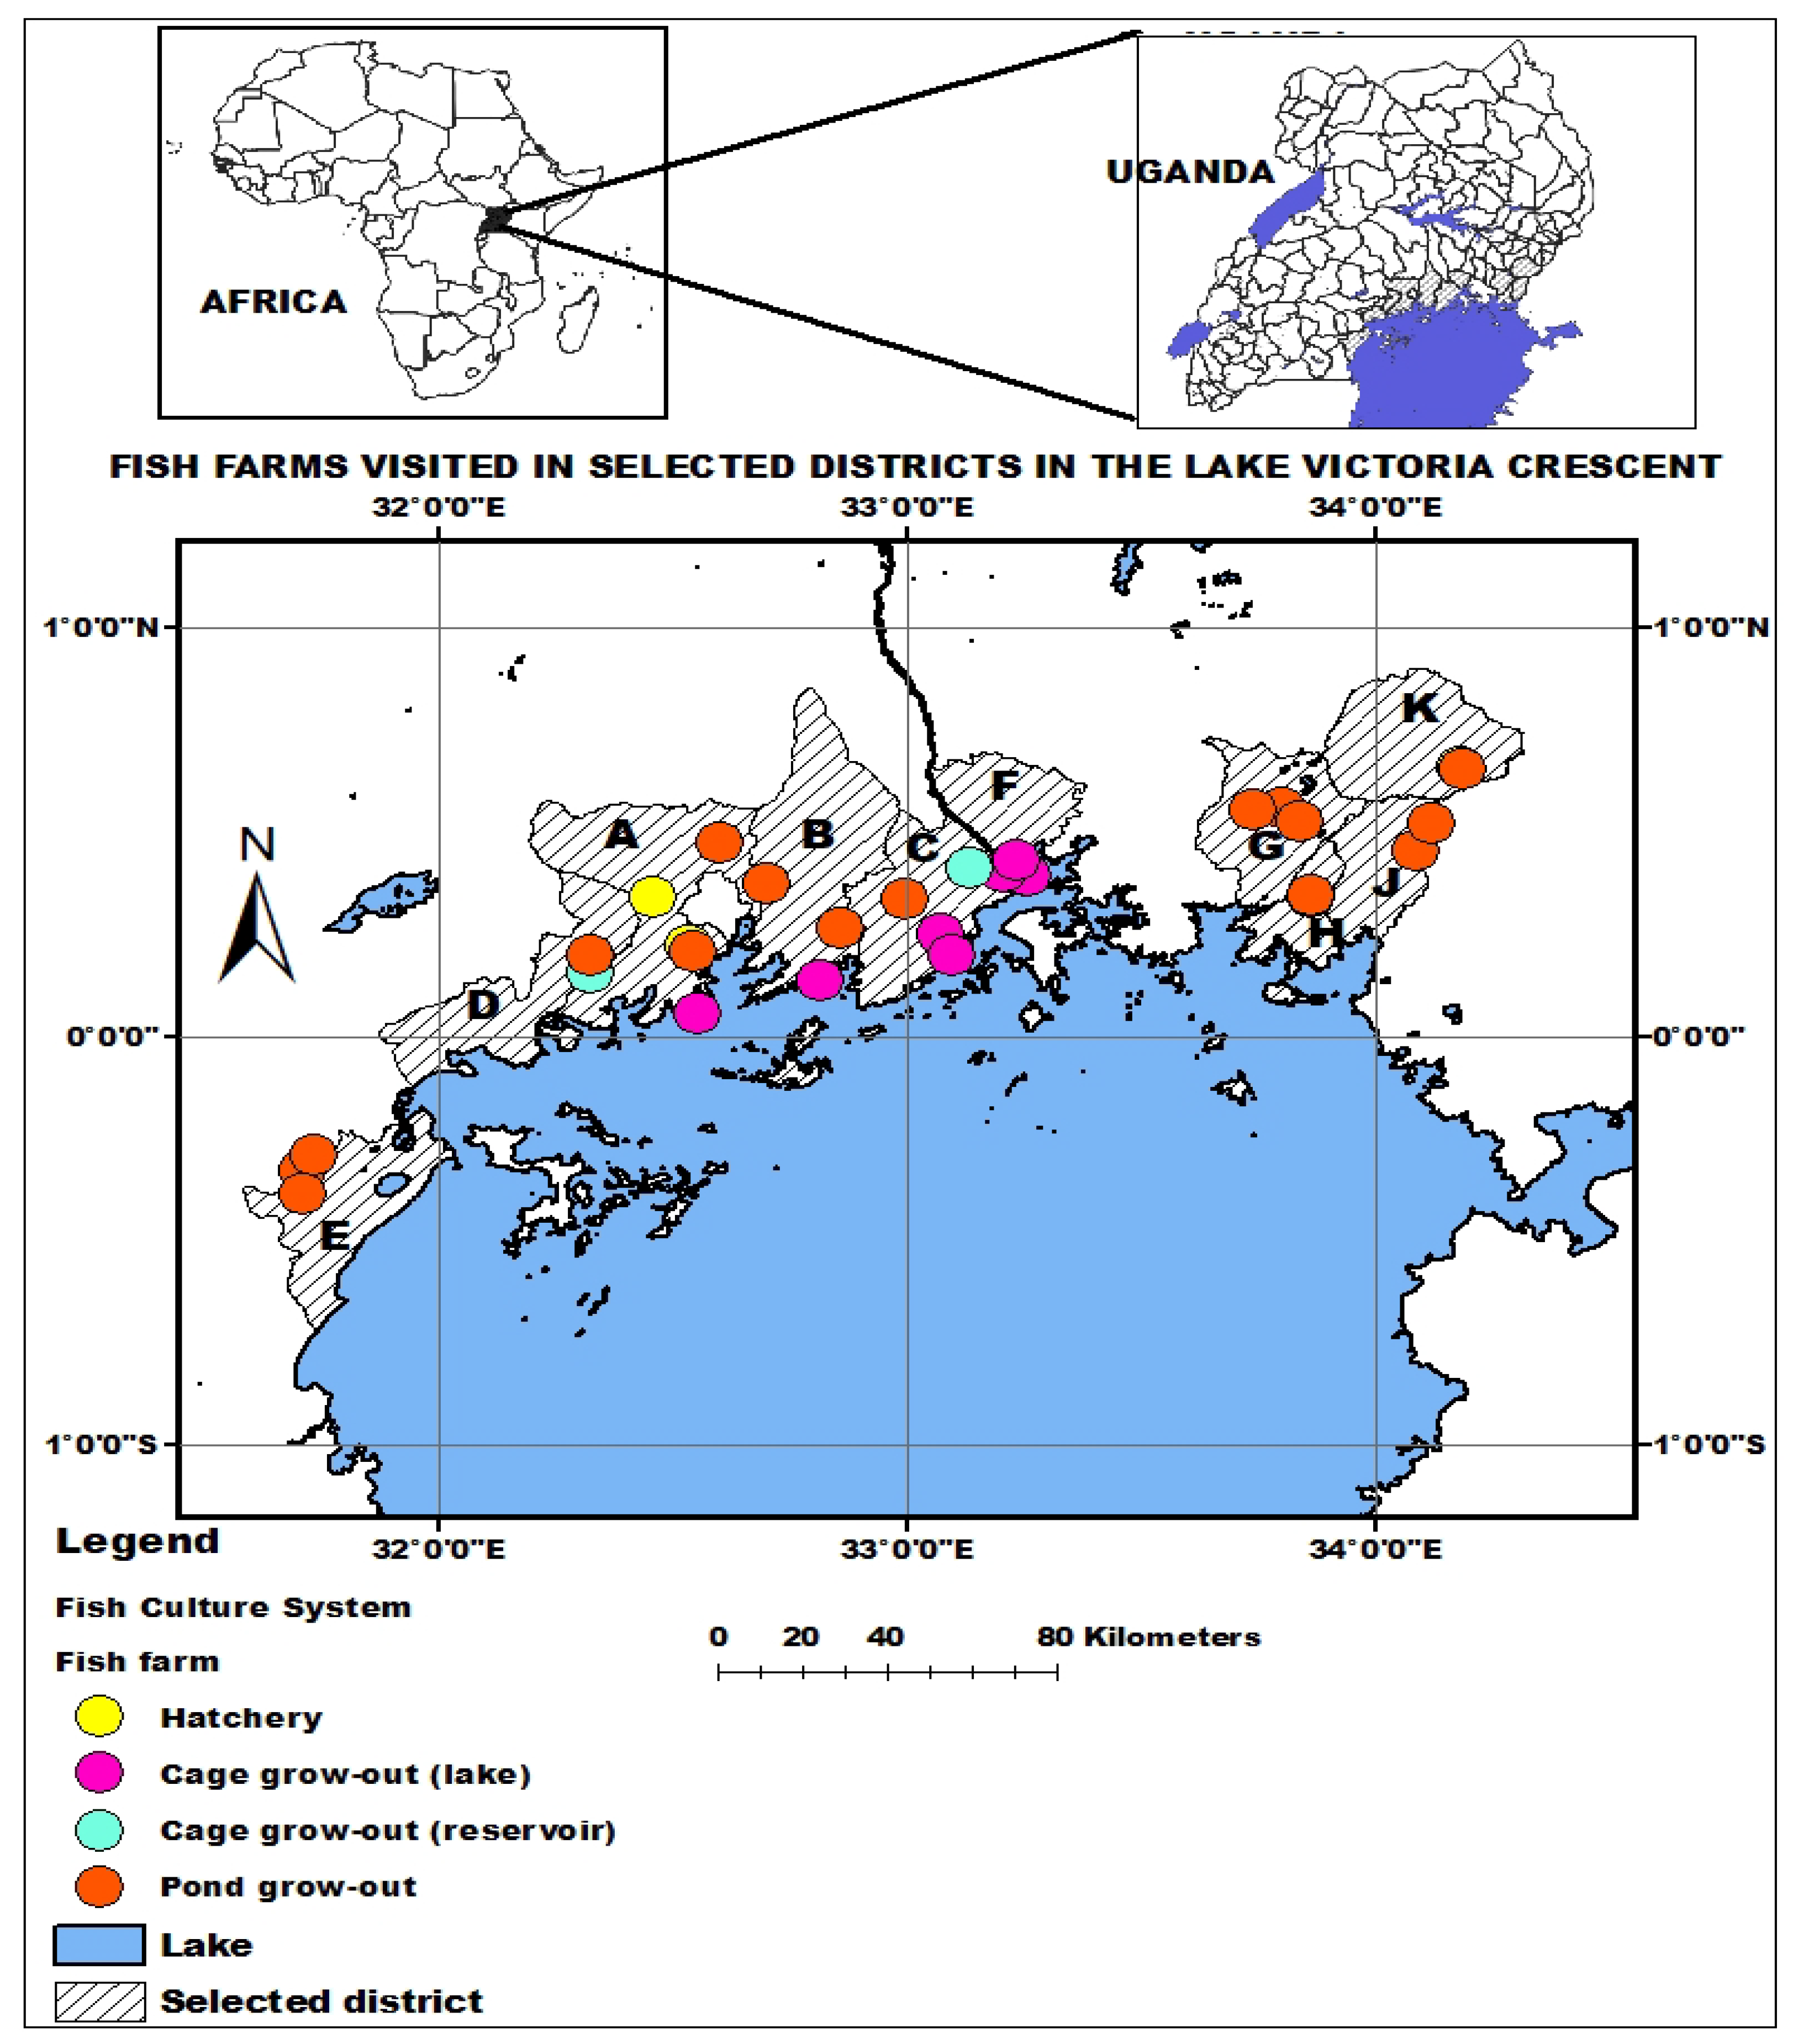
Figure 2.
Micrographs of some of the parasites identified in/ on the fish; a) Dorso-ventrally flattened oval metacercariae of Clinostomum sp. with a sucker (arrow) around the anterior mouth, b) Elongated, cyclopoid and segmented Ergasilus sp. with elongated antennae, c) Dorso-ventrally flattened Acanthocephalus sp. with spiny proboscis (arrow), d) Cylindrical shaped Trichodina sp. with numerous denticulate rings as viewed under Electronic Leica microscope at X400.
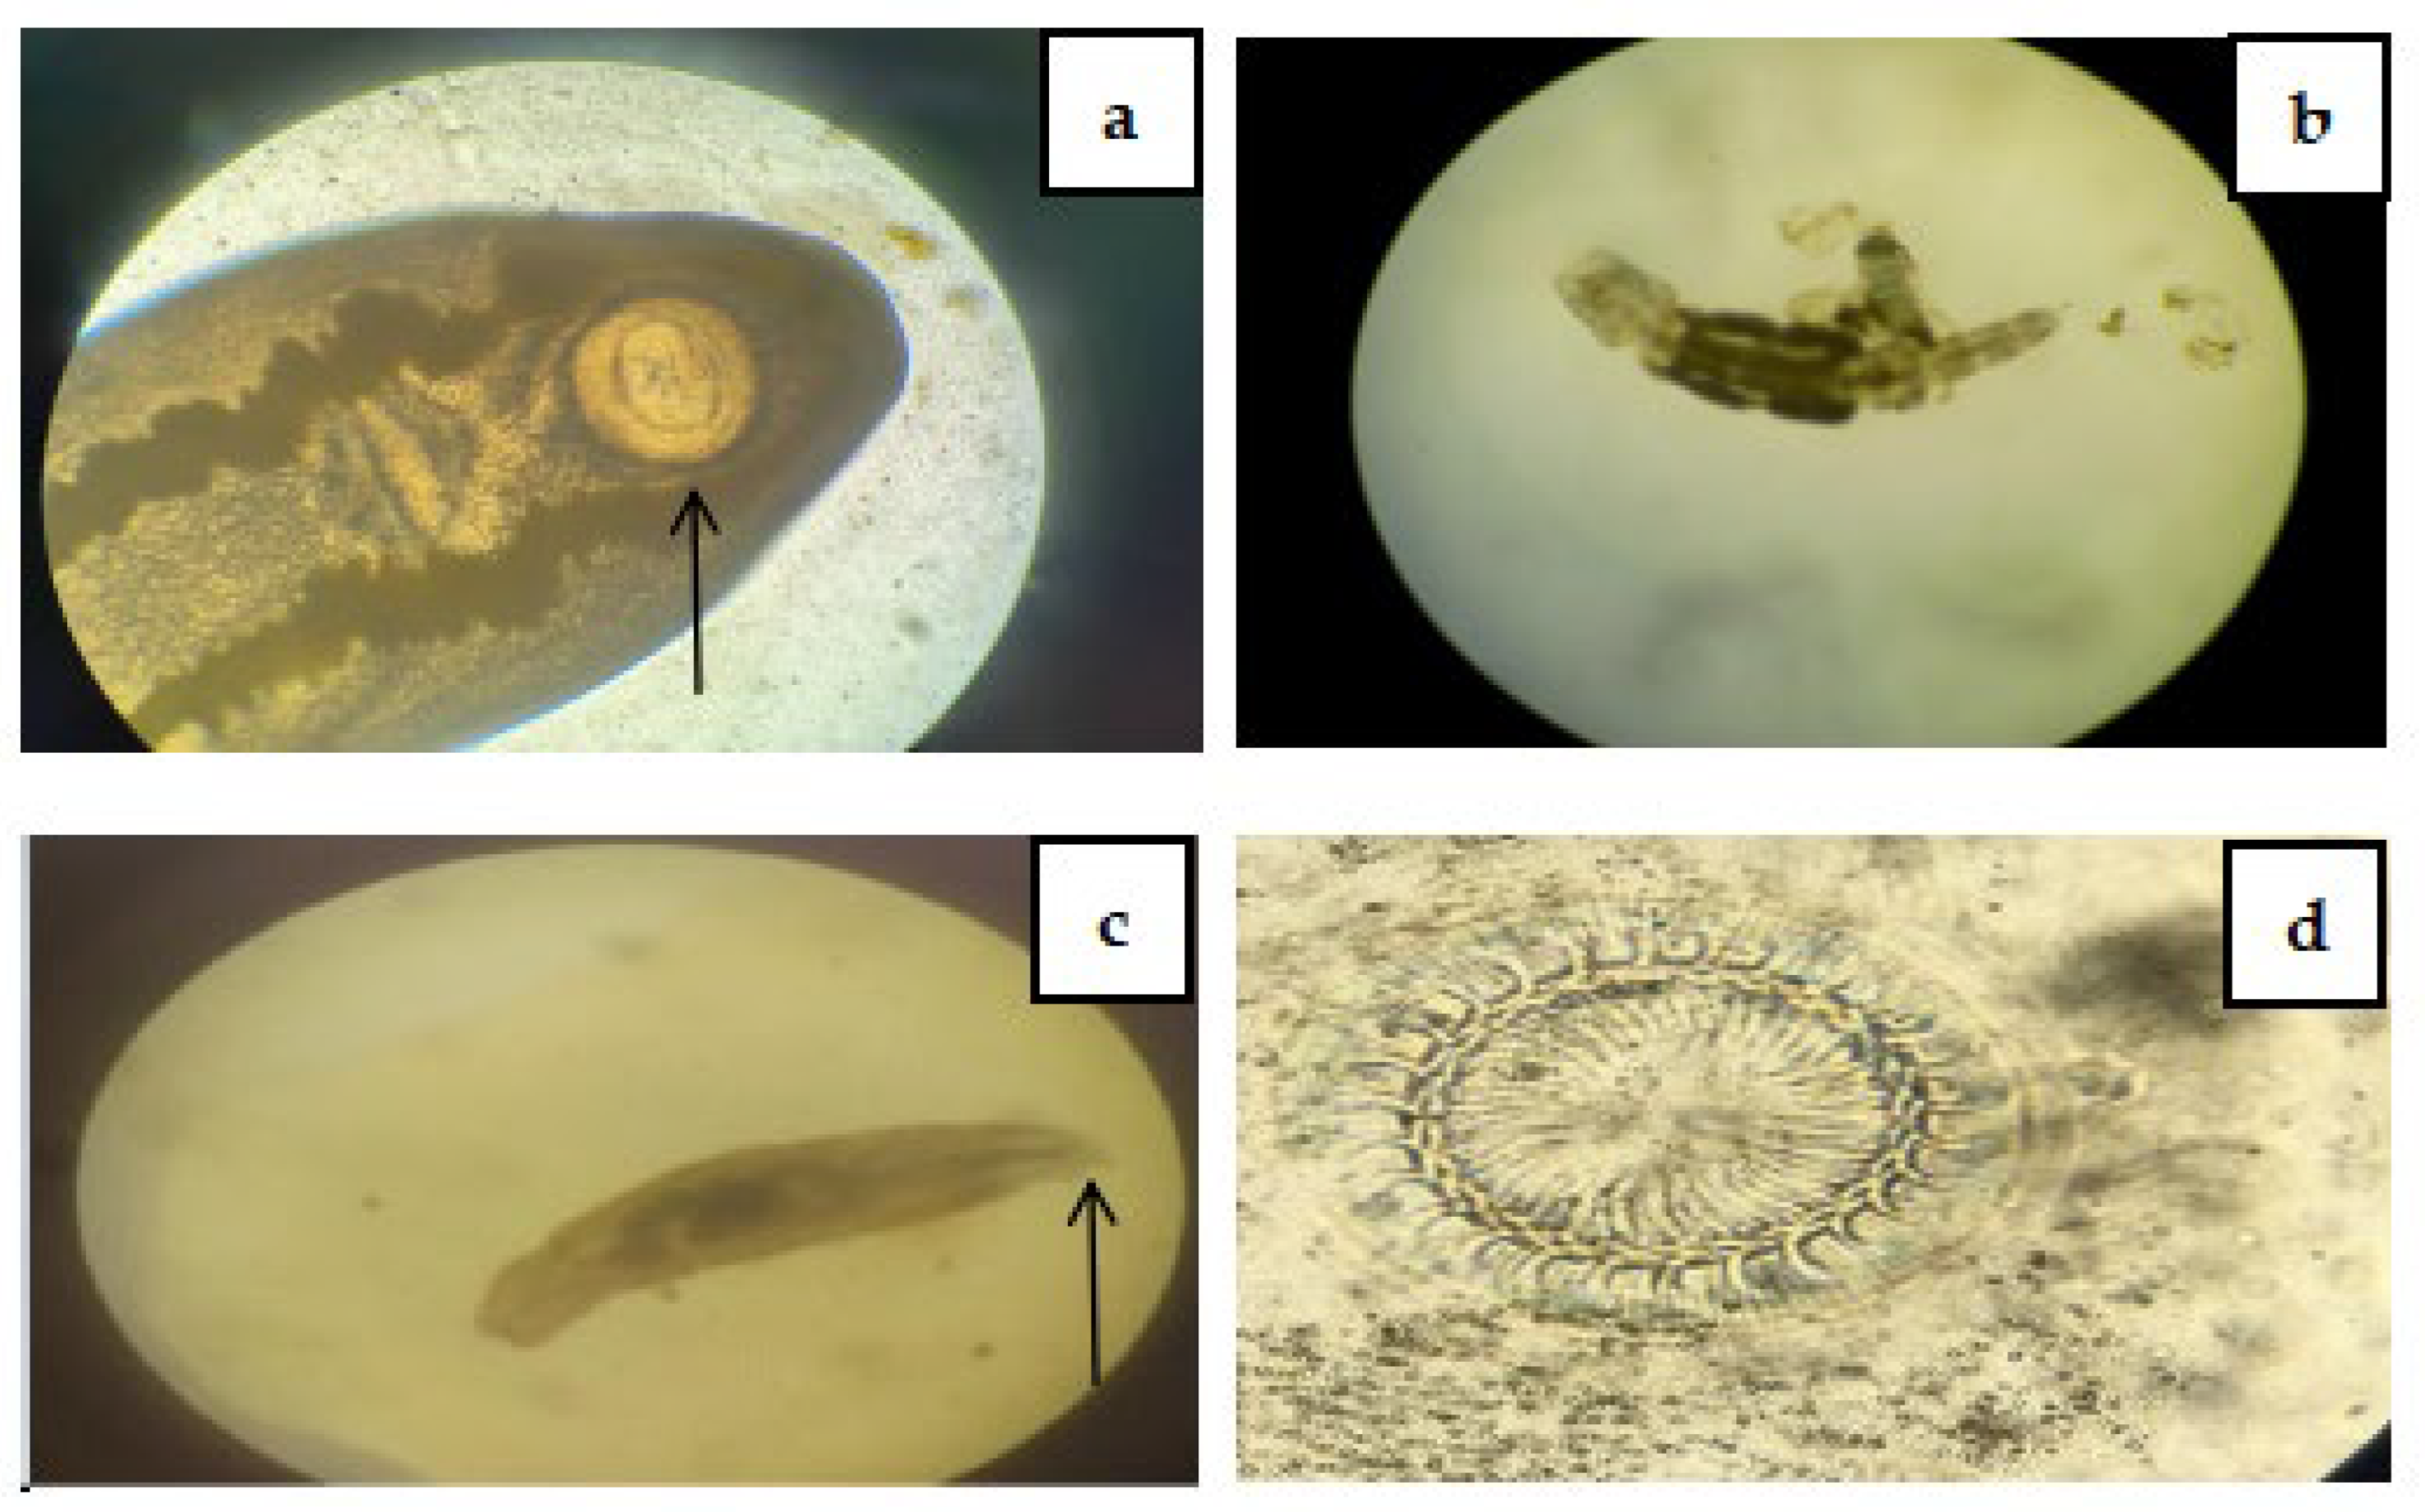
Figure 3.
Number of fish farms belonging to each class of parasitic infestation in the different culture systems.
Figure 3.
Number of fish farms belonging to each class of parasitic infestation in the different culture systems.
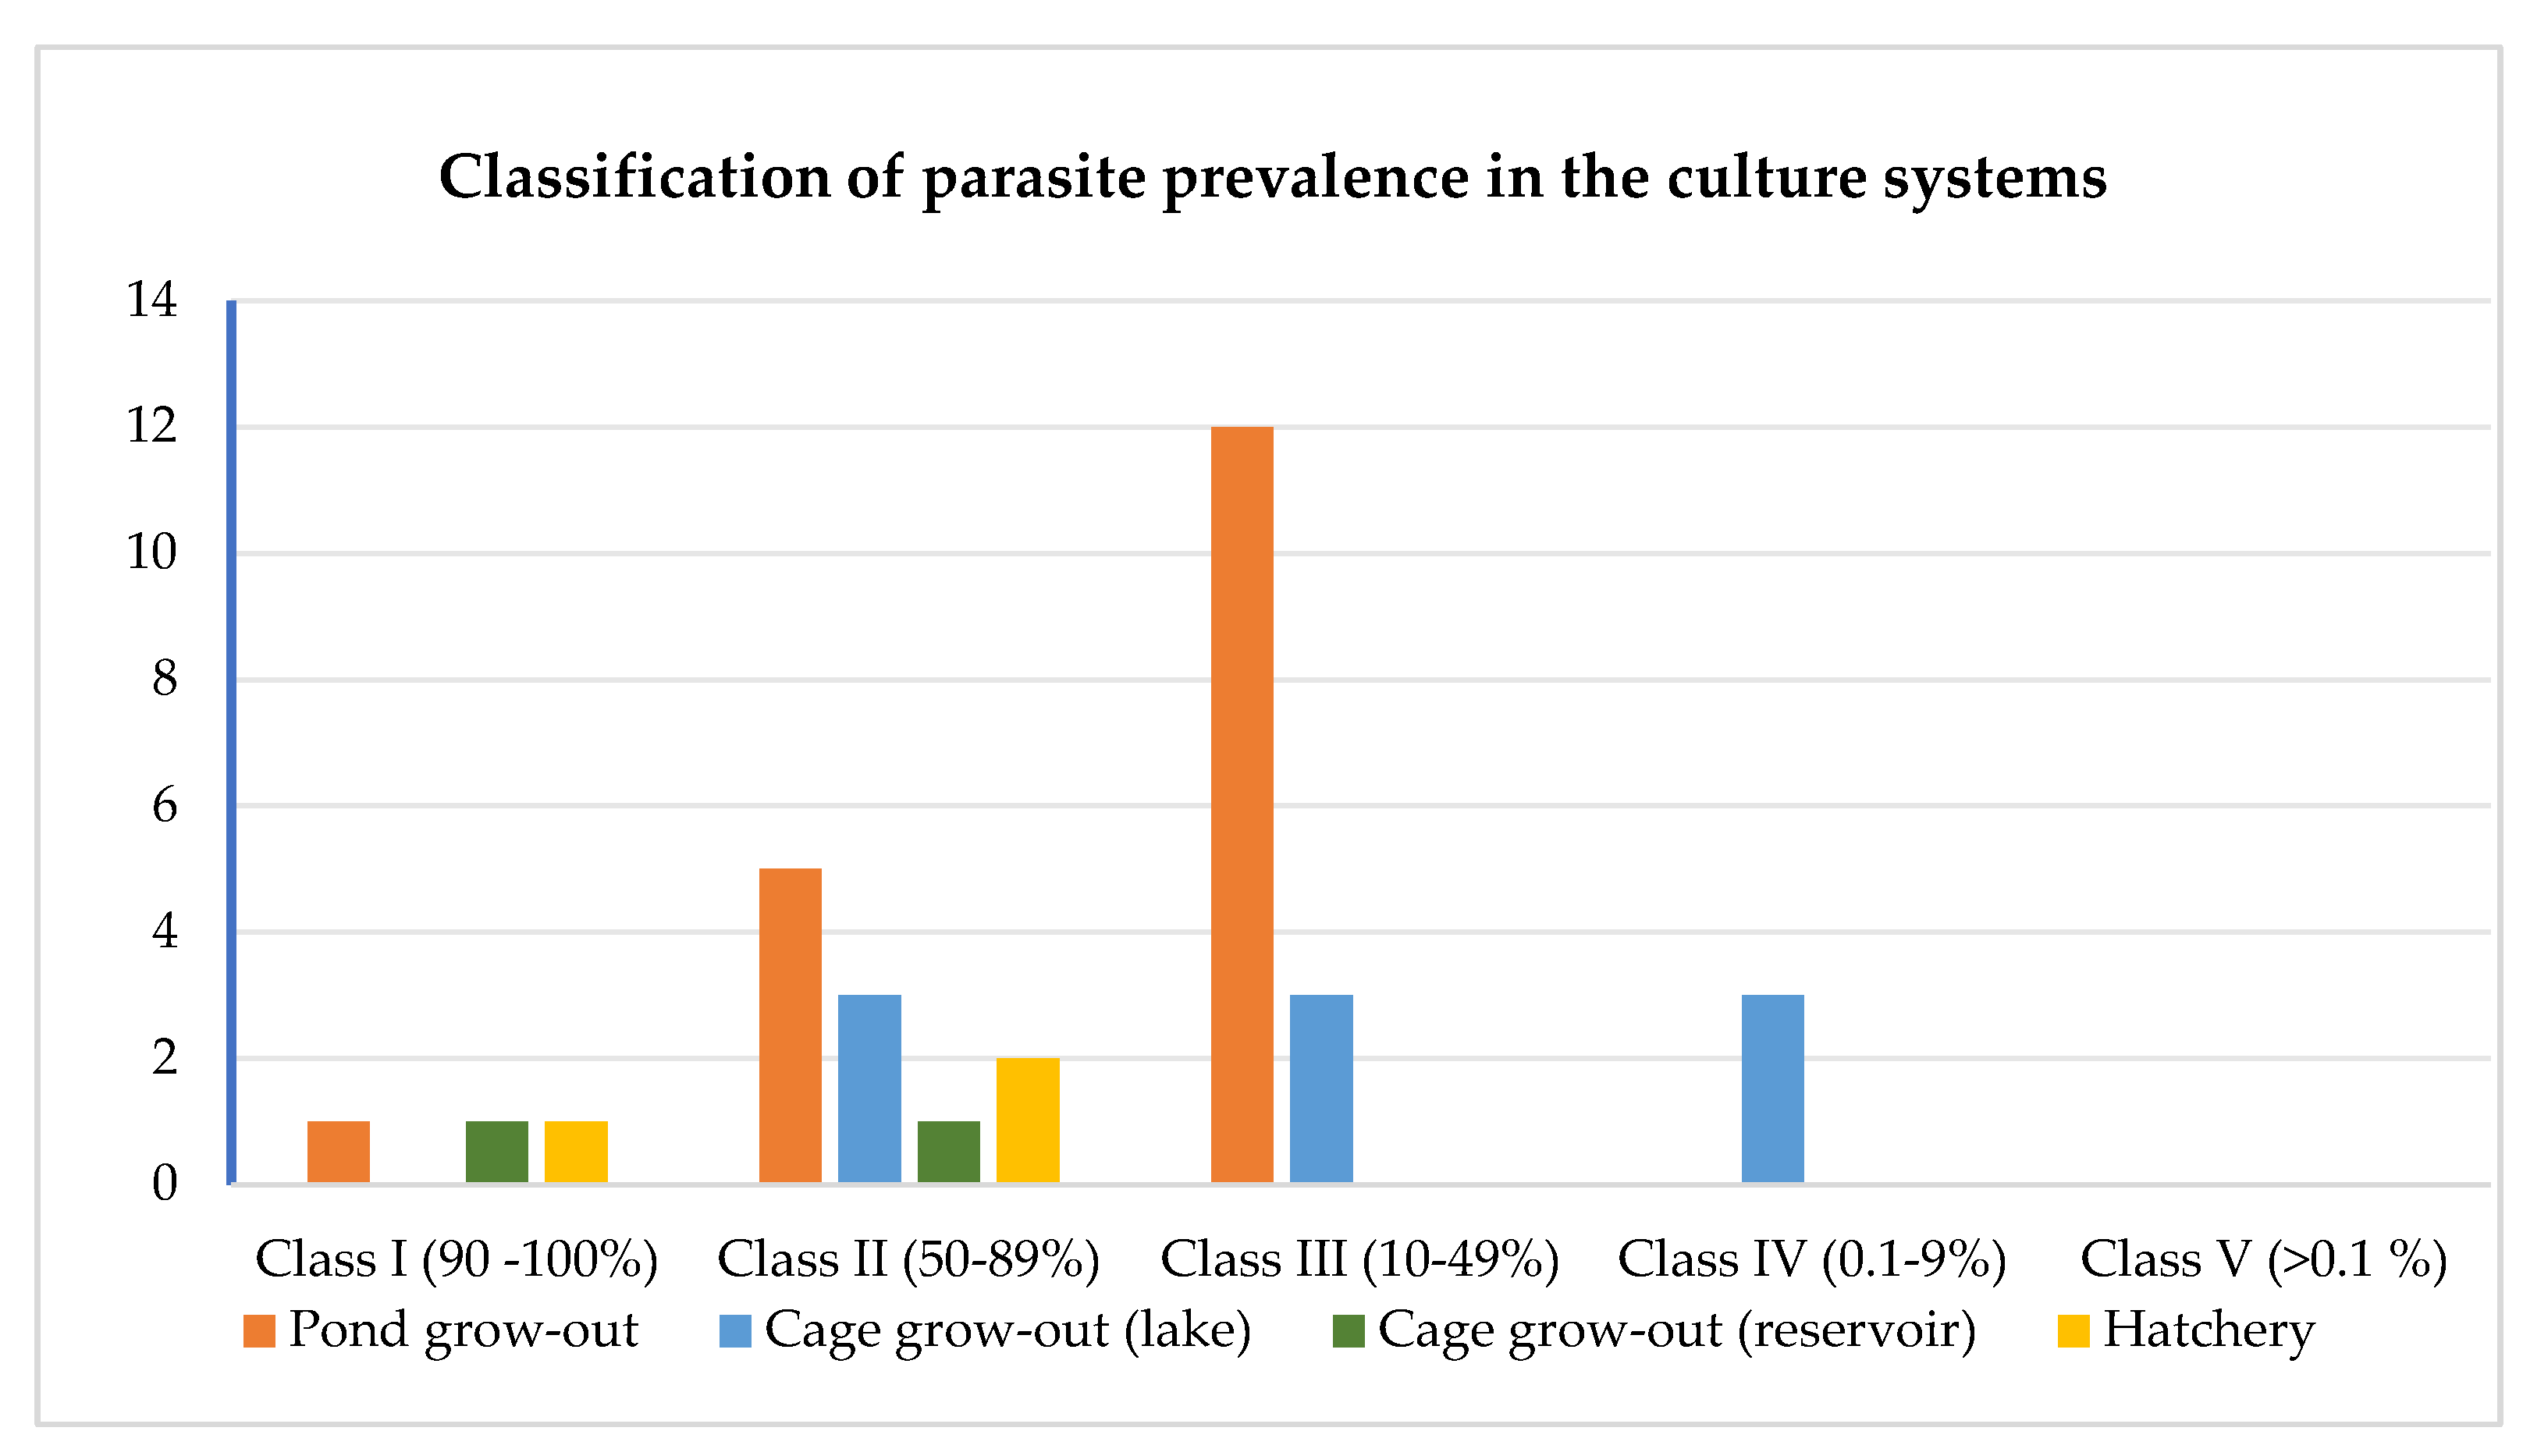

Table 1.
Prevalence criteria.
| Class | Description of Infection/ Infestation | Prevalence (%) |
|---|---|---|
| I | Very severe/ Severe | 100-90 |
| II | Intermediate/ very frequent | 89-50 |
| III | Normal/ frequent | 49-10 |
| IV | Gradual/ rare | 9-0.1 |
| V | Very rare/ almost no | >0.1 |
Table 2.
Summary of ecological characteristics of Oreochromis niloticus parasite diversity.
| Diversity parameter | Oreochromis niloticus (n = 640) |
|---|---|
| Total number of genera | 16 |
| Shannon index (H′) | 0.961 |
| Evenness (E) | 0.347 |
| Berger–Parker Dominance index (d) | 0.79 |
| Diversity estimators | |
| Chao | 16.125 |
| Jackknife | 16.998 |
Table 3.
Prevalence (P), Mean intensities (Mi) and Mean abundance (Ma) of parasitic infestation in different organs of sampled Oreochromis niloticus from the Lake Victoria Crescent.
Table 3.
Prevalence (P), Mean intensities (Mi) and Mean abundance (Ma) of parasitic infestation in different organs of sampled Oreochromis niloticus from the Lake Victoria Crescent.
| Genus | Organ infested | Prevalence (%) | Mean intensity | Mean abundance |
|---|---|---|---|---|
| Trichodina | Skin, Gills, Fins | 23.4 | 41.21 | 9.66 |
| Dactylogyrus | Gills | 14.2 | 4.16 | 0.59 |
| Neascus | Skin, Gills, Fins | 5.6 | 4.9 | 0.28 |
| Clinostomum | Skin | 3.6 | 3.22 | 0.12 |
| Ergasilus | Gills | 5.9 | 4.61 | 0.27 |
| Myxobolus | Gills, Muscles, Viscera, Gonads, Liver, Intestine (anterior), Gas bladder, Stomach, Spleen | 4.4 | 13.64 | 0.60 |
| Amirthalingamia | Intestine (anterior), Intestine (posterior) | 0.6 | 2.25 | 0.014 |
| Acanthocephalus | Intestine (anterior), Intestine (posterior | 1.4 | 1.56 | 0.022 |
| Monobothroides | Intestine (anterior), | 0.2 | 25 | 0.039 |
| Contracaecum | Intestine (posterior), Viscera | 0.3 | 3 | 0.0094 |
| Eimeria | Intestine (anterior) | 0.2 | 35 | 0.055 |
| Gyrodactylus | Gills | 0.6 | 4.5 | 0.028 |
| Chilodonella | Skin, Gills | 0.3 | 17.5 | 0.055 |
| Ichthyobodo | Gills | 1.9 | 6 | 0.11 |
| Ambiphrya | Gills | 0.3 | 12 | 0.038 |
| Diphyllobothrium | Muscles, Viscera | 3 | 11.47 | 0.34 |
Table 4.
Percentage prevalence of parasite genera of Oreochromis niloticus in different culture systems.
Table 4.
Percentage prevalence of parasite genera of Oreochromis niloticus in different culture systems.
| Genus | Prevalence per culture system | p-Value | |||
|
Pond grow-out (n=360) |
Cage grow-out (lake) (n=180) |
Cage grow-out (reservoir) (n=40) |
Hatchery (n=60) |
6.709e-13 | |
| Trichodina | 86(23.9%) | 31(17.2%) | 18(45%) | 15(25%) | |
| Dactylogyrus | 44 (12.2%) | 30(16.7%) | 8(20%) | 9(15%) | |
| Neascus | 20(5.5%) | 7(3.9%) | __ | 9(15%) | |
| Clinostomum | 14(3.9%) | 2(1.1%) | __ | 7(11.7%) | |
| Ergasilus | 15(4.2%) | __ | __ | 23(38.3%) | |
| Myxobolus | 9(2.5%) | __ | 5(12.5%) | 14(23.3%) | |
| Amirthalingamia | 1(0.3%) | __ | __ | 3(5%) | |
| Acanthocephalus | __ | __ | __ | 9(15%) | |
| Monobothroides | __ | __ | __ | 1(1.7%) | |
| Contracaecum | 2(0.6%) | __ | __ | __ | |
| Eimeria | __ | __ | __ | 1(1.7%) | |
| Gyrodactylus | __ | __ | __ | 4(6.7%) | |
| Chilodonella | 2(0.6%) | __ | __ | __ | |
| Ichthyobodo | 11(3%) | 1(0.6%) | __ | __ | |
| Ambiphrya | 2(0.6%) | __ | __ | __ | |
| Diphyllobothrium | 19(5.3%) | __ | __ | __ | |
*The Chi square test was used to compare the difference in prevalence by culture system.
Table 5.
Mean intensities of parasite genera infesting Oreochromis niloticus in different culture systems.
Table 5.
Mean intensities of parasite genera infesting Oreochromis niloticus in different culture systems.
| Genus | Overall intensity | Mean intensities in culture systems | p-Value | |||
| Pond grow-out | Cage grow-out (lake) | Cage grow-out (reservoir) | Hatchery | 3.188e-09 | ||
| Trichodina | 41.21 | 15.6±10.4 | 41.5±16.7 | 121.1±29.5 | 22±9.5 | |
| Dactylogyrus | 4.16 | 3.2±1.4 | 5.9±2.5 | 5.0±2.7 | 5.6±2.6 | |
| Neascus | 4.9 | 4.1±2.5 | 5.3±3.3 | _ | 5.4±2.3 | |
| Clinostomum | 3.22 | 2.9±1.5 | 2.5±0.7 | _ | 4.0±1.2 | |
| Ergasilus | 4.61 | 5.3±2.8 | _ | _ | 4.2±2.7 | |
| Myxobolus | 13.64 | 13.1±16.9 | _ | 19.6±8.4 | 11.9±7.7 | |
| Amirthalingamia | 2.25 | 2.0±1.0 | _ | _ | 3.0±0.0 | |
| Acanthocephalus | 1.56 | _ | _ | _ | 1.6±0.7 | |
| Monobothroides | 25 | _ | _ | _ | 25±0.0 | |
| Contracaecum | 3 | 3.0±0.0 | _ | _ | ||
| Eimeria | 35±0.0 | _ | _ | 35±0.0 | ||
| Gyrodactylus | 4.5 | _ | _ | 4.5±2.4 | ||
| Chilodonella | 17.5 | 17.5±4.9 | _ | _ | _ | |
| Ichthyobodo | 6 | 5.5±3.0 | 12±0.0 | _ | _ | |
| Ambiphrya | 12 | 12.0±1.4 | _ | _ | _ | |
| Diphyllobothrium | 11.47 | 11.5±2.4 | _ | _ | _ | |
*The Chi square test was used to compare the difference in mean intensities by culture system.
Table 6.
Mean values of water quality and farm management practices at the various culture systems.
|
Parameter |
Recommended limits* | Pond grow-out parameter mean value (farms outside recommended limits ) N=18 | Cage grow-out (lake) parameter mean value (farms outside recommended limits ) N =9 |
Cage grow-out (reservoir) parameter mean value (farms outside recommended limits ) N=2 |
Hatchery parameter mean value (farms outside recommended limits ) N=3 |
|---|---|---|---|---|---|
| DO (mg/l) | 5.5 – 10 | 5.1±2.4 (n = 7) | 5.7±1.0 (n = 4) | 3.8±1.3 (n = 2) | 5.7±1.2 (n = 1) |
| T(°C) | 26 – 32 | 24.9±1.3 (n = 13) | 26.2±0.9 (n = 4) | 24.1±0.1 (n = 2) | 24.7±0.5 (n = 3) |
| pH | 6.5–8.5 | 7.6±0.4 (n = 0) | 8.5±0.5 (n = 6) | 7.7±0.5 (n = 0) | 7.8±0.3 (n = 0) |
| Salinity (PSU) | 0 -20 | 0.06±0.05 (n = 0) | 0.04±0.01 (n = 0) | 0.03±0.07 (n = 0) | 0.06±0.03 (n = 0) |
| TDS (mgl-1) | < 0.13 | 0.08±0.07 (n = 4) | 0.05±0.01 (n = 0) | 0.05±0.07 (n = 0) | 0.09±0.04 (n = 1) |
| Conductivity (µS/cm) | 100 -2000 | 120.7±108.5 (n = 8) |
78.4±29 (n = 6) | 62.1±11.1 (n = 2) | 118.2±64.8 (n = 2) |
| Ammonia free nitrogen (mg/l) | 0 – 0.2 | 1.2±0.6 (n = 17) | 1.5±0.5 (n = 9) | 2±0.0 (n = 2) | 1.2±0.3 (n = 3) |
| Hardness (ppm) | < 50 | 36.3±23.4 (n = 5) | 22±17.2 (n = 0) | 26±8.5 (n = 0) | 31.7±25.6 (n = 1) |
| Nitrite (mgl-1) | 0 – 0.2 | 0.07±0.1 (n = 0) | 0.05±0.0 (n = 0) | 0.005±0.0 (n = 0) | 0.04±0.03 (n = 0) |
| Chloride (ppm) | <230 | 19.1±10 (n = 0) | 12.7±11.5 (n = 0) | 31.5±9.2 (n = 0) | 12±5.6 (n = 0) |
| Fish seed source | Certified hatchery-1 | 2 (n = 13) | 1 (n = 1) | 2 (n = 1) | 1 (n = 0) |
| Stocking density | Recommended -2 | 1 (n = 11) | 1 (n = 3) | 2 (n = 0) | 2 (n = 1) |
| Feeding and nutrition | Rank 4, 5 | 3 (n = 12) | 4 (n = 0) | 3 (n - 2) | 4 (n = 0) |
| Disinfection | Present-1 | 0 (n = 10) | 1 (n = 2) | 0 (n = 2) | 1 (n = 0) |
| Control of Intermediate hosts | Absent-0 | 0 (n = 7) | 0 (n = 4) | 1 (n = 2) | 1 (n = 3) |
| Control of Wild fish entry | No entry -0 | 1(n = 10) | 1 (n = 6) | 1(n = 1) | 0 (n = 1) |
Key; Fish seed source (1-Certified hatchery, 2-Other: wild catch or from fellow farmers); Feeding and nutrition status (Rank 1 to 5 according to amount of feed given, feeding frequency , time intervals of feeding and feed quality ); Disinfection (Present-1, Absent-0); Stocking density (1-overstocked, 2-recommended) ; Control of intermediate hosts (Intermediate hosts present-1 , absent-0); Control of wild fish entry (Entry of wild fish-1 , No entry-0), TDS; Total dissolved solids, N; Number of fish farms per culture system, n; number of fish farms with parameter outside recommended limits, *Recommended limits as reported by [51,52,53].
Table 7.
Association between parasite prevalence and farm management practices in all fish farms visited in the Lake Victoria Crescent.
Table 7.
Association between parasite prevalence and farm management practices in all fish farms visited in the Lake Victoria Crescent.
| Parameter | p-Value |
|---|---|
| Fish seed source | 0.00173* |
| Stocking density | 0.002705 * |
| Feeding and nutrition | 0.0003973* |
| Disinfection | 0.3007* |
| Control of Intermediate hosts | 0.02484* |
| Control of Wild fish entry | 0.04636* |
*The Fisher’s exact test used to determine if there was a significant association between farm management practices and parasite prevalence.
Table 8.
Association between parasite prevalence and farm management practices in Pond grow-out and Cage grow-out (lake) farming systems.
Table 8.
Association between parasite prevalence and farm management practices in Pond grow-out and Cage grow-out (lake) farming systems.
| Pond grow-out | Cage grow-out (lake) | |
|---|---|---|
| Parameter | p-Value | p-Value |
| Fish seed source | 0.02171 * | 1 |
| Stocking density | 0.01282 * | 0.03571* |
| Feeding and nutrition | 0.008807 * | 0.01429* |
| Disinfection | 0.03595 * | 1 |
| Control of Intermediate hosts | 0.01282 * | 1 |
| Control of Wild fish entry | 0.01785 * | 0.03571* |
*The Fisher’s exact test used to determine if there was a significant association between parasite prevalence and farm management practices in Pond grow-out and Cage grow-out (lake) farming systems.
Disclaimer/Publisher’s Note: The statements, opinions and data contained in all publications are solely those of the individual author(s) and contributor(s) and not of MDPI and/or the editor(s). MDPI and/or the editor(s) disclaim responsibility for any injury to people or property resulting from any ideas, methods, instructions or products referred to in the content. |
© 2025 by the authors. Licensee MDPI, Basel, Switzerland. This article is an open access article distributed under the terms and conditions of the Creative Commons Attribution (CC BY) license (http://creativecommons.org/licenses/by/4.0/).
Copyright: This open access article is published under a Creative Commons CC BY 4.0 license, which permit the free download, distribution, and reuse, provided that the author and preprint are cited in any reuse.


