1. Introduction
Indoor farming is an alternative method of agriculture, complementary with conventional agriculture to face the challenges of feeding a constantly growing and increasingly urbanized population in the context of global warming [
1,
2]. Indoor farming occurs in Plant Factories with Artificial Lighting (PFAL), in which climatic parameters are controlled, and the light is provided by lamps,
i.e. independent from natural sunlight. Those conditions are optimal for plants growth, which explains that indoor grown plants have higher Light, Water and Land Surface Use Efficiencies (LUE, WUE, LSUE, respectively) than greenhouses or open field productions [
3,
4,
5]. However, the main challenge of indoor farming is energy consumption. For example, it has been presented that an hydroponic indoor production needs eighty-two times more kJ kg
-1 an
-1 than a production in conventional agriculture [
6]. The cost of indoor production is three to five times higher than open field [
7] and, at an industrial scale, electricity costs represents 25% of the total cost of lettuce produced indoor [
8,
9]. Among parameters, lighting plays a key role in energy consumption, as it represents from 50 to 80% of the total electricity consumption of an PFAL [
4,
8,
10,
11].
It seems challenging to reduce energy consumption indoor farming by reducing the lighting without compromising yields. Indeed, lettuce dry weight correlates with the Daily Light Integral (DLI) in the range of 250 to 650 µmoles photons m
-2 [
12,
13,
14,
15]. Moreover, extensive research has already optimized lighting parameters, with optimal light quality between 400-700 nm, far-red supplementation (700-800 nm), optimal light intensity of 250 µmoles photons m
-2 s
-1 intensity, and an optimal photoperiod of 16 hours resulting in 14.4 moles of photons m
-2 d
-1 [
14,
16,
17,
18,
19]. Another way to reduce energy consumption could be to decrease the number of lamps used, while keeping other lighting parameters constant. In standard horizontal cultivation system, this is challenging in terms of light homogeneity. However, light homogeneity is a key parameter in indoor farming as one of its advantages is to provide consistent, uniform, and stable production throughout the year.
A promising approach to reduce energy consumption, without compromising yields or lighting homogeneity, is through new cultivation systems. Rotational cultivation systems require a low number of lamps per plant while maintaining perfect light homogeneity among them. Specifically, a small number of lamps emitting light at 360°C can be positioned at the center of the cylinder, with plants rotating around the lamps, ensuring that each plant remains equidistant from the light source.
To our knowledge, only one recent study focused on the feasibility of indoor productions in a rotational cultivation system [
20]. The objective of this work is thus to compare lettuces grown in a rotational cultivation system and in a horizontal control one in terms of yields, Water Use, Light Use, Energy Use and Land Surface Use Efficiencies, as well as quality at harvest and postharvest storage capacity. The GiGrow® rotational cultivation system has been studied, as it was designed for industrial-scale use. The rotational cultivation system used rotates at a speed of 50 minutes per revolution, which induces a constant perturbation of plants gravity perception. Thus, to bring insight into the rotation on plants physiology, we also studied photosynthesis. The plant matrix used was
L. sativa and is among the most frequently consumed vegetable of nutritional interest globally [
21], and is a standard production of indoor farming facilities.
2. Materials and Methods
2.1. Plant Material and Germination
Butterhead lettuce (Lactuca sativa L. var. fairly, ‘Enza Zaden’, The Netherlands) seeds were sown in 144 (16x9) holes germination trays filled with potting soil (TBSP, ‘Florentaise’, France). The photoperiod was 16/8 (16 hours of light, 8 hours of darkness) with respective temperatures of 24/19°C and relative humidity of 65%. Water was provided until saturation by sub irrigation on a 3-days basis with a germination solution composed of 3,2, 0,6, 0,9, 1,3, 0,8 and 0,1 mmoles L-1 of nitrogen, phosphorus, potassium, calcium, magnesium, and sulfur, respectively. The electroconductivity (EC) of the irrigation solution was equal to 0,5 mS cm-1 with a pH of 5,6. Light intensity was set at 130 µmoles m2 s-1 with Red:Blue 3:1 and ≈17% of white light, provided by LED lamps (T10 LED Grow Tube Light, HW-GL-T10-1200-36W-3Y, China).
2.2. Plant Growth
After 14 days of germination, plants were transplanted in two different cultivation systems:
A control cultivation system, horizontal (
Figure 1A). Lettuces grown in this cultivation system are referred to as CT lettuces. cultivation frames (140 x 210 cm) were installed in a growth chamber and equipped with a drip irrigation system and white light LEDs lamps (LO250 Floodlight, LO250-PSHW06040, ‘Vegeled’, Belgium). Lettuces were cultivated on pots (2 113 cm
3) filled with potting soil (VER4, ‘Florentaise’, France) with a density of 30 plants m
-2.
A Gigrow® rotational cultivation system from Futura Gaïa Technology (
Figure 1B). Lettuces grown in this cultivation system are referred to as ROT lettuces. Lettuces were transplanted in 5 holes stainless steel trays (72 x 15 x 4,5 ; l x w x h, in cm) filled with potting soil (VER4, ‘Florentaise’, France), with a density of 30 plants m
-2. Plants were rotating according to a horizontal rotation axis at a speed of 50 minutes per revolution, which provides a centrifugal force of 1,33x10
-5 Newton, considered neglectable. Light was provided using ceramic metal-halide lamps with a 4200K color temperature (630W double ended, ‘Lumatek Ltd’, Malta).
In both cultivation systems, the light intensity was 370 ±20 µmoles of photons m-2 s-1, with a Red:Green:Blue ratio of 1:0,8:0,4. Temperature was equal to 24 ±0,1°C during the lighting periods and 18,5 ±0,5°C during the darkness period in both cultivation systems. Vapor Pressure Deficit were equal to 1 ±0,1 and 0,6 ±0,1 during the lighting and darkness periods, respectively, in both cultivation systems. Irrigation solutions were made with NutrimixTM of Futura Gaïa Technologies. Water supply was managed to saturate the soil, to avoid water deficiency effects (2,5 L plant-1 for 31 days). The fertilization solution was composed of 29,3, 1,8, 12,5, 10, 7,5 mmoles L-1 of nitrogen, phosphorus, potassium, calcium, and magnesium respectively with an electroconductivity (EC) of 4 mS cm-1 and a pH of 6,5. Cultivation time was set for 31 days.
2.3. Measurement and Calculation Methods of Agronomic Parameters
Fresh weight, dry weight and leaf area were studied after 0, 8, 14, 19, 24, 28 and 31 days after transplantation (DAT). Whole plants were harvested, weighed, and all leaves were arranged on a blank surface to take a picture. Leaf area was determined using ImageJ [
22]. The dry weight of the whole plants was determined by placing at least two representative leaves in an oven at 80°C for seven days.
Yields and efficiencies were calculated based on fresh and dry weights at harvest, after 31 DAT. Fresh and dry yields were calculated in kilograms of fresh or dry weight, respectively, per square meter. Efficiencies were calculated according to [
23] as follows. Light Use Efficiencies (LUE) were calculated in grams of fresh or dry weight per mole of photons by summing the Daily Light Integral (DLI) of each day of cultivation. Water Use Efficiencies (WUE) were calculated in grams of fresh or dry weight per liter of irrigation solution provided throughout the cultivation. Energy Use Efficiencies (EUE) were calculated in milligrams of fresh or dry weight per kilowatt consumed. For the control cultivation system, kilowatt consumption was measured using an electricity meter (CONTAX D TRI 80A LCD, MCI, France). For the rotational cultivation system, kilowatt consumption was also measured using an electricity meter (PowerTag Vigi DT40/iC60 3P+N 63A, Schneider Electric, France). For one day of cultivation, the control cultivation system consumed 203 kWh and the rotational cultivation system consumed 43 kWh of electricity. Land Surface Use Efficiencies (LSUE) were calculated in grams of fresh or dry weight per square meter of land surface used by the cultivation system and per day. For the control, the land surface used was equal to the cultivation area, while for the rotational cultivation, a production area of 8 m
2 can fit into a land surface of 2,8 m
2.
2.4. Glucose, Fructose and Sucrose Contents by HPAEC
Glucose, fructose and sucrose content were assayed by HPAEC (High Performance Anion-Exchange Chromatography). After removing the core, lettuces leaves were frozen in liquid nitrogen, grounded using IKA A11 basic Analytical mill (IKA
®, Germany) and then freeze-dried using a Cryotec Cosmos freeze-dryer (Cryotec
®, France). Between 15 and 20 mg of dried lettuces were sampled in ultra-pure water to obtain a concentration of 10 mg of DW mL
-1. Samples were homogenized and centrifugated 4 minutes at 15 000g, 4°C (Merck 3-16KL, KGaA
®, Germany). Supernatant was collected and filtered through PTFE membrane filter (0,2 μm, IC Millex
®-LG, Merck KGaA
®, Germany). Glucose, fructose, and sucrose contents were assayed using HPAEC (Dionex
® ICS-3000, USA) by injecting 5 μL of each sample. Separation was carried out using an IC Dionex CarboPac
TM PA1 analytical anion-exchange column (10 μm, 4 x 250 mm, Dionex
®, USA). The mobile phase was a solution of H
2O (eluent A) and 250 mM NaOH with 4 mM sodium acetate (eluent B) with A/B ratio of 35:65 (v/v). An isocratic elution mode at a constant flow rate of 0,7 ml min
-1 was performed. Sugars were monitored by Pulsed Amperometric Detection (PAD), with a detection peak at 254 nm. Curves of glucose, fructose and sucrose contents were obtained by injecting calibration standards with concentrations of 2,5, 5, 7,5, 10, 12,5, 15 and 20 nmoles. CHROMELEON software v.6.7. was used to analyze the concentration of sugars. The limit of quantification was calculated according to previous study [
24]. Total soluble sugars (TSS) content was calculated by summing glucose, fructose, and sucrose contents.
2.5. Photosynthetic and Chlorophyll Fluorescence Parameters
Net photosynthesis (µmol CO2 m-2 s-1), stomatal conductance (mmol H2O m-2 s-1) and the quantum yield of PSII electron transport, i.e. efficiency of the photosystem II (ΦPSII calculated as (Fm’-Fs)/Fm’) were measured using a portable photosynthetic analyzer (Head version 1.4.7, LI-COR® 6800, Li-Cor, Inc. Lincoln, NE, USA) equipped with a LI-COR® chamber type 6800-01. Fs is the steady state chlorophyll fluorescence level, F0’ the minimum chlorophyll fluorescence yield in the light-adapted state and Fm’ the maximum chlorophyll fluorescence yield in the light-adapted state. Parameters were set at 400 µmoles of photons m-2 s-1 of light (Red and Blue light, R:B ratio of 9:1) with 420 ppm CO2. Temperature and VPD were not controlled and therefore remained the same as those in the cultivation chamber (24/18,5°C and 1/0,6 kPa for the light/dark periods). Plants from the rotational cultivation system were placed horizontally to allow for analysis and were placed under lighting conditions similar to those in the cultivation system. All plants were rehydrated every hour to prevent a water deficit bias. Measurements were carried out after 15 days of cultivation on 10 plants, with 2 leaves per plant, so that each leaf was measured every hour. Net photosynthesis and stomatal conductance were measured during an entire lighting period of 16 hours. The efficiency of the photosystem II (ΦPSII) was measured during the first 6 hours of lighting, when it is at its maximum. Measurements were recorded manually every 3 to 5 minutes, with value stability serving as the indicator for recording the data.
2.6. Untargeted Liquid Chromatography Analysis
2.6.1. Sample Extraction
At 31 DAT, 10 ± 0,5mg of freeze-dried lettuce was weighed out in a microcentrifuge tube and extracted with 1,5 ml of MeOH:H2O (1:1, v:v). Samples were mixed for 10min at 20°C, followed by centrifugation for 5 min at 15000 g and 4°C (Sigma 1-16K centrifuge, Osterode am Harz, Germany). Then, 300 µl of supernatant were collected and dried overnight in a miVac Duo Concentrator (Genevac, Ipswich, UK). The dry extracts were resuspended in 200 µl of ultra-pure water and filtered through a 0,22µm PTFE filter by centrifugation at 10000 g, 4°C for 2min.
2.6.2. Untargeted UPLC-ESI-QTOF-MSE Profiling
Ultra Performance Liquid Chromatography – Electrospray Ionization – Quadruple Time-of-Flight – Mass Spectrometry
E (
UPLC-ESI-QTOF-MSE) analyses were carried out on an Acquity UPLC I-Class system (Waters
®, Milford, MA, USA), hyphenated to a Synapt G2-Si quadrupole time-of-flight (Q-TOF) mass spectrometer (Waters
®, Milford, MA, USA).The untargeted profiling was conducted with the chromatographic and mass spectrometry conditions as described in [
25]. Each sample was injected three times.
2.6.3. Data Processing and Data Analysis
Principal Components Analysis (PCA), an unsupervised technique, and Orthogonal Partial Least Squares Discriminate Analysis (OPLS-DA), a supervised technique, were used for building the qualitative models in this investigation, following the data processing and curation described by [
25]. The analyzed spectral data with a coefficient of variation inferior to 30%, a significant difference with ANOVA (α=0,05), a max abundance of at least 750 and a fold change superior to 2 were then studied with PCA using Rstudio [
26]. All data were mean centered, and Pareto scaled prior to OPLS-DA. S-plot representation was done to differentiate discriminant molecules between CT and ROT lettuces.
2.7. Postharvest Analyses
At 31 DAT, at harvest, lettuces were minimally processed. Leaves were cut in pieces (approximately 3 x 3cm), washed in chlorinated water (80 ppm) for 3 minutes, rinsed with tap water for 1 minute and then dried. The leaves were packaged in propylene trays covered with oriented polypropylene film using TOP SEAL 160 heat-sealer and stored in standard climatic chambers. Temperature was equal to 5,2 ± 0,5°C, measured with Kistock KH 110 sensor. Samples were analyzed after 0, 3, 7 and 10 days of storage. O
2 and CO
2 content were recorded using the Gas CheckMate3 (Dansensor, United Kingdom). The respiration rate was measured with a static system and calculated using the following formula, with Vs representing the volume of the static system in milliliters and FW representing the fresh weight in grams.
Overall visual quality (OVQ) was scored by a three-member trained panel. Quality was evaluated considering wilting severity and overall visual aspect according to a 3 points hedonic scale running from 3=absence of wilting and marketable aspect, to 0 = severe wilting and unmarketable aspect.
2.8. Statistical Analyses
Statistical analyses were carried using RStudio version 4.2.2 [
26]. The following packages were used for data analysis and visualization: circlize, ComplexHeatmap, cowplot, dplyr, factoextra, FactoMineR, gdata, ggpattern, ggplot2, ggplotify, ggpubr, ggrepel, grid, gridExtra, multcompView, PMCMRplus, rcompanion, ropls, sf and tidyr. The non-parametric Wilcoxon-Mann-Whitney test was used to determine if the differences observed were significant. The details of the obtained p-values not presented in the figures are provided in the Supplementary Data.
3. Results
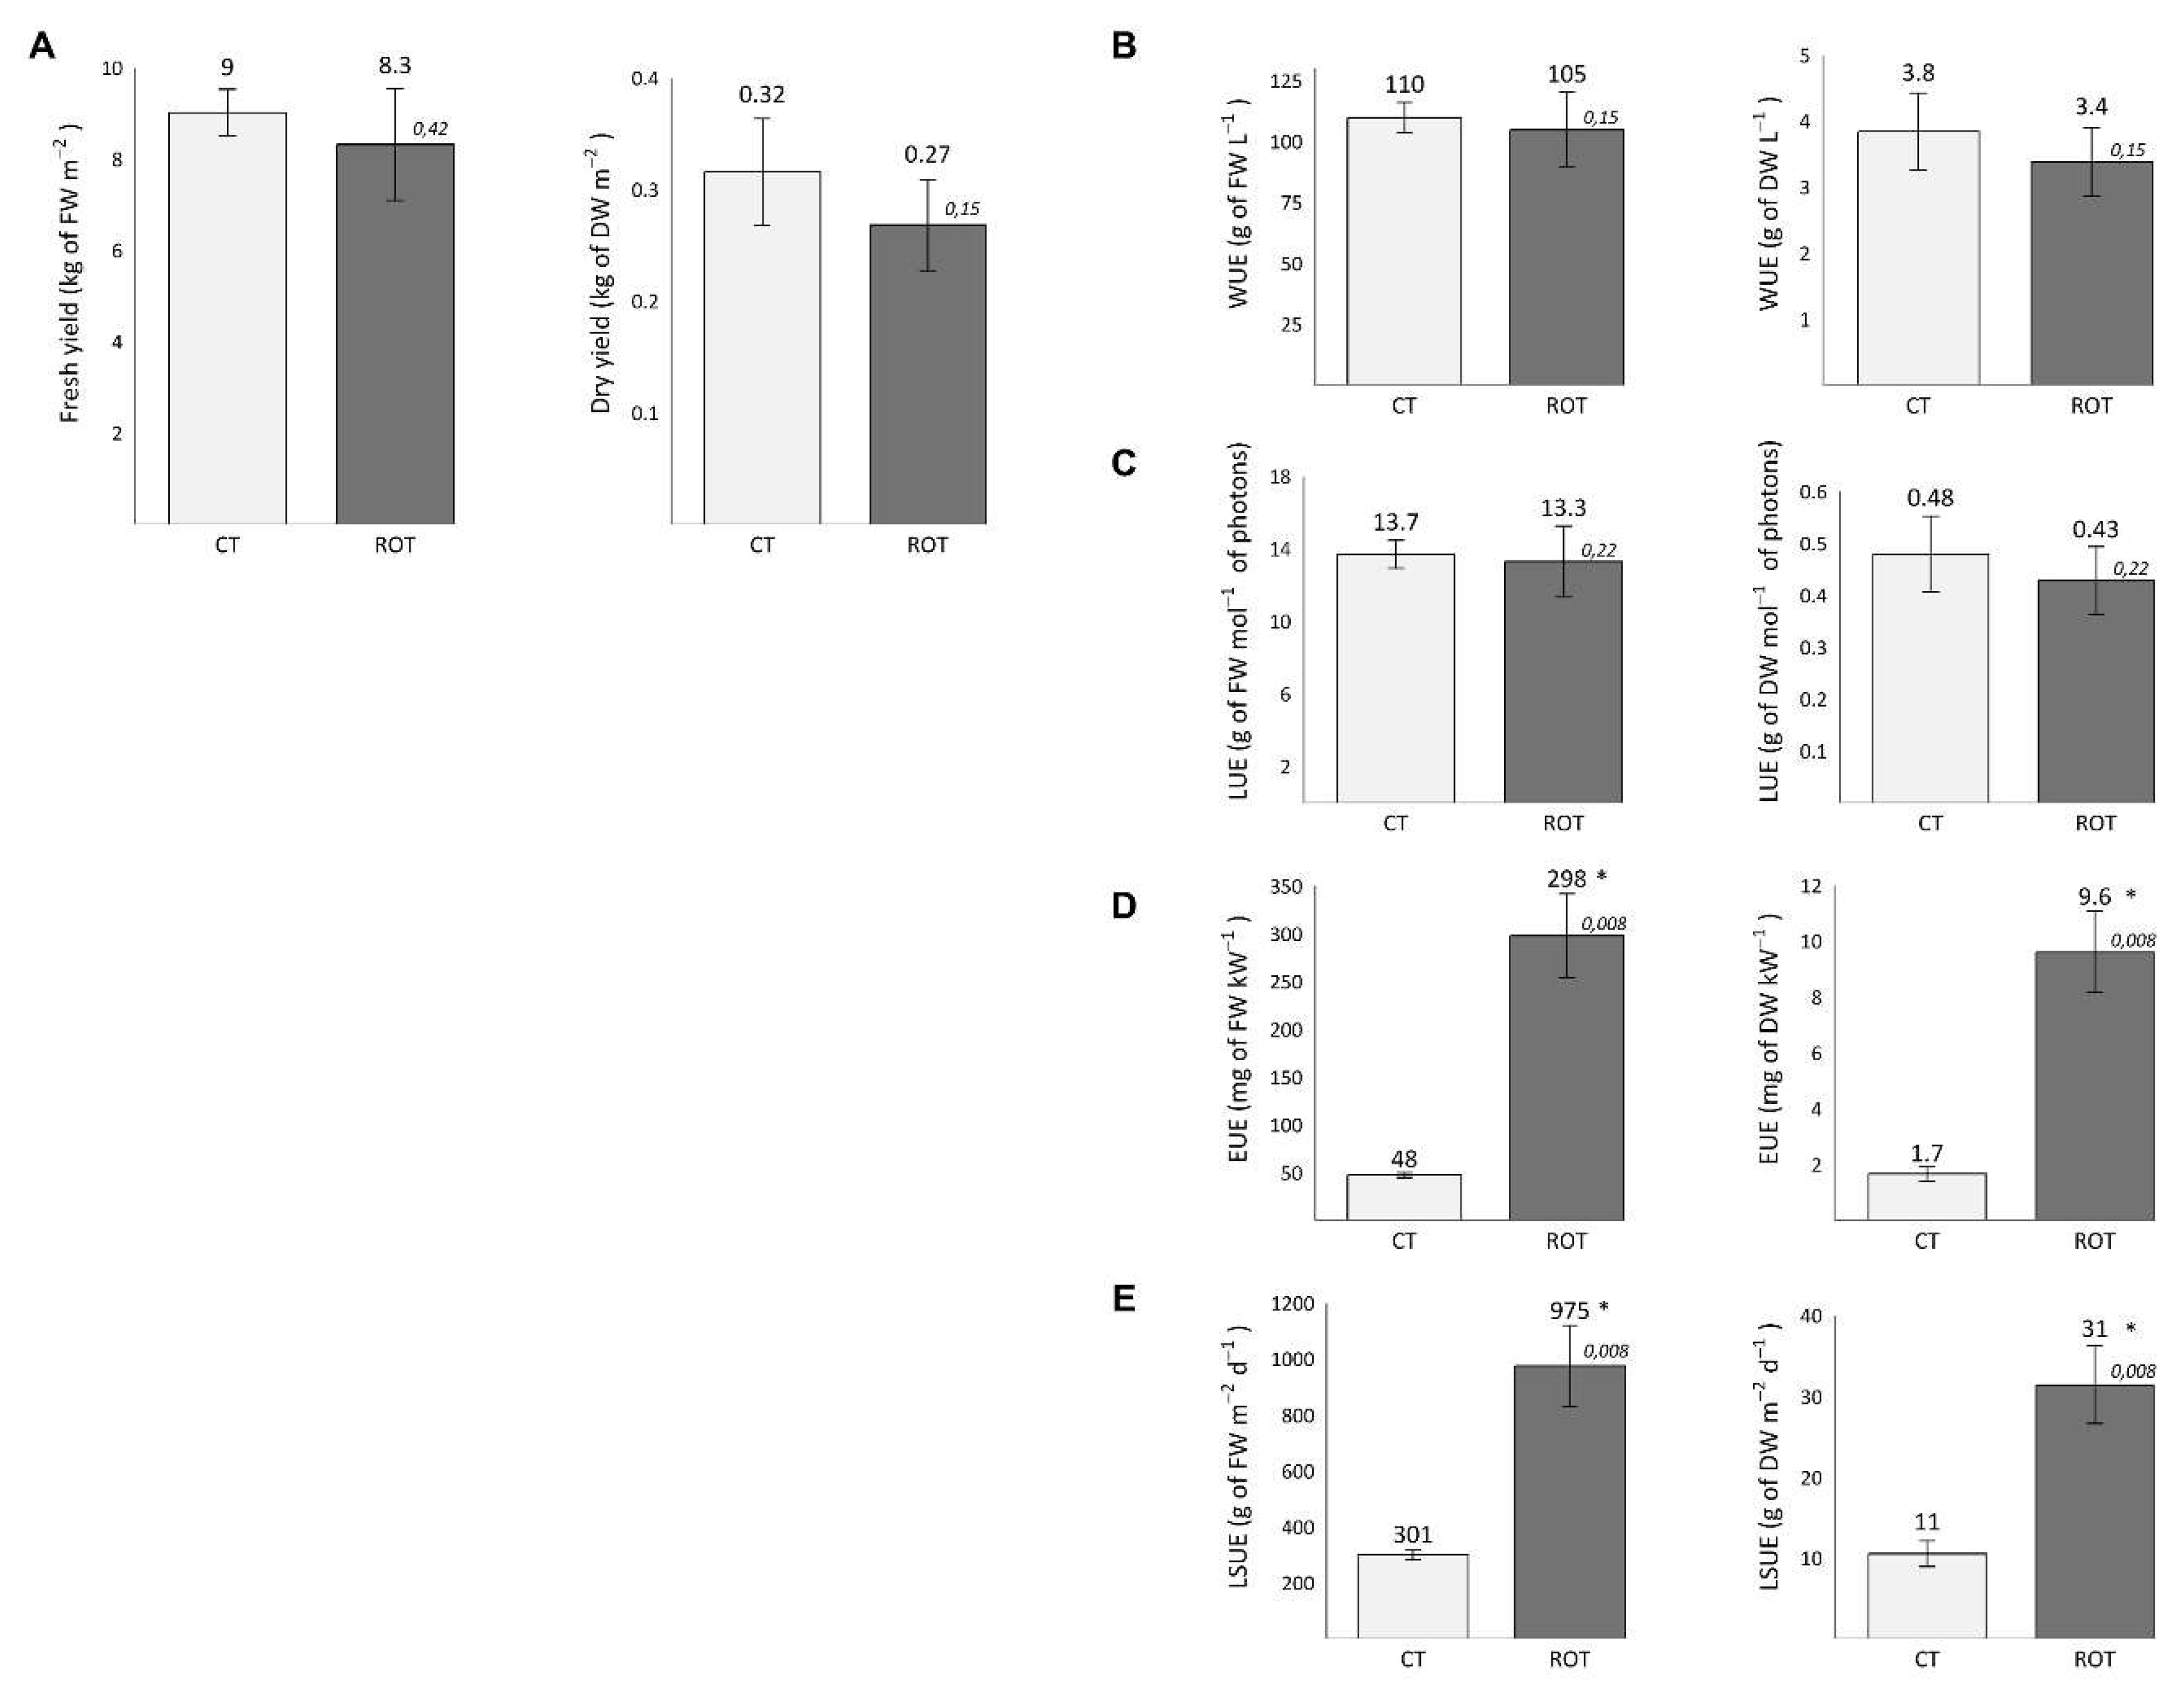
3.1. Yields, Efficiencies and Agronomic Parameters
The yields and Water, Light, Energy and Land Surface Use Efficiencies (WUE, LUE, EUE and LSUE, respectively) of CT and ROT lettuces are presented in
Figure 2. No significant differences in fresh and dry yield, WUE or LUE were observed. The EUEs of ROT lettuces were equal to 50g of FW kWh
-1 and 1,6g of DW kWh
-1, which was significantly six and five times higher than those of CT lettuces, respectively. The LSUEs of ROT lettuces were equal to 975g of FW m
-2 d
-1 and 31g of DW m
-2 d
-1, which was significantly three times higher than those of CT lettuces, respectively.
The details of fresh weight per plant, dry weight per plant and leaf area of CT and ROT lettuces are presented in
Table 1. The mean fresh weights of ROT lettuces were always slightly lower than those of the control, with mean fresh weights 25%, 29%, 16%, 6% and 8% lower than those of the control at 14, 19, 24, 28 and 31 DAT, respectively. However, the fresh weight of ROT lettuces was only significantly lower than those of CT ones at 19 DAT. The same trend can be observed for the dry weight, and the dry weight of ROT lettuces was only significantly lower than that of the control at 14 DAT. Thus, at harvest (31 DAT), no significant differences in fresh weight, dry weight and leaf area were observed between ROT and CT lettuces.
3.2. Glucose, Fructose, Sucrose, and Total Soluble Sugars (TSS) Contents
Glucose, fructose, sucrose, and TSS contents are presented in
Table 2. At 18 DAT, the glucose, fructose, and TSS contents of ROT lettuces were significantly lower than those of CT lettuces. Moreover, at 31 DAT, the glucose, fructose, and TSS contents of ROT lettuces were lower than those of CT lettuces, but no significant difference was observed.
3.3. Photosynthetic Parameters
The values of net photosynthesis, stomatal conductance and efficiency of the photosystem II (
ΦPSII) are presented in
Figure 3.
Net photosynthesis and stomatal conductance decreased throughout the lighting period (
Figure 3A,B). The net photosynthesis and stomatal conductance of ROT lettuces were significantly lower than those of CT lettuces during the first two hours of lighting with values of 8,6 ±1,6 and 11,7 ±0,9 µmol CO
2 m
-2 s
-1 for the net photosynthesis and 0,15 ±0,04 and 0,22 ±0,04 mmol H
2O m
-2 s
-1 for the stomatal conductance, respectively. ROT lettuces net photosynthesis and stomatal conductance of ROT lettuces were also significantly lower than those of CT lettuces at the end of the lighting period, from 10 to 14 hours of lighting. Finally, the net photosynthesis of ROT lettuces was also significantly lower than that of CT lettuces from 14 to 16 hours of lighting. The mean efficiency of the photosystem II (
ΦPSII) of ROT lettuces during the first 6 hours of lighting was significantly 10% lower than that of the control.
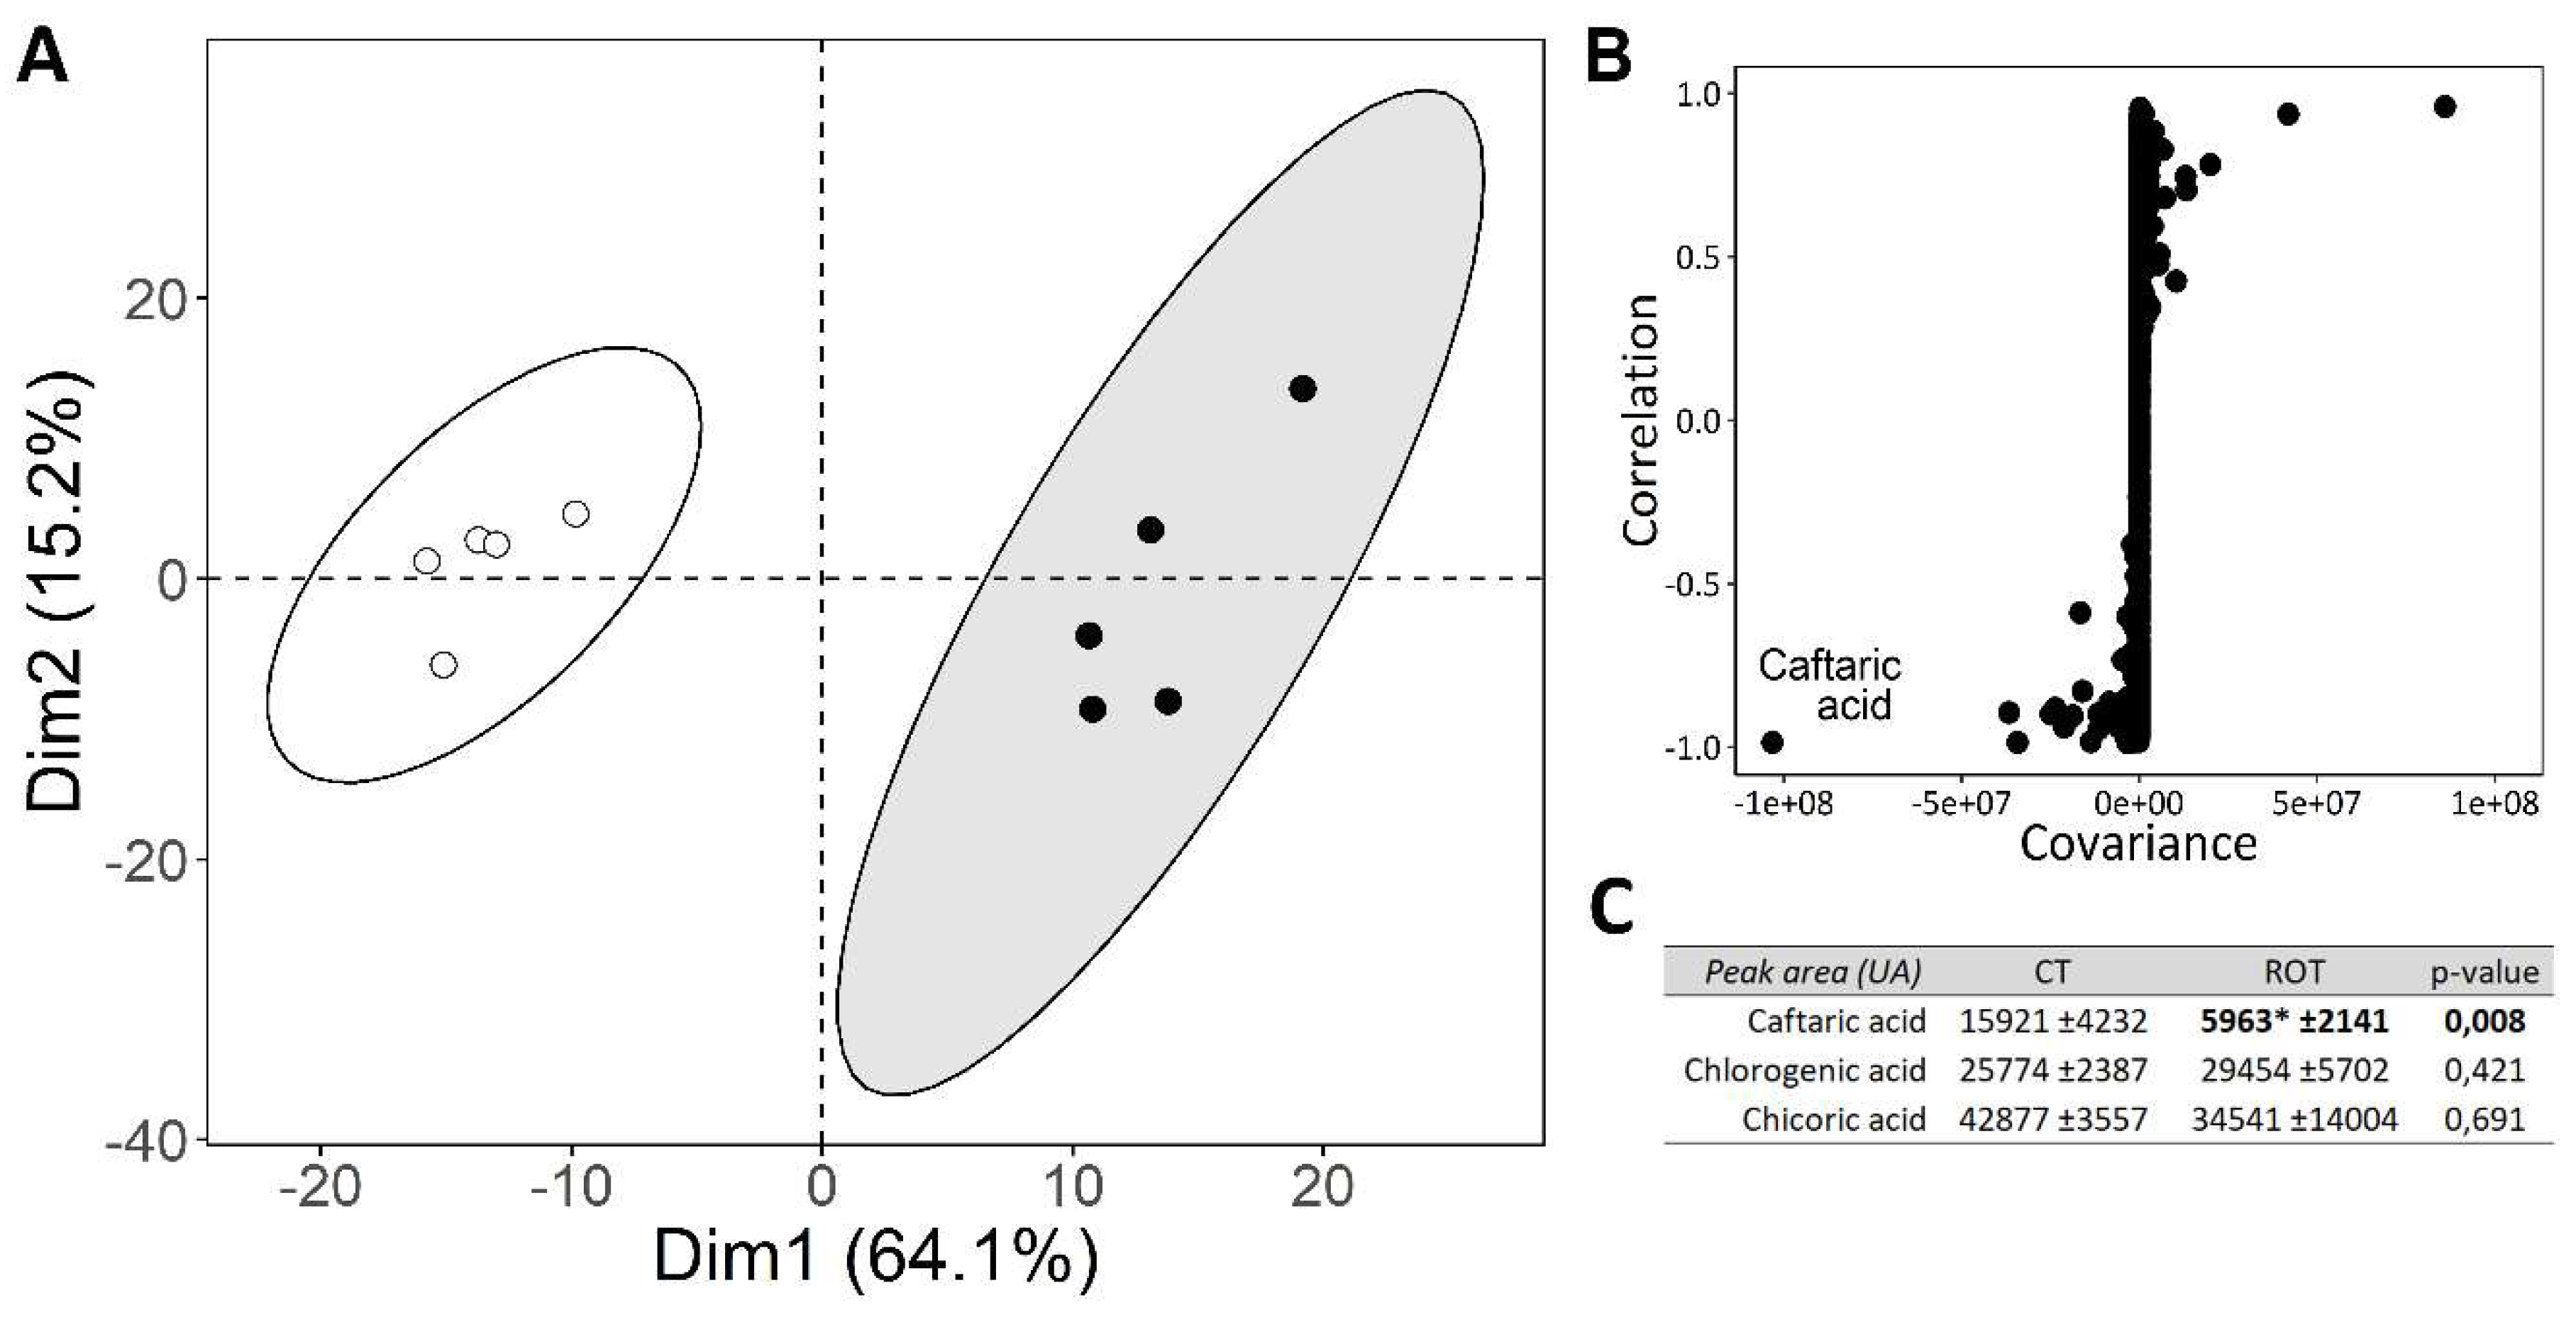
3.4. Untargeted Liquid Chromatography Profiling and Main Polyphenols Content at Harvest
PCA analysis, the S-plot derived from the supervised OPLS-DA model, and the peak areas of caftaric acid, chlorogenic acid, and chicoric acid are presented in
Figure 4.
In the biplot representation of the PCA (
Figure 4A), we observe that samples from ROT lettuces are well separated from those of CT lettuces, as the ellipses representing the groups do not overlap. The first dimension on the x-axis accounts for 64,1% of the total variation across the samples, while the second dimension on the y-axis accounts for 15,2% of the total variation across the samples.
The S-plot from the supervised OPLS-DA model shows a strong involvement of caftaric acid in the differentiation of samples from ROT and CT lettuces (
Figure 4B). The caftaric acid peak area was approximately three times lower in samples from ROT lettuces compared to those from CT lettuces (
Figure 4C). No significant differences in chlorogenic and chicoric acid peak areas were observed between the two modalities.
3.5. Postharvest Analyses
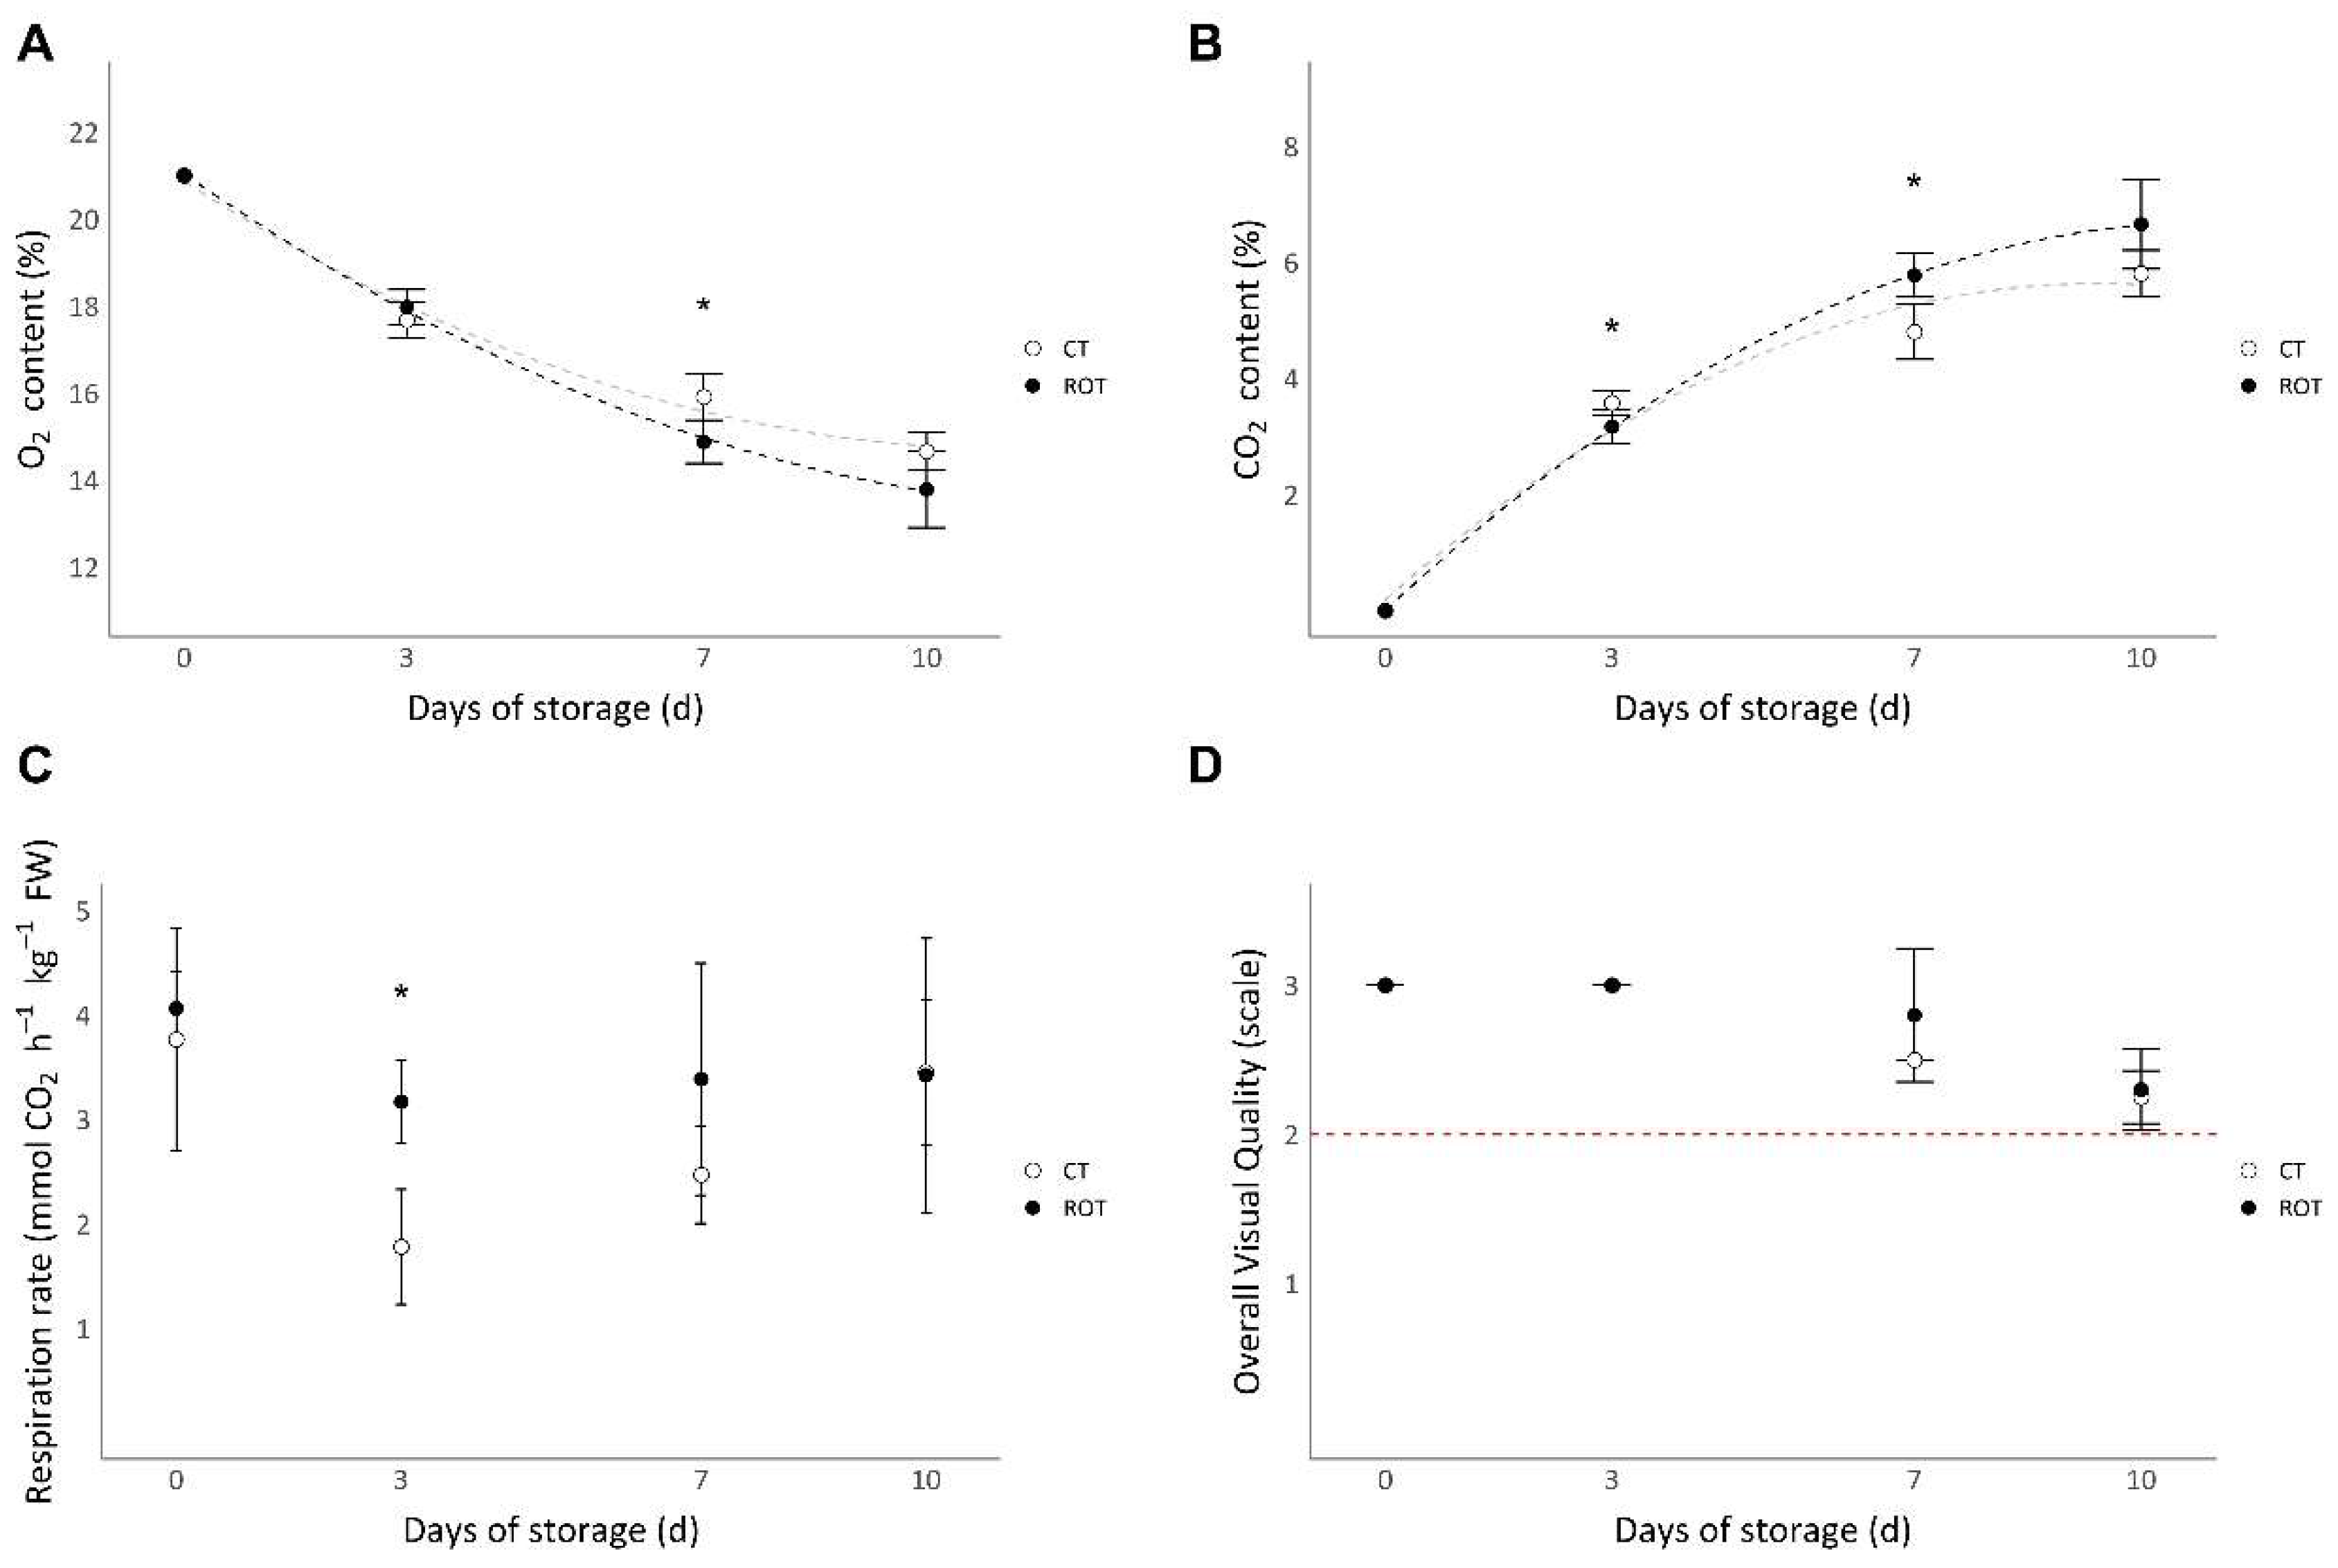
CO2 and O2 packaging content, respiration rates and the overall visual quality (OVQ) of ROT and CT lettuces from harvest until 10 days of storage are presented in figure 5.
The O2 content inside the packaging of both ROT and CT lettuces decreased throughout the storage period (
Figure 5A). Inversely, the CO2 content inside the packaging of the two modalities increased throughout the storage period (
Figure 5B).
Respiration rates of the two modalities decreased from harvest to the third day of storage and then slightly increased until the tenth day of storage (
Figure 5C). The respiration rate of ROT lettuces was significantly higher than that of CT lettuces after 3 days of storage, but no significant differences were observed after 7 and 10 days of storage.
Overall visual quality (OVQ) was assessed using a predefined scale, with lettuces graded as non-marketable under a grade of 2 (
Figure 5D). No significant differences between ROT and CT lettuces were observed at harvest or throughout the storage period. After 10 days of storage, the grades of ROT and CT lettuces were both above the marketability threshold.
4. Discussion
4.1. The Yields in Control or the Rotational Cultivation Systems Were Similar
In this work, we compared the fresh and dry weights and yields of lettuces grown into two cultivation systems. The first was a control horizontal cultivation system, while the second was a rotational cultivation system, used for indoor production at an industrial scale. Fresh yields obtained in both cultivation systems were similar and equal to 9 and 8,3 kg m
-2, respectively. Those data are consistent with a previous meta-analysis presenting that vertical farming systems can yield up to 6,9 kg of lettuce m
-2 [
27]. Moreover, fresh and dry weights obtained at harvest (31 DAT) were consistent with weights of lettuces cultivated in horizontal systems previously described [
28].
Similar values in fresh and dry yields were consistent with the fact that there are no significant differences in fresh and dry weights between the two cultivation systems at harvest (31 DAT). However, it must be noted that the mean fresh and dry weights of ROT lettuces were always slightly lower than those of the control, even if significant differences were found at 19 DAT and 14 DAT for fresh weight and dry weight, respectively. Moreover, the mean glucose, fructose, and Total Soluble Sugars contents were lower in lettuces grown in the rotational cultivation system compared to the control ones. Those trends and differences in weights and sugars contents can be explained by net photosynthesis, as the net photosynthesis of lettuces grown in the rotational cultivation system were significantly lower than those of the control in the first two hours of lighting and from ten hours of lighting until the end of the lighting period. Nevertheless, the differences in net photosynthesis were too small to induce significant differences in yields at harvest.
4.2. The Decrease in Net Photosynthesis Observed is a Consequence of the Perturbation of Plants Gravity Perception
To better describe the differences in net photosynthesis between lettuces grown in the rotational cultivation system and the control, we studied the stomatal conductance and the efficiency of the photosystem II. The decrease in photosynthetic activity was synchronous with that in stomatal conductance, which is consistent with the linked between the net photosynthesis and the stomatal conductance previously described [
29,
30,
31]. Furthermore, the efficiency of the photosystem II (
ΦPSII) during the first 6 hours of lighting was 10% lower in ROT lettuces compared to that of CT lettuces. Thus, the observed decrease in net photosynthesis is the consequence of the loss in stomatal conductance and photosystem II efficiency. The rotational cultivation system rotates with a speed of 50 minutes per revolution, which induces a constant perturbation of plant’s gravity perception. The perturbation of gravity perception has already been described to decrease net photosynthetic activity of
Triticum aestivum (wheat) of 25%, and might alter its stomatal conductance [
32,
33]. Moreover, the activity of the photosystem II of
Triticum aestivum has already been described to decrease by approximately 10% when the gravity perception of plants are perturbated [
34,
35]. Based on this literature, it is likely to propose stomatal conductance, photosystem II efficiency and so net photosynthesis decreased because of the perturbation of plant’s gravity perception. However, studies on gravity perception are generally focusing on microgravity conditions, due to the high interest for space missions, and that condition of gravity perception might differ from these induced by the rotation cultivation system. Thus, as changes in gravity perception induces drastic and holistic changes in plants [
36,
37], further research are needed to better define and describe the nature and consequences of the perturbation of gravity perception endured by the plants in the rotational cultivation system.
4.3. Energy and Land Surface Use Efficiencies Were Higher in the Rotational Cultivation System but Still Need to Be Maximized
In this experiment, we compared Water, Light, Energy and Land Surface Use Efficiency (WUE, LUE, EUE and LSUE, respectively) of lettuces grown in a rotational cultivation system (ROT) and a control, in horizontal cultivation system (CT).
The WUE of ROT and CT lettuces were similar and 1,3 and 1,4 times higher than the higher range value presented in for lettuces in vertical farming, respectively [
23]. Moreover, the LUE of ROT and CT lettuces were similar. A meta-analysis on Light Use Efficiency of lettuce in vertical farms presented average LUE based on fresh weight of 11,6 g mol
-1 and average LUE based on dry weight of 0,55 g mol
-1 [
38]. In this experiment, we found that LUE based on fresh weight were equal to 13,7 and 13,3 g mol
-1 of photons, while those based on dry weight were equal to 0,48 and 0,43 g mol
-1 of photons for CT and ROT lettuces, respectively. Thus, the obtained values are consistent with those of literature.
The EUE based on fresh and dry weights of ROT lettuces was approximately six and five times higher than those of the control, respectively. The energy consumption in indoor vertical farming is mainly due to the lighting (range from 60 to 80%) [
4,
8,
10,
11]. Two lamps were needed for the rotational cultivation system, while a lamp ceiling was necessary to provide homogenous lighting for the control horizontal cultivation system. Indeed, as lamps are positioned in the center of the rotational cultivation systems, more plants can be illuminated with one lamp. This difference in lamps number might explain most of the difference, however, we were not able to separate lighting-related consumption from that of climate control in both cultivation systems. The EUEs obtained for lettuces grown in the rotational cultivation system were consistent but within the lower range of those reported in recent studies on lettuce. Orsini et al. (2020) reported an EUE range in PFALs from 1 to 140g of FW kWh
-1, while Pennisi et al. (2019) reported values ranging from 60 to 100g of FW kWh
-1 [
23,
39]. The EUE obtained in the pilot farm of Futura Gaïa Technologies at a pre-industrial scale is close to that obtained in this experiment and is also on the lower end of values reported in the literature, at 48 ± 5 g of FW kWh
-1 (internal data, not shown). The energy consumption of lettuces grown in the rotational cultivation system was equal to 20 ± 3,0 kWh kg⁻¹ of FW, which align with previously reported energy consumption ranging from 6,2 to 12,0 kWh kg⁻¹ of FW for lettuces produced in PFALs [
40]. It must be noted that, for the control, all data related to energy efficiency are lower and all data related to energy consumption are higher (119 ± 6,3 kWh kg⁻¹ of FW) than the literature, respectively.
The LSUE has been determined to range from 1300 to 3300 g of FW m
-2 d
-1 in plant factories with artificial lighting [
23]. In this experiment, the land surface use efficiencies in the control and rotation cultivation system were lower than the cited literature as they are equal to 301 and 975 g of FW m
-2 d
-1, respectively. Low LSUE can be attributed to the single cultivation layer used in this experiment. In contrast, indoor vertical farming benefits from the ability to multiply cultivation layers. At an industrial scale, up to three rotational cultivation systems can be stacked on top of each other, which lead to an increase in the LSUE. Indeed, the LSUE obtained in the pilot farm of Futura Gaïa Technologies is equal to 1252 ± 128 g of FW m
-2 d
-1, which makes it more consistent with the literature (internal data, not shown).
In this experiment, WUE and LUE were similar in both systems and consistent with values reported in the literature. This suggests that the resource use efficiency of lettuces in the rotational cultivation system is near optimal. However, the EUE and LSUE values obtained in this experiment and reported from the pilot farm of Futura Gaïa Technologies were on the lower end of those reported in the literature. Improvements in space management, system stacking, lighting efficiency, and climate control are needed to significantly increase these values at an industrial scale.
4.4. The Rotational Cultivation System Induced Changes in the Plant’s Quality Without Altering the Postharvest Storage Capacity
In the biplot PCA after the LC-MS analysis, we observed a clear separation of the samples coming from lettuces grown in the rotational cultivation system from the control. The conducted analysis focused on polyphenols, and this is consistent with the literature, as it has been reviewed that the growing conditions have an impact on the polyphenols content [
21]. Among polyphenols, chicoric acid, biosynthesized from caftaric and chlorogenic acids, is of special interest as it can represent more than 55% of total caffeic acid derivatives [
41,
42]. No significant differences in chicoric acid were found, but we measured a three times lower content of caftaric acid in ROT lettuces compared to the control. Further research is needed to better characterize the differences in quality of lettuces grown in the rotational and control cultivation system. Moreover, it is of interest to determine if those differences are directly linked with the perturbation in plant’s gravity perception.
Higher respiration rate of lettuces grown in the rotational cultivation system compared to the control has been measured only after 3 days of storage, which was consistent with the slight decrease in O
2 content and a slight increase in CO
2 content in ROT lettuces packaging compared to the control during the storage. This might be explained by the rotational cultivation system, as it has been described that perturbation of gravity perception increases the number of mitochondria by at least 100% in
Brassica rapa and increases the mitochondrial activity and size in
Chlorella [
34,
43,
44,
45]. However, lettuce from the two modalities were still above the threshold of marketability after 10 days of storage, which shows that the differences in plant’s respiration rate did not induce a decrease in plant’s overall storage capacity.
5. Conclusions
This study compared lettuce grown in a rotational cultivation system with a horizontal control system, evaluating yields, Water Use Efficiency (WUE), Light Use Efficiency (LUE), Energy Use Efficiency (EUE), Land Surface Use Efficiency (LSUE), and postharvest storage capacity. No significant differences were found in yields, WUE, LUE, fresh or dry weights, or postharvest storage capacity between the two systems. These findings indicate that rotational cultivation is feasible in terms of yields. However, a slight trend toward lower fresh and dry weights in the rotational system was observed, correlating with a decrease in net photosynthesis during certain lighting hours, which can be explained by reduced stomatal conductance and photosystem II efficiency. Additionally, the rotational system modified the polyphenol profile, and decreased caftaric acid content compared to the control. Thus, further research is needed to better understand its effects on plants physiology and metabolism, particularly regarding the perturbation of gravity perception.
In conclusion, while indoor production using rotational cultivation systems is feasible based on yields, improvements are needed to optimize Energy Use Efficiency and Land Surface Use Efficiency (LSUE), notably through stacking multiple cultivation systems and working on the optimization of the rotation cultivation system itself. Moreover, more specific analyses of energy consumption and energy efficiency are needed to assess the competitiveness and economic feasibility of rotational cultivation systems in industrial-scale PFALs.
Author Contributions
Conceptualization, C.D. and V.T.; methodology, C.D., validation, V.T. and F.C.; formal analysis, C.D. and L.R., cultivation supervision, C.D. and L.R., metabolic analyses, C.D., O.C., V.V., sugars analysis, C.D., S.C., writing—original draft preparation, C.D., writing—review and editing, C.D., supervision, V.T., H.S. and F.C.; funding acquisition, V.T. and F.C. All authors have read and agreed to the published version of the manuscript.
Funding
This research was funded by Avignon University, Futura Gaïa Technologies and the National Association for Research in Technology (ANRT, n°2020/0819).
Data Availability Statement
Acknowledgment
This study was conducted with the financial support of the European Regional Development Fund, the French Goverment, the Sud Provence-Alpes-Côte d'Azur Region, the Departmental Council of Vaucluse and the Urban Community of Avignon. We would like to thank Louis Ramade for his assistance during the experiments.
Conflicts of Interest
The authors declare no conflicts of interest.
Abbreviations
The following abbreviations are used in this manuscript:
| LUE |
Light Use Efficiency |
| WUE |
Water Use Efficiency |
| EUE |
Energy Use Efficiency |
| LSUE |
Land Surface Use Efficiency |
References
- Gu, D.; Andreev, K.; Dupre, M.E. Major Trends in Population Growth Around the World. China CDC Wkly. 2021, 3, 604–613. [Google Scholar] [CrossRef] [PubMed]
- Mempel, H.; Jüttner, I.; Wittmann, S. The Potentials of Indoor Farming for Plant Production. at-Automatisierungstechnik 2021, 69, 287–296. [Google Scholar] [CrossRef]
- Graamans, L.; Baeza, E.; van den Dobbelsteen, A.; Tsafaras, I.; Stanghellini, C. Plant Factories versus Greenhouses: Comparison of Resource Use Efficiency. Agric. Syst. 2018, 160, 31–43. [Google Scholar] [CrossRef]
- Kozai, T.; Niu, G. Chapter 4 - Plant Factory as a Resource-Efficient Closed Plant Production System. In Plant Factory; Kozai, T., Niu, G., Takagaki, M., Eds.; Academic Press: San Diego, 2016; ISBN 978-0-12-801775-3. [Google Scholar]
- Righini, I.; Stanghellini, C.; Hemming, S.; Graamans, L.; Marcelis, L.F.M. Resources for Plant-Based Food: Estimating Resource Use to Meet the Requirements of Urban and Peri-Urban Diets. Food Energy Secur. 2023, 12, e462. [Google Scholar] [CrossRef]
- Barbosa, G.L.; Gadelha, F.D.A.; Kublik, N.; Proctor, A.; Reichelm, L.; Weissinger, E.; Wohlleb, G.M.; Halden, R.U. Comparison of Land, Water, and Energy Requirements of Lettuce Grown Using Hydroponic vs. Conventional Agricultural Methods. Int. J. Environ. Res. Public. Health 2015, 12, 6879–6891. [Google Scholar] [CrossRef]
- Tasgal, P. The Economics of Local Vertical & Greenhouse Farming Are Getting Competitive Available online:. Available online: https://agfundernews.com/the-economics-of-local-vertical-and-greenhouse-farming-are-getting-competitive (accessed on 13 January 2025).
- Avgoustaki, D.D.; Xydis, G. How Energy Innovation in Indoor Vertical Farming Can Improve Food Security, Sustainability, and Food Safety? In Advances in Food Security and Sustainability; Elsevier, 2020; Volume 5, pp. 1–51. ISBN 978-0-12-820711-6. [Google Scholar]
- Kozai, T. Resource Use Efficiency of Closed Plant Production System with Artificial Light: Concept, Estimation and Application to Plant Factory. Proc. Jpn. Acad. Ser. B Phys. Biol. Sci. 2013, 89, 447–461. [Google Scholar] [CrossRef]
- Avgoustaki, D.; Xydis, G. Plant Factories in the Water-Food-Energy Nexus Era: A Systematic Bibliographical Review. Food Secur. 2020, 12. [Google Scholar] [CrossRef]
- Harbick, K.; Albright, L.D. Comparison of Energy Consumption: Greenhouses and Plant Factories. Acta Hortic. 2016, 285–292. [Google Scholar] [CrossRef]
- Kelly, N.; Choe, D.; Meng, Q.; Runkle, E.S. Promotion of Lettuce Growth under an Increasing Daily Light Integral Depends on the Combination of the Photosynthetic Photon Flux Density and Photoperiod. Sci. Hortic. 2020, 272, 109565. [Google Scholar] [CrossRef]
- Palmer, S.; van Iersel, M.W. Increasing Growth of Lettuce and Mizuna under Sole-Source LED Lighting Using Longer Photoperiods with the Same Daily Light Integral. Agronomy 2020, 10, 1659. [Google Scholar] [CrossRef]
- Pennisi, G.; Pistillo, A.; Orsini, F.; Cellini, A.; Spinelli, F.; Nicola, S.; Fernandez, J.A.; Crepaldi, A.; Gianquinto, G.; Marcelis, L.F.M. Optimal Light Intensity for Sustainable Water and Energy Use in Indoor Cultivation of Lettuce and Basil under Red and Blue LEDs. Sci. Hortic. 2020, 272, 109508. [Google Scholar] [CrossRef]
- Zhang, X.; He, D.; Niu, G.; Yan, Z.; Song, J. Effects of Environment Lighting on the Growth, Photosynthesis, and Quality of Hydroponic Lettuce in a Plant Factory. Int. J. Agric. Biol. Eng. 2018, 11, 33–40. [Google Scholar] [CrossRef]
- Lee, M.-J.; Son, K.-H.; Oh, M.-M. Increase in Biomass and Bioactive Compounds in Lettuce under Various Ratios of Red to Far-Red LED Light Supplemented with Blue LED Light. Hortic. Environ. Biotechnol. 2016, 57, 139–147. [Google Scholar] [CrossRef]
- Liu, J.; van Iersel, M.W. Far-Red Light Effects on Lettuce Growth and Morphology in Indoor Production Are Cultivar Specific. Plants 2022, 11, 2714. [Google Scholar] [CrossRef] [PubMed]
- Pennisi, G.; Orsini, F.; Landolfo, M.; Pistillo, A.; Crepaldi, A.; Nicola, S.; Fernández, J.A.; Marcelis, L.F.M.; Gianquinto, G. Optimal Photoperiod for Indoor Cultivation of Leafy Vegetables and Herbs. Eur. J. Hortic. Sci. 2020, 85, 329–338. [Google Scholar] [CrossRef]
- Pinho, P.; Jokinen, K.; Halonen, L. The Influence of the LED Light Spectrum on the Growth and Nutrient Uptake of Hydroponically Grown Lettuce. Light. Res. Technol. 2017, 49, 866–881. [Google Scholar] [CrossRef]
- Paquet, G.; Nguyen, T.T.A.; Brégard, A.; Barrada, A.; Poirier, G.; Dorais, M. The Agronomic Potential of a New Vertical Growing Farming System Using Biofertilizers and Peat-Based Wood Fibre Growing Medium: Lettuce as a Case Study. Acta Hortic. 2022, 455–462. [Google Scholar] [CrossRef]
- Yang, X.; Gil, M.I.; Yang, Q.; Tomás-Barberán, F.A. Bioactive Compounds in Lettuce: Highlighting the Benefits to Human Health and Impacts of Preharvest and Postharvest Practices. Compr. Rev. Food Sci. Food Saf. 2022, 21, 4–45. [Google Scholar] [CrossRef]
- Schneider, C.A.; Rasband, W.S.; Eliceiri, K.W. NIH Image to ImageJ: 25 Years of Image Analysis. Nat. Methods 2012, 9, 671–675. [Google Scholar] [CrossRef]
- Orsini, F.; Pennisi, G.; Zulfiqar, F.; Gianquinto, G. Sustainable Use of Resources in Plant Factories with Artificial Lighting (PFALs). Eur. J. Hortic. Sci. 2020, 85, 297–309. [Google Scholar] [CrossRef]
- Rusch, A.; Suchail, S.; Valantin-Morison, M.; Sarthou, J.-P.; Roger-Estrade, J. Nutritional State of the Pollen Beetle Parasitoid Tersilochus Heterocerus Foraging in the Field. BioControl 2013, 58, 17. [Google Scholar] [CrossRef]
- Black, C.; Haughey, S.A.; Chevallier, O.P.; Galvin-King, P.; Elliott, C.T. A Comprehensive Strategy to Detect the Fraudulent Adulteration of Herbs: The Oregano Approach. Food Chem. 2016, 210, 551–557. [Google Scholar] [CrossRef] [PubMed]
- R Core Team R: A Language and Environment for Statistical Computing; Computing, Vienna, Austria, 2022.
- Gargaro, M.; Murphy, R.J.; Harris, Z.M. Let-Us Investigate; A Meta-Analysis of Influencing Factors on Lettuce Crop Yields within Controlled-Environment Agriculture Systems. Plants 2023, 12, 2623. [Google Scholar] [CrossRef]
- Matysiak, B.; Ropelewska, E.; Wrzodak, A.; Kowalski, A.; Kaniszewski, S. Yield and Quality of Romaine Lettuce at Different Daily Light Integral in an Indoor Controlled Environment. Agronomy 2022, 12, 1026. [Google Scholar] [CrossRef]
- Gago, J.; Daloso, D. de M.; Figueroa, C.M.; Flexas, J.; Fernie, A.R.; Nikoloski, Z. Relationships of Leaf Net Photosynthesis, Stomatal Conductance, and Mesophyll Conductance to Primary Metabolism: A Multispecies Meta-Analysis Approach. Plant Physiol. 2016, 171, 265–279. [Google Scholar] [CrossRef] [PubMed]
- Gorton, H.L.; Williams, W.E.; Binns, M.E.; Gemmell, C.N.; Leheny, E.A.; Shepherd, A.C. Circadian Stomatal Rhythms in Epidermal Peels from Vicia Faba. Plant Physiol. 1989, 90, 1329–1334. [Google Scholar] [CrossRef]
- Hennessey, T.L.; Field, C.B. Oscillations in Carbon Assimilation and Stomatal Conductance under Constant Conditions. Plant Physiol 1991, 96, 6. [Google Scholar] [CrossRef]
- Kirkham, M.B. Horizontal Root Growth: Water Uptake and Stomatal Resistance under Microgravity. Vadose Zone J. 2008, 7, 1125–1131. [Google Scholar] [CrossRef]
- Tripathy, B.C.; Brown, C.S.; Levine, H.G.; Krikorian, A.D. Growth and Photosynthetic Responses of Wheat Plants Grown in Space. Plant Physiol. 1996, 110, 801–806. [Google Scholar] [CrossRef]
- Jiao, S.; Hilaire, E.; Paulsen, A.Q.; Guikema, J.A. Brassica Rapa Plants Adapted to Microgravity with Reduced Photosystem I and Its Photochemical Activity. Physiol. Plant. 2004, 122, 281–290. [Google Scholar] [CrossRef]
- Stutte, G.W.; Monje, O.; Goins, G.D.; Tripathy, B.C. Microgravity Effects on Thylakoid, Single Leaf, and Whole Canopy Photosynthesis of Dwarf Wheat. Planta 2005, 223, 46–56. [Google Scholar] [CrossRef] [PubMed]
- Halstead, T.W.; Dutcher, F.R. Plants in Space. Annu. Rev. Plant Physiol. 1987, 38, 317–345. [Google Scholar] [CrossRef] [PubMed]
- Stutte, G.W.; Monje, O.; Hatfield, R.D.; Paul, A.-L.; Ferl, R.J.; Simone, C.G. Microgravity Effects on Leaf Morphology, Cell Structure, Carbon Metabolism and mRNA Expression of Dwarf Wheat. Planta 2006, 224, 1038–1049. [Google Scholar] [CrossRef] [PubMed]
- Jin, W.; Formiga Lopez, D.; Heuvelink, E.; Marcelis, L.F.M. Light Use Efficiency of Lettuce Cultivation in Vertical Farms Compared with Greenhouse and Field. Food Energy Secur. 2022. [Google Scholar] [CrossRef]
- Pennisi, G.; Orsini, F.; Blasioli, S.; Cellini, A.; Crepaldi, A.; Braschi, I.; Spinelli, F.; Nicola, S.; Fernandez, J.A.; Stanghellini, C.; et al. Resource Use Efficiency of Indoor Lettuce (Lactuca Sativa L.) Cultivation as Affected by Red:Blue Ratio Provided by LED Lighting. Sci. Rep. 2019, 9, 14127. [Google Scholar] [CrossRef]
- Eaton, M.; Shelford, T.; Cole, M.; Mattson, N. Modeling Resource Consumption and Carbon Emissions Associated with Lettuce Production in Plant Factories. J. Clean. Prod. 2023, 384, 135569. [Google Scholar] [CrossRef]
- Romani, A.; Pinelli, P.; Galardi, C.; Sani, G.; Cimato, A.; Heimler, D. Polyphenols in Greenhouse and Open-Air-Grown Lettuce. Food Chem. 2002, 79, 337. [Google Scholar] [CrossRef]
- Yang, M.; Wu, C.; Zhang, T.; Shi, L.; Li, J.; Liang, H.; Lv, X.; Jing, F.; Qin, L.; Zhao, T.; et al. Chicoric Acid: Natural Occurrence, Chemical Synthesis, Biosynthesis, and Their Bioactive Effects. Front. Chem. 2022, 10. [Google Scholar] [CrossRef]
- Popova, A.F. Comparative Characteristic of Mitochondria Ultrastructural Organization in Chlorella Cells under Altered Gravity Conditions. Adv. Space Res. 2003, 31, 2253–2259. [Google Scholar] [CrossRef]
- Sytnik, K.M.; Popova, A.F.; Nechitailo, G.S.; Mashinsky, A.L. Peculiarities of the Submicroscopic Organization of Chlorella Cells Cultivated on a Solid Medium in Microgravity. Adv. Space Res. 1992, 12, 103–107. [Google Scholar] [CrossRef]
- Vasilenko, A.; Popova, A.F. Energetic Metabolism Response in Algae and Higher Plant Species from Simulation Experiments with the Clinostat. Adv. Space Res. Off. J. Comm. Space Res. COSPAR 1996, 17, 103–106. [Google Scholar] [CrossRef] [PubMed]
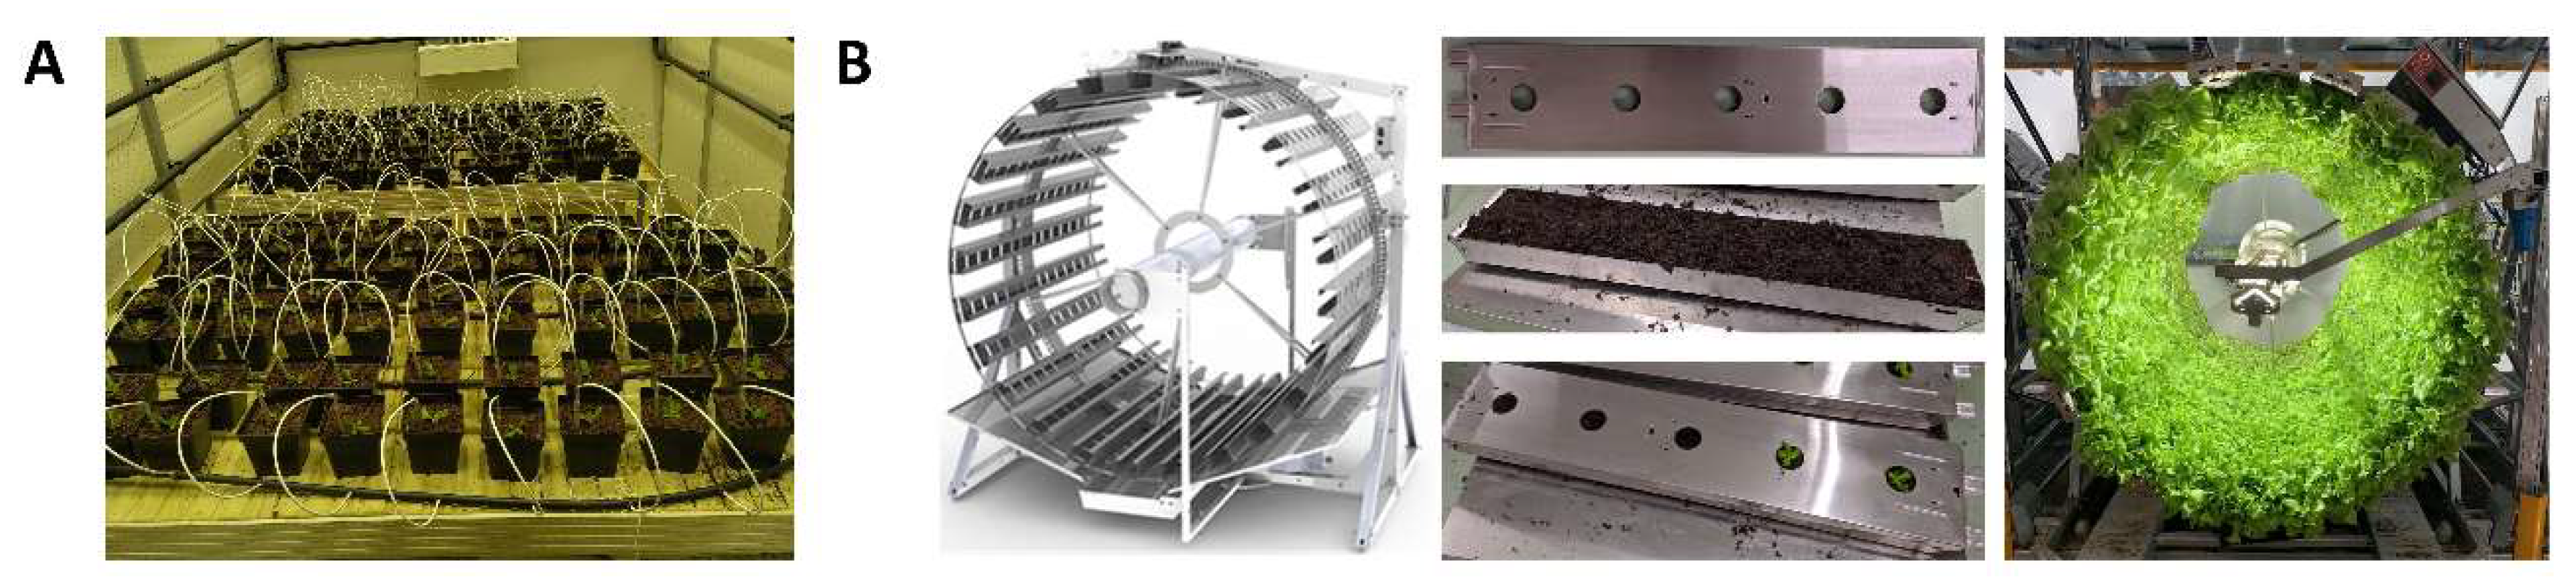
Figure 1.
Representation of the control cultivation system (A) (CT lettuces) and the rotational cultivation system Gigrow® from Futura Gaïa Technology (B) (ROT lettuces). In the rotational cultivation system, plants were grown in stainless steel trays containing potting soil similar to the control.
Figure 1.
Representation of the control cultivation system (A) (CT lettuces) and the rotational cultivation system Gigrow® from Futura Gaïa Technology (B) (ROT lettuces). In the rotational cultivation system, plants were grown in stainless steel trays containing potting soil similar to the control.
Figure 2.
Yields and efficiencies of lettuces grown in control or rotational cultivation systems (CT and ROT lettuces, respectively). (A) Fresh and dry matter yields per square meter. (B) Water Use Efficiency (WUE). (C) Light Use Efficiency (LUE). (D) Energy Use Efficiency (EUE). (E) Land Surface Use Efficiency (LSUE). Efficiencies were calculated according to Orsini et al., 2020. The mean values for CT and ROT lettuces are noted on top of each corresponding bar. Standard deviations are represented as error bars. Significant differences were tested using the non-parametric pairwise Wilcoxon-Mann-Whitney test (n = 5, α = 0,01). P-values are shown above each bar in italics. Significant differences are indicated by an asterisk..
Figure 3.
Photosynthetic parameters of lettuces grown in control and rotational cultivation systems (CT and ROT lettuces, respectively). (A) Net photosynthesis, i.e., net carbon assimilation. (B) Stomatal conductance. For (A) and (B), data are expressed according to the 16 daily hours of lighting (h), where 0 represents the beginning of the lighting period and 16 represents the end. Each point represents the mean value of all measurements taken over the previous 2 hours (for each point, 41 ≥ n ≥ 17). Standard deviations are presented as error bars. Significant differences were tested using the non-parametric pairwise Wilcoxon-Mann-Whitney test (α = 0,01). Significant differences are indicated by an asterisk. (C) Efficiency of photosystem II (ΦPSII), measured during the first 6 hours of lighting. The mean values for CT and ROT lettuces are noted on top of each corresponding bar. Standard deviations are represented as error bars. A significant difference was tested using the non-parametric pairwise Wilcoxon-Mann-Whitney test (n ≥ 50, α = 0,01). P-value is shown, and significant difference is indicated by an asterisk.
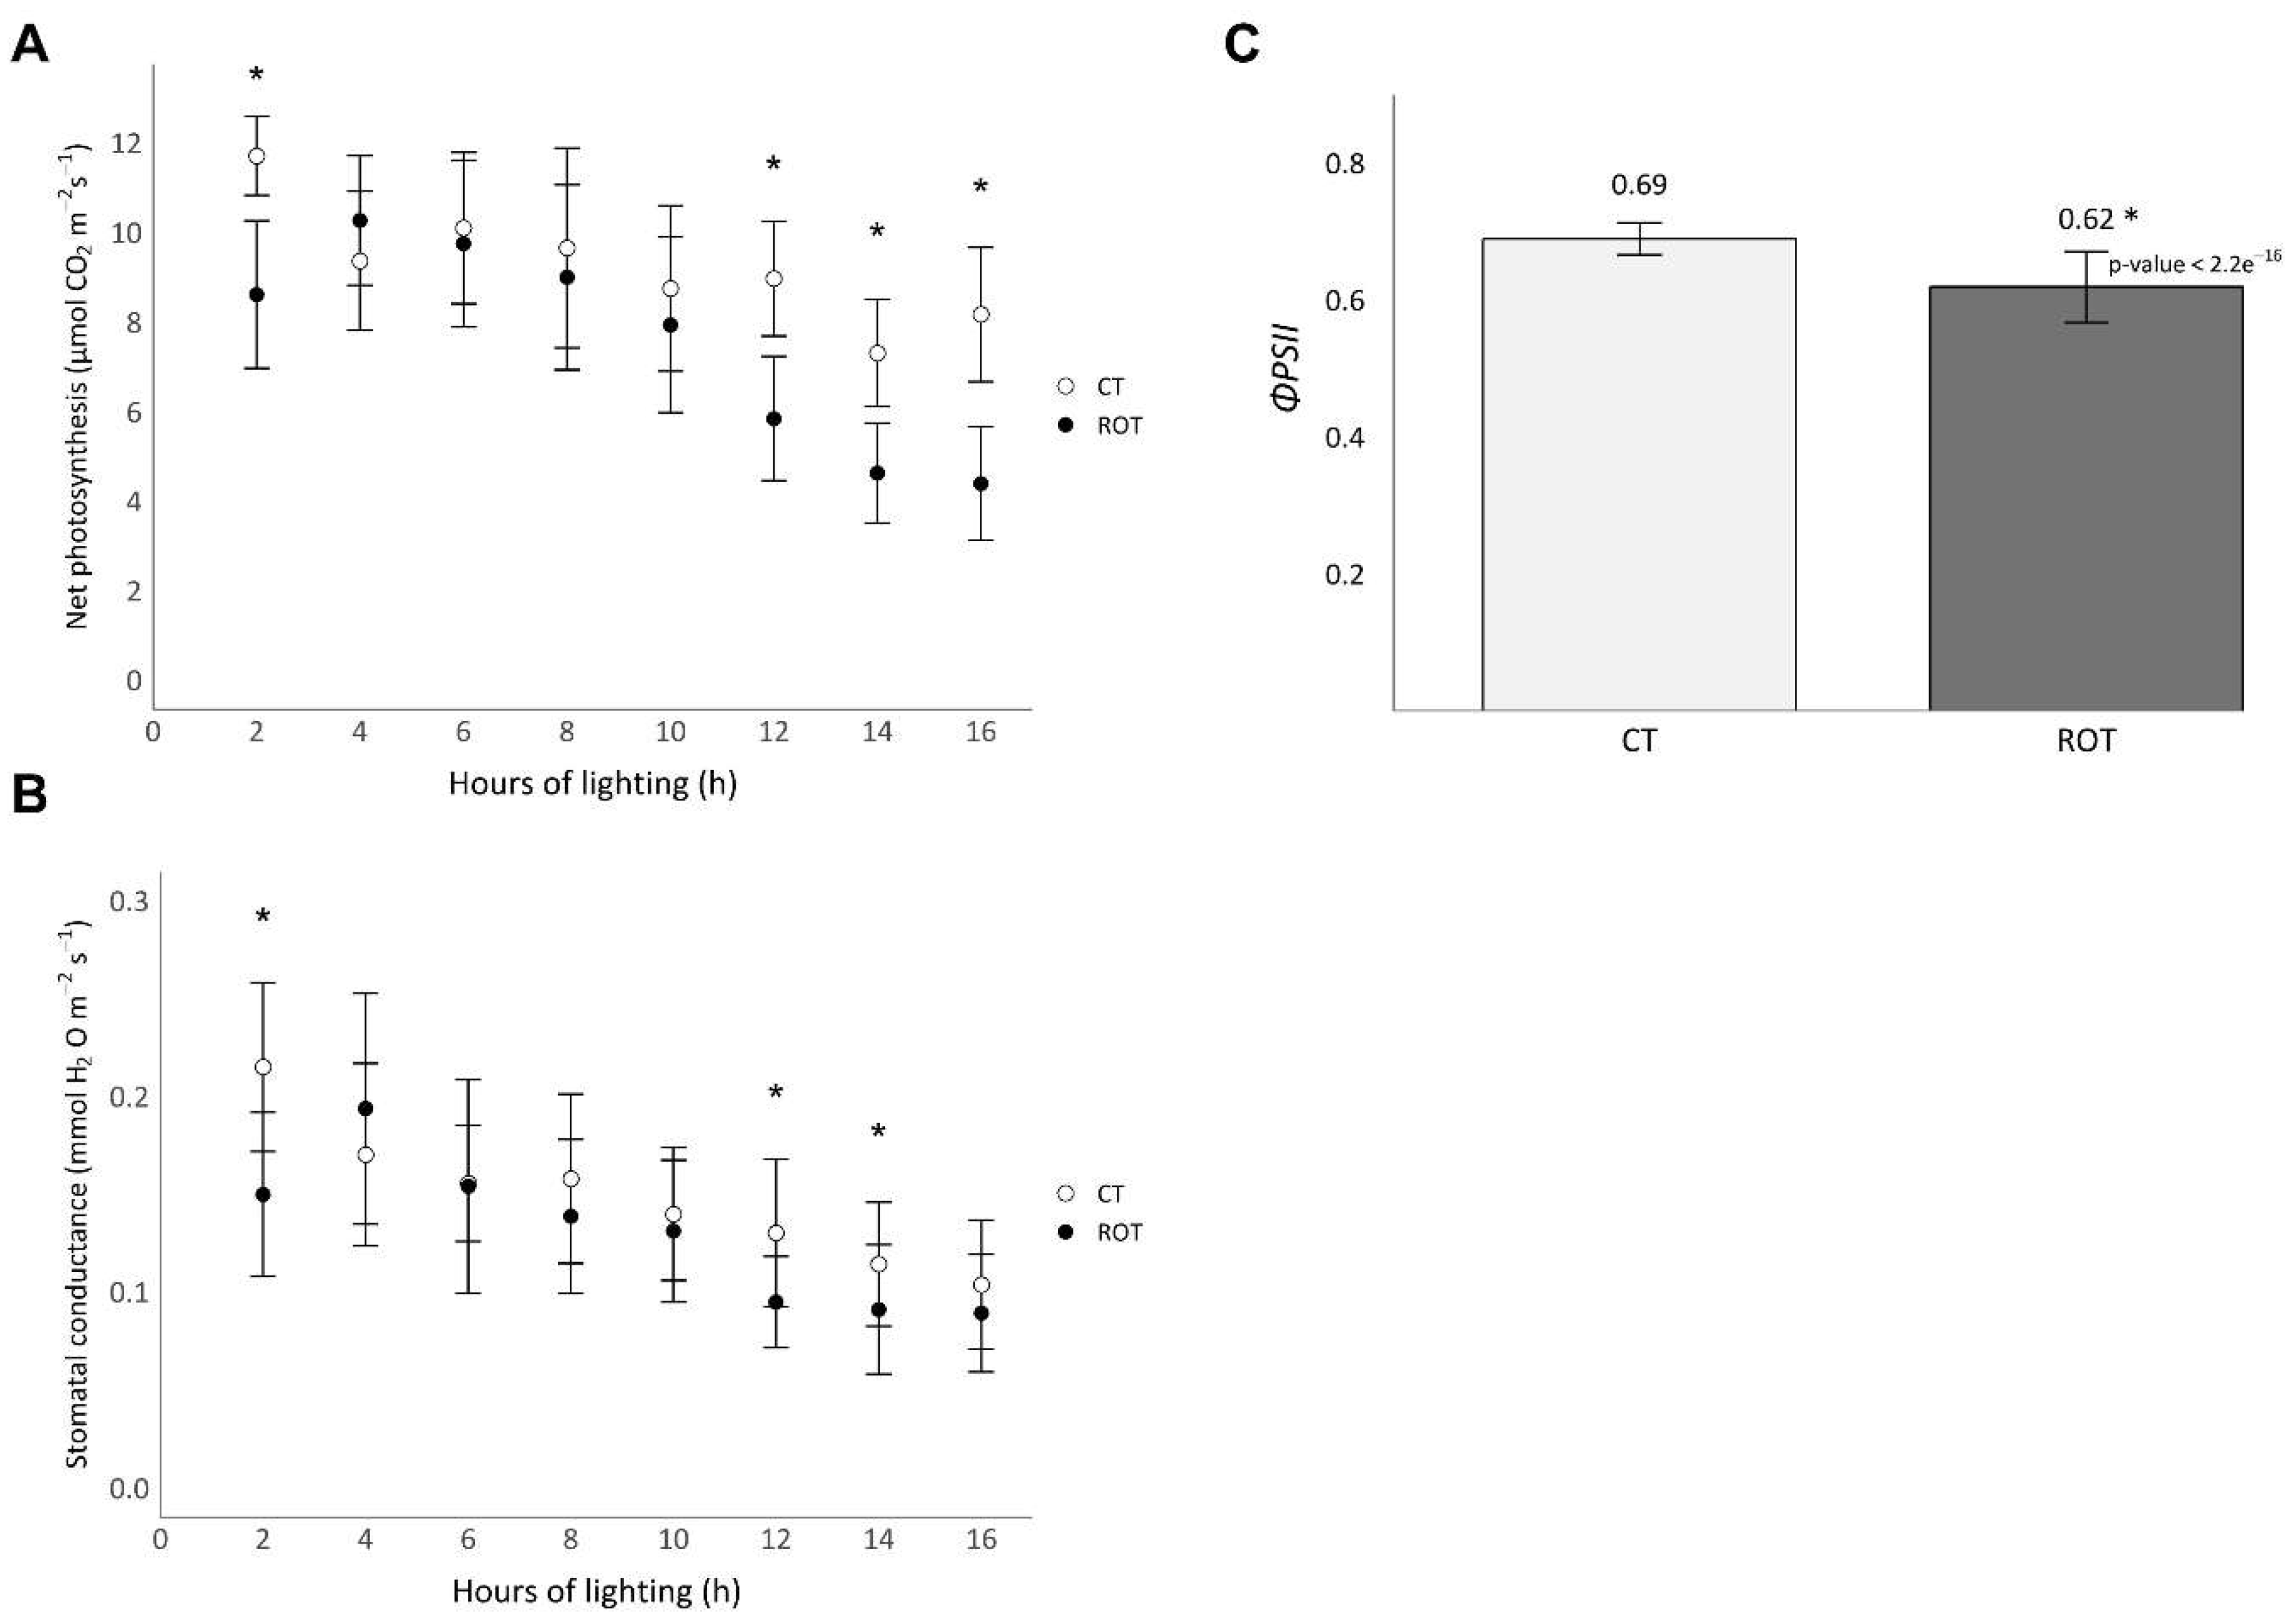
Figure 4.
Quality analyses of lettuces grown in control or rotational cultivation systems (CT and ROT lettuces, respectively). (A) Principal Component Analysis (PCA) of the metabolite profiles from untargeted UPLC-ESI-QTOF-MSE. (B) S-plot from the supervised OPLS-DA model, highlighting caftaric acid as a differentiating metabolite between CT and ROT lettuces. (C) Caftaric, chlorogenic, and chicoric acid contents. Significant differences were tested using the non-parametric Wilcoxon-Mann-Whitney test (n=5, α = 0,01). P-values are shown, and significant differences are indicated by an asterisk.
Figure 5.
Postharvest parameters of lettuces grown in control and rotational cultivation systems (CT and ROT lettuces, respectively). (A) O2 content. (B) CO2 content. For (A) and (B), dashed lines represent the fitting of a second-degree polynomial regression. (C) Respiration rates. (D) Overall visual quality, with the limit of marketability represented by a dashed red bar. Data are represented according to the days of storage. Each point represents the mean value of 10 plants for (A) and (B), and 5 plants for (C) and (D). Standard deviations are represented as error bars. Significant differences were tested using the non-parametric pairwise Wilcoxon-Mann-Whitney test (α = 0,01). Significant differences are indicated by an asterisk.
Table 1.
Fresh weight, dry weight, and leaf area of lettuces grown in control and rotational cultivation systems (CT and ROT lettuces, respectively), measured according to days after transplantation (DAT). Data are presented as mean ± standard deviation (sd). Significant differences were tested using the non-parametric pairwise Wilcoxon-Mann-Whitney test (n=5, α = 0,01). P-values are shown, and significant differences are indicated by an asterisk.
| |
Fresh weight (g) |
Dry weight (g) |
Leaf area (cm²) |
| |
CT |
ROT |
|
CT |
ROT |
|
CT |
ROT |
|
| DAT |
mean |
sd |
mean |
sd |
p-value |
mean |
sd |
mean |
sd |
p-value |
mean |
sd |
mean |
sd |
p-value |
| 0 |
0,4 |
± 0,07 |
0,5 |
± 0,05 |
0,6 |
0,02 |
± 0,005 |
0,03 |
± 0,005 |
0,016 |
17 |
± 4 |
20 |
± 2 |
0,151 |
| 8 |
3,3 |
± 0,29 |
2,7 |
± 0,25 |
0,016 |
0,23 |
± 0,02 |
0,22 |
± 0,02 |
0,421 |
168 |
± 13 |
115* |
± 8 |
0,008 |
| 14 |
36 |
± 4,4 |
27 |
± 5,4 |
0,032 |
1,9 |
± 0,12 |
1,3* |
± 0,25 |
0,008 |
1051 |
± 83 |
795 |
± 105 |
0,016 |
| 19 |
112 |
± 11,9 |
79* |
± 15,8 |
0,008 |
4,4 |
± 0,64 |
3,4 |
± 0,57 |
0,032 |
2403 |
± 505 |
2426 |
± 499 |
0,841 |
| 24 |
184 |
± 18,3 |
155 |
± 30,7 |
0,151 |
7,5 |
± 1,07 |
6 |
± 1,24 |
0,0952 |
3632 |
± 530 |
4511 |
± 1087 |
0,222 |
| 28 |
262 |
± 13,3 |
247 |
± 8,35 |
0,095 |
10,2 |
± 0,72 |
8,6 |
± 0,66 |
0,0159 |
7341 |
± 794 |
6099 |
± 884 |
0,056 |
| 31 |
301 |
± 16,9 |
277 |
± 40,8 |
0,421 |
10,5 |
±1,6 |
8,9 |
± 1,4 |
0,151 |
8013 |
± 1406 |
6635 |
± 1351 |
0,222 |
Table 2.
Glucose, fructose, sucrose, and total soluble sugars (TSS) contents of lettuces grown in control and rotational cultivation system (CT and ROT lettuces, respectively), measured at 18 and 31 days after transplantation (DAT). Data are presented as mean ± standard deviation (sd). Significant differences were tested using the non-parametric pairwise Wilcoxon-Mann-Whitney test (n=5 at 18 DAT, n=4 at 31 DAT, α = 0,01). P-values are shown, and significant differences are indicated by an asterisk.
| |
Glucose (mg g-1 of DW) |
Fructose (mg g-1 of DW) |
Sucrose (mg g-1 of DW) |
Total soluble sugars (mg g-1 of DW) |
| |
CT |
|
ROT |
|
|
CT |
|
ROT |
|
|
CT |
|
ROT |
|
|
CT |
|
ROT |
|
|
| DAT |
mean |
sd |
mean |
sd |
p-value |
mean |
sd |
mean |
sd |
p-value |
mean |
sd |
mean |
sd |
p-value |
mean |
sd |
mean |
sd |
p-value |
| 18 |
108 |
± 19,8 |
81* |
± 6,4 |
0,0079 |
161 |
± 23,2 |
101* |
± 10,2 |
0,0079 |
114 |
± 21,3 |
99 |
± 10,1 |
0,1508 |
383 |
± 23,2 |
281* |
± 15,7 |
0,0079 |
| 31 |
129 |
± 14,8 |
95 |
± 19,2 |
0,0635 |
130 |
±16,5 |
101 |
± 19,7 |
0,1111 |
13 |
± 2 |
19 |
± 8,5 |
0,2857 |
273 |
± 33,2 |
214 |
± 32,8 |
0,0635 |
|
Disclaimer/Publisher’s Note: The statements, opinions and data contained in all publications are solely those of the individual author(s) and contributor(s) and not of MDPI and/or the editor(s). MDPI and/or the editor(s) disclaim responsibility for any injury to people or property resulting from any ideas, methods, instructions or products referred to in the content. |
© 2025 by the authors. Licensee MDPI, Basel, Switzerland. This article is an open access article distributed under the terms and conditions of the Creative Commons Attribution (CC BY) license (http://creativecommons.org/licenses/by/4.0/).