
Submitted:
11 February 2025
Posted:
12 February 2025
You are already at the latest version
Abstract
The present study concerns the investigation of the sorption and desorption phenomena of the organic compound methylene blue which is used as a synthetic dye in several industries. The batch equilibrium technique was applied using three marine sediments collected from the North Aegean Sea (Greece). Simultaneously, a different target of the current survey was to examine whether non-living biomass of the seagrass species Posidonia oceanica can be used as efficient biosorbents for the removal of MB dye from wastewater through phycoremediation. The influence of several factors on biosorption was studied, such as organic dye loading, biomass loading, contact time, solution pH, and speed of agitation. The obtained experimental results showed that both Freundlich and Langmuir isotherm models could describe the kinetics of the occurred process. Acquired results indicated a positive correlation between the sorption of the target chemical and the adsorbents' organic matter content and textural analysis of fine fraction (<63μm). Desorption studies revealed that the studied dye in most cases the dye was very strongly adsorbed on studied matrices with lower quantities of seawater extractable amounts. Finally, according to the experimental findings, bioadsorption on P. oceanica can be characterized as an efficient method for the bioremediation of dye-polluted wastewater.
Keywords:
Aquatic pollution
; Methylene blue
; Synthetic dyes
; Adsorption isotherms
; Biosorption
; Kinetics
; Marine sediments
; Algae
; Phycoremediation
1. Introduction
In modern society, a constantly growing number of harmful organic substances are discarded into the environment. Organic dyes constitute a category of synthetic and environmentally persistent pollutants. According to the 2012 annual report of Pure Earth (originally Blacksmith Institute, a New York City-based international nonprofit organization), textile industries contribute around 17–20 % of the total industrial water pollution globally [1,2].
A wide variety of dyes, including aryl amines, azo dyes, anthraquinones, carbazoles, oxazines, phenothiazines, rhodamines, thiophene dyes, and several other chemicals that are classified into different chemical groups is used in numerous applications. More than 100,000 commercial dyes have been reported worldwide [3]. Regardless of the various procedures that have been used worldwide to treat dye-containing wastewater produced by various industries (such as adsorption, precipitation, reverse osmosis, oxidation/reduction, and biological methods including aerobic and anaerobic treatments), dyes are inevitably released to the environment producing highly colored wastewater (according to the relevant scientific data, approximately 10%–15% of the originally used amount) [4]. Therefore, likewise many other anthropogenic organic substances, organic dyes can be introduced into various aquatic ecosystems including marine and coastal environments. The majority of dyes, along with their degradation byproducts, after penetrating several environmental compartments (soil, water, air), may cause numerous health problems for the inhabitants of the ecosystems and consequently humans due to their toxic and carcinogenic nature [5,6]. Solar radiation penetration and thus reduction of the photosynthesis rate of phytoplanktons and other macrophytes present in water, pH, and salinity of the water alterations, reduction of dissolved oxygen (DO), increase in biological oxygen demand (BOD) and chemical oxygen demand (COD) are some of the impacts that affect the overall ecological balance of the water body [1,7,8].
Hence, the scientific interest is non-diminishingly focused on dyes’ environmental fate and behavior, and their removal from dye-polluted wastewater matrices. Based on the retrieved literature, the removal of dyes can be achieved by numerous physical, chemical, and biological traditional techniques [9,10,11], while adsorption processes are considered feasible and effective methods for their elimination from water bodies [1,12]. The effectiveness of various low-cost adsorbents towards dye adsorption has been investigated, such as natural materials, waste materials from industry, agricultural by-products, and biomass based activated carbon [1,12,13].
Biosorption of toxic pollutants by macroalgae and microalgae, known as phycoremediation, is a promising method for wastewater treatment due to its natural, eco-friendly and cost-effective characteristics [1]. The major advantages of using algae in adsorption-based treatment of colored wastewater are their easy availability and growth, efficient uptake of dyes, and formation of less toxic sludge [1].
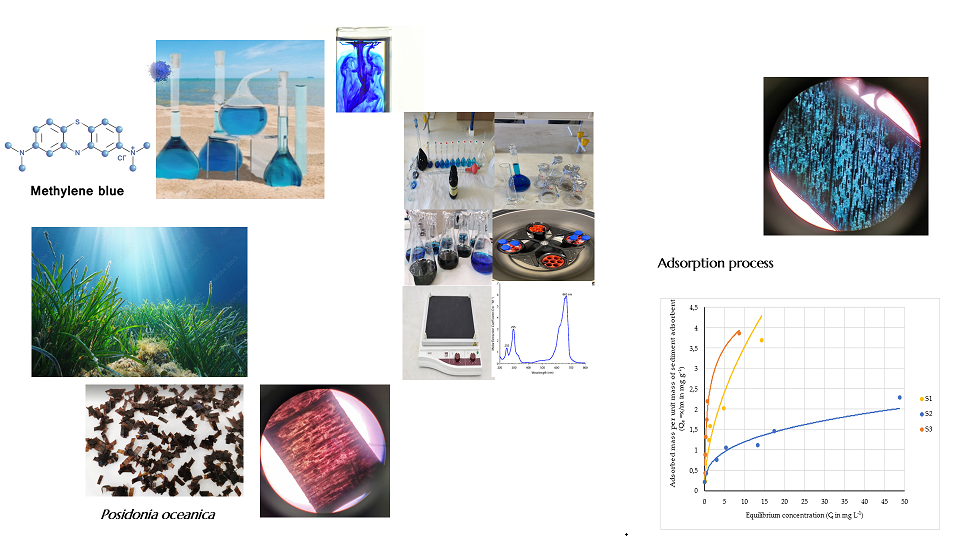
Methylene blue (MB) is an organic molecule classified as an aromatic heterocyclic basic dye. It is widely utilized as a synthetic dye across multiple industries, including textile, plastic, paper, and printing, and in scientific applications such as photo-redox catalysis, fluorescent tracers, and various medicinal uses. The International Union of Pure and Applied Chemistry (IUPAC) recognizes it by its full name: [7-(Dimethylamino)phenothiazin-3-ylidene]-dimethylazanium chloride (Table 1). Notably, MB is highly water-soluble and is recognized as a cationic and primary thiazine dye [14]. Its principal applications involve the paper, pulp, and printing industries, textile dyeing—especially for materials like silk, wool, and cotton—and it also serves as a pharmaceutical agent in the treatment of methemoglobinemia [1,13,14].
Since the dye compound MB is xenobiotic, its environmental fate and behavior are critical issues in research conducted by the scientific community. The persistence of the molecule determines its mobility across environmental compartments and defines its impact on the ecosystem. A comprehensive list of scientific studies, including various literature reviews, has documented the removal of MB through adsorption [15,16,17] and bioremediation [12,13,18]. However, the existing literature offers limited published data on the adsorption of MB onto natural substrates, such as marine sediments [19,20].
The present study concerns two scientific targets: (i) to investigate the sorption and desorption phenomena of MB on three different marine sediments collected from unpolluted coasts of the North Aegean Sea (Greece) that varied in their textural analysis and their content of organic matter, and (ii) to examine whether the seagrass species Posidonia oceanica is a natural material that can be used for the efficient bioadsorption of MB dye and consequently considered as a promising alternative treatment that could be applied as a supplement or a substitute method of current water treatments for the removal of organic pollutants from wastewater.

Table 1.
Structural formulae, main physicochemical properties, and other information for MB.
| Data | |
|---|---|
| Structural formulae |  |
| Molecular formulae | C16H18ClN3S |
| IUPAC systemic name | [7-(Dimethylamino)phenothiazin-3-ylidene]-dimethylazanium chloride |
| Synonyms | Aizen methylene blue; Basic blue 9 (8CI); Calcozine blue ZF; Chromosmon; C.I. 52 015; Methylthionine chloride; Methylthioninium chloride; Phenothiazine5-ium,3,7-bis, (dimethylamino)-, chloride; Swiss blue; Tetramethylene blue; Tetramethyl thionine chloride |
| Relative molecular mass | 319.85 a.m.u. |
| Description | Dark green crystals or crystalline powder with bronze lustre, odourless, stable in air, deep blue solution in water or alcohol, forms double salts |
| Density | 1.0 g/mL at 20 °C |
| Solubility | 43.6 g/L in water at 25 °C; also soluble in ethanol |
| pKa | 3.14 to 3.851 |
| Vapour pressure | 1.30 × 10⁻⁷ mm Hg at 25 °C |
2. Materials and Methods
Analytical grade MB was supplied by Merck (Germany) and used as adsorbate without any further purification. The stock solution of MB (1,000 mg L-1) was prepared daily in high purity water Type-II (Evoqua Water Technologies LLC, UK) and suitably diluted in saltwater to the required initial concentrations (working solutions). The seawater used in the current study was collected from an unpolluted area of the Aegean Sea, near the city of Mytilene (Lesvos) (Figure 1).
The sediment samples used in the present study were collected from three different sampling stations of the Aegean Sea in Northern Greece (Figure 1). Specifically, sediment samples 1 and 2, S1 and S2 respectively, were collected from stations 1 and 2 which were located in relatively unpolluted coastal areas of Chios (S1) and Lesvos (S2) islands. In contrast, sample 3 (S3) was gathered from station 3 which was located in a marine aquaculture industry (Selonda, Gera’s Golf, Lesvos).
Before their use, all three samples were air-dried at room temperature, passed through a 10-mesh sieve (2mm particle size), and stored in tightly sealed dark Pyrex vials under refrigeration (at -20°C). The determination of the % content of sediments’ organic matter was performed according to the Walkley & Black chromic acid wet oxidation method [24]. Finally, the organic matter content was calculated by multiplying organic carbon by factor 1.72. In Table 2 the afore-mentioned characteristics of the analyzed marine sediments are presented.
The criterion for the selection of those substrates as adsorbent surfaces were based on both their difference in their textural analysis fine fraction (<63μm) (that ranged between 1.68–34.54%) and the content of organic matter as well (that varied from 1.70 to 5.38%).
The non-living biomass of the species Posidonia oceanica employed as adsorbent material was manually collected from the coastal area of the city of Mytilene (Lesvos, N. Aegean) (Figure 1). The collected seagrass biomass was transferred in plastic bags to the laboratory within the same day and thoroughly washed with running tap water to remove any foreign bodies, chemical substances, and remaining saltwater. Afterward, the washed biomass was rinsed with ultrapure water multiple times (at least three). Finally, the seagrass mass was placed spread out on filter papers laid on plastic trays and left until complete air-drying was achieved at ambient temperature (18-20 ºC) for 48-72 hours to a constant weight. The storage of dried P. oceanica biomass was done in hermetically sealed glass jars until their further use in the adsorption tests. Simultaneously, the natural pretreatment of P. oceanica biomass was assessed by cutting its fibres into smaller pieces measuring 2mm in width and 6-7mm in length. This method was evaluated as a simple approach to enhance its adsorption capacity.
2.1. Adsorption studies
The batch adsorption experiments were conducted according to the Test Guideline-106 proposed by the Organization for Economic Co-operation and Development Guideline 106 [25]. The method has been previously described in detail by Vagi et al., 2023 [13,26]. Briefly described, all tested adsorption systems were prepared separately in Erlenmeyer flasks by mixing a known volume of MB standard solution (prepared in seawater and with final concentrations ranging between 1 and 100 mg L-1) with a pre-weighed quantity of studied adsorbent (marine sediment or seagrass biomass). Erlenmeyer flasks were sealed with Teflon lining and shaken by a horizontal shaker (Gesellschaft für Labortechnik, GFL, Germany) until adsorption equilibrium was reached (according to the results of the conducted preliminary kinetic experiments) at a constant room temperature of 20°C±1°C. After equilibration, aliquots of the aquatic suspensions were withdrawn (5 mL), centrifuged (5000 rpm for 15 min, Heraeus, Germany), and the remaining (not adsorbed) dye concentrations in the solution was determined by spectrophotochemical analysis at 665 nm (Cary 60 UV-Vis Spectrophotometer, Agilent Technologies, USA).
The amount of adsorbed MB on the marine substrates was evaluated by calculating the difference between the initial and equilibrium dye concentrations in the solution (Equations 1 & 2):
where Ci and Ce are the initial and equilibrium (or final) concentrations of MB dye (in mg L-1), respectively, V is the volume of the dye solution (in L), and m is the mass of dry adsorbent tested (in g) [1,27,28].
Further mass balance calculations were made based on the assumption that the total amount of MB dye that was originally added in the adsorption mixtures was equal to the sum of the amount of permanently adsorbed MB on the marine substrates used as adsorbent materials, the amount of pigment desorbed, the remaining (free or not-adsorbed) amount in the marine solution, and finally the amount of MB degraded by biotic or abiotic processes (Equation 3):
Simultaneously, similar experimental procedure was followed for blanks (without MB) and controls (without sediment or seagrass biomass) which were included in each sample batch to ensure the quality control of the conducted experiments. The average values of duplicate runs were obtained and analyzed.
2.2. Desorption studies
Desorption of adsorbed MB at 20°C±1°C was determined by using the experimental systems from previously conducted batch adsorption tests. When the equilibrium of the of the solid-solution mixtures (marine sediment-seawater or seagrass biomass-seawater mixtures) was reached, the entire volume of supernatants was poured off (after centrifugation, 5000 rpm for 15 min) and replaced by fresh seawater. The flasks were mechanically shaken for 2 h to achieve the desorption equilibration process and afterwards centrifuged (5000 rpm for 15 min). In each case, the amount of dye recovered through the desorption process by seawater was determined by spectrometric analysis (λ=665 nm), whereas the amount of MB remaining permanently adsorbed by the sediment or seagrass biomass was calculated as the difference between the initial adsorbed amount and the desorbed amount [13,26].
3. Results and Discussion
The experimental results obtained from the conducted adsorption-desorption batch equilibrium tests that were carried out are presented below.
3.1. Adsorption of methylene blue dye onto marine sediments
3.1.1. Effect of contact time
The effect of contact time on the extent of dye adsorbed onto the three marine adsorbent materials (and therefore removed from the aquatic solution) in terms of the % percentage amount remaining in solution versus contact time was investigated. The data acquired after the mechanical agitation of 7 mg L-1 MB seawater solution-sediment mixtures for 10, 20, 30, 60, 120, and 360 min are presented in Figure 2 for all the selected marine sediments and control experiments.
The results indicate that the sorption of MB on the three marine sediments occurred rapidly under the experimental conditions. All systems reached equilibrium, with the S3 sediment sample, which had a higher organic matter content (5.38%) and the highest percentage of fine fraction (<63μm) at 34.54%, showing the fastest rate. Equilibrium for the S3 sediment and MB solution mixtures was achieved within 30 minutes. However, a contact time of 2 hours was established as the optimum for all sediment-MB solution adsorption systems, as equilibrium was attained for all tested systems within that timeframe.
Given that in batch-type adsorption systems, a monolayer of adsorbate is normally formed on the surface of the adsorbent, the rate of transport of MB dye from the aqueous seawater solution onto the surface of the adsorbent was decreased when adsorption sites of the adsorbent particles were also reduced. Moreover, the amount of MB degraded during this time was negligible, as indicated by the control experiment of MB in seawater without adding sediment.
3.1.2. Adsorption isotherms
In the related literature, the adsorption process is usually investigated by plots/isotherms that relate the solute's relative concentrations in solution (Ce) and adsorbed to the solid adsorbent (q). For that purpose, seven test substance initial concentrations (Ci) were used between the range of 5 to 100 mg L-1 in batch adsorption tests as described in paragraph 2.1. (Experimental conditions: Volume of MB seawater solution =50mL; Dose of adsorbent = 2 g L-1; Contact time= 2 h; pH=8.00; θ=20°C±1°C). For the case of S3 sediment sample, experiments were performed using only six concentration levels of MB in the initial seawater solution that was in contact with the marine sediment. The lowest initial concentration of 5 mg L-1 (included in cases of sediments S1 and S2) was not studied, since total removal of MB through adsorption was expected to occur. After adsorption equilibrium was reached, individual spectrophotometric analysis of the aqueous phases was performed and the solution’s equilibrium concentrations (Ce) of MB were determined, and the amount of dye adsorbed on marine sediment’s surface was calculated from the depletion of the test substance in the solution (indirect method). The adsorbed mass per unit mass of adsorbent was plotted as a function of the equilibrium concentration of the test substance [25]. Derived data are illustrated in Table 3 and Figure 3 and were further processed via kinetic models in order to draw safer conclusions regarding the study of the specific process.
3.1.3. Kinetics of adsortion
The acquired experimental data depicted in Table 3 and Figure 3 were fitted to the following three isotherm adsorption models: Freundlich, Langmuir and Henry which are described by Equations 3, 4 and 5, respectively:
where x/m = Cs = q (in mg g-1) is the quantity of dye adsorbed (x, in mg) per unit mass of adsorbent (m, in g); Ce (in mg L-1) is the equilibrium concentration of MB in solution; KF (in mg1–1/n g−1 L1/n) is the adsorption constant or distribution coefficient that represents the quantity of MB adsorbed in mg/g (sediment) for a unit equilibrium concentration of the compound under test; n represents energy distribution of sorption sites, while l/n is a measure for the sorption intensity (e.g. for n=l the partition between the two phases is independent of the concentrations); (x/m)max = qmax (in mg g-1) is the measure of monolayer (maximum) adsorption capacity of the adsorbent substrate (marine sediment); KL is Langmuir constant and represents the energy of adsorption (in L mg-1); and finally KH is the adsorption constant (or distribution coefficient) of Henry’s isotherm model that indicates the adsorbate affinity toward a solid surface (in L g-1)
The obtained values for the basic isotherm modeling parameters after the application of the above three Equations are presented in Table 4.
From Table 4 it was observed that the equilibrium sorption data were very well represented by the Freundlich isotherm by providing the highest correlation coefficients (R2 ≥ 0.9004), whereas the lowest correlation coefficients were calculated for Henry isotherm (R2 ≥ 0.6949) that is a one-parameter adsorption model representing a linear relationship between the adsorbed adsorbate and the bulk amount of adsorbate present in the solution. In Freudlich isotherm model, the surface is considered as heterogeneous and moreover, in this case, monolayer capacity is not assumed [1,29]. Εstimated values of Freundlich sorption coefficients KF for adsorption systems of MB and S1, S2, and S3 sediments were 1.0049, 0.5623, and 1.8576 L mg-1, respectively. Furthermore, calculated 1/n values between the range of 0.328 and 0.546 (therefore less than 0.7) described highly curved isotherms (Figure 3). Obtaned values of (1/n) < 1, as well stated in bibliography, represent a convex, L type isotherm in which the adsorption energy decreases as the surface concentration increases, and the adsorption process is favorable if 1/n is greater than zero (0<(1/n)<1) [29].
In all three cases of marine sediment samples tested the KF (Freundlich isotherm model), qmax (Langmuir isotherm model), and KH (Henry isotherm model) values are in the order: S3>S1>S2 (Table 4), while % content of organic matter of the adsorbent sediments is in the order: S3>S1>S2 (Table 2). The lower adsorption capacity was determined in the experiments using as an adsorbent the sediment with a lower content of organic matter (S2). In others words the amount of MB sorbed on sediment with a lower content of organic matter (S2) was the smallest. On the contrary, for sediments with higher organic matter content (S1, 2.94%, and S3, 5.38%), sorption followed a different behavior and occurred to a higher extent. Therefore, a positive correlation between the sorption of MB and the organic matter content of marine sediments is indicated.
The adsorption distribution coefficients are important parameters for understanding the mobility of a chemical compound in the environmental matrices and its distribution between water and sediment compartments. However, their values for a given compound can vary dramatically between different types of soils or sediments. For that reason, the values of adsorption distribution coefficients are often normalized to the organic content of the matrix to obtain sorption coefficients that do not depend on the properties of the sorbent. Normalized to organic matter content sorption coefficients (KOM) are described as the ratio between the sorption coefficient KF, and the organic matter content of the sorbent, in units of mass of organic matter (OM) per mass of sediment (g OM/g sediment). Estimated KOM coefficients were used to assess the extent to which the studied organic chemical MB dye, was sorbed. KOM values were calculated through the Equation 6:
As shown in Table 5 the values of the KOM coefficients ranged from 33.0765 to 34.5279. Acquired data confirmed that using KOM coefficients over KF coefficients is preferable when adsorption experiments are performed on substrates with different percentages of organic matter content, as this smooths out the differences between the substrates, which in any case are reduced but not eliminated. Furthermore, the decreasing order of adsorption capacity, based on organic matter content normalized adsorption coefficients, followed the corresponding decreasing order of content of organic matter in the sediments:
Sediment S3 (KOΜ= 34,5279)> Sediment S1 (KOΜ= 34,1803)> Sediment S2 (KOΜ= 33,0765)
The mechanism of adsorption as well as the strength of the formed adsorbate-adsorbent bonds were evaluated by calculating the change in Gibbs free energy, ΔG (in both cal mol-1 and J mol-1 units) through Equation 7:
where R is the universal gas constant (equal to 1.986 cal K-1 mol-1 or 8.314 J K-1 mol-1), and T is the absolute temperature (in degrees K). Based on the calculated values presented in Table 5, ΔG is negative in all cases examined, indicating that the adsorption process is spontaneous and exothermic. As it has been well established in literature , a process occurs spontaneously, when the change in Gibbs free energy, ΔG, is negative. Simultaneously, the change in entropy, ΔS, is also negative, since adsorption restricts the freedom of translational movement of the adsorbed substance. Hence, the value of ΔG=ΔH-T ΔS is negative only if the change in enthalpy, ΔH, is also negative, i.e. if the process is exothermic. In addition, based on estimated data for all three sediments, the values of ΔG were of the same order of magnitude (range of values: from -2,067.98 cal mol-1 for sample S3 to -2,042.91 cal mol-1 for sample S1), indicating chemisorption in all cases examined.
3.1.4. Affinity of studied marine sediments with the MB dye
According to the the relevant scientific literature, in order to draw useful and safe conclusions regarding the affinity of the solid adsorption surface (i.e. marine sediments) with the adsorbed substance, the production of plots that describe the extent of adsorption in conditions of saturation of the aqueous solution is suggested, as for example the function ln(x/m)=f[ln(Ce/Cs)] [30]. In Figure 4 the relative graphs obtained are illustrated that show the correlation for eachone of the three sediments examined with the synthetic dye MB through the relations (a) ln(x/m)=f[ln(Ce/Cs)] and (b) (x/m)=f[ln(Ce/Cs)] where Ce is the adsorption equilibrium concentration and Cs is the solubility of of synthetic test compound in water (43.6 g/L, data from reference [23]).
Based on the information acquired from the relevant processing of the experimental results, it appears that the affinity of the marine sediment substrates for the adsorption of the selected synthetic dye follows the following increasing order: S2>S1>S3 as the isotherms in both Figure 4(a) and Figure 4(b) shift towards lower values of the parameter ln(Ce/Cs).
3.1.5. Mass balances
In Table 6 the results of the average values determined after the execution of two series of experiments are depicted concerning the % percentage masses of MB dye : (i) adsorbed on 1g of marine sediment at seven different concentrations, called loading levels, which ranged from 0.225 to 4.5 mg g-1 of dry marine sediment, (ii) desorbed by 10 mL of seawater (for loading levels 0.225, 0.45 and 0.9 mg g-1) or 20 mL of seawater (for loading levels 0.225, 0.45 and 0, 9 mg g-1), and finally (iii) remained free (or not adsorbed) in the seawater phase.
According to the relevant laboratory results of the mass balances study, it was evident that the percentages of the amount of MB dye adsorbed in all three marine sediments from different origins in the North Aegean Sea were notably high. For sample S1, the adsorption ranged from 85.75% to 98.06%. Sample S2 showed a broader range from 51.24% to 99.17%, while sample S3 had percentages ranging from 91.34% to 99.24%. As expected (based on the treatment results acquired by adsorption isotherm models and the assessment of the affinity of the substance with the substrates), the lowest adsorption rates were observed for the case of sample S2, which was the sample containing the minimum values of organic matter content (1.70%) and microparticle fraction <63μm (6.24%). On the contrary, the highest adsorption percentages were recorded for the case of sample S3, which was the sample with the highest content of organic matter (5.38%) as well as the highest value of microparticle content <63μm (34.54%).
Additionally, it became evident from Table 6 that the adsorption of the selected organic compound decreased as its concentration increased in the seawater/sediment system. For example, the % amount of adsorbed substance in sample S2 decreased from 99.17% to 51.24% (~48% reduction) when the initial concentration in the aqueous solution that was in contact with the solid surface of the sediment rised from 5 mg L-1 to 100 mg L-1 (those concentrations in the contact solution correspond to loading levels of 0.225 mg g-1 and 4.5 mg g-1 marine sediment, respectively). These result are in accordance with the relevant scientific literature, according to which this phenomenon is expected and interpreted based on the fact that as all the active adsorption sites available from the surface of the marine sediment are occupied, the system is driven towards a saturation state [12,29].
Regarding the desorption process, as it follows from Table 6, the percentages of the desorbed amount of MB dye (calculated based on the initial amounts of MB loaded in batch adsorption systems and based on the corresponding adsorbed masses of MB) were too low. More specifically, the percentages of the desorbed amounts of MB (based on the initial amounts of the compound in the sediment/seawater mixture) ranged for sample S1 from 0.09 to 1.62%, for sample S2 from 0.09 to 0.38% and sample S3 from 0.00 to 0.68%. These observations suggest the following assumptions: (i) strong retention of the adsorbed molecules of the compound with the colloidal particles of the sediment through high energy bonds which do not break and consequently the process of adsorption (chemisorption) is irreversible, and (ii) the greater affinity of the molecules of the MB compound to the adsorption sites of the colloids of the marine sediments examined compared to seawater.
Finally, the unadsorbed amount of synthetic dye that remained free in the overlying seawater solution (i.e. in the water column of marine environment) was different for each case of examined sediment and dependent on the physicochemical characteristics of the underlying marine sediment substrate. In particular, the highest percentages of non-adsorbed/free amount of MB, which ranged from 0.83 to 48.76% of the initial amount, were observed in the case of sample S2 which was the sample with the minimum content of organic matter and fine textural fraction<63μm (1.70% and 6.24%, respectively). On the contrary, the lowest percentages of free amount were recorded for the case of sample S3 (from 1.00 to 8.66% of the initial amount of MB) which was the sample with the maximum organic matter content (5.38%) as well as the highest value of contained microparticle fraction <63μm (34.54%). Sample S1 showed moderate behavior as the percentages of non-adsorbed, and therefore bioavailable substance percentages, ranged from 1.94 to 14.25%, an observation attributed to the corresponding values of organic matter content (2.94%) and microparticle fraction <63μm (1.68%).
3.2. Adsorption of methylene blue dye onto seagrass biomass of Posidonia oceanica species
3.2.1. Effect of contact time
The effect of contact time on the amount of dye adsorbed on biomass of P. oceanica was examined at various time intervals in seawater solutions containing initial concentrations of dye that varied (within the range of 10 to 50 mg L-1), and which were mixed with two different doses of the studied algal adsorbent substrate (1 and 2 g L-1). Selected experimental data obtained are presented in Figure 5 for both cases of biomass in original physical size and biomass cut into smaller length pieces (2mm width x 7mm length). Based on the results, the contact time required to achieve adsorption equilibrium is short (about 60 min) indicating a rapid process of transport and accumulation of MB on the surface of the seagrass biomass. The relative increase in the extent of removal of dye after 60 min of contact time is not significant and hence it was fixed as the optimum contact time for MB and P. oceanica adsorption systems.
Considering that the rate of the studied physical process of transport and retention of the substance from the liquid solution on the solid surface of the adsorbent depends on the number and availability of surface adsorption sites, the shape of the curve was expected. Τhe decrease in the adsorption rate of MB pigment by P. oceanica species depending on the time that is observed in Figure 5 is attributed to the fact that the increase in the quantity of substance already adsorbed leads to less likely possibilities for a non-adsorbed molecule to find an available adsorption site.
In addition, according to Figure B data, the estimated rate of the process was greater in the material of seagrass biomass that had been divided into small pieces compared to not cut seagrass biomass. This observation was expected since the increase in the surface area of adsorbent accelerates the phenomenon, especially in the initial stages when diffusion and dispersion from the solution between the pores of the adsorbent take place. Finally, negligible amount of MB degraded during the control experiment (MB in seawater without adding algal biomass, Figure 5).
3.2.2. Effect of adsorbent’s dose
The effect of the adsorbent’s dose on the extent of MB dye adsorption (in terms of percentage removal and equilibrium concentration) was investigated by the conduction of a series of batch adsorption experiments using different amounts of algae mass of P. oceanica species. Hence, individual masses of adsorbent material ranging between the values of 1 to 25 g L-1 were used, mixed with 50 mL of dye standard solution at three concentration levels (20 mg L-1, 30 mg L-1 and 50 mg L-1) and shaken mechanically to bring the adsorption equilibrium (contact time 60min, stirring speed 150 rpm, pH=5.77, θ=20°C±1°C). The relevant data for initial concentration level 20 mg L-1 are given in Figure 6 indicating that the percentage removal of MB increased with the increase in dose of adsorbent. This may be due to the increase in availability of surface-active-sites resulting from the increased dose and conglomeration of the adsorbent which is in accordance with other researchers [27,28,31].
Based on the acquired results the increase in the extent of MB dye’s removal by adsorption was found to be significant by increasing the dose of adsorbent up to 2 g L-1, whereas above that value minor further increase in the adsorption capacity of the adsorption systems was observed. Consequently, the amount of biomass 2 g L-1 was fixed as the optimum dose of P. oceanica used as adsorbent substrate in all other series of experiments conducted.
3.2.3. Effect of mechanical rotational stirring speed
Batch adsorption experiments with constant algal biomass (2 g L-1) and initial concentration of MB dye 30 mg L-1 (volume of MB seawater solution 50 mL) were performed at different mechanical rotational stirring speeds (0, 150, 300 and 450 rpm) to study the effect of rotational speed on the adsorption capacity of the seaweed P. oceanica. After 60min of mechanical agitation (to reach adsorption equilibrium), equilibrium concentration of target dye substance was determined via spectrophotometric analysis and the corresponding results are summarized in Figure 7 (in terms of percentage removal by adsorption).
Although the maximum (%) percentage removal of MB through adsorption process on the studied seagrass biomass was achieved at the highest value of tested stirring speed (450 rpm) than the others examined (0, 150, and 300 rpm), however the stirring rate of 150 rpm was chosen as the most practical and efficient one for the execution of the experiments since at this speed the % adsorption was in the same order of magnitude (at 150 rpm: 84.99%±2.99% removal; at 450 rpm: 88.77%±4.93% removal).
3.2.4. Effect of pH
In order to study the effect of pH of the aquatic solution containing the dye on the adsorption process onto algal biomass, experiments were carried out over a range of pH values (2.20 to 11.80). The pH was adjusted to the desired value by adding sodium hydroxide (NaOH) or hydrogen chloride (HCl) solution. The results of the measurements are given in Figure 8 where the quantity of adsorbed MB pigment per unit mass of P. oceanica seaweed (mg of MB per g of biomass) as a function of pH is depicted. As can be seen, the minimum value of adsorbent capacity is observed at pH=2.20 (11.18 mg g-1), which increased up to the value of 5.45 and then remained constant (15.59 mg g-1) within the pH range of 5.45 and 11.50.
Several researchers have already reported that the aqueous solution pH is an important parameter influencing the sorptive uptake of dyes because of its profound impact on both the surface binding sites of the biosorbent and the ionization/aggregation process of the dye molecules [12,27,28,32]. The lower adsorptive capacity that was noted at the most acidic value studied (pH=2.20) can be attributed to the fact that methylene blue is a cationic substance (pKa =3.14 έως 3.851, Table 1) combined with the phenomenon that at low pH values (or high concentrations of hydrogen cations H+) the surface of the seaweed can be positively charged (primary via protonation of functional groups contained in polysaccharides, lipids and proteins). Therefore, due to the repulsive electrostatic forces between the adsorbent and the absorbate reduced adsorption occurred at pH=2.20. Consequently, pH=5.45 was set as the optimal value for the maximum adsorbent capacity and used in the rest of the adsorption experiments including the study of adsorption isotherms. The results of the present study regarding the influence of solution pH on biosorption of MB by algae are consistent with other published studies that involved the study of biosorptive uptake of MB using various species of algae, such as the Mediterranean green alga Enteromorpha spp. [28], and P. oceanica [32] which showed that the equilibrium biosorption capacity was optimal under alkaline conditions (pH=6-10) and minimum at acidic pH 2 [28,32].
3.2.5. Adsortion isotherms
Isotherms relating the solute's relative concentrations in solution (Ce) and adsorbed to the solid adsorbent (Qe) were plotted after the performance of the appropriate experiments. More specific, five test substance initial concentrations (Ci) were used between the range of 10 to 50 mg L-1 in batch adsorption tests that were performed under the optimal experimental conditions, as described in paragraph 2.1. (Experimental conditions: Volume of MB seawater solution =50mL; Dose of adsorbent = 2 g L-1; Contact time=60min; pH=5.45; θ=20°C±1°C). After adsorption equilibrium was reached, the amount of dye adsorbed on P. oceanica was determined indirectly (calculated from the depletion of the test substance in the solution) [25]. Derived data are illustrated in Table 7 and Figure 9.
3.2.6. Adsorption kinetic modelling
The acquired experimental data depicted in Table 7 and Figure 9 were fitted to the prescribed Freundlich’s, Langmuir’s and Henry’s isotherm adsorption models, described by Equations 3, 4 and 5, respectively. The isotherm modelling parameters related to the biosorption of MB onto P. oceanica biomass calculated are summarized in Table 8.
As shown by the isotherm modelling parameters calculated through the three different mahthematical adsorption models (Table 8), it becomes evident that the squared regression correlation coefficients (R2) ranged between the values 0.7735 and 0.9606 indicating from satisfactory to very good fit of the obtained experimental data to all models examined.
Moreover, based on the comparison of calculated data illustrated in Table 8, it is observed that the Langmuir adsorption model was the best-fit equilibrium isotherm model for the processing of the experimental equilibrium adsorption data of MB dye on the selected alga as its application provided the highest collinearity coefficient values for both the untreated P. oceanica biomass as well as for the naturally treated by shredding P. oceanica biomass (cut into pieces of size 2mm x 6-7mm) with R2 values equal to 0.9131 and 0.9606, respectively. Therefore, the main assumption that could be made is the monolayer coverage process of MB molecules onto Pocidonia’s sorptive sites. Consequenlty, the surface of tested seagrass can be considered as homogeneous where all adsorption sites exhibit equal affinity for solute MB molecules [1,33,34]. As it has been previously reported by other researchers the Langmuir model is a valid model for monolayer sorption onto a surface with a finite number of similar active sites [27,28,32,33,34,35]. Furthermore, the high values of substrate’s sorptive capacity (13.245 mg g-1 and 17.857 mg g-1 for not-cut and cut into smaller size pieces of P. oceanica, accordingly) indicated the strong atrraction forces that interact between the binding-sites on the biomass of seagrass and the molecues of the studied dye.
High values of adsorption capacity indicate a strong electrostatic force of attraction between MB dye molecules and the biosorbent binding sites of P. oceanica, which align with previously reported scientific data on the removal of various chemicals from aqueous solutions through adsorption onto algal species. For instance, Ncibi et al. conducted batch biosorption experiments for the removal of MB from aqueous solutions using biomass from P. oceanica fibers, achieving a maximum adsorption capacity of 5.56 mg g-1 [32]. Additionally, the same authors noted that a significantly higher adsorption capacity of 274 mg g-1 could be achieved in the removal of MB by utilizing raw and dried Mediterranean green alga Enteromorpha spp. as adsorbent materials [28].
4. Discussion
Based on the broad published bibliographic information gathered in this research, there has been significant scientific interest in removing MB dye as a pollutant from aqueous solutions through adsorption techniques utilizing low-cost adsorbents such as agricultural wastes and byproducts, industrial solid wastes, biomass, clay minerals, and zeolites [15,36,37]. The use of biosorption methods with algae to remediate dyes from aquatic ecosystems provides a cleanup technology that is not only cost-effective but also eco-friendly, non-intrusive, and safe. This technique, known as phycoremediation, is a segment of bioremediation that employs macroalgae or microalgae to remove or transform contaminants with potential toxicity, including various dyes present in water into nonhazardous compounds. Algae possess several advantageous characteristics that make them suitable for efficiently eliminating synthetic dyes from dilute effluents. These include their abundance in nature, large surface area-to-volume ratios, ability to clean sites contaminated with multiple types of pollutants, and the generation of minimal amounts of chemical and biological sludge for disposal [1].
More specifically, the studies on biosorption of MB dye by plants, macroalgae or microalgae revealed an interesting adsorption potential of some species such as Posidonia oceanica [present study,32], Enteromorpha spp. [28], Spirodela polyrrhiza [38], Ulva Lactuca [39], Cystoseira barbatula [40], Sargassum muticum [41], Bifurcaria bifurcate [42], Fucus vesiculosus [43], Chlorella pyrenoidosa [44], Phaeodactylum tricornutum [45], Caulerpa lentillifera [46], Sargassum muticum [47], and Gelidium [48]. Summarized bibliography retried is given in Table 9.
The experimental results of this study concerning the adsorption efficiency of the seagrass P. oceanica in removing methylene blue cationic dye from aquatic solutions simulating a marine environment are comparable to some of the previously published scientific data presented in Table 9. In comparison to earlier scientific studies that documented the successful elimination of the studied dye from aqueous solutions in laboratory settings, the maximum capacity evaluated in the current study (13.24 to 17.86 mg g-1) is consistent with the findings of Santaeufemia et al. (2021). Their research focused on the effective removal of dyes from seawater using both dead and living biomass of the microalga Phaeodactylum tricornutum, reporting a maximum removal capacity for methylene blue of 18.9 mg g−1. Notably, the dead biomass exhibited greater effectiveness, likely due to the difficulties faced by the dye in penetrating living cells [45].
Likewise, the study by El Sikaily et al. (2006) investigated the maximum adsorption capacity of the commonly available green alga Ulva lactuca as a viable biosorbent for the biological treatment of methylene blue. They found that the adsorption capacity was approximately 40.2 mg of dye per gram of dry green algae at a pH of 10, with dye and alga concentrations of 25 g L−1 and 2.5 g L−1, respectively [39]. According to Caparkaya et al. (2008), the maximum adsorption capacity of the brown alga Cystoseira barbatula Kützing, which is widely distributed in the Mediterranean Sea, was estimated as 38.61 mg g–1 at 35 °C. This observation suggested that it could serve as an effective and low-cost bio-sorbent for the removal of methylene blue from aqueous solutions [40]. Accordingly, values of the same order of magnitude were determined by Pathak, et al. (2015) for phycoremediation of MB by Chlorella pyrenoidosa (20.8-21.3 mg g-1) [44].
Simultaneously, other researchers have reported varying adsorption efficiencies for different species used as biosorbents. For example, a study by Bouzikri et al. (2020) found that the brown marine alga Bifurcaria bifurcata, which is abundantly available along the Moroccan coast, achieved a maximum biosorption capacity of 2,744.5 mg g⁻¹ for methylene blue (MB) at an optimal pH of 5.6, after a contact time of 15 minutes [42]. Similarly, the maximum adsorption capacities of various species have been documented, showing that some are more efficient in the bioremediation of methylene blue (MB) dye. For instance, Spirodela polyrrhiza has a capacity of 144.93 mg g⁻¹ [38], Sargassum muticum at 191.38 mg g⁻¹ [39], Fucus vesiculosus at 698.477 mg g⁻¹ [43], Caulerpa lentillifera at 417 mg g⁻¹ [46], and another measurement for Sargassum muticum is 279.2 mg g⁻¹ [47], with algae Gelidium also showing a capacity of 279.2 mg g⁻¹ [48]. In comparison, the estimated adsorption capacity for P. oceanica in the present study ranges from 13.24 to 17.86 mg g⁻¹, which is significantly lower than the capacities of those algal species. On the contrary, Ncibi et al. (2007) studied the kinetic and equilibrium sorption phenomenon of methylene blue by the seagrass P. oceanica, which is an endemic marine magnoliophyta present in the Mediterranean Sea and is the same species utilized by the present study. The results showed that biosorption capacity was optimal using a 6–9 solution pH range and by increasing the biosorbent concentration up to 1 g L-1. The reported value of maximum bioadsorption capacity was equal to 5.56 mg g-1 [32], which is lower than the one that was estimated in the present study.
Furthermore, the published scientific data retrieved showed that there is a complete lack of data regarding the sorption process of MB dye in water systems and specifically in marine and coastal ecosystems. Although for a few decades, the method of biosorption of chemical dyes and especially MB on biomass adsorbent materials of various origins (e.g. algae, fungi, agricultural by-products, activated carbon, etc.) has been extensively studied and has been proven to be a very effective method of remediation of industrial wastewater containing xenobiotic pigments, however the study of the adsorption process in natural environmental substrates such as soils and sediments is minimal (Table 9).
For example, the published work of Liu et al. (2012), according to the results of which it is shown that wine-processing waste sludge (WPWS) allowed the adsorption of high amounts of MB from aqueous solution (maximum adsorption capacity qmax= 285.7 mg g-1) due to its high organic matter content. This characteristic made this mud excellent for dye adsorption due to its large specific surface area and high binding affinity with the adsorbed dye [50]. Similarly, in an experimental study by Chen et at. (2018) which was implemented with sewage channel sediments collected from a Taiwanese industrial park, appear to exhibit behavior very similar to WPWS. These sediments were also black in color and fine-textured (mud and very fine sand covered with black, sticky organic materials), so the canal sediment could remove the most MB from water at pH 8.0 (qmax= 56.0 mg g-1 at 10 °C), while additionally it was shown that adsorption rates increased with increasing temperature [20].
Finally, according to the findings of Dra et al. (2020), batch studies on the adsorption of methylene blue (MB) using untreated Moroccan sediment from Oued Sebou revealed a maximum adsorption yield of 100%. This was achieved at a pH of 8, a solution temperature of 323 K, a sediment mass of 1 g·L−1, and an MB concentration of 10 mg·L−1. These results indicate that the operational parameters significantly influenced the adsorption process. Additionally, a maximum adsorption capacity of 3.24 mg g−1 was reported [49].
Therefore, marine sediments and raw P. oceanica seagrass fibres seem to be competitive materials compared to other methylene blue sorbents and some optimizing treatments on these substrates might be very interesting for further studies in the future.
5. Conclusions
In conclusion, the experimental results from this study, which investigated the adsorption of methylene blue dye on marine sediments from the Aegean Sea in Northern Greece, demonstrate that this process is significant. It influences the distribution of the synthetic dye within the marine ecosystem, occurs extensively, and is irreversible. The highest removal of adsorption was achieved at a basic pH and with high organic matter and fine sediment fractions (less than 63μm). The Langmuir and Freundlich isotherm models closely fit the adsorption process, while Henry’s isotherm model showed the lowest squared correlation coefficients for fitness.
Additionally, the findings indicated that the cationic dye methylene blue was strongly adsorbed onto the surfaces of various marine sediments as well as on the seagrass biomass of Posidonia oceanica, a native marine flowering plant found in the Mediterranean Sea. The results suggest that non-living biomass of P. oceanica can effectively serve as a raw material, requiring no additional preparation, for removing the dye from seawater across a wide range of concentrations. Overall, the results of this study indicate that using natural materials from the Aegean Sea in Northern Greece for the adsorption removal of methylene blue dye is both feasible and environmentally friendly.
Conflicts of Interest
“The authors declare no conflicts of interest.”
Abbreviations
The following abbreviations are used in this manuscript:
| BOD | Biological Oxygen Demand |
| Ce | Equilibrium concentration of methylene blue in the solution (in mg L-1) |
| Ci | Initial concentration of methylene blue in the solution (in mg L-1) |
| Cs | Solubility or saturation concentration (in mg L-1) |
| COD | Chemical Oxygen Demand |
| DO | Dissolved oxygen |
| IUPAC | International Union of Pure and Applied Chemistry |
| KF | Freundlich’s isotherm constant (in mg1–1/n g−1 L1/n ) or L mg-1) |
| KH | Henry’s isotherm constant (in L g-1) |
| KL | Langmuir’s isotherm constant (in L mg-1) |
| KOM | Normalized sorption coefficients per 1g of organic matter |
| m | Mass of dry adsorbent (in g) |
| MB | Methylene Blue |
| n | Freundlich exponent related to adsorption intensity (dimensionless) |
| OECD | Organization for Economic Co-operation and Development Guideline |
| OM | Organic matter |
| pH | Negative logarithm (base 10) of hydrogen ion concentration |
| pKa | Negative logarithm (base 10) of the acid dissociation constant |
| q | Amount of methylene blue adsorbed per unit of mass of dry adsorbent (in mg g-1) |
| qmax | Maximum (monolayer) adsorption capacity of the adsorbent substrate (in mg g-1) |
| R | Universal gas constant (equal to 1.986 cal K-1 mol-1 or 8.314 J K-1 mol-1) |
| R2 | Squared regression correlation coefficient |
| T | Absolute temperature (in K degrees) |
| V | Solution volume (in L) |
| WPWS | Wine-Processing Waste Sludge |
| ΔG | Change in Gibbs free energy (in cal mol-1 or J mol-1) |
| ΔH | Change in enthalpy (in cal mol-1 or J mol-1) |
| ΔS | Change in entropy (in cal mol-1 or J mol-1) |
| θ | Temperature (in oC degrees) |
References
- Chakravarty, P.; Bauddh, K.; Kumar, M. (2015). Remediation of Dyes from Aquatic Ecosystems by Biosorption Method Using Algae. In: Algae and Environmental Sustainability. Developments in Applied Phycology; Singh, B., Bauddh, K., Bux, F., Eds.; Publisher: Springer, New Delhi, 2015; Volume 7, pp. 97–106. [CrossRef]
- Blacksmith Institute Annual Report: 2012 report: the top ten sources by global burden of disease. Available online: http://en.wikipedia.org/wiki/Blacksmith_Institute#2012_report:_The_Top_Ten_Sources_by_Global_Burden_of_Disease (accessed on 5/2/2025).
- Bouras, H.D.; Isik, Z.; Arikan, E.B.; Yeddou, A.R.; Bouras, N.; Chergui, A.; Favier, L.; Amrane, A.; Dizge, N. Biosorption characteristics of methylene blue dye by two fungal biomasses. Int. J. Environ. Stud. 2020, Volume 78, pp.365–381. [CrossRef]
- Koroglu, E.O.; Yoruklu, H.C.; Demir, A.; Ozkaya, B. Chapter 3.9 - Scale-Up and Commercialization Issues of the MFCs: Challenges and Implications. In Biomass, Biofuels and Biochemicals, Microbial Electrochemical Technology, Venkata Mohan, S., Sunita Varjani, Ashok Pandey, Eds; Elsevier, 2019, pp. 565-583. Available online: https://doi.org/10.1016/B978-0-444-64052-9.00023-6 (accessed on 15/1/2025). [CrossRef]
- Alves de Lima, R.O.; Bazo, A.P.; Salvadori, D.M.F.; Rech, C.M.; de Oliveira Palma, D., Umbuzeiro, G.A. Mutagenic and carcinogenic potential of a textile azo dye processing plant effluent that impacts a drinking water source. Mut. Res./Gen. Toxicol. Environ. Mutagen. 2007, Volume 626, pp.53–60. [CrossRef]
- Oplatowska, M.; Donnelly, R.F.; Majithiya, R.J.; Kennedy, D.G.; Elliott, C.T. The potential for human exposure, direct and indirect, to the suspected carcinogenic triphenylmethane dye Brilliant Green from green paper towels. Food Chem. Toxicol. 2011, Volume 49, pp.1870–1876. [CrossRef]
- Chia, M.A.; Musa, R.I. Effect of indigo dye effluent on the growth, biomass production and phenotype plasticity of Scenedesmus quadricauda (Chlorococcales). An. Acad. Bras. Cienc. 2014, Volume 86(1), pp. 419–428.
- Ratna, R.; Padhi, B.S. Pollution due to synthetic dyes toxicity & carcinogenicity studies and remediation. Int. J. Environ. Sci. 2012, Volume 3(3), pp. 940-955.
- Suteu, D.; Zaharia, C.; Bilba, D.; Muresan, A.; Muresan, R.; Popescu, A. Decolorization wastewaters from the textile industry – physical methods, chemical methods. Ind .Text. 2009, Volume 60, pp.254–263.
- Zaharia,C.; Suteu ,D. Textile organic dyes – characteristics, polluting effects and separation/elimination procedures from industrial effluents – a critical overview. In: Organic pollutants ten years after the Stockholm Convention – Environmental and analytical update, 1st ed., Puzyn, T., Mostrag-Szlichtyng A., Eds.; Publisher: InTech, Croatia, 2012, pp 55–86.
- Punzi, M.; Anbalagan, A.; Aragão Börner, R.; Svensson, B.M.; Jonstrup, M.; Mattiasson, B. Degradation of a textile azo dye using biological treatment followed by photo-Fenton oxidation: evaluation of toxicity and microbial community structure. Chem. Eng. J. 2015, Volume 270, pp.290–299. [CrossRef]
- Yagub, M.T.; Sen, T.K.; Afroze, S.; Ang, H.M. Dye and its removal from aqueous solution by adsorption: A review. Adv. Colloid Interface Sci. 2014, Volume 209, pp. 172-184. [CrossRef]
- Vagi, M.C.; Leventelli M.; Petsas, A.S. Adsorption-desorption of methylene blue dye onto marine sediments: Kinetics and equilibrium studies. In Proceedings of 18th International Conference on Environmental Science and Technology, Athens, Greece, (30 August to 2 September 2023).
- Khan, I.; Saeed, K.; Zekker, I.; Zhang, B.; Hendi, A.H.; Ahmad, A.; Ahmad, S.; Zada, N.; Ahmad, H.; Shah, L.A.; et al. Review on Methylene Blue: Its Properties, Uses, Toxicity and Photodegradation. Water, 2022, Volume 14, Article ID 242. [CrossRef]
- Rafatullah, M.; Sulaiman, O.; Hashim, R.; Ahmad, A. Adsorption of methylene blue on low-cost adsorbents: A review. J. Hazard. Mater. 2010, Volume 177, pp. 70–80. [CrossRef]
- Santoso, E.; Ediati, R.; Kusumawati, Y.; Bahruji, H.; Sulistiono, D.O.; Prasetyoko, D. Review on recent advances of carbon based adsorbent for methylene blue removal from waste water. Mater. Today Chem. 2020, Volume 16, Article ID 100233. [CrossRef]
- Mashkoor, F.; Nasar, A. Magsorbents: Potential candidates in wastewater treatment technology—A review on the removal of methylene blue dye. J. Magn. Magn. Mater. 2020, Volume 500, Article ID 166408. [CrossRef]
- Zamel, D.; Khan, A.U. Bacterial immobilization on cellulose acetate based nanofibers for methylene blue removal from wastewater: Mini-review. Inorg. Chem. Commun. 2021, Volume 131, Article ID 108766. [CrossRef]
- Dra, A.; Tanji, Κ.; Arrahli, A.; Iboustaten, Ε.Μ.; Gaidoumi, A. Ε.; Kherchafi, A.; Chaouni Benabdallah, A.; Kherbeche ,A. Valorization of Oued Sebou Natural Sediments (Fez-Morocco Area) as Adsorbent of Methylene Blue Dye: Kinetic and Thermodynamic Study. Sci. World J. 2020, Volume 2020, Article ID 2187129. [CrossRef]
- Chen, L-F.; Wang, H.-H.; Lin, K.-Y.; Kuo, J.-Y.; Wang, M.-K.; Liu, C.-C. Removal of methylene blue from aqueous solution using sediment obtained from a canal in an industrial park. Water Sci. Technol. 2018, Volume 78(3-4), pp. 556-570. [CrossRef]
- Global Chemical Network (ChemNet). Available online: https://www.chemnet.com (accessed on 15/1/2025).
- National Toxicology Program (NTP). Toxicology and carcinogenesis studies of methylene blue trihydrate (Cas No. 7220–79–3) in F344/N rats and B6C3F1 mice (gavage studies). Natl Toxicol Program Tech Rep Ser. 2008 May; 540, 1–224. PMID:18685714. Available online: https://pubmed.ncbi.nlm.nih.gov/18685714/ (accessed on 15/1/2025).
- PubChem Open Chemistry Database at the National Library of Medicine, National Center for Biotechnology Information. Methylene blue. Available online: https://pubchem.ncbi.nlm.nih.gov (accessed on 15/1/2025).
- Walkley, A.; Black, I.A. An examination of the Degtjiareff method for determining soil organic matter and a proposed modification of chromic acid titration method. Soil Sci. 1934, Volume 37, pp. 29-38.
- Organization for Economic Co-operation and Development (OECD). Test No. 106: Adsorption-Desorption Using a Batch Equilibrium Method. In OECD Guidelines for Testing of Chemicals, Section 1. OECD Publishing, Paris. Available online: https://doi.org/10.1787/9789264069602-en (accessed on 15/1/2025). [CrossRef]
- Vagi, M.C.; Petsas, A.S.; Kostopoulou, M.N.; Lekkas, T.D. Adsorption and desorption processes of the organophosphorus pesticides, dimethoate and fenthion, onto three Greek agricultural soils. Int. J. Environ. Anal. Chem. 2010, Volume 90(3-6), pp. 369-389. [CrossRef]
- Ncibi, M.C.; Mahjoub, B.; Ben Hamissa, A.M.; Ben Mansour, R.; Seffen, M. Biosorption of textile metal-complexed dye from aqueous medium using Posidonia oceanica (L.) leaf sheaths: Mathematical modelling. Desalination 2009, Volume 243, pp. 109-121. [CrossRef]
- Ncibi, M.C.; Ben Hamissa, A.M.; Fathallah, A.; Kortas, M.H.; Baklouti, T.; Mahjoub, B.; Seffen, M. Biosorptive uptake of methylene blue using Mediterranean green alga Enteromorpha spp. J. Haz. Mat. 2009, Volume 170 (2-3), pp. 1050-1055. [CrossRef]
- Chen, X.; Hossain, M.F.; Duan, C.; Lu, J.; Tsang, Y.F.; Islam, M.S.; Zhou, Y. Isotherm models for adsorption of heavy metals from water - A review. Chemosphere. 2022, Volume 307, Part 1, Article ID 135545. [CrossRef]
- Vagi, M.C. Hydrolysis and adsorption study of selected organophosphorus pesticides in aquatic and soil systems. Εvaluation of their toxicity on marine algae. phD Thesis, University of the Aegean, Department of Environment, School of Environment, Mytilene, Lesvos, 2007. Available online: http://hdl.handle.net/10442/hedi/17779(accessed on 6/2/2025) (in Greek, 355 pages).
- Kannan, N.; Sundaram, M.M. Kinetics and mechanism of removal of methylene blue by adsorption on various carbons—A comparative study. Dyes Pigments 2001, Volume 51, pp. 25–40.
- Ncibi, M.C.; Mahjoub, B.; Seffen, M. Kinetic and equilibrium studies of methylene blue biosorption by Posidonia oceanica (L.) fibres. J. Hazard. Mater. 2007, Volume 139(2), pp. 280–285. [CrossRef]
- Langmuir, I. The adsorption of gases on plane surfaces of glass, mica and platinum. J. Am. Chem. Soc. 1918,40 (9), pp. 1361–1403.
- Kaewsarn, P.; Yu, Q. Cadmium removal from aqueous solutions by pretreated biomass of marine algae Padina sp. Environ. Pollut. 2001, Volume 112, pp. 209–213.
- Rashid, J.;Tehreem, F.; Rehman, A.; Kumar, R.. Synthesis using natural functionalization of activated carbon frompumpkin peels for decolourization of aqueous methylene blue. Sci. Total Environ. 2019, Volume 671, pp. 369–376.
- Wang, J.; Ma, J.; Sun, Y. Adsorption of methylene blue by coal-based activated carbon in high-salt wastewater. Water, 2022, Volume 14(21), Article ID 3576. [CrossRef]
- Kuang, Y.; Zhang, X.; Zhou, S. Adsorption of methylene blue in water onto activated carbon by surfactant modification. Water, 2020, Volume 12(2), Article ID 587. [CrossRef]
- Waranusantigul, P.; Pokethitiyook, P.; Kruatrachue, M.; Upatham, E.S. Kinetics of basic dye (methylene blue) biosorption by giant duckweed (Spirodela polyrrhiza). Environ. Pollut. 2003, Volume 125, pp. 385–392.
- El Sikaily, A.; Khaled, A.; El Nemr, A.; Abdelwahab, O. Removal of methylene blue from aqueous solution by marine green alga Ulva lactuca. Chem. Ecol. 2006, Volume 22(2), pp. 149–57.
- Caparkaya, D.; Cavas, L. Biosorption of methylene blue by a brown alga Cystoseira barbatula Kutzing. Acta Chim. Slov. 2008, Volume 55, pp. 547–553.
- El Atouani, S.; Belattmania, Z.; Reani, A.; Tahiri, S.; Aarfane, A.; Bentiss, F.; Zrid, R.; Sabour, B. Brown seaweed Sargassum muticum as low-cost biosorbent of Methylene blue. Int. J. Environ. Res. 2019, Volume 13, pp. 131–142.
- Bouzikri, S.; Ouasfi, N.; Benzidia, N.; Salhi, A.; Bakkas, S.; Khamliche, L. Marine alga “Bifurcaria bifurcata”: Biosorption of Reactive Blue 19 and methylene blue from aqueous solutions. Environ. Sci. Pollut. Res. 2020, Volume 27, pp. 33636–33648. [CrossRef]
- Lebron, Y.A.R.; Moreira, V.R.; Santos, L.V.S. Studies on dye biosorption enhancement by chemically modified Fucus vesiculosus, Spirulina maxima and Chlorella pyrenoidosa algae. J. Clean. Prod. 2019, Volume 240, Article ID 118197.
- Pathak, V.V., Kothari, R., Chopra, A.K., Singh, D.P. (2015). Experimental and kinetic studies for phycoremediation and dye removal by Chlorella pyrenoidosa from textile wastewater. J. Environ. Manag. 2015, Volume 163, pp. 270-277.
- Santaeufemia, S.; Abalde, J.; Torres, E. Efficient removal of dyes from seawater using as biosorbent the dead and living biomass of the microalga Phaeodactylum tricornutum: equilibrium and kinetics studies. J. Appl. Phycol. 2021, Volume 33, pp. 3071–3090. [CrossRef]
- Marungrueng, K.; Pavasant, P. High performance biosorbent (Caulerpa lentillifera) for basic dye removal. Biores. Technol. 2007, Volume 98(8), pp. 1567–1572.
- Rubin, E.; Rodriquez, P.; Herrero, R.; Cremades, J.; Barbara, I.; Sastre de Vicente, M.E. Removal of methylene blue from aqueous solutions using as biosorbent Sargassum muticum: an invasive macroalga in Europe. J. Chem. Technol.Biotechn. 2005, Volume 80(3), pp. 291–298. [CrossRef]
- Vilar, V.J.P.; Botelho, C.; Boaventura, R.A.R. Methylene blue adsorption by algal biomass-based materials: biosorbents characterization and process behaviour. J. Hazard. Mat. 2007, Volume 147(1), pp. 120–132. [CrossRef]
- Dra A., Tanji Κ., Arrahli A., Iboustaten Ε.Μ., Gaidoumi A. Ε., Kherchafi A., Chaouni Benabdallah A., Kherbeche A., (2020). Valorization of Oued Sebou Natural Sediments (Fez-Morocco Area) as Adsorbent of Methylene Blue Dye: Kinetic and Thermodynamic Study. Sci. World J. 2020, Volume 2020, Article ID 2187129. [CrossRef]
- Liu, C.C.; Li, Y.S.; Chen, Y.M.; Li, H.H.; Wang, M.K. Removal of methylene blue from aqueous solution using wine-processing waste sludge. Wat. Sci. Technol. 2012, Volume 65 (12), pp. 2191–2199. [CrossRef]
Figure 1.
Map of sampling locations of marine sediments and seagrass biomass.
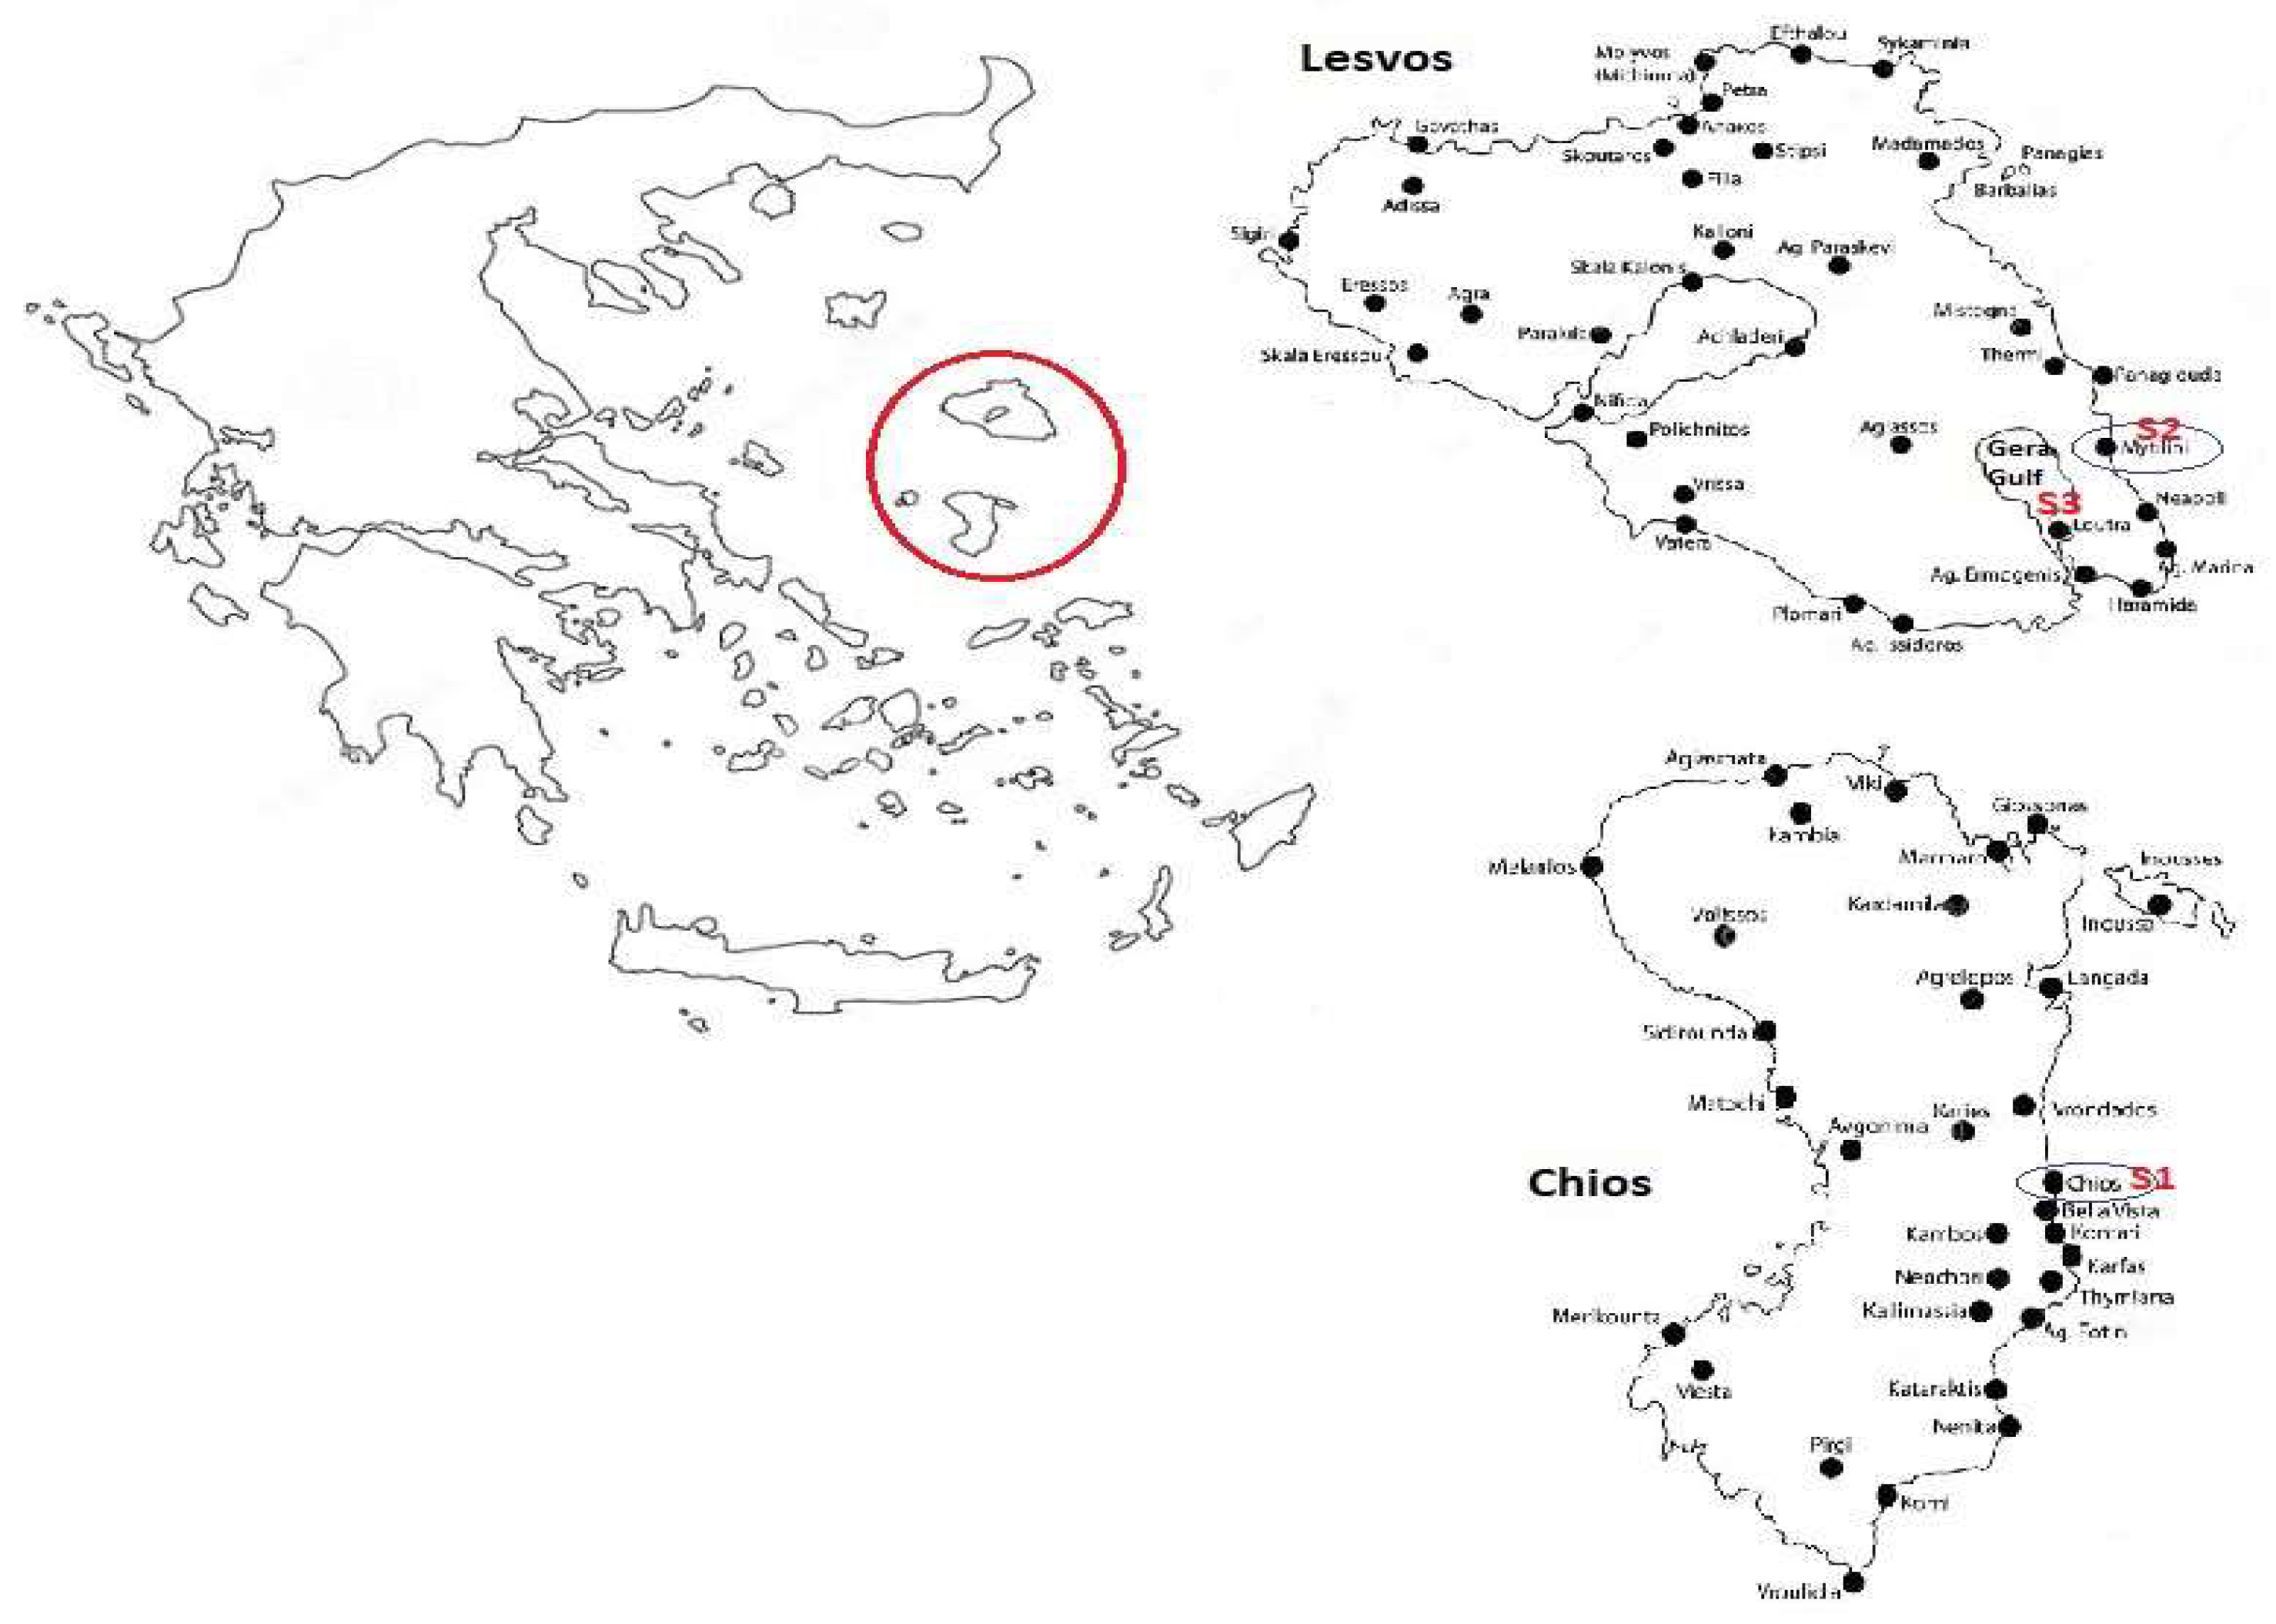
Figure 2.
Rate of sorption of MB onto marine sediments studied (Experimental conditions: Dye’s initial concentration = Ci = 7 mg L-1; Volume of MB seawater solution =50mL; Dose of adsorbent = 0.5 g L-1; pH=8.00; θ=20°C±1°C).
Figure 2.
Rate of sorption of MB onto marine sediments studied (Experimental conditions: Dye’s initial concentration = Ci = 7 mg L-1; Volume of MB seawater solution =50mL; Dose of adsorbent = 0.5 g L-1; pH=8.00; θ=20°C±1°C).
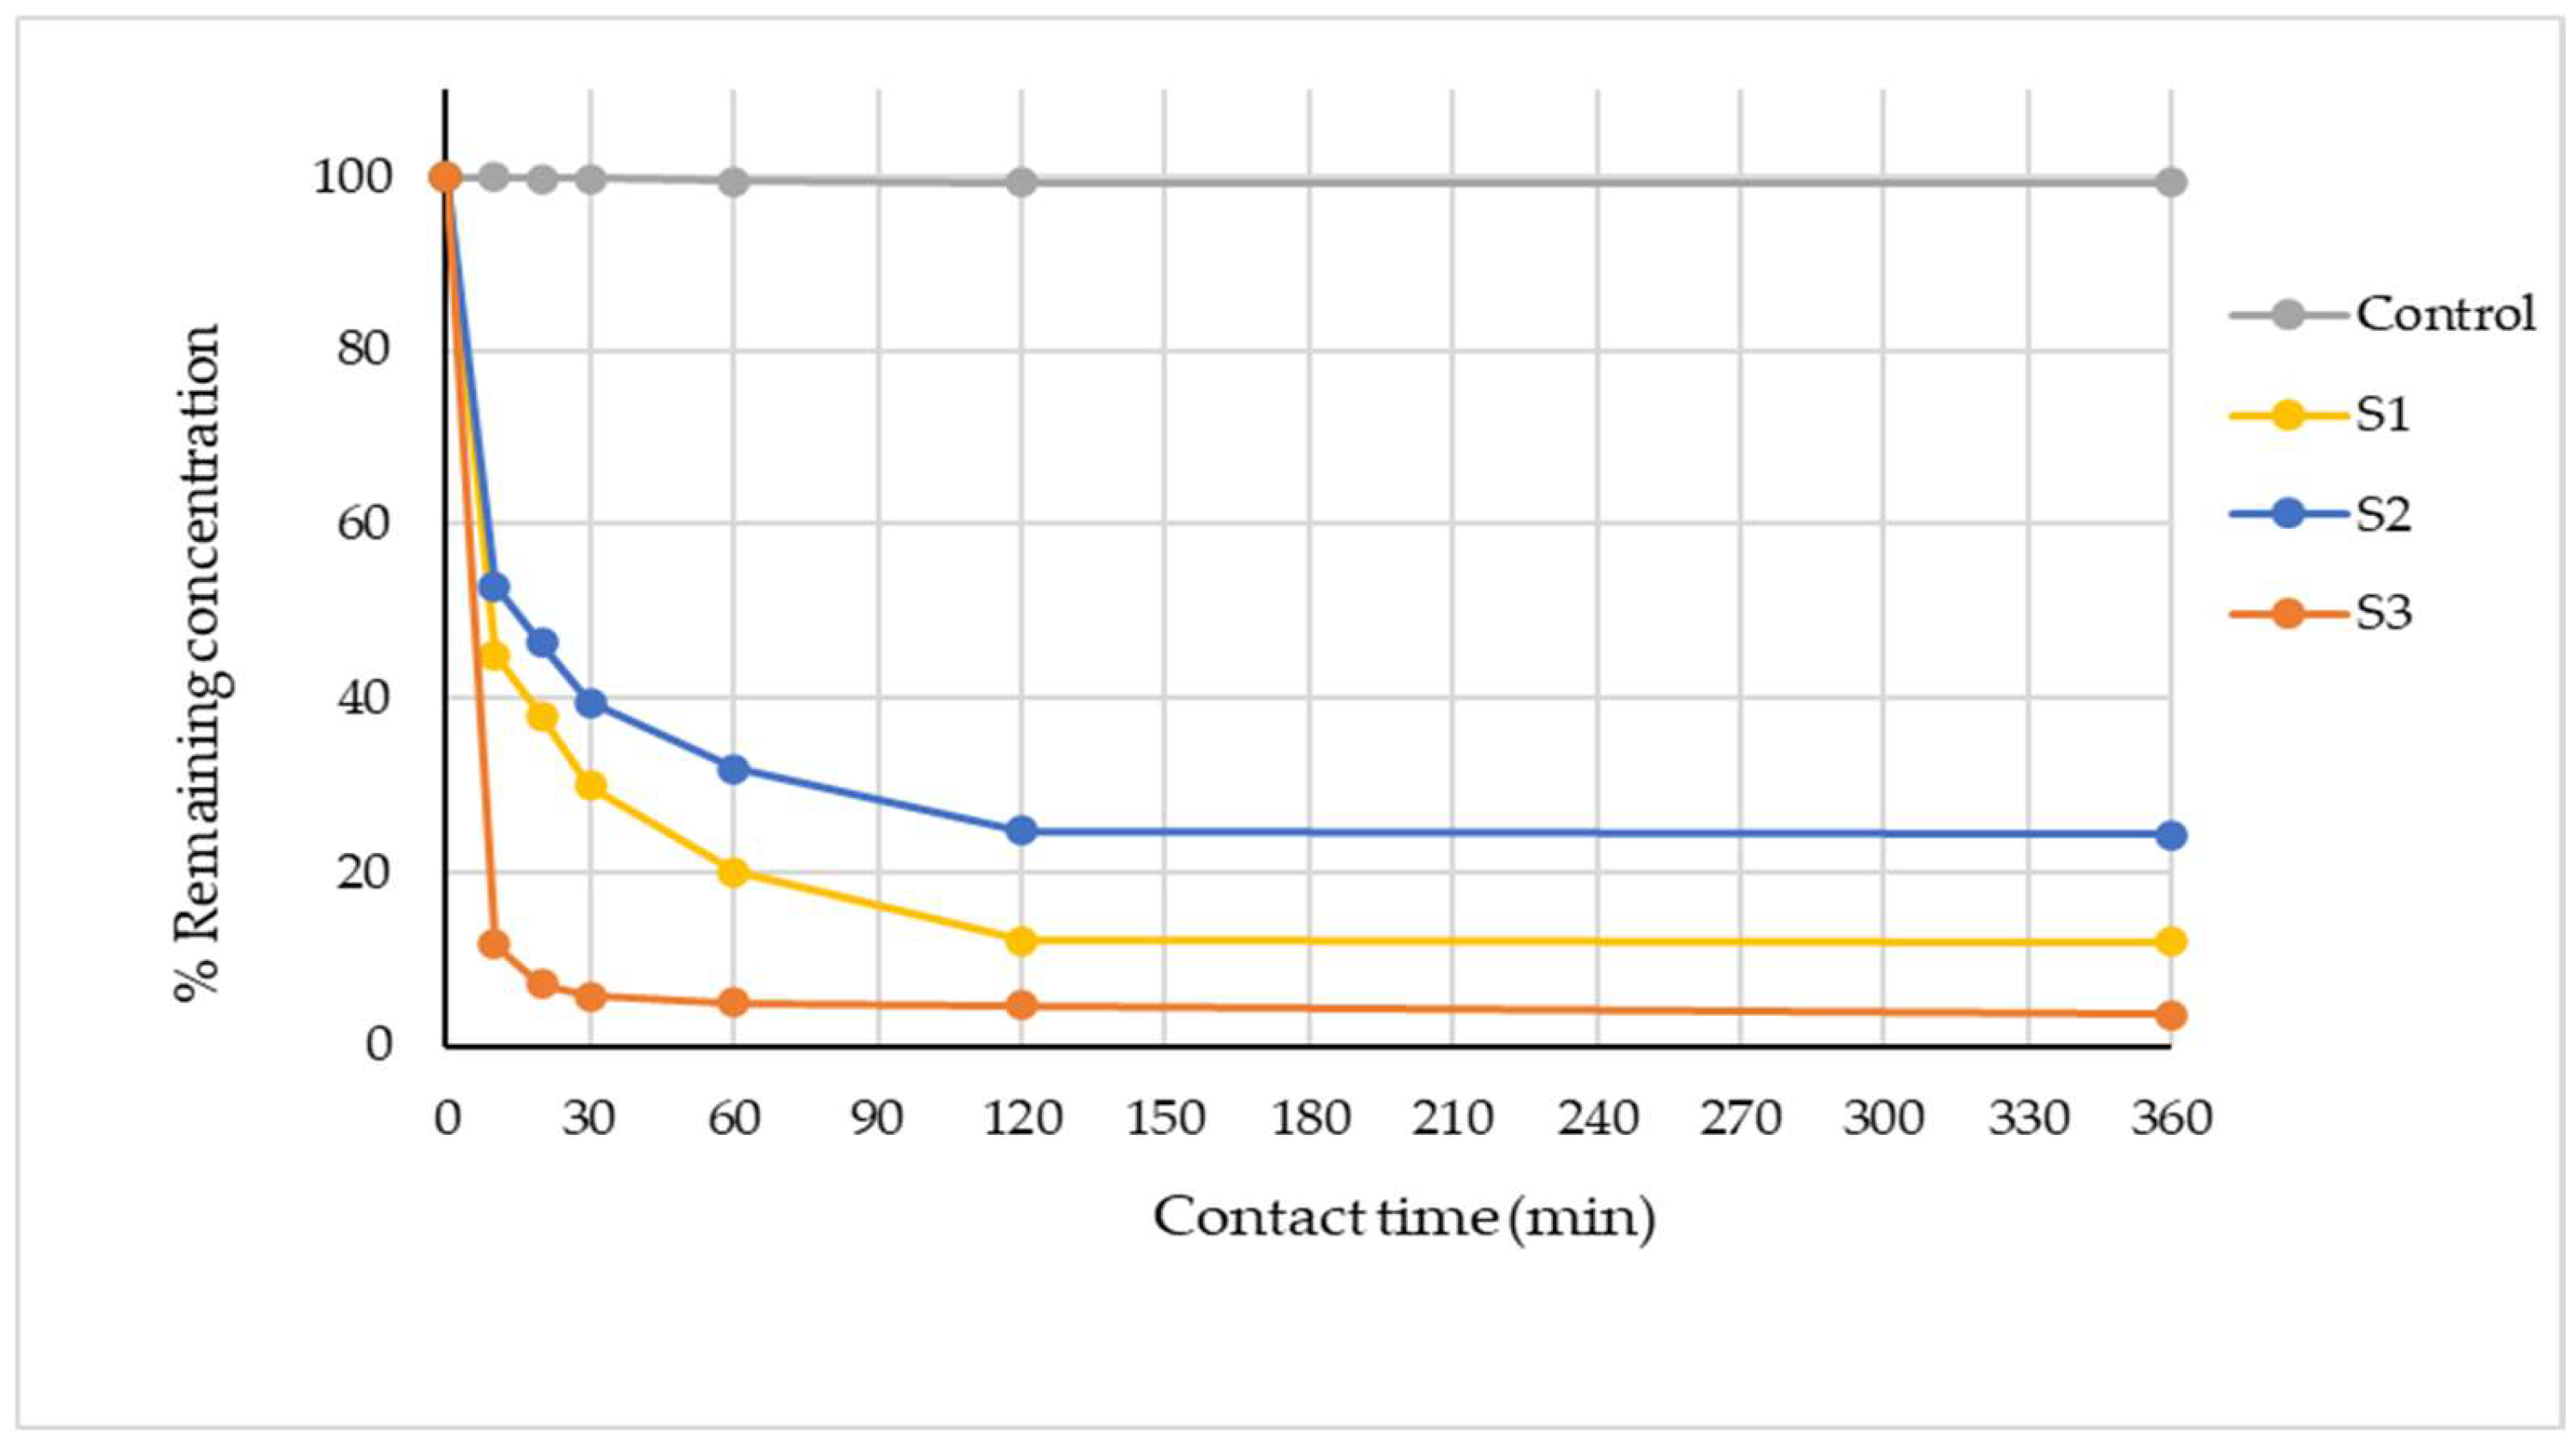
Figure 3.
Adsorption isotherms of MB dye on three studied marine sediments (Experimental conditions: Dye’s initial concentration = Ci = 5 to 100 mg/L; Volume of MB seawater solution =50mL; Dose of adsorbent = 2 g L-1; Contact time= 2h; pH=8.00; θ=20°C±1°C).
Figure 3.
Adsorption isotherms of MB dye on three studied marine sediments (Experimental conditions: Dye’s initial concentration = Ci = 5 to 100 mg/L; Volume of MB seawater solution =50mL; Dose of adsorbent = 2 g L-1; Contact time= 2h; pH=8.00; θ=20°C±1°C).
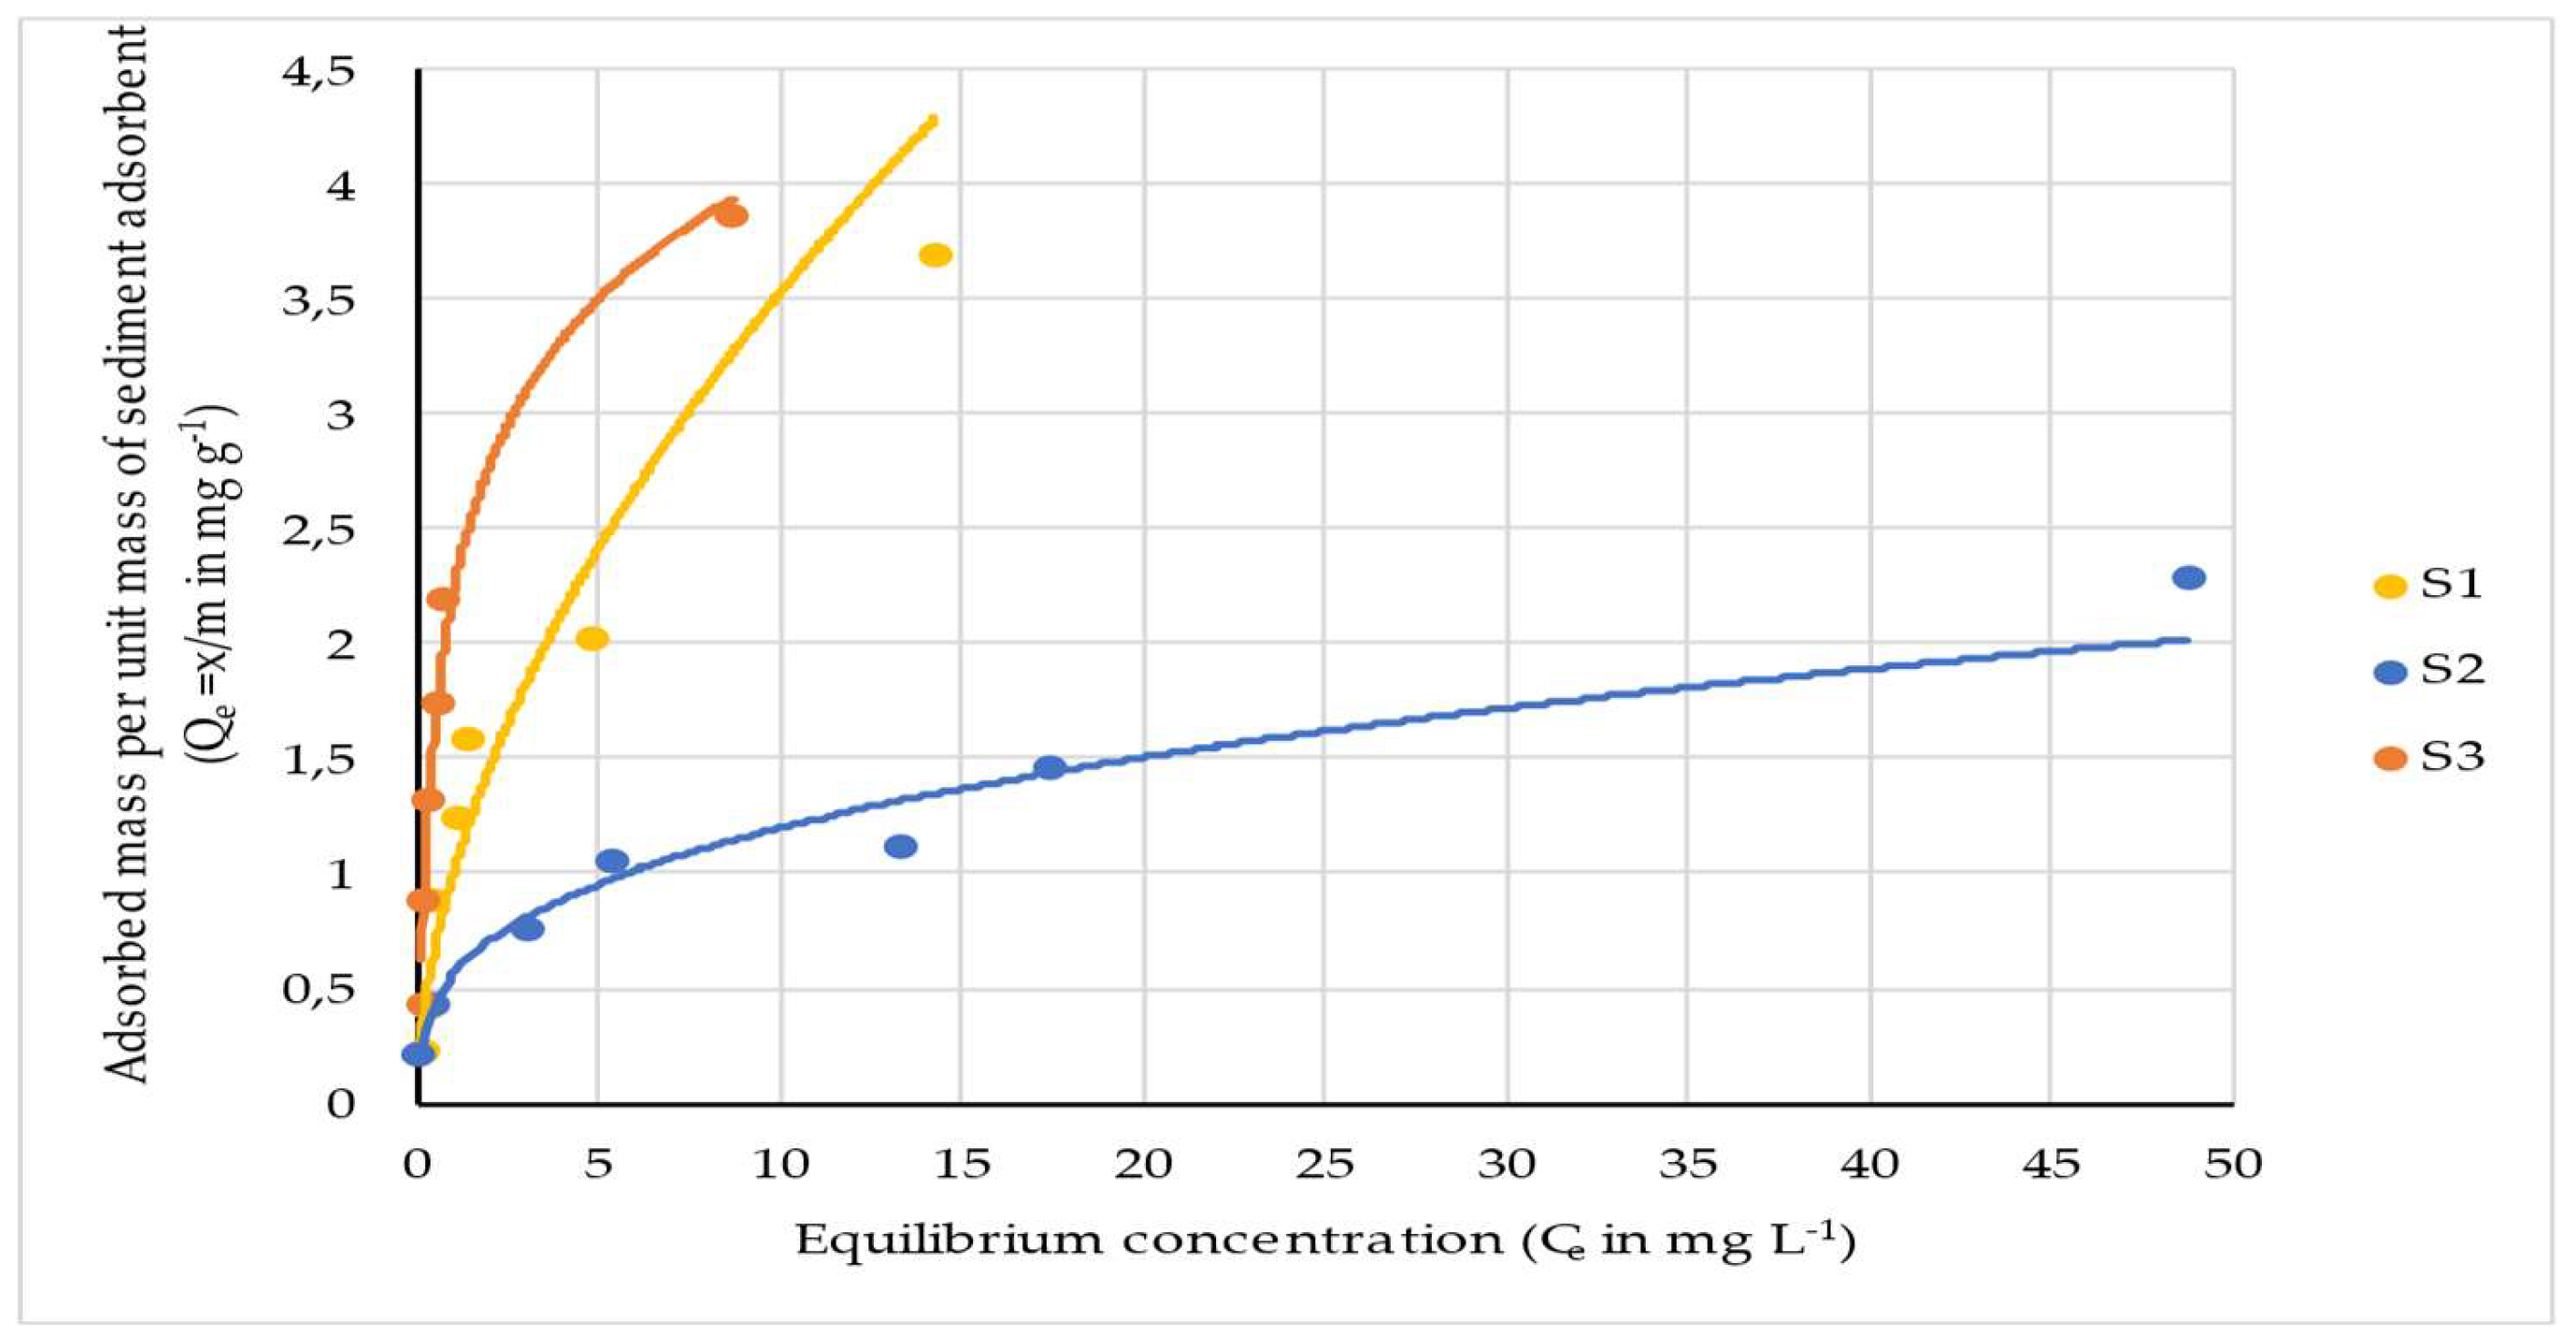
Figure 4.
Affinity of the three examined marine sediments to the adsorption of the synthetic dye MB, (a) ln(x/m)=f[ln(Ce/Cs)] and (b) (x/m)=f[ln(Ce/Cs)].
Figure 4.
Affinity of the three examined marine sediments to the adsorption of the synthetic dye MB, (a) ln(x/m)=f[ln(Ce/Cs)] and (b) (x/m)=f[ln(Ce/Cs)].
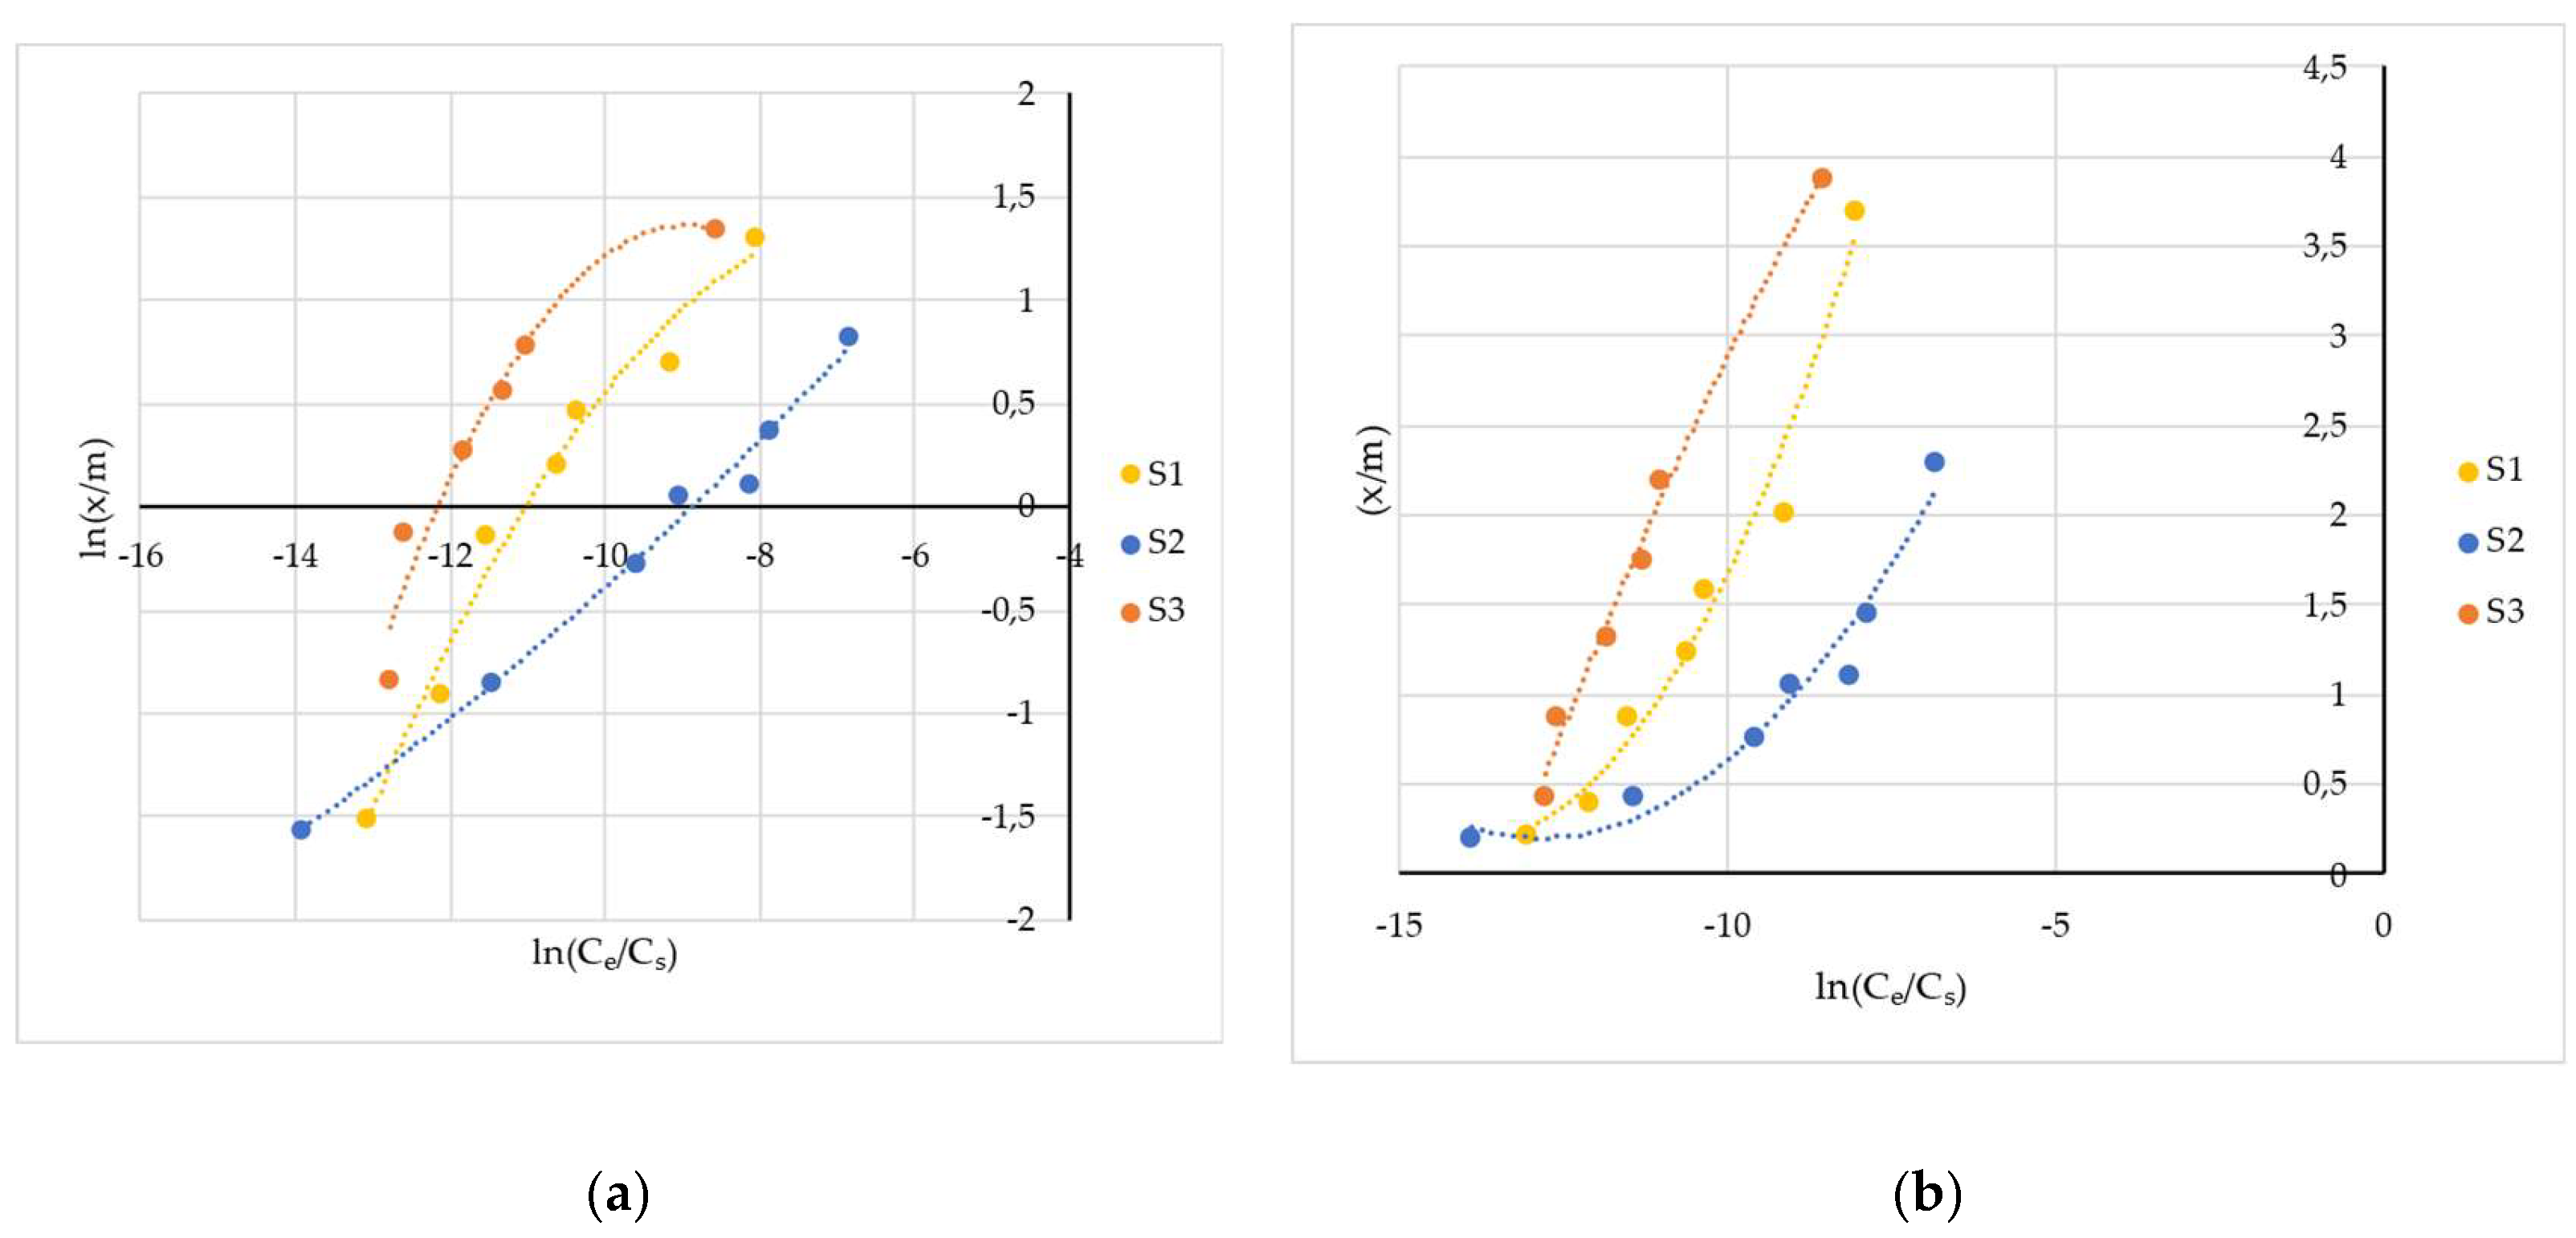
Figure 5.
Rate of sorption of MB onto seagrass biomass of P. oceanica (Experimental conditions: Dye’s initial concentration = Ci = 40 mg L-1; Volume of MB seawater solution =50mL; Dose of adsorbent = 2 g L-1; Rotational stirring speed= 150 rpm; pH=5.45; θ=20°C±1°C).
Figure 5.
Rate of sorption of MB onto seagrass biomass of P. oceanica (Experimental conditions: Dye’s initial concentration = Ci = 40 mg L-1; Volume of MB seawater solution =50mL; Dose of adsorbent = 2 g L-1; Rotational stirring speed= 150 rpm; pH=5.45; θ=20°C±1°C).
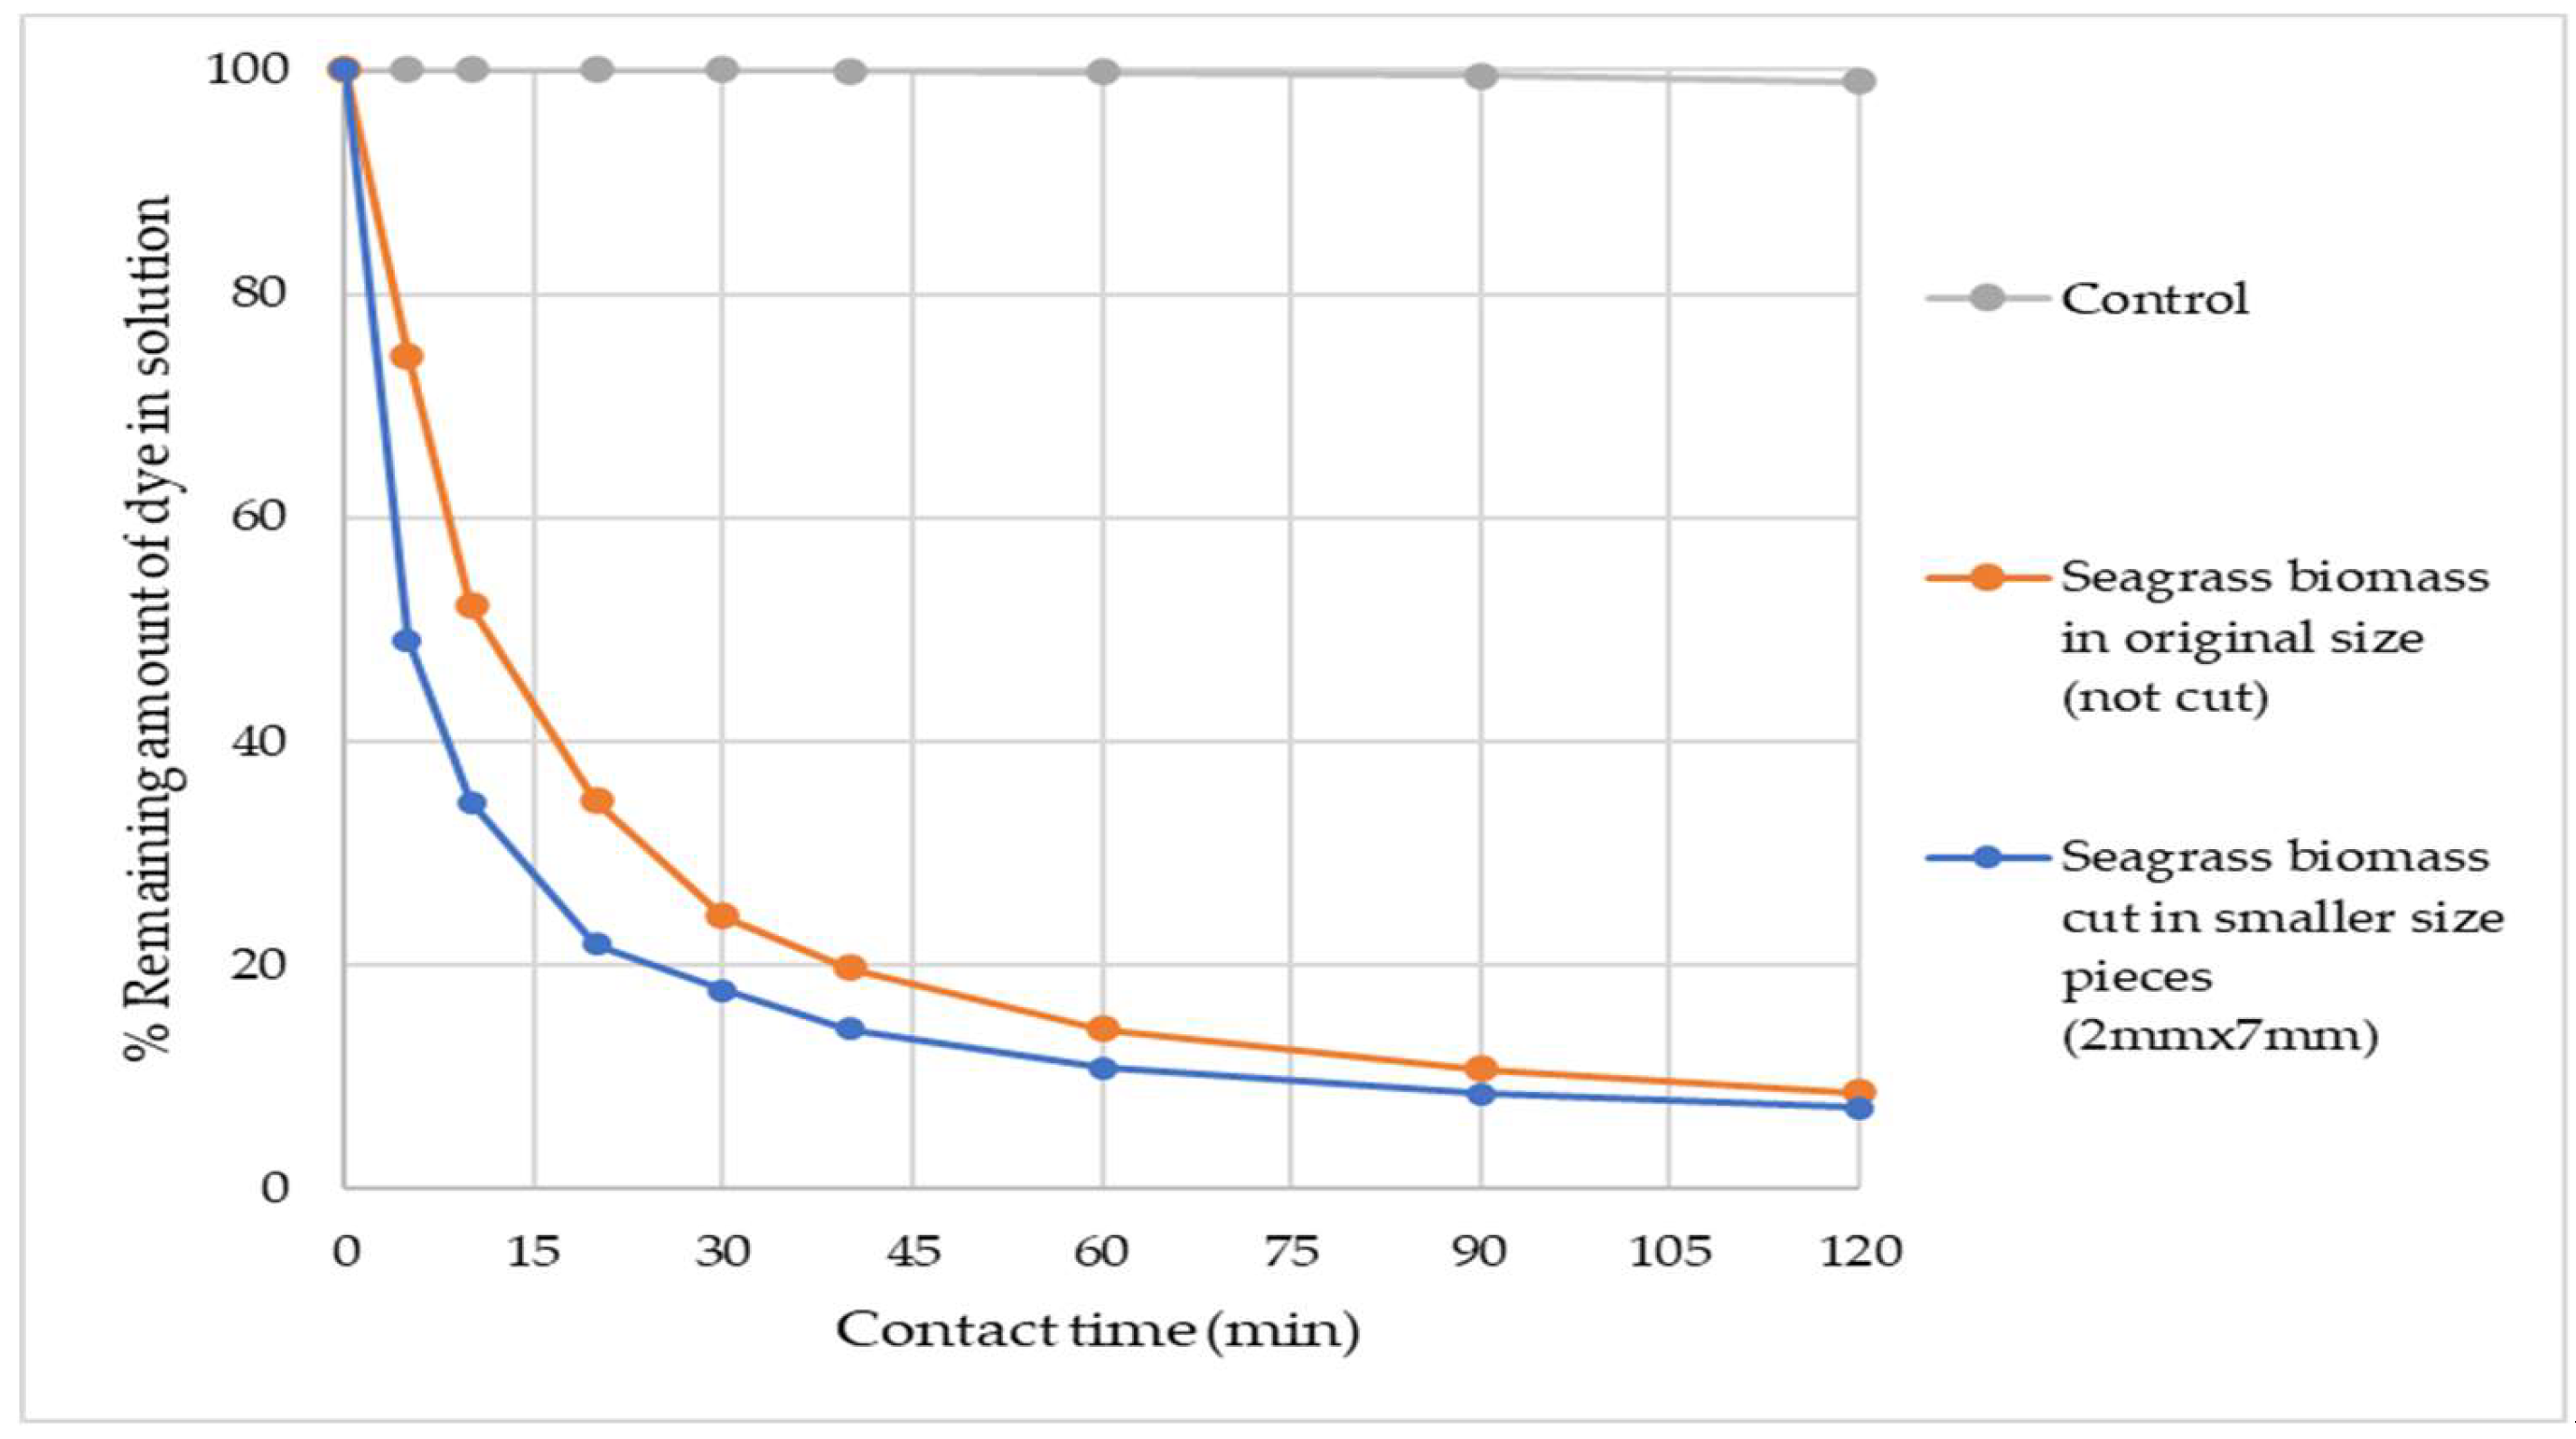
Figure 6.
Effect of the amount of P. oceanica biomass on the adsorption of the MB dye (Experimental conditions: Dye’s initial concentration = Ci = 20 mg L-1; Volume of MB seawater solution =50mL; Contact time=60 min; Rotational stirring speed= 150 rpm; pH=5.45; θ=20°C±1°C).
Figure 6.
Effect of the amount of P. oceanica biomass on the adsorption of the MB dye (Experimental conditions: Dye’s initial concentration = Ci = 20 mg L-1; Volume of MB seawater solution =50mL; Contact time=60 min; Rotational stirring speed= 150 rpm; pH=5.45; θ=20°C±1°C).
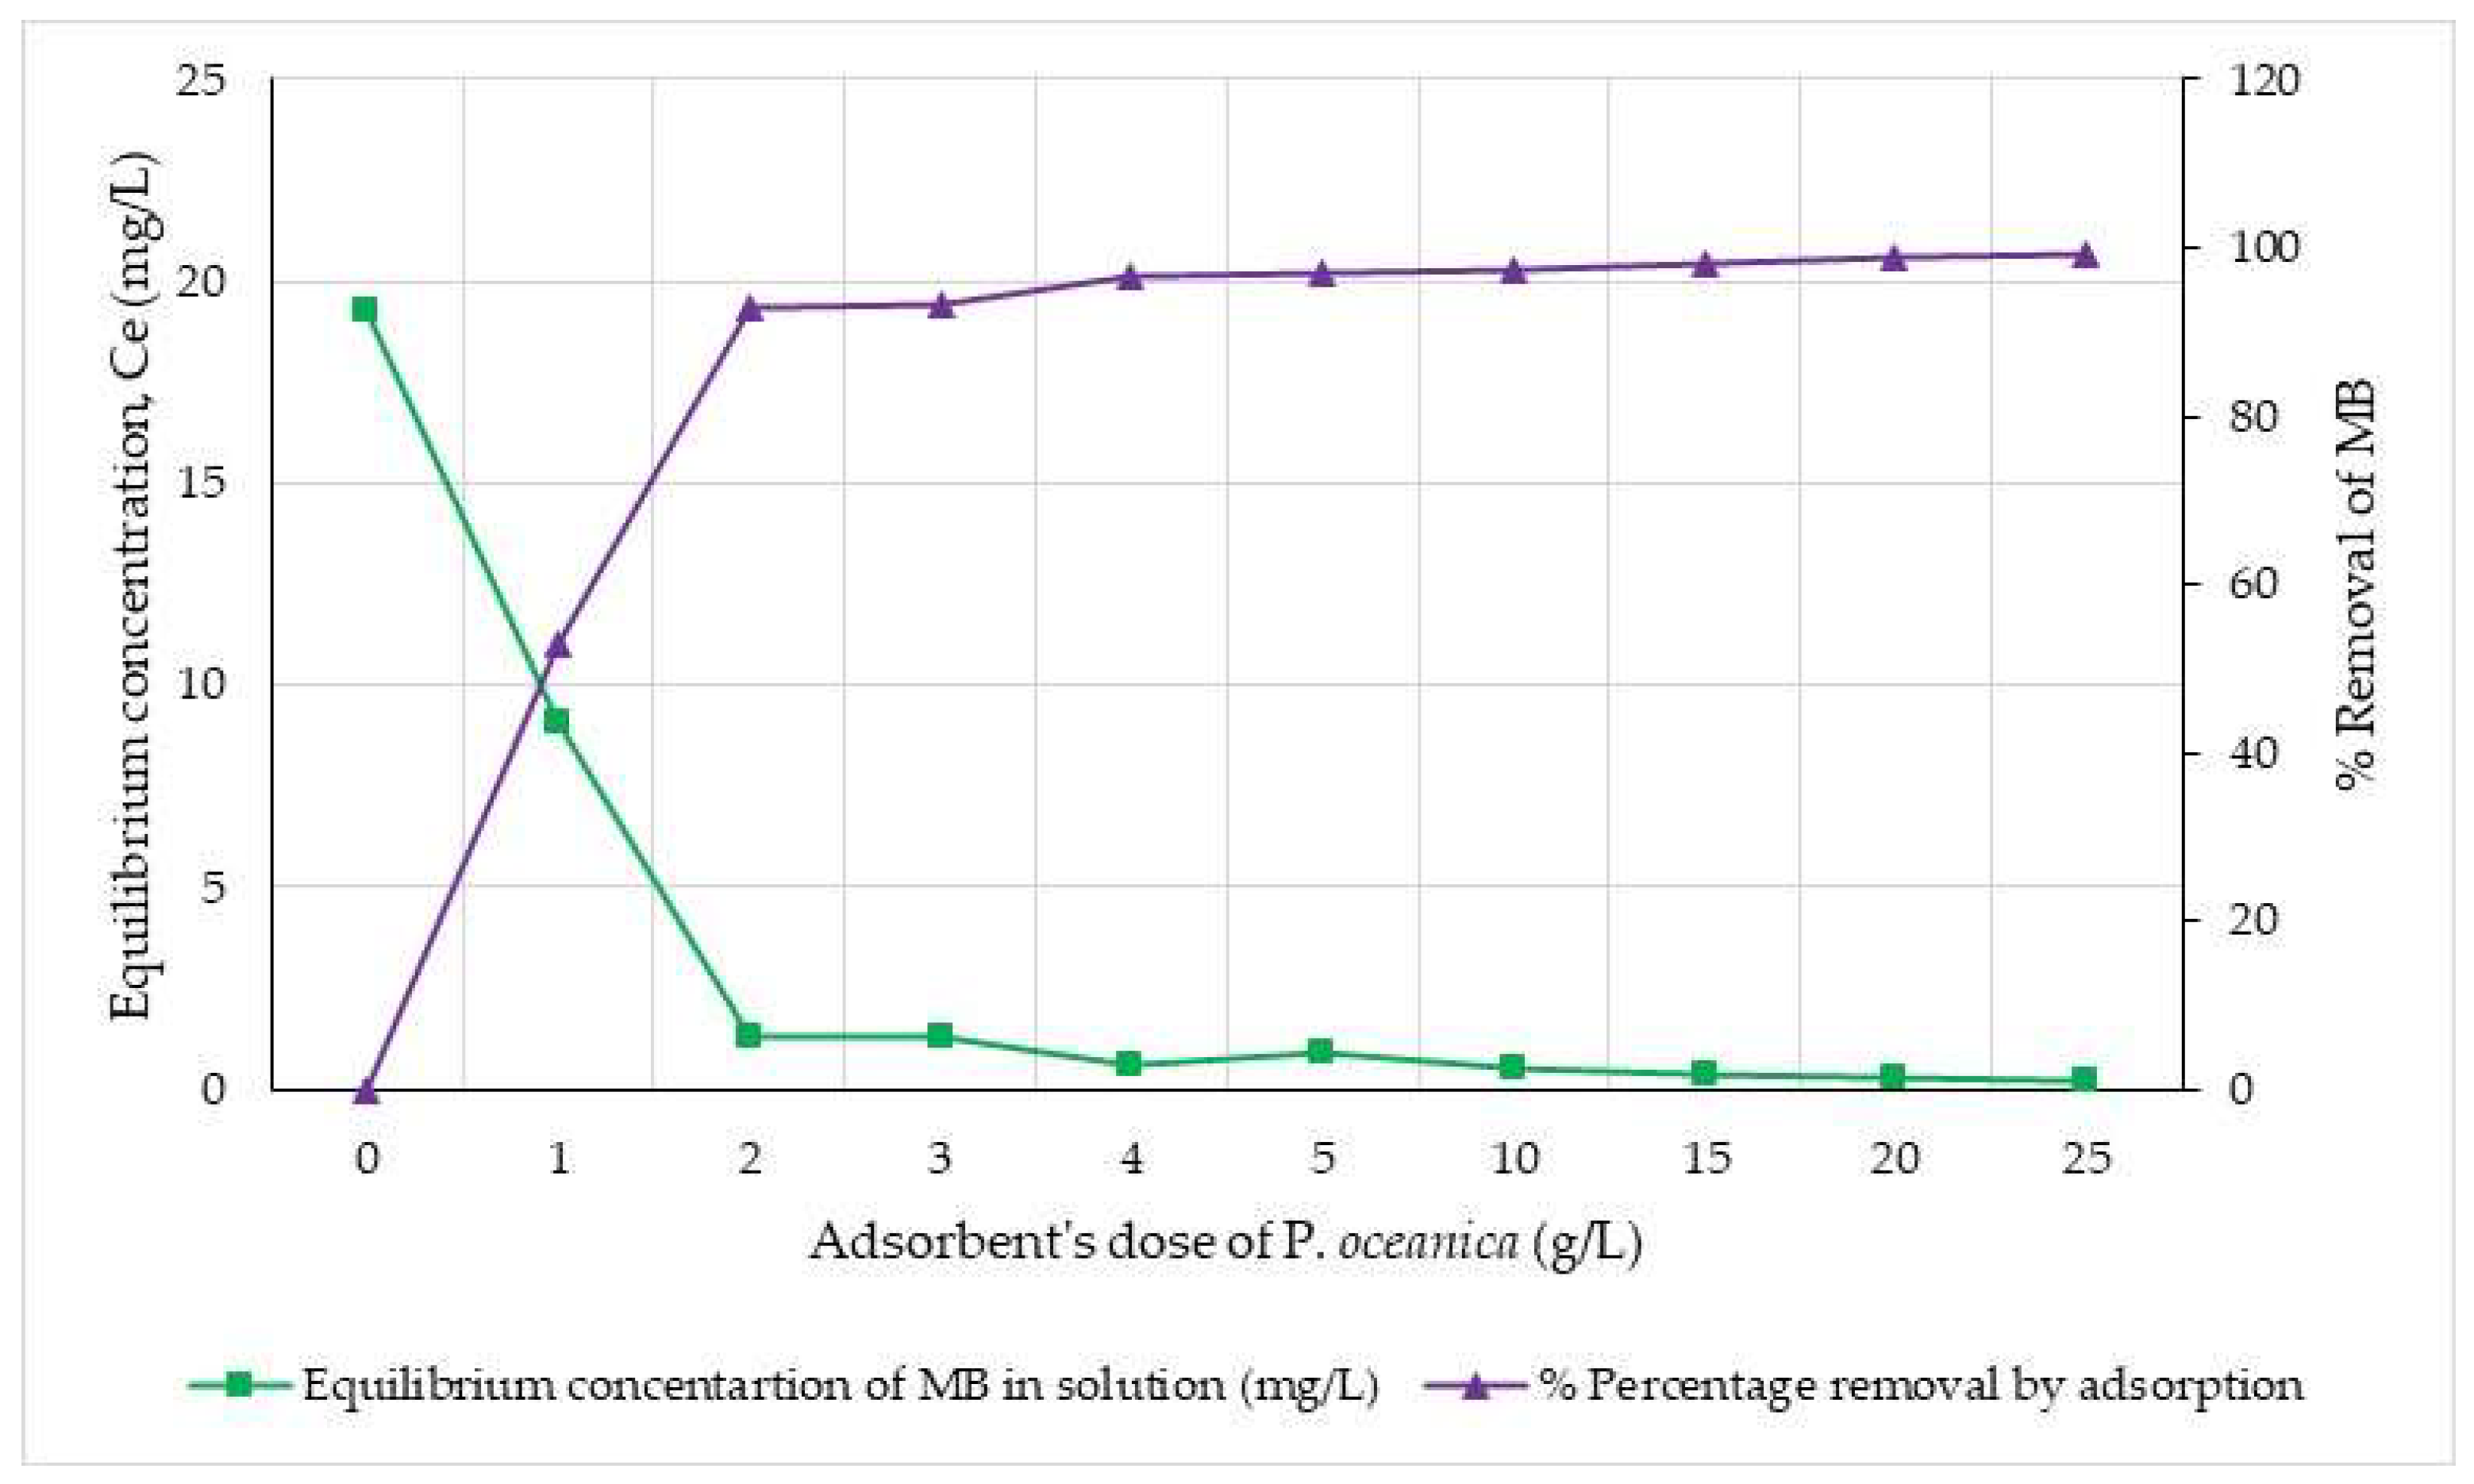
Figure 7.
Effect of rotational stirring speed on the extent of MB dye adsorption on P. oceanica (Experimental conditions: Dye’s initial concentration = Ci = 30 mg/L; Volume of MB seawater solution =50mL; Dose of adsorbent = 2 g L-1; Contact time= 60min; pH=5.45; θ=20°C±1°C). Mean values of three replicates (N=3) and standard deviations.
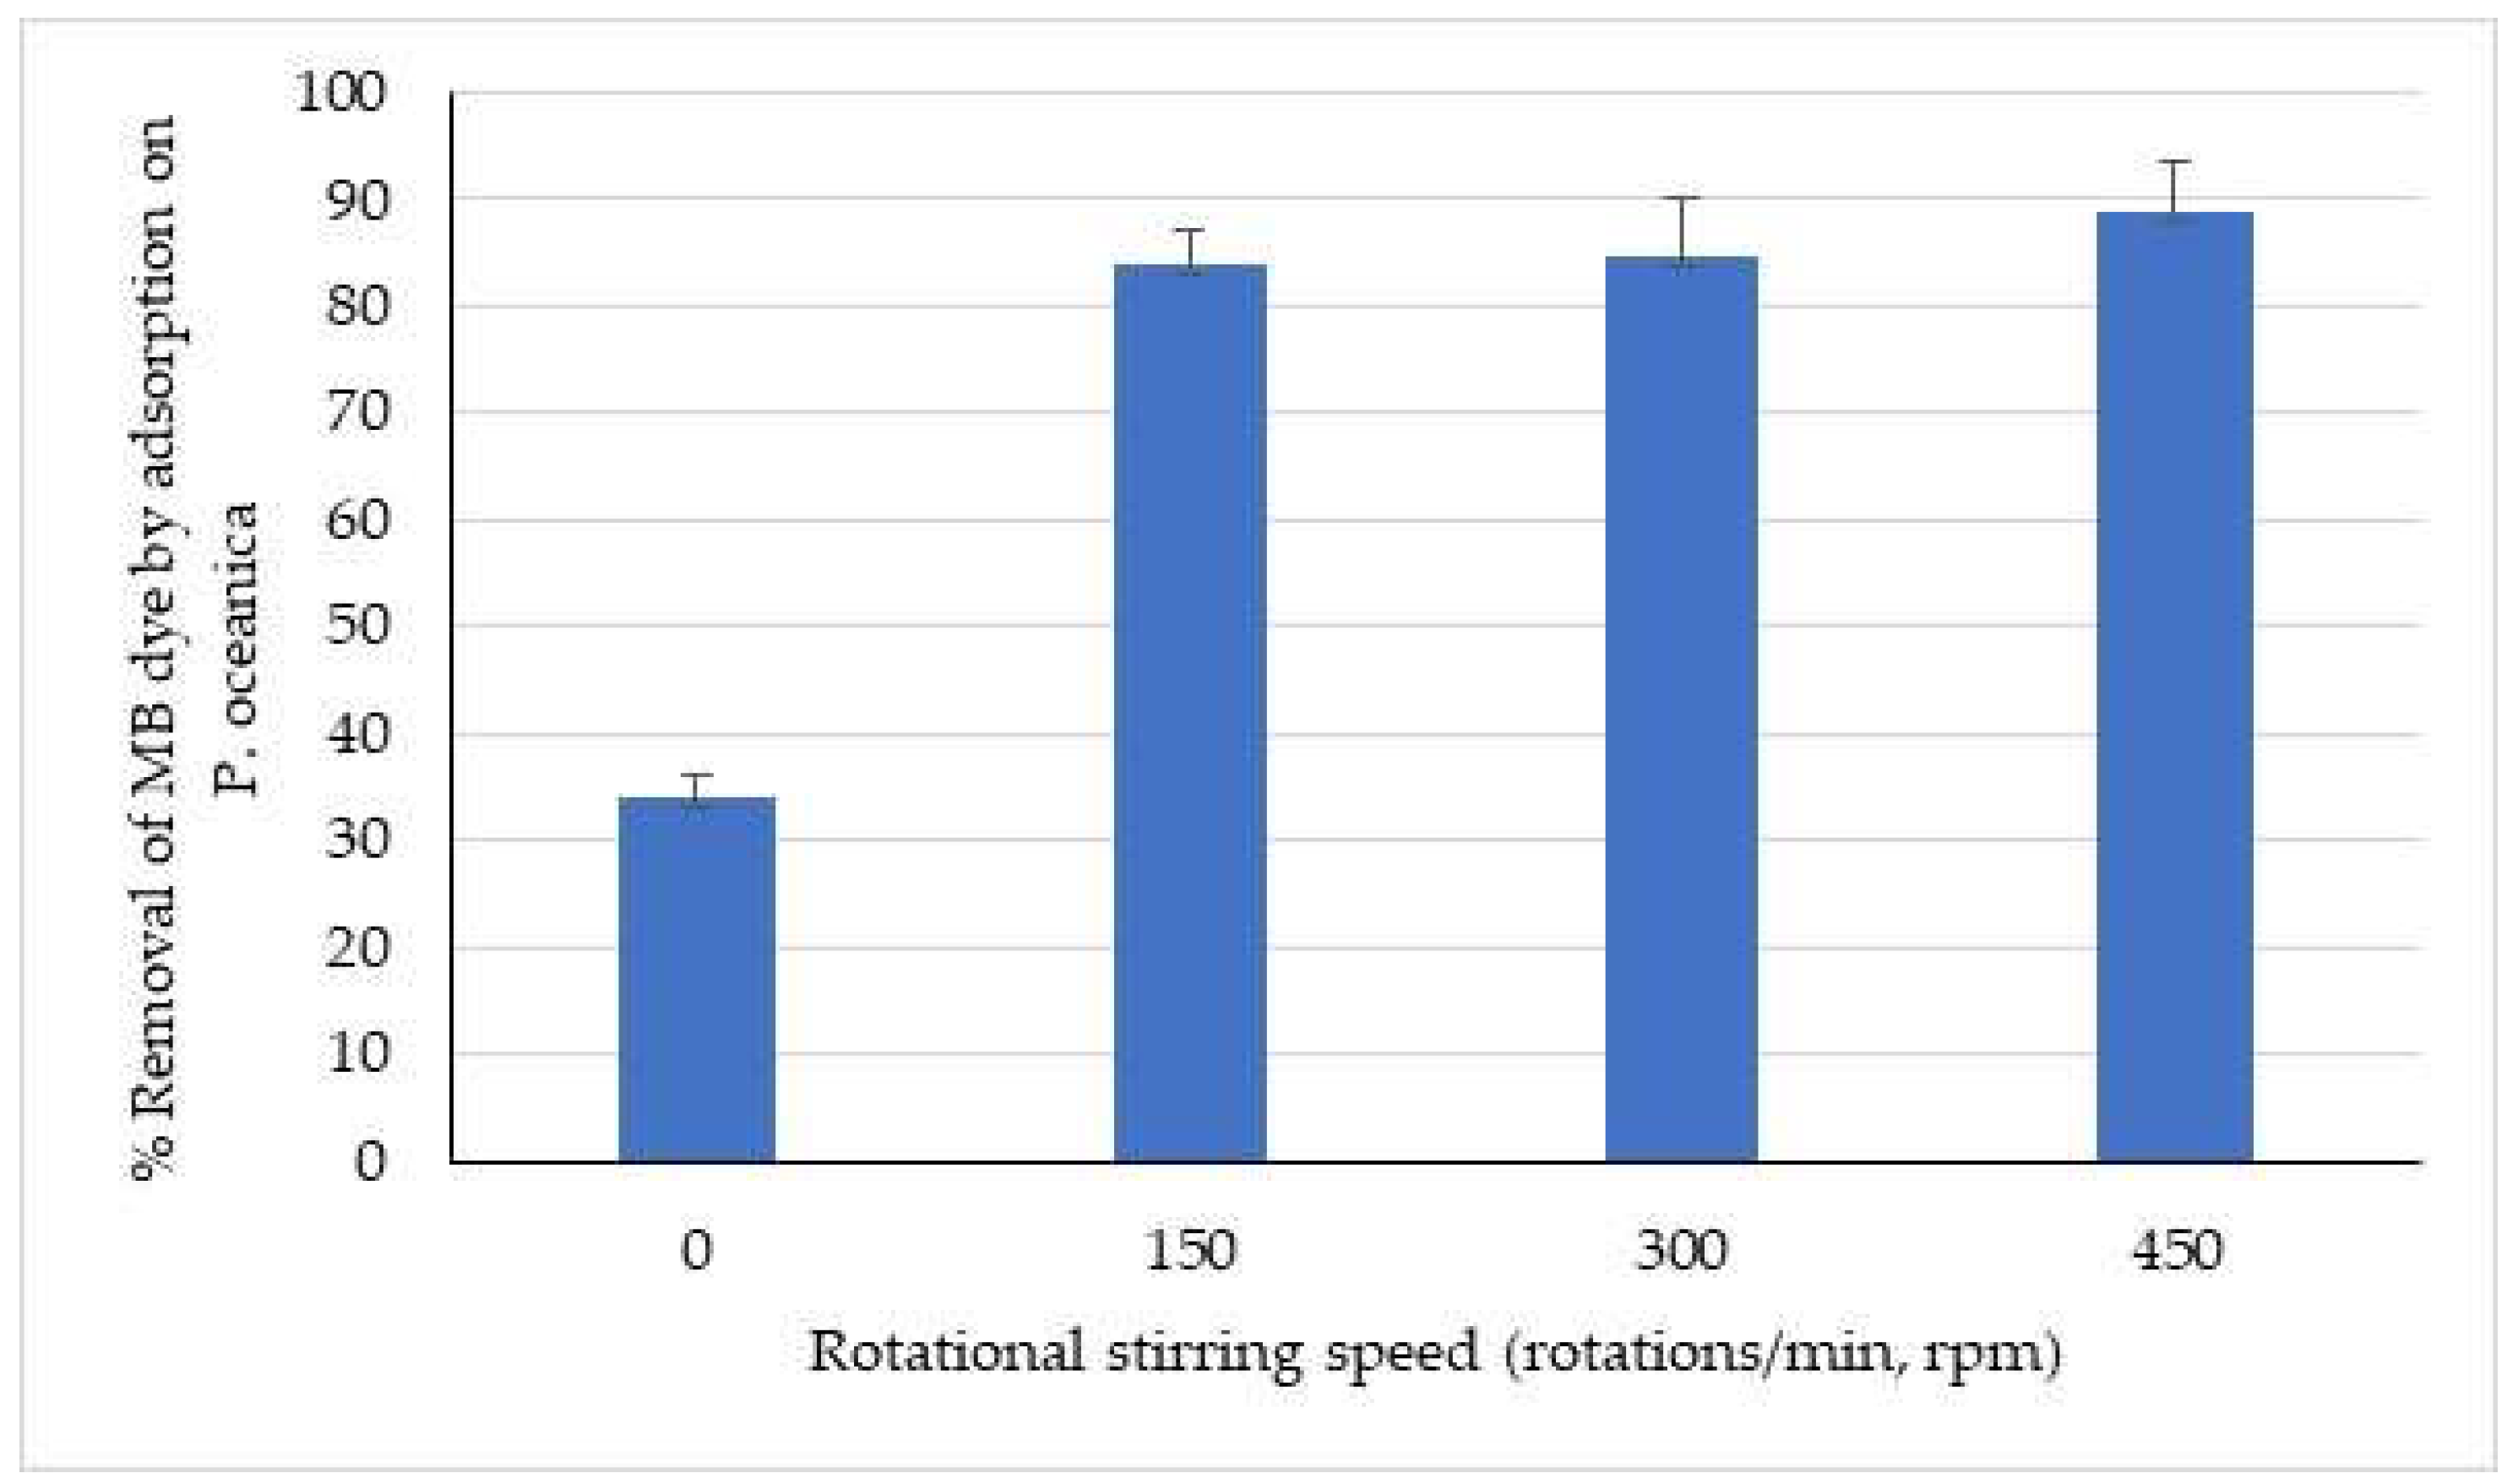
Figure 8.
Effect of pH value on the extent of MB dye adsorption on P. oceanica (Experimental conditions: Dye’s initial concentration = Ci = 30 mg/L; Volume of MB seawater solution =50mL; Dose of adsorbent = 2 g L-1; Contact time= 60min; θ=20°C±1°C).
Figure 8.
Effect of pH value on the extent of MB dye adsorption on P. oceanica (Experimental conditions: Dye’s initial concentration = Ci = 30 mg/L; Volume of MB seawater solution =50mL; Dose of adsorbent = 2 g L-1; Contact time= 60min; θ=20°C±1°C).
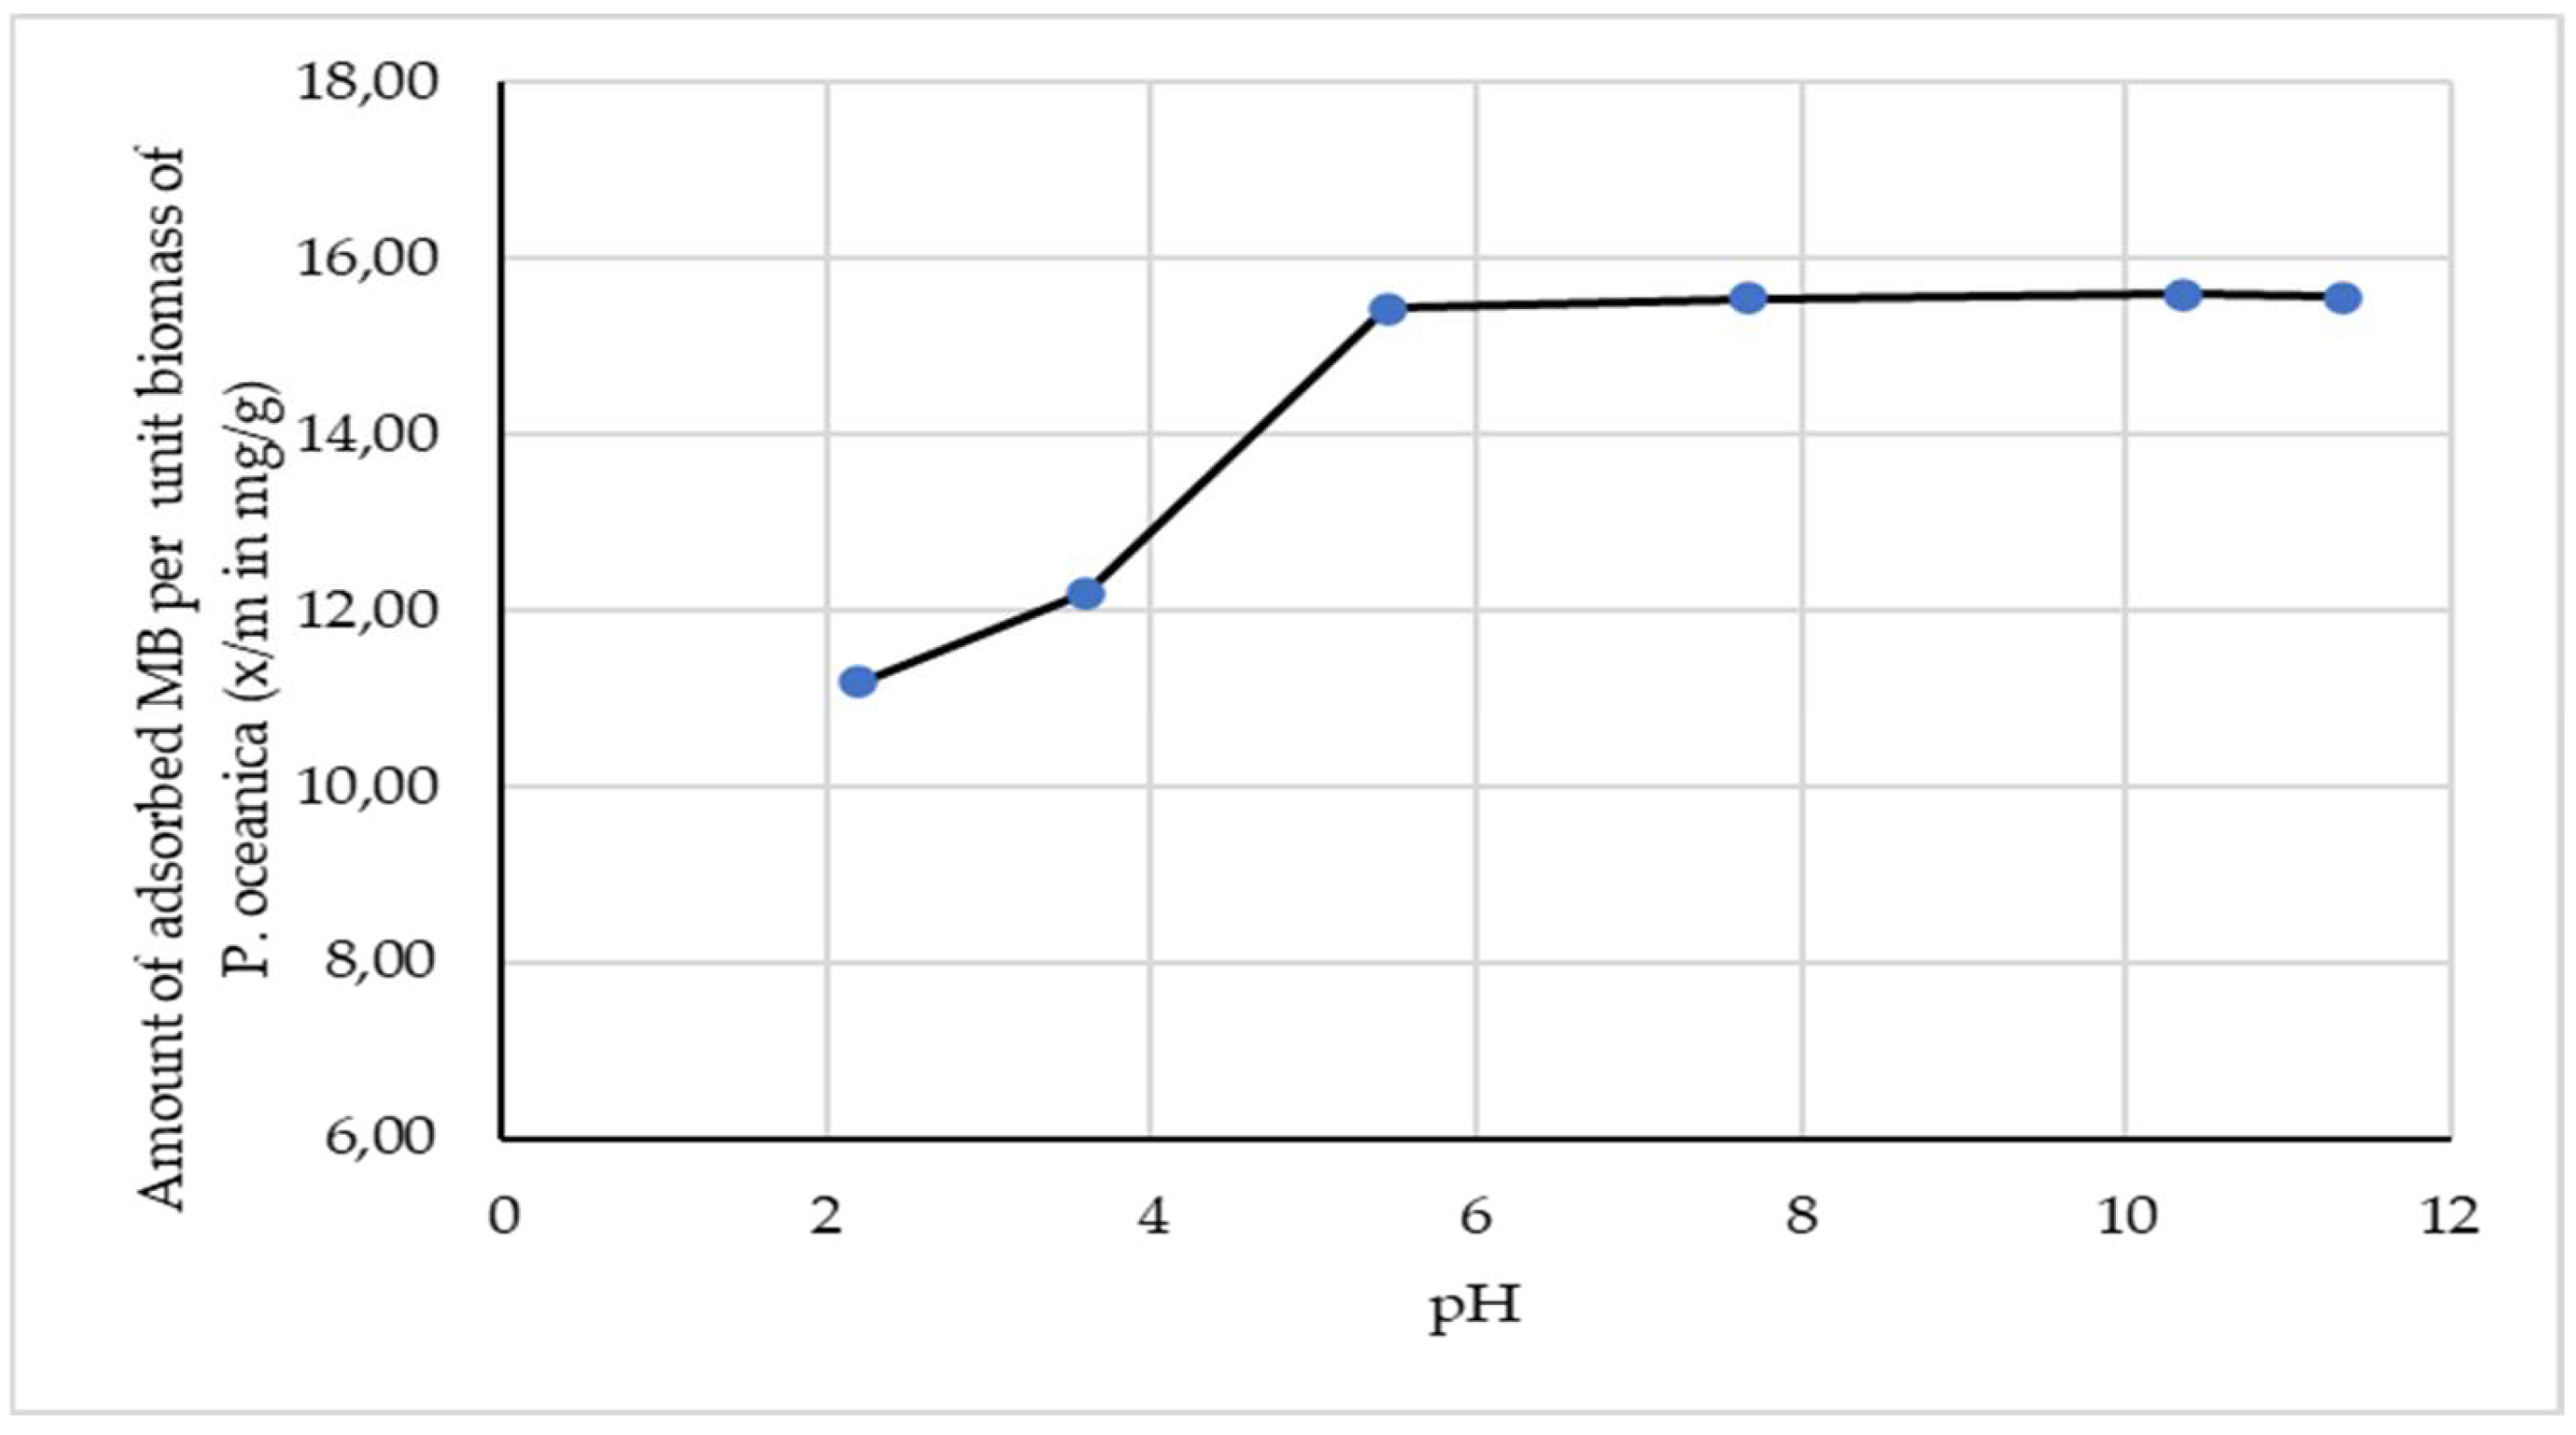
Figure 9.
Adsorption isotherms of MB dye on (a) Seagrass biomass of P. oceanica in original size (not cut), and (b) Seagrass biomass of P. oceanica cut into smaller size pieces (2mm width x 7mm length), (Experimental conditions: Dye’s initial concentration = Ci = 10 to 50 mg/L; Volume of MB seawater solution =50mL; Dose of adsorbent = 2 g L-1; Contact time= 60min; pH=5.45; θ=20°C±1°C).

Table 2.
Characteristics of the studied sediments.
| Sediment sample | Textural analysis (%) | Organic matter content (%)1 | |
|---|---|---|---|
| 63-2000 μm | <63μm | ||
| S1 | 98.32 | 1.68 | 2.94 |
| S2 | 93.76 | 6.24 | 1.70 |
| S3 | 65.46 | 34.54 | 5.38 |
1 Determined by Walkley & Black chromic acid wet oxidation method.
Table 3.
Effect of adsorbate’s initial concentration on the extent of dye’s removal by adsorption on marine sediments (Experimental conditions: Dye’s initial concentration = Ci = 5 to 100 mg/L; Volume of MB seawater solution =50mL; Dose of adsorbent =2 g L-1; Contact time= 2h; pH=8.00; θ=20°C±1°C).
Table 3.
Effect of adsorbate’s initial concentration on the extent of dye’s removal by adsorption on marine sediments (Experimental conditions: Dye’s initial concentration = Ci = 5 to 100 mg/L; Volume of MB seawater solution =50mL; Dose of adsorbent =2 g L-1; Contact time= 2h; pH=8.00; θ=20°C±1°C).
| S1 | S2 | S3 | ||||||
|---|---|---|---|---|---|---|---|---|
| Co (mg L-1) |
Ce (mg L-1) |
q (mg g-1) |
Co (mg L-1) |
Ce (mg L-1) |
q (mg g-1) |
Co (mg L-1) |
Ce (mg L-1) |
q (mg g-1) |
| 5 | 0,10 | 0,22 | 5 | 0,04 | 0,21 | 10 | 0,13 | 0,44 |
| 10 | 0,25 | 0,41 | 10 | 0,49 | 0,43 | 20 | 0,15 | 0,88 |
| 20 | 0,45 | 0,88 | 20 | 3,07 | 0,76 | 30 | 0,33 | 1,32 |
| 30 | 1,11 | 1,24 | 30 | 5,36 | 1,06 | 40 | 0,56 | 1,75 |
| 40 | 1,45 | 1,59 | 40 | 13,37 | 1,11 | 50 | 0,75 | 2,20 |
| 50 | 4,86 | 2,02 | 50 | 17,35 | 1,46 | 100 | 8,66 | 3,87 |
| 100 | 14,25 | 3,70 | 100 | 48,76 | 2,29 | |||
Table 4.
Isotherm modelling parameters related to the adsorption of MB onto marine sediments.
| Freundlich Isotherm Model | |||
| Parameter (units) |
S1 sediment sample |
S2 sediment sample |
S3 sediment sample |
| KF (L mg−1) | 1.0049 | 0.5623 | 1.8576 |
| n | 1.8315 | 3.0414 | 2.2267 |
| R2 | 0.9659 | 0.9644 | 0.9004 |
| Langmuir Isotherm Model | |||
| Parameter (units) |
S1 sediment sample |
S2 sediment sample |
S3 sediment sample |
|
qmax (mg g-1) |
2.5907 | 0.9827 | 6.7981 |
| KL (L mg-1) | 6.2246 | 6.1419 | 30.6359 |
| R2 | 0.9829 | 0.8884 | 0.8487 |
| HenryIsotherm Model | |||
| Parameter (units) |
S1 sediment sample |
S2 sediment sample |
S3 sediment sample |
| KH (L g-1) | 0.2897 | 0.0553 | 0.4837 |
| R2 | 0.8474 | 0.8399 | 0.6949 |
Table 5.
Normalized to organic matter content sorption coefficients (KOM) and free energy change ΔG values1.
Table 5.
Normalized to organic matter content sorption coefficients (KOM) and free energy change ΔG values1.
| Sediment sample | KOM |
ΔG | |
|---|---|---|---|
| (cal mol-1) | (J mol-1) | ||
| S1 | 34,1803 | -2.062,07 | -8.627,70 |
| S2 | 33,0765 | -2.042,91 | -8.547,53 |
| S3 | 34,5279 | -2.067,98 | -8.652,42 |
1 Based on data obtained through Freundlich adsorption isotherm model.
Table 6.
Average values of percentage balances for the adsorbed, desorbed and free amount of the selected synthetic dye in the marine sediments of the study (Experimental conditions: Sediment mass (adsorbent): 1.0000±0.0002 g; Volume of MB seawater solution =45 mL; Rotational stirring speed: 150 rotation min-1; pH=8.00; θ=20°C±1°C).
| Sediment Sample | Loading Level (mg g-1) |
(%) Adsorbed | (%) Free or not adsorbed | (%) Desorbed1 |
|---|---|---|---|---|
| S1 | 0.225 | 98.06 | 1.94 | 0.09 (0.09) |
| 0.45 | 97.49 | 2.51 | 0.21 (0.22) | |
| 0.9 | 97.75 | 2.25 | 0.22 (0.22) | |
| 1.35 | 96.28 | 3.72 | 0.54 (0.56) | |
| 1.8 | 96.38 | 3.62 | 0.48 (0.50) | |
| 2.25 | 90.28 | 9.72 | 1.02 (1.13) | |
| 4.5 | 85.75 | 14.25 | 1.62 (1.89) | |
| S2 | 0.225 | 99.17 | 0.83 | 0.09 (0.09) |
| 0.45 | 95.15 | 4.85 | 0.14 (0.14) | |
| 0.9 | 84.65 | 15.35 | 0.11 (0.13) | |
| 1.35 | 82.13 | 17.87 | 0.23 (0.28) | |
| 1.8 | 66.58 | 33.42 | 0.16 (0.25) | |
| 2.25 | 65.30 | 34.70 | 0.21 (0.32) | |
| 4.5 | 51.24 | 48.76 | 0.38 (0.73) | |
| S3 | 0.225 | 99.00 | 1.00 | 0.00 (0.00) |
| 0.45 | 98.72 | 1.28 | 0.01 (0.01) | |
| 0.9 | 99.24 | 0.76 | 0.09 (0.09) | |
| 1.35 | 98.91 | 1.09 | 0.15 (0.15) | |
| 1.8 | 98.61 | 1.39 | 0.17 (0.17) | |
| 2.25 | 98.51 | 1.49 | 0.19 (0.19) | |
| 4.5 | 91.34 | 8.66 | 0.68 (0.74) |
1 Data without brackets have been calculated based on the initial amounts of MB loaded in batch adsorption systems. In contrast, data in brackets have been calculated based on the corresponding adsorbed masses of MB.
Table 7.
Effect of adsorbate’s initial concentration on the extent of dye’s removal by adsorption onto biomass of P. oceanica (Experimental conditions: Dye’s initial concentration = Ci = 10 to 50 mg/L; Volume of MB seawater solution =50mL; Dose of adsorbent = 2 g L-1; Contact time= 60min; pH=5.45; θ=20°C±1°C).
| Seagrass biomass of P. oceanica in original size (not cut) | Seagrass biomass of P. oceanica cut into smaller size pieces (2mm width x 7mm length) | ||||||
|---|---|---|---|---|---|---|---|
| Co (mg L-1) |
Ce (mg L-1) |
% Removal |
Qe (mg g-1) |
Co (mg L-1) |
Ce (mg L-1) |
% Removal |
Qe (mg g-1) |
| 10 | 0,58 | 94,21 | 4,61 | 10 | 0,42 | 95,85 | 4,70 |
| 20 | 1,92 | 90,39 | 9,13 | 20 | 1,85 | 90,76 | 9,21 |
| 30 | 2,45 | 91,50 | 13,89 | 30 | 2,13 | 92,90 | 13,55 |
| 40 | 3,33 | 91,68 | 19,84 | 40 | 2,59 | 93,52 | 20,29 |
| 50 | 3,22 | 93,56 | 22,71 | 50 | 5,10 | 89,80 | 21,77 |
Table 8.
Isotherm modelling parameters related to the biosorption of MB onto P. oceanica biomass.
| Freundlich Isotherm Model | ||
| Parameter (units) | Seagrass biomass of P. oceanica in original size (not cut) | Seagrass biomass of P. oceanica cut into smaller size pieces (2mm width x 7mm length) |
| KF (L mg-1) | 0.1357 | 0.0593 |
| n | 0.9424 | 0.7247 |
| R2 | 0.9194 | 0.7777 |
| Langmuir Isotherm Model | ||
| Parameter (units) | Seagrass biomass of P. oceanica in original size (not cut) | Seagrass biomass of P. oceanica cut into smaller size pieces (2mm width x 7mm length) |
|
qmax (mg g-1) |
13.245 | 17.857 |
| KL (L mg-1) | 0.0095 | 0.0008 |
| R2 | 0.9131 | 0.9606 |
| HenryIsotherm Model | ||
| Parameter (units) | Seagrass biomass of P. oceanica in original size (not cut) | Seagrass biomass of P. oceanica cut into smaller size pieces (2mm width x 7mm length) |
| KH (L g-1) | 0.1444 | 0.2073 |
| R2 | 0.9241 | 0.7735 |
Table 9.
Selected bibliographic references regarding maximum adsorption capacity qmax (in mg g-1) of adsorbent materials of different origin for the removal of MB dye.
Table 9.
Selected bibliographic references regarding maximum adsorption capacity qmax (in mg g-1) of adsorbent materials of different origin for the removal of MB dye.
| Adsorbent Material | Maximum adsorption capacity qmax (in mg g-1) |
Reference |
|---|---|---|
| Posidonia oceanica | 13.24-17.86 | Present Study |
| Posidonia oceanica | 5.56 | [32] |
| Enteromorpha spp. | 274 | [28] |
| Spirodela polyrrhiza | 144.93 | [38] |
| Ulva lactuca | 40.2 | [39] |
| Cystoseira barbatula | 38.61 | [40] |
| Sargassum muticum | 191.38 | [41] |
| Bifurcaria bifurcata | 2,744.5 | [42] |
| Fucus vesiculosus | 698.477 | [43] |
| Chlorella pyrenoidosa | 20.8-21.3 | [44] |
| Phaeodactylum tricornutum | 18.5-18.9 | [45] |
| Caulerpa lentillifera | 417 | [46] |
| Sargassum muticum | 279.2 | [47] |
| Algae Gelidium | 171 | [48] |
| Algal waste | 104 | [48] |
| Composite material with polyacrylonitrile | 74 | [48] |
| Marine sediment (collected from unpolluted coastal areas of Chios, North Aegean, Greece) | 0.9827 | Present Study |
| Marine sediment (collected from unpolluted coastal areas of Mytilene, Lesvos, North Aegean, Greece) | 2.5907 | Present Study |
| Marine sediment (collected from a marine aquaculture industry, Selonda, Gera’s Golf, Lesvos North Aegean, Greece) | 6.7981 | Present Study |
| Sediment obtained from a canal in an industrial park (Ekman dredge, Taipei City, Taiwan) | 56,0 | [20] |
| River sediment (Sebou River, Morocco) | 3,24 | [49] |
| Wine-processing waste sludge | 285.7 | [50] |
Disclaimer/Publisher’s Note: The statements, opinions and data contained in all publications are solely those of the individual author(s) and contributor(s) and not of MDPI and/or the editor(s). MDPI and/or the editor(s) disclaim responsibility for any injury to people or property resulting from any ideas, methods, instructions or products referred to in the content. |
© 2025 by the authors. Licensee MDPI, Basel, Switzerland. This article is an open access article distributed under the terms and conditions of the Creative Commons Attribution (CC BY) license (http://creativecommons.org/licenses/by/4.0/).
Copyright: This open access article is published under a Creative Commons CC BY 4.0 license, which permit the free download, distribution, and reuse, provided that the author and preprint are cited in any reuse.


