
Submitted:
10 March 2025
Posted:
11 March 2025
You are already at the latest version
Abstract
Freshwater scarcity is a growing concern, exacerbated by industrial effluents containing dyes and other pollutants that endanger aquatic ecosystems. This study explores the potential of biochar sorbents, derived from renewable seaweed biomass, as a sustainable and cost-effective solution for water decontamination. Seaweed biomass (Sargaço) collected from Portuguese seashores was carbonized at 300 °C and 400 °C to produce biochar. Adsorption experiments with methylene blue (MB) revealed that carbonization at 400 °C, followed by ball milling, significantly enhanced adsorption performance. Langmuir isotherm analysis demonstrated a maximum adsorption capacity of 500 mg MB/g sorbent for the optimized biochar (400 °C, ball milled), with adsorption efficiency improving at elevated temperatures and pH levels up to 12. ATR-FTIR analysis confirmed the involvement of π–π interactions and hydrogen bonding in the adsorption mechanism. These findings highlight the potential of seaweed-derived biochar as an effective and eco-friendly solution for water purification.
Keywords:
wastewater treatment
; biochar
; seaweed biomass
; biosorbent
; carbonization
1. Introduction
Fresh water is a finite resource (3% of the Earth's water, of which only 0.5% is accessible) that is essential for life. In large-scale industrial applications, water pollutants must be removed before wastewater can be discharged into natural watercourses, as legislation is strict about the amount of pollutants. Wastewater and water treatment is a market with considerable sales volume and great development potential in the next years (Figure 1) Wastewater treatment is seen as critical to environmental protection. There are several methods for removing pollutants from water. Table 1 summarizes the conventional, established, and emerging wastewater treatments, as well as their benefits and drawbacks (Crini, 2006). Given the environmental importance of treating dye-contaminated wastewater, numerous technologies have been extensively studied in recent years. Bilal et al. highlight various methods, including photocatalysis, ozonation, incineration, electrochemistry, ion exchange, flocculation, electrocoagulation, micro-flocculation, electrocatalysis, catalytic photodegradation, advanced oxidation, membrane technologies, and biological processes. However, the authors emphasize that the key limitations of these emerging technologies—such as low removal efficiency, the generation of toxic byproducts, high energy demands, complex regeneration processes, and high costs—have led to a growing reliance on adsorption using biologically derived materials, such as biomass-based charcoal, for dye removal from wastewater.
The increasing use of dyes in the textile, cosmetics, leather, food, pharmaceutical, paint and varnish, and paper industries makes their removal in wastewater treatment processes crucial. Adsorption is the most frequently documented (Figure 2) of the several dye removal processes that have been investigated in the literature (Dutta et al., 2021). Sorbent materials’ competitiveness in comparison to other pollution removal strategies is determined by the production and use costs. According to recently published data sorbent materials costs should be between 1 USD and 200 USD per mole of pollutant eliminated (cheap and expensive) (Ighalo et al., 2022).
Sorbent materials' competitiveness in comparison to other pollution removal strategies is determined by the production and use costs. According to recently published data sorbent materials costs should be between 1 USD and 200 USD per mole of pollutant eliminated (cheap and expensive) (Ighalo et al., 2022). The sustainability of the water treatment process is closely tied to the sustainability of the sorbent materials used. Biosorbents, due to their renewable nature and potential for biodegradation, emerge as the preferred choice for this purpose. Sorbents derived from biomaterials can be prepared using a wide range of materials, including waste, following different preparation methodologies, and can be used to remove water pollutants including dyes, heavy metals, radionuclides, and pharmaceuticals among others.
Methylene blue adsorption onto BC is a complex process embracing multiple mechanisms such as hydrogen bonding, electrostatic attraction, ion exchange, surface complexation, π-interactions, and pore filling (Singh et al., 2023). The morphology of biochar and the functional groups on its surface, with heteroatoms, play a crucial role in its ability to remove pollutants as shown in Figure 3 The characteristics of biochar depend on the raw biomass, carbonization procedure, and post-production activation treatments (Yaashikaa et al., 2020). The chemical properties of BC are determined by the C, H, N, S, and O content of the biomass that gives rise to it and factors in the production process such as temperature. The most important physical property of BC is the porosity that is formed by the removal of volatile matter during carbonization (Jeyasubramanian et al., 2021). Terrestrial and marine biomass have different compositions, giving rise to chars with different properties. Since oceans and seas envelop approximately 71% of the Earth's surface, marine macroalgae possess an abundant biomass. The utilization of marine biomass like macroalgae, known as blue carbon, is pivotal in fostering sustainable development by enhancing the circular economy and thereby aiding in climate change mitigation (Dang et al., 2023). Unlike terrestrial biomass, seaweed predominantly stores carbon in the form of sugars instead of lignocellulosic compounds. This unique attribute allows marine biomass to undergo carbonization under mild conditions compared to woody terrestrial biomass. Additionally, the substantial presence of inorganic salts in seaweed catalyzes gasification, accelerating its conversion into carbon-rich compounds. Seaweed-derived biochar has several functional groups that make it suitable for removing pollutants and soil amendments. (Liu et al., 2022).
Jiang et al. (Jiang et al., 2023) recently studied MB removal using NaOH-activated seaweed-derived biochar. From DFT (Density-functional theory) computations, the authors attributed the high adsorption capacity to the high biochar porosity and synergy effect between the different adsorption mechanisms (p-p stacking, cation-p interaction, and electrostatic interaction). Other researchers also studied the performances of seaweed biochar in the MB removal from contaminated water. Data in Table 2 show that MB removal efficiency increases raising the temperature at which biochar is prepared and activation procedure also plays a chief role in the MB adsorption performances.
Despite extensive research on macroalgae biochar production, knowledge gaps remain. In a recent review, Wang et al. (Y. Wang et al., 2023) emphasized the significant potential of seaweed biochar due to its readily available and cost-effective biomass source, underlining the need for additional investigation into the production and activation of these biochars, given that reported materials exhibit notably low porosity. Additionally, they stated that seaweed char's sustainability hinges on the possibility of efficient adsorbent regeneration.
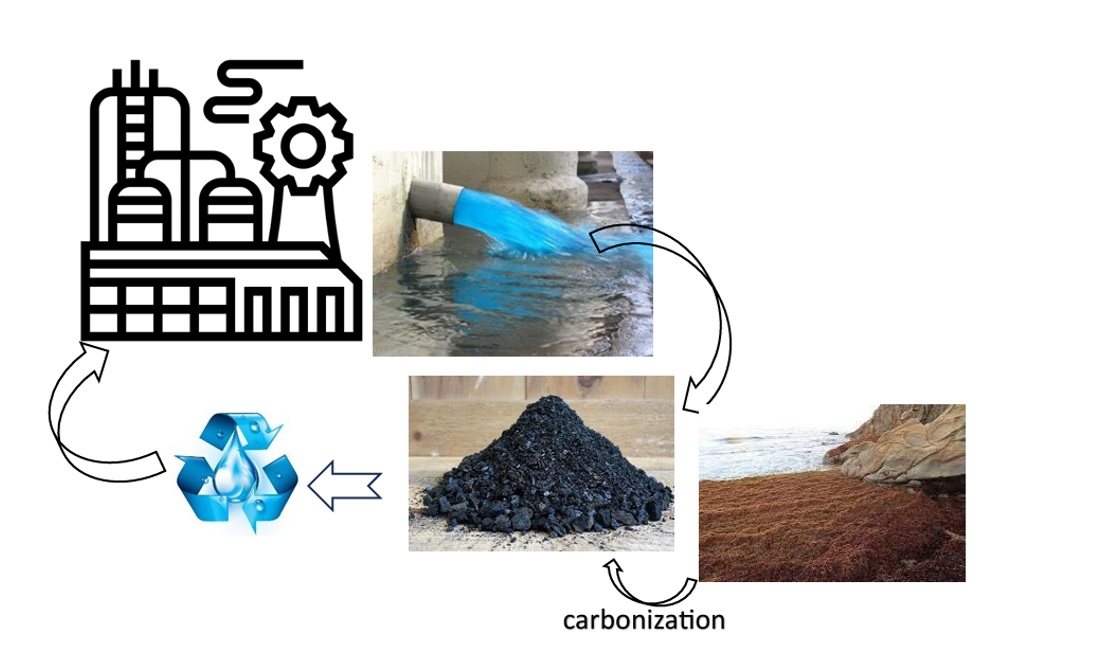
The following sections present results on the use of biochar for dye removal from wastewater. Biochar was produced by carbonization of seaweed biomass similar to Sargassum, harvested from the Portuguese coastline. The most efficient material achieved an adsorption capacity of 500 mg of dye per gram of solid—a significant value given the simplicity of the sorbent preparation, which required neither high-temperature thermal activation nor chemical treatment.This study aligns with the United Nations Sustainable Development Goals (SDGs) 6 (Clean Water and Sanitation) and 12 (Responsible Consumption and Production). It underscores the growing scarcity of potable water, exacerbated by consumer-driven industries such as clothing manufacturing, where resilient dyes contribute to industrial wastewater pollution.
2. Experimental
The char sorbents were prepared by slow carbonization of a brown seaweed mixture (Table 3), collected in the coastal areas of Portugal. Different species of marine algae were collected by hand from Praia de Alpertuche, Setúbal (38°28'4.93"N, 8°59'22.27"W) on three different dates: 28/05/2022, 4/07/2022, and 5/11/2022, to guarantee a more representative sample of the collected marine algae. The collected biomass was washed thoroughly with tap water to remove contamination with sand and seawater and then dried naturally in contact with atmospheric air (2 days). A sufficient amount of water was used to thoroughly remove all the sand from the biomass. Lisbon's tap water meets the European Community's quality standards for drinking water, with an average pH of approximately 8.0. The biomass was further dried overnight in an oven at 60 °C to ensure an easily grindable material.
After grinding in a blade mill, the biomass was sieved and the fractions above 750 mm were subjected to a new grinding process. Carbonization in a muffle was carried out by wrapping 10 g of biomass in an envelope (with 4 layers, around 3 g), of aluminum foil (Figure 4), leaving a small hole for the gases formed to escape, thus maintaining a non-oxidizing atmosphere during the process. The char samples were prepared at 300 °C and 400 °C. The carbonization temperature was chosen from the thermal degradation profile under nitrogen flow. The thermogram was acquired at 20 °C/min, under N2 flow, using a Netzsch STA490 PC thermobalance. An alumina crucible with 60 mg of the powdered sargaço was used.
Previous research found that below 300 °C, the carbonized biomass contained a significant amount of water-soluble organic compounds, which is why this temperature was chosen as the lowest for the procedure. The consumption of energy is significantly over 400 °C, which is why this is the maximum temperature used. Heating during carbonization was carried out at a constant rate for a 2 h period and the sample remained at maximum temperature for 2 h. Cooling was done slowly while keeping the sample inside the oven. After cooling, the chars were weighed and then washed with boiling distilled water to remove water-soluble compounds formed during carbonization and inorganic salts. After filtration, the chars were dried overnight in an oven at 70 °C. The produced chars were labeled as S300 and S400, according to the carbonization temperatures, preceded by NW for unwashed and W for washed. The char prepared by carbonization at 400 °C was subjected to a physical activation treatment in a ball mill. The treatment was carried out for 1 hour using Retsch S1 planetary ball mill equipment with the container and balls in agate using a ball/char mass ratio of around 10 and a rotational speed of 370 rpm. The ball/char volume ratio was 14/50 with balls of different diameters (6 balls of 12 mm plus 2 balls of 20 mm). The pH of the prepared chars was determined in aqueous suspensions of the powdered materials following the methodology reported in the literature (Singh et al., 2017). Briefly, a 1:20 (weight basis) suspension of solid in distilled water was prepared and kept under magnetic stirring (500 rpm) for 90 min. After the equilibration period, the pH was measured with a Consort C931 electrochemical analyzer. The non-washed and washed chars were characterized by infrared spectroscopy to characterize the surface functional groups. The post-adsorption solids were also characterized to depict the interactions between the colorant molecules and the sorbent. The spectra were acquired by attenuated total reflectance mode using a PerkinElmer Spectrum Two IR spectrometer equipped with a Pike ATR accessory with a diamond crystal.
Each spectrum was acquired in the 4000-600 cm-1 wavenumber range using 4 scans and a resolution of 4 cm-1.
XRD was used to examine the inorganics in char materials as well as the chars themselves, both washed and unwashed. The diffractograms were plotted from 5-70 ° (step of 0.02° and 1 s by step) on a Burke D8 Advance X-ray diffractometer with Cu Ka radiation at 40 kV and 40 mA.
The morphology and near-surface chemical composition of the chars were assessed by SEM-EDS. Before analysis, the powdered sample was studded over a double-face carbon tape and covered by a thin film of Pd-Au. The micrographs were gathered using a Hitachi S-2400 Scanning Electron Microscope. The elemental analysis during image acquisition was performed using a Bruker light elements EDS detector at 20.0 kV.
The prepared chars were also characterized by Raman spectroscopy using a Horiba LabRam HR 800 Evolution confocal Raman micro spectrometer with a 532 nm laser focused with a 100× objective with 10 mW power at the samples. The graphitization index (ID/IG) of the chars, was obtained by the curve fitting method applied to the spectral data in the 800-2000 cm-1 as reported before (Rijo et al., 2023). The ID/IG was obtained by the ratio of the areas under the Gaussian curves centered at 1367 cm-1 (D band) and 1587 cm-1 (G band). The G (graphitized material) band arises from the in-plane vibrations of SP2 bonded carbon atoms while the D band is due to out of plane vibrations attributed to the presence of structural defects in disordered material (Brown et al., 2017).
The batch methylene blue adsorption tests were carried out in a thermostatic bath at temperatures in the 25 °C to 50 °C range. For each test, 50 mL of methylene blue solution (100 to 520.5 ppm) was previously thermostatic (15 min) in a stoppered flask with a magnetic stirrer. After the thermostatisation period, the char (1 to 15 g/L) was added, and the adsorption test was carried out for 30 min to 120 min. The reproducibility of the MB adsorption tests was tested using 4 replicates of a randomly chosen test. The associated error was computed using Student's distribution for a 95% confidence level. In the adsorption kinetics tests, samples were taken every 5 min during the first 30 min and every 15 min after that. After the adsorption tests, the char was removed by vacuum filtration, and the solid was dried in an oven (60 °C) overnight for subsequent characterization.
To optimize the sorbent dose used in adsorption experiments, various amounts of W-BM-S400 ranging from 0.05 to 0.75 g were added to 50 mL of solution at 40 °C. The impact of solution pH on MB adsorption was analyzed by adding HCl and/or NH4OH until the desired pH (2-12) was achieved. The acid or base, in the form of concentrated solutions, was gradually added with continuous pH monitoring and vigorous stirring until the desired pH was achieved.
Adsorption experiments based on pH were conducted by adding 0.10 g of sorbent to 50 mL of MB solution at 40 °C. To investigate the influence of solution temperature on MB adsorption, 0.10 g of W-BM-S400 was added to 50 mL of MB solution at 25 °C, 30 °C or 40 °C. In all these experiments, the contact time was 30 min, the stirring speed was 900 rpm, and the MB solution concentration was 520.5 ppm.
The methylene blue in aqueous solutions was quantified using the UV-Vis spectroscopy. The calibration curve, absorbance versus MB concentration, was carried out for solutions with MB concentration in the 0-30 ppm range. As reported in the literature (Fernandez-Perez and Marban, 2020) the proportionality spectral feature/concentration was established for the absorbance at 664 nm. The Figure 5 shows the UV-Vis spectra of standard solutions and the obtained calibration curve.
3. Results and Discussion
The sargaço biomass was characterized by thermogravimetry under N2 flow to select the carbonization temperature. The thermal degradation profile in Figure 6 shows that at 400 °C the biomass has already suffered the greatest loss of mass, which occurs at a maximum rate of around 270 °C. Given the thermogravimetry data, 300 °C and 400 °C were chosen as the carbonization temperatures. The selected carbonization temperatures are in line with the data of Wang et al. (Wang et al., 2020), which show that the devolatilization stage of seaweed biomass occurs between 200 °C and 550 °C.
After carbonization, the biomass was converted into a dark grey/black material with char yields and pH summarized in Table 4. The char yields agree with recently published data, which emphasizes that the yield depends on the carbonization temperature and the type of seaweed used (Dang et al., 2023). The high content of alkali in seaweed biomass (Figure 7) can contribute to prompt gasification during carbonization thus decreasing the char yield (Soares Dias et al., 2019). All the prepared biochar presents an alkaline character due to inorganics, such as K, and the organic surface groups such as -COO- and -O- (Chung et al., 2023). The biochar washed samples present lower pH values due to the leaching of alkali salts.
The high content of alkali elements of non-washed chars was confirmed by EDS during SEM micrographs acquisition (Figure 8). Both techniques, XRF and EDS, underline the fact that the washing procedure is crucial to leach inorganics salts of chars which would otherwise be solubilized in the wastewater to be treated. Results shown in Figure 7 and Figure 8 indicate that Ca remains in the chars even after washing, which may contribute to better methylene blue adsorption. Wang et al. (K. Wang et al., 2023) reported that ion exchange and π−π stacking- π−π interactions in Figure 3 - increased MB adsorption for Ca-modified rice husk chars. The ball-milled sample displays the highest Ca content.
The brownish-colored char washing water contained significant amounts of potassium and organic compounds derived from the partial carbonization of algal sugars, making it a viable source of liquid fertilizer, or foliar spray, for agriculture and floriculture (Sangha et al., 2014). Inorganics in raw sargaço are well visible in SEM micrographs (Figure 10) as small agglomerates of light color studded over the bulk material. The leaching of alkali chlorides, and other water-soluble salts, during the washing procedure, was confirmed by X-ray diffraction (Figure 11). Non-washed samples show XRD patterns belonging to the inorganics crystalline phases whereas the char-washed sample’s XRD lines of non-soluble-inorganics such as quartz overlapped with the characteristic pattern of semi-graphitized char (Singh and Vander Wal, 2022) with a broad feature centered at 23.5°.
The graphitization Index of the produced chars was evaluated by Raman spectroscopy (Figure 12). Data from spectra deconvolution showed ID/IG values of 1.81, 1.70, and 1.67 for washed samples prepared at 300 °C, 400 °C, and ball mill respectively. As expected, char graphitization increases raising the carbonization temperature (Yuan et al., 2023) and ball milling also has a benefit on this char feature. In the spectral region between the D and G bands appears the D' band, around 1500 cm-1, which results from defects induced by heteroatoms. This band results from the PAH moieties' combined vibration modes, mostly caused by N or O functional groups (Ayiania et al., 2020). The ball mill sample (W-BM-S400) presents a D’ band more intense (ID’/ID=0.52) than the other 2 samples (0.38 at 300 °Cand 0.35 at 400 °C), which means that BM treatment is beneficial for the formation of oxygen functional groups. Moreover, such treatment also increases the surface exposure of the preexistent functional groups (Lopez-Tenllado et al., 2021). The changes introduced by the ball mill occur through a radical mechanism (Timko et al., 2016) which allows rearrangements with the formation of aromatic groups with more units or termination with oxygenated groups.
The XRD data (Figure 11) also confirms the high inorganic content of biochar samples. The diffractograms show diffraction lines of alkali crystalline salts such as sylvite, halite, calcite, dolomite, and anhydrite overlapped with XRD lines belonging to quartz. The same XRD lines were observed for sargaço which is consistent with the high mineral content reported for the seaweed biomass (Soares Dias et al., 2023). Other researchers (Sun et al., 2022) observed substantial inorganic content for seaweed-derived biochar, emphasizing how this distinguishes it from wood-derived biochar.
The O/C and H/C ratios, assessed by elemental analysis, of raw biomass and prepared biochars were used to draw the Van Krevelen diagram (Figure 9). This type of diagram facilitates the evaluation of the processes involved in biomass carbonization.
The predicted reaction path from raw biomass to chars, the dashed line, shows that the dehydration processes are dominant in the carbonization of sargaço, because the dehydration vector and the path are close. This observation is in line with what has been reported in the literature for the carbonization of sugars, which are the major components of seaweed (C. Zhang et al., 2020). As expected higher carbonization temperature raises the loss of oxygen containing species, decreasing the O/C ratio (Bakshi et al., 2020). Ball milling for 1h very slightly decreased O and H atomic percentages, and increased C at.%, though reducing H/C and O/C ratios (Table 10). The same results were obtained by Timko et al. (Timko et al., 2016) studying glucose hydrothermal char.
Micrographs of non-washed char show inorganic materials agglomerates that are absent in washed chars. The morphology of char produced at 300 °C and 400 °C (Figure 9) by slow carbonization is less spongy than that reported in the literature for char produced by high-temperature pyrolysis (>600 °C), which implies a smaller surface area available for the adsorption of pollutants.
The functional group on the char surface and the MB adsorbed species were evaluated by ATR-FTIR. Figure 13 presents the IR reflectance spectra of the biochars before MB adsorption, along with the raw biomass, with vibration mode assignments based on literature data.
The adsorption of MB onto the chars was assessed by analyzing the shift of the reflectance bands in the IR spectrum of pure MB with the analogous bands of the chars after adsorption (Table 5).
The data show that the band corresponding to the C-H vibration mode of the heterocycles is the one that undergoes the greatest shift, suggesting that the adsorption mechanism involves p-p interactions (Ovchinnikov et al., 2016). A kind of electrostatic interaction called the n-π interaction, in which the surface O and N containing-functionals groups, whose atoms possess a lone pair of electrons, acting as electron donors and the aromatic rings in biochar as electron acceptors (Gayathri and Palanisamy, 2020; X. Zhang et al., 2020) could also have played a role in MB removal since the prepared char contain considerable amounts of N and O.
For the MB adsorption tests, the char mass/solution volume ratio (dosage) was optimized using the sample produced at 400 °C and subjected to ball mill activation. For the 520.5 ppm MB solution (pH=5.5) and 30 min adsorption period (Figure 14). In the tested conditions the MB removal efficiency increased raising the char mass due to the higher availability of adsorption sites. However, an increase in the adsorbent dose above 4 g/L, promoted a pronounced decrease in the MB adsorption capacity. A high dose of char could have blocked possible adsorption sites due to the superposition of the adsorbent layers. As a good practice, the char dose must be optimized to reach the highest MB removal efficiency while keeping the process cost-effective (Barquilha and Braga, 2021; Dutta et al., 2021; Enaime et al., 2020).
The temperature effect was studied and the results in Figure 15 show that char MB adsorption capacity increases with temperature, which is in line with thermodynamic studies that indicate that the adsorption process is spontaneous and endothermic, i.e. favored by an increase in temperature (Li et al., 2023).
The MB solution pH effect (Figure 16) on the char adsorption performances was studied using the char prepared at 400 °C with ball mill treatment which showed b FTIR few acidic O containing functional groups such as carboxylic acids. Thus, the pH-dependent electrostatic interaction between these functional groups conjugated bases negative charge and MB positive charge was not expected to play a huge role. The lower adsorption capacity at a pH of 2.2 was due to the increased competition between H+ ions in solution and the cationic dye for adsorption sites on the char surface (K. Wang et al., 2023). Moreover, the amine groups, detected by FTIR, can be protonated in acidic solutions, possessing a positive charge that repelled MB dye molecules. At pH in the 4.8- 7.2 range, the adsorption capacity was almost the same, revealing that huge amounts of carbonate minerals of biochar have helped to remove H+ from the solution (K. Wang et al., 2023; Yang et al., 2021). Actually, after MB adsorption the initial pH of 4.8 changed to 7.4 (K. Wang et al., 2023). The slightly higher adsorption capacity at pH of 7.2 compared to pH of 4.8 could have been due to some residual carboxylic acid groups which become deprotonated with higher OH- presence in solution, thus enhancing electrostatic interaction (Güleç et al., 2022). Despite the decrease in the electronegativity of char at lower pH and increased competition with H+ for adsorption sites, the fairly good adsorption capacity obtained revealed that π-π interaction and hydrogen bonding must have been crucial for MB removal from solution (Lyu et al., 2018). As determined by the FTIR analysis strong shifts in the bands associated with MB interaction with biochar through H-bonding with N in methylamino groups and N in heterocycle were found. Moreover, the char had abundant aromatic structures on the surface, the π-π, interactions, n-π interactions, and Yoshida H-bonding have also been involved in MB adsorption.
At pH 12.6, the methylene blue solution loses its distinctive blue hue and turns purple, indicating a structural shift in the molecule that appears to assist removal from the solution by adsorption onto the char. The literature claims that high pH aids in the removal of MB (Zhu et al., 2018). In any scenario, high pH values are prohibited from the standpoint of wastewater treatment process sustainability.
Equilibrium data from the isothermal adsorption study at 40 °C were fitted using the Langmuir (eq.1) (Mani et al., 2023) and Freundlich (eq.2) isotherms (Figure 17).
(eq.1)
(eq.2)
Ce- concentration of MB at equilibrium; qe- the amount of adsorbate per mass unit of char at equilibrium; Qmax- maximum monolayer adsorption capacity; KL- Langmuir isotherm constant; KF- Freundlich constant and 1/nF- heterogeneity factor.
The Langmuir and Freundlich adsorption isotherms fitted to the MB adsorption data, after linearization, are shown in Figure 17. The same figure also presents the adjusted parameter values for each isotherm, as well as the quality of the fit (R²). The Freundlich model (R2=0.981) provides a better fit than the Langmuir model (R2=0.935). revealing that MB adsorption onto W-BM-S400 surface followed preferentially the Freundlich isotherm. Thus the surface of W-BM-S400 must be heterogeneous, in which MB dyes potentially auto associate to form multiple layers due to π-π stacking between dye monomers and H-bonds with solvent molecules (H2O).
Regarding the Langmuir isotherm, the obtained KF value ranged between 0 and 1, confirming that the adsorption of MB dye onto W-BM-S400 was favorable [47,55]. Similarly, for the Freundlich isotherm, the heterogeneity factor (1/nF) was lower than one, indicating that the adsorption process was favorable. Additionally, the value of 1/nF was less than 0.5, suggesting that MB was easily adsorbed . From the linearized Langmuir model, the maximum computed adsorption capacity of the best prepared sorbent (400 °C, ball mill) was 500 mgMB/gchar.
The maximum adsorption capacity of the prepared char is above the average values reported in the literature for char derived from terrestrial biomass, even when subjected to chemical/physical activation treatments (Figure 18).
4. Conclusions
The invasive marine macroalgae that accumulate on beaches, causing environmental concerns, can be repurposed into carbonaceous materials such as biochar for wastewater treatment through adsorption. In this study, a mixture of seaweed, similar in composition to sargaço and harvested from the Portuguese coast, was carbonized at 300 °C and 400 °C to produce biochar for the removal of methylene blue (MB) from contaminated water. The resulting biochar, characterized by a low graphitization index and relatively compact morphology, underwent a washing process to remove alkali chlorides (K and Na), preventing solution contamination and ensuring that adsorption sites remained accessible. The remaining calcium salts in the biochar enhanced MB adsorption through an ion-exchange mechanism. The Freundlich isotherm parameters confirmed the heterogeneous nature of the biochar surfaces and the favorability of MB adsorption (1/nF < 1). Furthermore, the Langmuir isotherm adsorption kinetics revealed a maximum adsorption capacity of 500 mg MB/g char for the best-performing biochar. Notably, the adsorption capacity of these seaweed-derived biochars exceeds the average reported for biochars produced from woody biomass. Ball milling activation further enhanced adsorption performance. The promising results obtained in this study demonstrate that biochars derived from seaweed, such as sargassum, offer a sustainable and effective solution for removing dyes from wastewater, particularly from the fabric dyeing industry. This approach not only mitigates the environmental impact of algal overgrowth but also provides an eco-friendly alternative to conventional wastewater treatment methods. Future research should focus on biochar regeneration and reuse to evaluate its long-term feasibility for large-scale applications in industrial wastewater treatment.
Author Contributions
A.Dias: conceptualization, resources, supervision, writing original draft; F.Santos: investigation, writing original draft; B. Rijo: methodology, supervision, formal analysis, writing-review &editing; L. Pereira: resources, review &editing; D. Simes: resources, review & editing; M.Pereira: resources, formal analysis, review &editing
Data Availability Statement
Data will be available on request.
Acknowledgments
The authors acknowledge Fundação para a Ciência e a Tecnologia, I.P. (Portuguese Foundation for Science and Technology) under project UIDB/05064/2020 (VALORIZA – Research Centre for Endogenous Resource Valorization). The authors gratefully acknowledge the support of the CERENA (FCT-UIDB/04028/2025 and FCT-UIDP/04028/2025)
Conflicts of Interest
The authors declare that they have no known competing financial interests or personal relationships that could have appeared to influence the work reported in this paper.
Abbreviations
BM- ball milled
Ce-concentration of MB at equilibrium;
KF- Freundlich isotherm constant
KL- Langmuir isotherm constant
MB – methylene blue dye
1/nF – heterogeneity factor
NW – non washed char
qe- amount of adsorbate per mass unit of char at equilibrium
Qmax- maximum monolayer adsorption capacity
S300 – sargaço char produced at 300 °C
S400 – sargaço char produced at 400 °C
Sargaço – Seaweeds harvested along the Portuguese coastline
W -washed char
References
- Ahmed, M.J. , Okoye, P.U., Hummadi, E.H., Hameed, B.H., 2019. High-performance porous biochar from the pyrolysis of natural and renewable seaweed (Gelidiella acerosa) and its application for the adsorption of methylene blue. Bioresour. Technol. 278, 159–164. [CrossRef]
- Ayiania, M. , Weiss-Hortala, E., Smith, M., McEwen, J.S., Garcia-Perez, M., 2020. Microstructural analysis of nitrogen-doped char by Raman spectroscopy: Raman shift analysis from first principles. Carbon N. Y. 167, 559–574. [CrossRef]
- Bakshi, S. , Banik, C., Laird, D.A., 2020. Estimating the organic oxygen content of biochar. Sci. Rep. 10, 1–12. [CrossRef]
- Barquilha, C.E.R. , Braga, M.C.B., 2021. Adsorption of organic and inorganic pollutants onto biochars: Challenges, operating conditions, and mechanisms. Bioresour. Technol. Reports 15, 100728. [CrossRef]
- Brown, A.B. , McKeogh, B.J., Tompsett, G.A., Lewis, R., Deskins, N.A., Timko, M.T., 2017. Structural analysis of hydrothermal char and its models by density functional theory simulation of vibrational spectroscopy. Carbon N. Y. 125, 614–629. [CrossRef]
- Chung, B.Y.H. , Ang, J.C., Tang, J.Y., Chong, J.W., Tan, R.R., Aviso, K.B., Chemmangattuvalappil, N.G., Thangalazhy-Gopakumar, S., 2023. Rough set approach to predict biochar stability and pH from pyrolysis conditions and feedstock characteristics. Chem. Eng. Res. Des. 198, 221–233. [CrossRef]
- Crini, G. , 2006. Non-conventional low-cost adsorbents for dye removal: A review. Bioresour. Technol. 97, 1061–1085. [CrossRef]
- Dang, B.T. , Ramaraj, R., Huynh, K.P.H., Le, M.V., Tomoaki, I., Pham, T.T., Hoang Luan, V., Thi Le Na, P., Tran, D.P.H., 2023. Current application of seaweed waste for composting and biochar: A review. Bioresour. Technol. 375, 128830. [CrossRef]
- Dutta, S. , Gupta, B., Srivastava, S.K., Gupta, A.K., 2021. Recent advances on the removal of dyes from wastewater using various adsorbents: a critical review. Mater. Adv. 2, 4497–4531. [CrossRef]
- El Nemr, A. , Shoaib, A.G.M., El Sikaily, A., Mohamed, A.E.D.A., Hassan, A.F., 2021. Evaluation of Cationic Methylene Blue Dye Removal by High Surface Area Mesoporous Activated Carbon Derived from Ulva lactuca. Environ. Process. 8, 311–332. [CrossRef]
- Enaime, G. , Baçaoui, A., Yaacoubi, A., Lübken, M., 2020. Biochar for Wastewater Treatment—Conversion Technologies and Applications. Appl. Sci. 2020, Vol. 10, Page 3492 10, 3492. [CrossRef]
- Fernandez-Perez, A. , Marban, G., 2020. Visible light spectroscopic analysis of methylene blue in water; what comes after dimer? ACS Omega 5, 29801–29815. [CrossRef]
- Gayathri, K. , Palanisamy, N., 2020. Methylene blue adsorption onto an eco-friendly modified polyacrylamide/graphite composites: Investigation of kinetics, equilibrium, and thermodynamic studies. Sep. Sci. Technol. 55, 266–277. [CrossRef]
- Global water & wastewater treatment market size 2021 | Statista [WWW Document], n.d. URL https://www.statista.com/statistics/1199744/market-size-water-and-wastewater-treatment-global/ (accessed 10.3.23).
- Güleç, F. , Williams, O., Kostas, E.T., Samson, A., Stevens, L.A., Lester, E., 2022. A comprehensive comparative study on methylene blue removal from aqueous solution using biochars produced from rapeseed, whitewood, and seaweed via different thermal conversion technologies. Fuel 330, 125428. [CrossRef]
- Ighalo, J.O. , Omoarukhe, F.O., Ojukwu, V.E., Iwuozor, K.O., Igwegbe, C.A., 2022. Cost of adsorbent preparation and usage in wastewater treatment: A review. Clean. Chem. Eng. 3, 100042. [CrossRef]
- Jeyasubramanian, K. , Thangagiri, B., Sakthivel, A., Dhaveethu Raja, J., Seenivasan, S., Vallinayagam, P., Madhavan, D., Malathi Devi, S., Rathika, B., 2021. A complete review on biochar: Production, property, multifaceted applications, interaction mechanism and computational approach. Fuel 292, 120243. [CrossRef]
- Jiang, D. , Li, H., Cheng, X., Ling, Q., Chen, H., Barati, B., Yao, Q., Abomohra, A., Hu, X., Bartocci, P., Wang, S., 2023. A mechanism study of methylene blue adsorption on seaweed biomass derived carbon: From macroscopic to microscopic scale. Process Saf. Environ. Prot. 172, 1132–1143. [CrossRef]
- Li, Huaiyan, Kong, J., Zhang, H., Gao, J., Fang, Y., Shi, J., Ge, T., Fang, T., Shi, Y., Zhang, R., Zhang, N., Dong, X., Zhang, Y., Li, Hui, 2023. Mechanisms and adsorption capacities of ball milled biomass fly ash/biochar composites for the adsorption of methylene blue dye from aqueous solution. J. Water Process Eng. 53, 103713. [CrossRef]
- Li, X.Y. , Han, D., Xie, J.F., Wang, Z.B., Gong, Z.Q., Li, B., 2018. Hierarchical porous activated biochar derived from marine macroalgae wastes (: Enteromorpha prolifera): Facile synthesis and its application on Methylene Blue removal. RSC Adv. 8, 29237–29247. [CrossRef]
- Liu, S. , Shen, C., Wang, Y., Huang, Y., Hu, X., Li, B., Karnowo, Zhou, J., Zhang, S., Zhang, H., 2022. Development of CO2/H2O activated biochar derived from pine pyrolysis: application in methylene blue adsorption. J. Chem. Technol. Biotechnol. 97, 885–893. [CrossRef]
- Lopez-Tenllado, F.J. , Motta, I.L., Hill, J.M., 2021. Modification of biochar with high-energy ball milling: Development of porosity and surface acid functional groups. Bioresour. Technol. Reports 15, 100704. [CrossRef]
- Lyu, H. , Gao, B., He, F., Zimmerman, A.R., Ding, C., Tang, J., Crittenden, J.C., 2018. Experimental and modeling investigations of ball-milled biochar for the removal of aqueous methylene blue. Chem. Eng. J. 335, 110–119. [CrossRef]
- Mani, D. , Elango, D., Priyadharsan, A., Al-Humaid, L.A., Al-Dahmash, N.D., Ragupathy, S., Jayanthi, P., Ahn, Y.H., 2023. Groundnut shell chemically treated with KOH to prepare inexpensive activated carbon: Methylene blue adsorption and equilibrium isotherm studies. Environ. Res. 231, 116026. [CrossRef]
- Ovchinnikov, O. V. , Evtukhova, A. V., Kondratenko, T.S., Smirnov, M.S., Khokhlov, V.Y., Erina, O. V., 2016. Manifestation of intermolecular interactions in FTIR spectra of methylene blue molecules. Vib. Spectrosc. 86, 181–189. [CrossRef]
- Rijo, B. , Dias, A.P.S., Carvalho, J.P.S., 2023. Recovery of carbon fibers from aviation epoxy composites by acid solvolysis. Sustain. Mater. Technol. 35, 14–16. [CrossRef]
- Sangha, J.S. , Kelloway, S., Critchley, A.T., Prithiviraj, B., 2014. Seaweeds (Macroalgae) and Their Extracts as Contributors of Plant Productivity and Quality: The Current Status of Our Understanding. Adv. Bot. Res. 71, 189–219. [CrossRef]
- Singh, B. , Dolk, M.M., Shen, Q., Camps-Arbestain, M., 2017. Biochar pH, electrical conductivity and liming potential. Biochar A Guid. to Anal. Methods 23–38.
- Singh, M. , Vander Wal, R.L., 2022. Carbon Composites—Graphene-Oxide-Catalyzed Sugar Graphitization. C 2022, Vol. 8, Page 15 8, 15. [CrossRef]
- Singh, S. , Prajapati, A.K., Chakraborty, J.P., Mondal, M.K., 2023. Adsorption potential of biochar obtained from pyrolysis of raw and torrefied Acacia nilotica towards removal of methylene blue dye from synthetic wastewater. Biomass Convers. Biorefinery 13, 6083–6104. [CrossRef]
- Sivaranjanee, R. , Kumar, P.S., Rangasamy, G., 2023. A critical review on biochar for environmental applications. Carbon Lett. 33, 1407–1432. [CrossRef]
- Soares Dias, A.P. , Rego, F., Fonseca, F., Casquilho, M., Rosa, F., Rodrigues, A., 2019. Catalyzed pyrolysis of SRC poplar biomass. Alkaline carbonates and zeolites catalysts. Energy 183, 1114–1122. [CrossRef]
- Soares Dias, A.P. , Rijo, B., Santos, F., Galhanos dos Santos, R., Frade, T., 2023. Overview on biofuels production in a seaweed biorefinery. Sci. Total Environ. 884, 163714. [CrossRef]
- Sun, J. , Norouzi, O., Mašek, O., 2022. A state-of-the-art review on algae pyrolysis for bioenergy and biochar production. Bioresour. Technol. 346, 126258. [CrossRef]
- Timko, M.T. , Maag, A.R., Venegas, J.M., McKeogh, B., Yang, Z., Tompsett, G.A., Escapa, S., Toto, J., Heckley, E., Greenaway, F.T., 2016. Spectroscopic tracking of mechanochemical reactivity and modification of a hydrothermal char. RSC Adv. 6, 12021–12031. [CrossRef]
- Wang, K. , Peng, N., Zhang, D., Zhou, H., Gu, J., Huang, J., Liu, C., Chen, Y., Liu, Y., Sun, J., 2023. Efficient removal of methylene blue using Ca(OH)2 modified biochar derived from rice straw. Environ. Technol. Innov. 31, 103145. [CrossRef]
- Wang, S. , Zhao, S., Uzoejinwa, B.B., Zheng, A., Wang, Q., Huang, J., Abomohra, A.E.F., 2020. A state-of-the-art review on dual purpose seaweeds utilization for wastewater treatment and crude bio-oil production. Energy Convers. Manag. 222, 113253. [CrossRef]
- Wang, Y. , Ma, C., Kong, D., Lian, L., Liu, Y., 2023. Review on application of algae-based biochars in environmental remediation: Progress, challenge and perspectives. J. Environ. Chem. Eng. 11, 111263. [CrossRef]
- Yaashikaa, P.R. , Kumar, P.S., Varjani, S., Saravanan, A., 2020. A critical review on the biochar production techniques, characterization, stability and applications for circular bioeconomy. Biotechnol. Reports 28, e00570. [CrossRef]
- Yang, C. , Miao, S., Li, T., 2021. Influence of water washing treatment on Ulva prolifera-derived biochar properties and sorption characteristics of ofloxacin. Sci. Rep. 11, 1–12. [CrossRef]
- Yuan, R. , Dong, Y., Hou, R., Shang, L., Zhang, J., Zhang, S., Chen, X., Song, H., 2023. Structural transformation of porous and disordered carbon during ball-milling. Chem. Eng. J. 454, 140418. [CrossRef]
- Zhang, C. , Zhang, L., Gao, J., Zhang, S., Liu, Q., Duan, P., Hu, X., 2020. Evolution of the functional groups/structures of biochar and heteroatoms during the pyrolysis of seaweed. Algal Res. 48, 101900. [CrossRef]
- Zhang, X. , Wang, Y., Cai, J., Wilson, K., Lee, A.F., 2020. Bio/hydrochar Sorbents for Environmental Remediation. Energy Environ. Mater. 3, 453–468. [CrossRef]
- Zhu, Y. , Yi, B., Yuan, Q., Wu, Y., Wang, M., Yan, S., 2018. Removal of methylene blue from aqueous solution by cattle manure-derived low temperature biochar. RSC Adv. 8, 19917–19929. [CrossRef]
Figure 1.
Global water and wastewater treatment market size 2023-2034 (source).
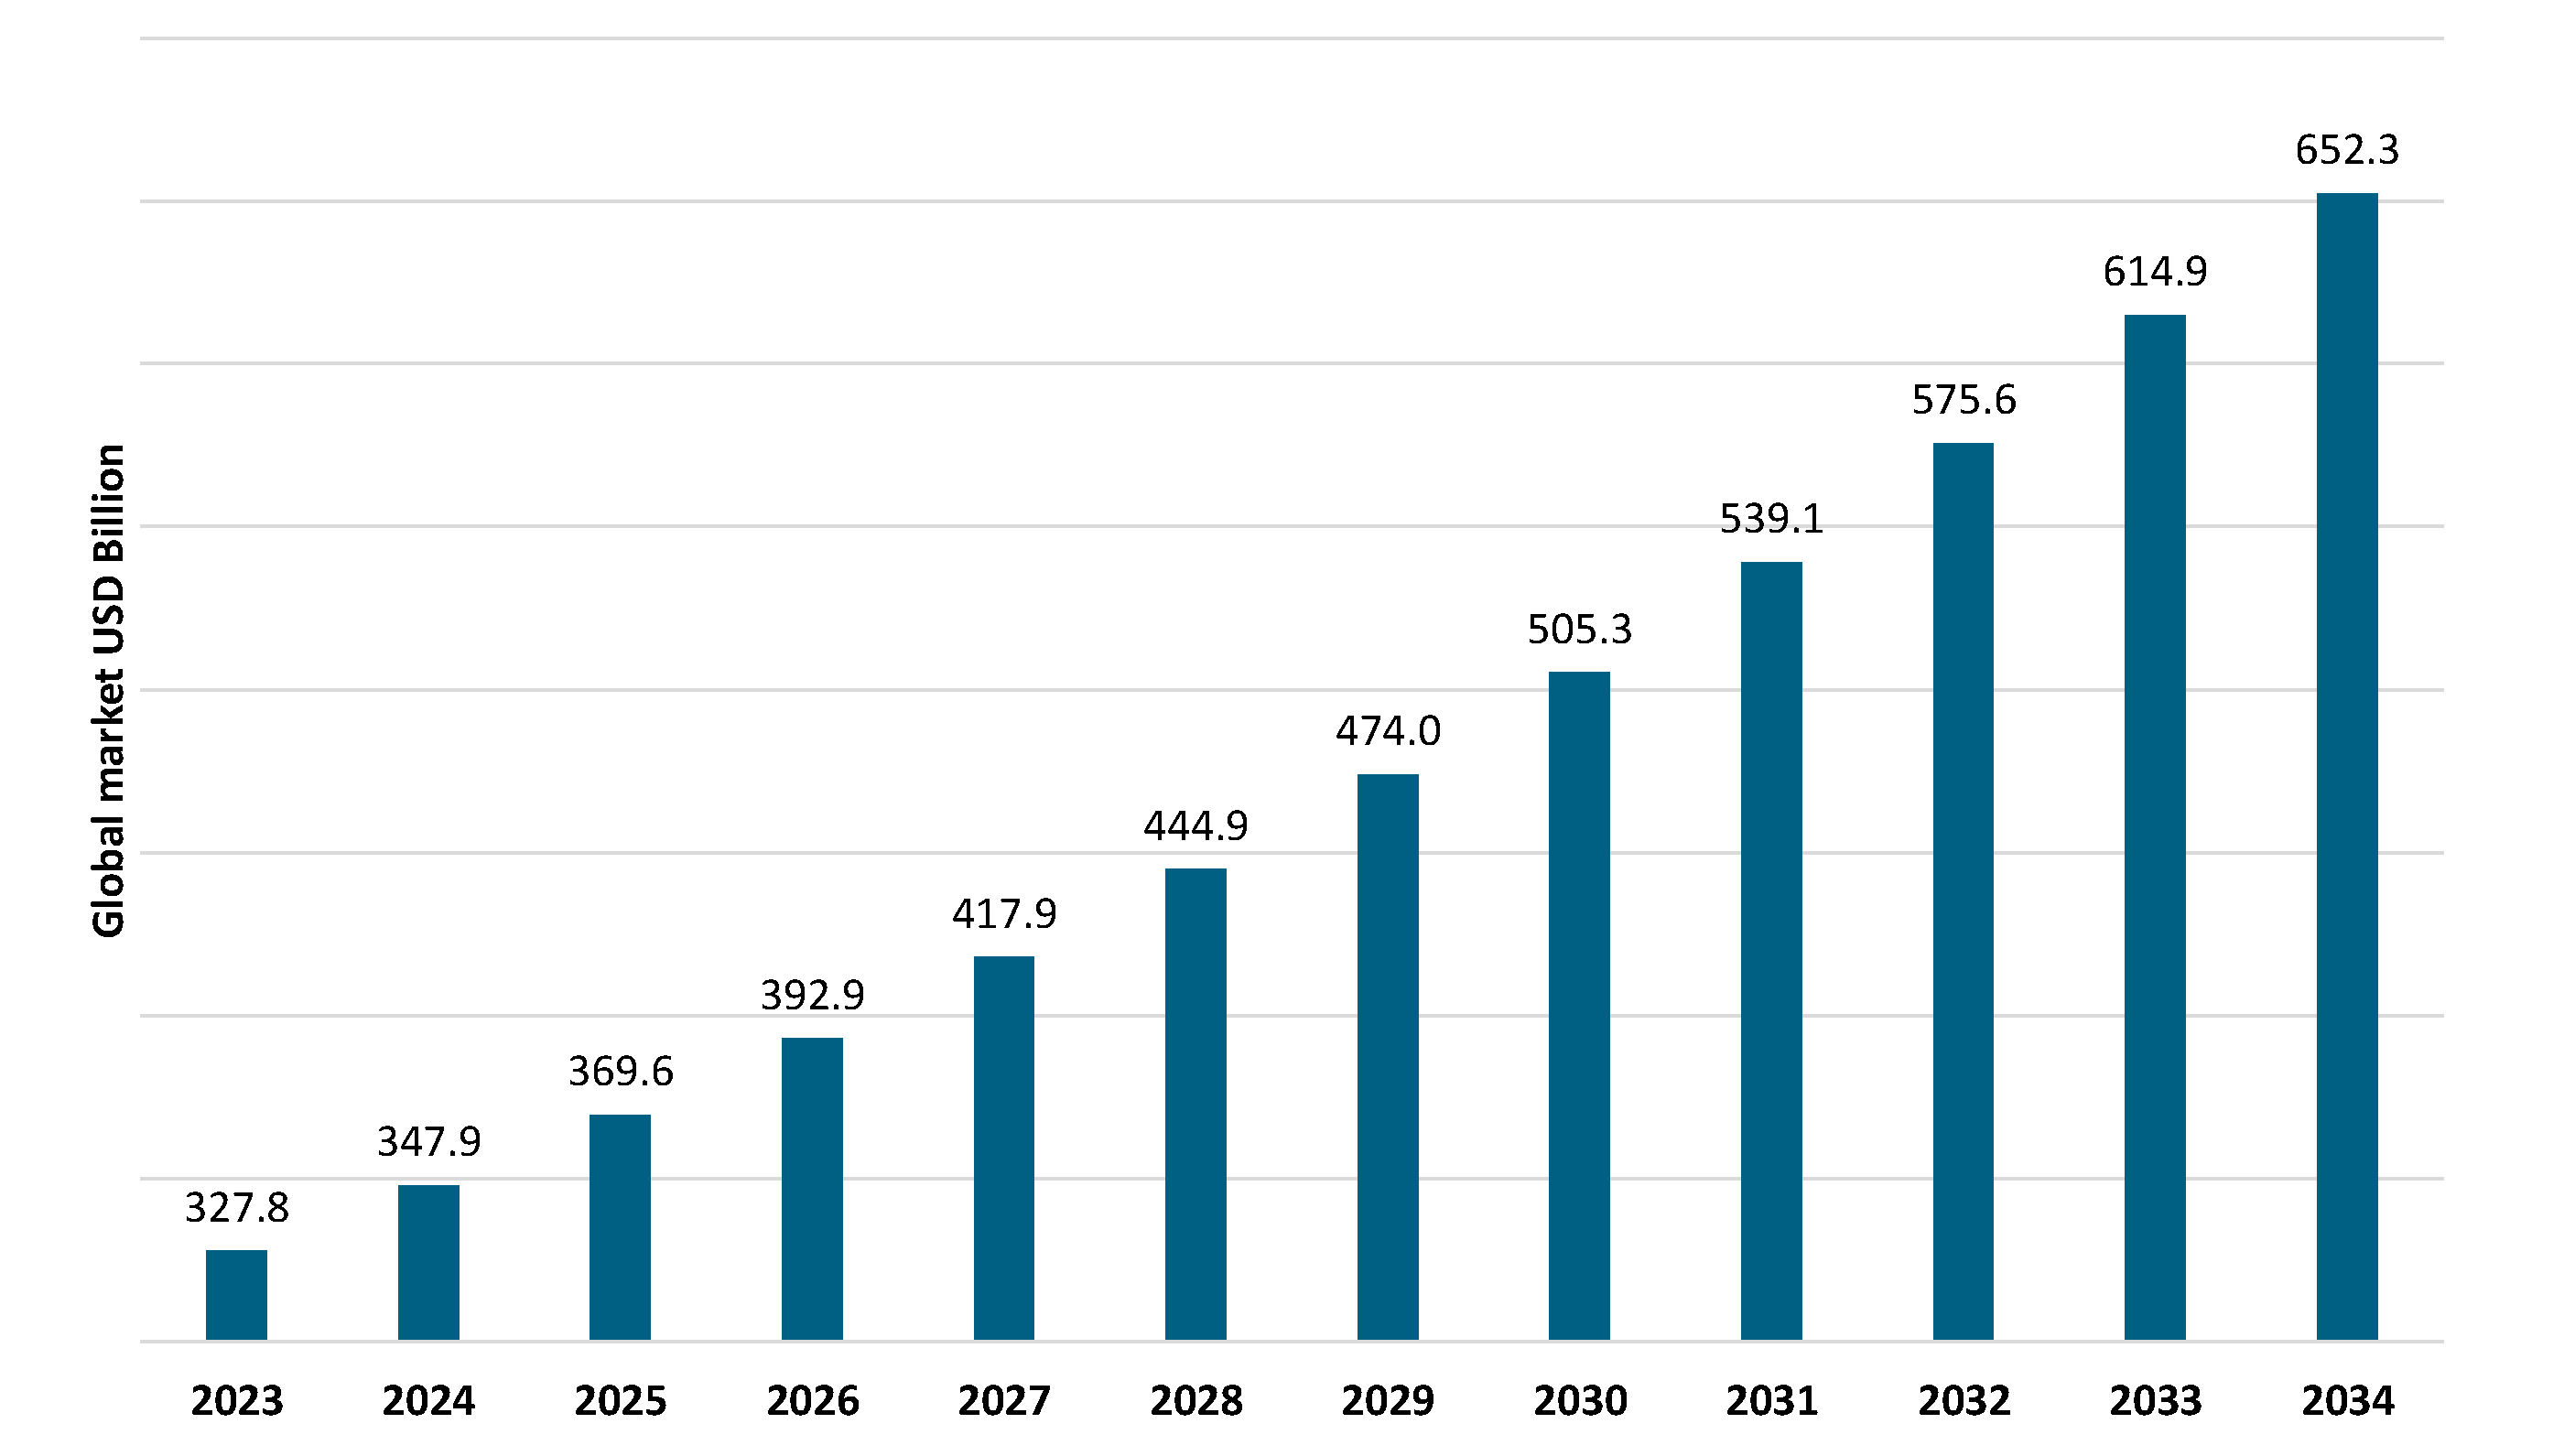
Figure 2.
Dyes removal from wastewater methods (adapted from (Dutta et al., 2021)).
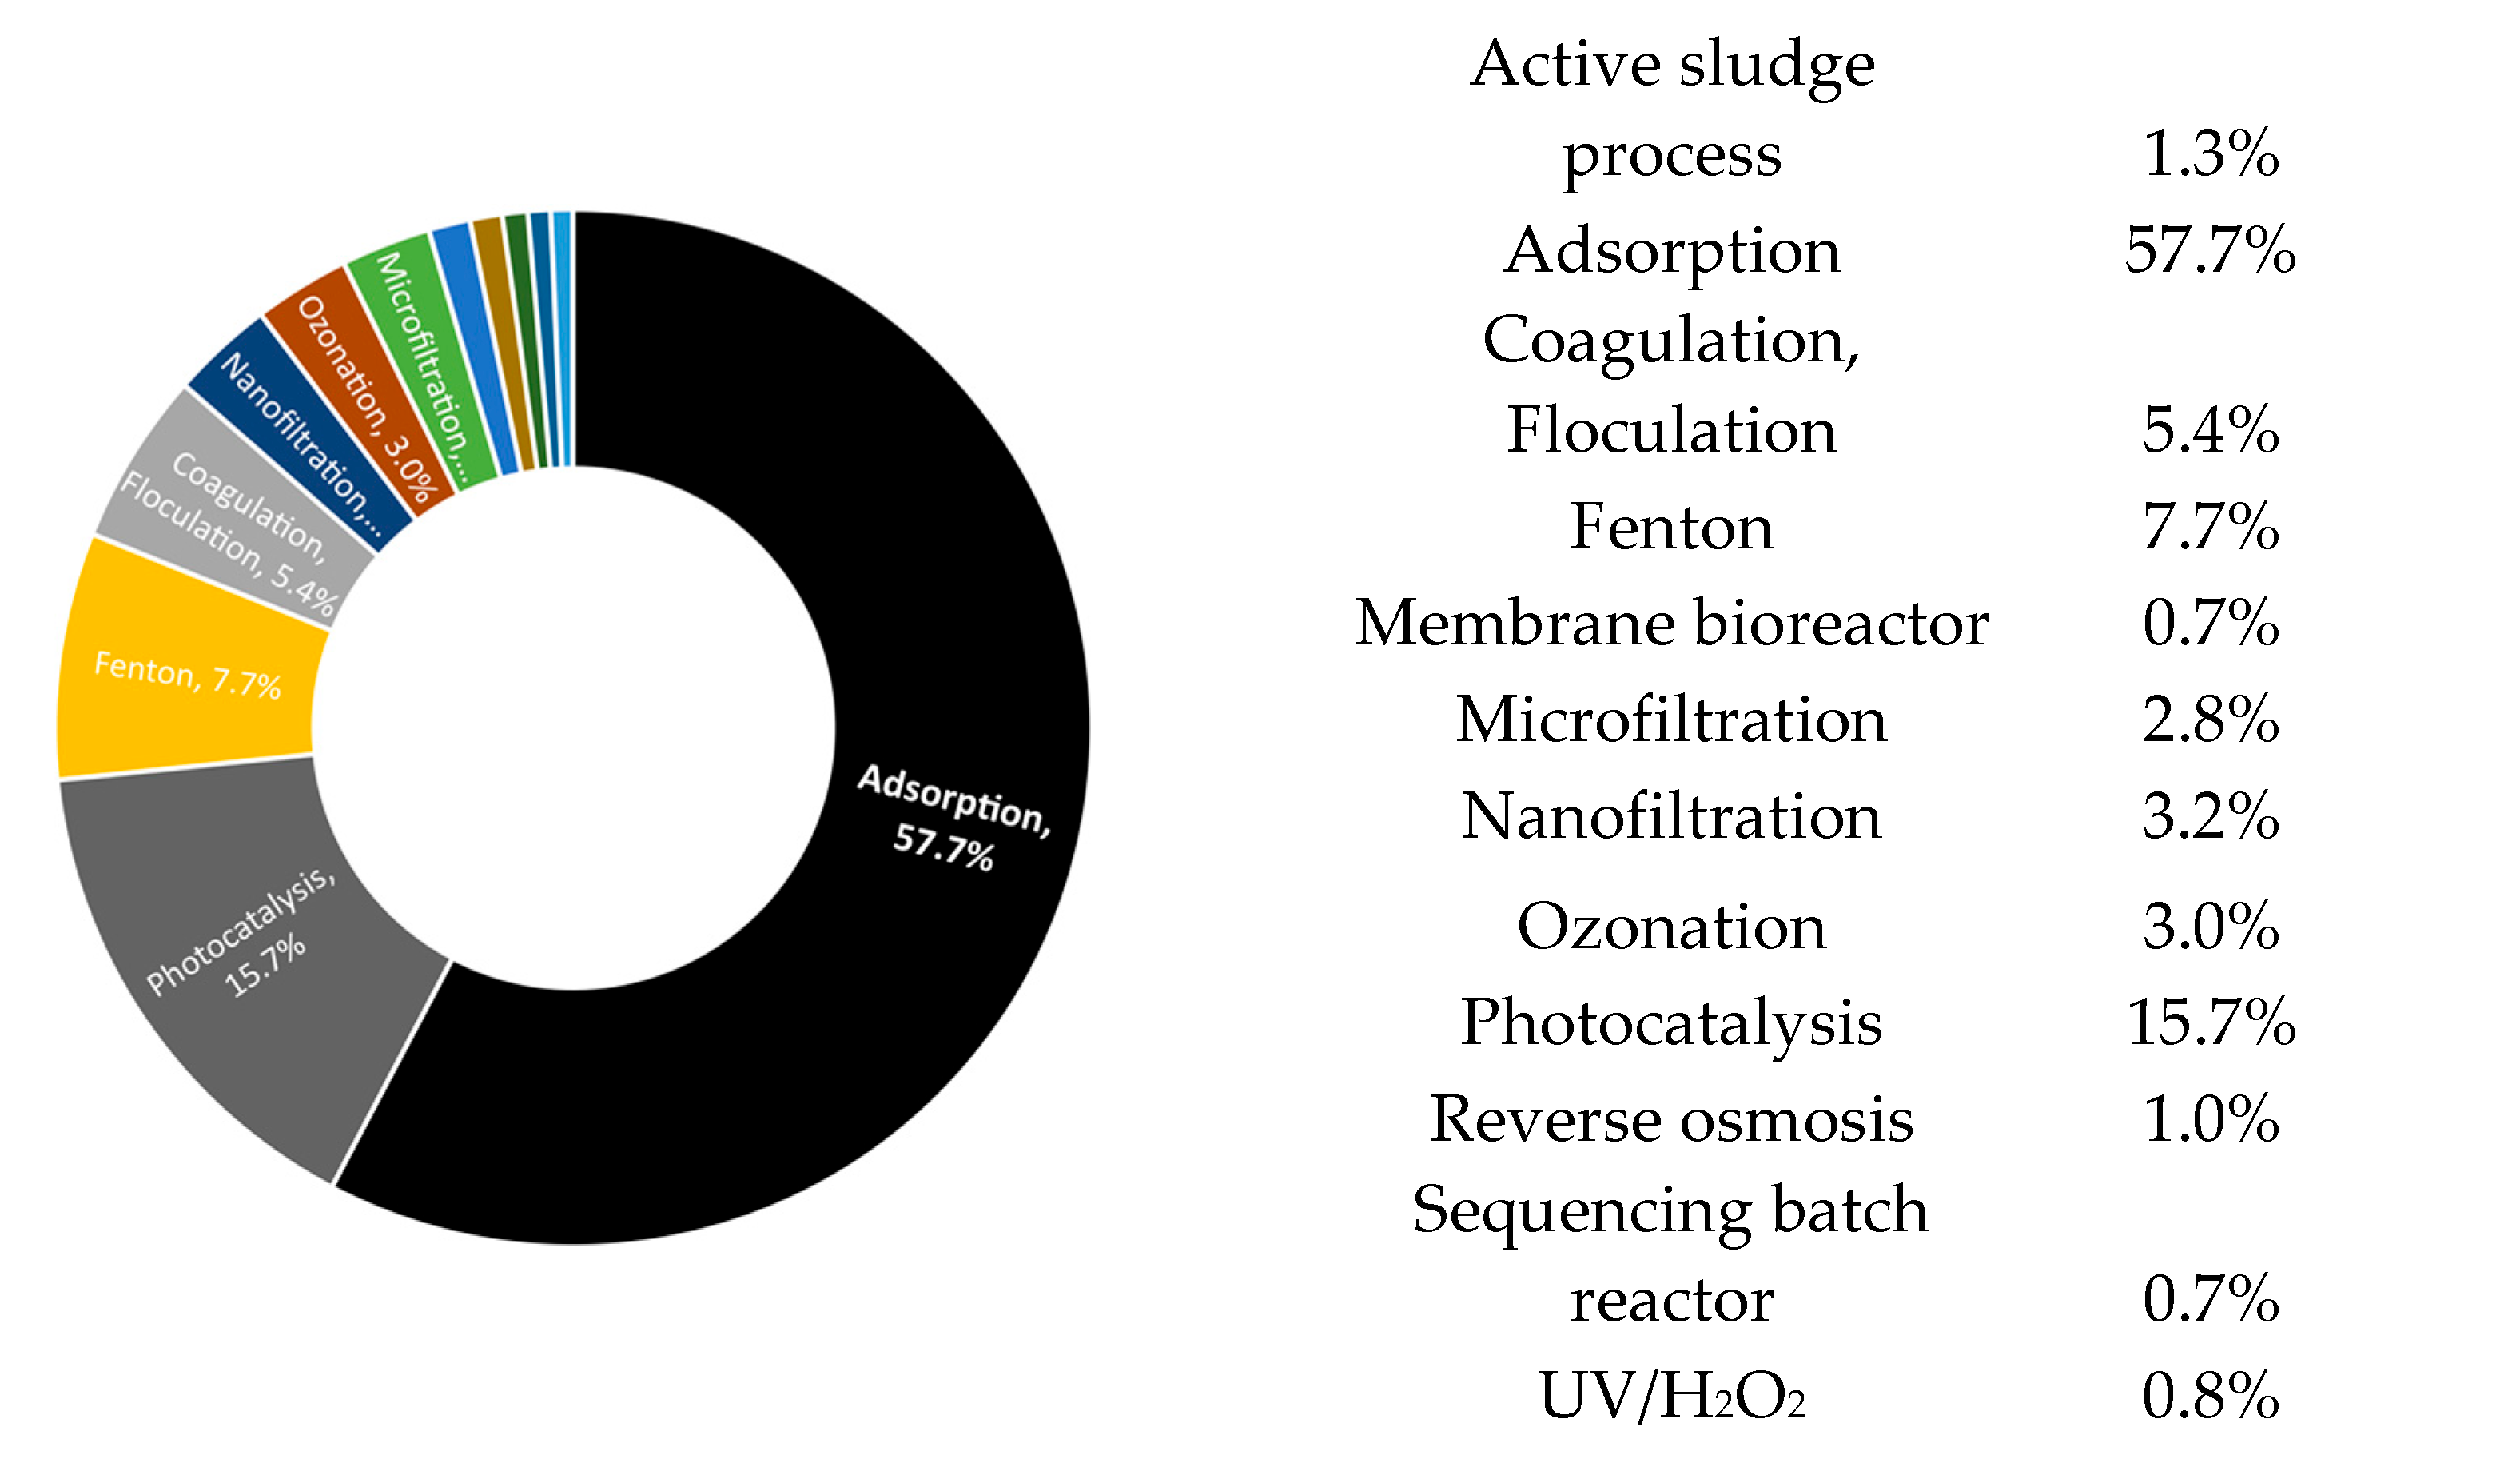
Figure 3.
Methylene blue adsorption mechanisms in biochar adapted from (Liu et al., 2022)).
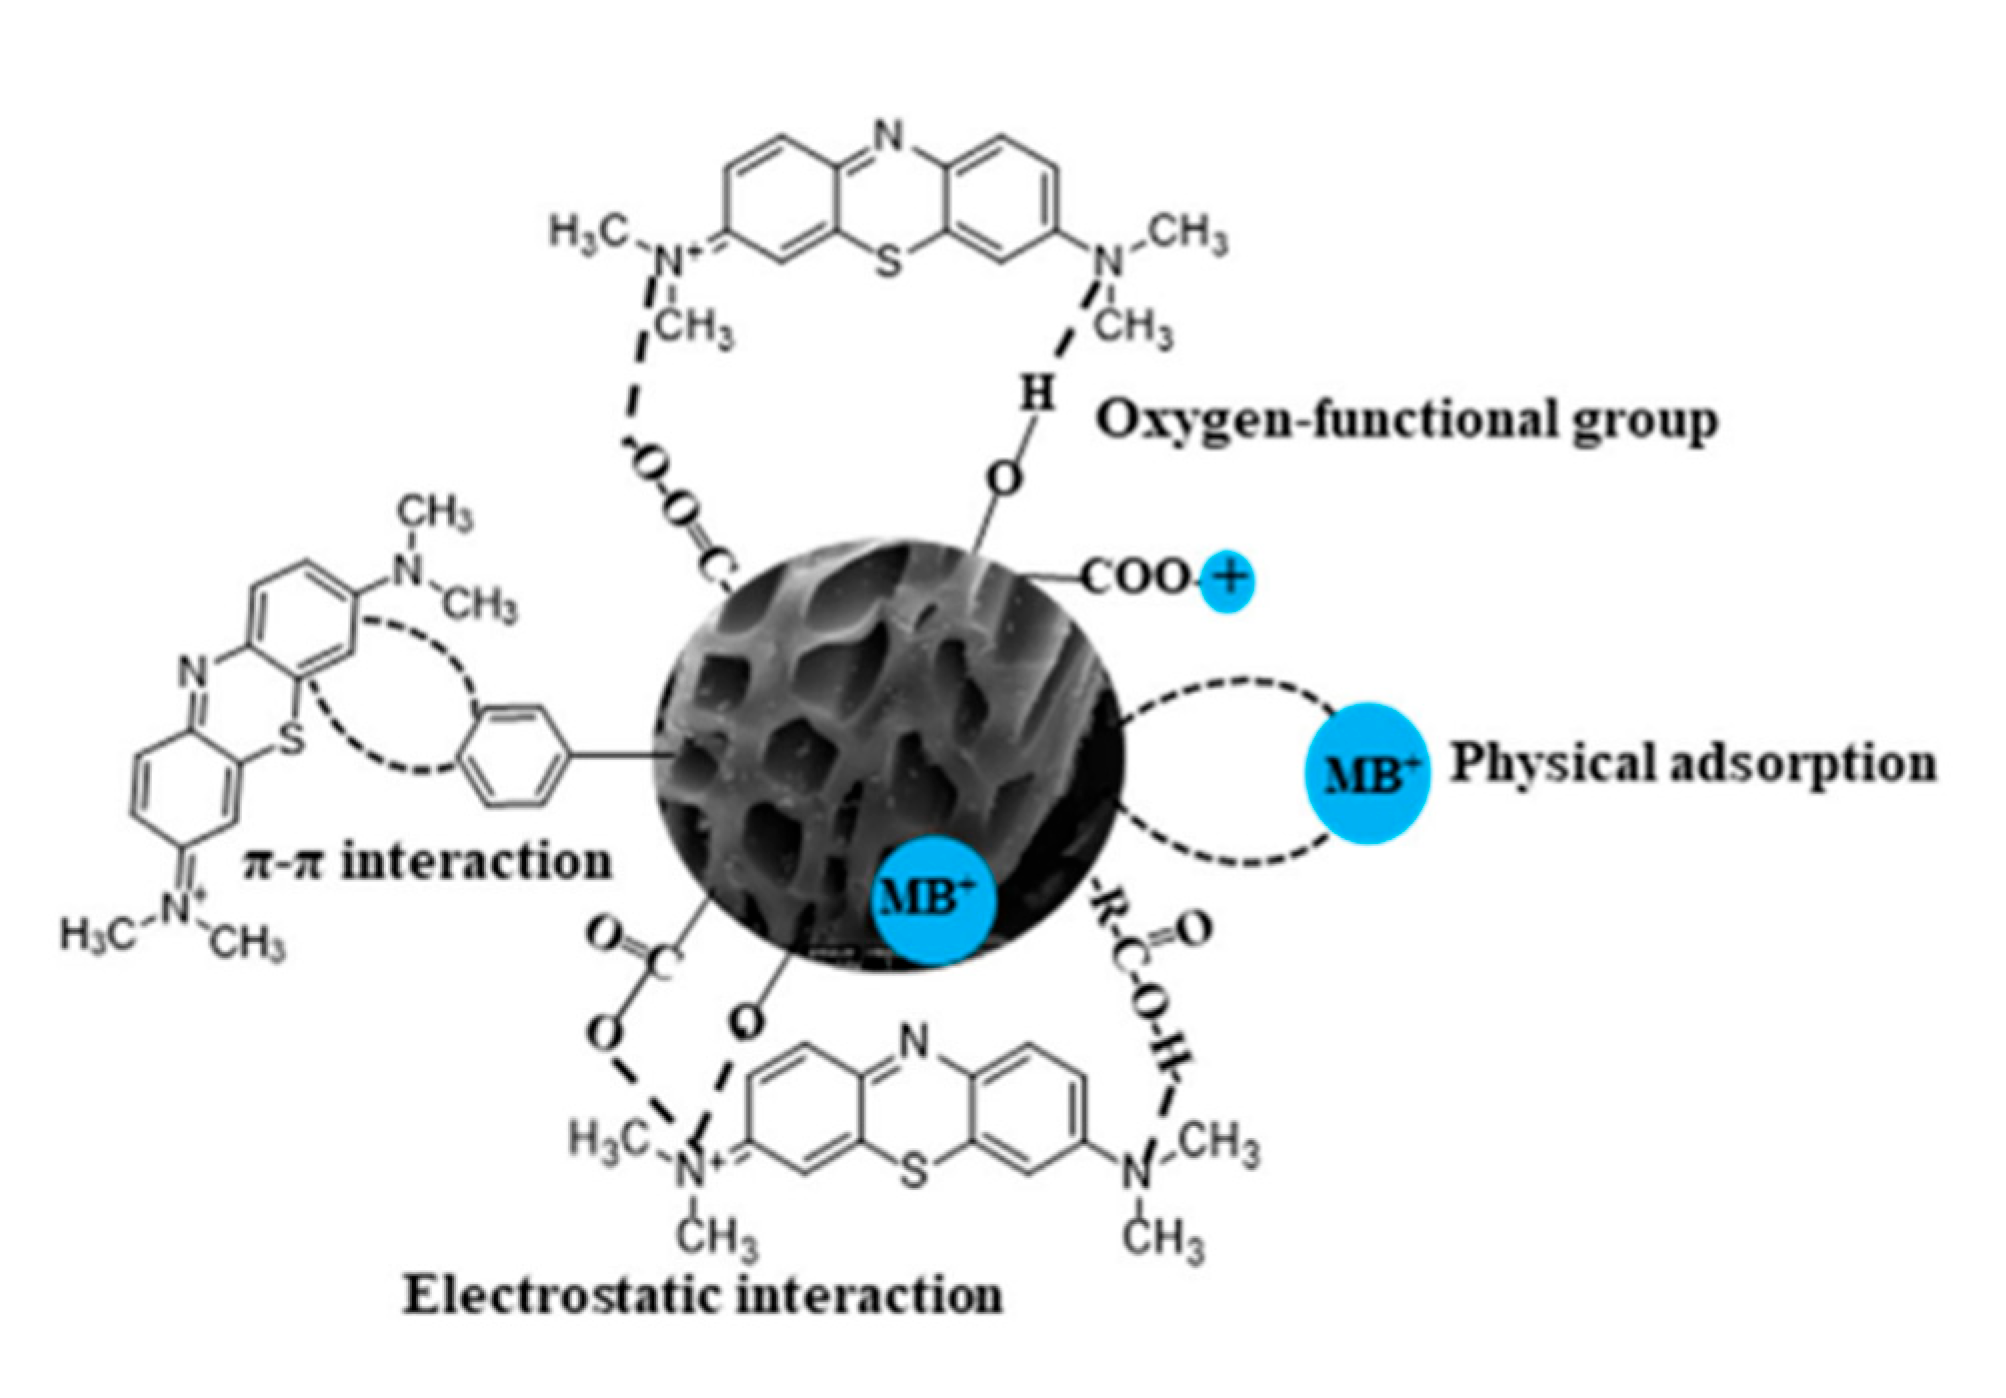
Figure 4.
Aluminium foil envelope for biomass carbonization.
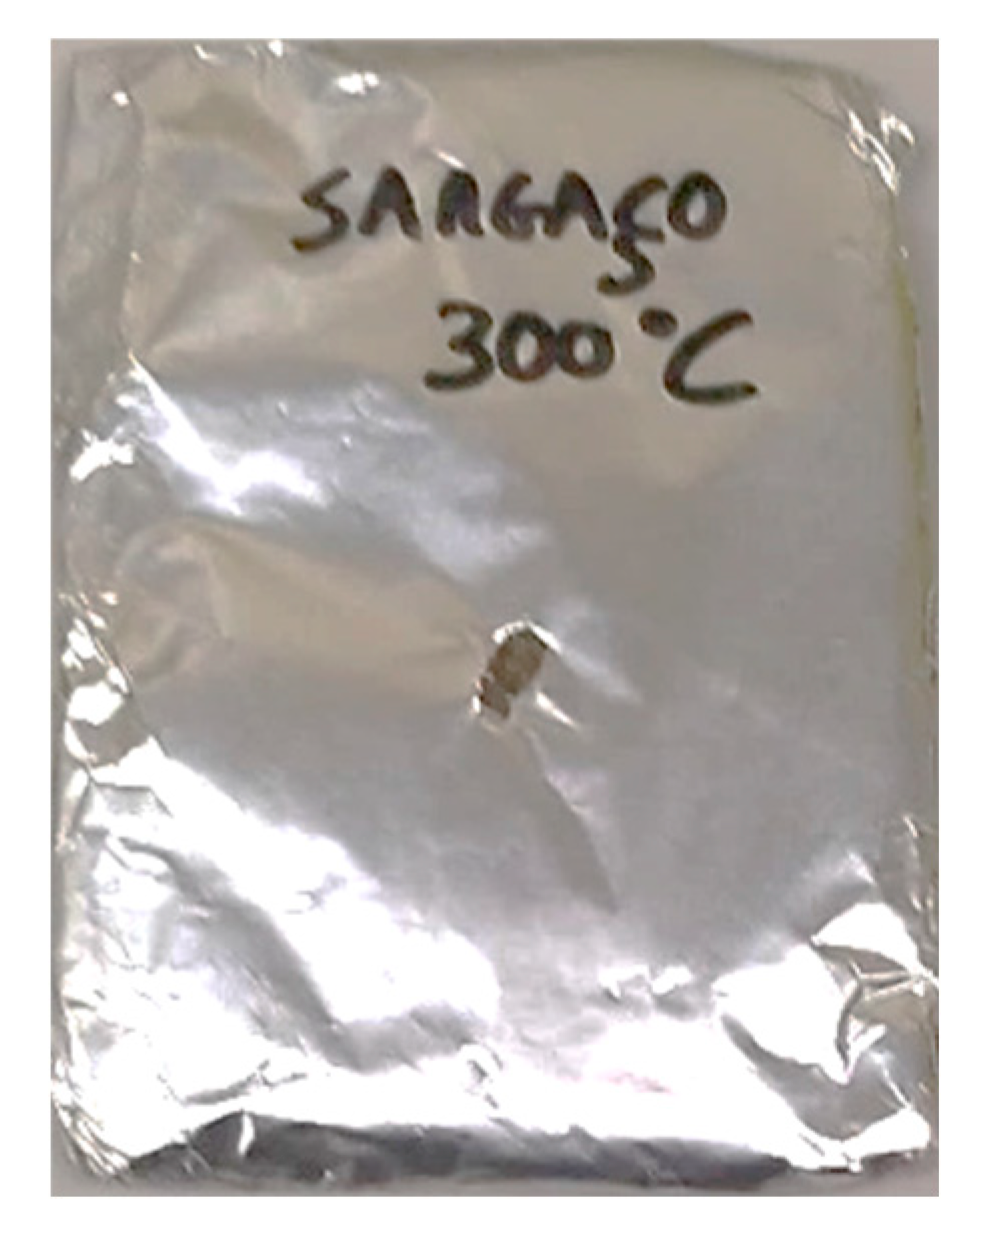
Figure 5.
UV-Vis spectra and calibration curve for methylene blue quantification.
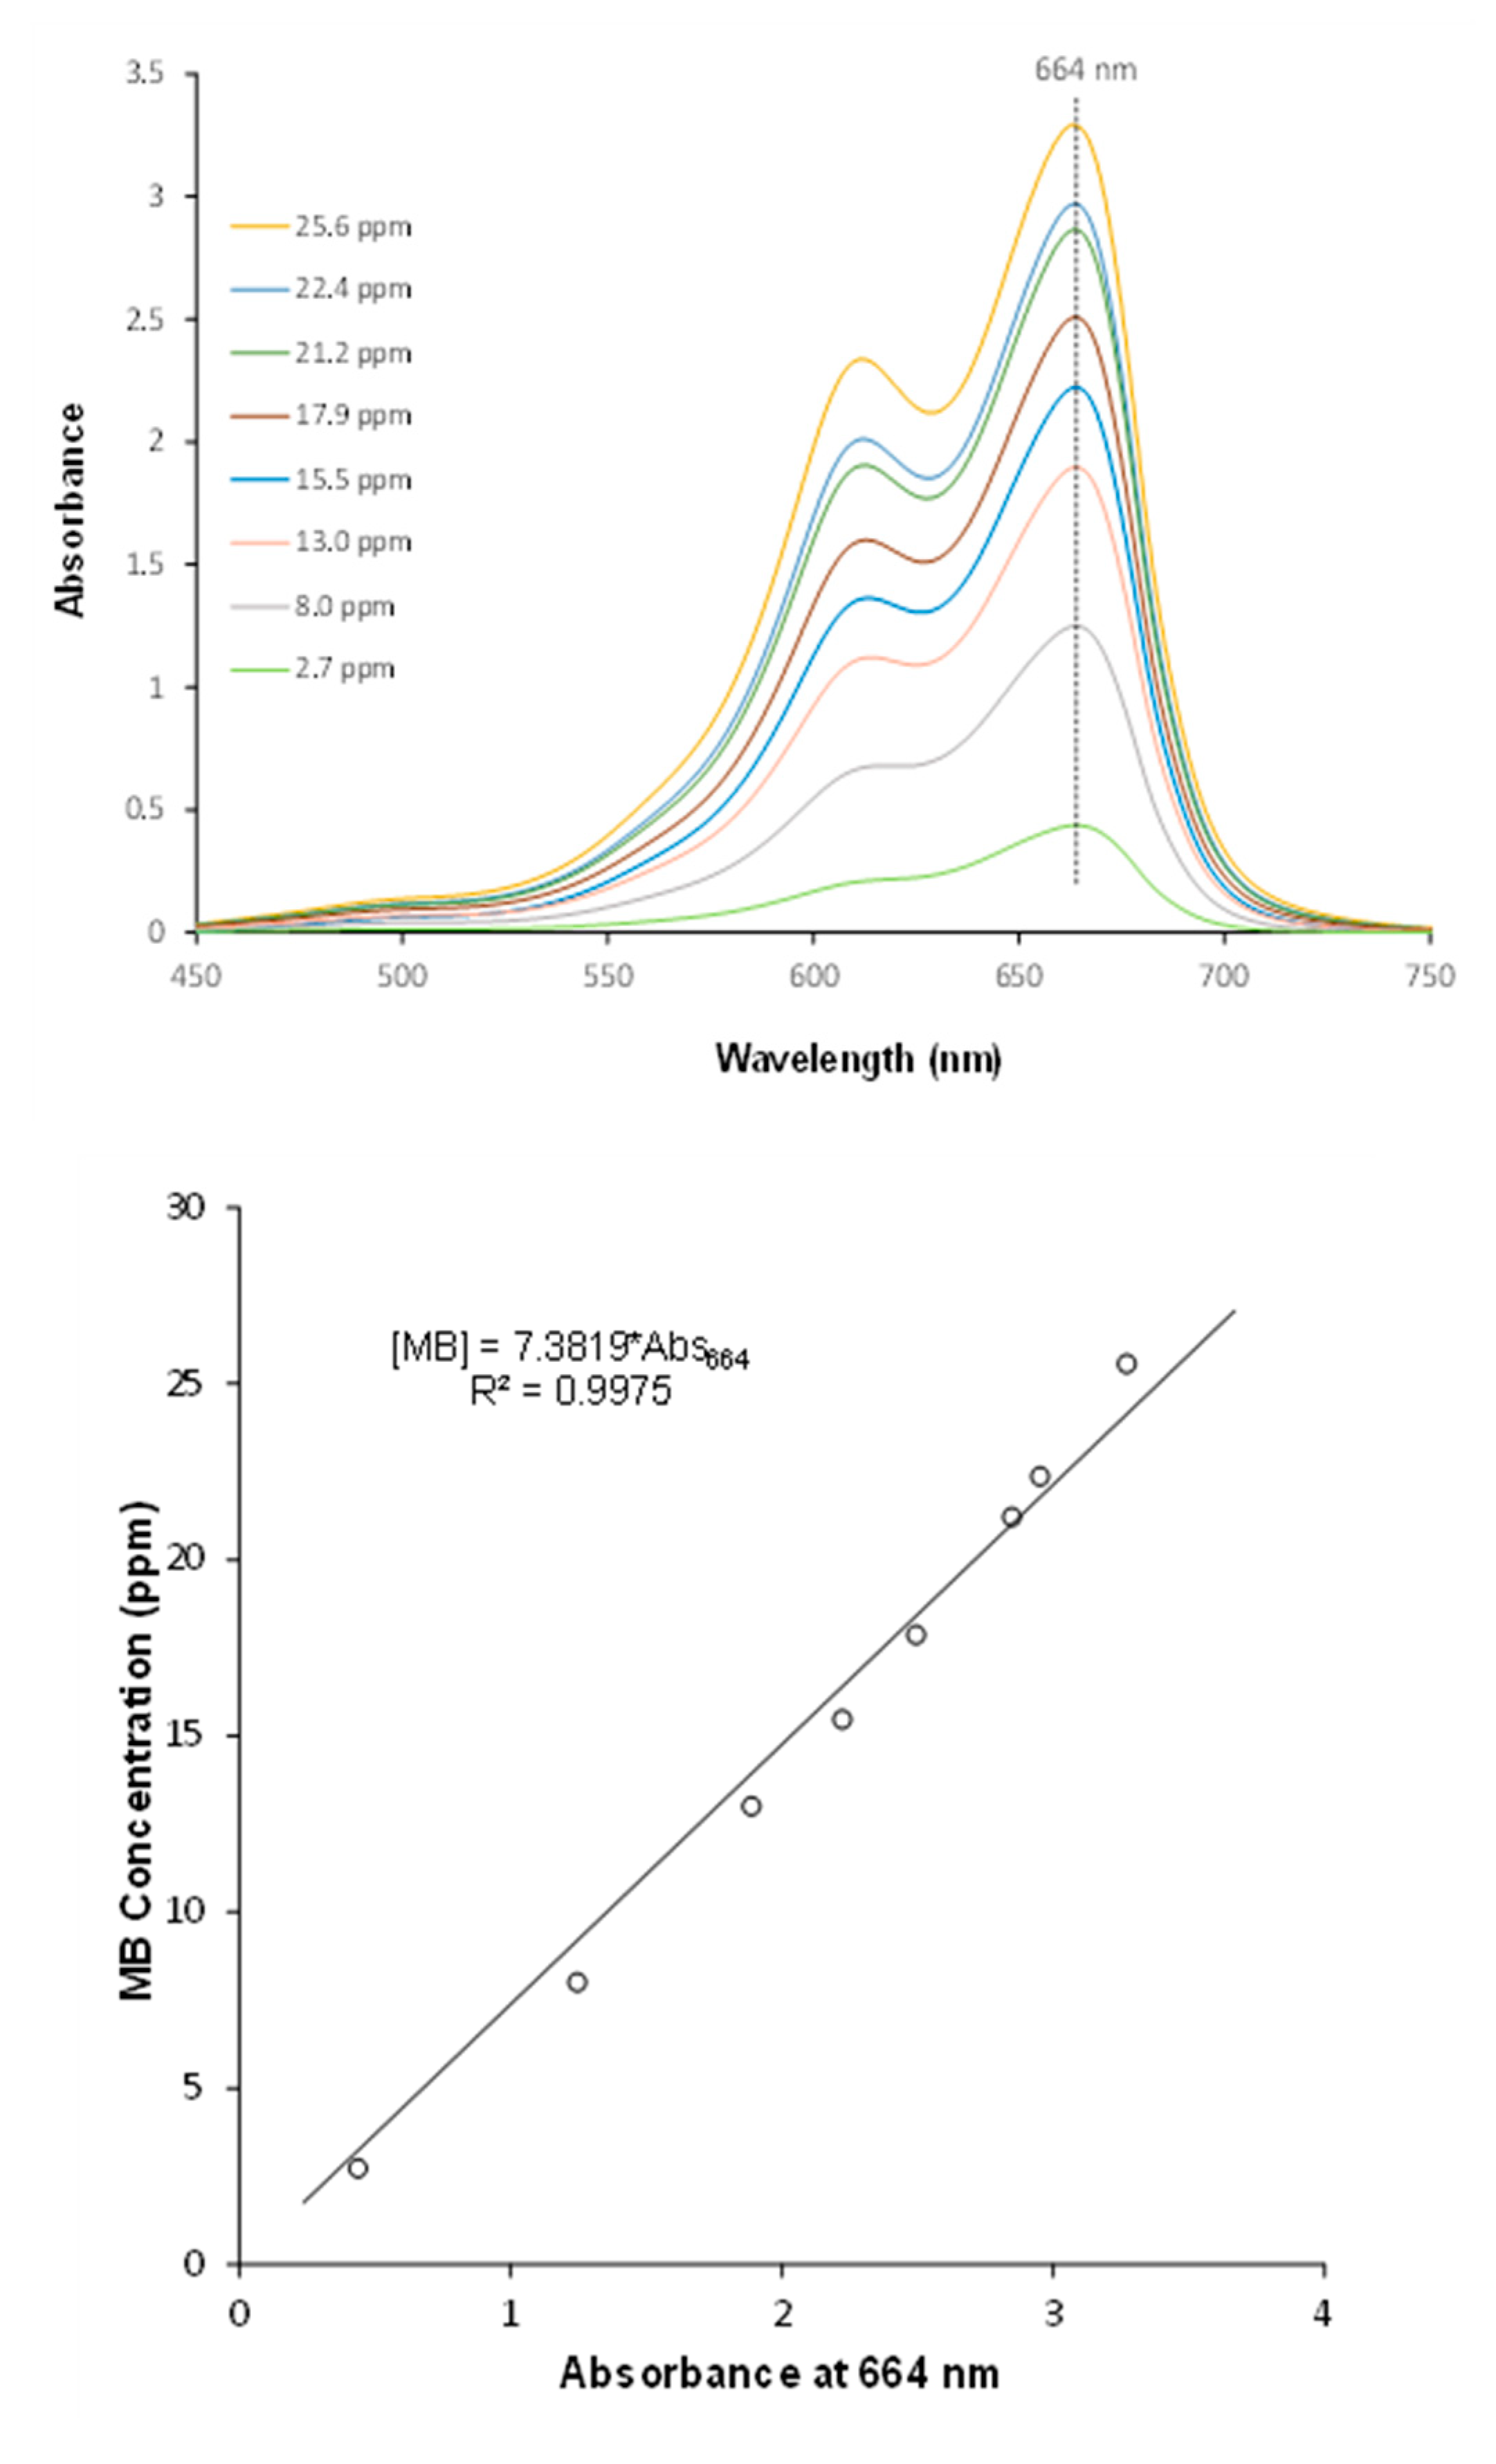
Figure 6.
Thermogram of sargaço under N2 flow with a heating rate of 20 °C/min.
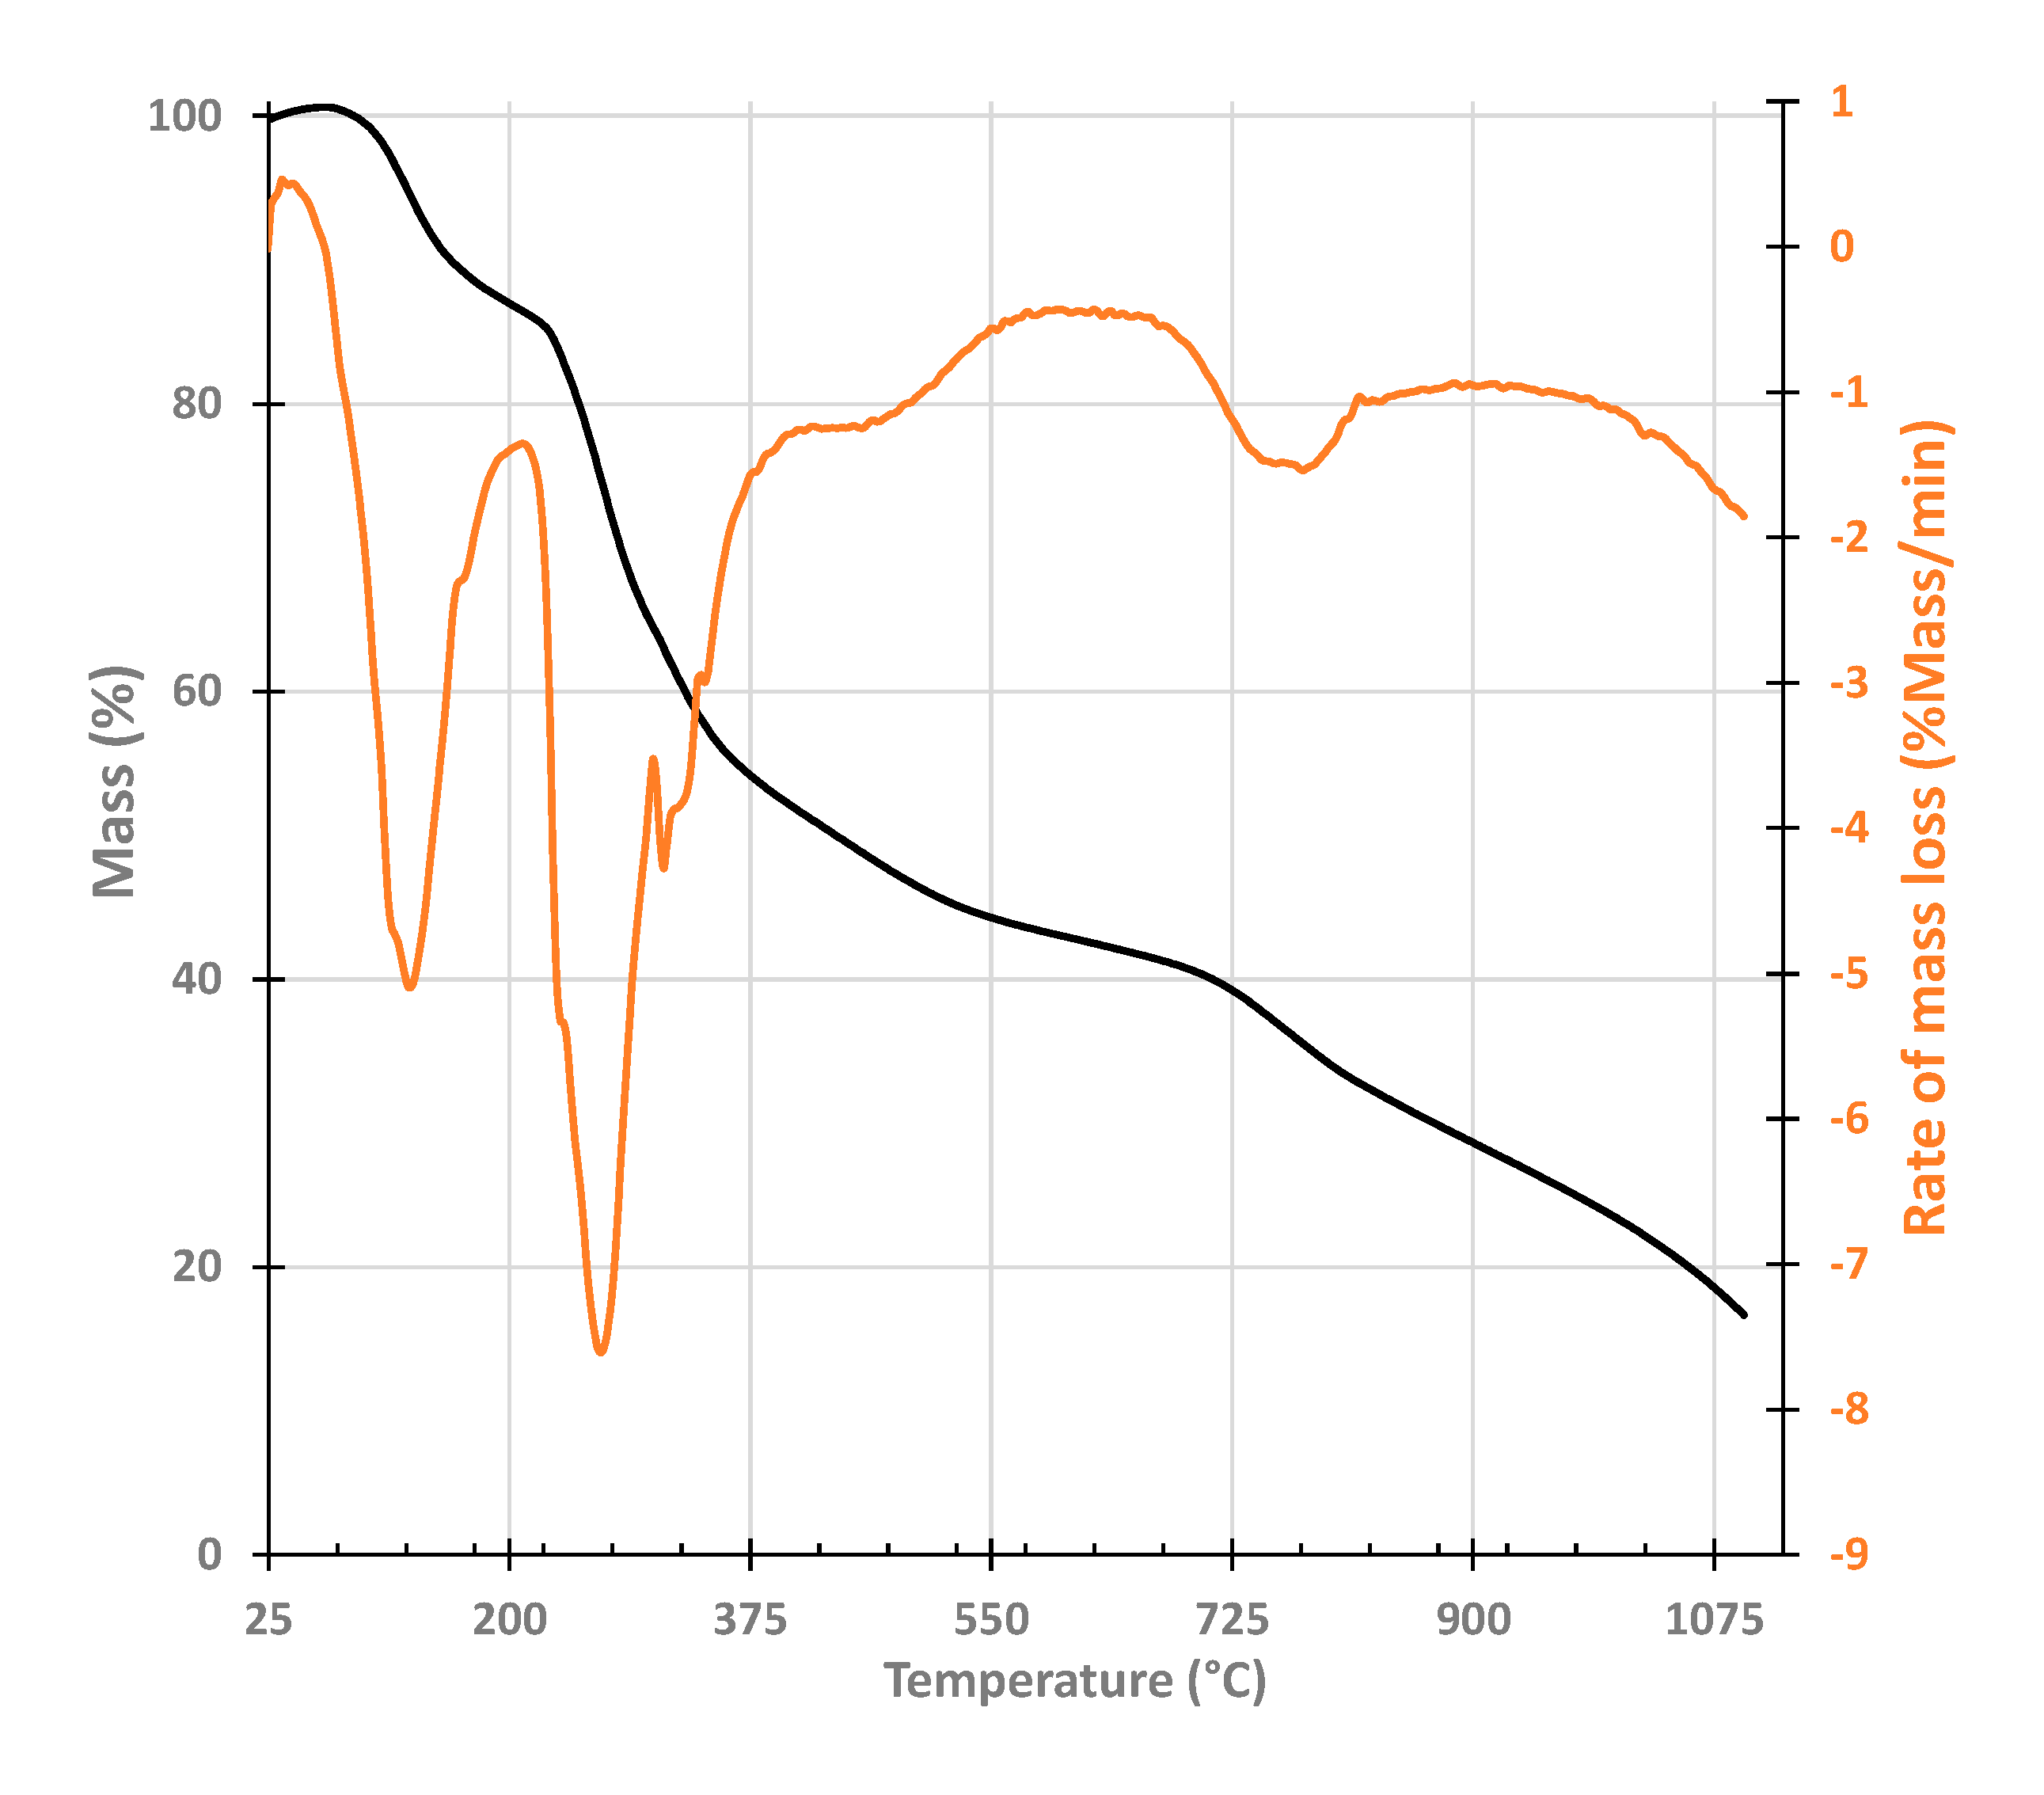
Figure 7.
XRF elemental analysis of raw biomass and non-washed and washed char materials.
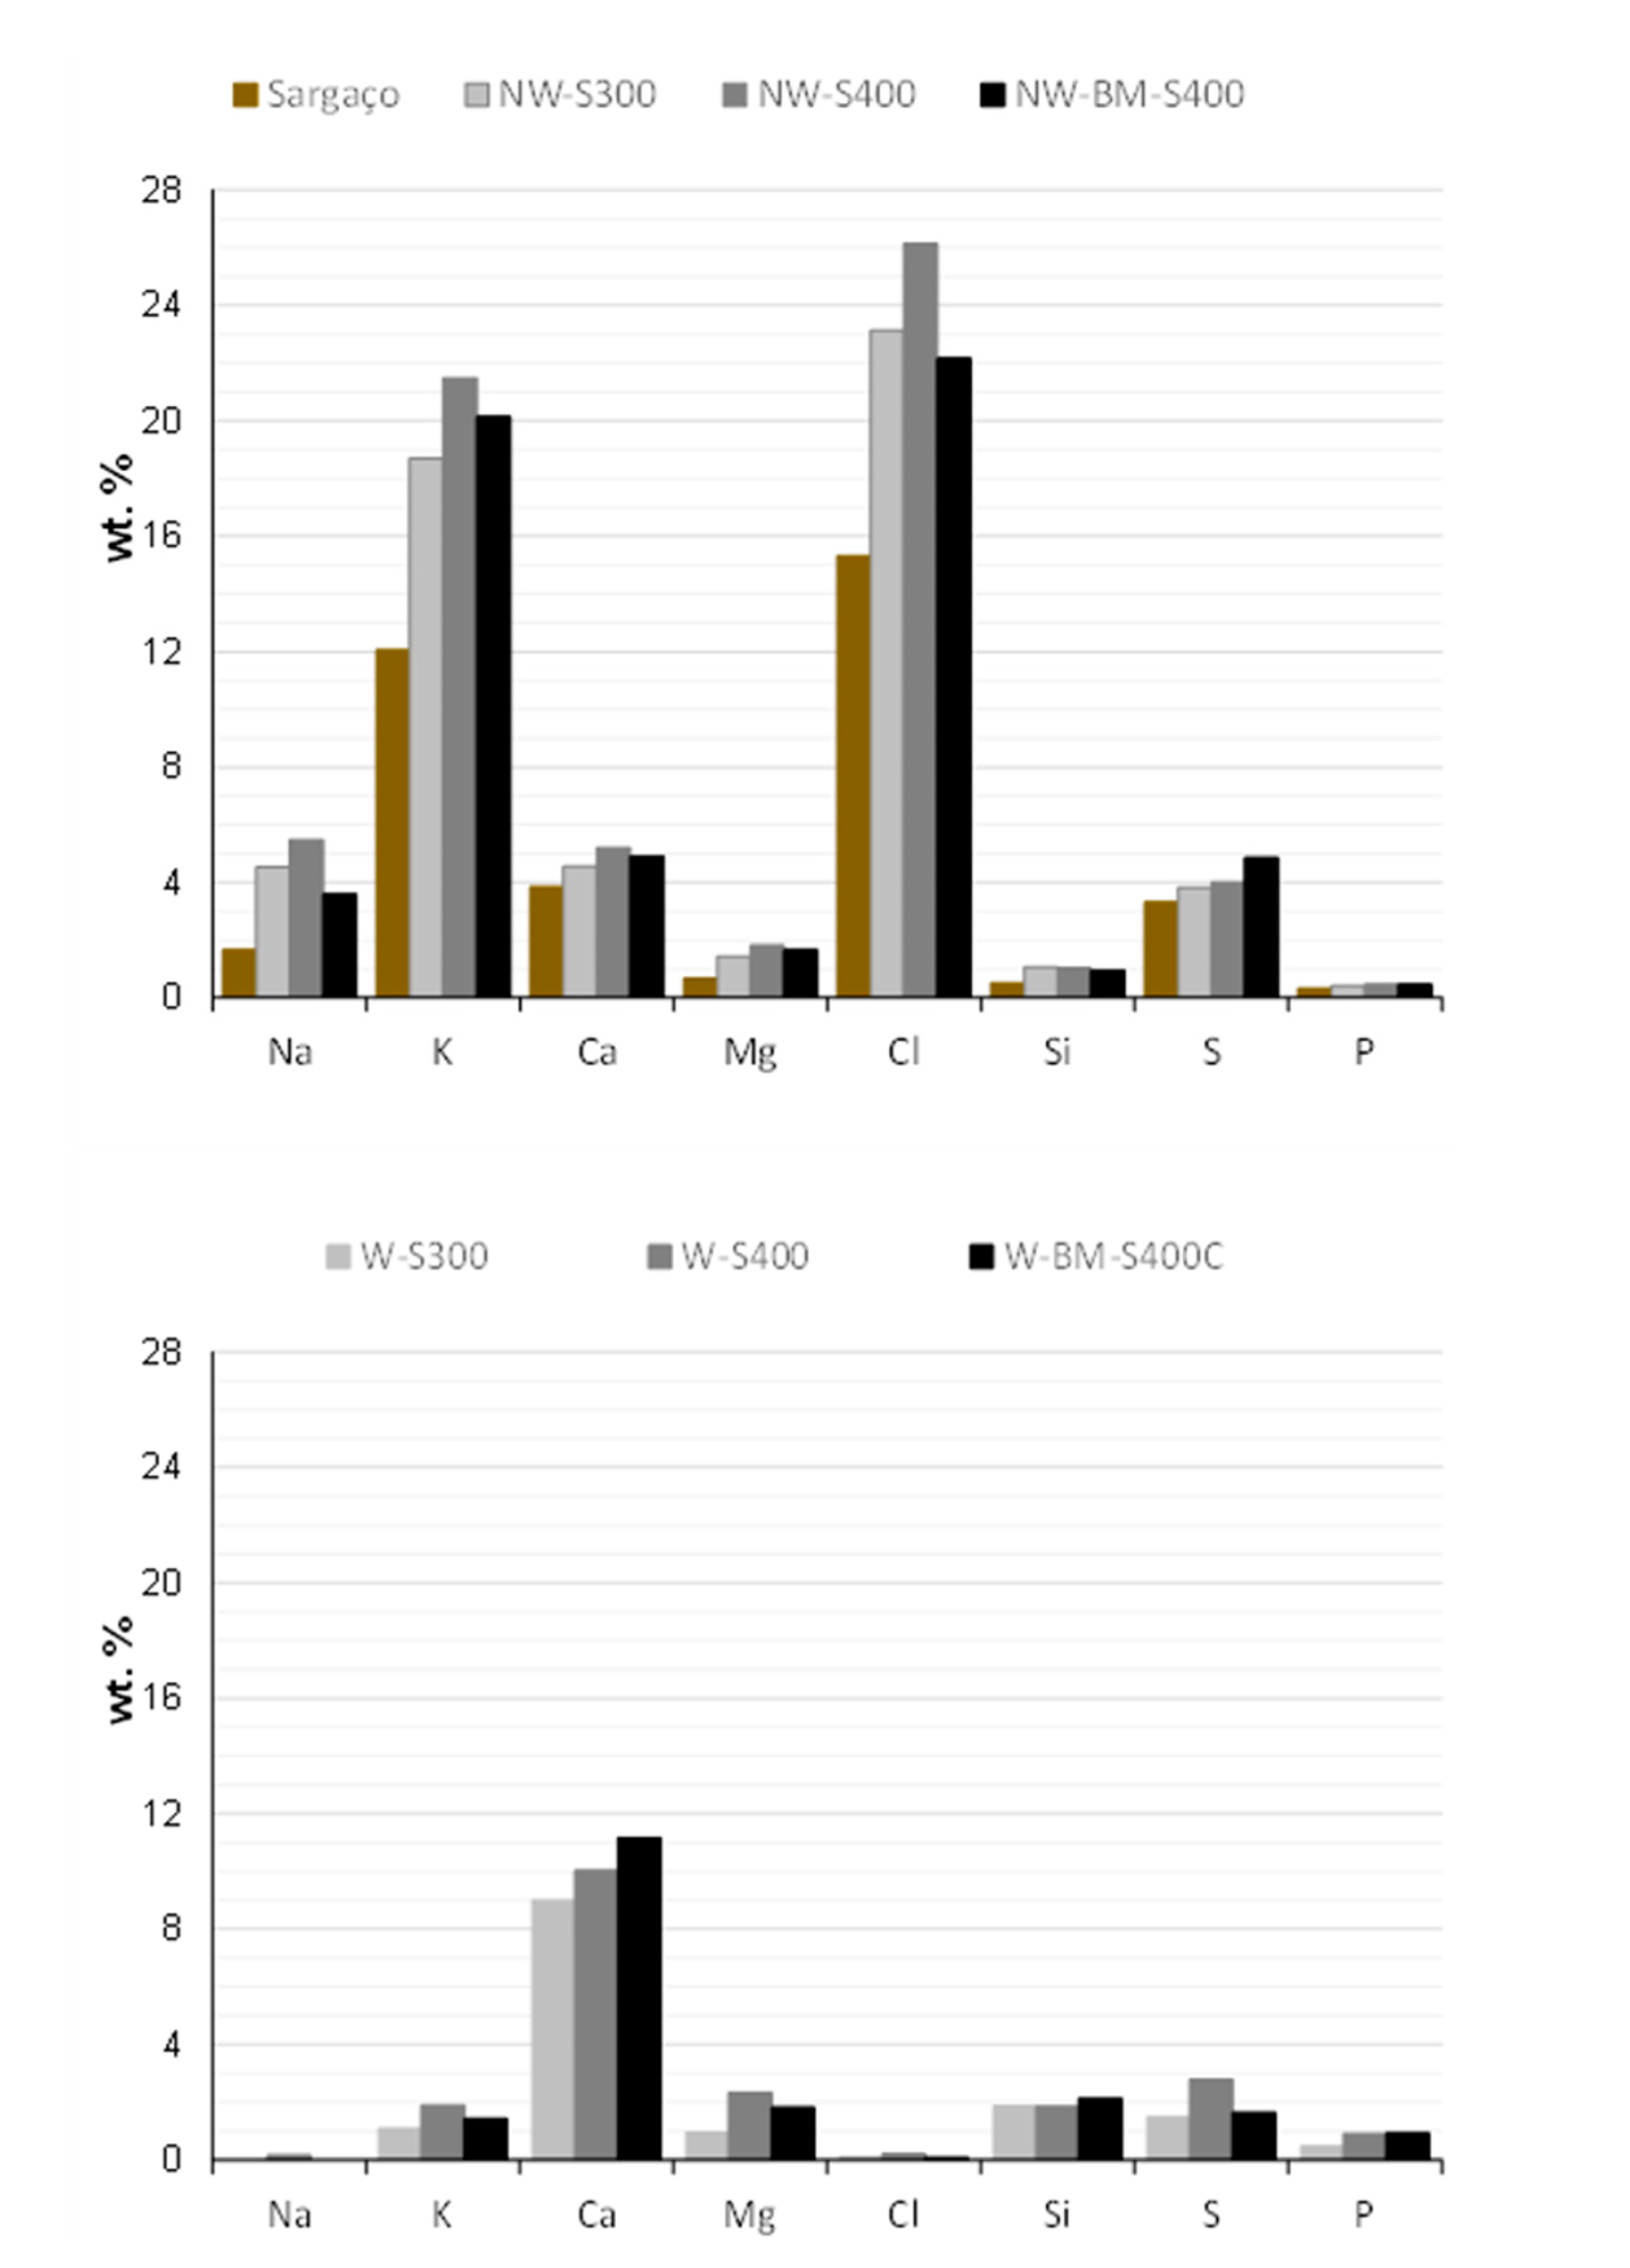
Figure 8.
Inorganics in washed and non-washed biochar assessed by EDS.
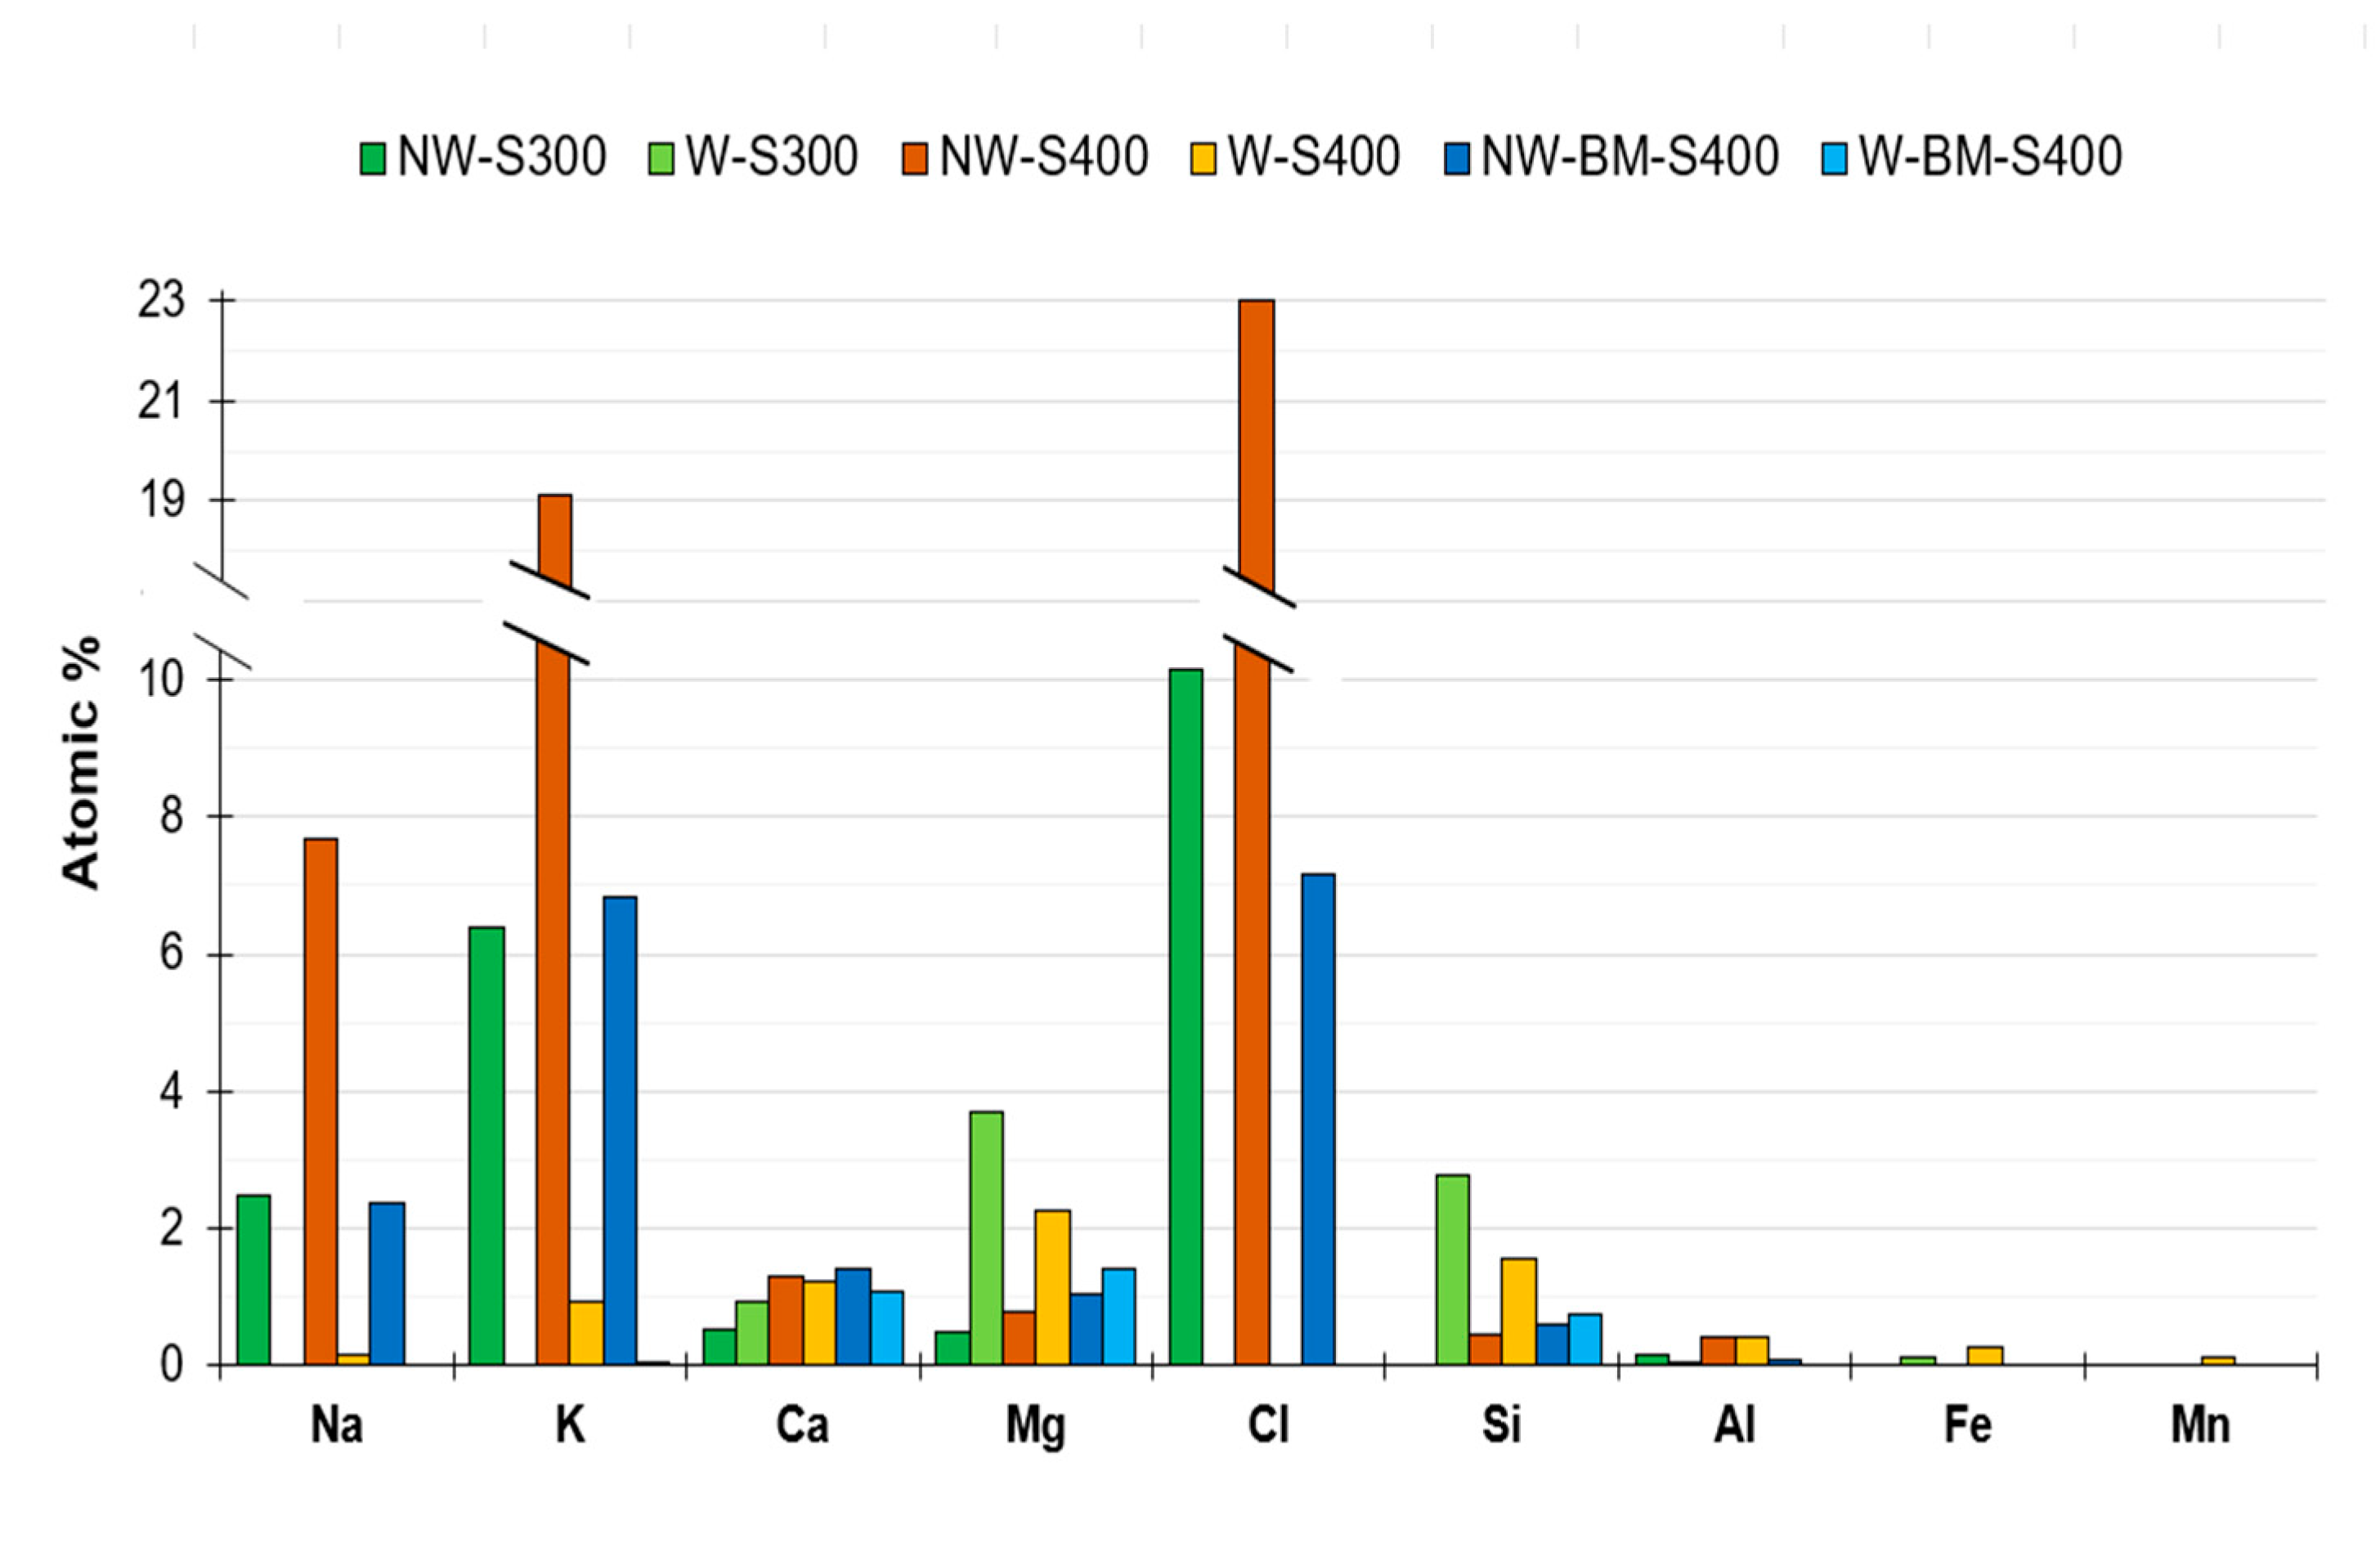
Figure 9.
Van Krevelen diagram of raw biomass and prepared biochars.
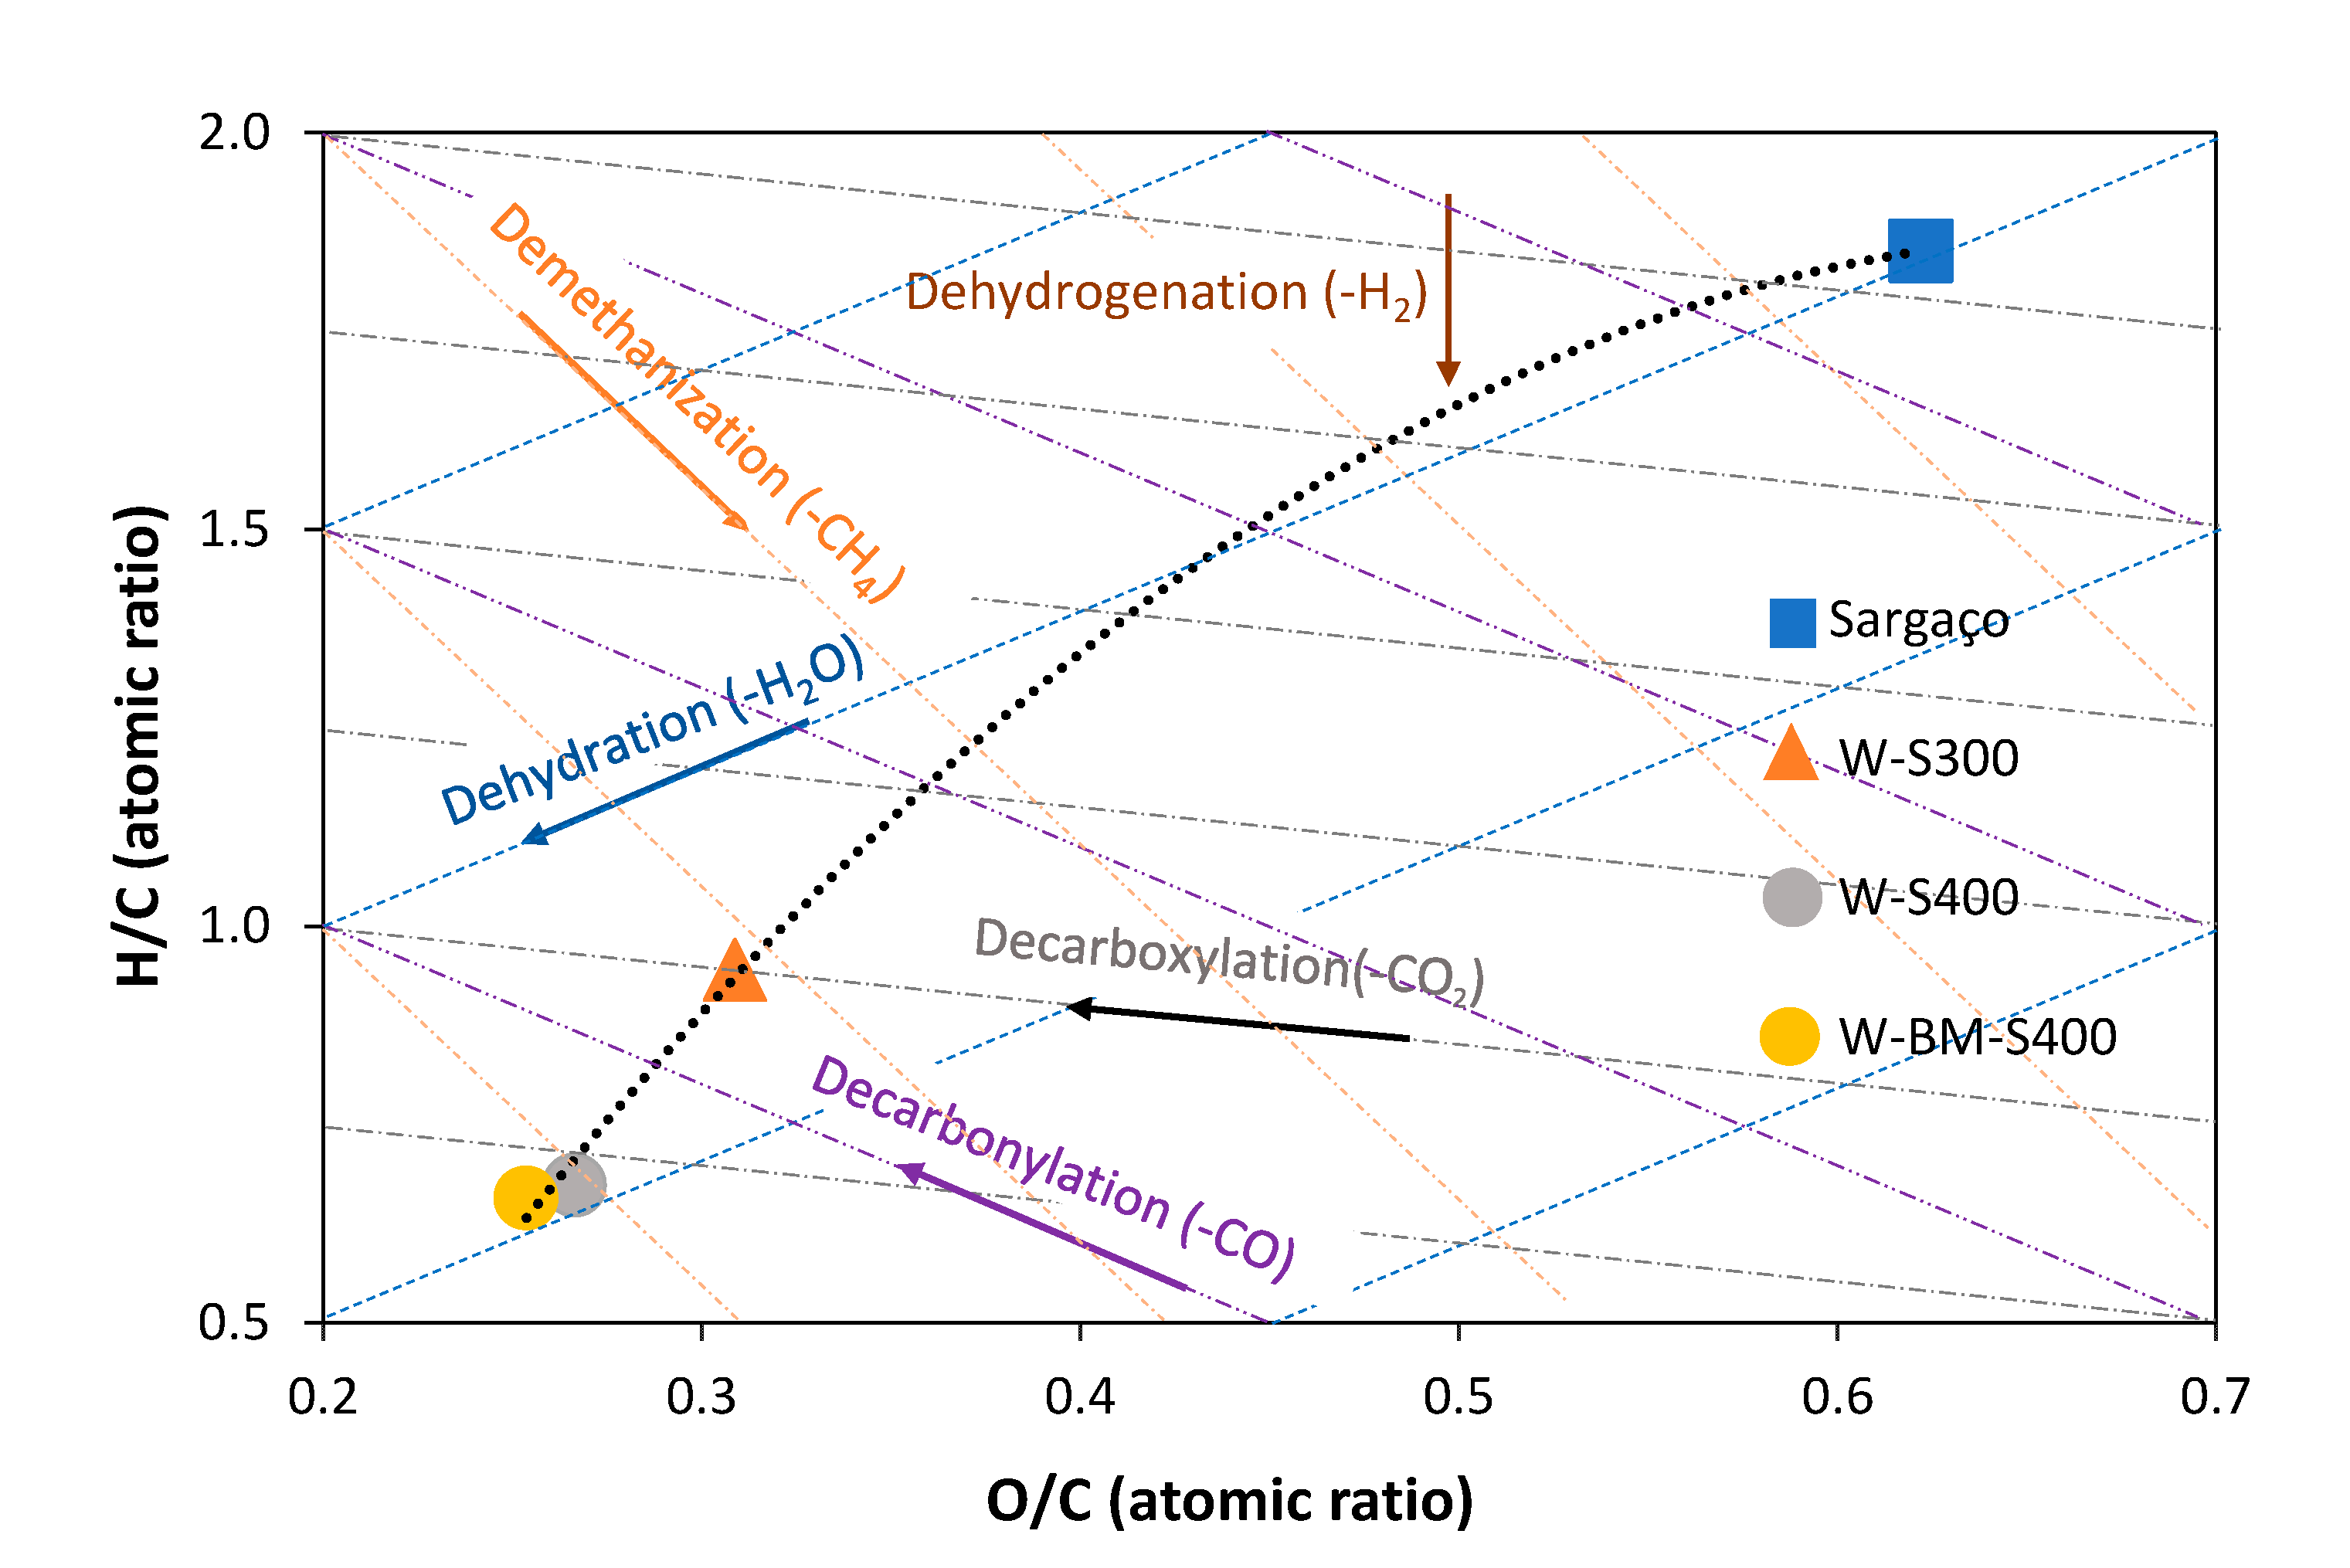
Figure 10.
SEM micrographs of sargaço and washed and non-washed chars.
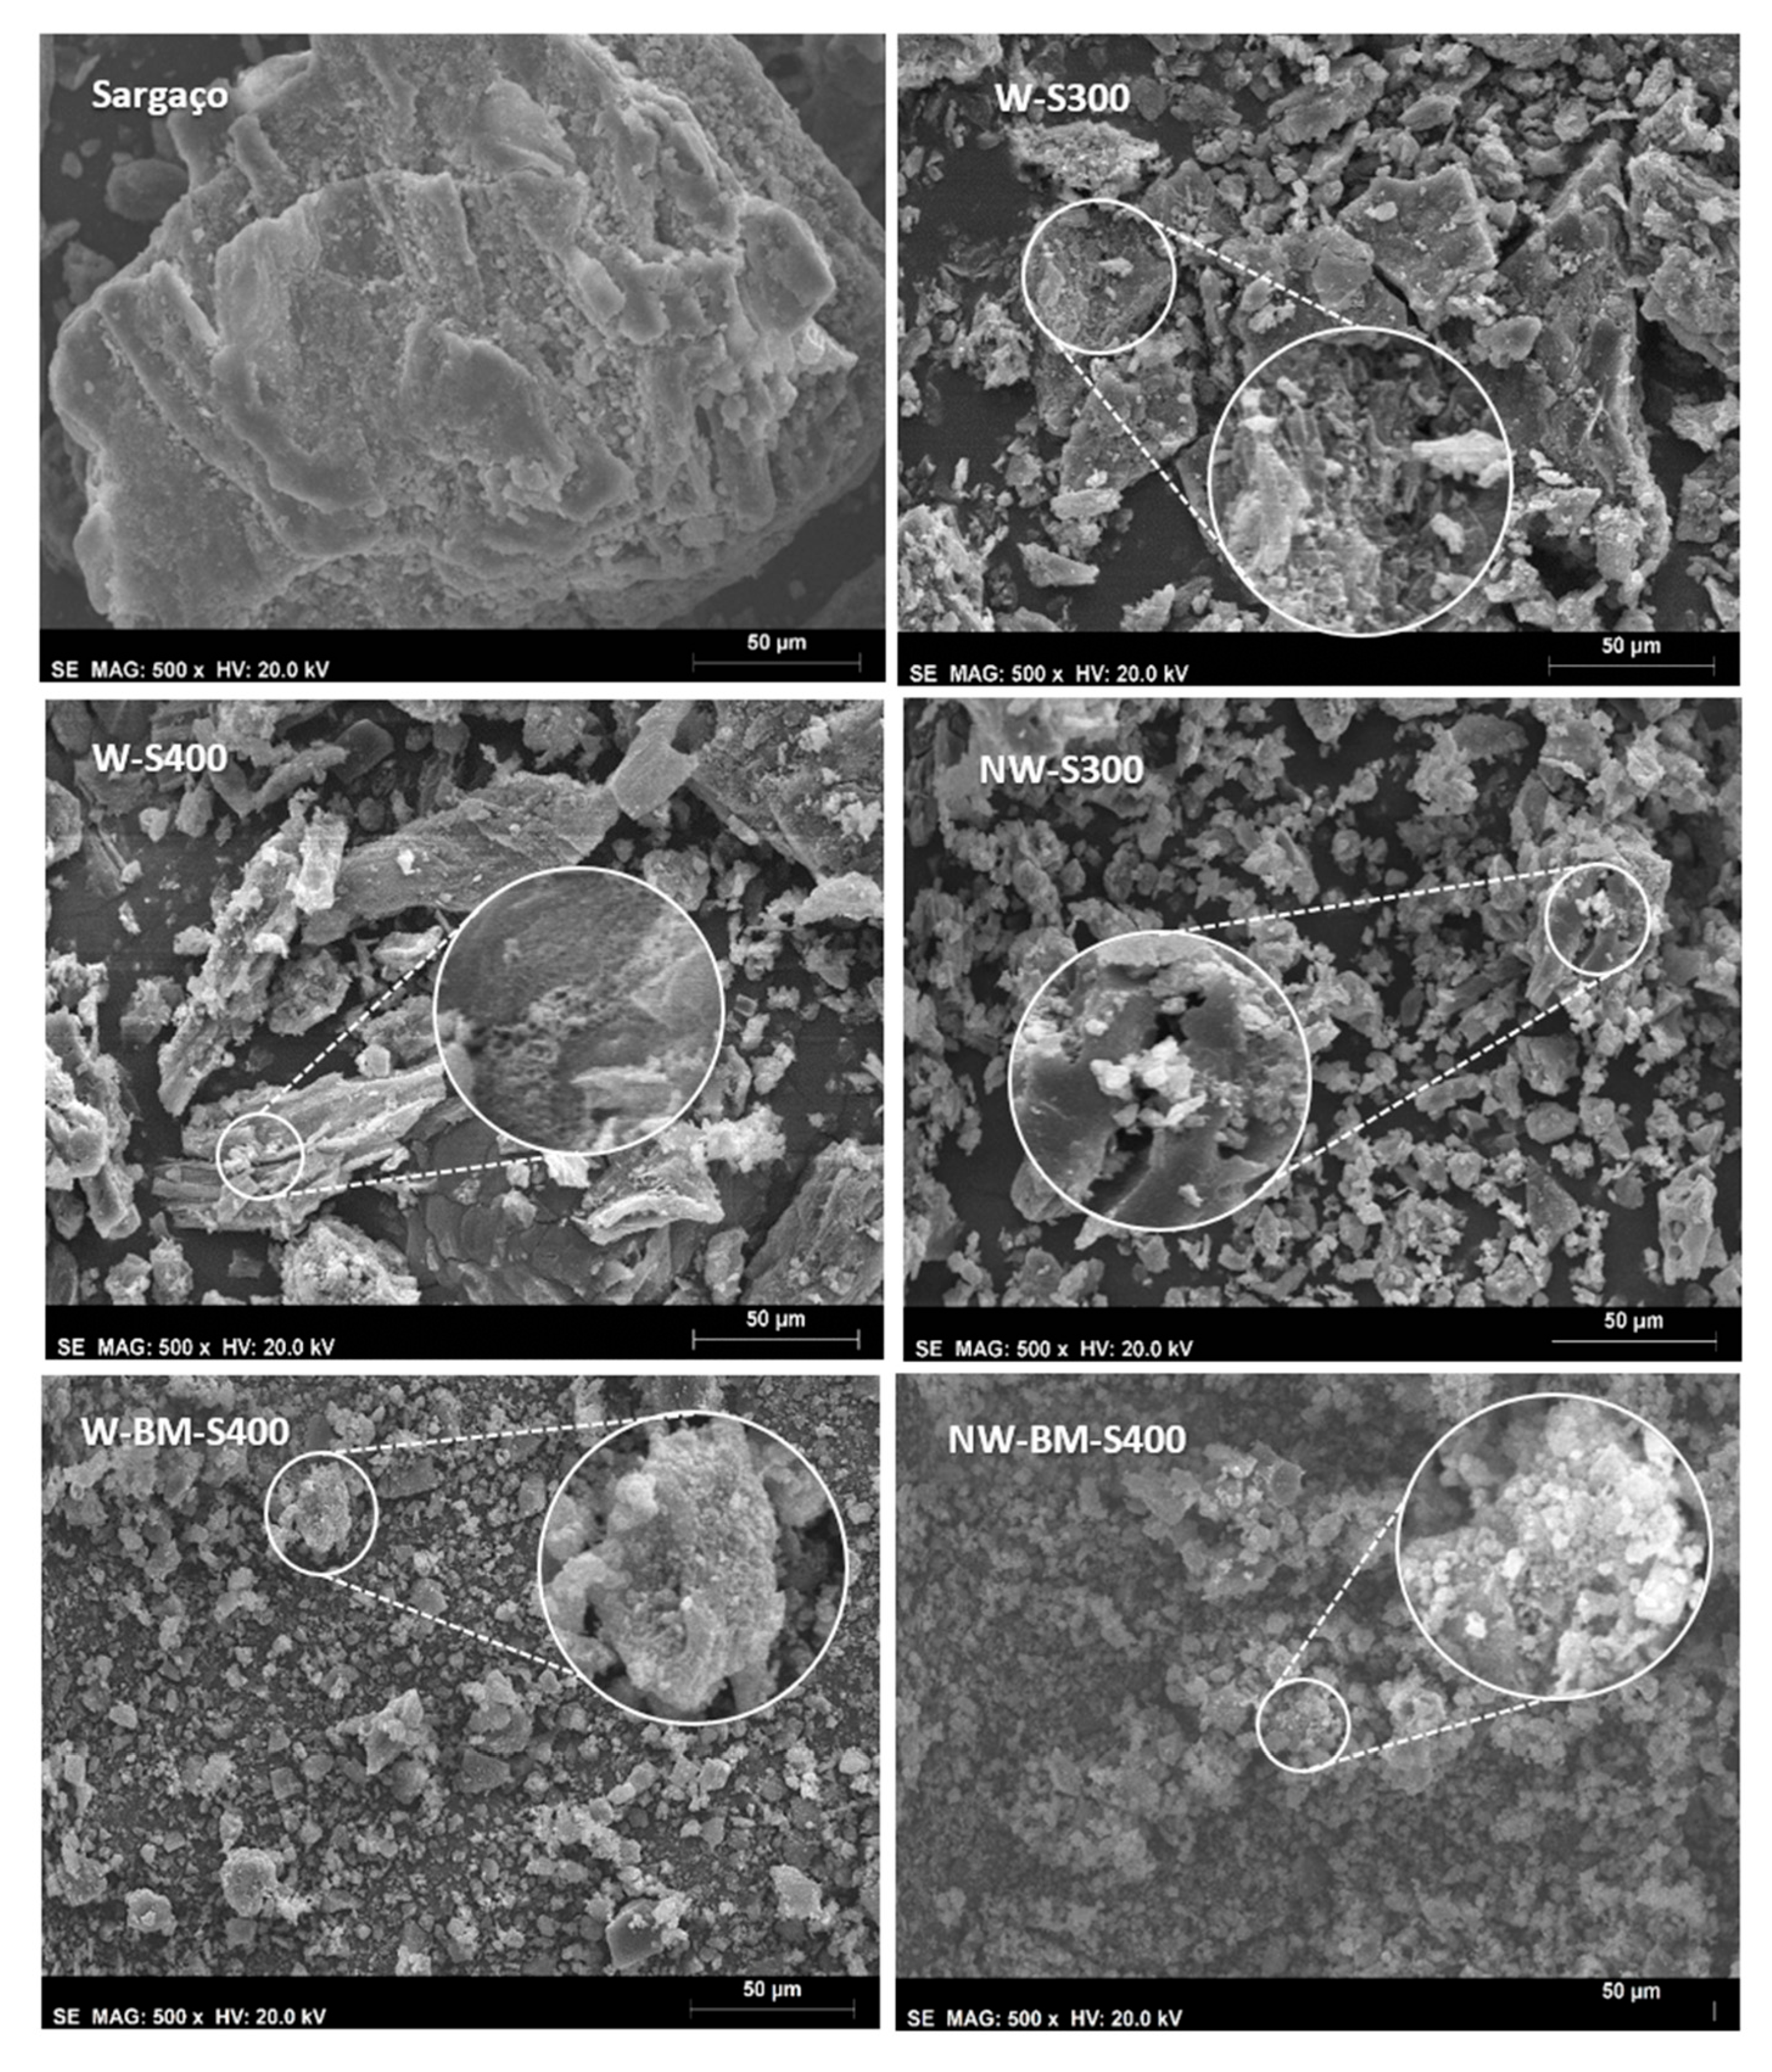
Figure 11.
XRD patterns of washed and non-washed chars and raw biomass (sargaço).
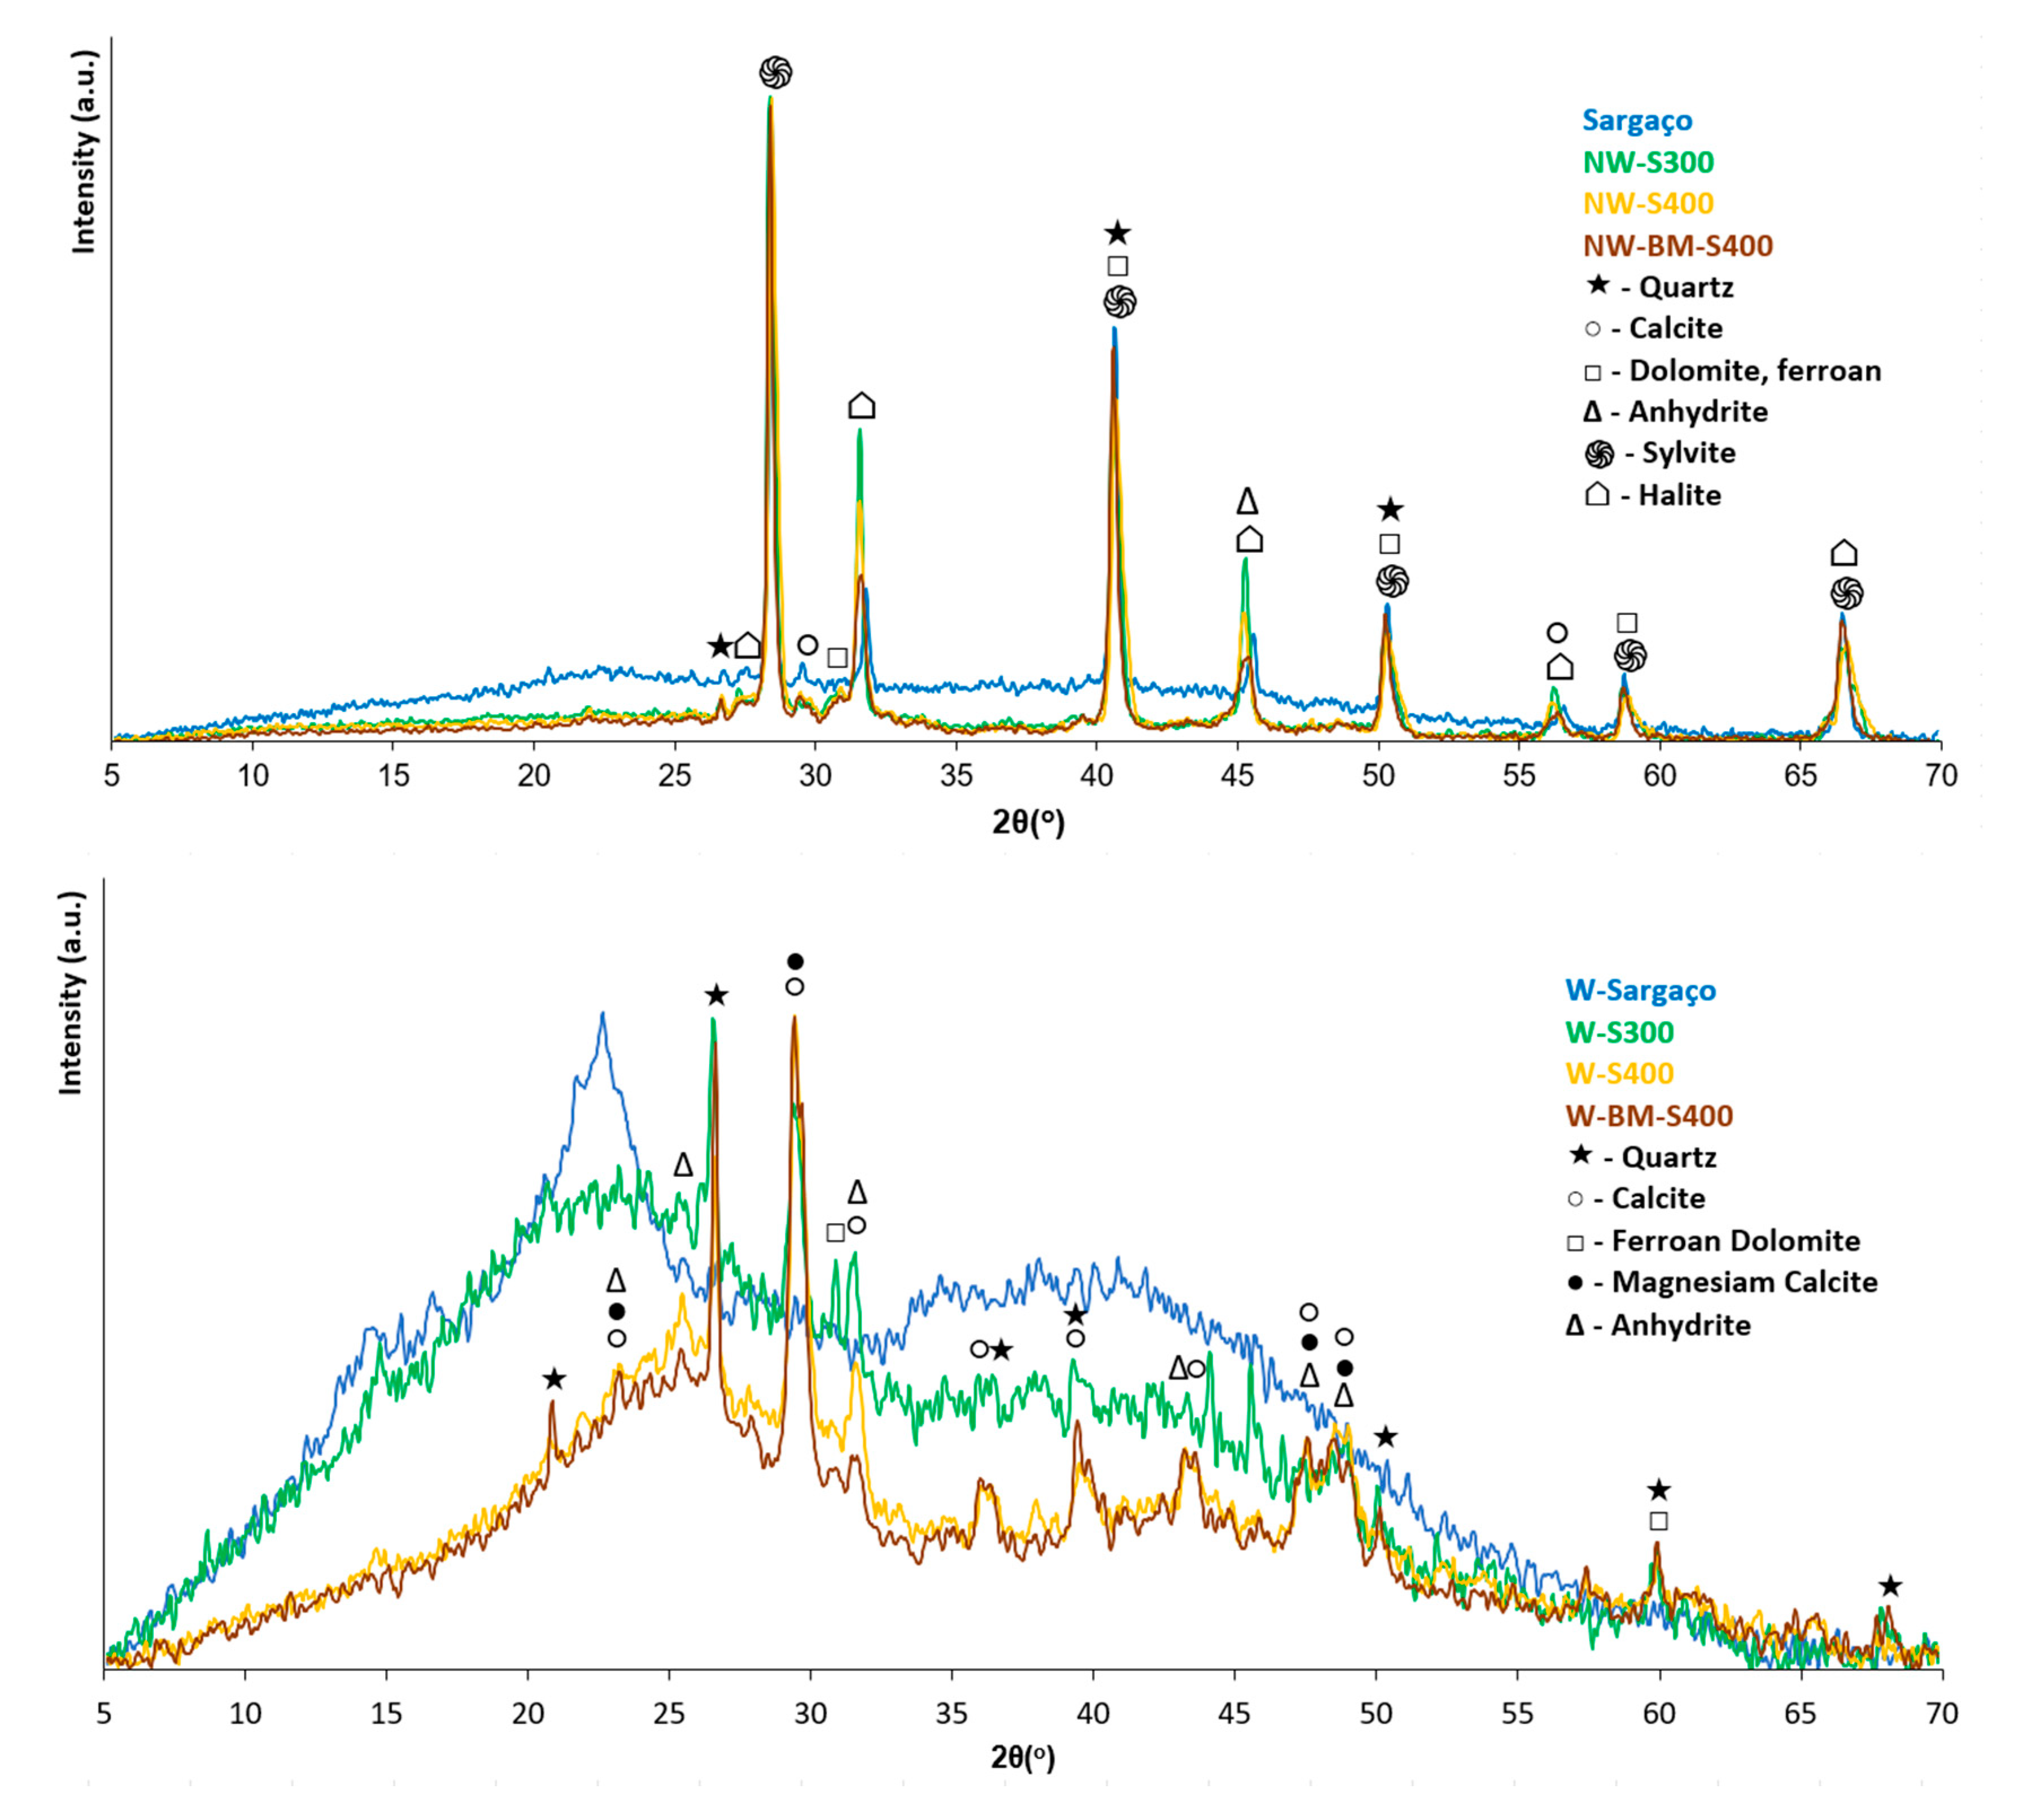
Figure 12.
Raman spectra of washed biochars.
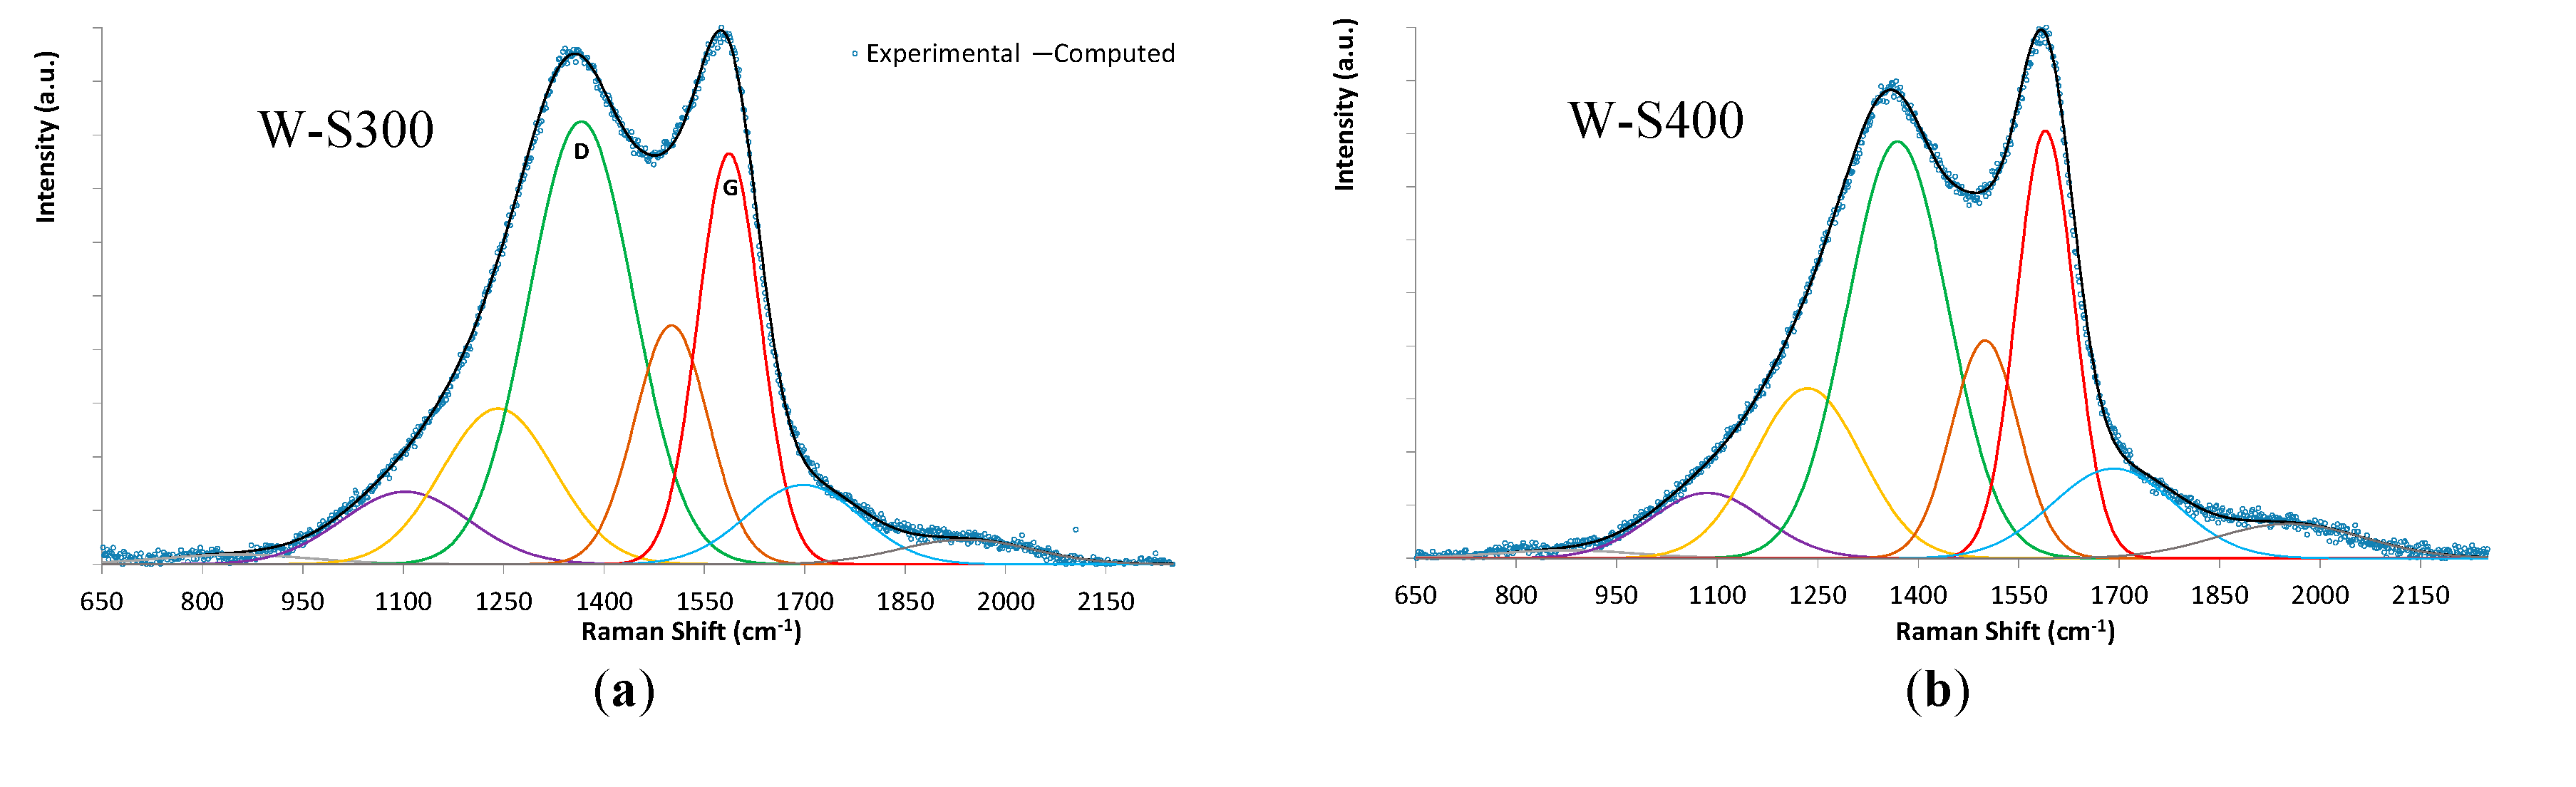
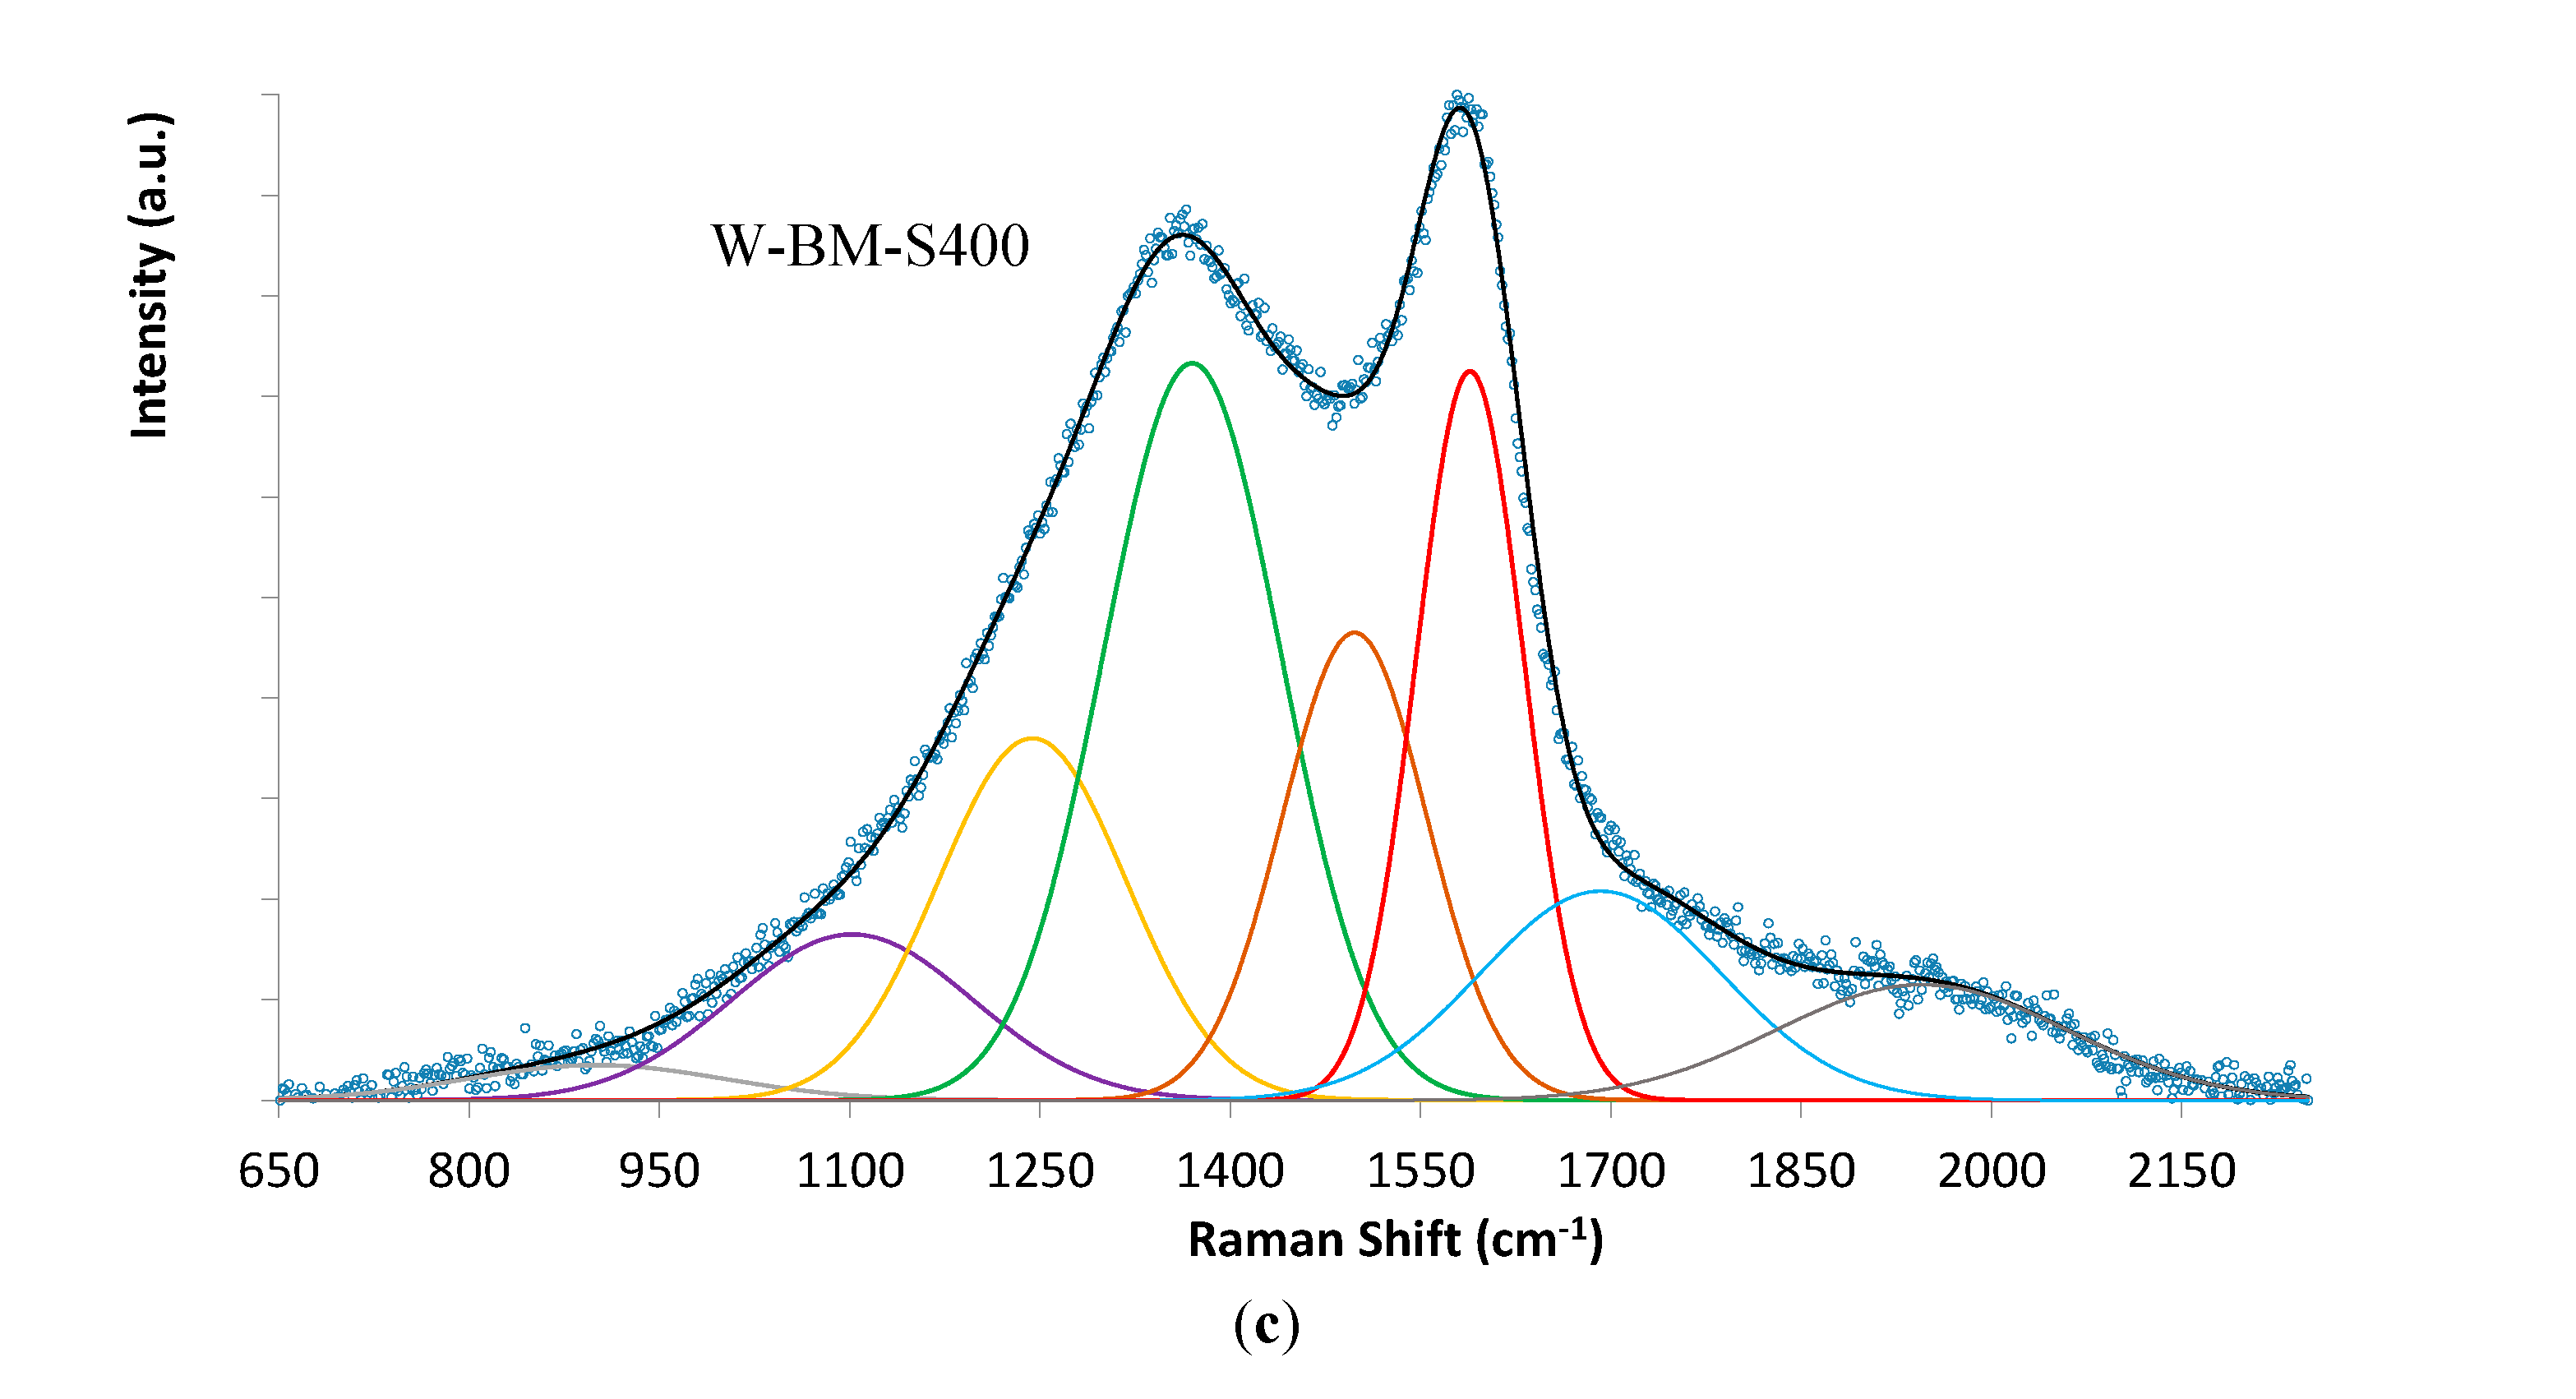
Figure 13.
FTIR spectra of biochars before MB adsorption tests and raw biomass with vibration mode assignments based on literature data.
Figure 13.
FTIR spectra of biochars before MB adsorption tests and raw biomass with vibration mode assignments based on literature data.
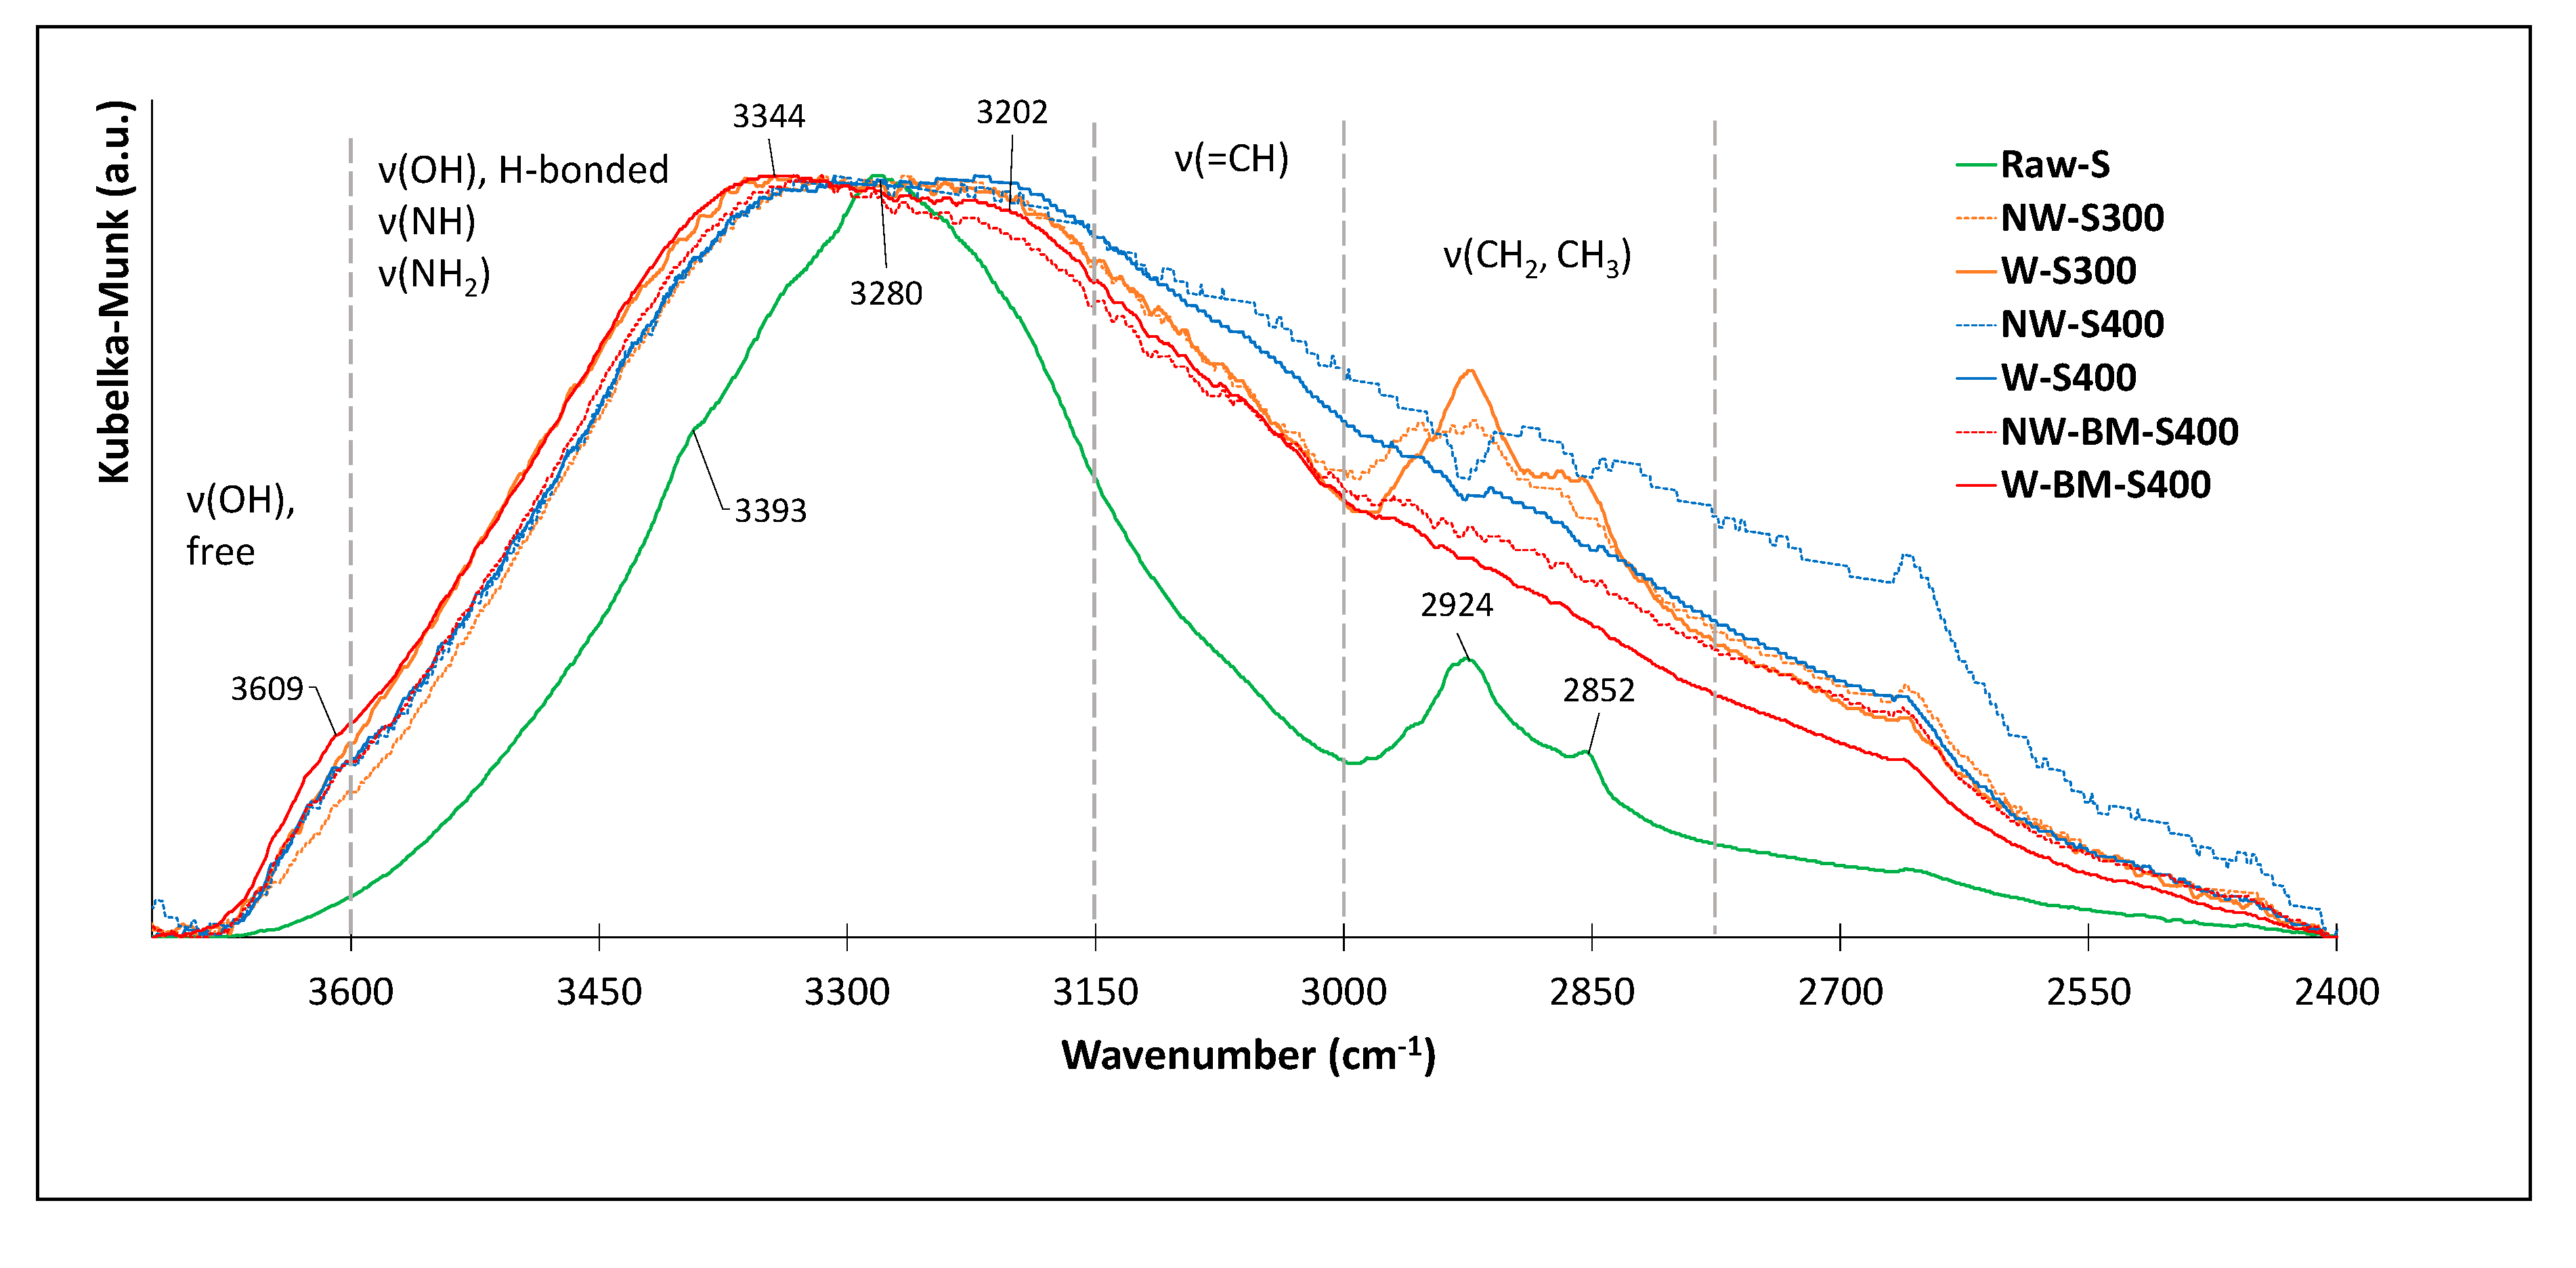
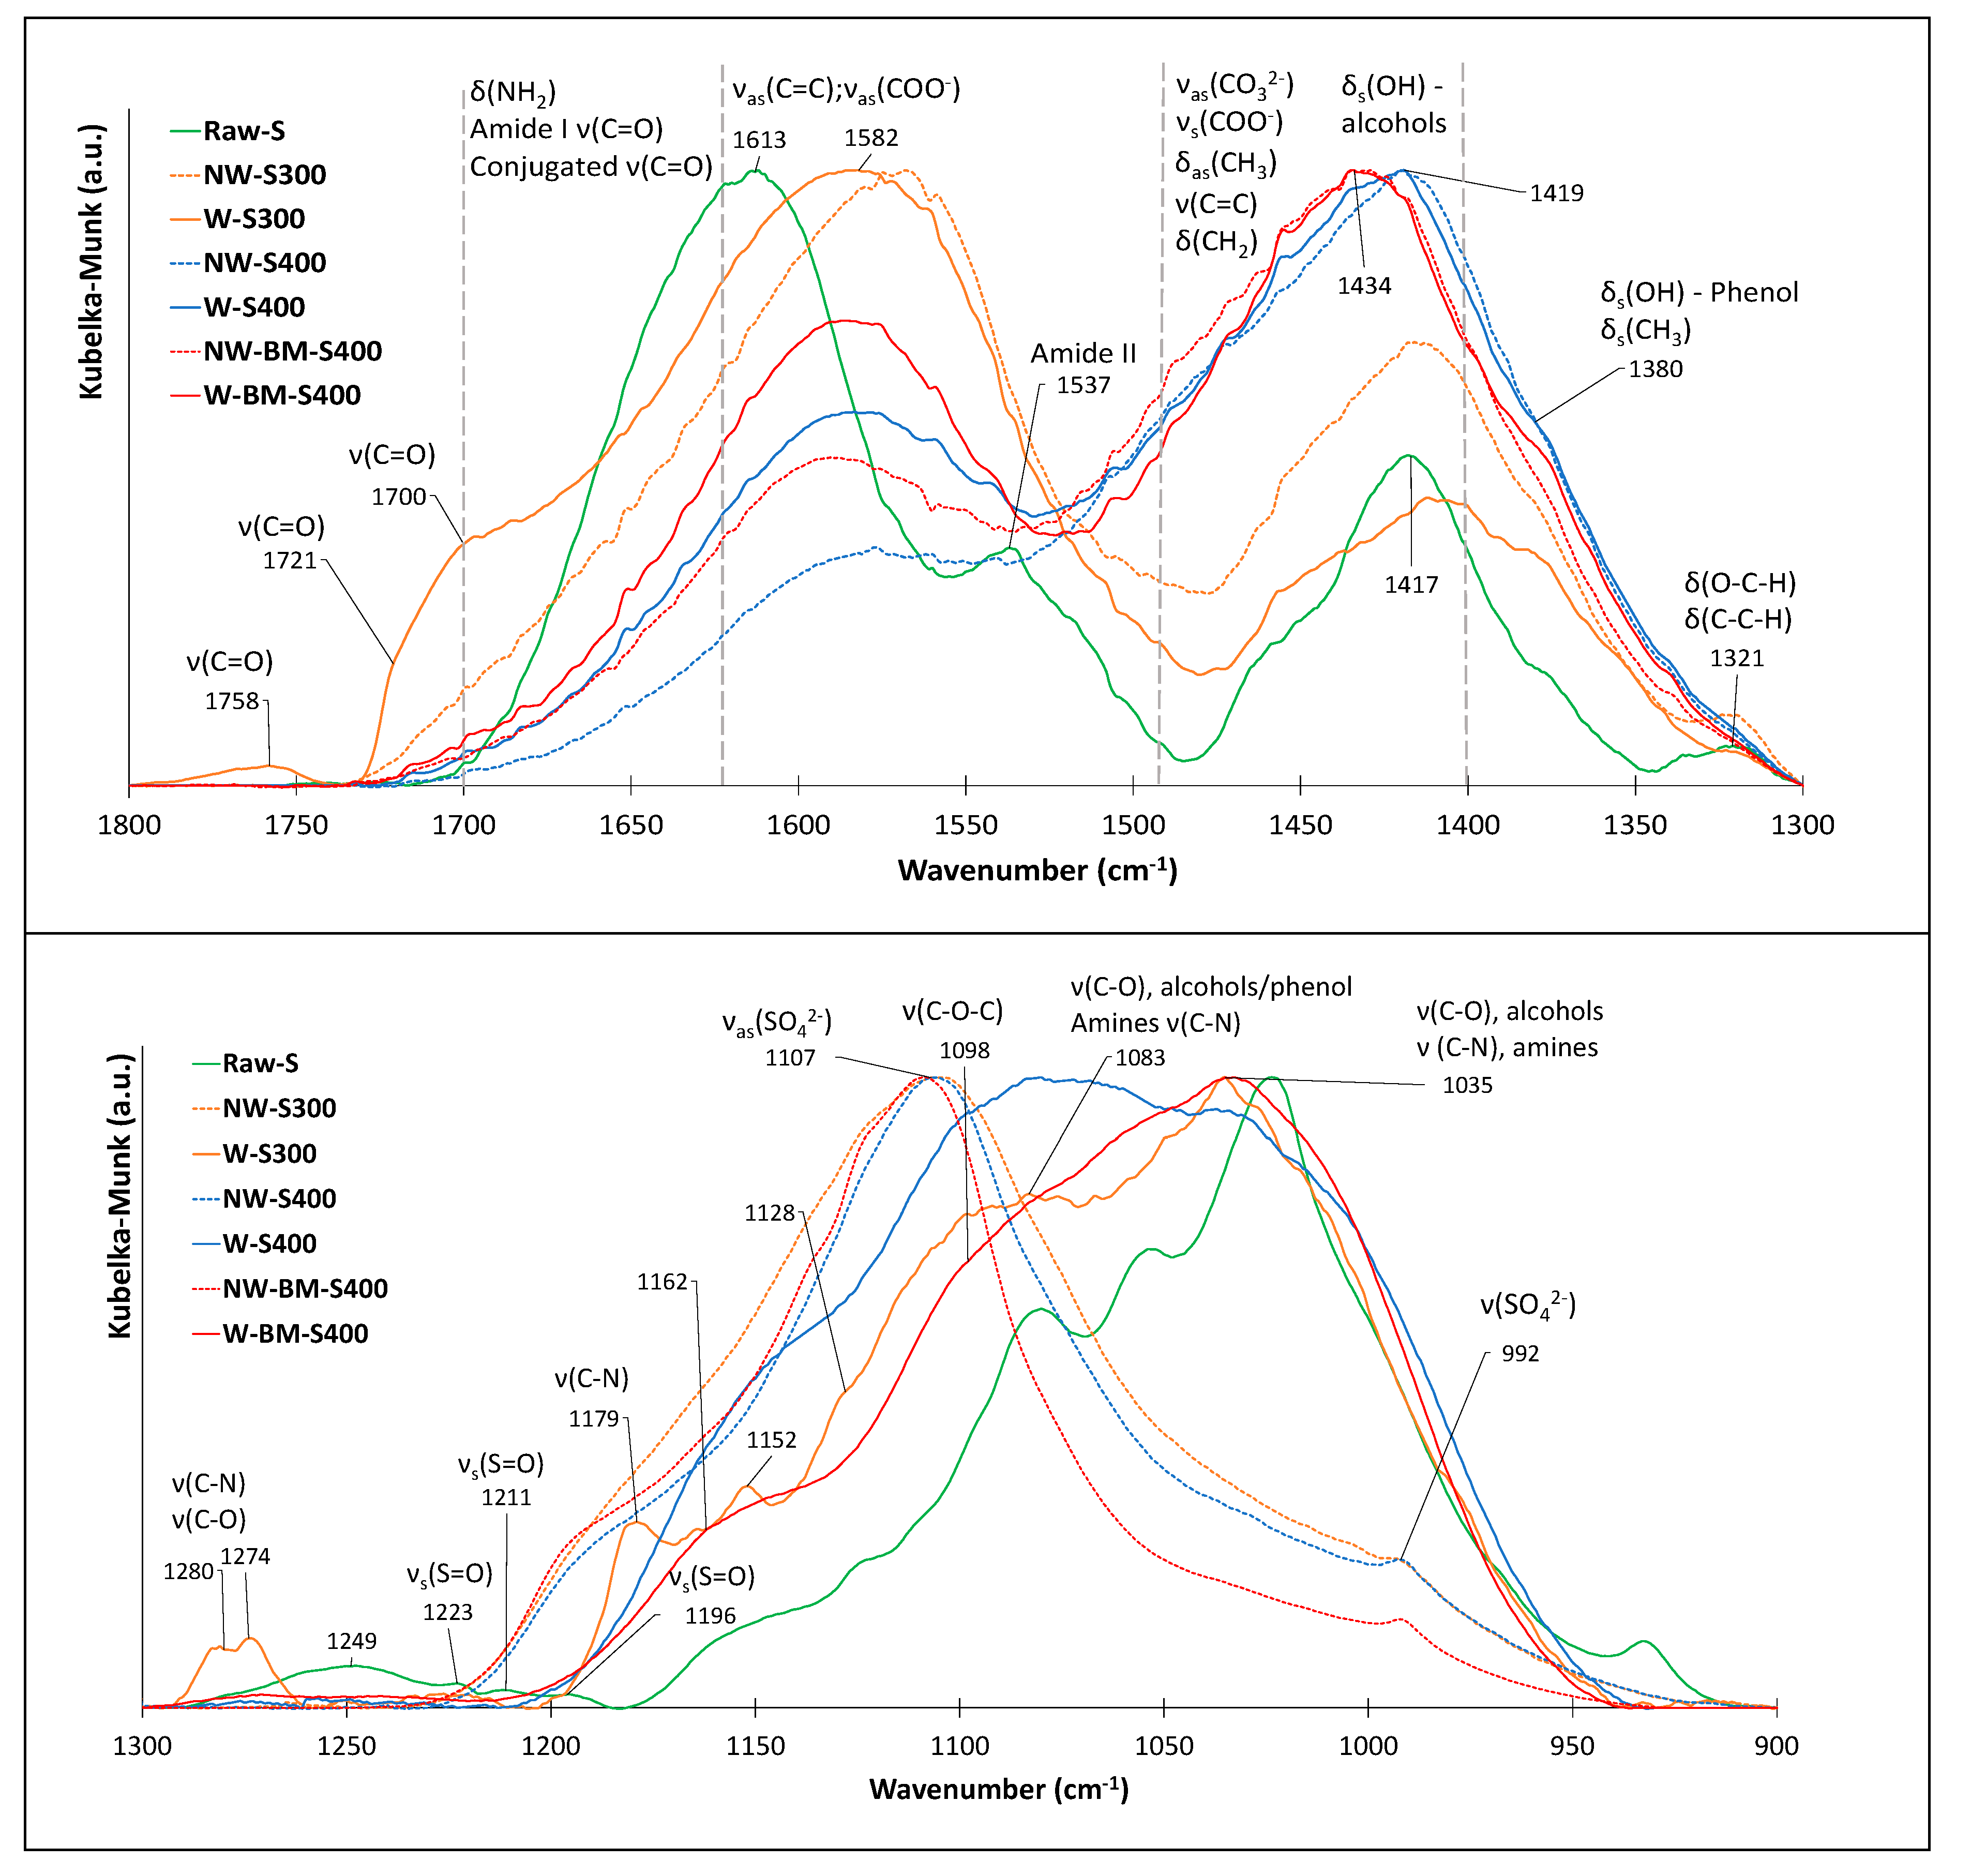
Figure 14.
Effect of the adsorbent dosage on the adsorption capacity and MB removal (W-BM-400, 40 °C; [MB]o=520.5 ppm).
Figure 14.
Effect of the adsorbent dosage on the adsorption capacity and MB removal (W-BM-400, 40 °C; [MB]o=520.5 ppm).
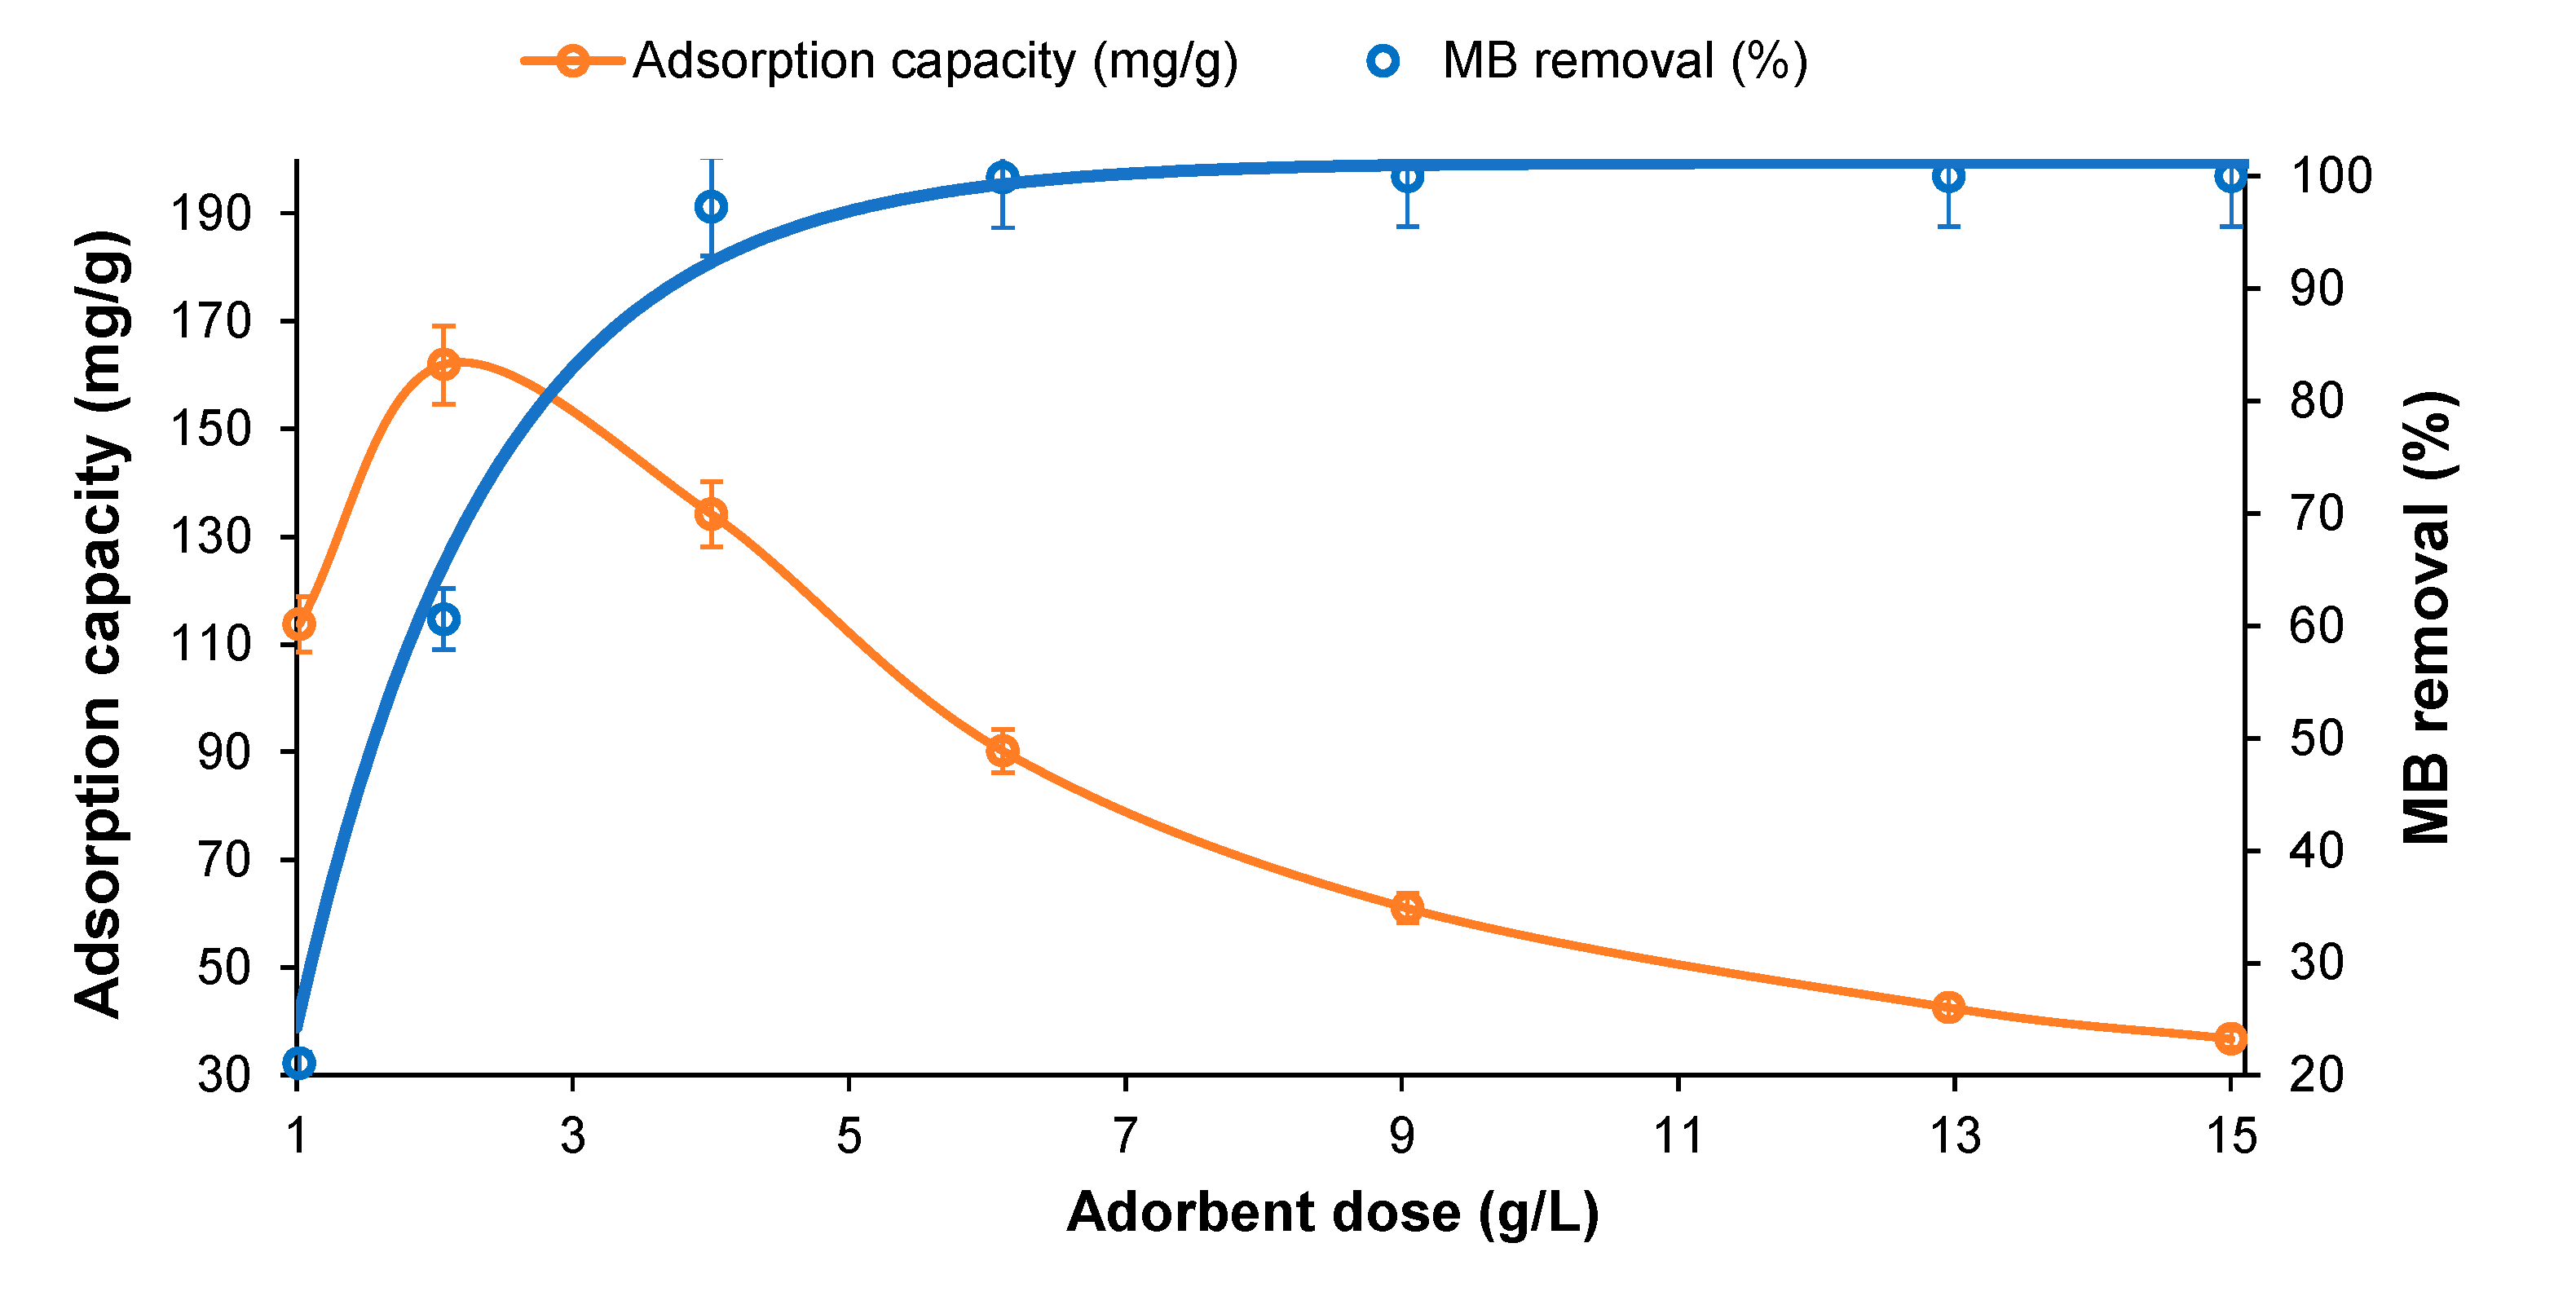
Figure 15.
Temperature effect on the MB adsorption capacity (W-BM-400, dose=2 g/L, 40 °C, [MB]o=520.5 ppm).
Figure 15.
Temperature effect on the MB adsorption capacity (W-BM-400, dose=2 g/L, 40 °C, [MB]o=520.5 ppm).
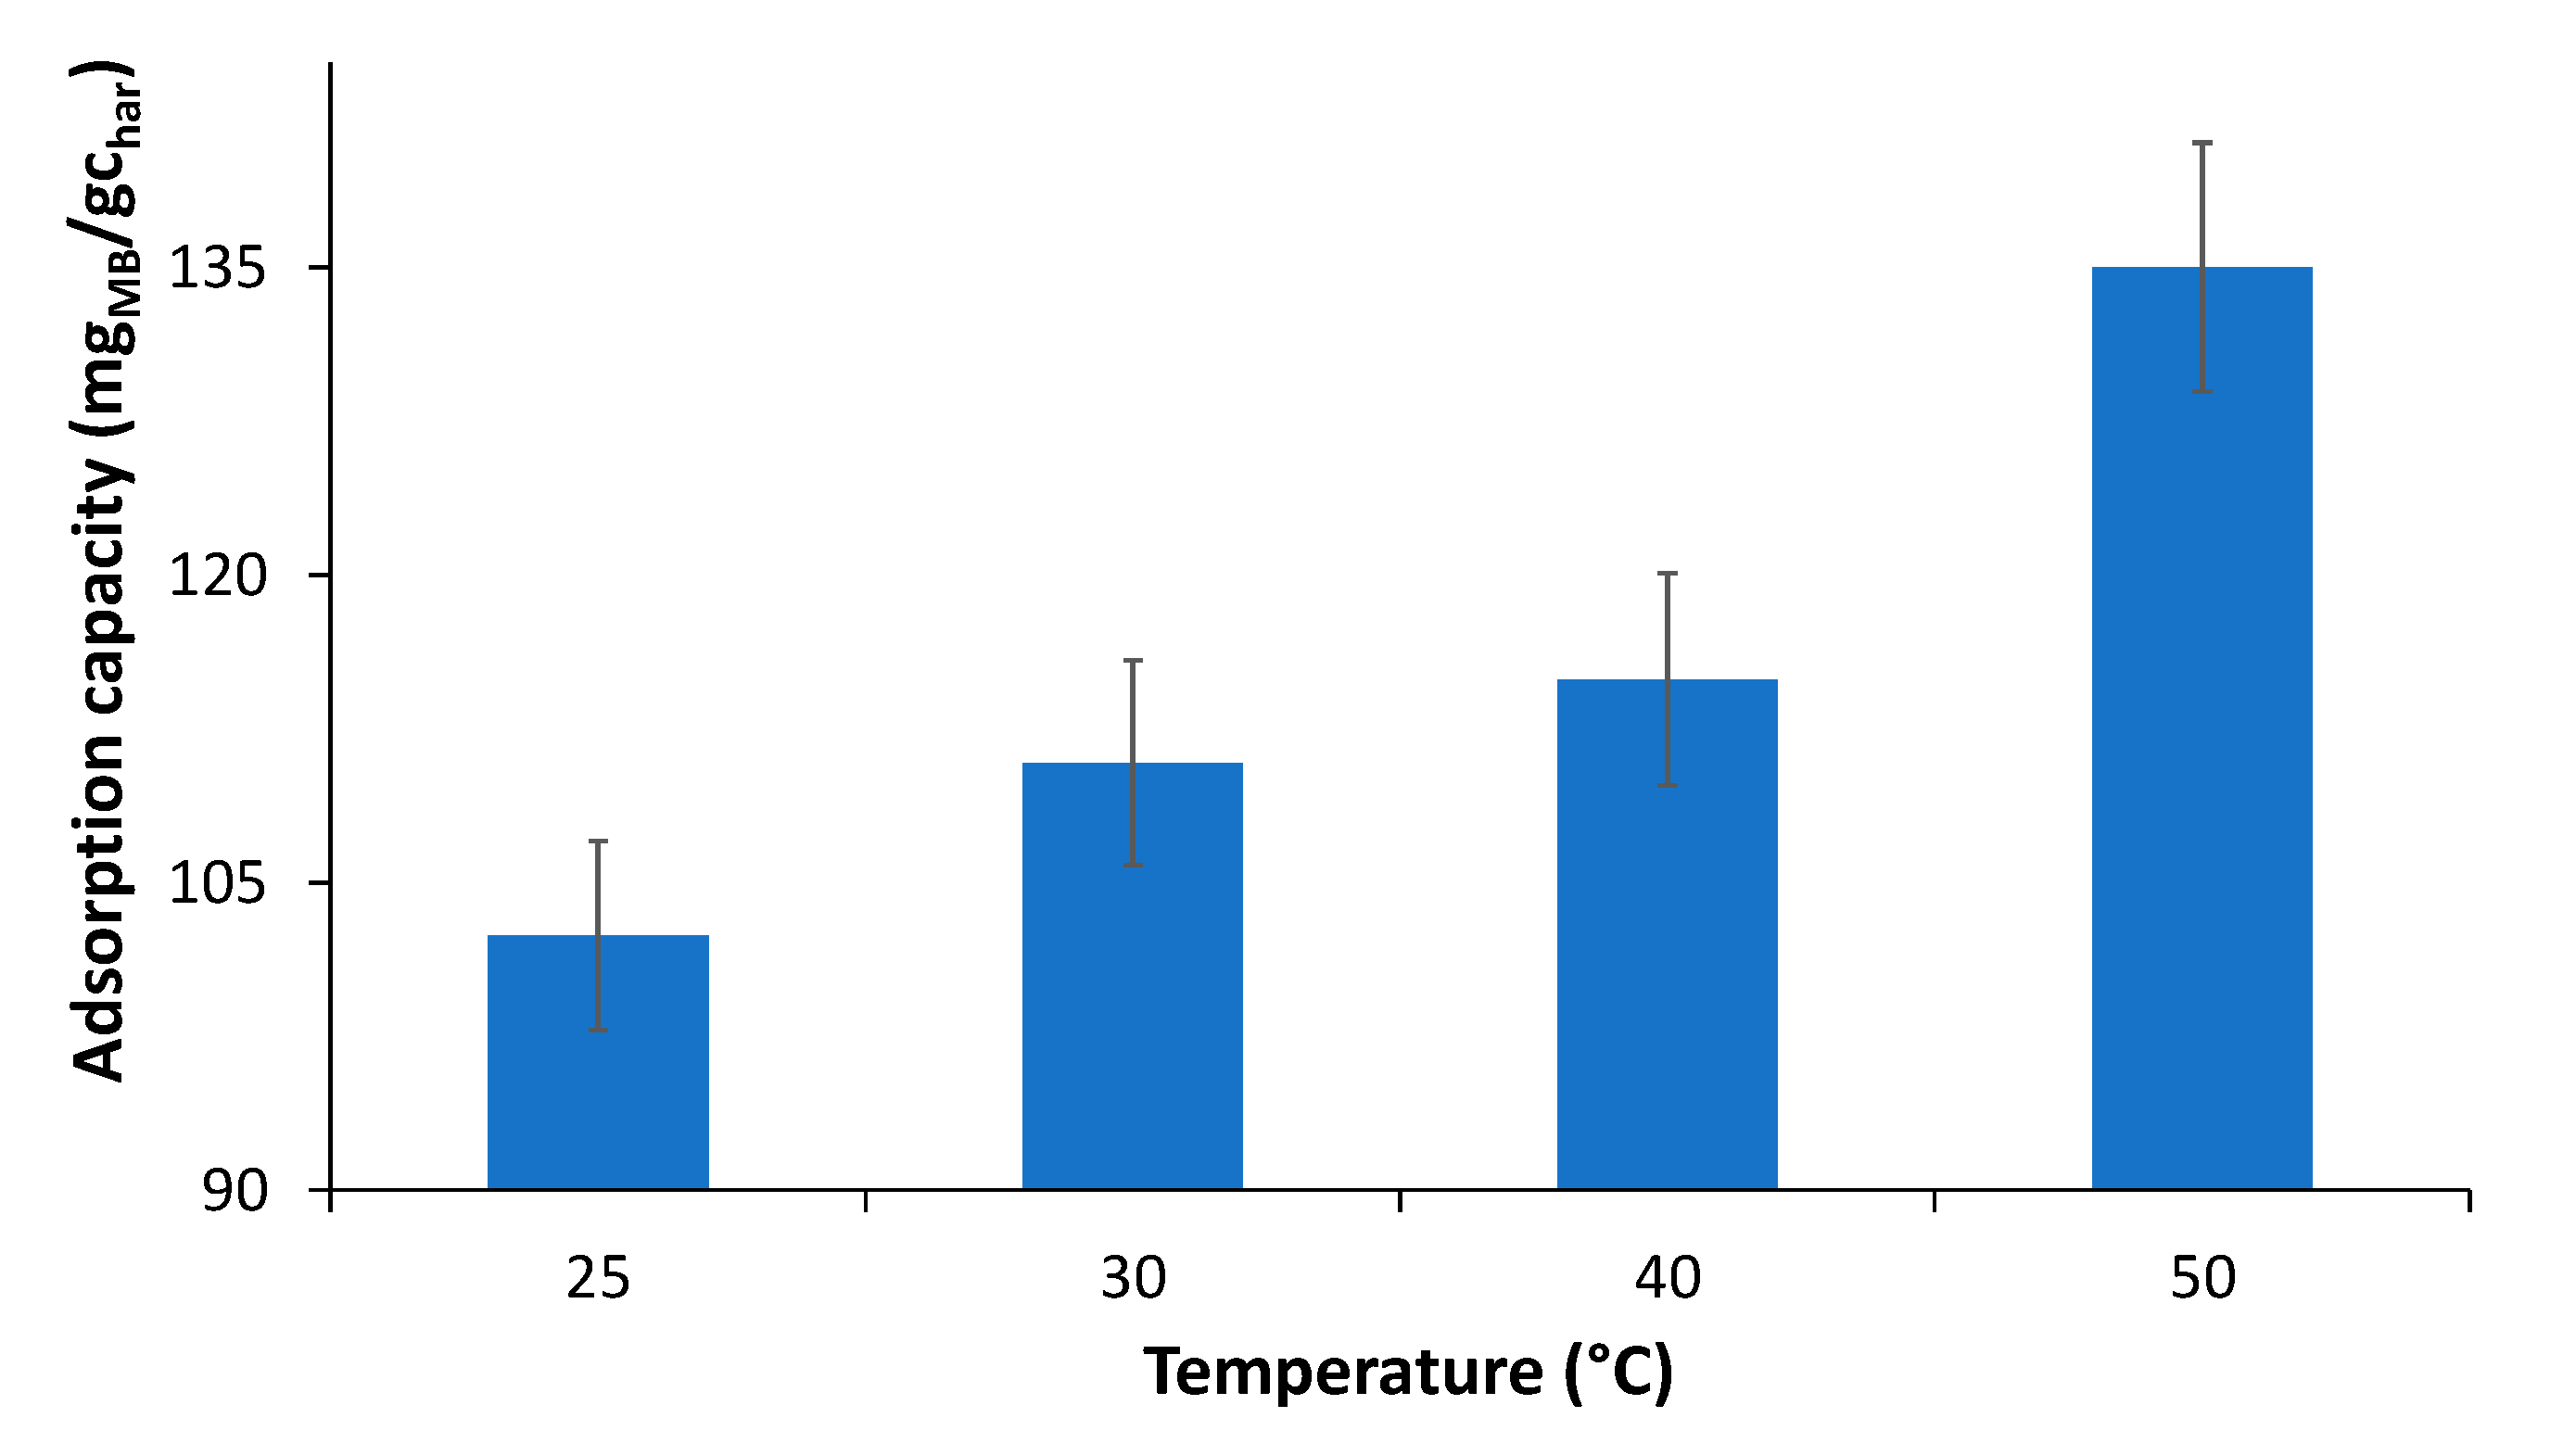
Figure 16.
pH effect on the MB adsorption capacity (W-BM-S400, 2g/L, 30 min; 40 °C and [MB]o=520.5 ppm).
Figure 16.
pH effect on the MB adsorption capacity (W-BM-S400, 2g/L, 30 min; 40 °C and [MB]o=520.5 ppm).
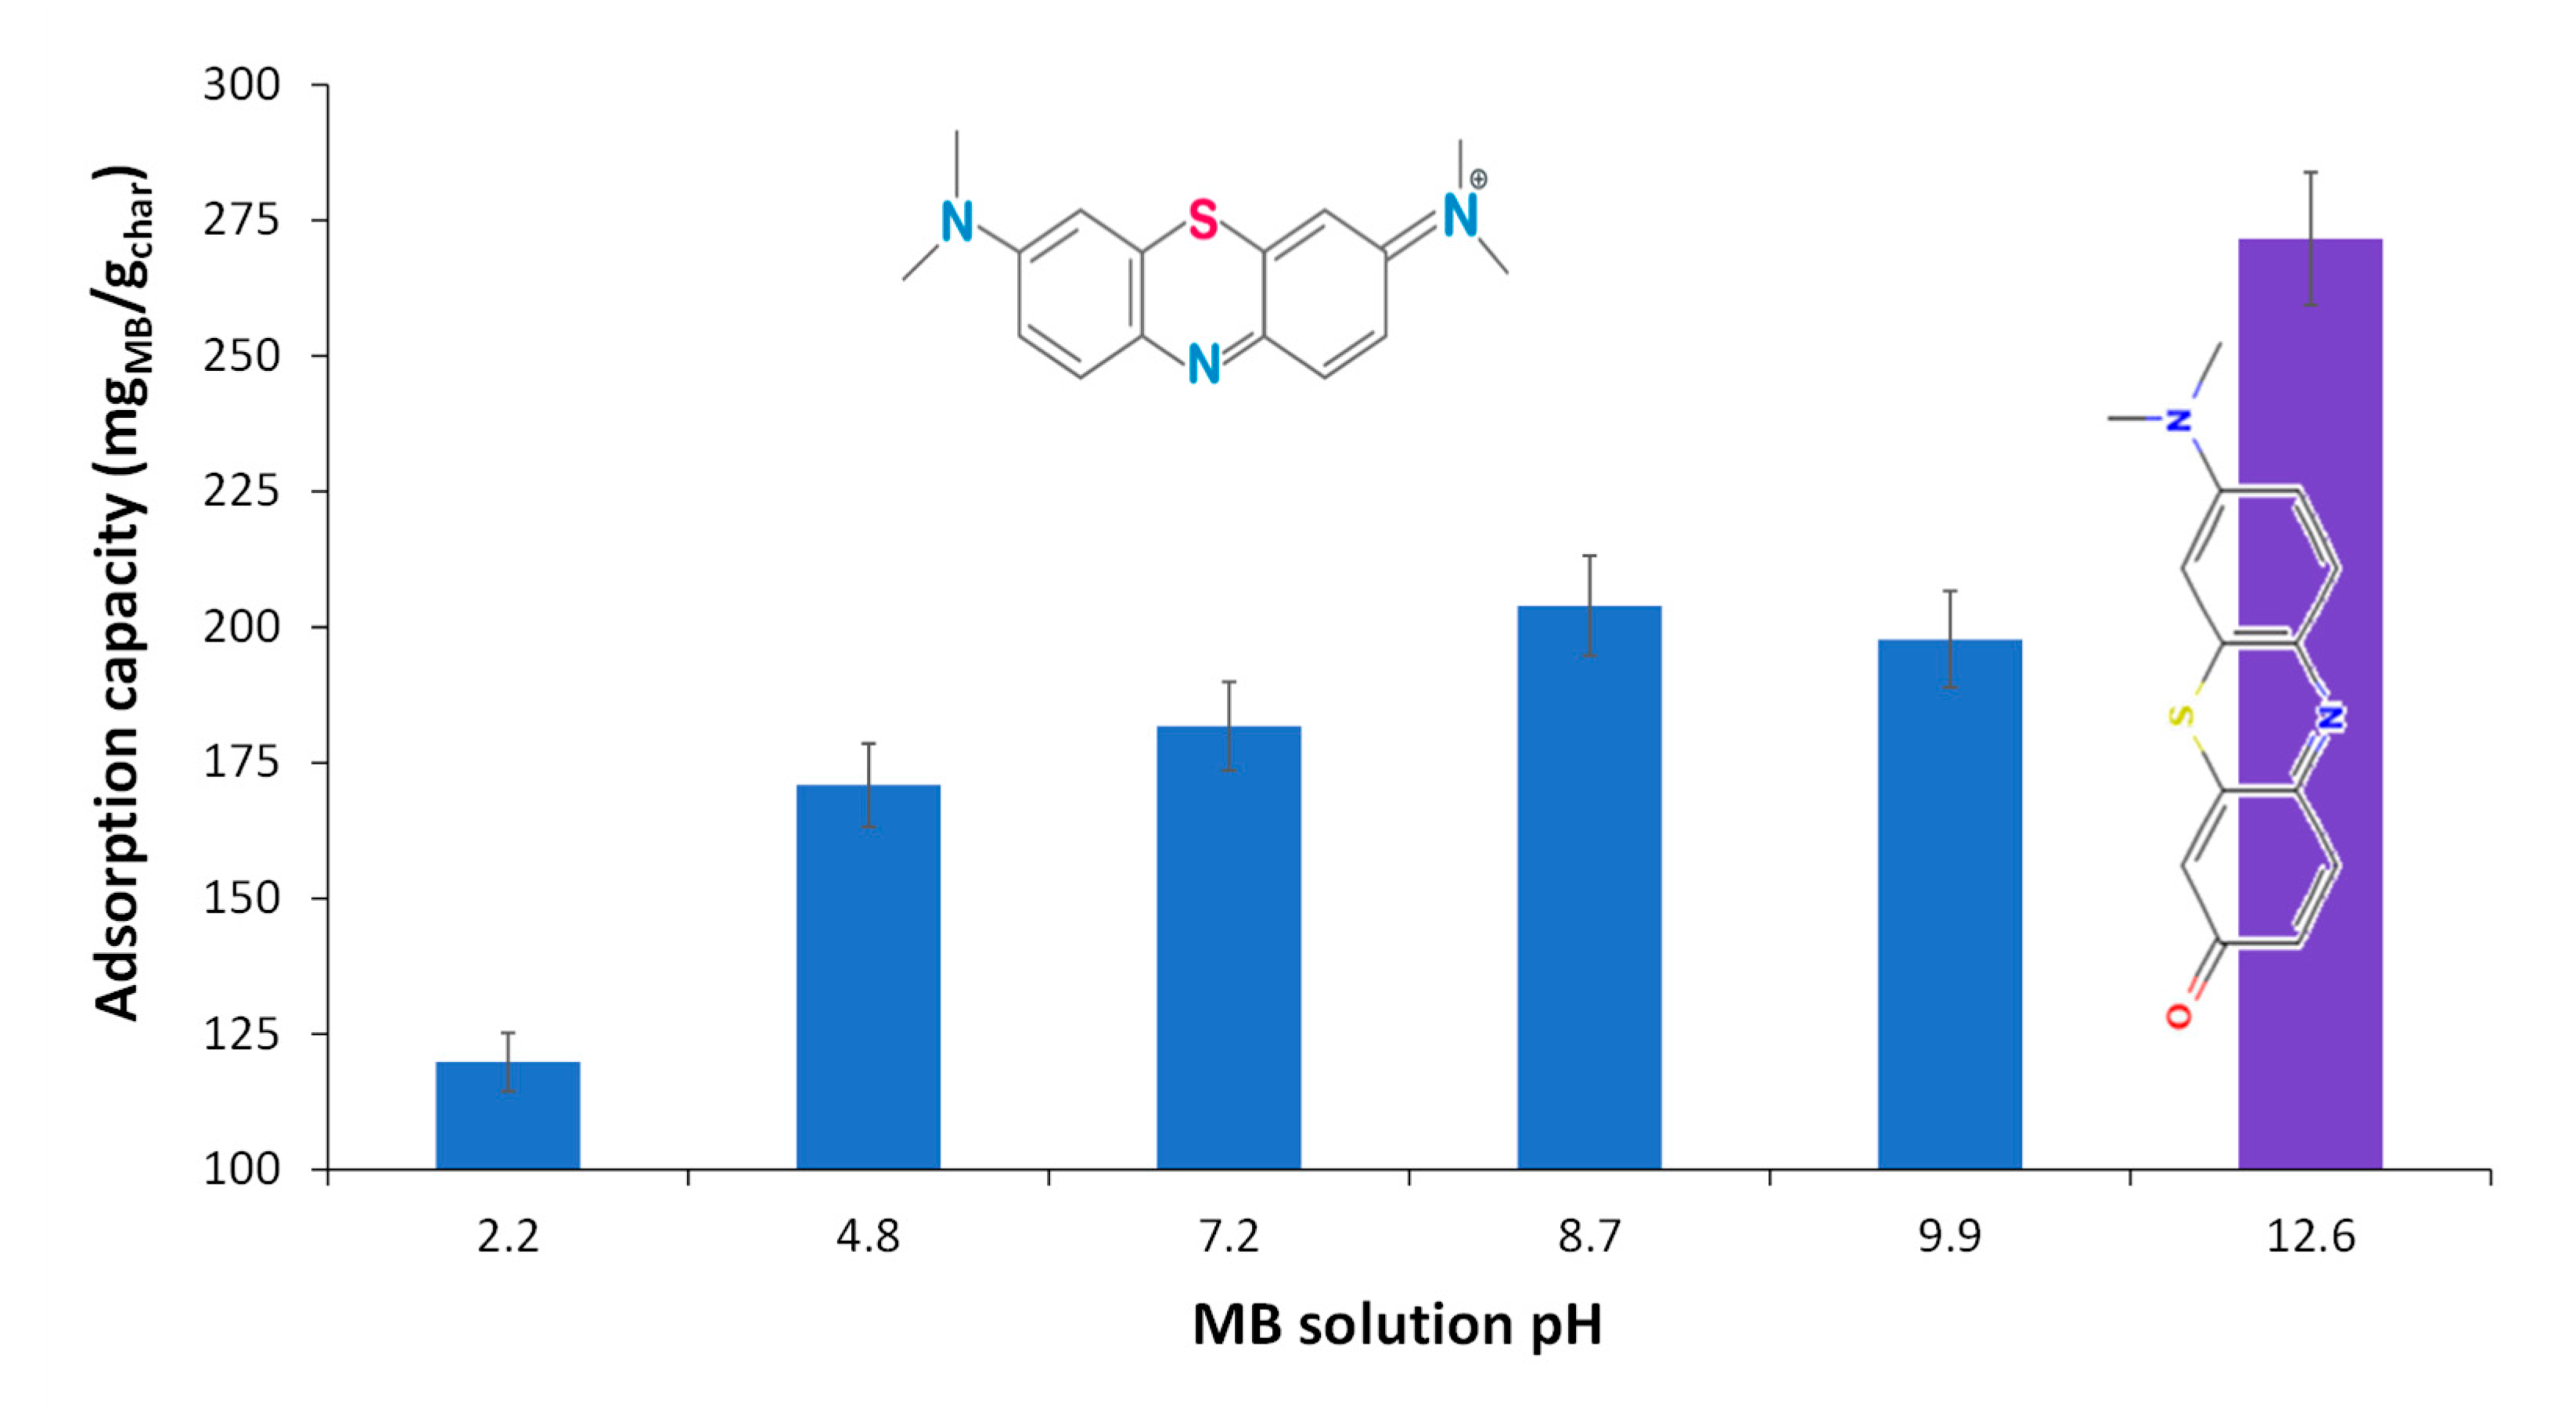
Figure 17.
Langmuir (1) and Freundlich (2) adsorption isotherms for MB adsorption tests at 40 °C and 2g/L.
Figure 17.
Langmuir (1) and Freundlich (2) adsorption isotherms for MB adsorption tests at 40 °C and 2g/L.
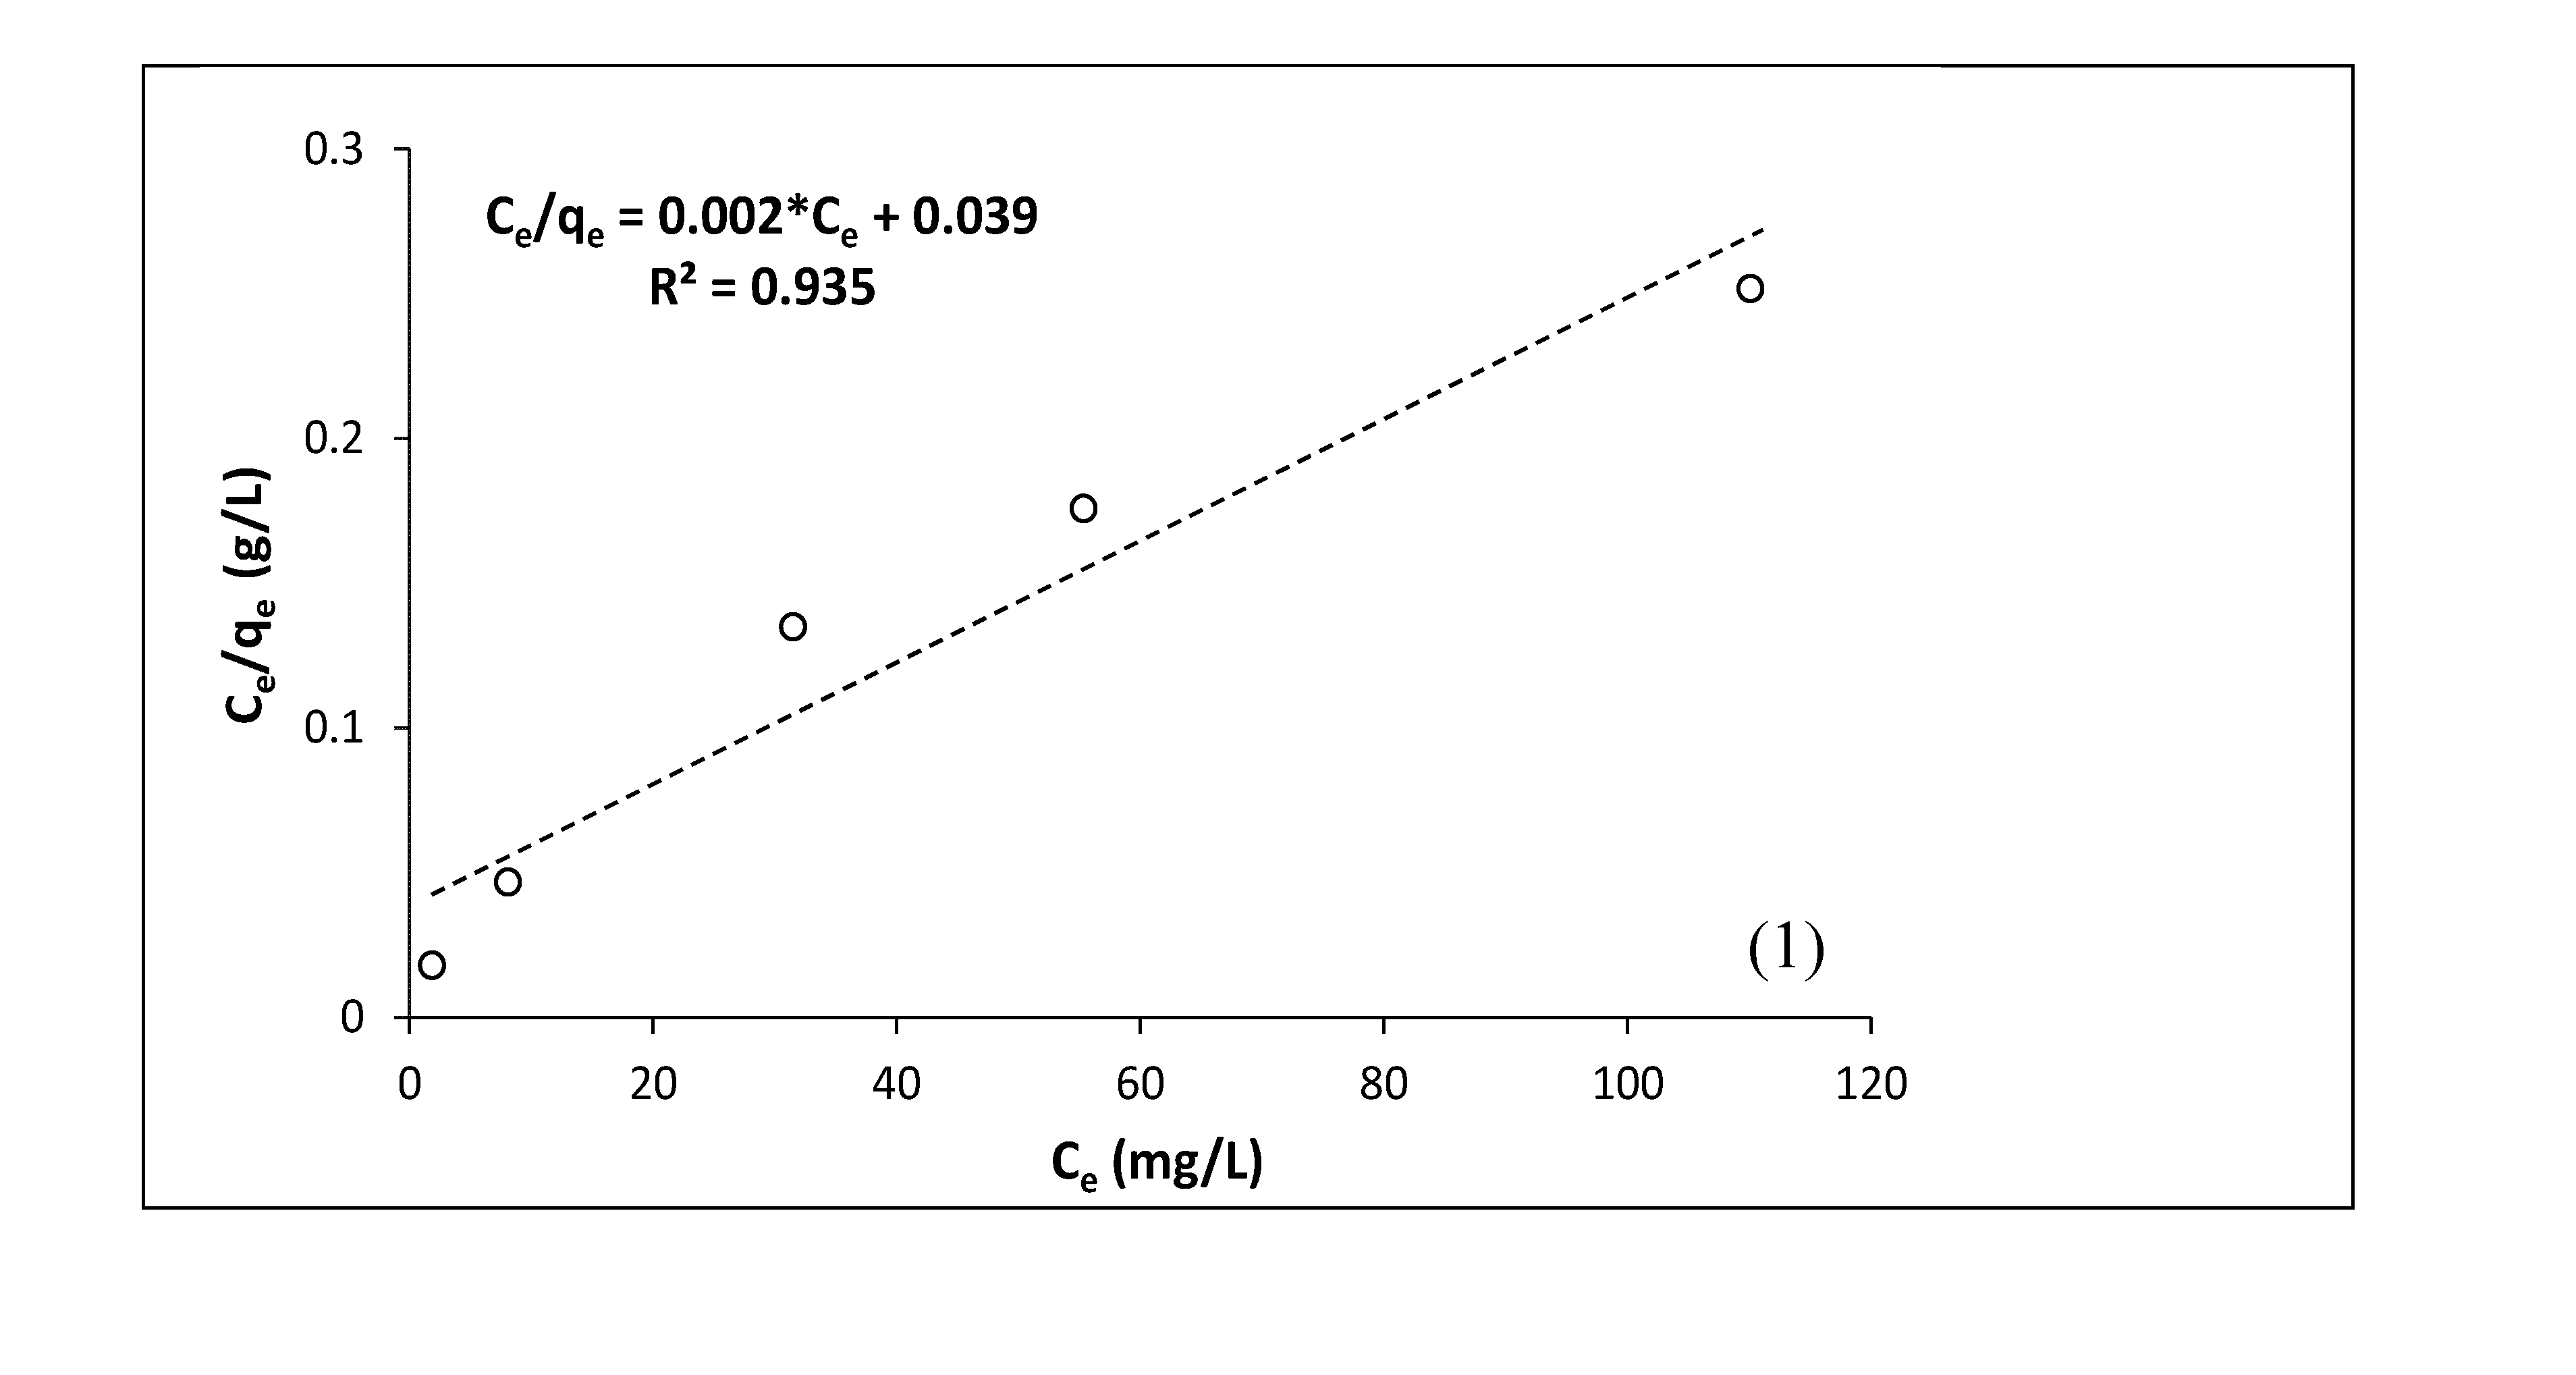
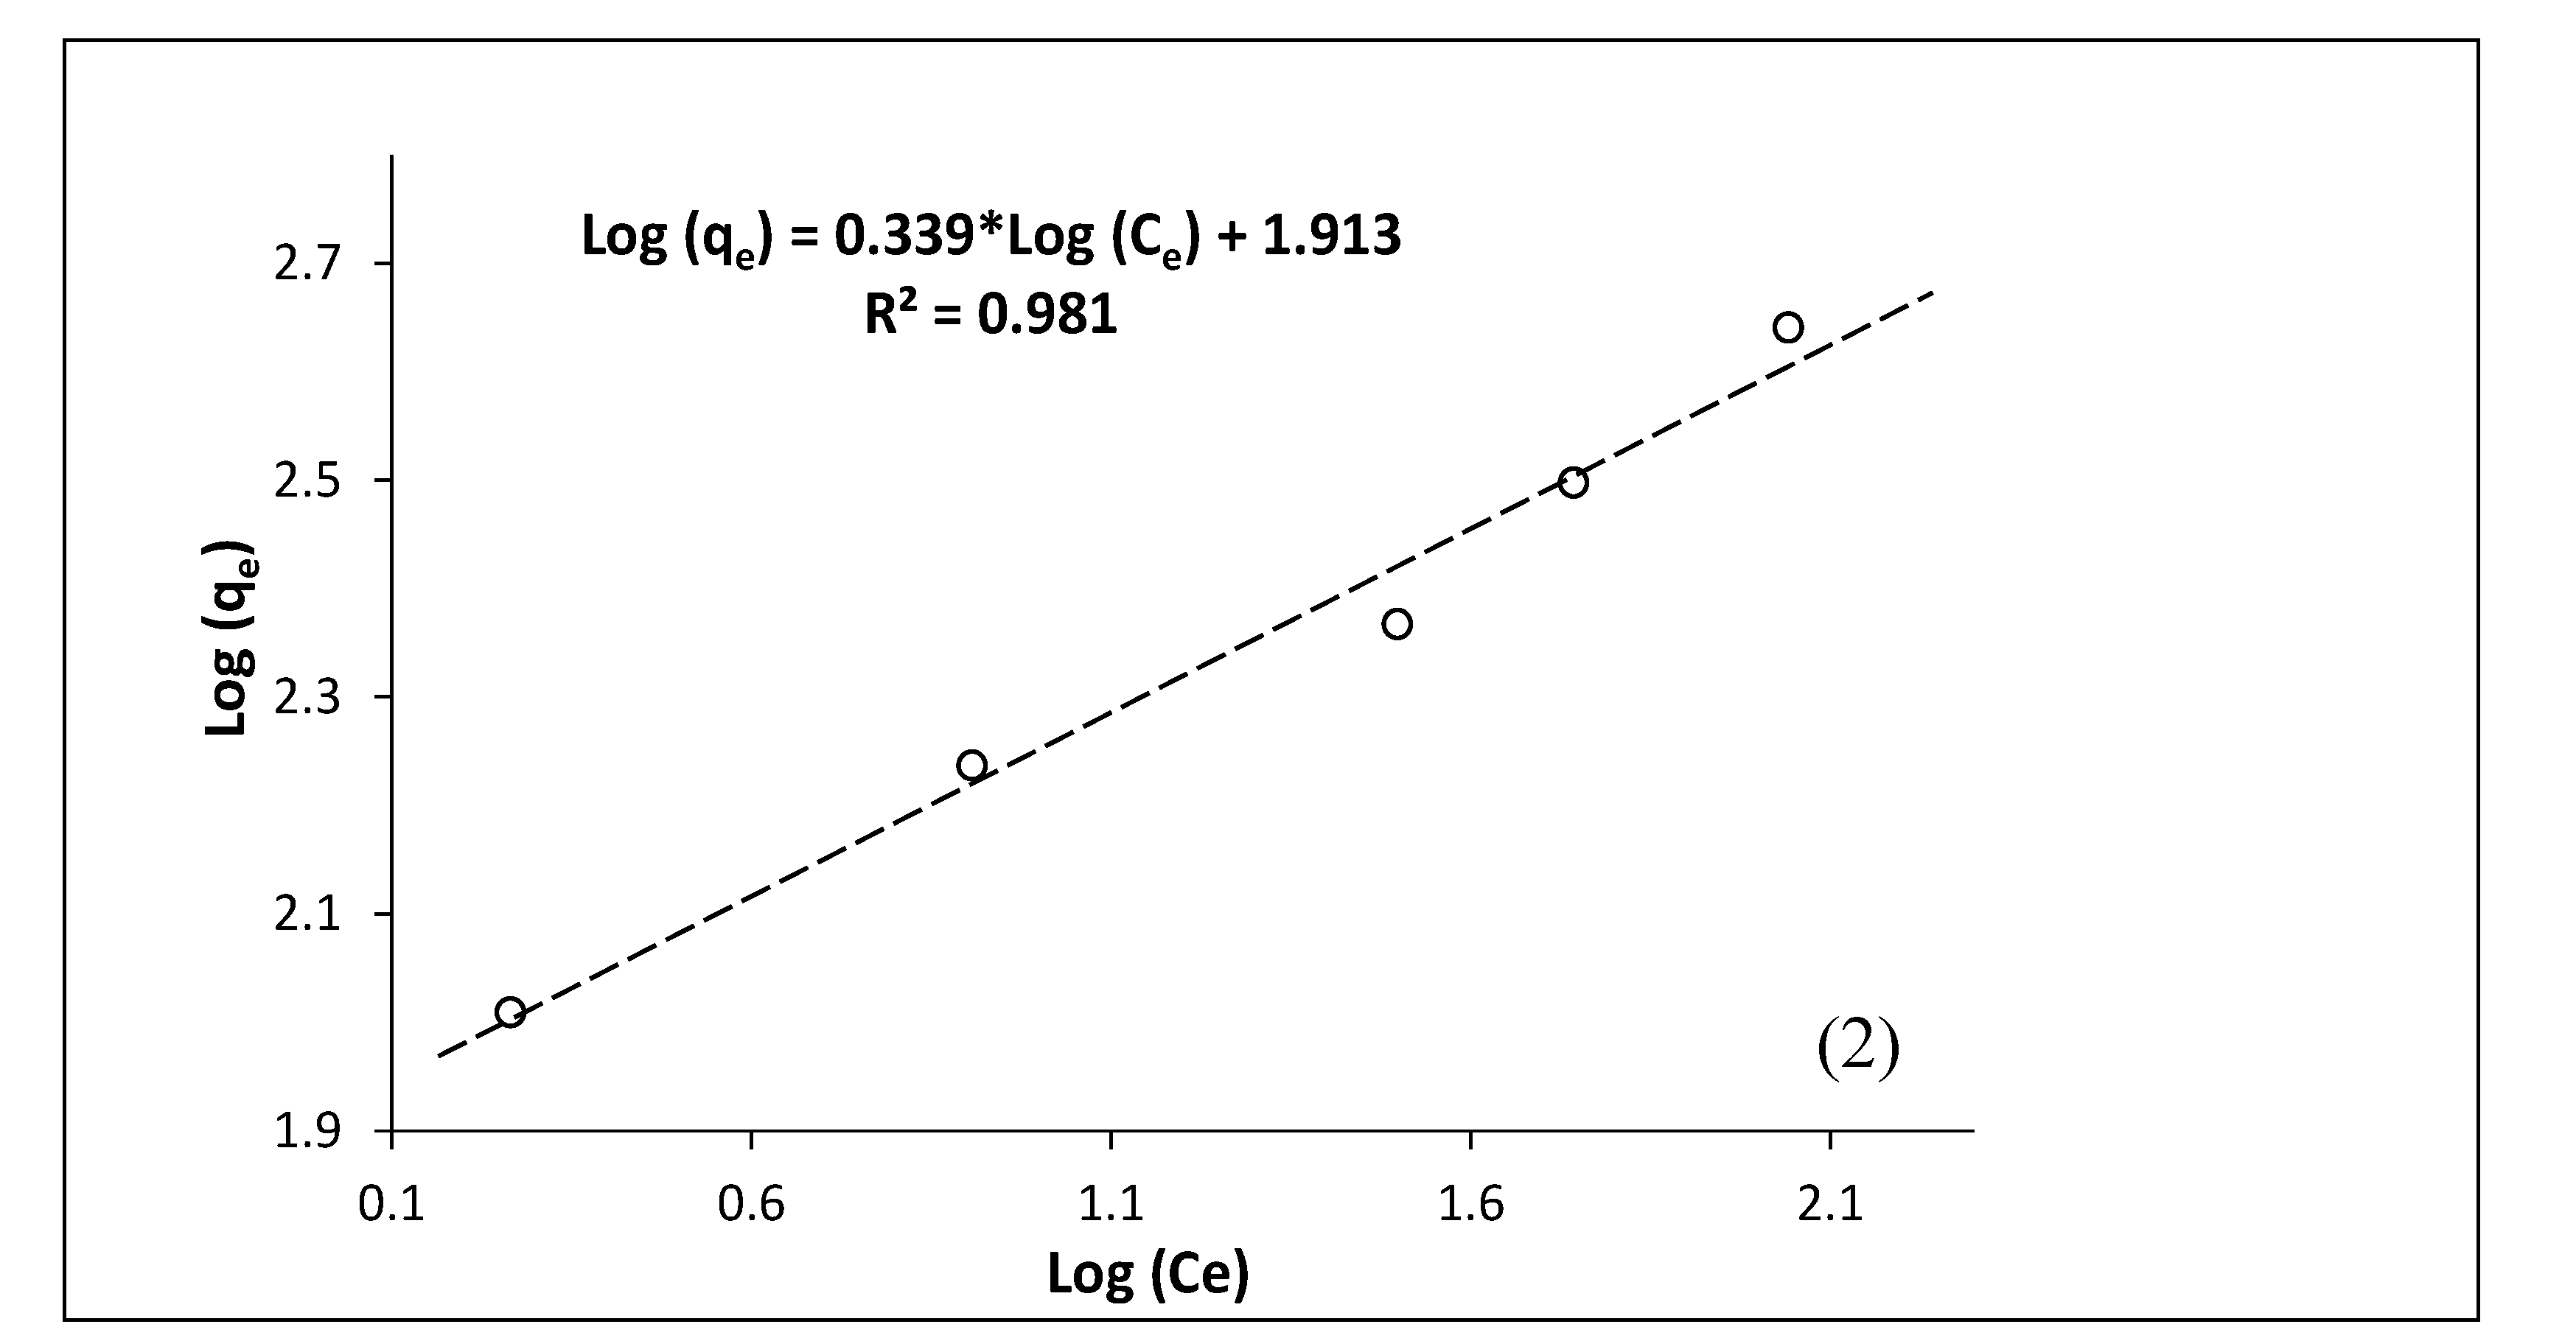
Figure 18.
Maximum MB adsorption capacity of char compared with published data for land biomass-derived chars with (dark blue) and without activation treatment (light blue) (data source (Sivaranjanee et al., 2023)). The green dotted line presents the maximum MB removal capacity for this work seaweed chars.
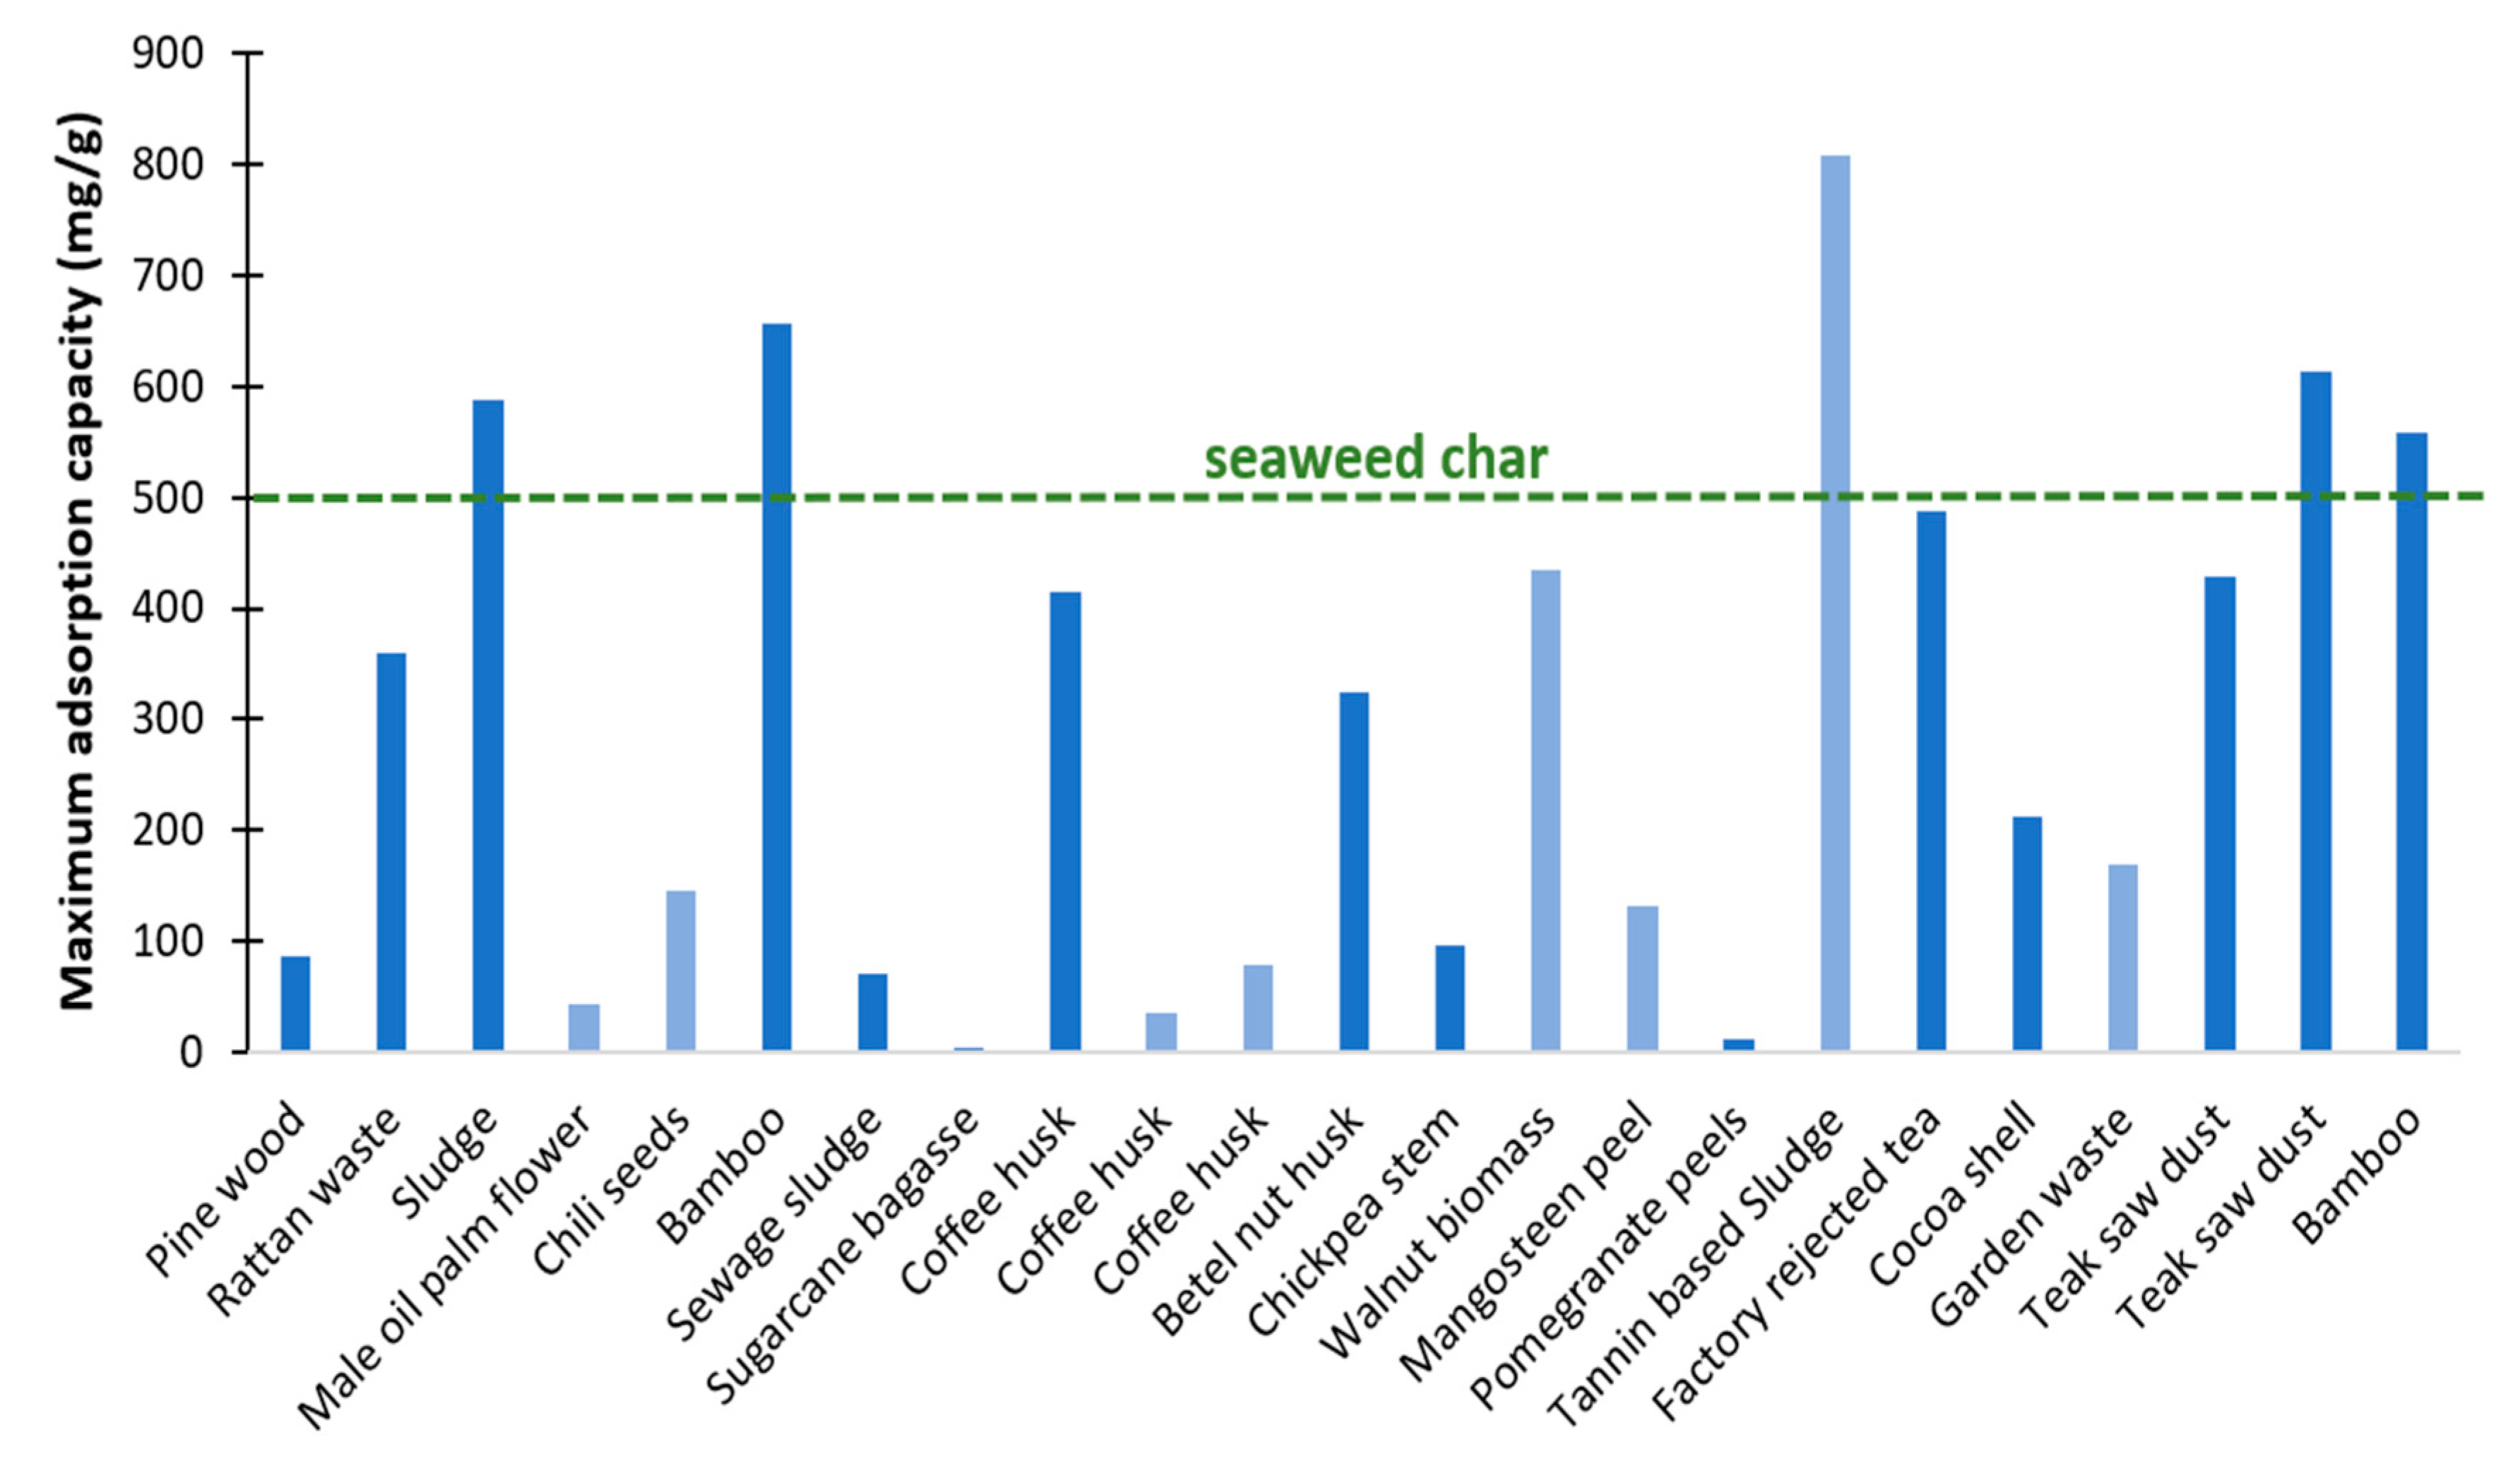

Table 1.
Existing and emerging processes to remove dyes from wastewater (adapted from (Crini, 2006)).
Table 1.
Existing and emerging processes to remove dyes from wastewater (adapted from (Crini, 2006)).
| Technology | Advantages | Disadvantages | |
|---|---|---|---|
| Conventional | Coagulation Flocculation Biodegradation |
Simple, economically feasible Economically attractive, publicly acceptable treatment |
High sludge production, handling and disposal problems Slow process, necessary to create an optimal favorable environment, maintenance and nutrition requirements |
| Adsorption on activated carbons | The most effective adsorbent, great, capacity, produces a high-quality treated effluent | Ineffective against disperse and vat dyes, the regeneration is expensive and results in loss of the adsorbent, non-destructive process | |
| Established | Membrane separations Ion-exchange Oxidation |
Removes all dye types, produces a high-quality treated effluent No loss of sorbent on regeneration, effective Rapid and efficient process |
High pressures, expensive, incapable of treating large volumes Economic constraints, not effective for disperse dyes High energy cost, chemicals required |
| Emerging | Advanced oxidation process Selective bio-adsorbents Biomass |
No sludge production, little or no consumption of chemicals, efficiency for recalcitrant dyes Economically attractive, regeneration is not necessary, high selectivity Low operating cost, good efficiency and selectivity, no toxic effect on microorganisms |
Economically unfeasible, formation of by-products, technical constraints Requires chemical modification, non-destructive process Slow process, performance depends on some external factors (pH, salts) |
Table 2.
MB removal using seaweed-derived biochar from literature.
| Biomass | Temperature (°C) | Activation | Washing | qmax (mg/g)* | Reference |
|---|---|---|---|---|---|
| Laminaria digitata | 400 | - | - | 117 | (Güleç et al., 2022) |
| Laminaria digitata | 250 | - | - | 175 | (Güleç et al., 2022) |
| Enteromorpha prolifera | 500 | NaOH, 800 °C | HCl, H2O | 244 | (Jiang et al., 2023) |
| Ulva lactuca | 700 | ZnCl2 | HCl, H2O | 345 | (El Nemr et al., 2021) |
| Gelidiella acerosa | 800 | - | HCl, H2O | 513 | (Ahmed et al., 2019) |
| Enteromorpha prolifera* Oily sludge | 700 | KOH | HCl, H2O | 910 | (Li et al., 2018) |
* maximum adsorption capacity by Langmuir adsorption isotherm
Table 3.
Species and phylum/class percentages (wt. %, dried) of the prepared sargaço mixture.
| Phylum | Species | Species (wt. %; dried) |
|---|---|---|
| Phaeophyceae | Ascophyllum nodosum | 5.0 |
| Fucus vesiculosus | 15.0 | |
| Gongolaria baccata | 10.1 | |
| Saccorhiza polyschides | 39.9 | |
| Chlorophyta | Ulva lactuca | 7.5 |
| Ulva rigida | 7.5 | |
| Rhodophyta | Gelidium corneum | 7.0 |
| Gracilaria gracilis | 4.0 | |
| Plocamium cartilagineum | 4.0 |
Table 4.
Yield (%) and pH of the produced char.
| Biochar ID | Yield (%) | pH |
|---|---|---|
| NW-S300 | 57.4 | 8.5 |
| W-S300 | - | 7.1 |
| NW-S400 | 46.0 | 10.3 |
| W-S400 | - | 9.3 |
| NW-BM-S400 | - | 10 |
| W-BM-S400 | - | 9.1 |
NW- non washed; W-washed; BM-ball milled; S-sargaço.
Table 5.
FTIR bands of MB and MB adsorbed on chars and bands shift. Bands attribution according to Ovchinnikov et al. (Ovchinnikov et al., 2016).
Table 5.
FTIR bands of MB and MB adsorbed on chars and bands shift. Bands attribution according to Ovchinnikov et al. (Ovchinnikov et al., 2016).
| MB solid (cm-1) | Char (cm-1) | Shift (cm-1) | Band assignment in MB | |
|---|---|---|---|---|
| 3041 | 3058 | +17 | vhet(C-H) | |
| 2921 | 2921 | 0 | νas(CH3) | |
| 2850 | 2850 | 0 | νs(CH3) | |
| 1585 | 1596 | +11 | vhet(C=C), vhet(C=N) | |
| 1484 | 1489 | +5 | vhet(C=S+) | |
| 1437 | 1437 | 0 | δas(CH3) | |
| 1382 | 1387 | +4 | δ(C-H), γ(C-H) | |
| 1349 | 1349 | 0 | v(C=S+) | |
| 1313 | 1327 | +14 | v(C-N), in N-CH3 | |
| 1244 | 1244 | 0 | δ(C-H), γ(C-H) | |
| 1215 | 1223 | +8 | νhet(C-C) | |
| 1162 | 1172 | +10 | δhet(C-H) | |
| 1132 | 1134 | +2 | δhet(C-N) | |
| 1036 | 1036 | 0 | γhet(C-H) | |
| 947 | 952 | +5 | Nhet···HO | |
| 876 | 884 | +8 | Nhet···HO | |
| 821 | 827 | +6 | δhet(C-C) | |
| 666 | 668 | +2 | νs(C-S-C) in heterocycle | |
v – stretching; δ – bending; s- symmetric vibration; as – asymmetric vibration; Het – heterocycle. All MB bands were assigned from (Ovchinnikov et al., 2016).
Disclaimer/Publisher’s Note: The statements, opinions and data contained in all publications are solely those of the individual author(s) and contributor(s) and not of MDPI and/or the editor(s). MDPI and/or the editor(s) disclaim responsibility for any injury to people or property resulting from any ideas, methods, instructions or products referred to in the content. |
© 2025 by the authors. Licensee MDPI, Basel, Switzerland. This article is an open access article distributed under the terms and conditions of the Creative Commons Attribution (CC BY) license (http://creativecommons.org/licenses/by/4.0/).
Copyright: This open access article is published under a Creative Commons CC BY 4.0 license, which permit the free download, distribution, and reuse, provided that the author and preprint are cited in any reuse.


