Submitted:
11 February 2025
Posted:
11 February 2025
You are already at the latest version
Abstract
Malware analysis is a crucial area of cybersecurity, focusing on identifying, categorizing, and studying malicious software to prevent it from posing a threat to computer systems. This paper introduces a new approach to malware analysis by integrating two methods, Shared Code Analysis (SCA) and Shared Attribute Analysis (SAA). The SCA component searches for similarities in code within multiple malware samples using the MinHash techniques. The SAA component uses the Jaccard indexing technique to analyze and approximate similarity based on malware samples’ attributes. The visualization is implemented using NetworkX with Graphviz, where nodes represent individual malware samples and edges represent close relations. The visualization is provided as a PNG file, demonstrating the grouping of related malwares according to their attributes. A real-life case based on malware samples from GitHub repositories illustrates the application of the proposed methodology. The integration of the Jaccard Index and MinHash provides an extensive method for covering the relationships among malware and enhancing detection and categorization steps. This approach not only provides a better understanding of code patterns, but it also helps visualize attribute-based maximum similarity, making it a valuable tool for researchers and cybersecurity professionals.
Keywords:
Malware analysis
; Jaccard index
; MinHash
; Network visualization
; Cybersecurity
; Data mining
; PE (Portable Executable)
1. Introduction
Malware is becoming increasingly complex and dangerous, therefore presenting real threats to computer systems, networks, and data. Malware is currently on the rise in society, necessitating efficient malware analysis for any organization that is serious about safeguarding its computer system [1]. Historically, common strategies for analysing malware have included static and dynamic analysis, which provide valuable insights into the behaviour of the malware and its code [2]. However, due to the increasing sophistication of malware, the methods may not adequately highlight its features and richness [3,4].
To address these challenges, this paper presents a novel approach to malware analysis that integrates two distinct methodologies, Shared Code Analysis (SCA) and Shared Attribute Analysis (SAA). These two techniques are combined to enhance the efficiency and effectiveness of malware analysis, enabling better identification of similarities and differences among diverse malware types.
In recent years, the mode and density of malware have significantly improved or advanced. Signatures and heuristic analysis have not been capable of coping with this evolution in traditional manners. This is why researchers and practitioners have gone further and employed machine learning, behavior analysis, and code similarity [5].
SCA compares two or more malware samples based on similarities in their manufacturing code. This paper discusses the use of molecular techniques like string extraction and similarity measurements to compare one sample with others. This method significantly contributes to understanding the structure and behavior of current malware by enabling the identification of various families and types of malicious programs.
On the other hand, SAA focuses on analyzing the attributes or features of the malware samples provided. This method compares the samples according to their attribute sets, whereby the use of MinHash and sketching results in an approximation of the samples’ similarities. This approach not only helps in recognizing similar samples, but also helps to represent the relationship between the said malware in PNG image form.
1.1. Related Work
Zhao et al. [6] have enhanced the Faster Region-based Convolutional Neural Network (R-CNN) model and proposed a new malware detection method that relies on the textures (or images) of a binary code. Object detection algorithms are used to find malicious patterns in the binary data representation, and transfer learning is used to make the malware detection models work better with fewer training samples. Currently, this method frees up feature extraction, making it less of a manual process and therefore more efficient. However, converting binary codes into images can pose a challenge, as the translation process may fail to accurately depict signals due to minor variations in binary codes, particularly when translating to compact images. Furthermore, the incorporation of Faster R-CNN increases complication and computation time, making it unsuitable for real-time large-scale malware identification, despite the model’s potential to improve the malware detection rate.
Qi et al. [7] improved upon related research by using deep learning directly on raw binary programs with no need of code visualization. This method allowed the model to learn features in binaries while retaining all the details, unlike Zhao et al.’s work, which transformed binaries into images. This not only reduced the time it took to craft features but also increased accuracy because this deep learning framework was able to learn both low-level and high-level features directly from binaries. The drawback of this approach is the use of a deep learning framework, which requires extensive neural networks, making the process computationally intricate and time-consuming. Furthermore, while the model was functional for detection, its lack of a proper preprocessing phase resulted in slow performance, especially when dealing with large amounts of data containing malware samples.
Kita and Uda [8] continued the work by developing an efficient preprocessing method that uses the suffix array to detect malware in the binary code’s byte sequences. This approach significantly reduced the preprocessing time, a computational inefficient aspect of Qi et al.’s deep learning-based model. Additionally, Qi et al.’s approach of using byte n-grams worked better at separating different types of malwares, and this model was especially good at finding small changes in malware that older methods would have trouble finding on their own. This method was better for real-time detection because it focused on speeding up preprocessing and finding specific types of malwares, unlike earlier methods that needed more computing power and had time limits of preprocessing [9]. Therefore, their method required less time for analysis and was capable of processing large datasets of malware.
Andreopoulos [10] recognized the limitations of Kita and Uda’s proposal, which relied solely on static analysis. To mitigate this, the study combined sequence-based machine learning with deep learning to analyze the malware both statically and dynamically. This approach offers a more sophisticated method of malware detection, based not only on its code but also on its coordination during execution. While this method enhanced detection accuracy, it also augmented model integration and real-time system handling, potentially complicating its effective implementation. As mentioned by Andreopoulos, it is possible to conduct a hybrid analysis of the information sources to identify the elements involved and the relationships between the elements. Judy and Khilar’s [11] research aimed to enhance hybrid analysis techniques while attempting to reduce the associated complexity. They developed an elegant machine-level static and dynamic analysis to enhance the results of flow analysis and effectively detect malicious code, all while minimizing computational costs. The proposed method was the most beneficial in terms of accurately analyzing and categorizing malware. However, the study focused solely on assessing the precision of the solution, without delving into the implementation of the procedure to provide a scalable solution in a vast data context. By fine-tuning a deep learning model for static analysis of Portable Executable (PE) files, Lad and Adamuthe [12] extended the study by Judy and Khilar. Their model improved the scalability issue while maintaining high detection accuracy, making it suitable for large-scale Neural Turing Machine (NTM). The study demonstrated that employing the deep learning approach can yield reliable malware detection results, eliminating the need for complex hybrid models. Still, such an approach might prove insufficient, since the model may fail to notice malware that functions as intended only during the execution phase.
To overcome the shortcomings with Lad and Adamuthe’s static-focused model, Alqahtani [13] combined both static and dynamic features in the machine learning methods. The paper primarily focused on secure or privacy-preserving techniques, and the authors highlighted the vulnerability of sensitive information leakage during malware analysis, a common limitation in most research works. This work suggested directions for improving the stability and privacy of the malware detection systems, though it provided more frameworks for future investigation than methods and solutions.
1.2. Contributions
To address these challenges, this paper presents a novel approach to malware analysis that combines two distinct methods, SCA and SAA. The SCA component identifies code similarities across various malware samples by employing the MinHash techniques. The SAA component employs the Jaccard Index method to evaluate and estimate similarity based in the attributes of malware samples. The visualization uses NetworkX in conjunction with Graphviz, where nodes represent distinct malware samples and edges indicate their close relationships. A PNG file is included, showcasing the grouping of related malwares based on their attributes. A practical example, using malware samples from GitHub repositories, demonstrates the proposed methodology. The combination of the Jaccard Index and MinHash offers a comprehensive approach to understanding the connections between malware, thereby improving detection and classification processes. This method enhances the comprehension of code patterns and facilitates the visualization of attribute-based maximum similarity, making it a significant resource for researchers and cybersecurity experts.
The primary contributions of this article are outlined below:
- Integration of Dual Analysis Techniques: This paper has centralised both the analysis of shared code and shared attributes. The two perspectives on malware connections are established through code comparison using the Jaccard Index and attribute comparison using MinHash. By integrating both file reusability and attribute similarity, it evaluates them more efficiently.
- Advanced Visualization Techniques: This work employs advanced visualization techniques, utilizing Graphviz, to create intricate malware instructional structures. Graphviz’s use of nodes and edges, along with the manipulation of some nodes’ size and colour, enhances the interpretability of the output. This type of visualization surpasses conventional methods by offering a more interactive approach to displaying malware relationships.
- Scalable Similarity Measures: This paper employs the MinHash algorithm to approximate the Jaccard Index at a lower computational cost. This approach helps to make similarity measures more scalable so that analyses based on the malware data will not become unduly large.
- Practical and Dynamic Data Collection: This paper uses public repositories on GitHub to gather up-to-date and diverse malware samples. Also, the ability to watch over these samples with a Shelve database and its query capabilities presents a viable idea of operating with datasets in evolution.
- Comprehensive Malware Detection Framework: This is a detailed and useful framework that merges code and attribute analysis methods. The combination of the two methods improves malware detection, accomplishment, and classification, unlike integrated systems that do not optimally integrate the two methods.
2. Related Theory
The related theory for the proposed algorithm is outlined below:
2.1. Static Analysis
Static analysis is a procedure that uses data visualization to analyze code and malware structures without executing the program. Obtaining malware samples, whether PE files or binaries, is the first step in this process, which then extracts opcodes, function calls, and control flow graphs. To detect malbehavioral patterns, it primarily relies on the discovery of static features and signatures that are associated with the malware files. In this paper, it stores most of the extracted attributes and compares them for similarity using methods like Jaccard Similarity or even MinHash. Strings, headers, and libraries are the primary structural components of the samples in question, and the system compares them with other known threats. This step is necessary if the system must classify malware after developing codes to form families. Finally, graphs display these epidemic static attributes, with nodes representing malware samples and edges representing structural similarity. Large, interrelated clusters represent various types of malwares, allowing researchers to consider the dependencies and proximity of different families in the information space. This type of analysis speeds up the classification of the malware and subsequent analysis, even when it is not active or running [3].
2.2. Dynamic Analysis
This method analyzes malware patterns in a separate environment, like a sandbox or virtual machine, allowing for immediate observation of behavior. This method provides researchers with the needed vision to represent how malware engages with the system, covering network communications, modifications to files, registry changes, and process formation. The goal is to record the malware’s runtime actions to identify behavior patterns that reveal malicious intent [18]. In the initial phase of dynamic malware analysis, this paper conducts testing in a secure location to protect the host device from potential threats. Monitoring instruments document a variety of actions within execution, such as API calls, system resource access, and outbound communication with external servers. These situations involve the application of methods related to large amounts of data that indicate the targets of the malware, revealing whether it seeks to extract data, circulate ransomware, or extend its networks. This paper converts the gathered behavioral data into a visual format for a more in-depth analysis. Systems illustrate their operations through visuals like graphs, where nodes represent various activities or API calls, and edges signify the directional flow of these activities or their interconnected relationships. The graph can display important facts that draw attention to notable behavior patterns, indicating crucial decision points related to the malware and the agents that trigger malicious actions [3,19].
2.3. Jaccard Index
The Jaccard Index is a technique for assessing malware similarity by concentrating on the individual strings found within their binary files. It is necessary to develop legitimate coding standards and conduct a comprehensive analysis of several malware cases. The first aspect of the discussion looks at important features of the malware binaries, including strings, function names, and unique sequences that form essential parts of the code. This paper obtains these features as data groups, each of which corresponds to a specific malware sample, and computes the Jaccard Index on pairs of malware samples by comparing their respective unique string collections. The Jaccard Index methodology generates a score from 0 to 1 by dividing the common components of two sets by their total combined count. A score in the upper range signifies the close placement of coding elements or structures, while a score in the lower range suggests their relative separation. This paper uses the Jaccard Index to convert the similarity scores from the visualisation stage to a graph. This representation depicts malware situations as nodes, with the edges that form between them signifying similarity scores. A substantial Jaccard Index exposes that computers suffering from malware frequently share connections or closeness to one another, adding to the presence of similar malware characteristics [4].
The rationale behind selecting the Jaccard Index in the SCA algorithm is outlined below:
- Parameter Choices: The Jaccard Index compares corresponding sets from malware code, such as extracted strings or byte sequences. Another major factor to be considered is the size of the set – big sets might give more precise values of similarity measures, and, conversely, little sets might give comparisons of a more general type. The string-matching level, such as or , determines when two malware samples are considered equivalent.
- The Jaccard Index is selected as the natural measure as it is for binary or categorical data sets, which is common when analyzing malware where features are present or not presented, for example, API calls. It provides a straightforward yet effective method for assessing the intensity and similarity of two sets, based on the ratio of the intersection set to the union set.
- Handling Different Types of Malwares: The Jaccard Index is utilized to compare two sets of features, like strings or API calls, extracted out of two malware samples. The binary categorization of these features enables the Jaccard Index to measure the similarity between two malware samples in terms of their defining features, even in cases where the malware’s code has undergone mutations or obfuscation.
The SAA algorithm chose the Jaccard Index for the following reasons:
- Parameter Choices: In SAA, Jaccard Similarity is adopted to address the similarity of sets of attributes for instance API calls. The set size (number of attributes) manages to play a decisive part since a larger set yields a denser comparison. A similarity of is generally used to filter out true positives with fewer chances to involve false positive forms.
- The Jaccard index effectively measures the degree of similarity between two features, such as the type of API call or the system behaviour of two malware specimens and predicts the degree of similarity between these specimens. This makes it particularly suitable for SAA, where we juxtapose sets of attributes that define malware.
- Handling Different Types of Malwares: To the author of SAA, Jaccard is suitable to use because of the capability to measure its overlap, which is important when comparing the behavioral or functional similarity between the samples where they belong to different families or contain polymorphism.
2.4. MinHash Algorithm
The MinHash algorithm is applied to quickly approximate Jaccard similarity measures for large sets of malware samples of various phenomenologies. Comparing malware using conventional methods, which delve into every possible feature or characteristic during data analysis, is computationally costly. MinHash is useful because it allows for quick approximation of the distances between malware samples without increasing storage or computation difficulty. The process starts by mapping a malware sample into a set of features or attributes that describe it, such as strings derived from binaries. Instead of comparing two sets, which can be time-consuming, MinHash reduces both sets into a smaller signature. These signatures are simply representations of the original data, and they provide efficient representations of the sets’ features for comparison with smaller versions of the originals. MinHash operates by hashing the elements with the malware sets and then selecting the minimum hash for each common function. These minimum values form the MinHash signature of the set, which represents the absolute minimum of all Miller Rank values. Instead of working with sets, this paper will compare the MinHash signatures between two malware samples and then use the elements of these signatures to estimate the Jaccard coefficient between the original sets, which involves matching the corresponding signatures and counting the elements. Since it involves many sets of data, the computation of average percentile rank in linear time makes it highly suitable for large-scale malware analysis [14,20].
The SCA algorithm chooses MinHash for the following reasons:
- Parameter Choices: MinHash is selected because it provides a fast way for approximating set similarities. The important factor in this case is the number of hash functions employed to create the MinHash signatures. A larger number of hash functions leads to the improved accuracy of the similarity estimation, but it also increases the computational load. In this case, a moderate number of hash functions is chosen to meet the requirements of desired precision and response time (50-100 hash functions).
- The MinHash algorithm has been found most effective, especially with large data sets and obscured malware examples. In general, malware code obfuscation, or polymorphism, makes its identification and matching toward the deployment strings problematic and variant sensitive. MinHash provides an approximate method that calculates the probability of association between sets of strings or code snippets, without the need for direct matching.
- Handling Different Types of Malwares: SCA reveals that the structure of a malware code can change due to obfuscation, mutation, or polymorphism. MinHash resolves these different data strings by focusing on similar subsets of features, such as API function names or system calls, enabling it to identify similarities in mutated malware, even when the code has undergone numerous transformations.
The reasons for selecting MinHash in the SAA algorithm are outlined below:
- Parameter Choices: In SAA, MinHash is used in a similar manner to approximate the overall similarity of sets of attributes associated with different malware (such as API calls, file access, or network traffic, for example). The primary measure used in SAA assesses the relevance by determining the number of hash functions used, typically between 50 and 100, to ensure efficient and accurate computation in similar instance detection.
- MinHash is incorporated into SAA due to its ability to compare large vectors of malware attributes, which may be concealed or transformed. Below is an example of behaviors that a malware sample can display, demonstrating how MinHash can assist in developing a practical, scalable method for analyzing the similarities between these behaviors, while acknowledging that each sample need not be identical.
- Handling Different Types of Malwares: In SAA, features such as file behaviour, system calls, or net operation may be examined. This allows MinHash to calculate the similarity of these attributes across various malware samples, irrespective of their formats, styles, or obfuscations.
2.5. Graphviz
Graphviz is a graphical tool that primarily creates structural diagrams by connecting nodes and edges. Graphviz is especially helpful when the nodes represent the number of samples, and the edges represent the relationships or similarities between them. The first step involves quantifying the similarity between malware samples using methods like MinHash, which approximate the likelihood of relatedness between different samples based on attributes extracted from the malware binaries. Each encoding is linked to the others through structures called edges. The weights on these edges show how similar the connected encodings are, and the nodes in the graph show different malware samples. After creating the similarity data, Graphviz builds a graphical view. According to the computed similarity scores, the edges express how close two samples are. The samples that are more similar in the map are connected closer; if their edges are short, it means that they are more similar than samples joined by thicker edges; in other cases, they are presented further apart. Graphviz visualization aids in identifying related malware clusters, depicted as “cliques”, or densely connected nodes within the network. Cybersecurity benefits from this type of representation as it helps analysts understand the relationships between malware variants and the behavior or structure of a particular family or strain [15].
2.6. Limitations of Present Approaches
Existing techniques in the form of MinHash, Jaccard Index, and visualization strategies are adequate for specific operations in malware analysis but unable to be applied alone.
- MinHash: It is efficient for detecting shared code fragments but struggles to analyze attribute-level similarities.
- Jaccard Index: It measures the similarity of attributes successfully but requires appropriate adaptation towards malware datasets.
- Visualization methods are important but do not use a holistic approach of both coding and attribute assessment.
These limitations thus drive the need for a unified framework addressing these shortcomings to be able to better and scale the malware analysis. This is what drives our proposed methodology underlined by this cue.
3. Methodology
3.1. Shared Code Analysis
The SCA component focuses on identifying similarities in the code of malware samples through the following steps. The SCA instance only deals with the identification of similarities in core of different samples of malware through the following process:
- Data Collection: In this paper, malware samples from multiple GitHub repositories, which contain several executable files. GitHub Choice does, however, present a selection of malware samples, both from different families and their derivatives.
- Feature Extraction: Extracts the mentioned textual features from each malware sample by invoking the terminal command “strings”, which outputs all unique strings present in the given sample. This utility extracts printable characters from binary files and groups them into sets. This paper derives these characters from the strings and analyze them to compare the similarities between them.
-
MinHash Algorithm: The MinHash algorithm is used to calculate the Jaccard Index similarity between two distinct clusters. It generates MinHash signatures and sketches of the malware samples’ attributes. The MinHash technique involves:
- To create minimum hashing signatures, the attributes are hashed using several hash functions.
- The system generates MinHashes and then merges them into sketches, which the database utilizes for similar queries.
Code Implementation: This paper implemented the SCA using Python code. The code includes functions for obtaining strings, verifying whether files are Windows PE executables, and performing the MinHash Computation. The code receives 'malware files', computes several 'similarity metrics', and then constructs a 'graph', where nodes represent 'malware samples', and edges represent 'similarity'. Figure 1 shows the block diagrammatic representation of SCA. The explanations for each of the blocks are as follows:
- Arguments from User: It enters the script, reading command-line arguments, and input from the user.
- Arguments Parsing: It parses a command-line argument to determine the path for malware-associated files, the database operations to be performed, and the search parameters to be utilized. It allows one to set it up to run different processes depending on the intended use.
- Filter out PE Files: It ensures the analysis of only Windows Portable Executable (PE) files with the correct header signature, while discarding the relevant files.
- Wipe Previous Database: If necessary, the script erases the existing database to eliminate the impact of previous data on the analysis.
- Create Database: The microcontroller provides a new data base in which to store all historical details about each sample of malware, as well as its attributes and hash values.
- MinHash of Sample Attributes and Sketches: This creates MinHashes and sketches of the malware attributes to try and find other samples that are like a given one.
- Store Samples in Database: The database stores the analysis results and characteristics of malware samples, enabling effective indexing and subsequent use.
- User Comments on Samples: A user can also make comments on specific malware samples and thereby contribute to the database’s development in terms of more observations or experiences.
- Search for Similar Samples: Using MinHashes and sketches, users can specifically locate a given file and categorize it as malware or not, resulting in similarity scores plus comments.
3.2. Shared Attribute Analysis
The SAA component oversees searching for the same attributes found in the malware samples. The methodology involves:
- Data Collection and Storage: Collection of SCA samples of malware and describe the characteristics of this type of file and then save these attributes in a database along with Jaccard Index and the sketch.
-
Jaccard Index Calculation: The Jaccard Index to gauge how similar the extracted string set is to other malware samples. The most used metrics in Jaccard-based analysis are the size of intersection and the size of union, which measure the similarity between two sets [16].The formula is given by (1) as,A and B represent sets of extracted strings from two distinct malware samples. Therefore, the resulting index ranges from zero to one, a value of zero indicates that cannot compare the two sets under consideration, while a value of one indicates that they are identical [17].
- Database Management: A Shelve database is used to store samples of malware, Jaccard and sketches of the samples. It also enables query search and comparison of samples, as well as ways to store and manage Jaccard and sketches.
-
Visualization: The Graphviz tool represents the similarity relationships of malware samples as a graph. They serve as a model for malicious software, where nodes represent samples and edges signify their similarity. They share the visualization output in the form of a PNG image.The specific visualizations created with the help of NetworkX and Graphviz in the current study provide a simple representation of the similarities between the malware samples; the nodes in the figure correspond to the malware samples, and the edges represent their similarities in terms of the attributes, such as the API calls. These visualizations are useful in illustrating the relationships between samples, but they lach the depth required for the instrumentation and categorization of malware for practical applications.
- Limited Analytical Insight: The current graphs primarily highlight the structural connections between various malware samples, without delving into the underlying nature of these relationships. These issues arise when investigating numerous malware program examples, as centrality measures and community detection exceed the capabilities of the available data space.
- Improvement Through Advanced Graph Techniques: Subsequent implementations of the methodology could use community detection algorithms, such as the Louvain method or modularity optimization to isolate clusters of associated malware types. This would empower analysts to make befitting categorization of malware into categories depending on their behavior or functionality. Another way this could be beneficial is by providing more insightful and useful data for decision-making.
- Incorporating Dynamic Attributes: Including dynamic attributes into graphical representations could be a major enhancement. For instance, the escalation of the threat could refer to characteristics like the mutation of the malware, the evolvement of the usage of API calls, or just the alteration of the obfuscation methods that could be traced and illustrated following the evolution of a particular family of the malware. This would assist in gaining insight on malware trends and what new threats are out there that cannot be recognized using the static signature way.
- Interactive Visualization: The graphs could be further enriched with interactivity, where people could explore specific samples of malware, examine and look at detailed descriptions of samples, and consider the selective parameters that would help in calculating the similarities between the samples. More specific search effects, such as mouse-over effects, similarity thresholds, or interactive clustering, would make it easier for analysts to work with the data and make good real-life decisions.
Code Implementation: The SAA code contains several functions related to sample storage and search, comment management, and the database in general. The use of Jaccard Index to generate signatures and sketches, facilitating scalable similarity detection. Figure 2 shows the block diagrammatic representation of SAA. The explanations for each of the blocks are as follows:
- Arguments from User: The script begins with defining command-line arguments, which may be typed in by a user. These arguments include the directory containing the malware files, the output file for the similarity graph, and the passed similarity threshold between the files.
- Parse Args: They serve to create a script at the command line level and to specify the executive parameters of the task. This means that in source code, only the input and output paths and other features, such as the similarity threshold, remain at the site.
- Appending Full Path of All Malware Files: The script reads and stores in the list the full path of all the malware that exists in the directory mentioned. This guarantees the scanning and subsequent analysis of all files within a directory.
- Check for PE File: To eliminate every non-Windows PE file, the script validates every file using the PE header signature “MZ.” The script only applies additional steps to files with PE headers, ignoring those in other formats.
- Extract and Store Attributes of PE Files: The script extracts strings (attributes of PE files) from each PE file, using a utility string as a guide. Every malware sample in the database has all these attributes gathered and preserved; the combination of strings from all the PE files constitutes this large dataset.
- Add Attributes to Graph: The system generates a similarity graph of attributes based on the features extracted from the sample data. The system relates the graph to the malware samples, awarding points based on the similarity of attributes between two samples.
- Calculate the Jaccard Distance: This tool proves useful when analyzing the three relationships between the attribute sets of different types of malwares. The tool’s purpose is to determine the degree of similarity between the two samples in terms of the characteristics under comparison.
- Threshold for Identifying Similarities: It includes a similarity ratio that determines which malware samples are more similar or belong to the same group. When the Jaccard distance between two samples increases, it indicates a high degree of similarity between them, leading to the creation of an edge in the graph.
- Show the Graph: Lastly, the script computes the similarity graph on the provided corpus, using a tool such as Graphviz. The node data models indicate the sizes of the malicious samples, while the edges illustrate the relationships between the samples and their attributes. The following graph illustrates some of the interrelationships between the different types of malware samples.
3.3. Integration of SCA and SAA
Many prior approaches to malware analysis involve making decisions based on measuring only one attribute of the specimen, either structural or behavioral, whereas in reality, the specimens can have complex interactions. Opcode and function call-based analysis techniques are effective at finding structural resemblances in code but are inadequate at finding run time behaviors. On the other hand, dynamic analysis methods are useful for analyzing execution characteristics such as APIs, network communications, and file changes. However, they are unable to analyze structural code reuse. To fill this gap, this research presents the concept of a unified approach to a more holistic form of malware analysis that includes the use of both SCA and SAA.
- Complementary Strengths: SCA focuses on the identification of structural similarities concerning detected reusable code fragments of functions and other similar features using MinHash and Jaccard indexes. SAA centres around such similarities in context and behavior as API calls, string patterns, and dependency relations. Integration carries the positive aspects of both techniques and relates the structural and behavioral characteristics of the samples to reveal more profound connections between the malwares.
- Resistance to Obfuscation: Any form of obfuscation, like polymorphism or encryption, often renders dynamic analysis ineffective. Nevertheless, integrating SAA results in the capability of the framework to detect the higher-level behavioral patterns of the subjects and their ability to evade such methods. It is also two-tiered to give cross-checks so that the detection mechanism is immune to manipulation strategies.
- Unified Visualization: The framework utilizes graphing tools, specifically Graphviz, to present relationships based on structural and behavioral analysis. In these visualisations, the nodes are the malware samples, and the edges point to related content found among these samples. The integration makes it possible to detect a malware family, the relationship between different variants, and even similarities between several different families.
Figure 3 represents the block diagrammatic representation of integration of SCA and SAA. The explanations for each of the blocks are as follows:
- Data Input Collection: Malware samples include code snippets, attribute metadata like file size and API calls, and description of functionality.
- Preprocessing: Such cleaning and normalization of gathered data are done using tokenizing the code, getting features from metadata, thus making data suitable for further analysis.
-
Dual-Analytical Framework:
- Shared Code Analysis (SCA): MinHash will find structural similarities in code. This would enable very effective detection of shared code fragments in different malware samples.
- Shared Attribute Analysis (SAA): Employ Jaccard Index to impose again, similarity properties this time onto meta-information: file sizes, use of API.
- Integrated Similarity Computation: It combines SCA and SAA scores, which give a unified score regarding the similarity between two samples. The score incorporates the structural and attribute-related characteristics of malware samples.
- Clustering and Anomaly Detection: The malware samples are identified as groups of clusters representing malware families, while anomalies representing outliers are marked for future analysis according to the similarity scores.
-
Visualization:
- Scatter Plots: Show groups of malware and outliers.
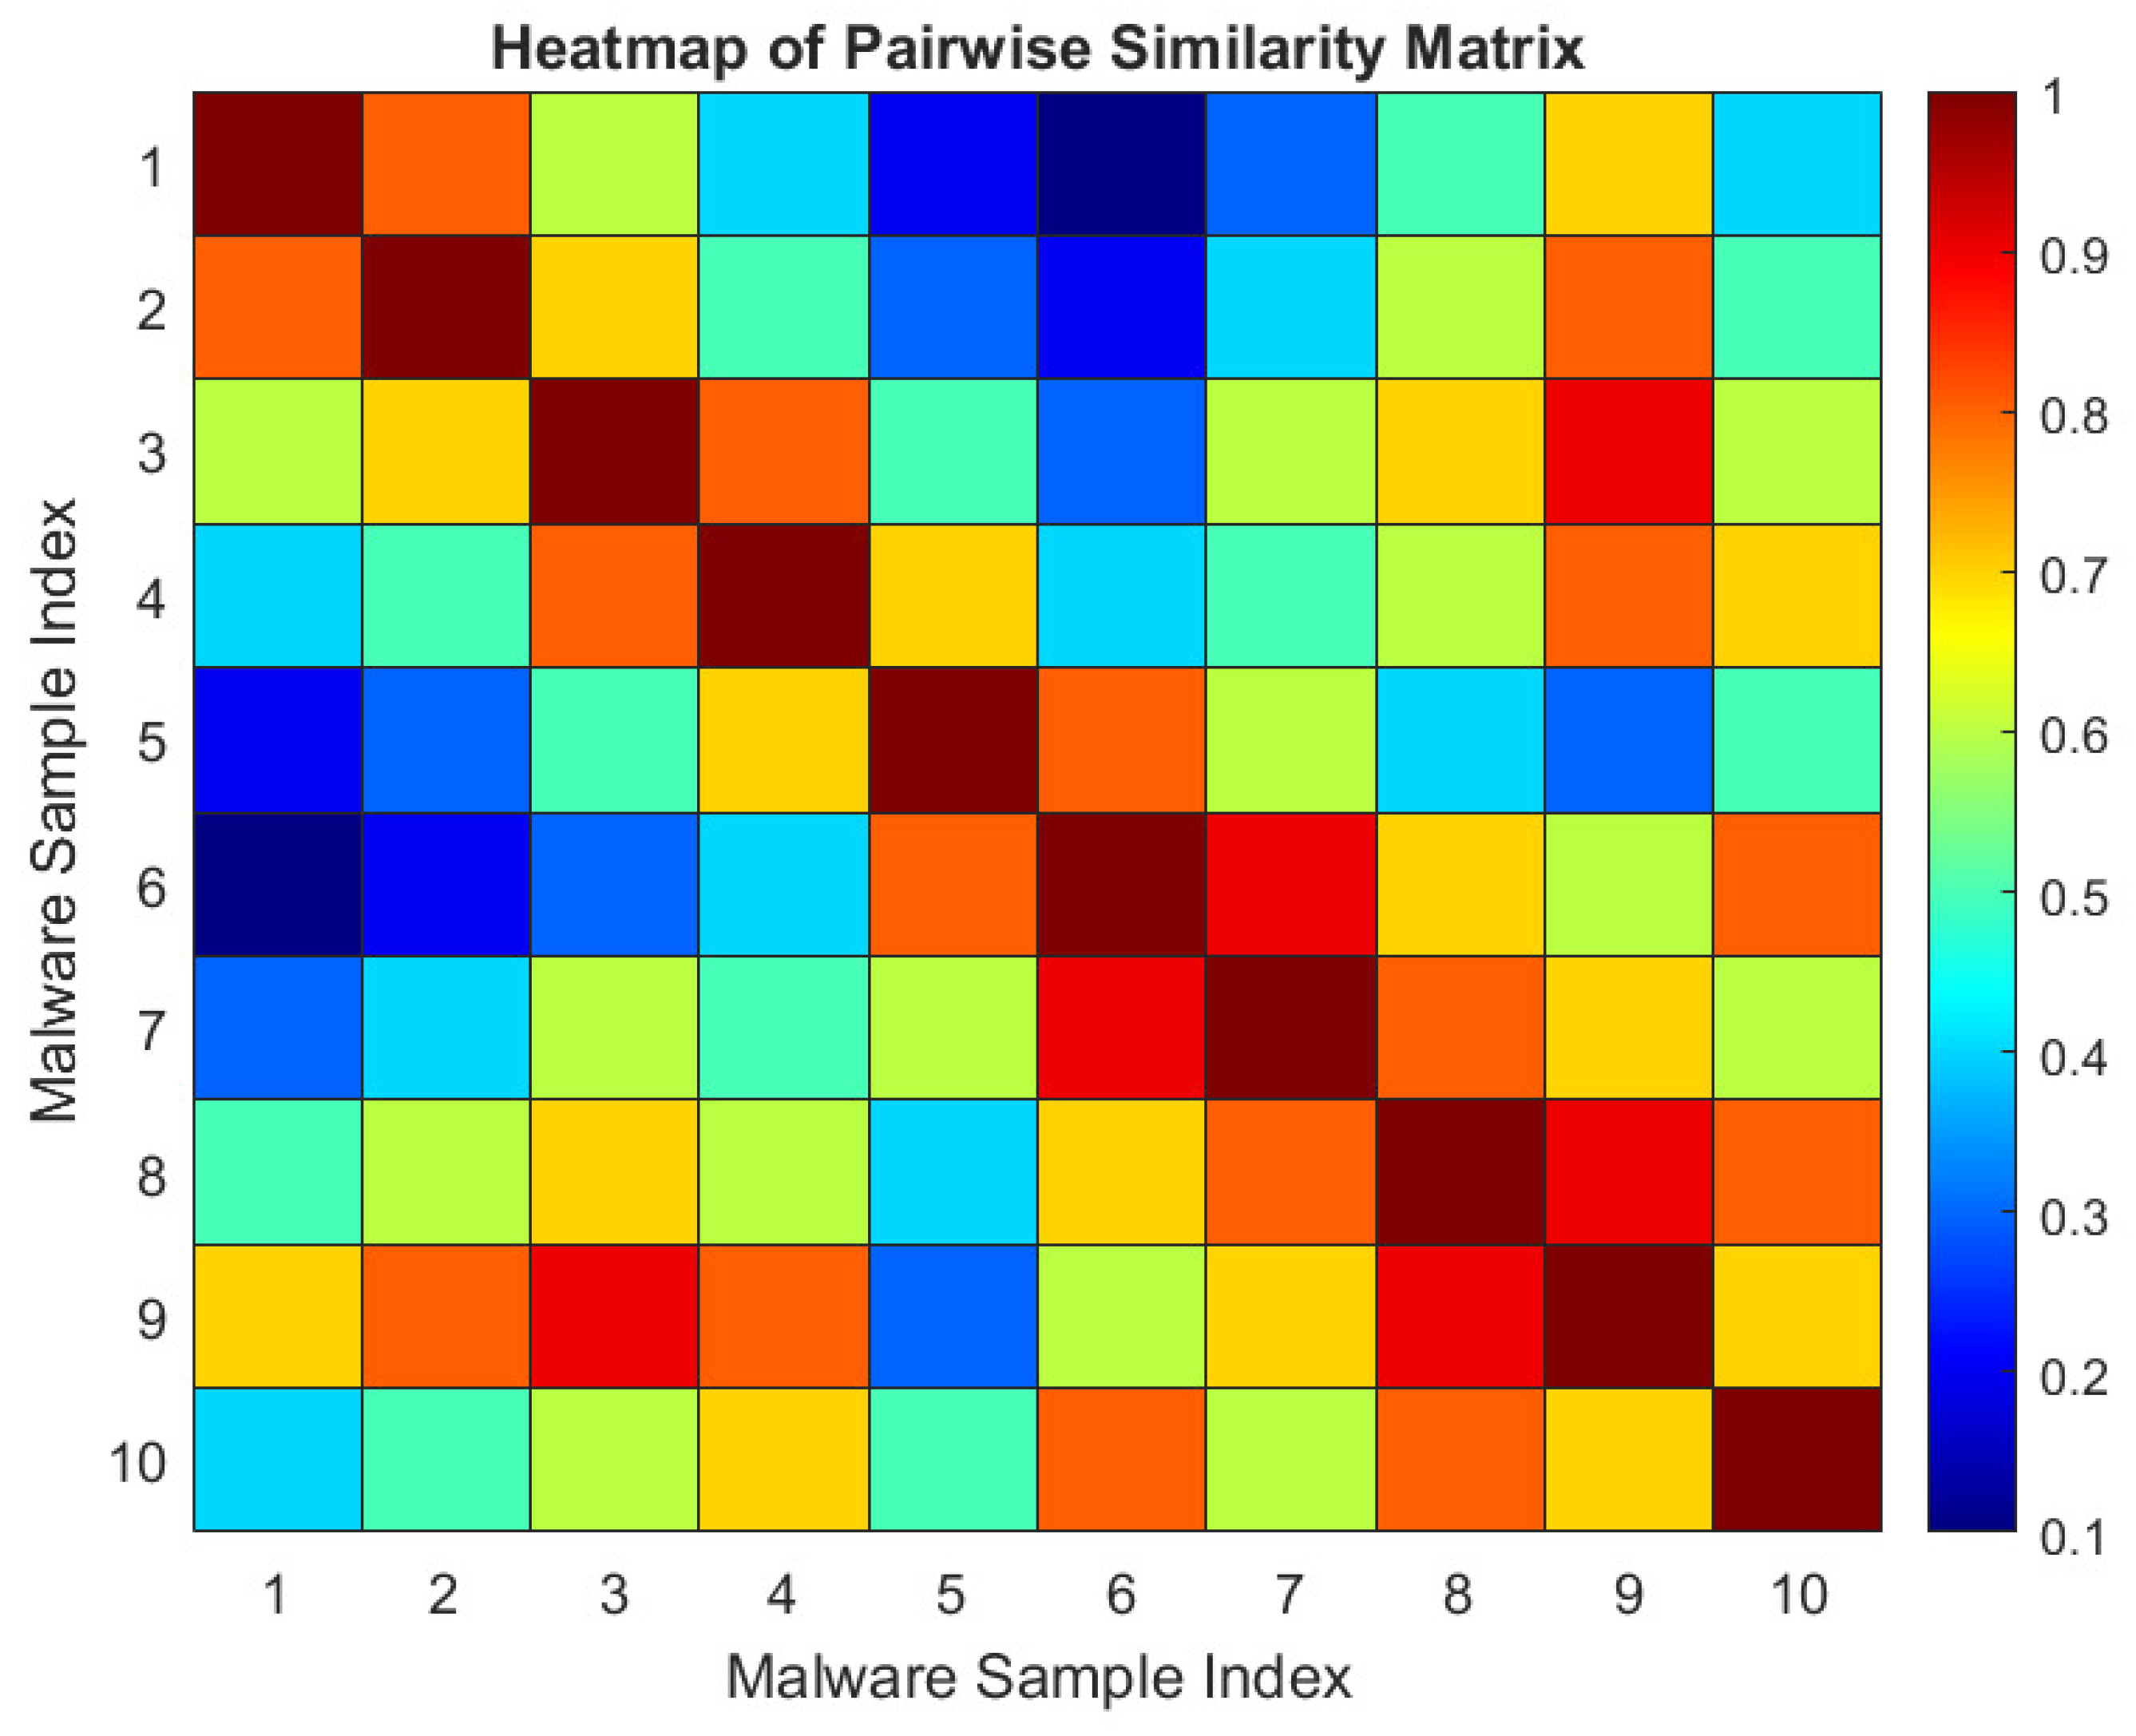
- Heatmaps: It all shows the pairwise relationships of malware samples for an overall view regarding distribution similarity.
- Results Interpretation: Analyzing results to derive actionable intelligence for malware family relationships and patterns with possible threats.
3.4. Threshold Strategies for Effective Malware Detection in SCA and SAA
-
Threshold Choice for Similarity Measurement: In SCA and SAA, similarity thresholds are crucial to identifying between which malware samples are similar. These thresholds are set scientifically and tested empirically to classify the samples of malwares into the right family or variant within families if exist.The commonly used thresholds are:
- -
- 0.6 for all-over relationships for different types of malwares.
- -
- 0.7 is the best test characteristic, offering a better trade-off between false positives and false negatives.
- -
- 0.8 for fine-grained clustering, both within families and within families for similar types of malwares in the case of a large number of similar and similar malwares.
-
Justification for Threshold Selection: The values used for these thresholds have been determined empirically using the discussed equations with the help of the malware samples belonging to various families. Such values, such as 0.7, are said to conform to clustering precision and avoid a high likelihood of mis-grouping contacts.
- -
- Threshold of 0.6: The threshold of 0.6 provides a more general mapping of relationships between various kinds within malware types, making it suitable for detecting families that appear similar at a high level of abstraction but differ significantly at a low level of malware code or behavior.
- -
- Threshold of 0.7: This threshold is optimal for most malware families, as it ensures a true positive rate equal to the recall, while simultaneously minimizing false positives. It forwards consistently without over-learning, which makes it ideal for identifying new samples, which are variants of a basic malware type.
- -
- Threshold of 0.8: The threshold of 0.8 is utilized for other malware types that belong to the same family. This threshold is perfect when you wish to cluster very similar malware samples which only differ slightly.
-
Effectiveness Across Different Malware Families:
- -
- Polymorphic Malware: Over time, the executable’s parts or entire form may change, complicating the classification of such samples. Even when the input matrix is transformed through functions such as MinHash and Jaccard Index, which remove any sense of position related to value occurrence, applying the framework with a coefficient of 0.7 ensures that he polymorphic variants belonging to a particular family are clustered appropriately.
- -
- Cross-Family Detection: We set a similarity of 0 at 0.6 for similar samples from different malware families that may exhibit similar behavior (e.g., spyware or ransomware with a similar function), even though their code may differ.
-
Impact on Robustness: The thresholds play a crucial role in ensuring the robustness of the framework, especially when dealing with:
- -
- Polymorphism: The capability of the malware to evolve in terms of structure but not in terms of its primary function.
- -
- Obfuscation: This is a common practice used by malware programs worldwide to mask their true functions with deceptive ones. They emphasize that even when the code of two variants of a given malware differs substantially, a threshold like 0.7 still allows the framework to identify similarities between obfuscated malware samples.
3.5. Evaluation and Comparison with Existing Tools
- The current evaluation is based on malware samples gathered from GitHub repositories, providing the first clue about how the proposed methodology should work to identify similarities and classify new attachments by family. However, the limited sample size and lack of diversity in malware types hinder the current analysis, making it challenging to apply. This is because there is not enough research on the approach’s resilience and flexibility against various threats.
- In future studies, they need to extend the evaluation protocol to more commonly used malware datasets such as the CICIDS dataset or any other dataset with benchmarked files. This would enable a comparison of the proposed methodology with other malware analysis tools, like VirusTotal, YARA, and signature-based systems, and therefore a systematic comparison of the strengths and limitations.
- The proposed approach is more powerful than the conventional signature-based methods in one aspect, particularly in detecting new or modified URLs belonging to the same group or different from the predefined fingerprint signature. This is especially important for polymorphic or obfuscated malware, which is beyond the capabilities of signature-based detection immune systems.
- Future comparisons should incorporate a greater number of malware sample representatives to enhance accuracy. Apart from evaluating the effectiveness of the methodology, we should also consider other factors like accuracy, false positive and false negative rates, and the duration of the analysis.
4. Results
The results are categorized into two parts: Shared Code Analysis and Shared Attribute Analysis.
4.1. Shared Code Analysis Results
The Shared Code Analysis component produces terminal output in the form of lists of pairs of malware samples and their calculated MinHash values. This index measures the number of matches between the codes of at least two different malware samples. Judging by the terminal output, one can get an idea of how much one malware sample reuses the code from the other samples, allowing one to find out which samples contain similar code. Figure 4 and Figure 5 show output 1 and output 2 of shared code analysis, respectively.
Linux commands used for shared code analysis:
-
python listing_5_2.py- l ../data/Malware_samplesThis command reads all the malware samples in the folder and analyse the code share between the samples.
-
ii. python listing_5_2.py -s ../data/Malware_samplesThis command gives the output in the form of a number which is in between 0 and 1, this implies the percentage of code shared between samples.
Listing_5_2.py is the python code for shared code analysis.
The shared code analysis outputs 1 and 2 are derived from distinct malware sets of samples, revealing the shared code among the malwares.
4.2. Shared Attribute Analysis Results
The Shared Attribute Analysis component offers means to represent the relative connectivity between different samples of malware. Graphviz creates this visualisation and exports it in the PNG format. The graph displays nodes representing various individual malware samples, with the edges connecting them signifying their respective levels of similarity. The larger and more saturated the colour nodes are, the higher their level of similarity.
PNG Image Visualization:
- In this paper, coloured and sized the nodes in the graph visualisation based on the calculated similarity scores between them. Bigger nodes with darker colours depict similar samples.
Key Observations:
- Small and dense groups of nodes suggest clusters of similar malware samples, where each node is more like nodes in the middle of the cluster.
- Samples with high density (i.e., many edges) are also likely to belong to the same malware family or contain a significant amount of the same code or parameters.
It helps determine the group of related malwares, see families, and further variants of the malware. It enhances the process of building a relationship system for malware samples, thereby simplifying the process of conducting investigations and analyses into the spread and development stages of malware.
Linux command used for shared attribute analysis:
-
python listing_5_1.py ../data/ output.dot fdp -Tpng -o output.png output.dotThe above command listing _5_1.py is the python code for shared attribute analysis which is implemented by giving the path of the Malware samples folder. Here the dot file is converted into PNG image file.
The output of the shared attribute analysis is based on the shared code analysis, which is implemented as a visualisation in PNG format. The above Figure 4 shared code analysis output is implemented in Figure 6 in the form of visualization. Figure 5 illustrates the implementation of various malware types, while Figure 7 presents the visualised result.
4.3. Visualization of Malware Clusters and Anomalies
It essentially functions by analyzing the relationship between its classification and detection within samples, providing more accurate information by utilizing graphic tools to identify any potential scatter plot clusters that exhibit anomalies or are related to the malware.
Scatter Plots:
Scatter plots depend on the clustering principle. Similar malware samples tend to cluster together due to their features or characteristics. This can highlight unique malware families and, in turn, identify samples that do not fit into one group. In a way, the possibility of using such a technique of producing scatter plots to depict such complex linkage among different variables presents its usability as a way for cybersecurity analysts to achieve a quicker sight of any pattern or trend in various malware samples. Figure 8 displays scatter plots that highlight clusters and outliers.
Heatmaps
This is a matrix with one row and column for every two samples. This matrix comprises all cells, each representing a measure of similarity between the corresponding samples; the darker the cell, the higher the similarity, while the lighter cell indicates a lesser similarity. Therefore, this method partially relies on the theory of the distance metric, linking scores such as the MinHash or Jaccard Index to malware samples. These scores can be visualised into a heatmap that makes the possible groupings of malware samples and their evolutionary relationships visible while pointing out possible outliers. Visualisation can then be used in improving the understanding of similarity distributions, an important constituent in fine-tuning malware classification models. Figure 9 heatmaps indicating pairwise similarities for the malware dataset. Visualise clusters and types of malwares to improve performance and effectiveness of malware identification.
5. Conclusion
This paper introduces a new approach to malware analysis by integrating two methods, SCA and SAA. The SCA utilizes the MinHash algorithm to measure the similarity between two malware samples within the extracted string sets, thereby identifying codes that are repeated in both samples and other malware families. By applying the Jaccard index to the SAA, one can measure the similarity between observed and random comparisons, which aids in the reformation of large datasets. The code-sharing analysis produces terminal outputs that display pairs of malwares with similar codes, aiding in the understanding of code reuse and other malware variants. The application of the SAA generates images in PNG format, where the nodes and edges highlight the relationships between the malware samples, with the size and colour of the nodes reflecting the differences. This tool not only aids in the search and classification of malware but also provides crucial information for individuals involved in combating malware threats. Future research will incorporate additional feature types, optimize algorithms, and enhance visualization methods to improve malware classification accuracy.
Author Contributions
Conceptualization, K Abhimanyu Kumar Patro; methodology, Narayandas Sai Ramana Vashista and K Abhimanyu Kumar Patro; software, Narayandas Sai Ramana Vashista; validation, K Abhimanyu Kumar Patro and Narayandas Sai Ramana Vashista; formal analysis, Narayandas Sai Ramana Vashista and K Abhimanyu Kumar Patro; investigation, K Abhimanyu Kumar Patro; resources, Narayandas Sai Ramana Vashista; data curation, Narayandas Sai Ramana Vashista; writing—original draft preparation, K Abhimanyu Kumar Patro and Narayandas Sai Ramana Vashista; writing—review and editing, K Abhimanyu Kumar Patro; visualization, K Abhimanyu Kumar Patro; supervision, K Abhimanyu Kumar Patro; project administration, Narayandas Sai Ramana Vashista; funding acquisition, K Abhimanyu Kumar Patro. All authors have read and agreed to the published version of the manuscript.
Funding
This research received no external funding
Institutional Review Board Statement
Not applicable
Informed Consent Statement
Not applicable
Data Availability Statement
All data generated or analyzed during this study are included in this published article.
Conflicts of Interest
The authors declare no conflicts of interest.
References
- Benchadi, D.Y.M.; Batalo, B.; Fukui, K. Efficient malware analysis using subspace-based methods on representative image patterns. IEEE Access 2023, 11, 102492–102507. [Google Scholar] [CrossRef]
- Li, C.; Cheng, Z.; Zhu, H.; Wang, L.; Lv, Q.; Wang, Y.; Li, N.; Sun, D. DMalNet: Dynamic malware analysis based on API feature engineering and graph learning. Comput. Secur. 2022, 122, 102872. [Google Scholar] [CrossRef]
- Yamany, B.; Elsayed, M.S.; Jurcut, A.D.; Abdelbaki, N.; Azer, M.A. A holistic approach to ransomware classification: Leveraging static and dynamic analysis with visualization. Information 2024, 15, 46. [Google Scholar] [CrossRef]
- Rudd, E.M.; Krisiloff, D.; Coull, S.; Olszewski, D.; Raff, E.; Holt, J. Efficient malware analysis using metric embeddings. Digit. Threats Res. Pract. 2024, 5, 1–20. [Google Scholar] [CrossRef]
- Gaurav, A.; Gupta, B.B.; Panigrahi, P.K. A comprehensive survey on machine learning approaches for malware detection in IoT-based enterprise information systems. Enterp. Inf. Syst. 2023, 17, 2023764. [Google Scholar] [CrossRef]
- Zhao, Y.; Cui, W.; Geng, S.; Bo, B.; Feng, Y.; Zhang, W. A malware detection method of code texture visualization based on an improved faster RCNN combining transfer learning. IEEE Access 2020, 8, 166630–166641. [Google Scholar] [CrossRef]
- Qi, P.; Zhang, Z.; Wang, W.; Yao, C. Malware detection by exploiting deep learning over binary programs. In Proceedings of the 2020 25th International Conference on Pattern Recognition (ICPR); IEEE, 2021; pp. 9068–9075. [Google Scholar] [CrossRef]
- Kita, K.; Uda, R. Fast Preprocessing by Suffix Arrays for Managing Byte n-grams to Detect Malware Subspecies by Machine Learning. J. Inf. Process. 2024, 32, 232–246. [Google Scholar] [CrossRef]
- Gopinath, M.; Sethuraman, S.C. A comprehensive survey on deep learning-based malware detection techniques. Comput. Sci. Rev. 2023, 47, 100529. [Google Scholar] [CrossRef]
- Andreopoulos, W.B. Malware detection with sequence-based machine learning and deep learning. Malware Anal. Using Artif. Intell. Deep Learn. 2021, 53–70. [Google Scholar] [CrossRef]
- Judy, S.; Khilar, R. Detection and Classification of Malware for Cyber Security using Machine Learning Algorithms. In Proceedings of the 2023 Eighth International Conference on Science Technology Engineering and Mathematics (ICONSTEM), IEEE, 2023, pp. 1–6. [CrossRef]
- Lad, S.S.; Adamuthe, A.C. Improved deep learning model for static PE files malware detection and classification. Int. J. Comput. Netw. Inf. Secur. 2022, 11, 14. [Google Scholar] [CrossRef]
- Alqahtani, M.A. Machine learning techniques for malware detection with challenges and future directions. Int. J. Commun. Netw. Inf. Secur. 2021, 13, 258–270. [Google Scholar] [CrossRef]
- Hao, J.; Luo, S.; Pan, L. Byte-Level Function-Associated Method for Malware Detection. Comput. Syst. Sci. Eng. 2023, 46, 719–734. [Google Scholar] [CrossRef]
- Bostock, M.; Heer, J. Protovis: A graphical toolkit for visualization. IEEE Trans. Vis. Comput. Graph. 2009, 15, 1121–1128. [Google Scholar] [CrossRef]
- Kabasakal, İ.; Soyuer, H. A Jaccard similarity-based model to match stakeholders for collaboration in an industry-driven portal. Proceedings 2021, 74, 15. [Google Scholar] [CrossRef]
- Gond, B.P.; Shahnawaz, M.; Mohapatra, D.P.; et al. NLP-Driven Malware Classification: A Jaccard Similarity Approach. Proceedings of the 2024 IEEE International Conference on Information Technology, Electronics and Intelligent Communication Systems (ICITEICS) 2024, 1–8. [CrossRef]
- Maniriho, P.; Mahmood, A.N.; Chowdhury, M.J.M. A study on malicious software behaviour analysis and detection techniques: Taxonomy, current trends and challenges. Future Gener. Comput. Syst. 2022, 130, 1–18. [Google Scholar] [CrossRef]
- Nguyen, M.T.; Nguyen, V.H.; Shone, N. Using deep graph learning to improve dynamic analysis-based malware detection in PE files. J. Comput. Virol. Hack. Tech. 2024, 20, 153–172. [Google Scholar] [CrossRef]
- Ioffe, S. Improved consistent sampling, weighted minhash and l1 sketching. Proceedings of the 2010 IEEE International Conference on Data Mining 2010, 246–255. [Google Scholar] [CrossRef]
Figure 1.
Block diagrammatic representation of Shared Code Analysis.
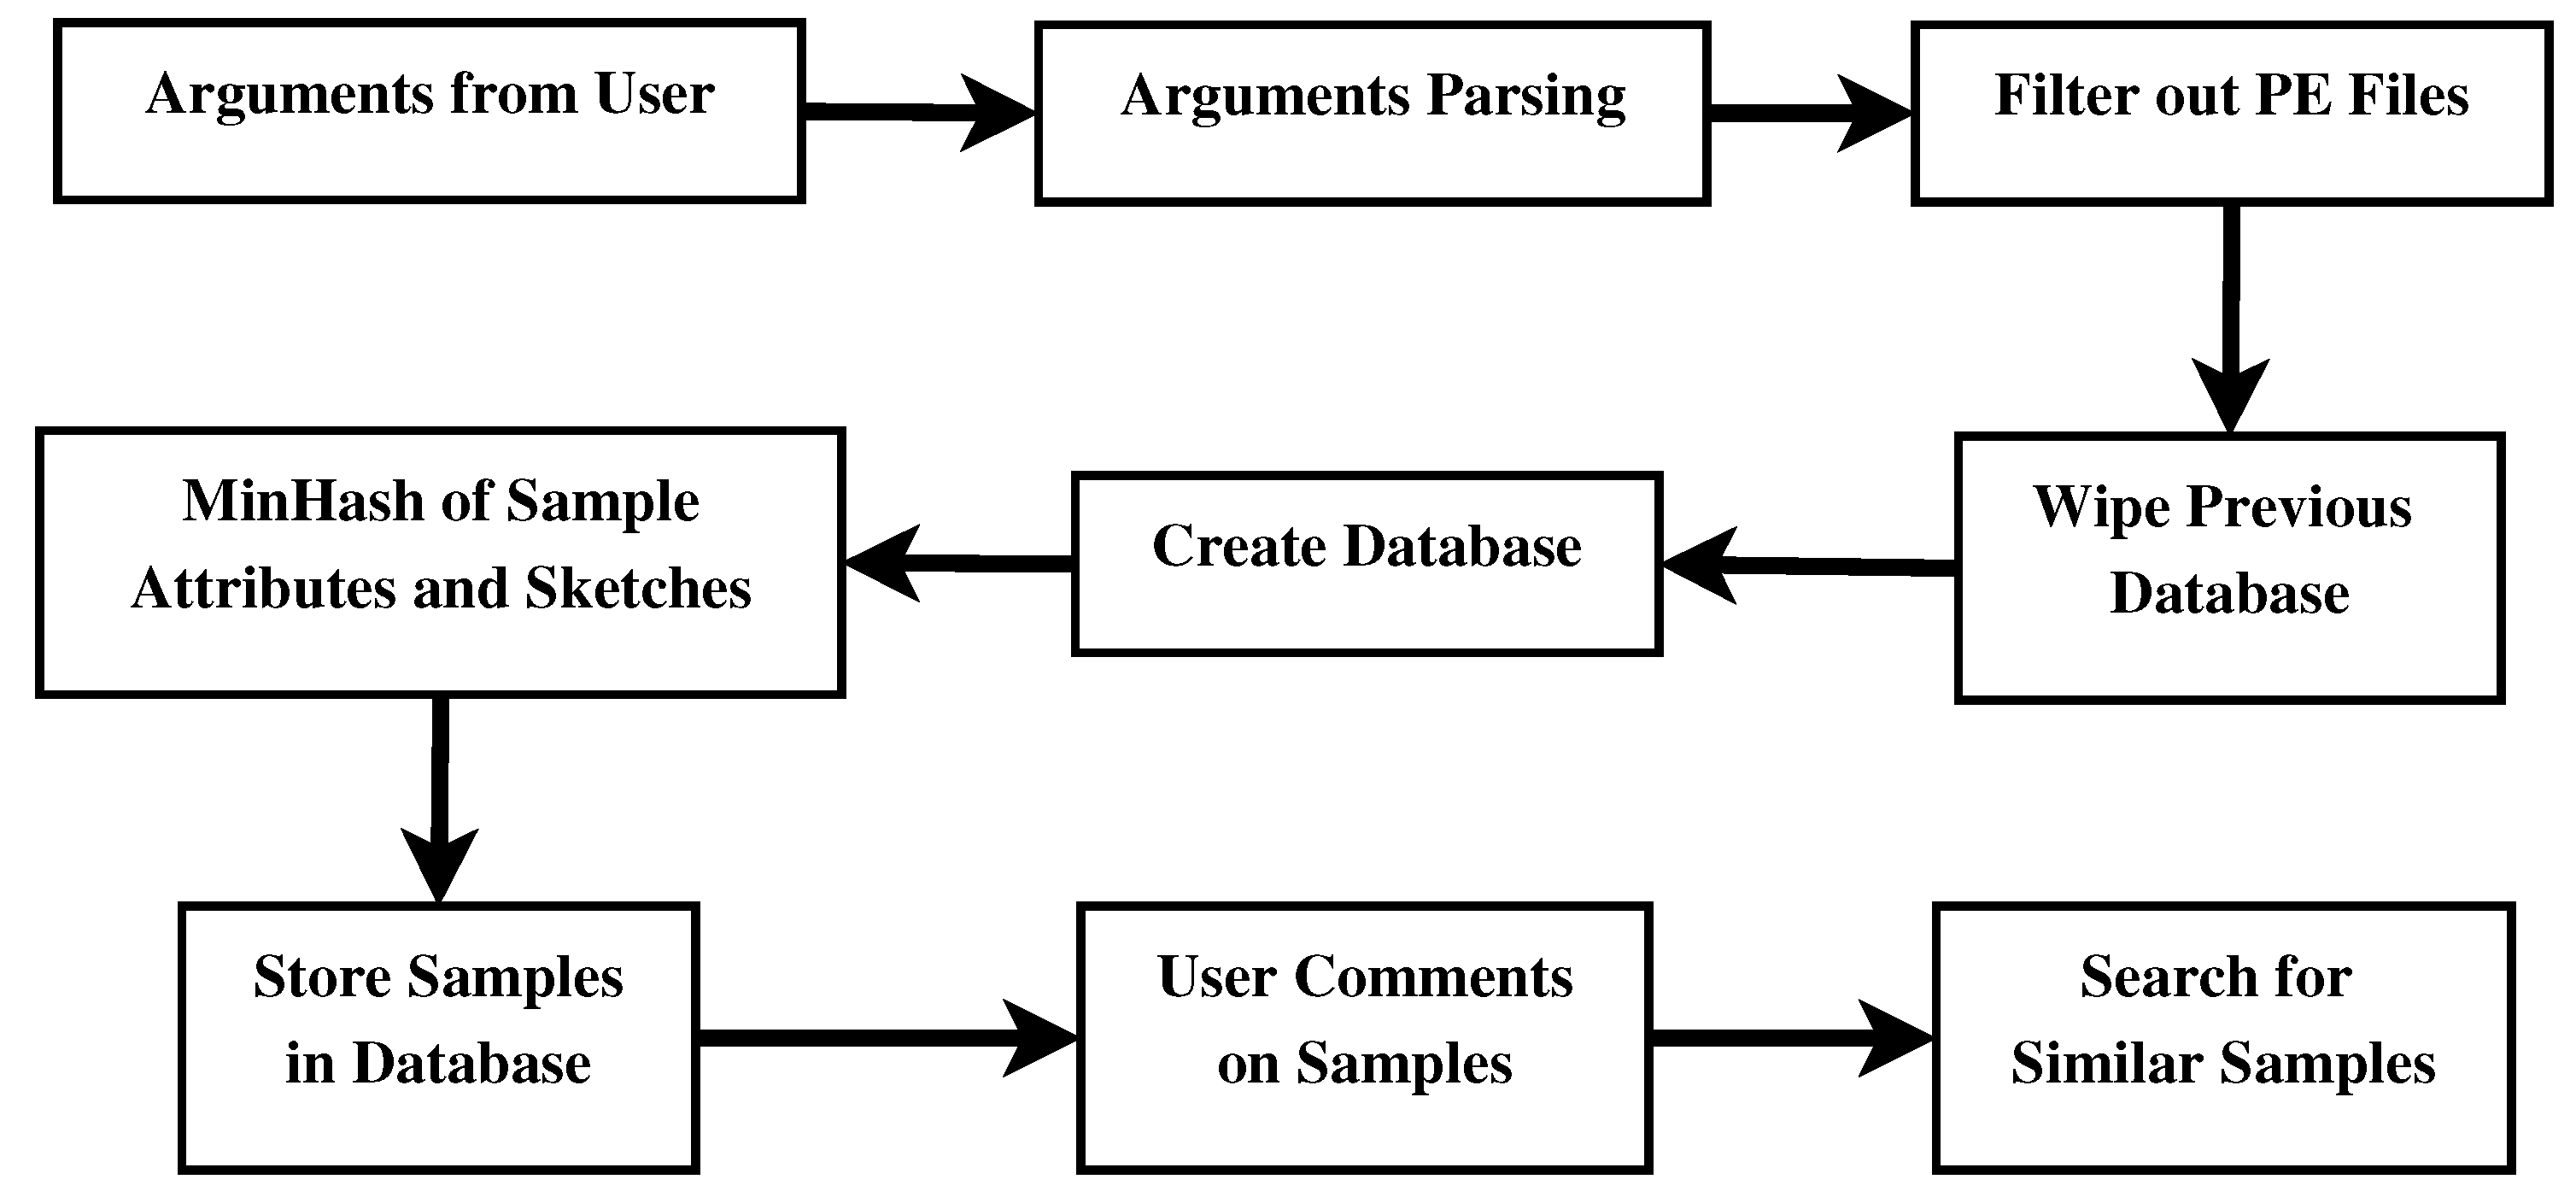
Figure 2.
Block diagrammatic representation of Shared Attribute Analysis.
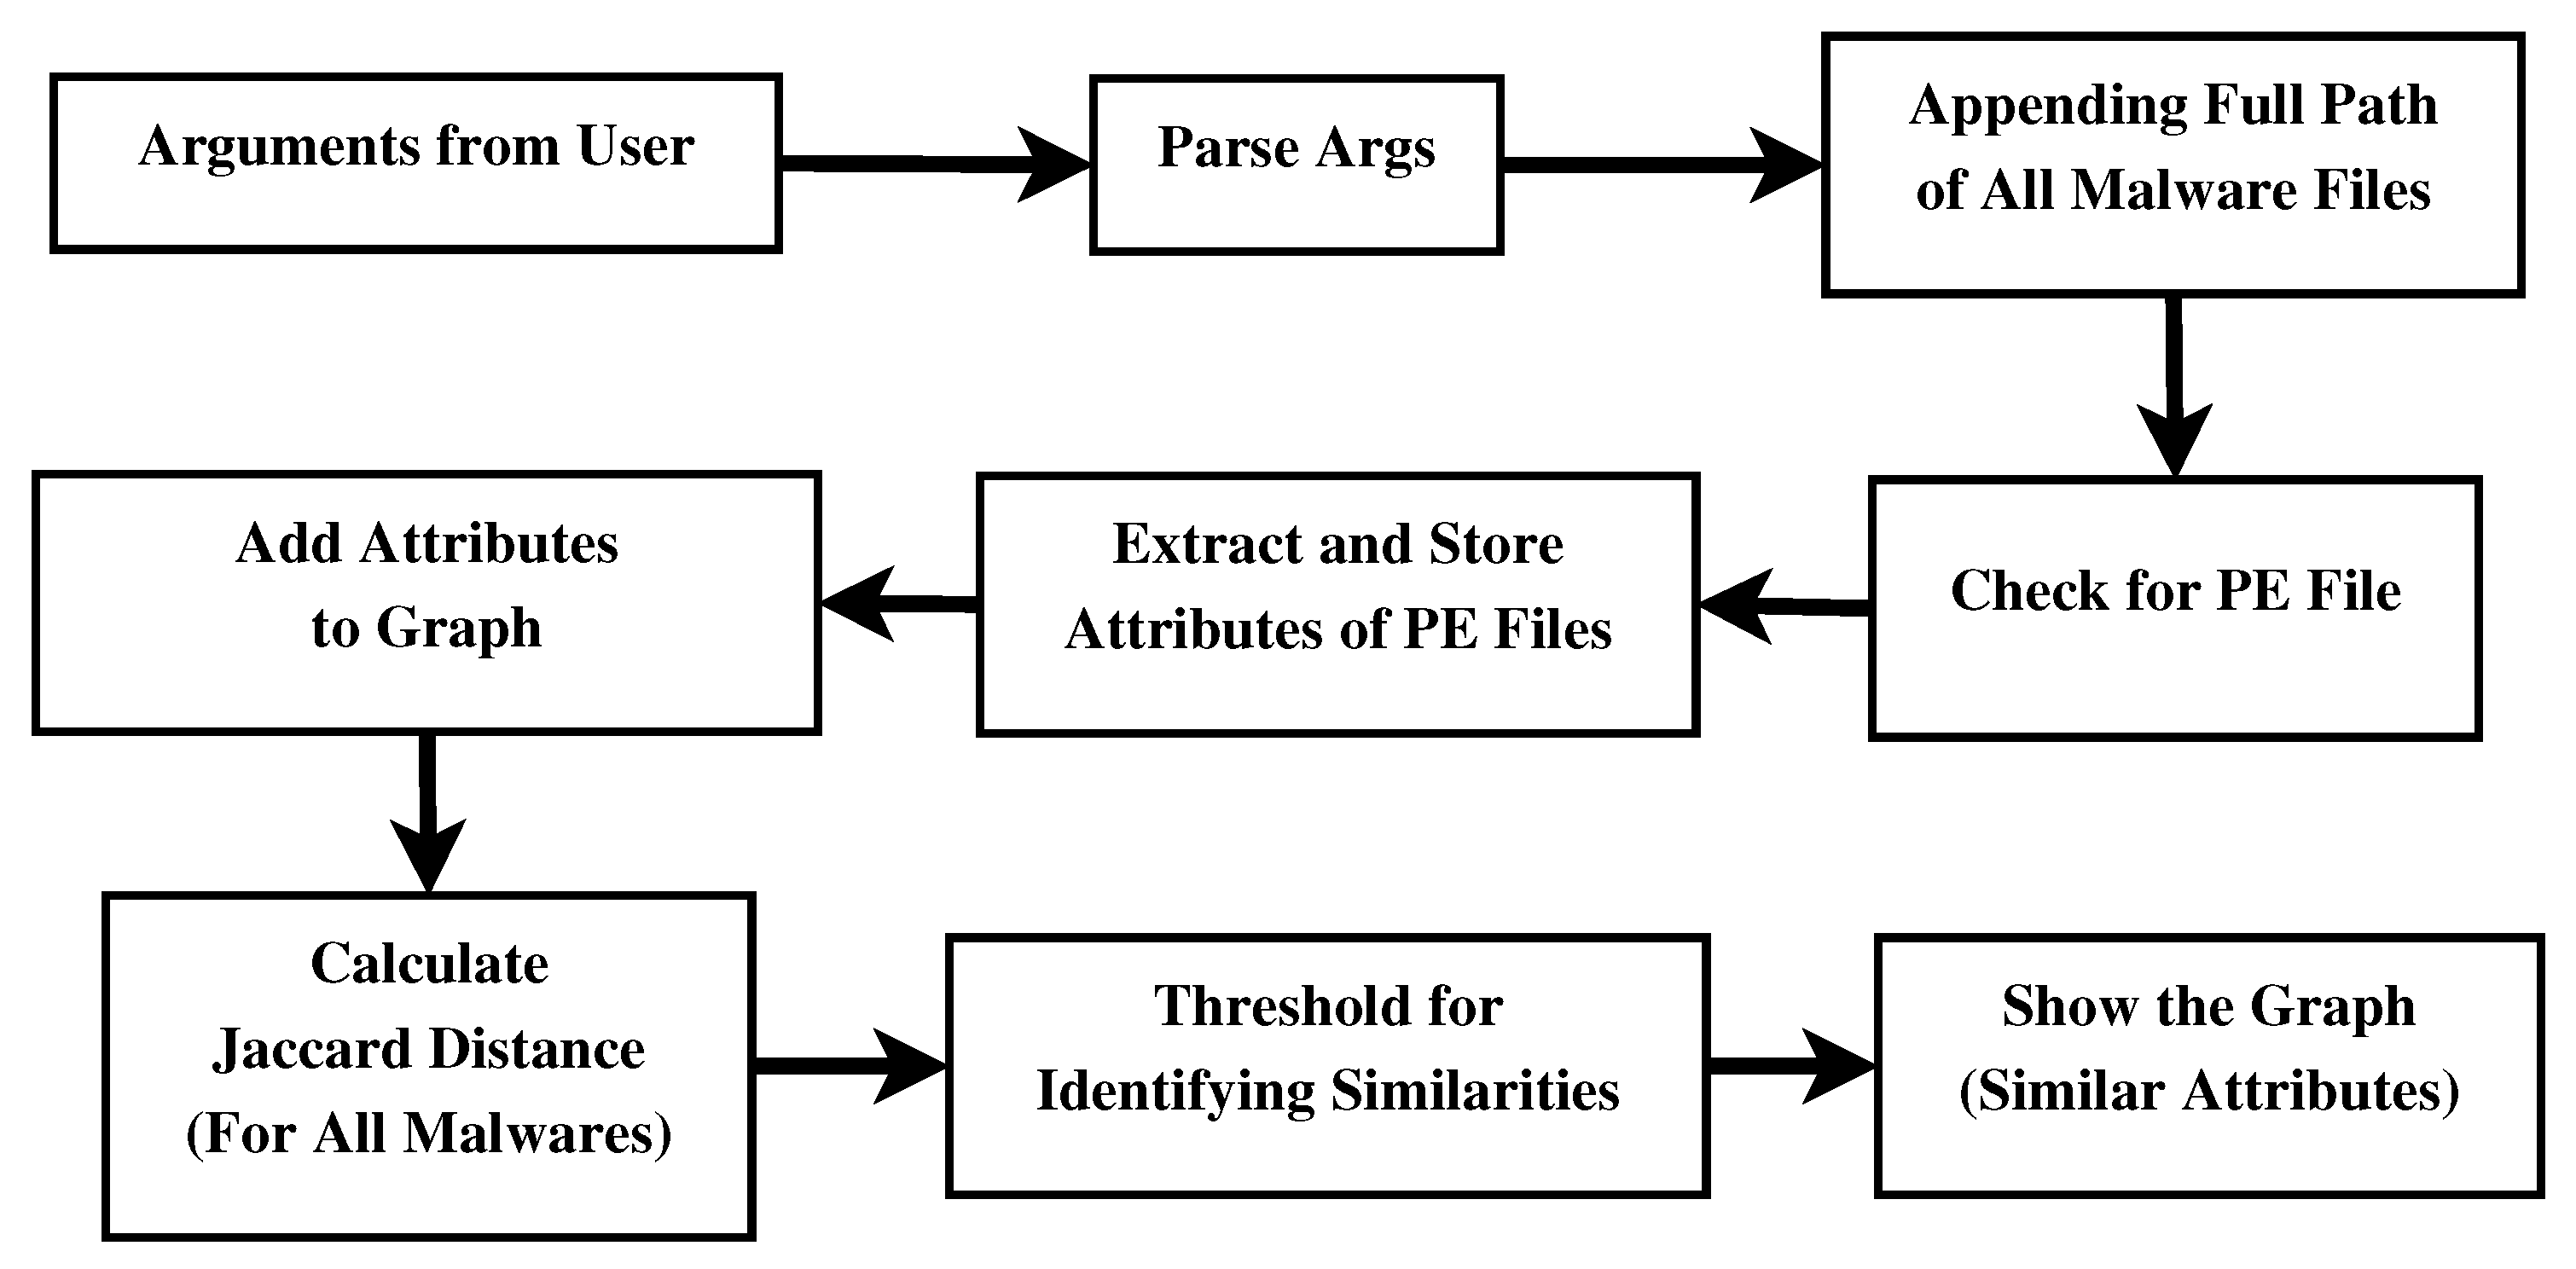
Figure 3.
Block diagrammatic representation of Integration of SCA and SAA.
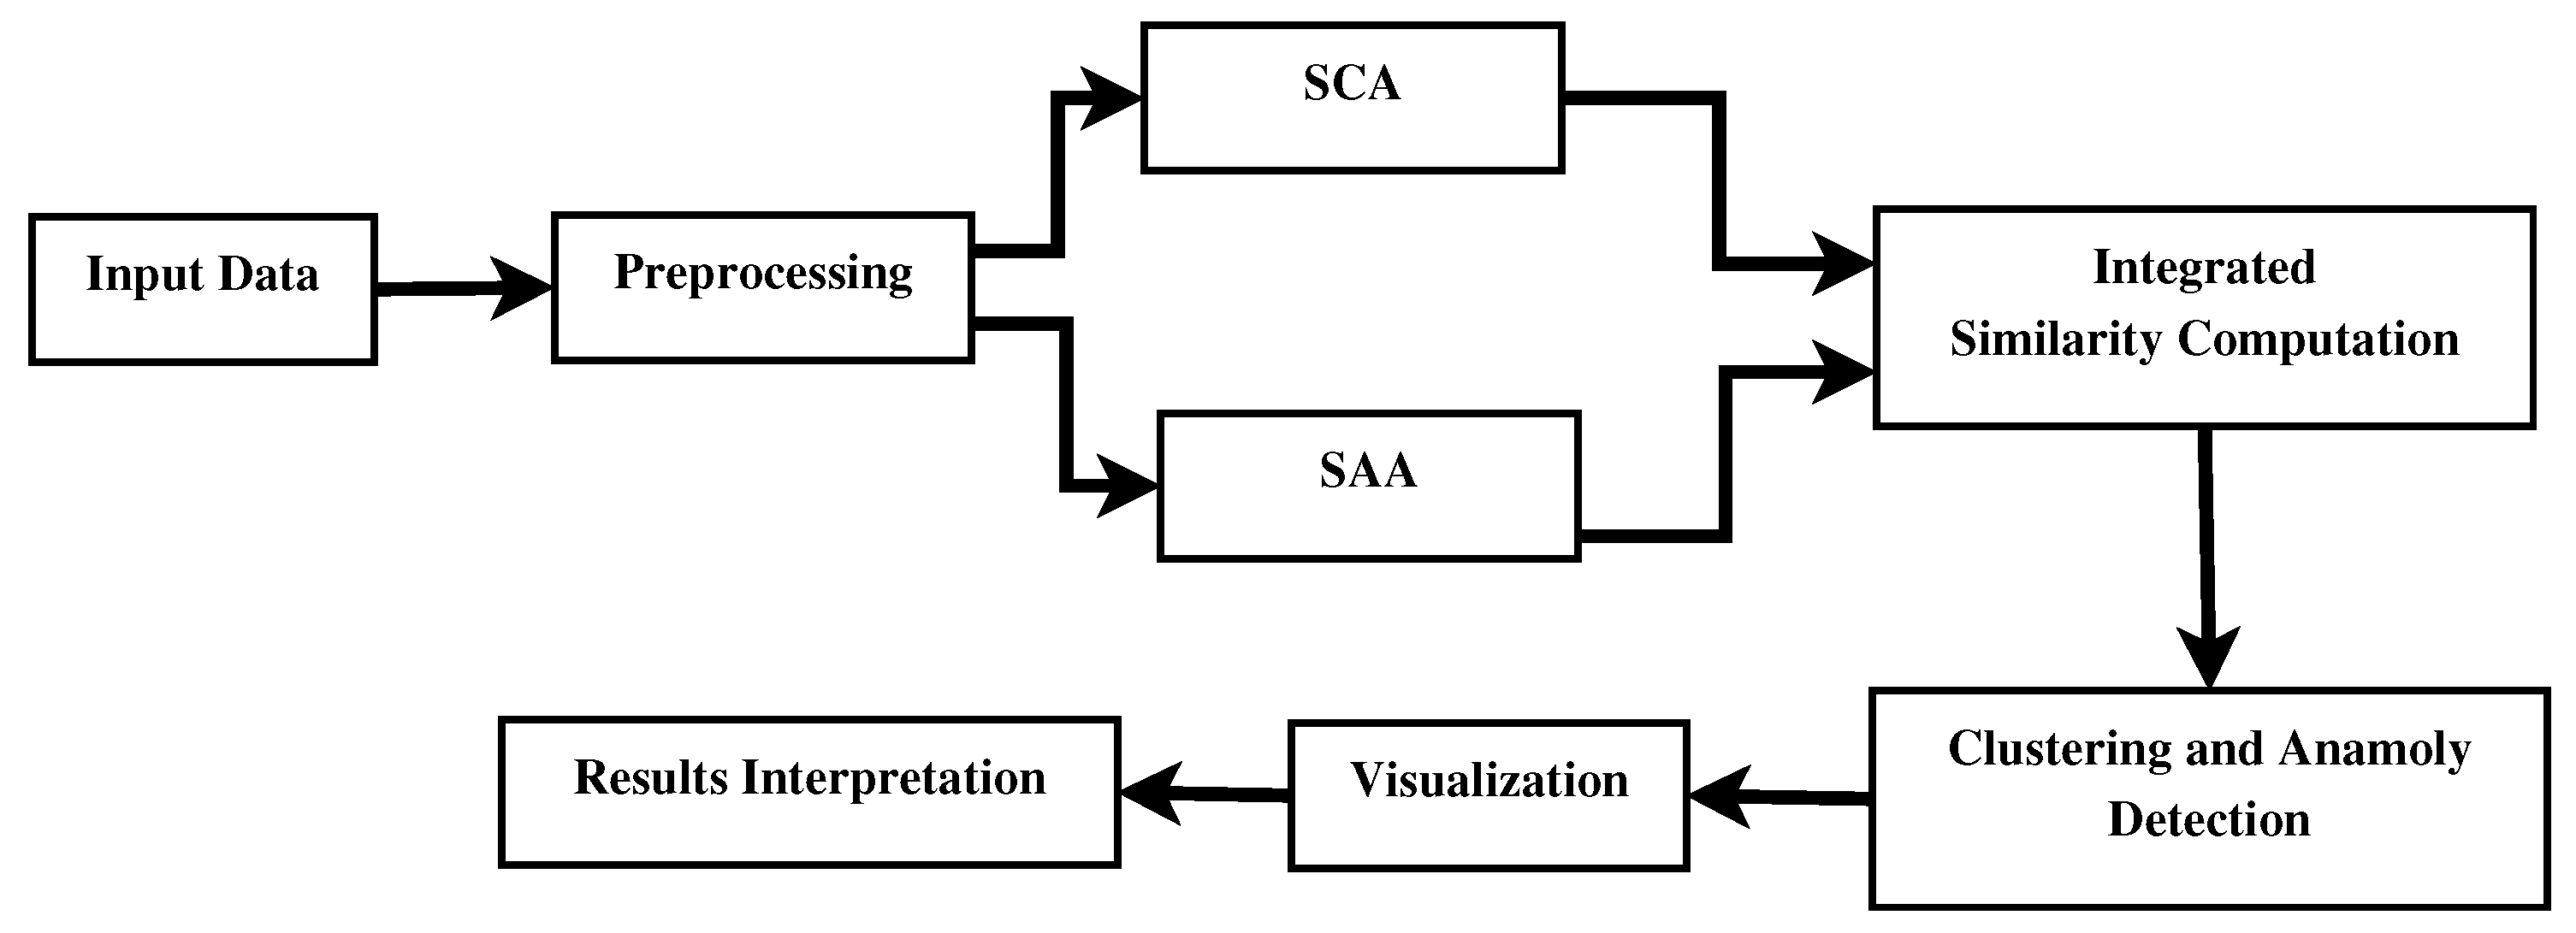
Figure 4.
Shared Code Analysis output 1.
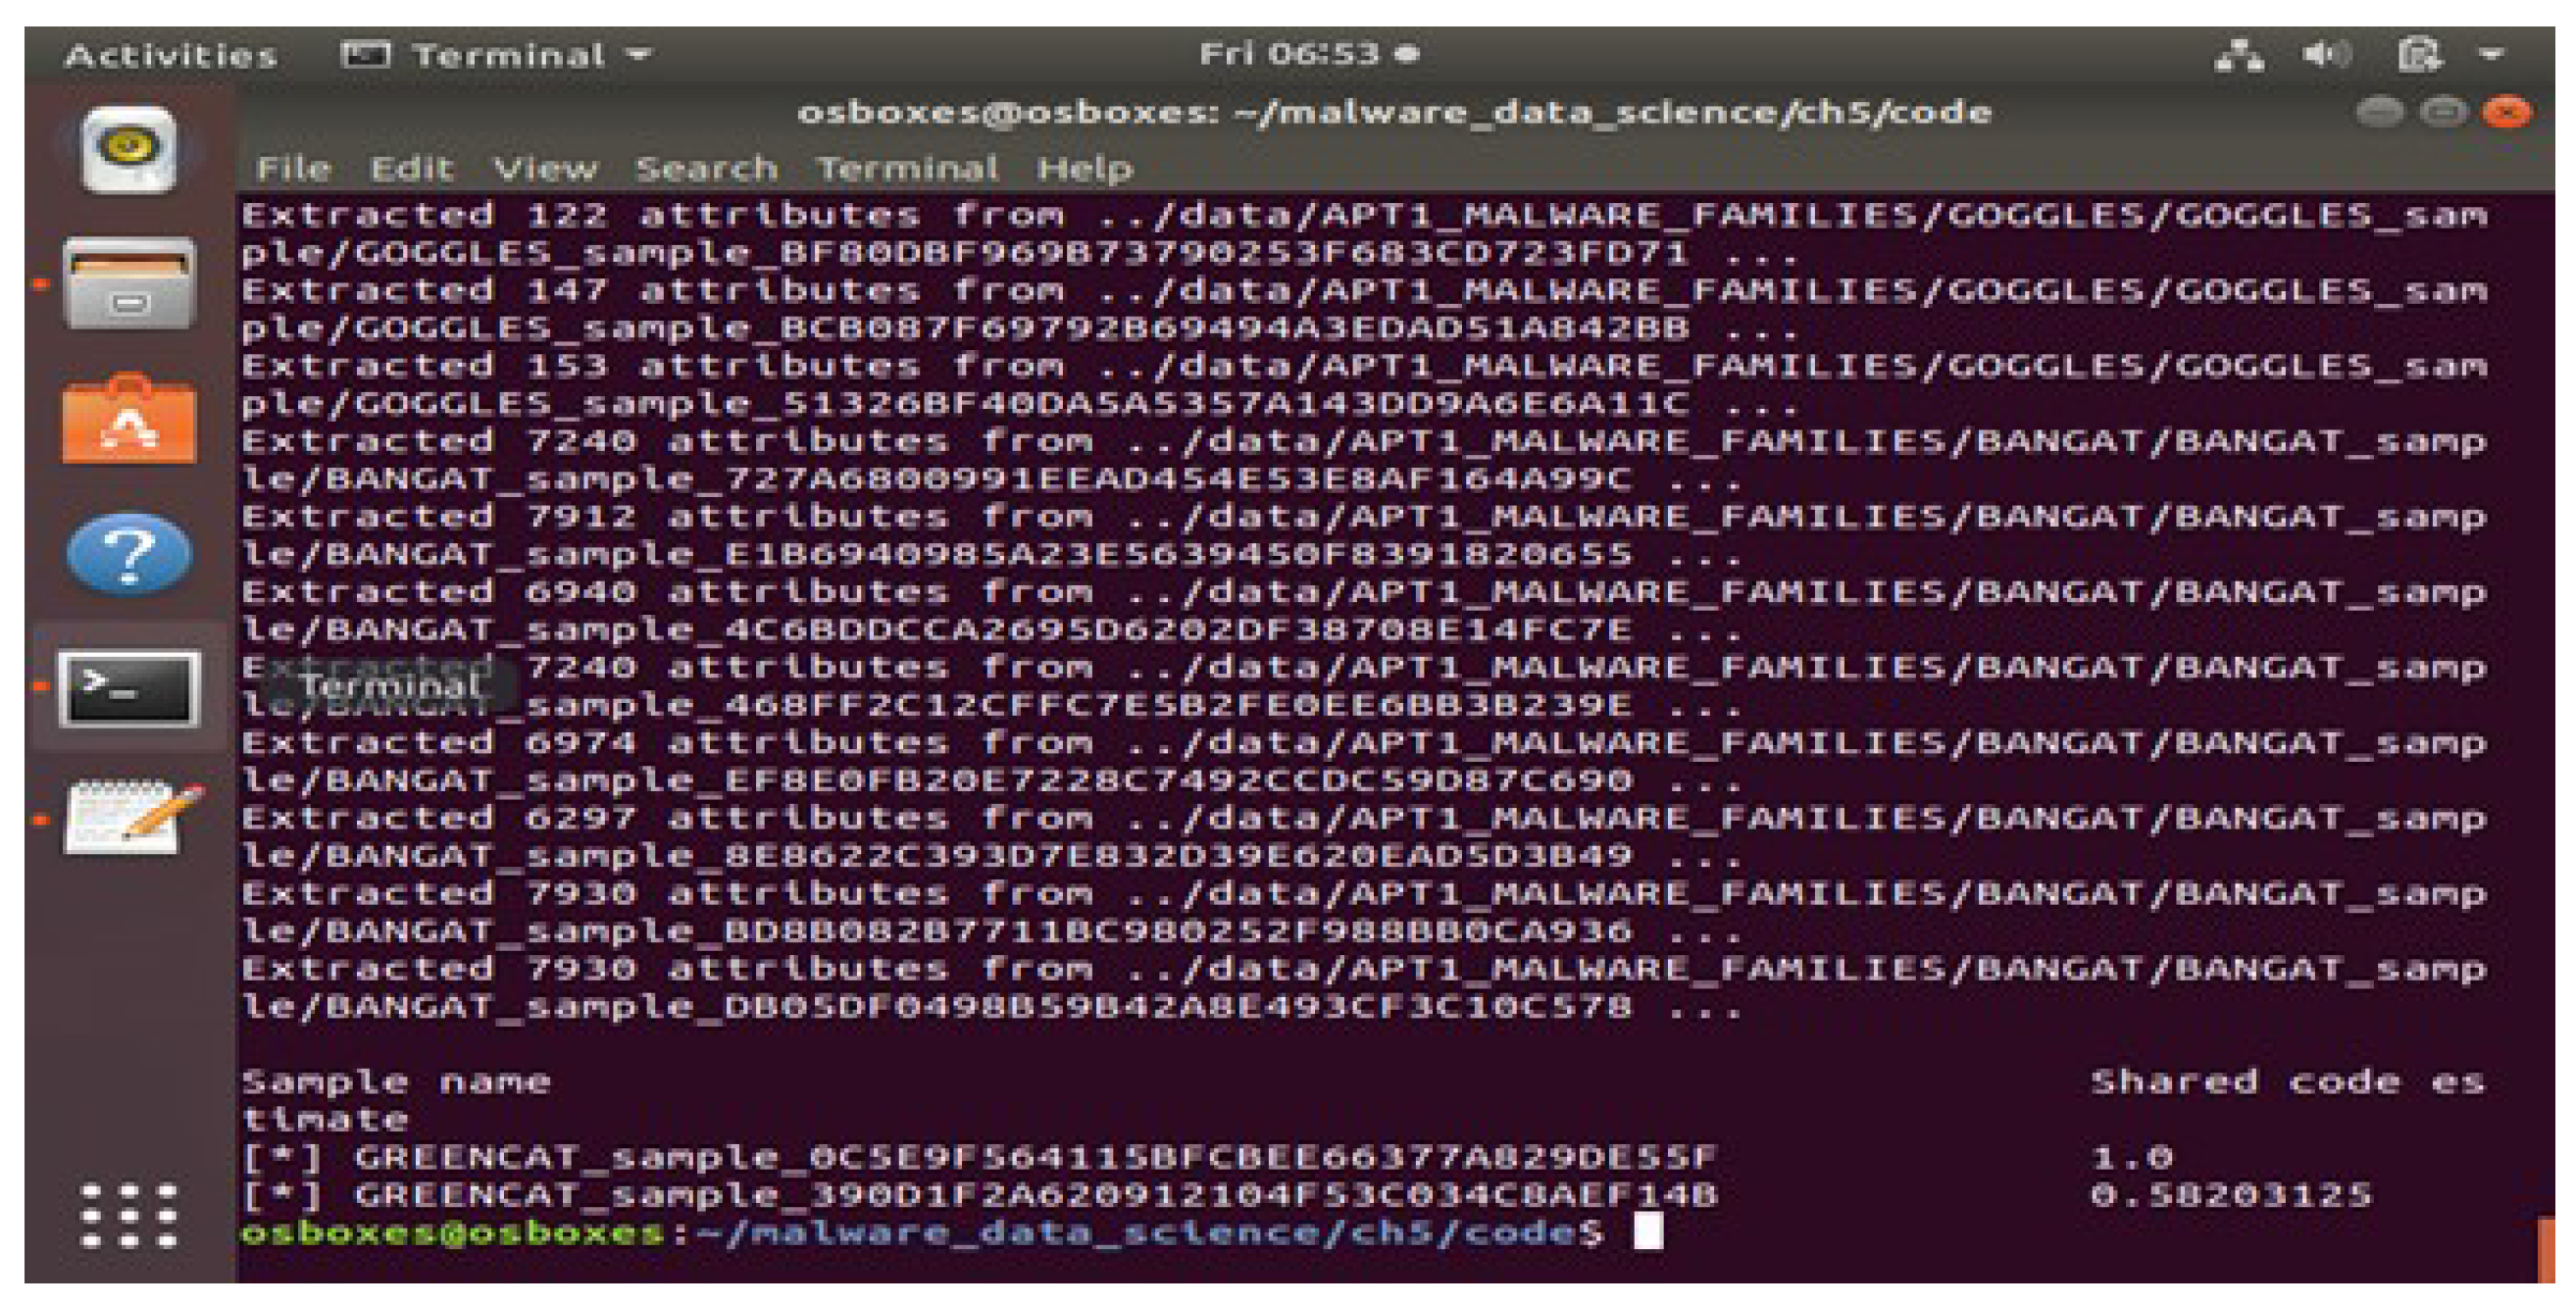
Figure 5.
Shared Code Analysis output 2.
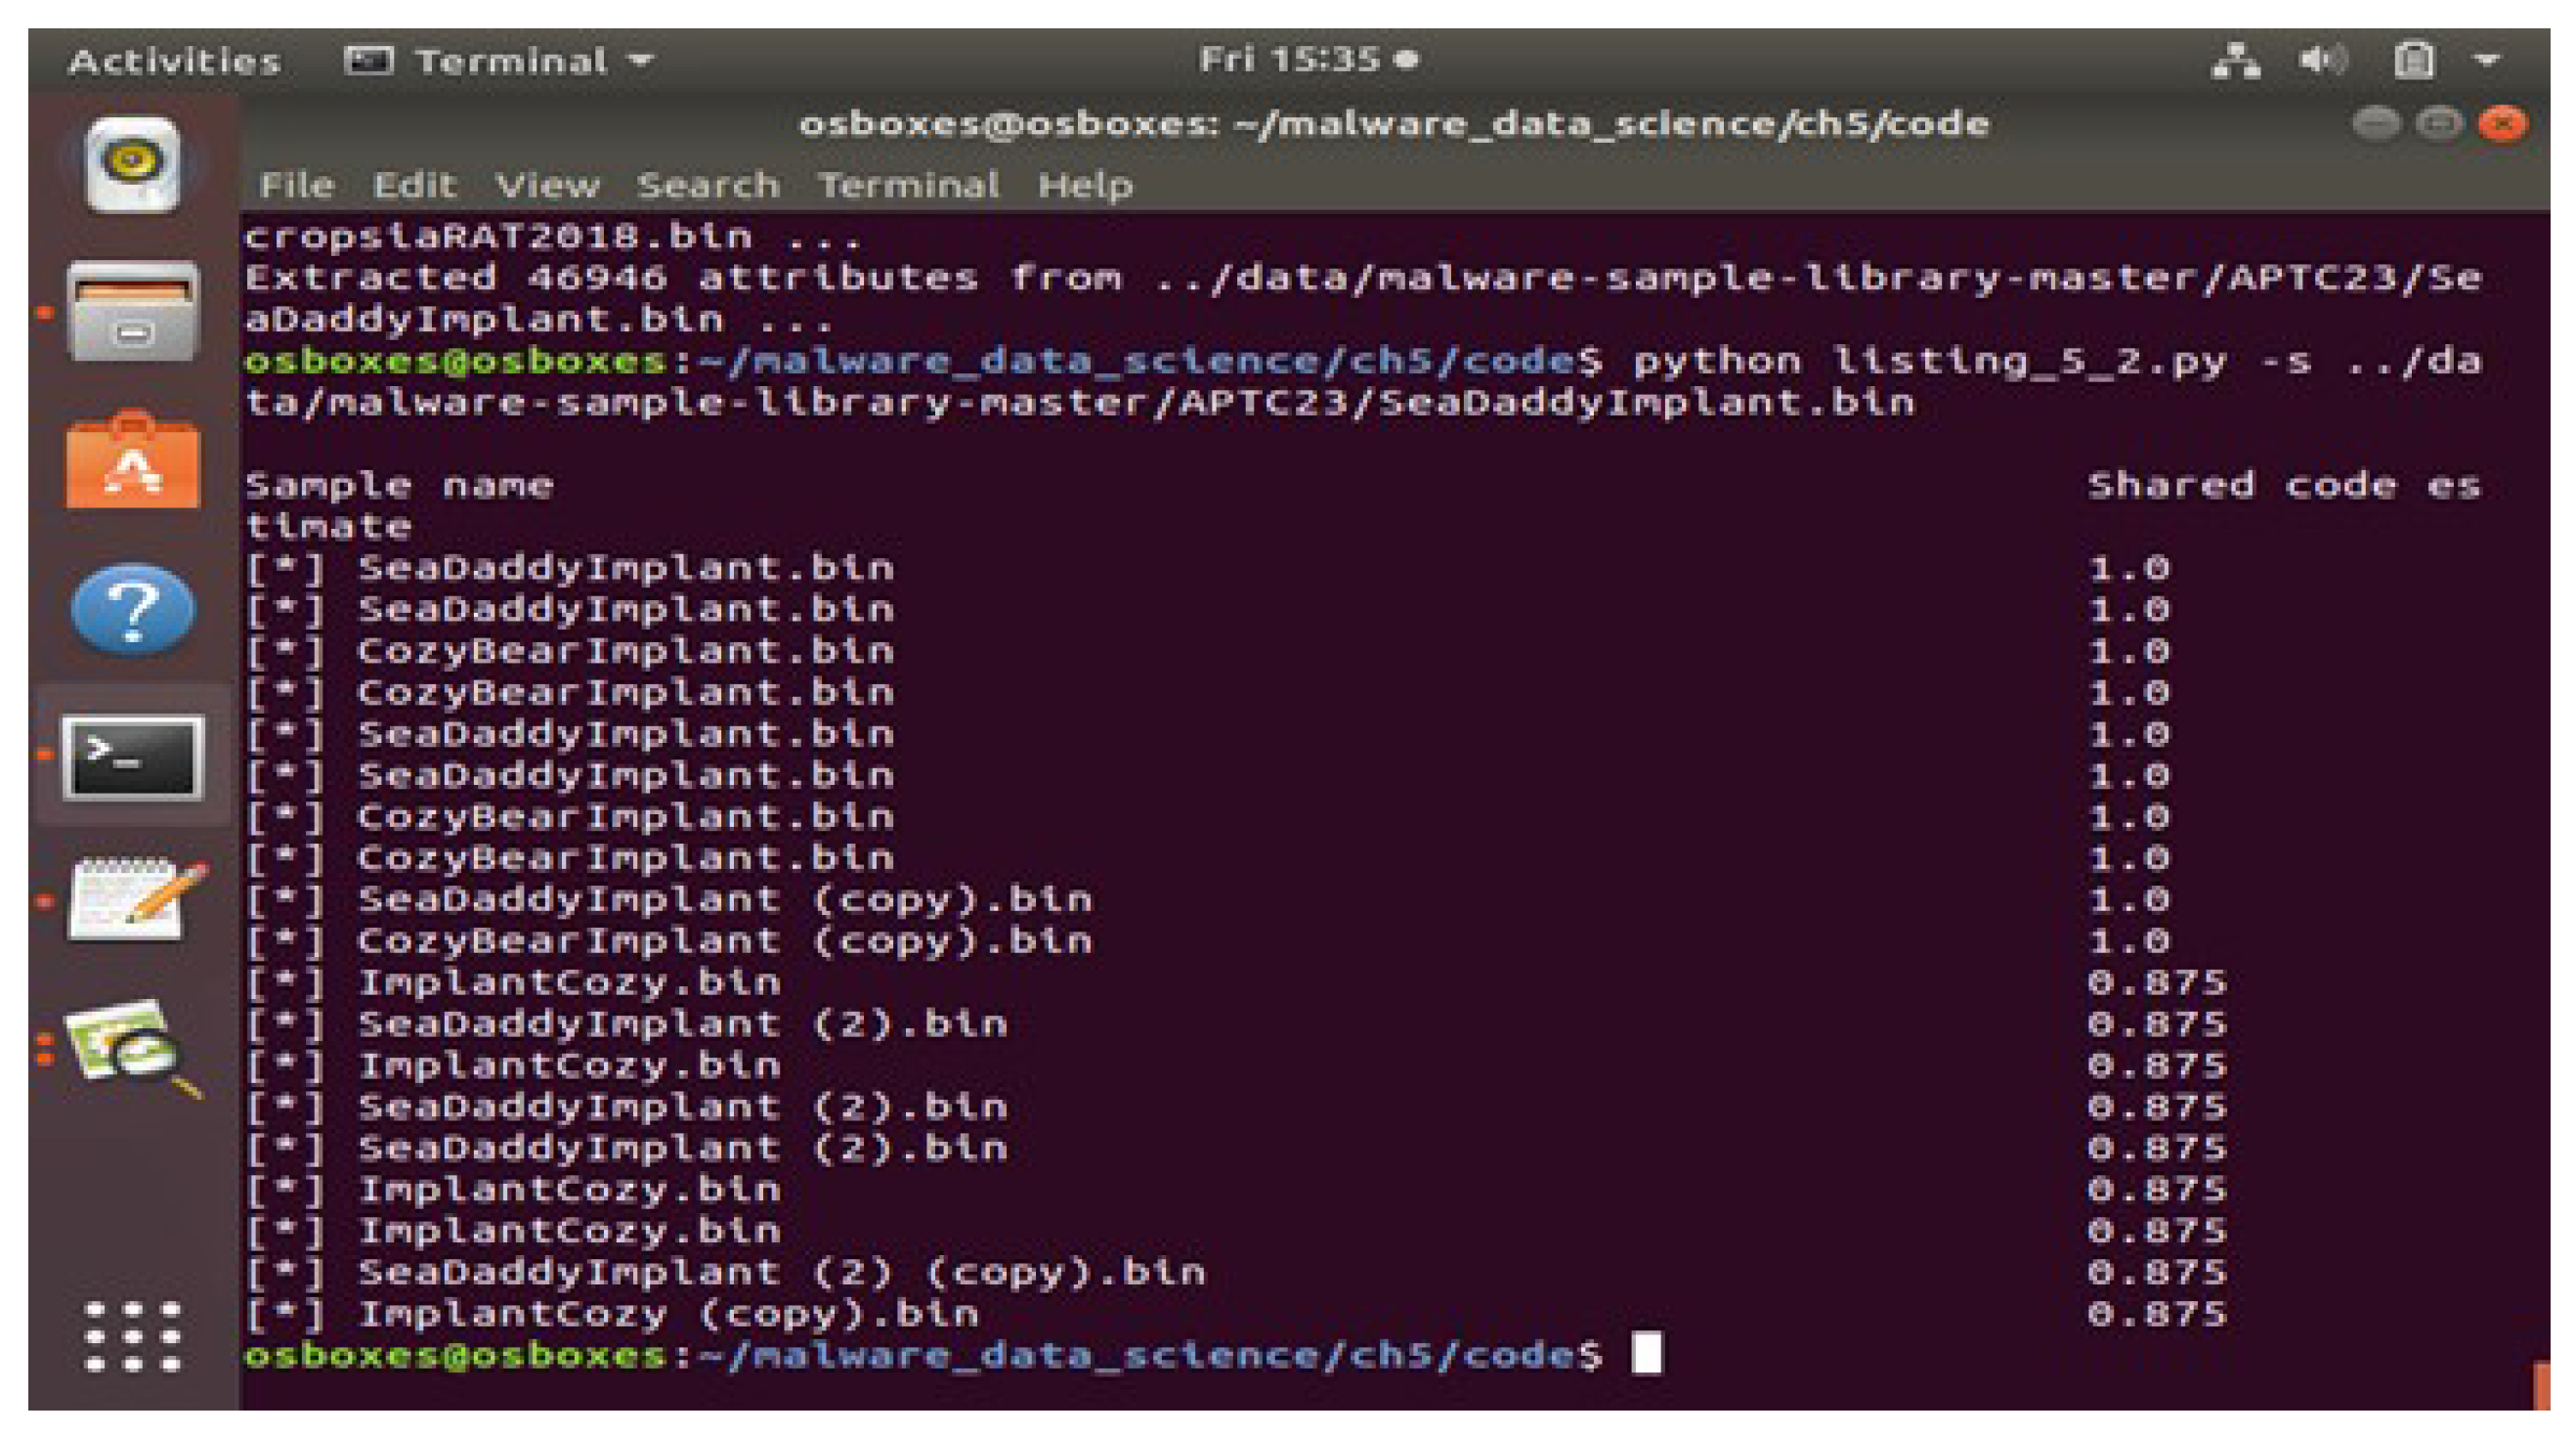
Figure 6.
Shared Attribute Analysis output 1.
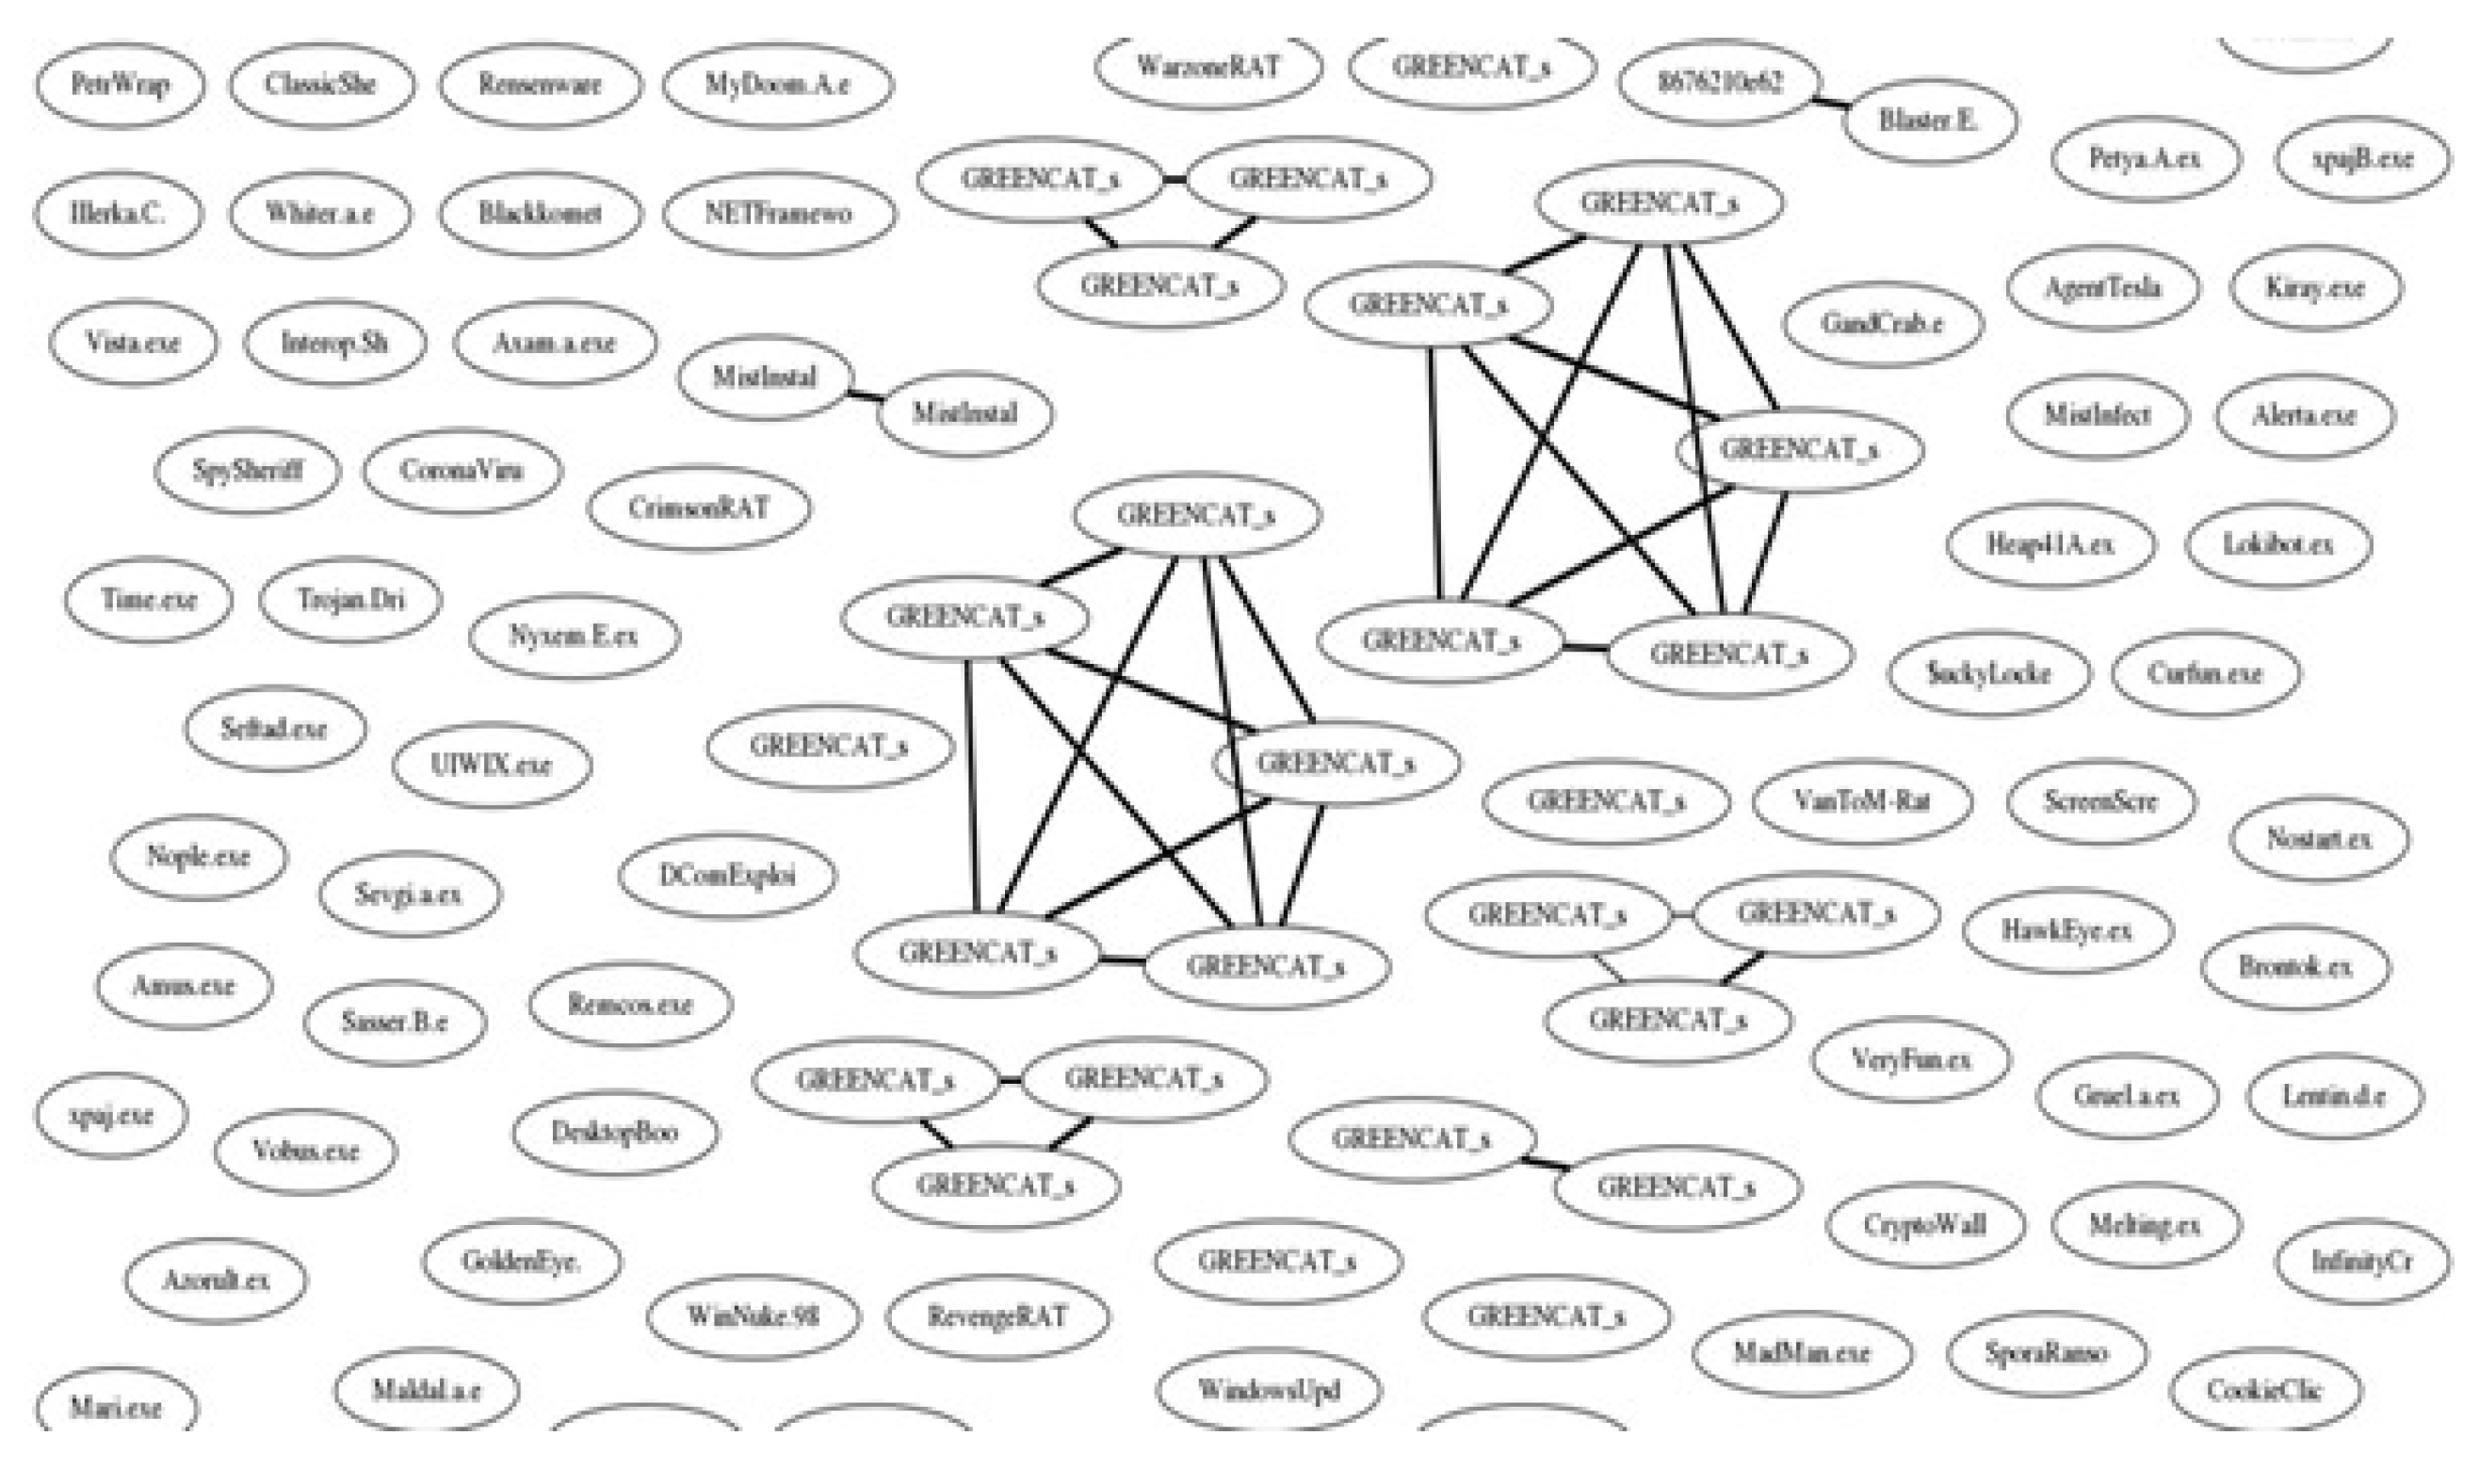
Figure 7.
Shared Attribute Analysis output 2.
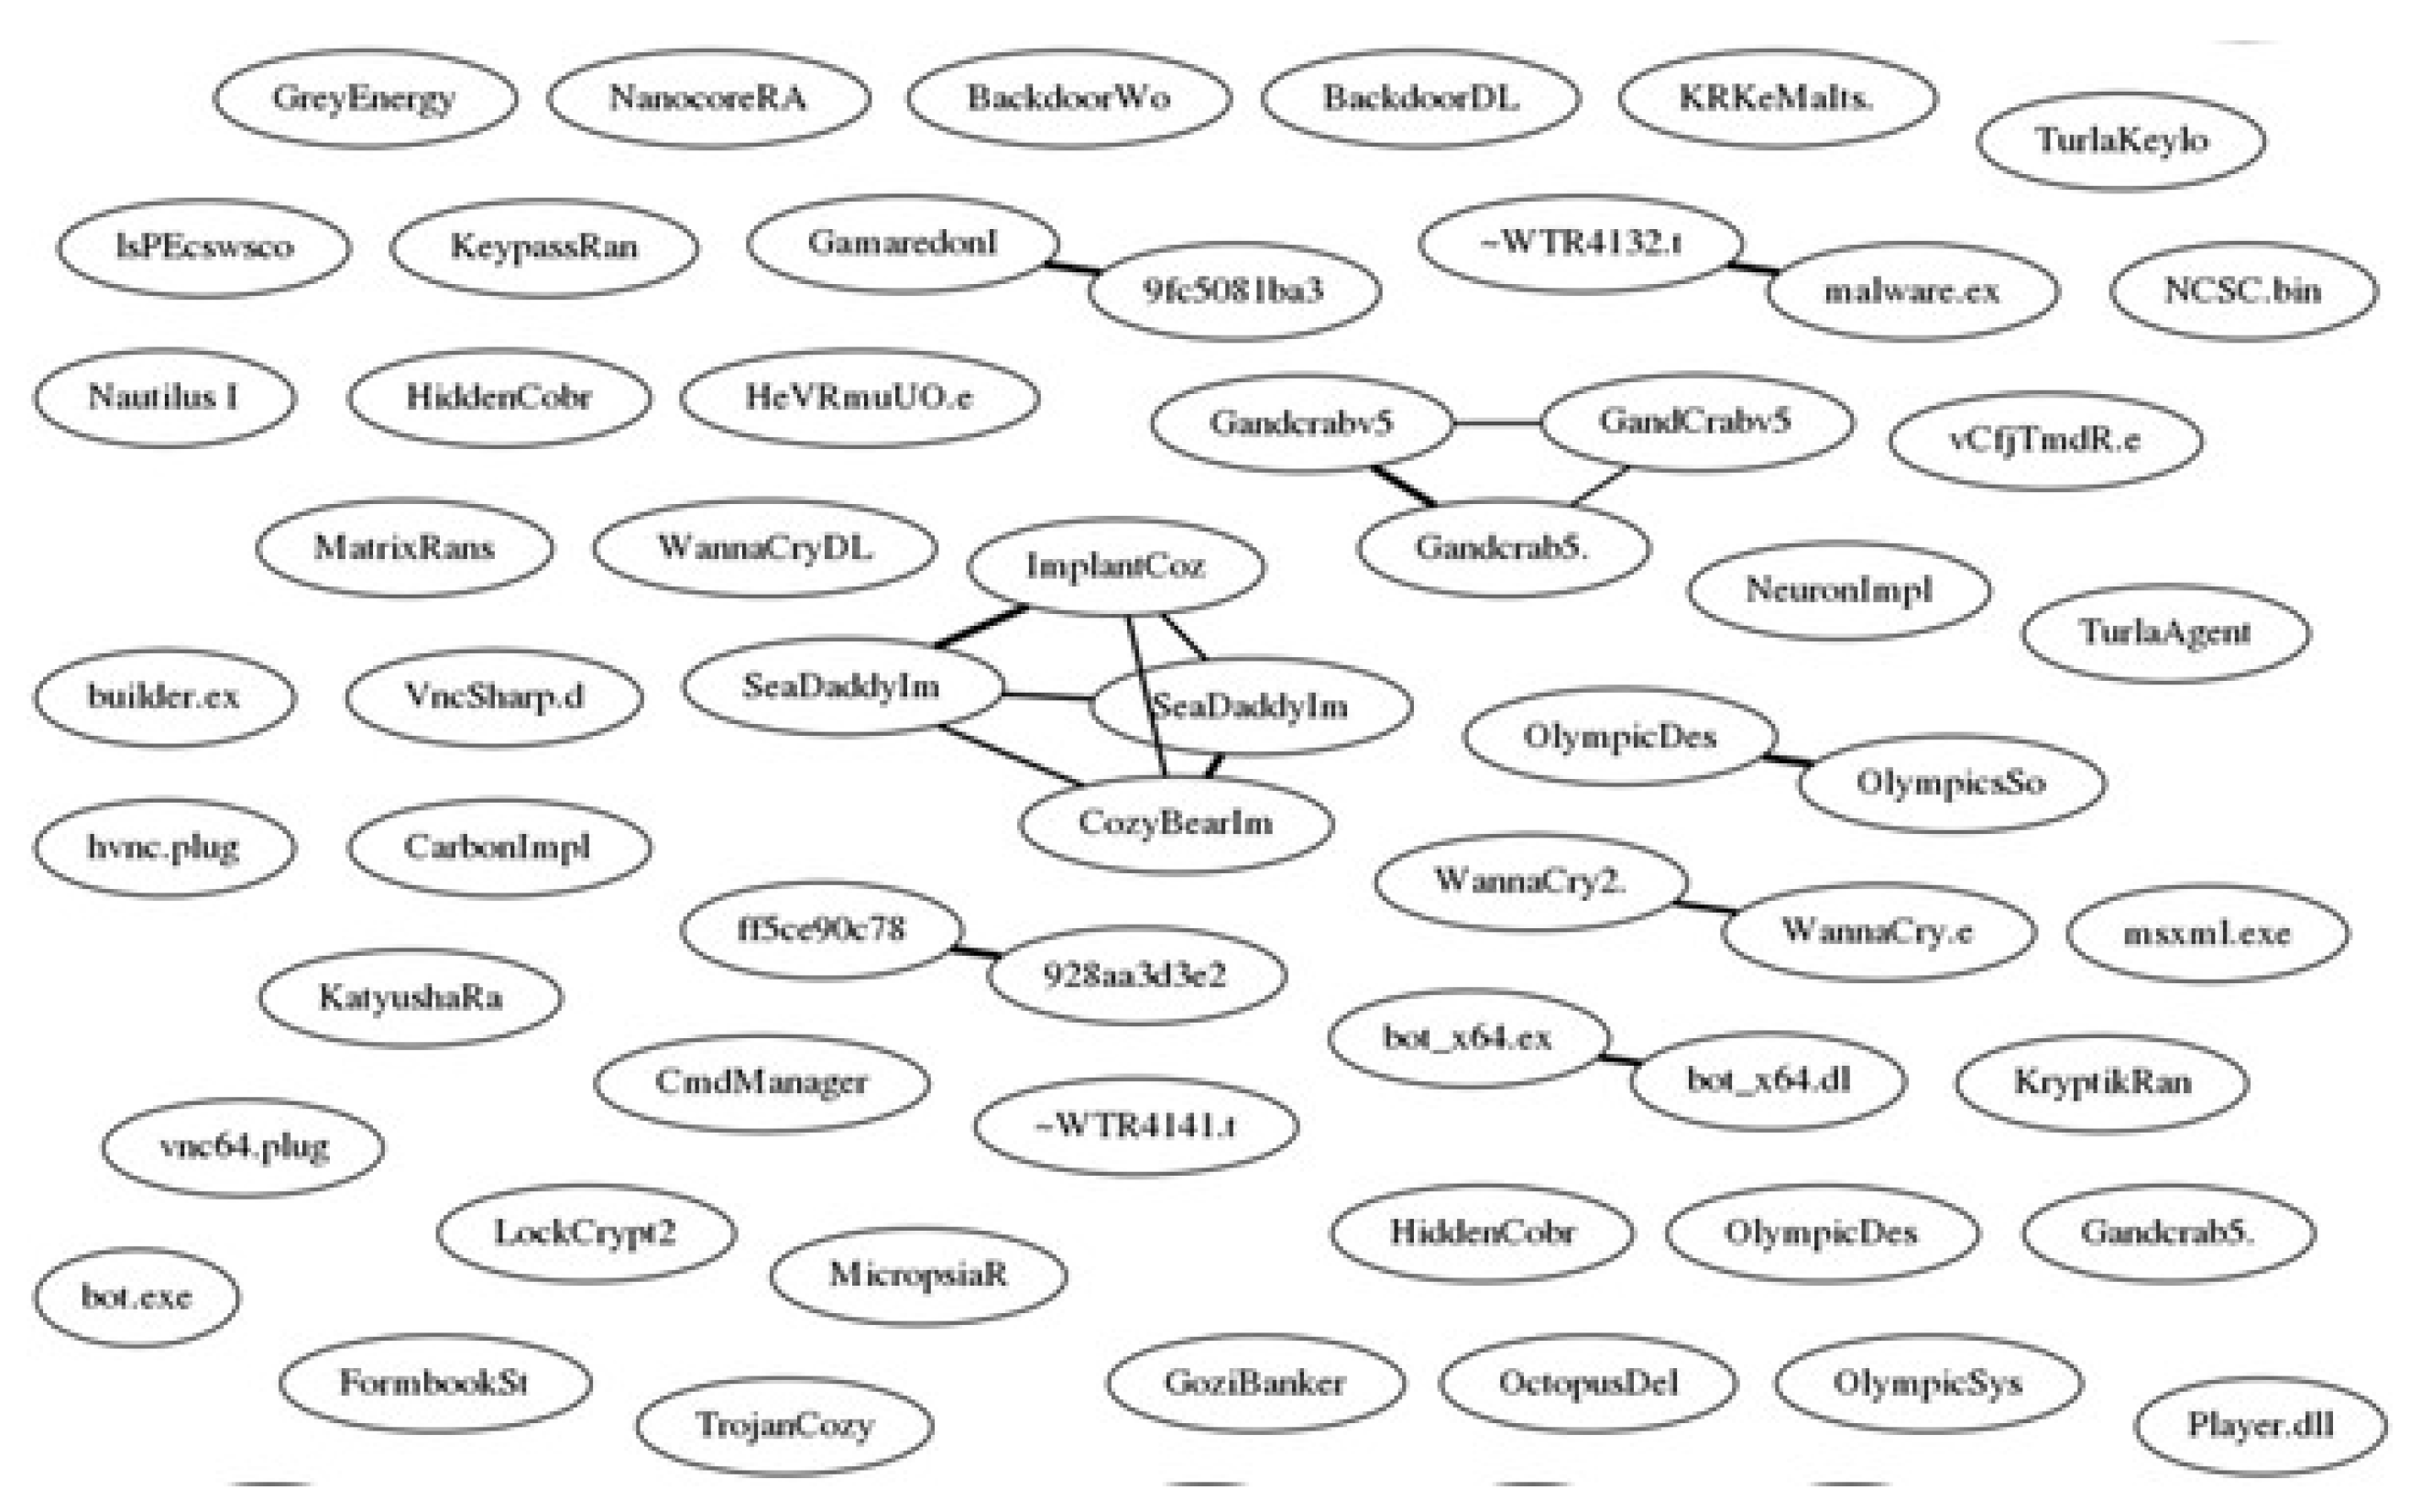
Figure 8.
Scatter Plots Showing Malware Clusters and Anomalies.
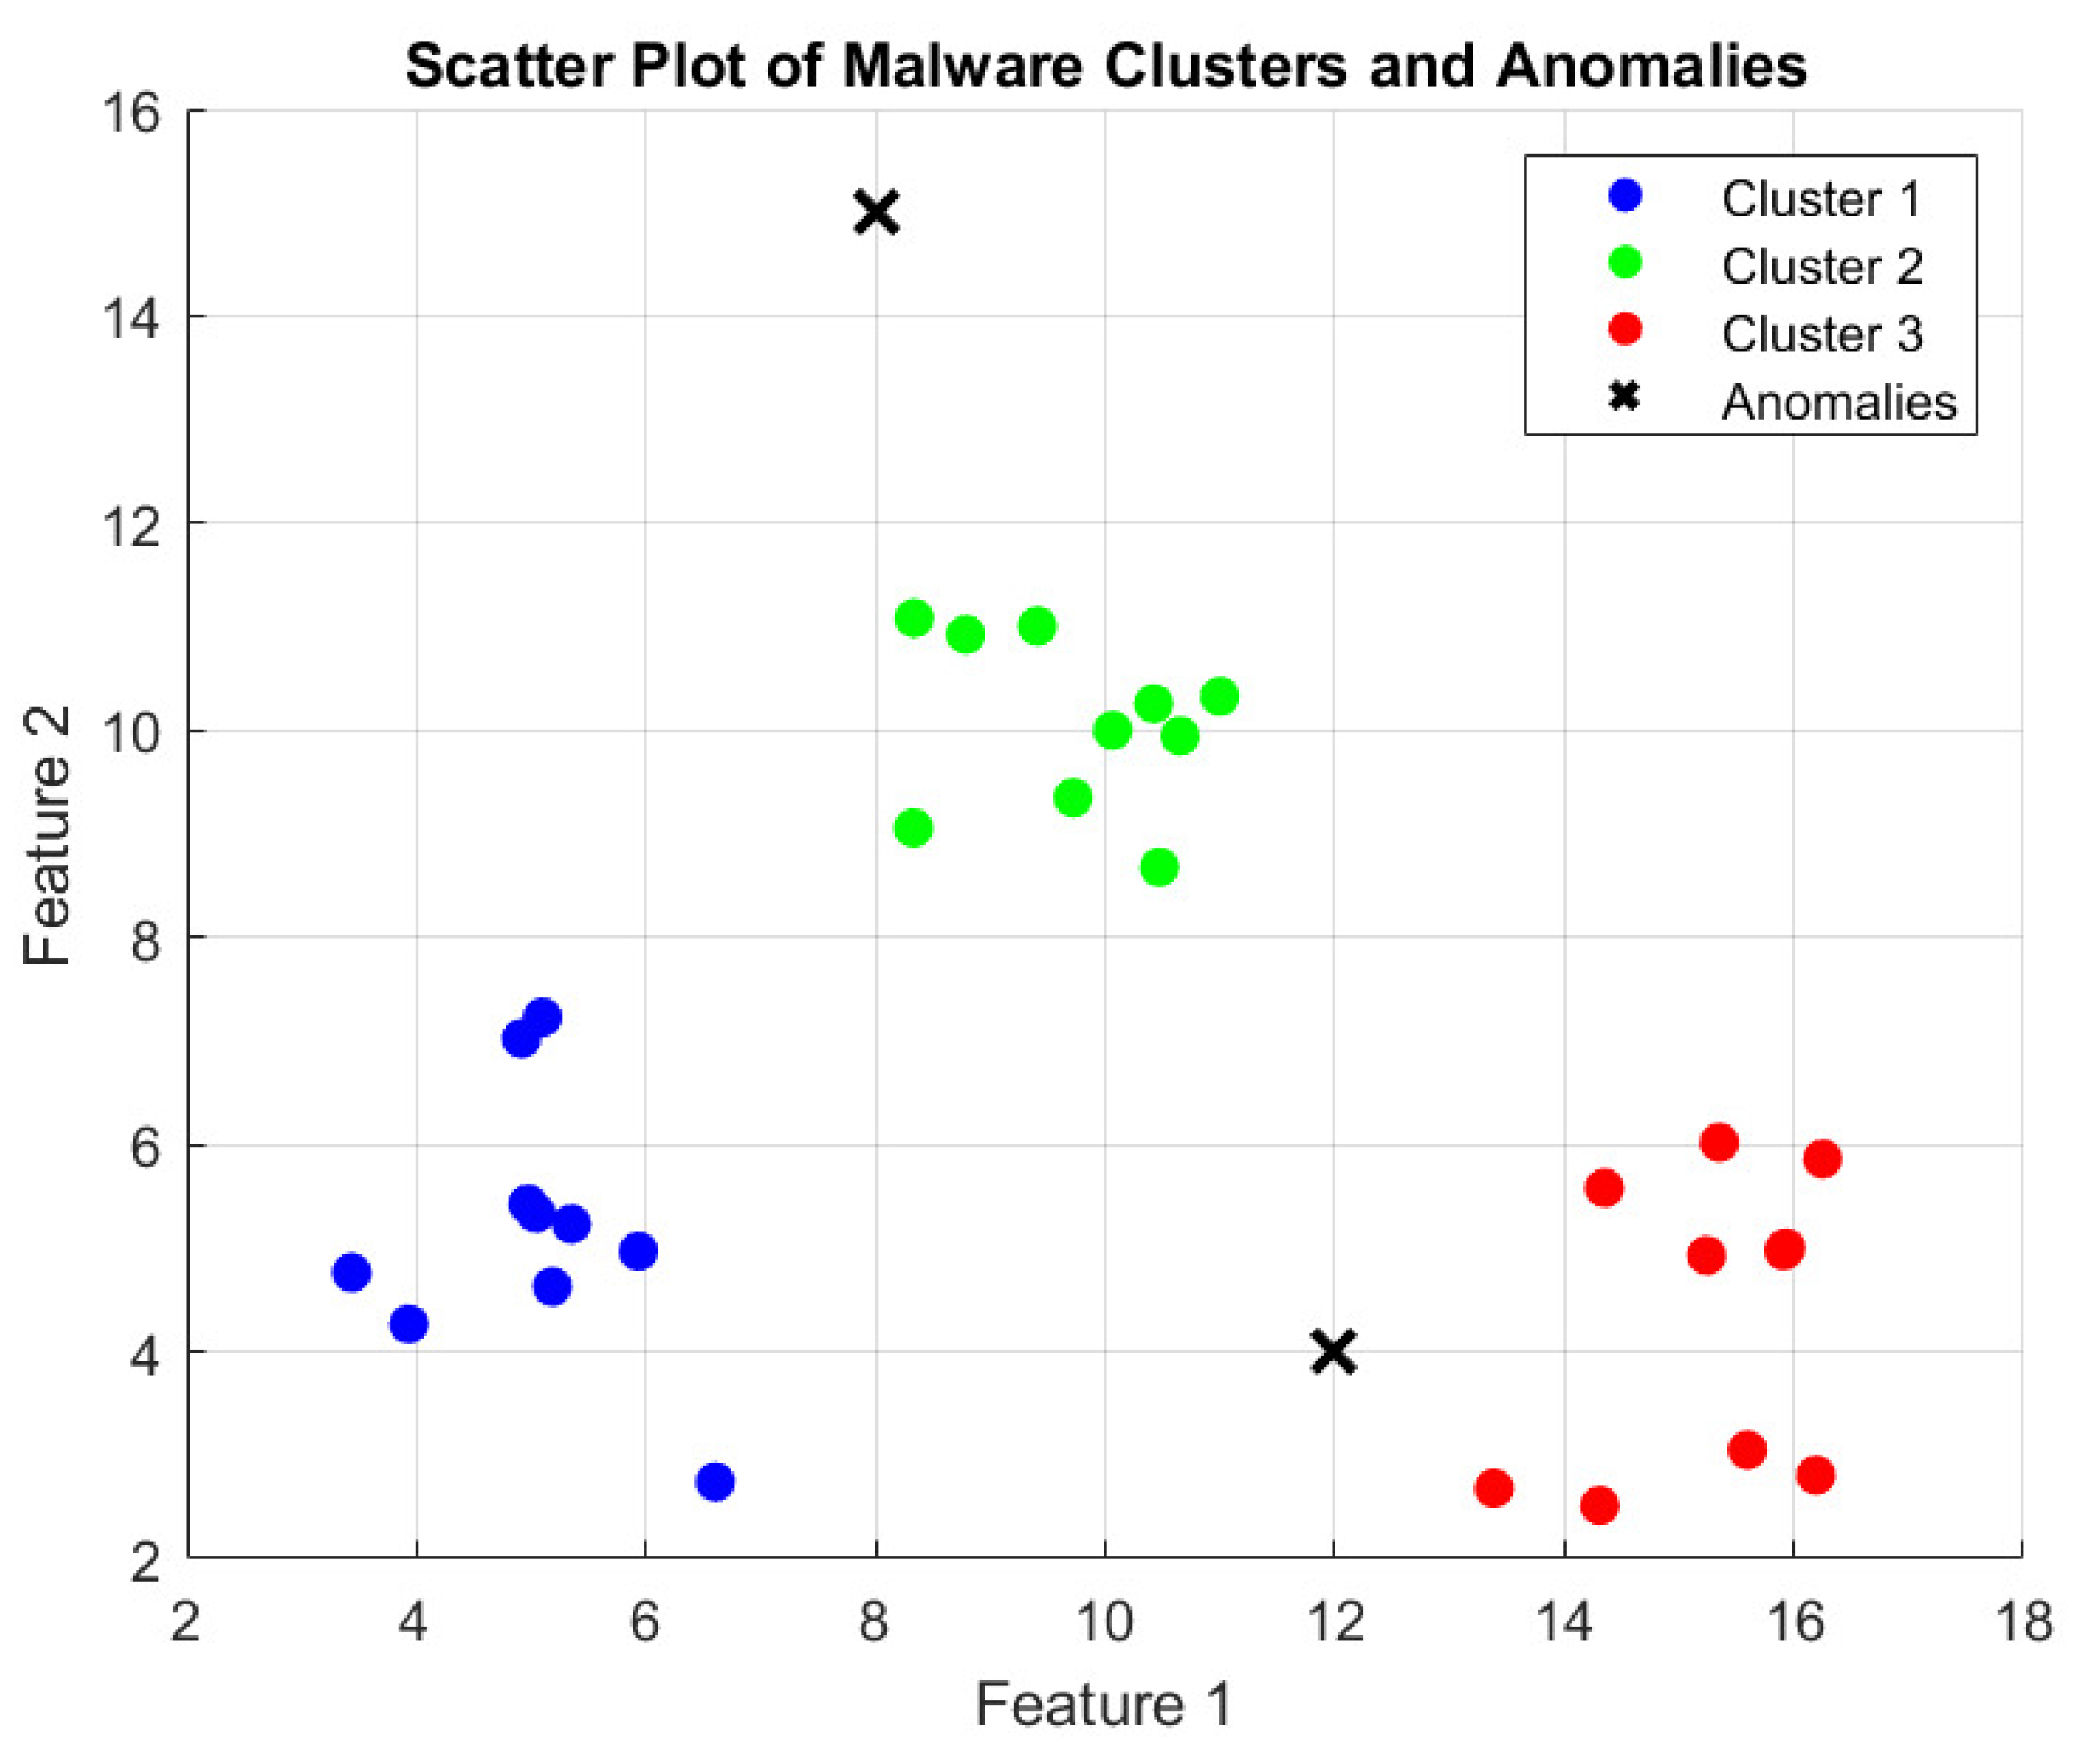
Figure 9.
Heatmaps Illustrating Pairwise Similarities Among Malware Samples.
Disclaimer/Publisher’s Note: The statements, opinions and data contained in all publications are solely those of the individual author(s) and contributor(s) and not of MDPI and/or the editor(s). MDPI and/or the editor(s) disclaim responsibility for any injury to people or property resulting from any ideas, methods, instructions or products referred to in the content. |
© 2025 by the authors. Licensee MDPI, Basel, Switzerland. This article is an open access article distributed under the terms and conditions of the Creative Commons Attribution (CC BY) license (http://creativecommons.org/licenses/by/4.0/).
Copyright: This open access article is published under a Creative Commons CC BY 4.0 license, which permit the free download, distribution, and reuse, provided that the author and preprint are cited in any reuse.


