Submitted:
10 April 2025
Posted:
12 April 2025
Read the latest preprint version here
Abstract
First demonstrated in 1942, subcritical and zero-power critical assemblies, also known as piles, are a fundamental tool for research and education at universities. Traditionally, their role has been primarily instructional and for measuring fundamental properties of neutron diffusion and transport. However, these assemblies could hold potential for modern applications and nuclear research. The Purdue University subcritical pile previously lacked a substantial testing volume, limiting its utility to simple neutron activation experiments for the purpose of undergraduate education. Following the design and addition of a mechanical and electrical testbed, this paper aims to provide an overview of the testbed design and characterize its neutron and gamma flux of the rearranged Purdue subcritical pile, justifying its use as a modern scientific instrument. The newly installed 1.5*10^5 cubic-centimeter volume testbed enables a systematic investigation of neutron and gamma effects on materials and the generation of a comprehensive dataset with the potential for machine learning applications. The neutron flux throughout the pile is measured using gold-197 and indium-115 foil activation alongside cadmium-covered foils for two-group neutron energy classification. The neutron flux measurements are then used to benchmark a detailed geometrically and materialistic accurate Monte-Carlo model using OpenMC and MCNP6.3. The experimental measurements reveal the testbed has a neutron environment with a total neutron flux approaching 9.5*10^3 n/cm^2*s and a thermal flux of 6.5*10^3 n/cm^2*s. This work establishes the modified Purdue subcritical pile can provide fair neutron and gamma fluxes within a large volume to enable radiation testing of integral electronic components and as a versatile research instrument with the potential to support material testing and limited isotope activation, while generating valuable training datasets for machine learning algorithms in nuclear applications.
Keywords:
Neutrons
; Subcritical
; Nuclear Data Set
; Irradiation Facility
; Isotope Production
1. Introduction
The first sustained nuclear chain reaction was conducted within the Chicago Pile, (CP-1) located underneath the University of Chicago’s Stagg Field in 1942. Since then, the scientific value of the subcritical pile grew significantly during the first era of nuclear energy research but now appears to have dwindled from the nuclear community [1].
There are three known subcritical piles located at Universities throughout the United States, which strictly act as an educational tool or with limited research use [2]. Recently, the pile located at Purdue University was re-arranged in late 2023 to accommodate a testbed to explore how thermal neutrons could affect the performance of microelectronics. Prior to the inclusion of the testbed, the pile was well-categorized by students and professors, however, the construction of the pile originally prevented any appreciable size of testing material from being placed within the pile. The inclusion of the testbed establishes a testing volume of approximately 1.5*10^5 cm^3 which exceeds that of any pile in the United States and of many test reactors that also exist in the university setting.
While the testbed was originally designed and constructed with the goal of testing the performance of commercial off-the-shelf microelectronics under neutron and gamma irradiation, the potential research uses extend beyond this topic of interest. An example that has received high attention within the nuclear community is the potential for limited isotope production via neutron activation under 1 Ci for research and educational purposes [3,4]. Both of which could have significant commercial and military applications.
Before the testbed can be used in any experimental capacity, it is important to quantify the spatial and energy distribution of neutrons and gammas internal and external to the testbed. These values allow for the identification of maxima and minima that may justify experimental setup and optimization. The subcritical pile neutron flux can be obtained using metallic foils that are activated and then measured for subsequent gamma decay. A secondary approach is the use of open-source Monte Carlo (MC) simulations to model the geometries of the pile to a high degree of fidelity [5]. One advantage of the MC methods is the production of large data sets that can be used for educational purposes or training and testing machine learning and artificial intelligence algorithms [6].
This article discusses the testbed design and construction, test methods, and data used to conduct metal foil neutron analysis to quantify the total flux within the pile and thermal/epithermal neutrons within the volume of the testbed. Two high-fidelity Monte Carlo models of the subcritical pile were produced using MIT’s OpenMC and MCNP6.3 software and then benchmarked using the obtained experimental metal foil measurements. The overall purpose is to classify the modified Purdue subcritical pile in the current testbed configuration to support its role as a scientific instrument for future testing and modeling of radiation environments.
2. Literature Review
Perhaps one of the most comprehensive resources for subcritical assemblies within the United States can be found in the 1961 Proceedings of the University Subcritical Assembly Conference. In this document, are the works from several universities across the nation covering the then ongoing research. The fundamentals of subcritical multiplication, nuclear diffusion theory, and construction details are discussed. The dimensions of the Purdue subcritical pile in its original configuration are listed in the proceedings. One important detail that can be derived from the graphite-moderated pile section is the analytical solution to the diffusion theory for thermal neutrons. The cosine function is used as a baseline for the experimental methods presented in this article [7].
While subcritical piles have been largely written off as only a tool to teach undergraduate students about basic neutrons, a team at MIT recently made use of their graphite pile to produce a data-driven control system. This project was sparked by the interest of the NRC and other nuclear regulators seeking the ability of artificial intelligence to control reactors. The research team highlighted the inherent safety of subcritical multiplication in the design system for training their algorithm and ultimately developing a digital twin. They reported that their artificial neural network could accurately predict the position of their initiating control rod within 2.5 cm with a 95% confidence interval [8].
Another recent study made use of a subcritical pile in Japan to conduct material testing on a fuel plate consisting of U-7Mo. A depleted uranium and molybdenum fuel that has caught the attention of non-proliferation advocates for possible refueling efforts in research reactors. The paper provides neutron flux measurements but highlights the need for additional reactor physics studies. However, the significance of this work is the use of subcritical piles to evaluate new reactor fuel sources and structural materials without the need for building large testing facilities [9].
The Purdue subcritical pile has also recently been used to evaluate the performance of the Defense Threat Reduction Agency’s Scatterable Radiation Monitor (SCRAM) while under a gamma and neutron flux. The purpose of SCRAM is to act as a Department of Defense tool for real time environmental dose readout. The inspiration for placing SCRAM into the pile was to determine if the environment in which the electronics are subjected to would cause a degradation of the accuracy of the data. While it was ultimately determined that the neutron flux was not significant enough to damage the SCRAM to any substantial degree, the rearranged pile was determined to be a useful tool in conducting microelectronic tests under low-to-medium thermal neutron flux [10].
In addition to experimental measurements, Monte Carlo numerical methods are often used to model radiation environments in which electronics are subjected to. One such example is the use of Monte-Carlo Neutron Particle transport (MCNP) to model the fast neutron environment of the University of Texas Austin’s TRIGA reactor for testing analog-digital converters. Similar to the experiment outlined in this article, this thesis compares the results of activated foil measurements to the output of MCNP for the validation of the environment. Which is then used to classify the mechanism of damage to microelectronics. The author argues the use of both experimental and numerical methods to reinforce the results of one another [11].
While MCNP is often regarded as an industry standard for modeling Monte Carlo methods, it is also an export-controlled software, which hinders the ability for some users to apply for a license. With this problem in mind, a team at MIT produced OpenMC [12]. An open source, Python-based program for rivaling MCNP. There are several advantages to OpenMC over MCNP, but OpenMC has yet to receive the same widespread industry use as its counterpart. Several comparison studies have been conducted, many of which provide evidence that OpenMC can be used as a replacement for MCNP. Though this statement should receive some scrutiny in that these studies consider one nuclear scenario of many possible that can be modeled, where one software may outperform the other. At least for common applications, OpenMC may offer a reliable substitute [5,13,14].
3. Modified Subcritical Pile Testbed
3.1. Pile Geometry
The subcritical pile is a repeating matrix of rectangular prism graphite and fuel. Natural Uranium fuel rods in aluminum cladding are placed inside graphite blocks, combining a total of 90 fuel-graphite joint blocks. Another 247 blocks of only graphite are placed as well. Together, they form the subcritical pile, measuring 179 cm in length, 260 cm in height, and 179 cm in depth. A cadmium sheath surrounds the whole pile to reduce thermal neutron flux in the worker space. 1 Americium-Berylium (AmBe) source of 10 Ci and 4 Plutonium- Berylium (PuBe) sources of 1 Ci each are placed in the pile. These sources are used to emit neutrons inside the pile, initiating and later controlling the fission reaction in the subcritical pile. The AmBe source has a neutron yield of 2.0 – 2.4*10^6 n/(s*Ci), while each PuBe source has a neutron yield of 1.5 – 2.0*10^6 n/(s*Ci) [21].
The chief addition to the pile is the rectangular testbed near the upper center in the Z and X planes. This feature was added to the pile in late 2023 and is the focal point of what differentiates the Purdue sub-critical pile from others. The testbed dimensions are 45 cm x 20 cm 162 cm, the limiting constraint was set to ensure minimal disruption to the original pile configuration. In addition to the test bed volume, there is a removable platform on drawer slides to allow for easy placement of test materials. The platform minimizes the potential for contamination from test materials and minimizes the dose to technicians while conducting measurements. The platform is roughly the same width as the testbed but has half of the depth into the pile. This design feature was selected due to the placement of the neutron sources near the front face of the pile relative to the personnel working space. Figure 1 displays the front and isometric views of the pile.
In addition to volume consideration for the testbed, the secondary concern was the potential for creating long-lived radioactive material. To prevent undesired waste, aluminum was selected as the structural material. While the potential for activation of Al-27 is not low (0.231 b), the half-life of Al-28 is 2.3 minutes, classifying the material as a short-lived isotope. The hardware of the testbed to a reasonable degree is low-cobalt steel. Construction materials were selected for metals that had a low cross-section for absorption and subsequent activation, as a result, the bulk of the testbed is aluminum. Thus, minimizing the production of long-lived waste. A 3D SolidWorks rendering of the test bed is shown in Figure 2. The testbed integrated into the pile from the working face is shown in Figure 3.
4. Methods
4.1. Neutron Interactions
Neutrons interact with the nuclei of target materials via scattering or absorption reactions. The methods outlined in ASTM Standard E262-17 are the basis of the analysis techniques presented in this work [15,16].
The specific isotopes being activated for neutron flux measurements are indium-115 and gold-197. The specific neutron activation reactions are given by reactions (1) and (2).
The gold reaction is straightforward, as it only has one naturally occurring isotope (Au-197), and it only activates to a single isotope (Au-198) with a singular photopeak of 411 keV. The cross-section for this reaction is 98.65 barns assuming a complete thermal flux. The indium reaction is more complicated, as naturally occurring indium contains more than one isotope. Indium-113 is present in natural indium at 4.28% abundance, and indium-115 making up the remaining 95.72%. Indium-113 activates to indium-114. With a half-life of 49.51 days, often indium-114 is not activated enough to be taken into consideration during neutron activation analysis. The final consideration to take into account is that indium-115 can activate into a metastable isotope. 79% of the time, indium-115 activates to indium-116m with half-life 54.29 minutes, so the neutron absorption cross section (202 barns) must be multiplied by 0.79 to yield the appropriate cross section for this specific reaction (159.58 barns). The other isotopes indium-115 activate into indium-116 and indium-116m2) have half-lives of less than 15 seconds, therefore it is important for those isotopes to decay before measuring the activities of any indium foils during neutron activation analysis [17].
In a similar manner, neutrons are also captured by cadmium-113. This isotope has a large capture cross-section at 0.55 eV (2233 barns), when compared to surrounding energies. This makes it convenient to block out thermal neutrons from reaching an activation foil by covering the foil with cadmium. The method of cadmium-covered activation foils is discussed extensively later in this work. Reaction (3) displays cadmium absorption [17].
4.2. Metal Foil Neutron Activation
Au-197 (1.5 cm and 0.1 mm) and In-115 foils (2.5 cm in diameter and 0.25 mm) thickness were activated in the subcritical pile to determine the neutron flux at different locations throughout, with an emphasis on the testbed region. Once activated, the gamma decay energy could be measured in order to determine the neutron flux at that location.
Foils measured throughout the pile were placed in an aluminum tray. The tray extends the whole length of the pile and has 17 slots to place foils. Each slot has an aluminum covering and a label to ensure consistent placement and safety of the handler. Due to having only nine indium-115 foils, they were placed in every other slot. Each foil was labeled with a letter that corresponded to the numbered slot they were placed.
Foils for testbed measurement were set in various measured locations on the platform to be activated. There were several orientations, and the placement location was determined by taking the width and the length and then dividing by the number of foils in each respective dimension. For example, a layout of 3 wide by 4 deep was placed on the testbed described in Figure 4.
All indium foils were activated in the pile overnight to ensure they reached saturation. Gold foils were activated for 14 days for the saturation condition. When being placed in the pile and removed, proper safety precautions were taken. The handlers wore a dosimeter to track their radiation exposure, as well as gloves to prevent contamination. When removing the foils from the pile, the long trays were taken out and moved to a separate room with the germanium detector. They were set on a desk on the opposite side of the room from the handler and the detector, still in the tray. When removing the foils from the testbed, tweezers were used to pick up and transport the foils to the detector. For indium, only one foil was moved at a time to prevent decay. However, the decay time of gold is sufficiently long, so this is not a factor.
4.3. Two-Group Neutron Profile
The measurement and subsequent calculation of two energy groups of neutrons require a two-foil approach. This is typically conducted through a cadmium-gold combination due to the neutron absorption cross-sections of the metals. In the thermal neutron energies (considered less than 1 eV for Cd), the neutron cross section is at least two orders of magnitude larger than gold. A 1 mm thick 1 cm diameter cadmium cover over gold will attenuate 99% of the thermal neutrons [18]. Thus, any gold activation is the result of epithermal neutrons. Figure 5 displays the setup of the gold foils in the cadmium cover in addition to the neutron cross-section for the absorption of the two metals.
The calculation process requires the use of both cadmium-covered and bare foils. The measured activity of the bare foils (Ab) and covered foils (Ac) normalized for mass are used to develop the cadmium ratio (Rcd), shown in equation (4). The gamma-decay constant (λ), activation time (ta), cooling time (tw), averaged neutron cross-section for absorption for thermal neutrons (σth), resonance integral of cadmium energy cross-section (I0), the thermal self-shielding (Gth), and resonance self-sheilding (Gepi) are all required to calculate the thermal flux and epithermal flux respectively from equations (5) and (7) [16]. Fcd is a convenience variable that is calculated in equation (6).
There is a fast neutron flux present in the pile due to the fission sources, but for experimental measurements, it is assumed less than 1%. Subsequently, the energy range of epithermal neutrons is assumed to be between 2.5 MeV and 0.5 eV. All energies below the cadmium cutoff are assumed thermal. The resonance integral, thermal self-shielding factor, and resonance self-shielding factor were determined using the ASTM standard [16]
The shelf-sheilding values were also validated in the MCNP file by a method that was not found in other literature. First, the gold and indium foils were defined in the MCNP subcritical pile model. This was done by modeling the foils as having the same measured diameter and thickness and being located at the same physical location they were irradiated at in the pile. With the foils defined a track-length flux tally was defined for each cell containing a foil. A number density, cell volume and (n,gamma) cross-section for the given material was applied to each tally. The resulting tally gives the neutron activation reaction rate per unit volume for the cell. For this first case, where the foils are modeled as having the original thickness of the physical foils that were irradiated, the self-shielding effect is inherently present in the calculated tallies. Next, the gold foils are modeled again, the same as the first case with the only difference being the thickness decreased to a value where the predicted self-shielding effect is much less than 1%. In this case 1 µm for gold and 0.1 µm for the indium foils. With the same tallies applied to the ‘thin’ foils the resulting activation rates per unit volume are greater than the ‘thick’ foils. The difference between these two values is then due to the self-shielding encountered by the ‘thick’ foils. By taking the ratio of these two values, for each modeled foil, a self-shielding factor can be found for each.
4.4. Monte Carlo Pile Modeling
The entire subcritical pile was modeled using the Python language-based OpenMC software and the industry standard Fortran-based MCNP6.3. The geometry was measured and replicated in the software using the respective languages. Material assignments were conducted by referencing technical manuals from the pile construction. The source strength was defined by the known fission rate of the Am-Be and Pu-Be sources placed within the graphite channels of the pile [22]. The geometry of the models is defined using constructive solid geometry (CSG), also sometimes referred to as combinational geometry. This is conducted by defining regions of space where the neutron is either counted or discarded. It is important to note for this particular model that any physical void space within the pile was assigned to air at standard temperature and pressure. All regions outside the cadmium shield set the neutron impornatce to null and discarded the counts. Though each graphite cell and the testbed were modeled, the placement of count tallies hides these features in the model when displaying the neutron count for any given location.
While the inputs between the two codes vary slightly, all efforts were made to replicate the same input between each code. Figure 6 provides the output of the MCNP and OpenMC tallies for the pile as viewed from the working space of the testbed. The tallies were normalized to one for each respective model, then the logarithmic value was plotted. It is important to note that tallies for the two models do not output neutron flux directly, and their comparison to the experimental results cannot be made without considering the source strength. However, they are proportional to flux, and a normalization of both models and experimental results offers a convenient means of comparing the foils to a corresponding tally. Where taking the logarithim aids in generating the visual comparison of two Monte Carlo methods only.
At first glance, it becomes evident that the OpenMC model is slightly cooler than the MCNP model. Evidence supports that while this effect is minimal, the AmBe and PuBe sources are handled differently between the two codes. This is more apparent when peering at the X-Y plane at Z = 30.48 cm, where the three sources are defined. This is displayed in Figure 7. Where the general flux profile is similar, but the OpenMC is slightly lower and concentrated about 15 cm offset from the MCNP.
However, the flux contour in the Y-Z plane at X=0 shows a slightly different perspective. Where the upper set of sources, which are only PuBe, agree better than the lower set. This suggests that OpenMC’s handling of the AmBe source is the basis for the difference in the models. These observations are displayed in Figure 8.
Despite the slight deviation between the two Monte Carlo methods near the defined AmBe source, the general neutron flux profile is consistent. Because the testbed region exists between the two sets of defined sources in the Y-Z plane and has fair agreement between the two data sets, the models are taken as comparable. However, because MCNP has a more historical use in the industry, it is taken as the more accurate model of the two. When analyzing neutron cross-sections and the energy profile, the MCNP model is considered.
5. Results
5.1. Detector Energy Calibration
The use of the HPGe is standard among radiation detection experiments for its high energy resolution. Equation (8) displays the method for calculating energy resolution. Where FWHM is the full width at half maximum. The ideal energy resolution as a function of energy follows the proportional relationship (9). Data produced from the HPGe measurements are found in Table 2.
An energy calibration is conducted through the use of known gamma-emitting test sources. The HPGe in the following experiments made use of Na-22, Ba-133, Co-60, and Cs-137 to establish the near-linear channel-to-energy relationship. An ABS 3D printed stand (10.8 cm above the end cap) was built for general use of the HPGe to minimize the potential for end cap contamination. Figure 9 displays the stand and measurement setup. The Maestro software was used to analyze HPGe radiation counts. The software has a built-in function that allows the assignment of channels to a particular energy. Table 1 presents the measured resolution, and Figure 10 displays the resolution graphed against photopeak energy, where the measured values are in agreement with the expected values calculated through relationship (9).
5.2. Absolute Photopeak Efficiency
As is the case with all instruments, the HPGe detectors are not capable of detecting all of the radiation emitted from a source. Geometry, distance, energy, and imperfections in electronics make for a less-than-ideal counting space. The counting error is minimized by investigating the detector’s absolute photopeak efficiency as a function of gamma energy. Again, test sources are used for this calculation. However, the activity of the source must be brought to the current date. In these experiments, the activity of the sources was verified on 01 July 2003. Using the exponential decay equation (10) and the half-life of the isotope of interest, the activity in decays/second could be determined for the date of the measurement.
The ratio of the activity measured by the detector and the current date activity at the particular photopeak is the absolute photopeak efficiency. These values must be calculated at the location where subsequent measurements are intended to be taken. Distance from the source to the detector face has a strong dependence on absolute efficiency. If there is a deviation from this practice, it is important to consider the distance of the source relative to the detector face to determine if the source should be treated as a point source or a planar source. A general rule includes that any source greater than 10 cm is considered a point source. Figure 11 provides the measured absolute photopeak efficiency for the HPGe detector at the endcap, where the gold foils were measured. A curve was fitted that follows equation (11). Where ε is the absolute efficiency and E is the gamma energy in keV. A second set of measurements was taken on the 3D printed platform for the indium foils, which can be found in Appendix A.
5.3. Testbed Region Neutron Flux Measured by Indium and Gold
The neutron flux within the volume of the testbed was measured using gold foils in a 4-wide by 7-deep configuration. The HPGe photopeak efficiency of gold was determined to be approximately 0.074 at the 411.0 keV photopeak through curve fitting. Using this value, the neutron flux as a function of location was determined for the 28 foils. To determine the average value of the flux, the mean of the 4 foils at each depth position was considered to determine the testbed centerline flux. The averaged flux along the depth (Y) dimension of the testbed is shown in Figure 12. The dimensions of the profile are in the X-Z plane relative to the OpenMC model. However, the origin of the testbed is set at the front face of the pile.
A similar analysis was conducted to verify the results of the gold foil experiments by using indium foils as the activation target. When using indium, multiple photopeaks can be used for the calculation. Similar to gold, each of the absolute photopeak efficiencies and branching ratios must be found. Table 3 displays the values for the activated indium photopeaks determined through Appendix A. Figure 12 also displays the calculated neutron flux for the approximately same testbed region as displayed above for both the gold-197 and indium-115 foils. It is important to note that there were 4 by 12 foils in the indium trial. The centerline average is considered because the length dimension for each depth position has a relatively flat neutron flux, as indicated by Figure 13 with the gold foils. However, the same occurrence was observed with indium. The uncertainty in the calculated flux values propagates the uncertainties from counts, absolute photopeak efficiency, and cross-section from the ASTM standard.
5.4. Two Energy Neutron Testbed Profile
Following the measurement of the bare and cadmium-covered foils from the pile, mass-normalized activity was considered to determine the Rcd value as a function of depth. The cadmium ratio, on average, was determined to be 3.8 for gold and 4.2 for indium. These values were assumed to be the Rcd for further calculations of epithermal and thermal neutrons. Making use of the equations presented in section 4.4, along with the activity and estimated RCd, the thermal and epithermal neutrons can be calculated as a function of the depth of the test bed. The results of the calculated two-energy group neutron flux are also presented in Figure 14. The uncertainty in the calculated thermal and epithermal flux values propagates the uncertainties from counts, absolute photopeak efficiency foil cross-section, and cadmium cover cross-section from the ASTM standard
5.5. Complete Pile Volume Neutron Flux via Indium Foils
The neutron flux across the full volume of the subcritical pile was measured using Indium foils. 271 foils were placed in various locations throughout the pile in place of graphite rods. The HPGE photopeak efficiency of Indium was measured at 2.24 x 10^-2 at the 1293 keV peak. Using this value along with the other necessary parameters from equation (7), the radiation counts measured from the HPGE detector were converted into flux values for this photopeak. The total flux averaged from the 417 keV, 1097 keV, and 1293 keV photopeaks of In-116m throughout the volume of the pile is displayed in Figure 15. This figure omits the testbed region, as these measurements were conducted separately.
5.6. Gamma Profile of Subcritical Pile
Though neutrons were the primary concern during this study, a gamma measurement was conducted with a sodium-iodide detector. The premise of this measurement is to establish a sense of the energy profile of the gammas. While the gamma flux at any point within the pile is not considered. The use of foils to measure neutron flux allows for an indirect measurement without damage to electronic equipment. The direct measurement of gammas within the pile could potentially damage the detector. As a result, the sodium-iodide detector was placed 30 centimeters away from the front face of the pile for 10 minutes. The energy spectra collected were primarily low-energy gammas, indicative of uranium fission. However, two additional photopeaks and a 511-peak were identified. Figure 16 contains the collected gamma energy spectrum and detector energy calibration.
5.7. MCNP and OpenMC Modeled Pile
The experiments within the testbed and of the entire pile were conducted separately. Subsequently, the normalization for the two regions of interest is handled differently to portray the results best. For the region within the testbed, the centerline flux was calculated by averaging the results from the foils in the same methods discussed earlier. However, the Monte Carlo results were exclusively taken from tallies along the centerline. Because the testbed region is small relative to the entire pile volume, these tallies were normalized to one within the dataset corresponding to the centerline of the testbed. It should be noted that simulated data is a function of defined source strength. Therefore, the shape of the plots as a function of depth is of interest. Shown below in Figure 17 is the Monte Carlo data from both models overlayed with the values of the flux measured from gold and indium within the testbed.
Conversely, the remainder of the pile volume is normalized to one, considering the largest tally or measured indium flux from the respective data sets. This process allows for a better representation of the overall volumetric flux shape than normalizing each depth as conducted within the testbed. To display the agreement between the simulated data and measured data, three regions designated low, medium, and high flux were selected from the Indium data set in Figure 15 and plotted against the simulated data as a function of depth into the pile. The flux designation was subjectively chosen relative to the distance from the source. However, all of the data plotted in one designator is representative of the same region within the pile volume, excluding the testbed volume or physical AmBe/PuBe sources. Figure 18, Figure 19, and Figure 20 correspond to low, medium, and high flux, respectively. Note, error for the Monte Carlo data is smaller than the symbol.
6. Discussion
6.1. Subcritical Pile Error Analysis
The advantage of using Monte Carlo methods in conjunction with the experimental data allows for an exploration into the experimental uncertainties generated through measurements. It is believed that the largest source of error for the flux calculations in the experimental setup is the assumption of a constant microscopic cross section for absorption as a function of depth into the testbed and the consistent energy profile throughout the pile. The ASTM attempts to correct for this by providing integrated cross-section data, but this is based upon experiments that have a different neutron energy profile than this experiment. The neutron energy profile generated by Monte Carlo method indicates that the energy profile varies as a function of location within the testbed. This occurrence, in turn, affects the probability of absorption for each foil within any given testbed location. The average microscopic cross-section for absorption was calculated for gold and indium. These values are presented in Figure 21, where the color represents the relative difference in barns. If accurate, this would indicate an underestimate of the gold calculated flux and an overestimate of the indium calculated flux compared to the nominal values selected from the ASTM standard.
Evidence in support of the Monte Carlo generated cross-section data may also be drawn from two other assumptions that were made. The first is that there is no fast flux in the pile. This is simply not true; fission neutrons are generated at energies considered fast and upscattering does occur. The second assumption is that the cadmium-covered foils remove all the thermal flux. Including these effects will vary the average cross-section value. This is supported by plotting a spectrum of the generated neutron energy as a function of location within the testbed. Shown in Figure 22 is the neutron energy spectra as a function of testbed depth, and also displays the percent difference among locations.
To calculate the whole energy spectrum weighted cross-sections a flux tally of each cell containing a foil was performed on the MCNP model, with this tally being split into 252 separate energy bins spanning from 1E-4 eV to 20 MeV. This 252-group neutron energy spectrum was then normalized to one. Each corresponding energy bin was then multiplied by the cross-section value specified by the ENDF/B-VIII.0: AU-197(n,g)AU-198 library for that same energy window. By summing all of these partial cross-section values together a whole energy spectrum weighted cross-section for each foil was found.
The MCNP results suggest that the largest number of fast neutrons relative to the testbed exist above the AmBe source. This is intuitive given the large source strength of the AmBe source compared to the PuBe sources and the birth energies of neutrons from both AmBe and PuBe. These results are further supported with the cadmium covered gold experiment. Where the epithermal neutron flux from foils placed at 22 cm depth extend above the expected cosine distribution by approximately 20%.
The experimental methods in this article aim to validate the results in the Monte Carlo output. Efforts were taken to maintain consistently among all foil measurements. However, it should be noted that sources of error in this data set are a result of conducting a detector calibration for each foil set and taking the centerline average of the testbed. Ultimately, the testbed and the whole pile measurements were independent experiments aligned with a common coordinate system to establish characterization through the subcritical volume. Ultimately the combined foil datasets, aligned with the normalized flux profiles of each numerical model providing support for the characterization of the Purdue subcritical pile.
7. Conclusions
Purdue University is home to one of three subcritical piles at universities in the United States. It features a testbed located in between neutron sources. The testbed was included in 2023, allowing enough volume for devices and objects to be placed and tested. The inclusion of the testbed separates the pile at Purdue University from those at other universities.
To use the subcritical pile and testbed for experiments, the neutron flux present at various locations must be determined. Multiple experiments were conducted to establish these values, including measuring the gamma decay of metallic foils after being activated in the neutron flux and Monte Carlo simulations.
Au-197 and In-115 foils were placed throughout the pile and on the testbed in the neutron flux for a time duration to reach saturation. Once removed, the foils were placed in a high-purity germanium detector to determine a neutron flux proportional to decay gammas. MCNP and OpenMC programs were used to replicate the pile geometry and materials to validate the measurements from foil activation. While there was general agreement among the experimental and computational methods, it was determined that OpenMC, given the same input, underperforms in handling the AmBe source. This resulted in a slightly lower neutron flux profile when compared to the experimental and MCNP results. However, this difference remains minimal in regions of the pile that are greater than 4 cm radially from the AmBe source.
Furthermore, the use of the ASTM standard for measuring neutron flux with foil activation presents an acceptable means of classifying neutron flux. However, the tabulated variables for the calculations are often a result of integrating the neutron energy dependent variable over relevant energies. The use of an indefinite integral neglects to take into consideration the birth energies of any particular source. As a result, this method could over- or underestimate the values. Due to the use of graphite in the pile, it was assumed that the ratio of thermal to epithermal neutrons was the same throughout. As such, the same neutron cross sections were applied to all of the foils. An energy profile generated from MCNP suggested that the fast/epithermal flux above the AmBe source was upwards of 350% compared to the testbed volume average. This was further validated in the cadmium covered foil experiments. This finding invalidates the assumption of a constant cross-section value applied to all foils.
Without the individual cross-section correction, the indium-116m and gold-198 foil experiments indicate that in the maximum testbed region exhibits a thermal and epithermal neutron flux of 6.5E+03 n/cm^2*s and 1.1E+03 n/cm^2*s respectively. For a total neutron flux of 9.5E+03 n/cm^2*, where the discrepancy is due to fast neutrons. Excluding the sources, the maximum measured total neutron flux in the entire pile was determined to be 1.1E^4 n/cm^2*s. Efforts were not specifically conducted to separate energies at this location, but it can be assumed the majority of these neutrons are fast and epithermal due to the proximity to the sources. Though it should be mentioned that the testbed remains the area of interest, as this is where radiation tests would be conducted.
Future work related to this project may include methods that aim to experimentally measure the gamma flux within the subcritical pile and the testbed region. This can then be used to validate the Monte Carlo generated gamma energy spectra and flux maps. Given the correlation between the experimental and MC generated neutron data, it can reasonably be assumed that the gamma data generated has some validity when compared to the subcritical pile. The gamma production results presented should be viewed as, at the very least, a numerical approximation based on a partially characterized MCNP and OpenMC model.
Author Contributions
Conceptualization, B.J., M.N., T.M., and S.C.; methodology, All; software, V.T.; validation, M.N., R.M., H.P., and V.T.; resources, B.J., T.M., S.C.; data curation, R.M.; writing—original draft preparation, M.N., R.M., H.P. and V.T.; Editing, S.C.; supervision, S.C. All authors have read and agreed to the published version of the manuscript.
Funding
This project did not receive external funding.
Data Availability Statement
Data is available upon request.
Acknowledgments
An additional thank you to the Purdue Military Research Institute for their support in higher education for the authors.
Conflicts of Interest
The authors declare no conflicts of interest.
Appendix A

Table A1.
Absolute Photopeak Efficiency at 3D Printed Platform.
| Energy (keV) | Resolution (%) | Error (%) |
|---|---|---|
| 80.0 | 6.05E-03 | 3.06E-02 |
| 276.4 | 6.98E-03 | 2.17E-02 |
| 302.8 | 5.25E-03 | 2.56E-02 |
| 356.0 | 3.99E-03 | 3.24E-02 |
| 383.8 | 3.78E-03 | 1.97E-02 |
| 662.0 | 2.24E-03 | 3.72E-02 |
| 1173.0 | 1.49E-03 | 1.97E-02 |
| 1332.0 | 1.34E-03 | 1.92E-02 |
References
- Manhattan Project: CP-1 Goes Critical, Met Lab, December 2, 1942. Available online: https://www.osti.gov/opennet/manhattan-project-history/Events/1942-1944_pu/cp-1_critical.htm (accessed on 16 December 2024).
- RRDB. Available online: https://nucleus.iaea.org/rrdb/#/home (accessed on 16 December 2024).
- Beck, J.N.; Lamberty, C.M. THERMAL NEUTRON ACTIVATION ANALYSIS—AN IMPORTANT ANALYTICAL TOOL. Applied Spectroscopy Reviews 2002, 37, 19–55. [Google Scholar] [CrossRef]
- Kardjilov, N.; Manke, I.; Hilger, A.; Strobl, M.; Banhart, J. Neutron Imaging in Materials Science. Materials Today 2011, 14, 248–256. [Google Scholar] [CrossRef]
- Lababsa, D.; Mazrou, H.; Belgaid, M. Performance Evaluation and Validation of OpenMC Code for Criticality Analysis of an MTR-Type Research Reactor. Annals of Nuclear Energy 2024, 206, 110617. [Google Scholar] [CrossRef]
- Vasili, K.; Seda Yilmaz; Matthew M. Niichel; Jonah Lau; Shripad Revankar; Lefteri Tsoukalas; Stylianos; Chatzidakis Exploring Quantitative and Qualitative Machine Learning Methods for Predicting Neutron Flux Values from a Simulated Molten Salt Reactor. In Proceedings of the TRANSACTIONS; Las Vegas, 2024.
- Proceedings of the University Subcritical Assemblies Conference: Held at Gatlinburg, Tennessee, August 28-30, 1961; United States Atomic Energy Commission, Technical Information Service Extension, 1961.
- Yu, J.; Wilson, J.C.; Dave, A.J.; Sun, K.; Forget, B.; Phillips, B. Experimental Demonstration of a Data-Driven Control System for Subcritical Nuclear Facility. Progress in Nuclear Energy 2024, 168, 104977. [Google Scholar] [CrossRef]
- Takahashi, Y.; Wakabayashi, K.; Kitamura, Y.; Unesaki, H.; Misawa, T. Subcritical Experiment Using U-7Mo LEU at KUCA Facility. RERTR 2022 – 42nd International Meeting on Reduced Enrichment for Research and Test Reactors.
- Niichel, M. Development of An Electronics Testbed For Radiation Testing In Gamma And Neutron Environments, Purdue University: West Lafayette, IN, 2024.
- Aghara, S. Characterization of an in -Core Irradiator for Testing of Microelectronics in a Mixed Radiation Environment, The Univerity of Texas Austin, 2003.
- Romano, P.; Horelik, N.; Herman, B.; Nelson, A.; Forget, B.; Smith, K. OpenMC: A State-of-the-Art Monte Carlo Code for Research and Development 2015.
- Raflis, H.; Ilham, M.; Su’ud, Z.; Waris, A.; Irwanto, D. Comparative Study on Fuel Assembly of Modular Gas-Cooled Fast Reactor Using MCNP and OpenMC Code. J. Phys.: Conf. Ser. 2021, 1772, 012031. [Google Scholar] [CrossRef]
- Eade, T.; Colling, B.; Naish, J.; Packer, L.W.; Valentine, A. Shutdown Dose Rate Benchmarking Using Modern Particle Transport Codes. Nucl. Fusion 2020, 60, 056024. [Google Scholar] [CrossRef]
- Lewis, E.E. Fundamentals of Nuclear Reactor Physics; Academic Press: Amsterdam; Boston, 2008; ISBN 978-0-12-370631-7.
- Standard Test Method for Determining Thermal Neutron Reaction Rates and Thermal Neutron Fluence Rates by Radioactivation Techniques. Available online: https://www.astm.org/e0262-17.html (accessed on 29 August 2024).
- E10 Committee ASTM International. Test Method for Determining Thermal Neutron Reaction Rates and Thermal Neutron Fluence Rates by Radioactivation Techniques. [CrossRef]
- Thomas, D.J.; Kolkowski, P.; Roberts, N.J.; D’Mellow, B.; Joyce, M.J. Investigation of a Possible Replacement for Cadmium as a Thermal Neutron Absorbing Material in Neutron Instruments; National Physical Laboratory, 2006.
- Sirakov; Kopecky; Young Au-197 (N,Tot).
- MUGHABGHAB Cd-113 (N,Tot) 2010.
- W.G. Mughabghab Indium 115 Neutron Total Cross-Section Data 2024.
- 0751 - H122 - Basic Health Physics - 25 - Neutron Sources. US NRC, 2011.
Figure 1.
3D SolidWorks of subcritical pile with testbed integration.
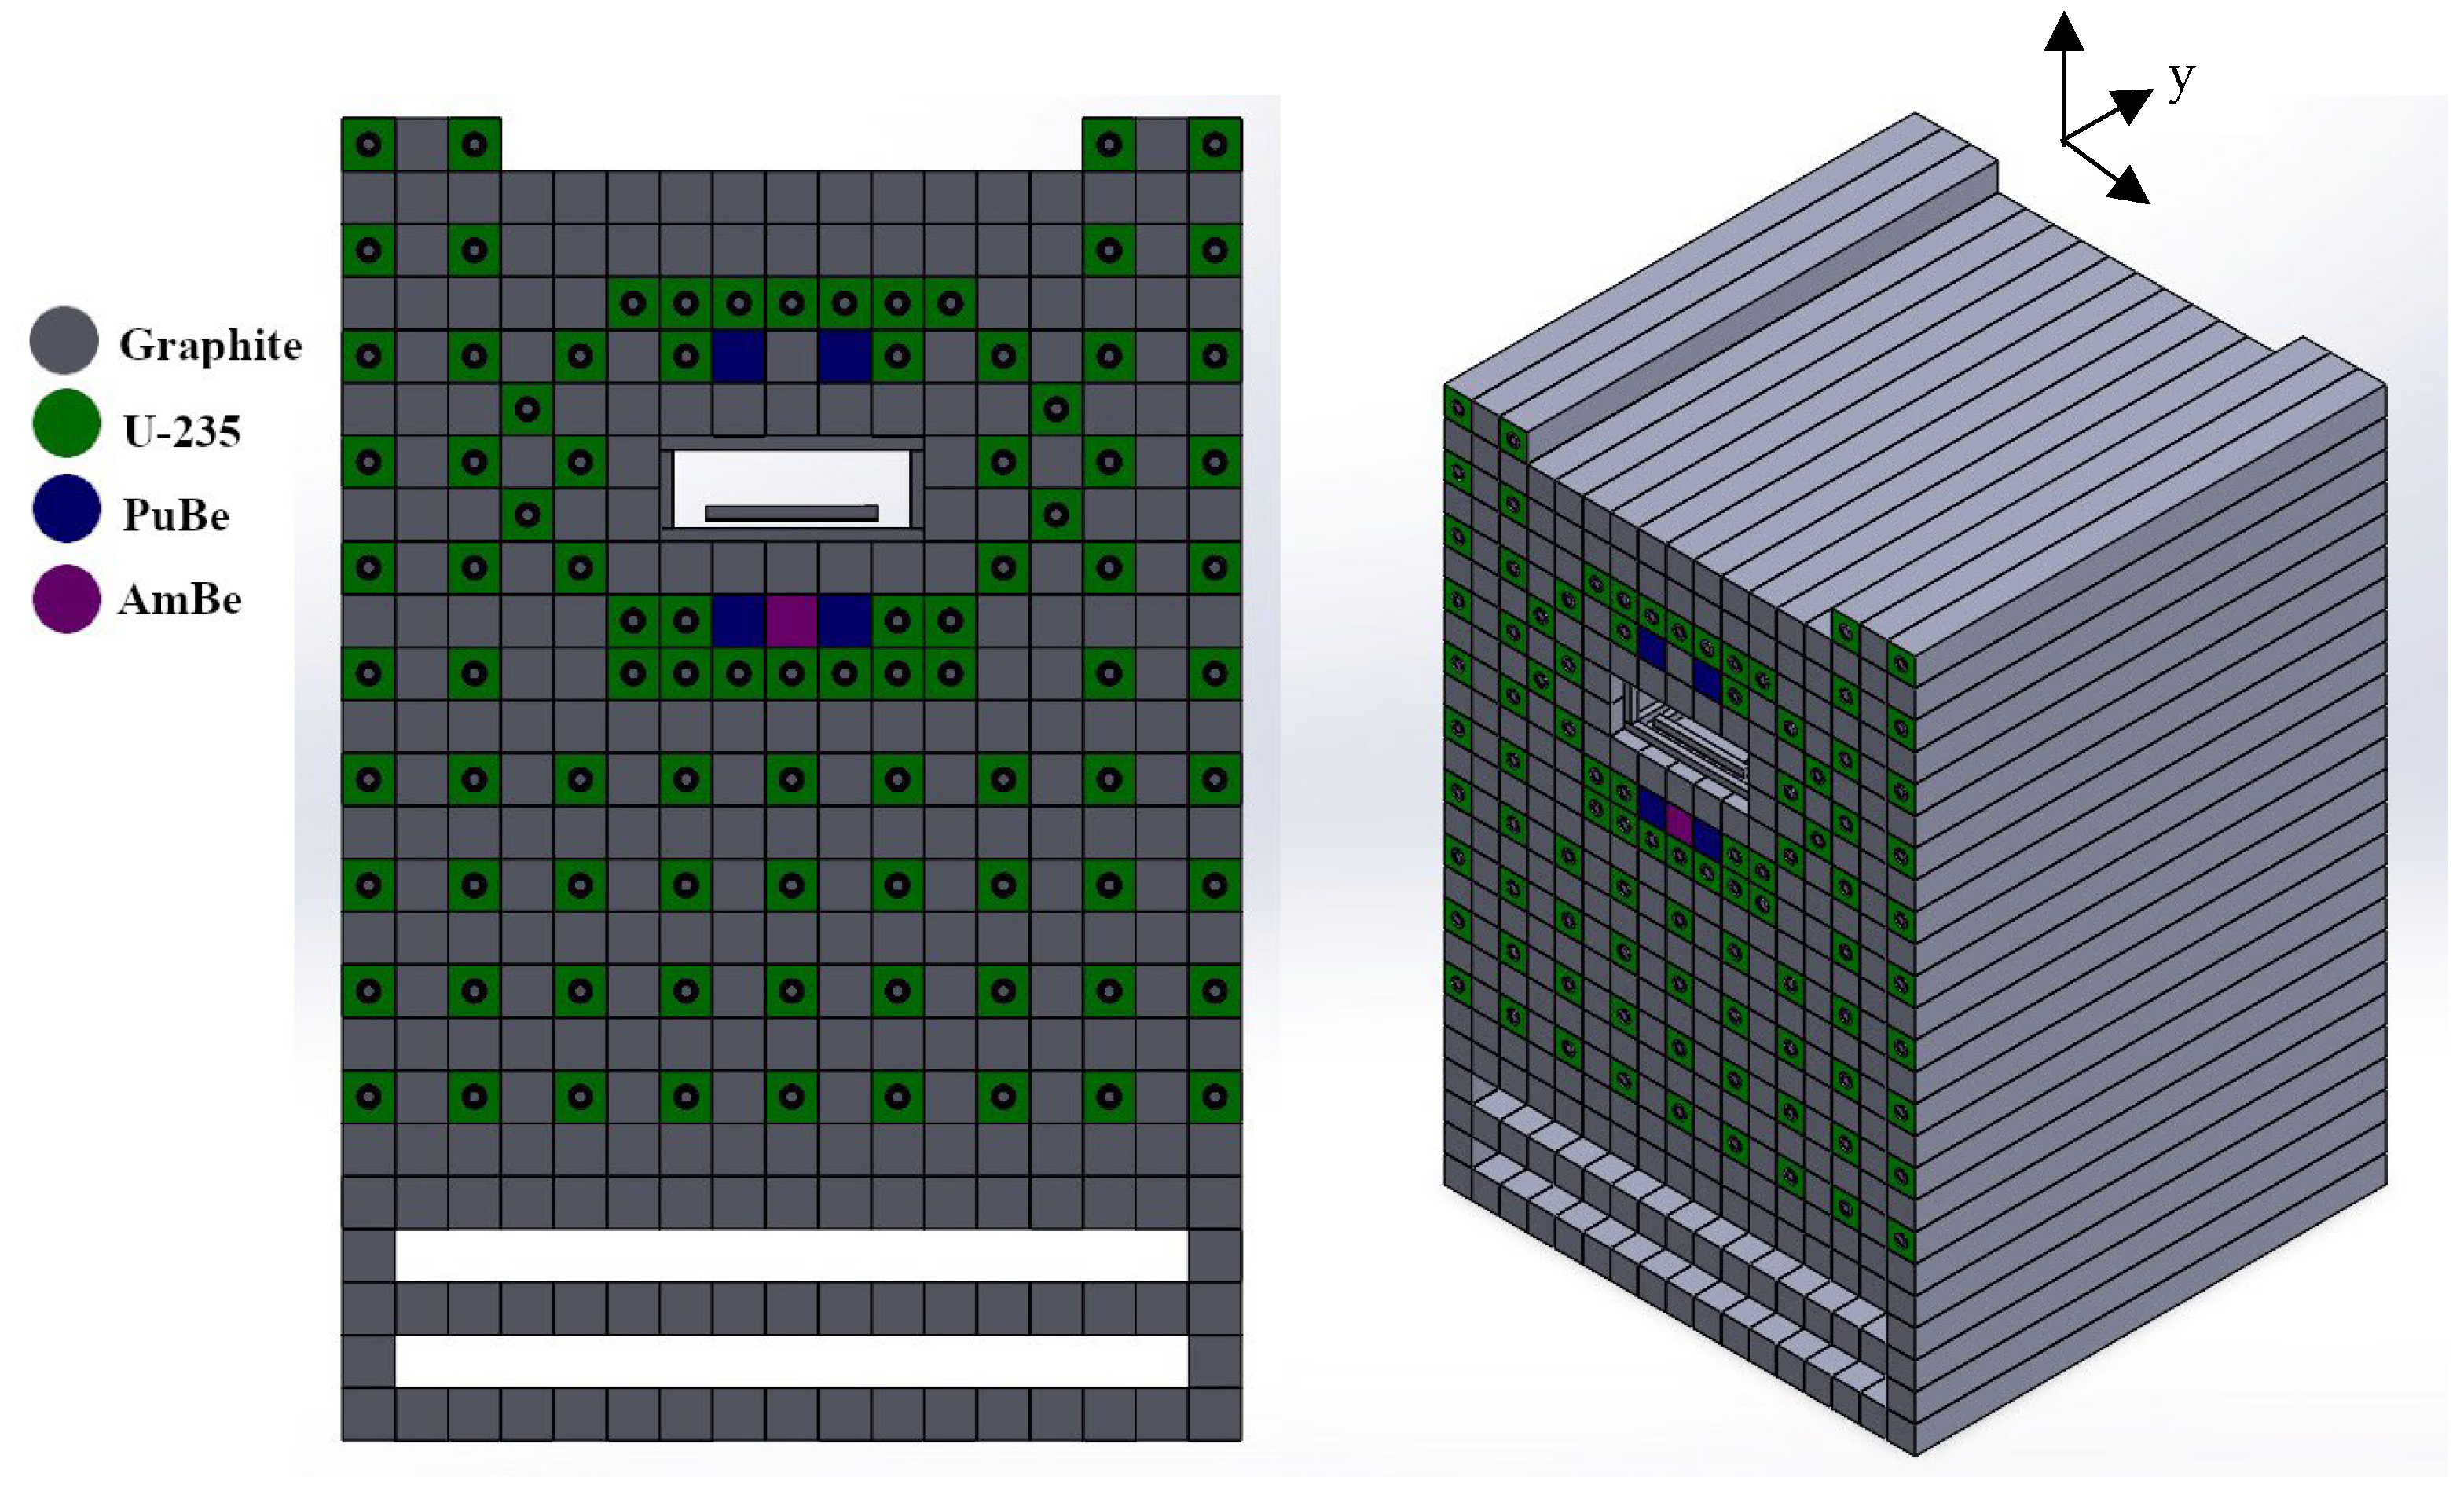
Figure 2.
3D SolidWorks rendering of the electronics testbed drawer placed within the Purdue sub-critical drawer [10].
Figure 2.
3D SolidWorks rendering of the electronics testbed drawer placed within the Purdue sub-critical drawer [10].
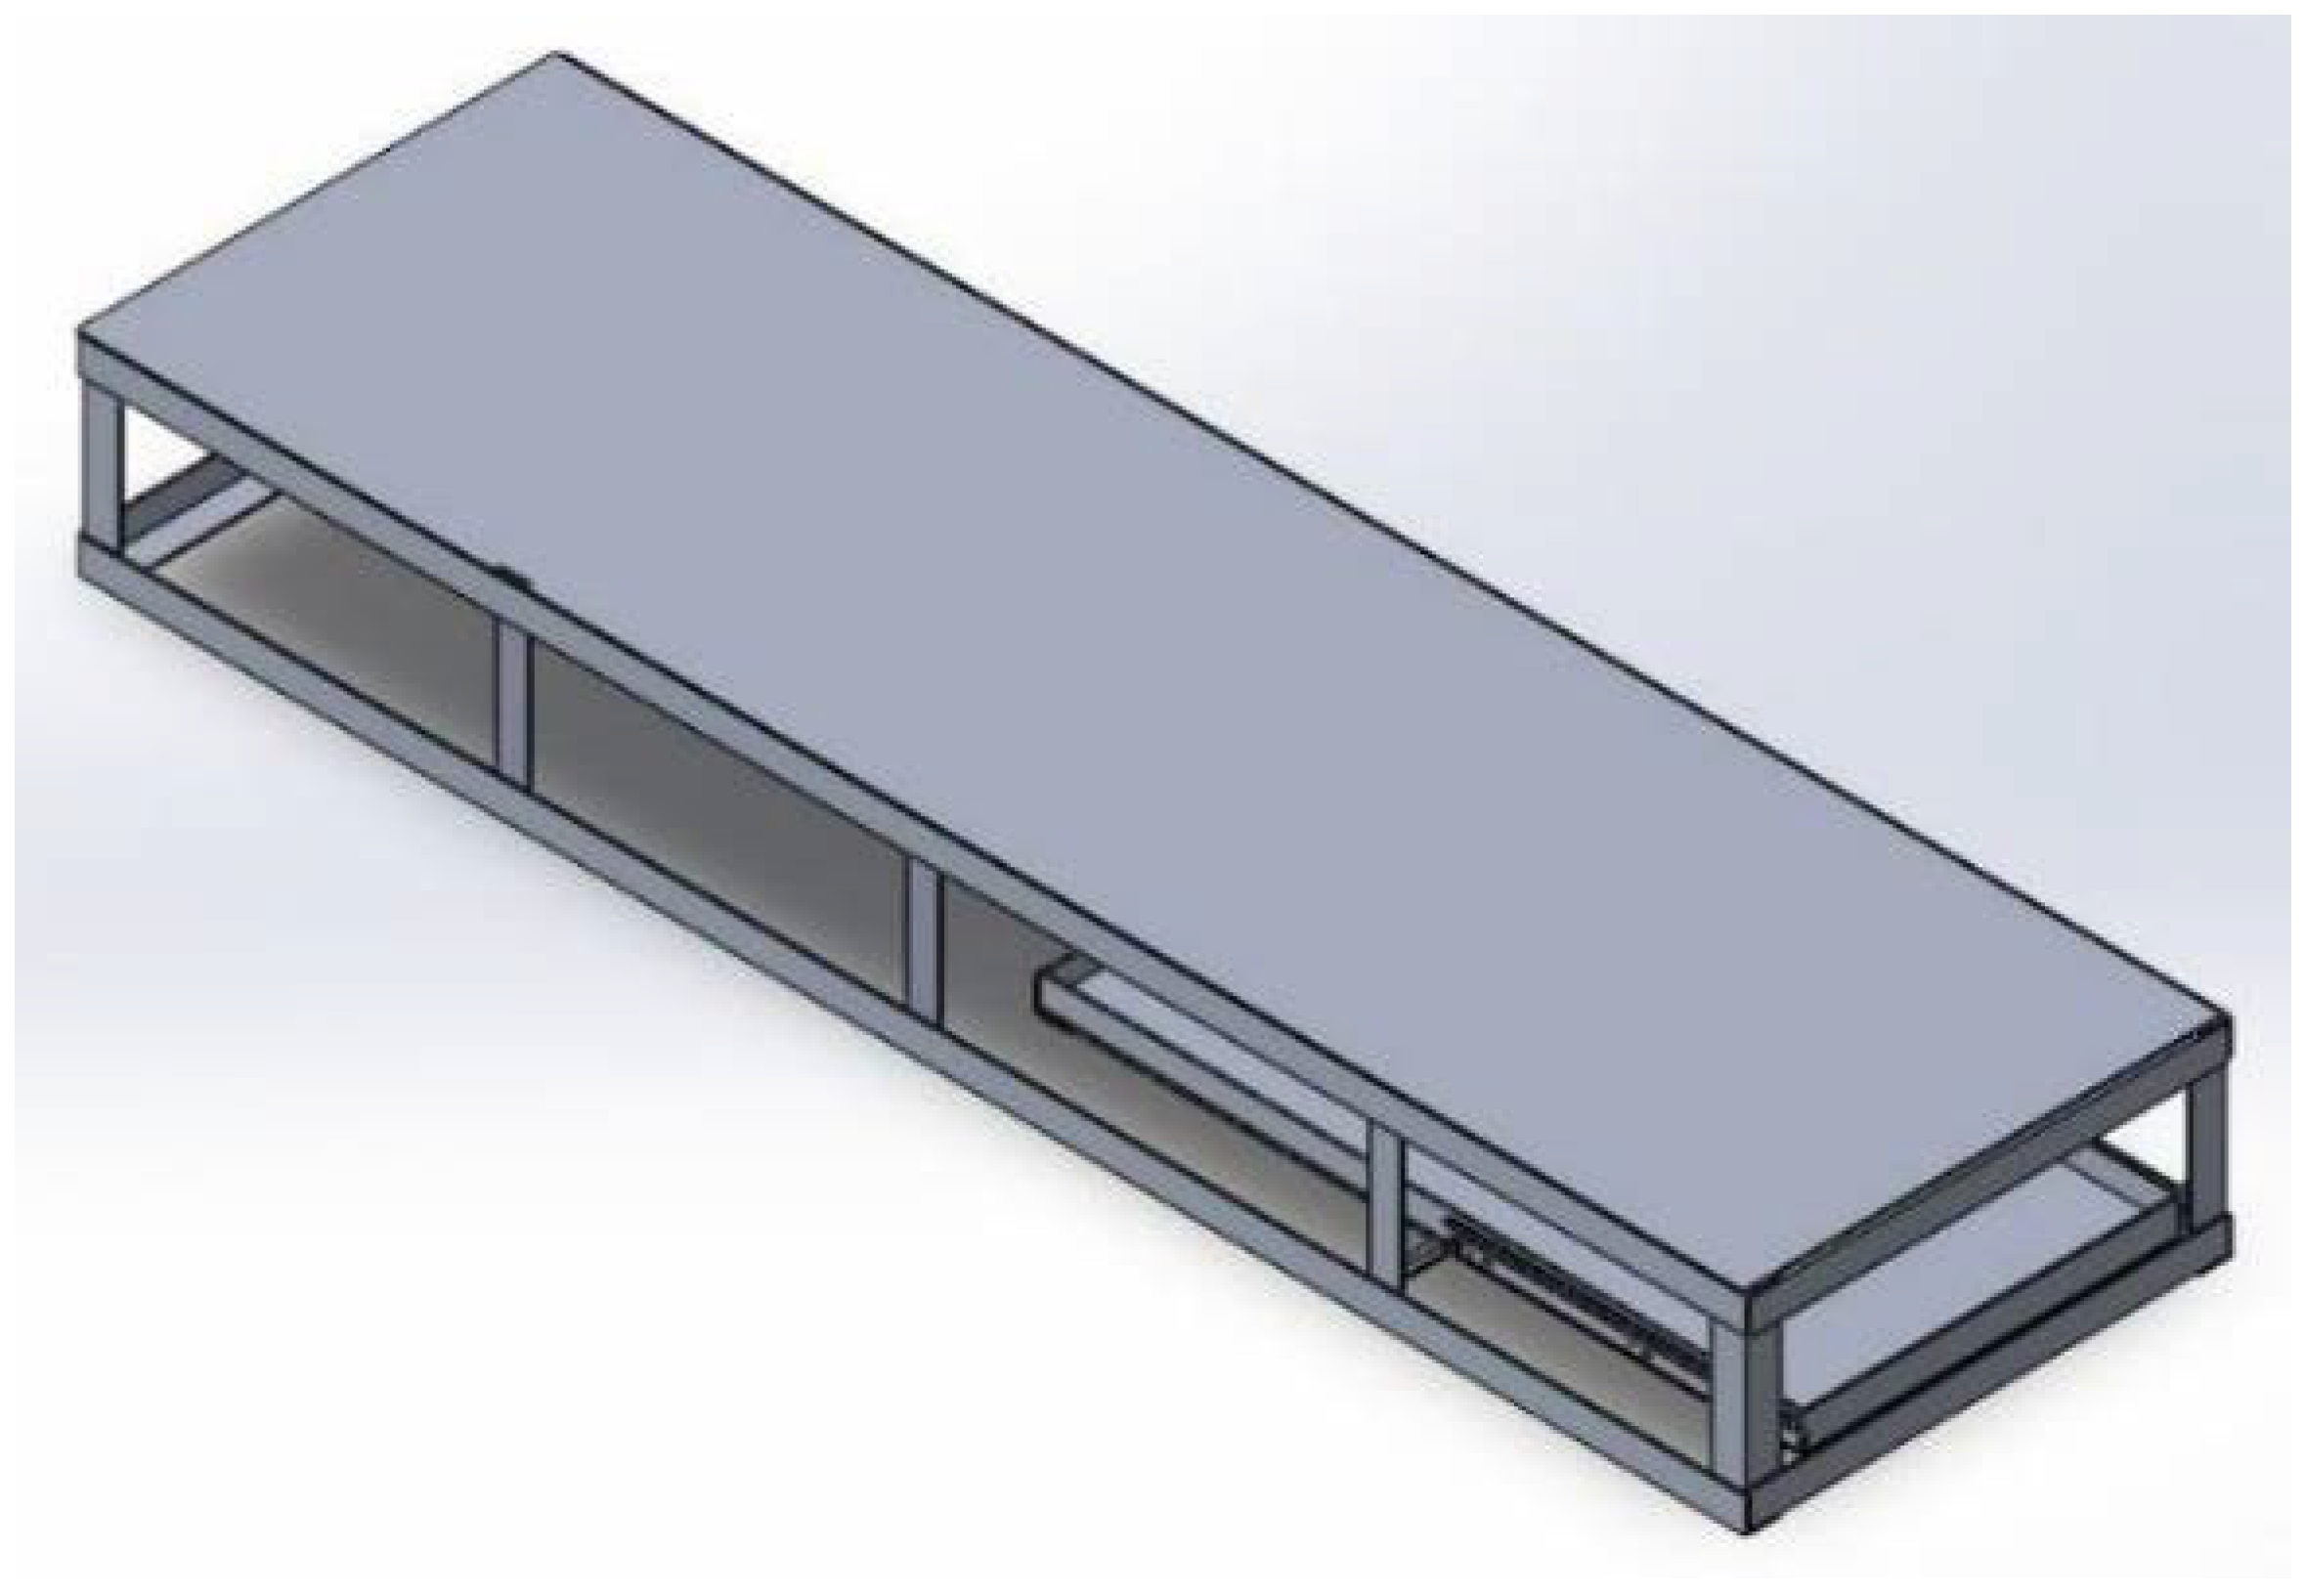
Figure 3.
(a) Modified Purdue subcritical pile. (b) In testing configuration with testbed drawer from the working face of the pile. Testbed dimensions are 45 cm x 20 cm x 162 cm for a total test volume of approximately 1.5E5 cm^3.
Figure 3.
(a) Modified Purdue subcritical pile. (b) In testing configuration with testbed drawer from the working face of the pile. Testbed dimensions are 45 cm x 20 cm x 162 cm for a total test volume of approximately 1.5E5 cm^3.
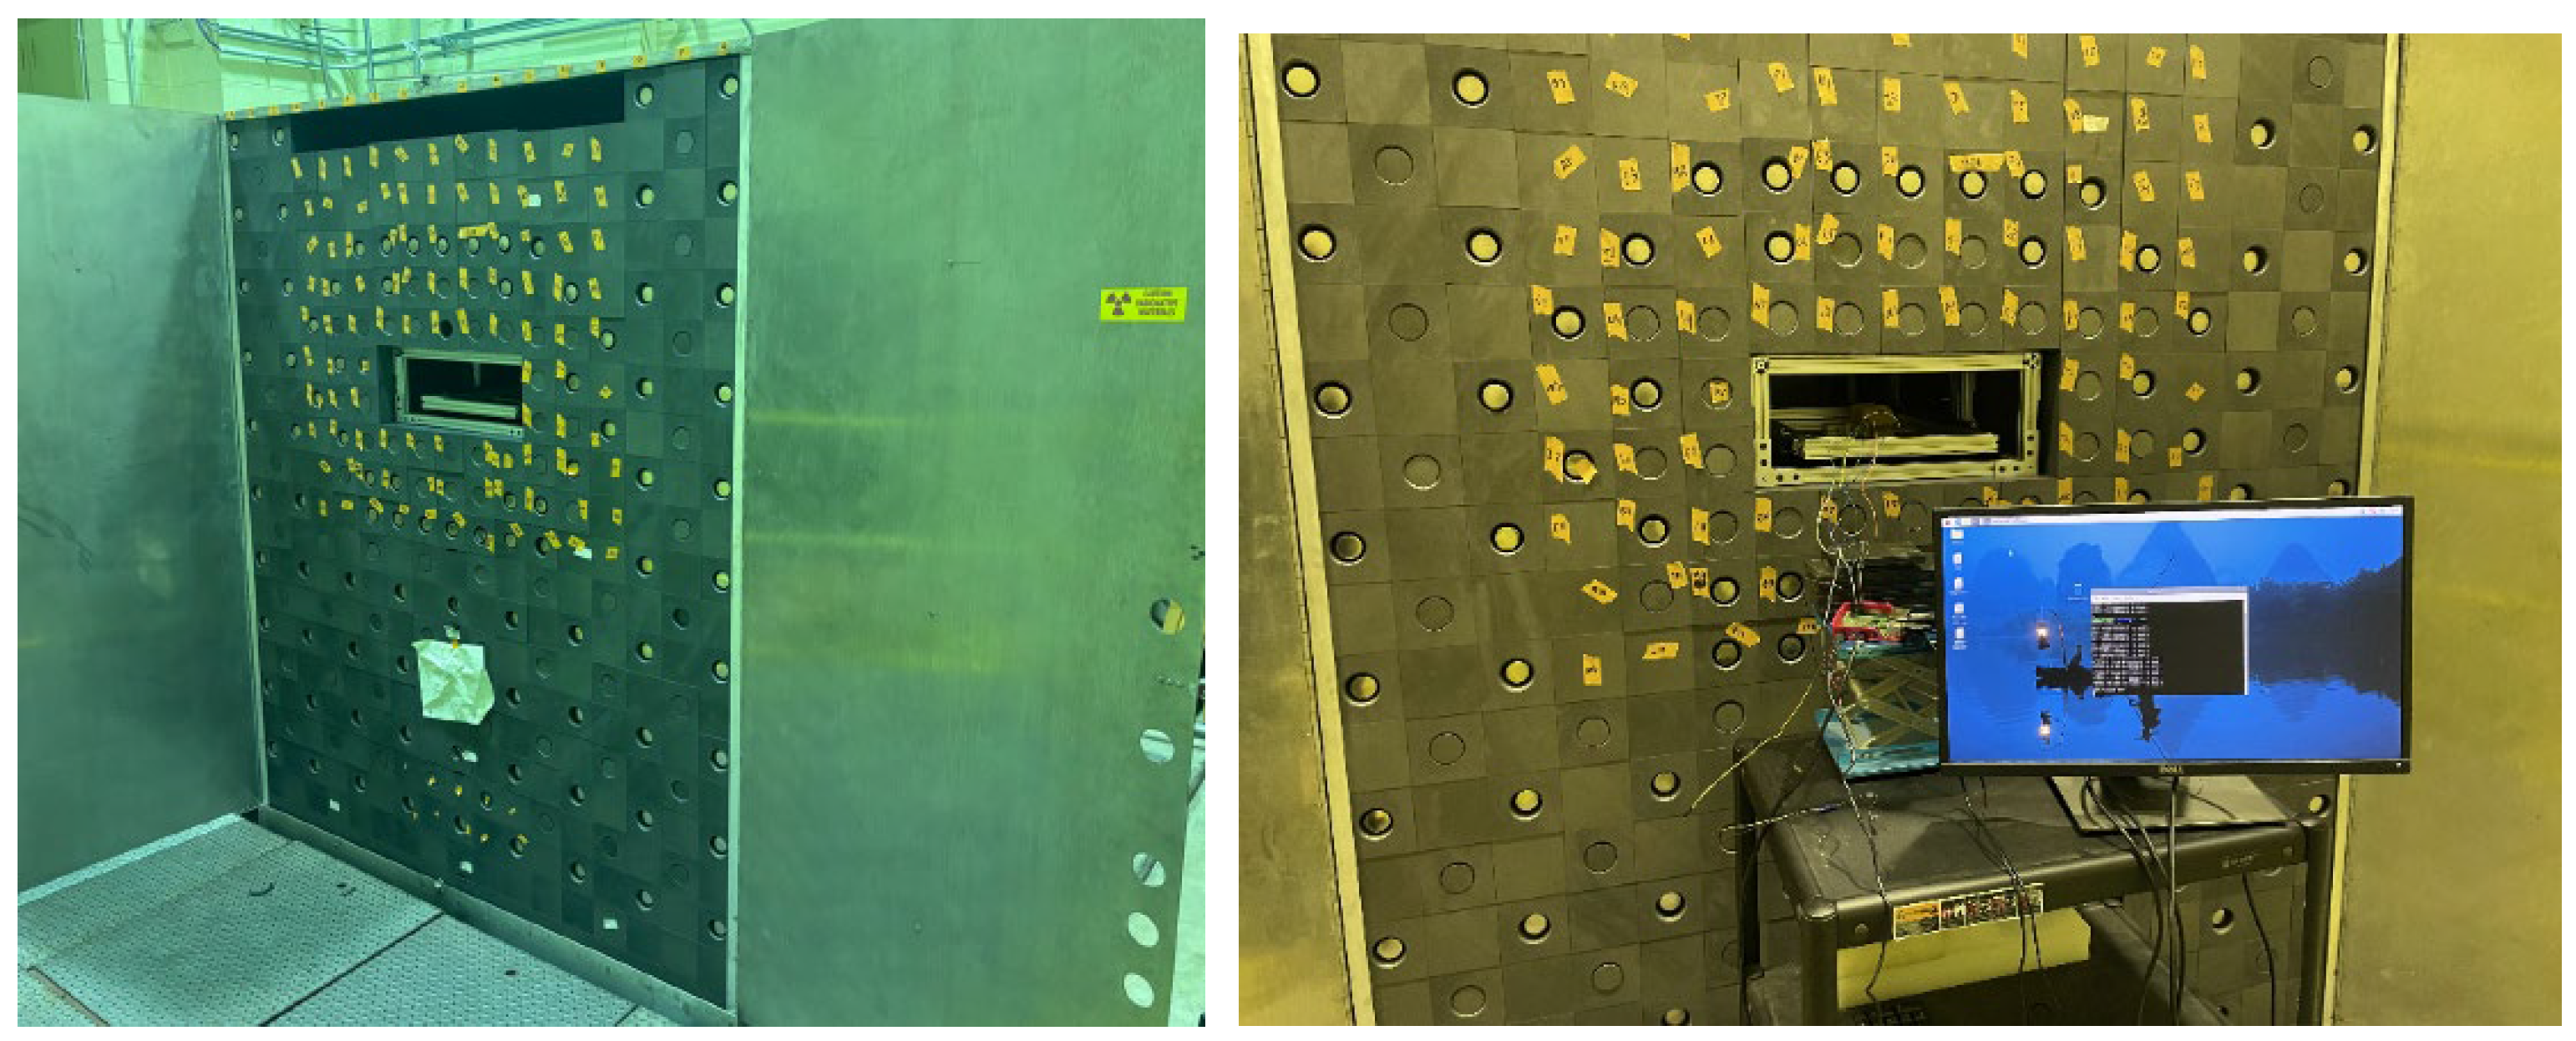
Figure 4.
Example testbed foil placement for a 3x4 configuration.
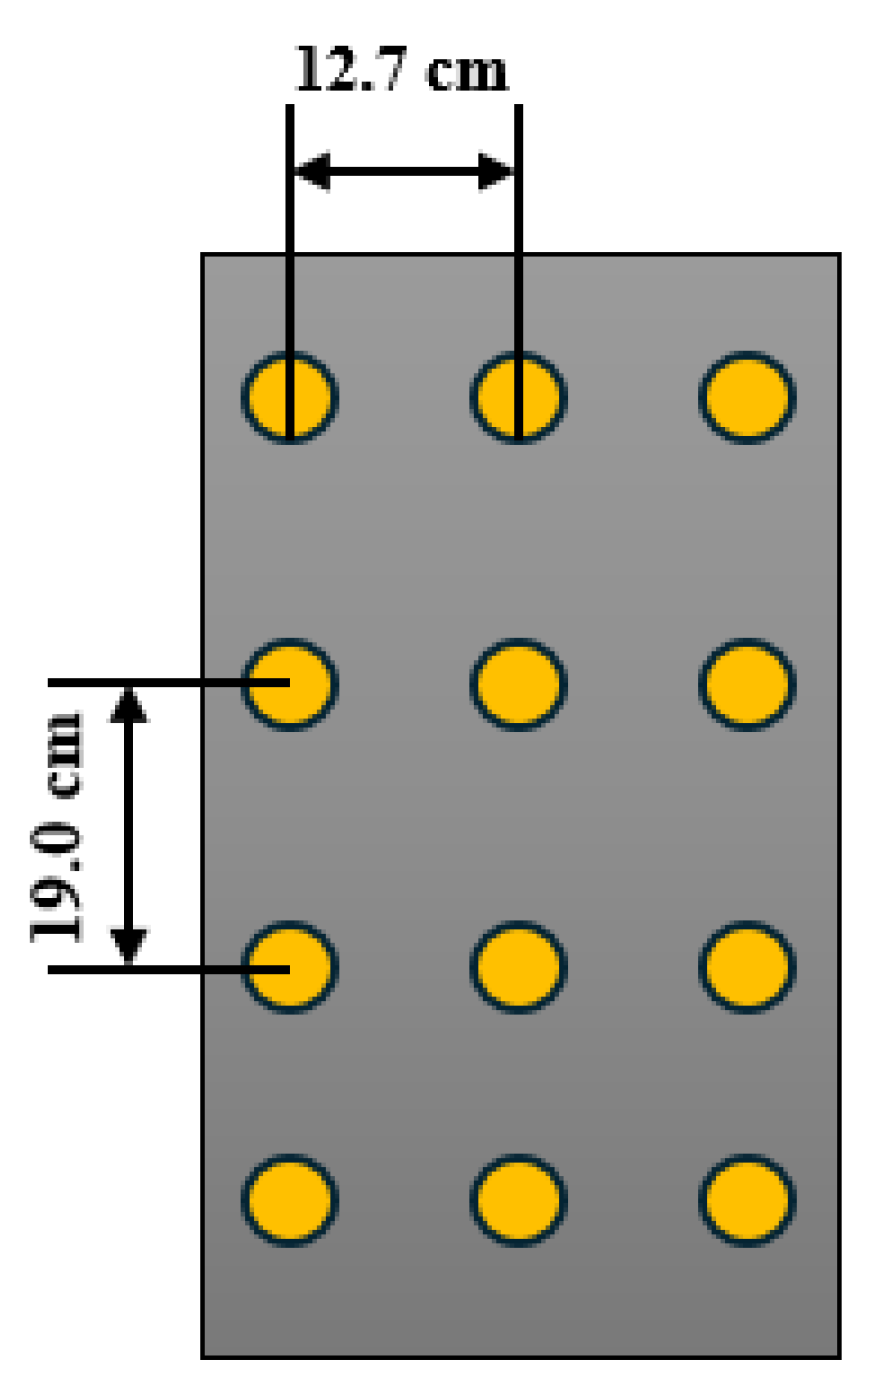
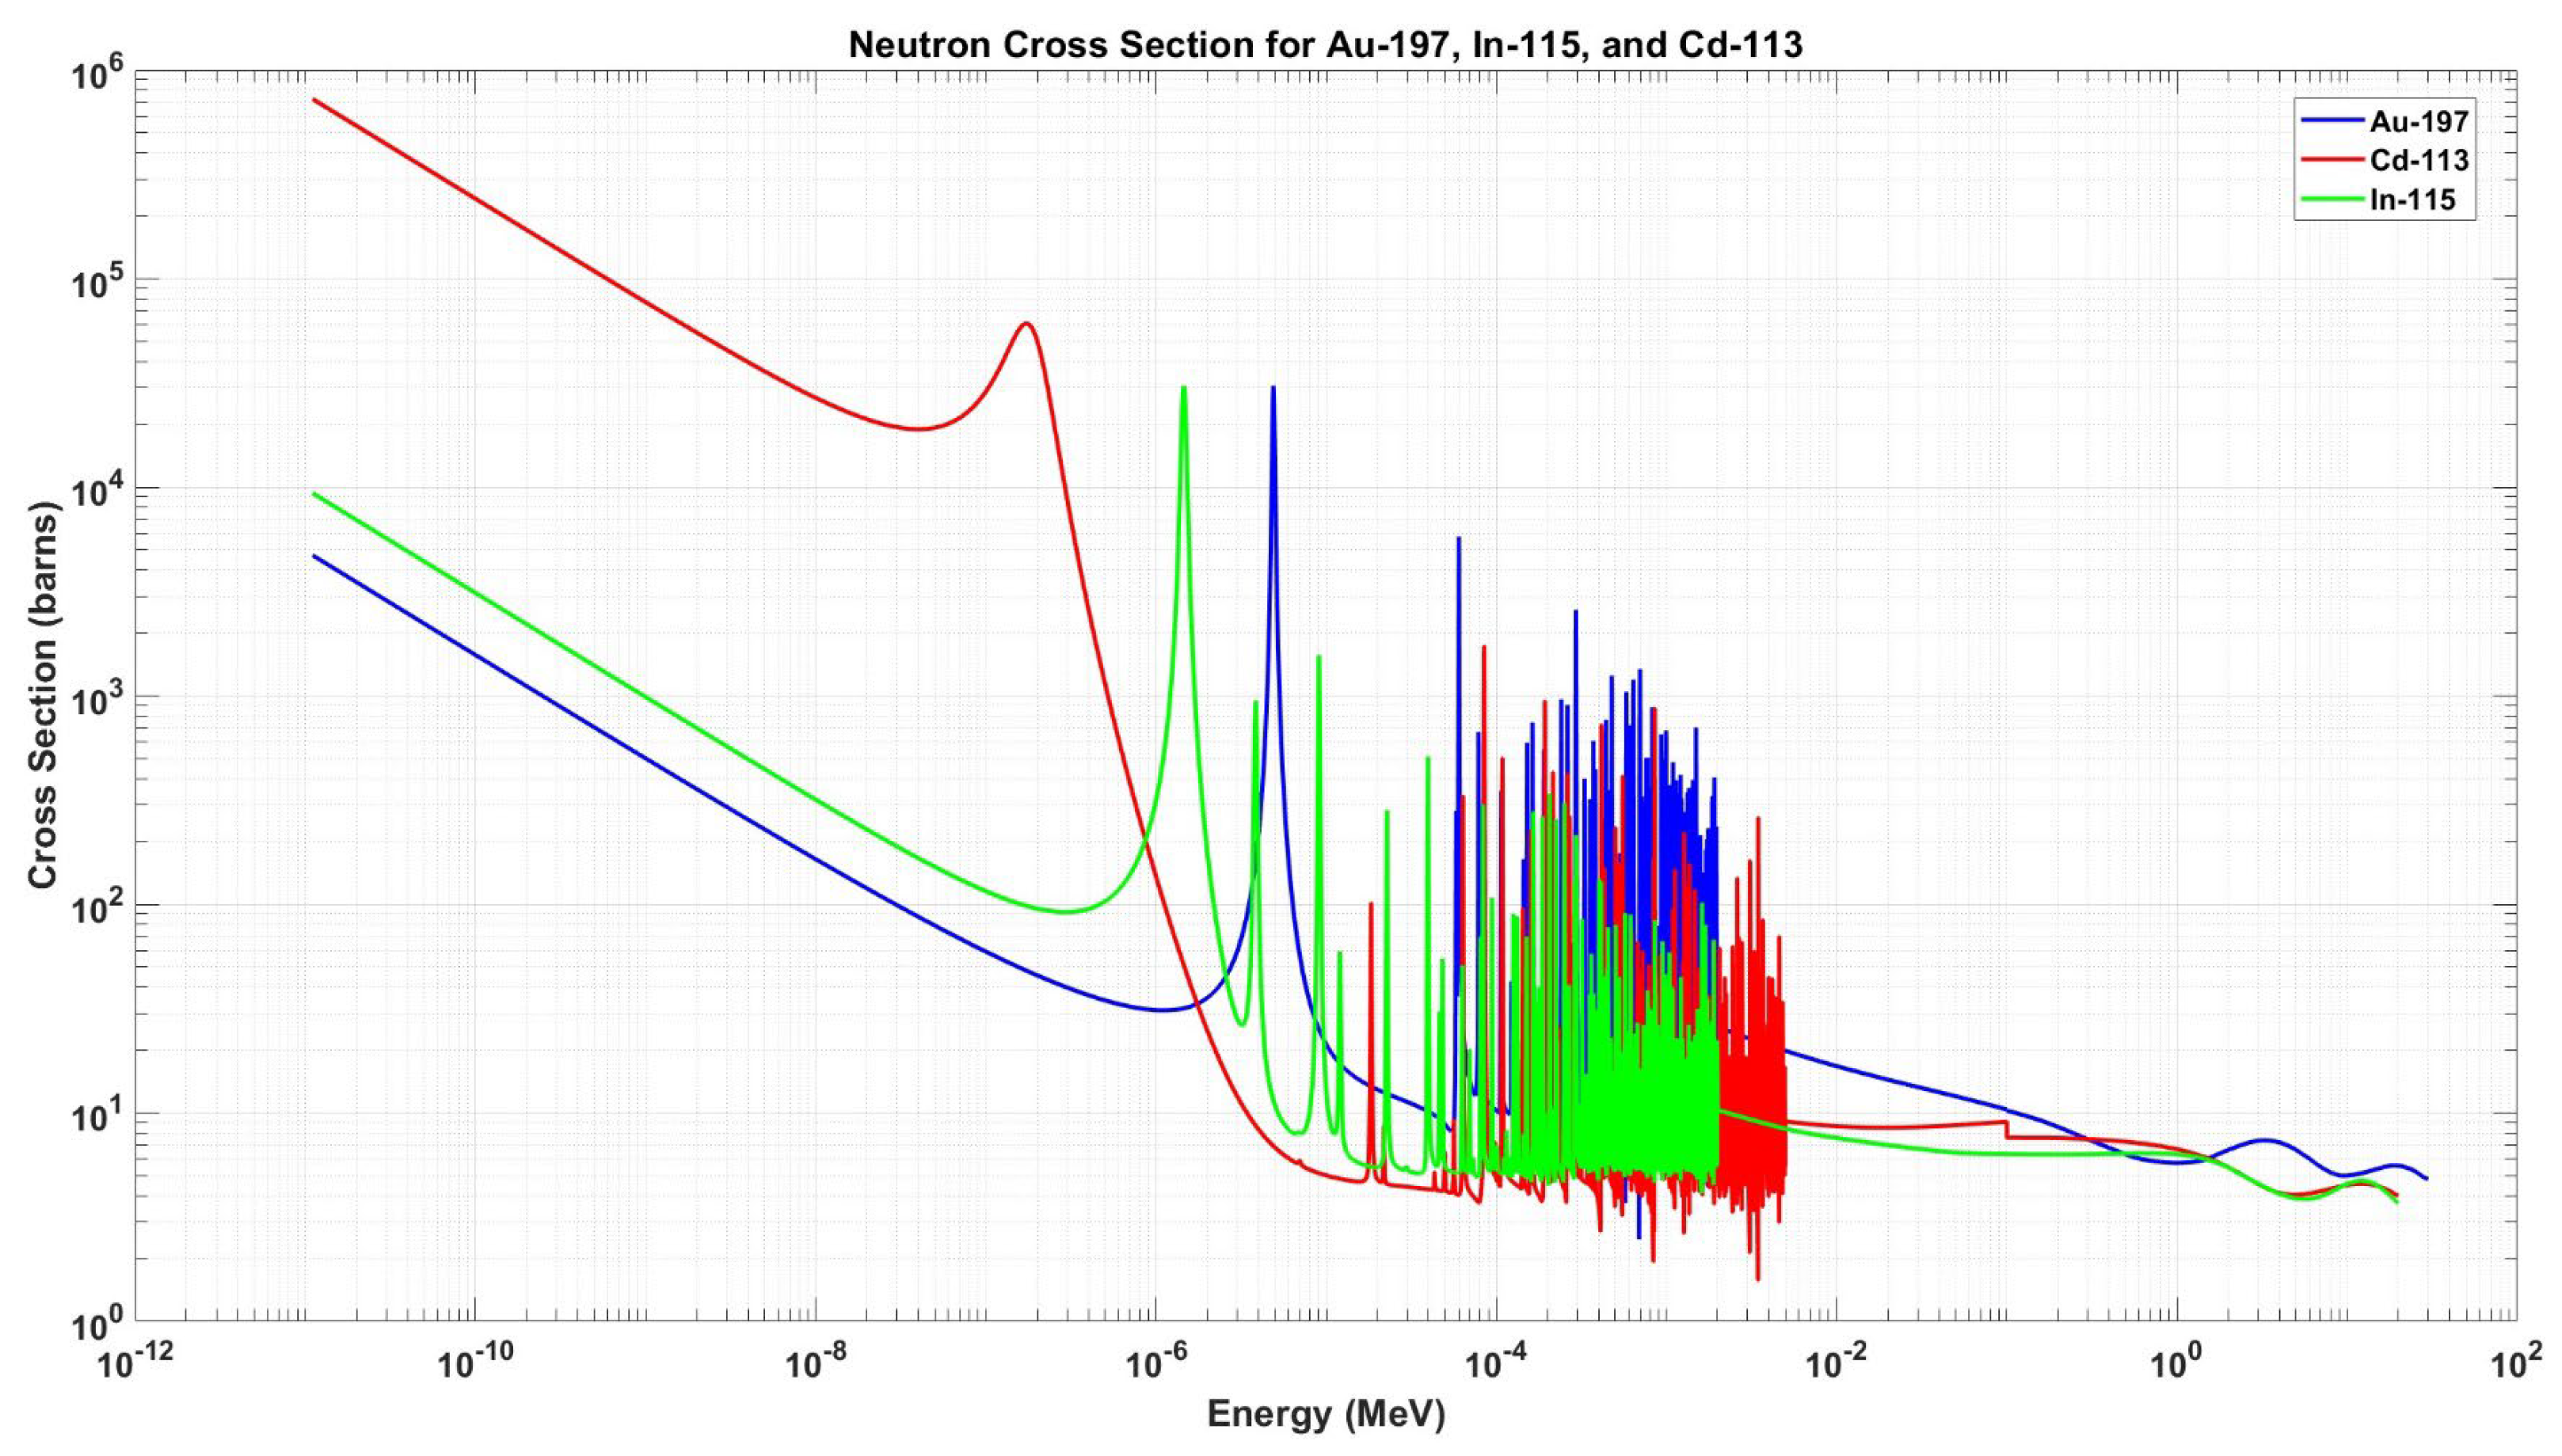
Figure 6.
(a) Normalized neutron flux for OpenMC model. (b) Nomalized neutron flux for MCNP model.
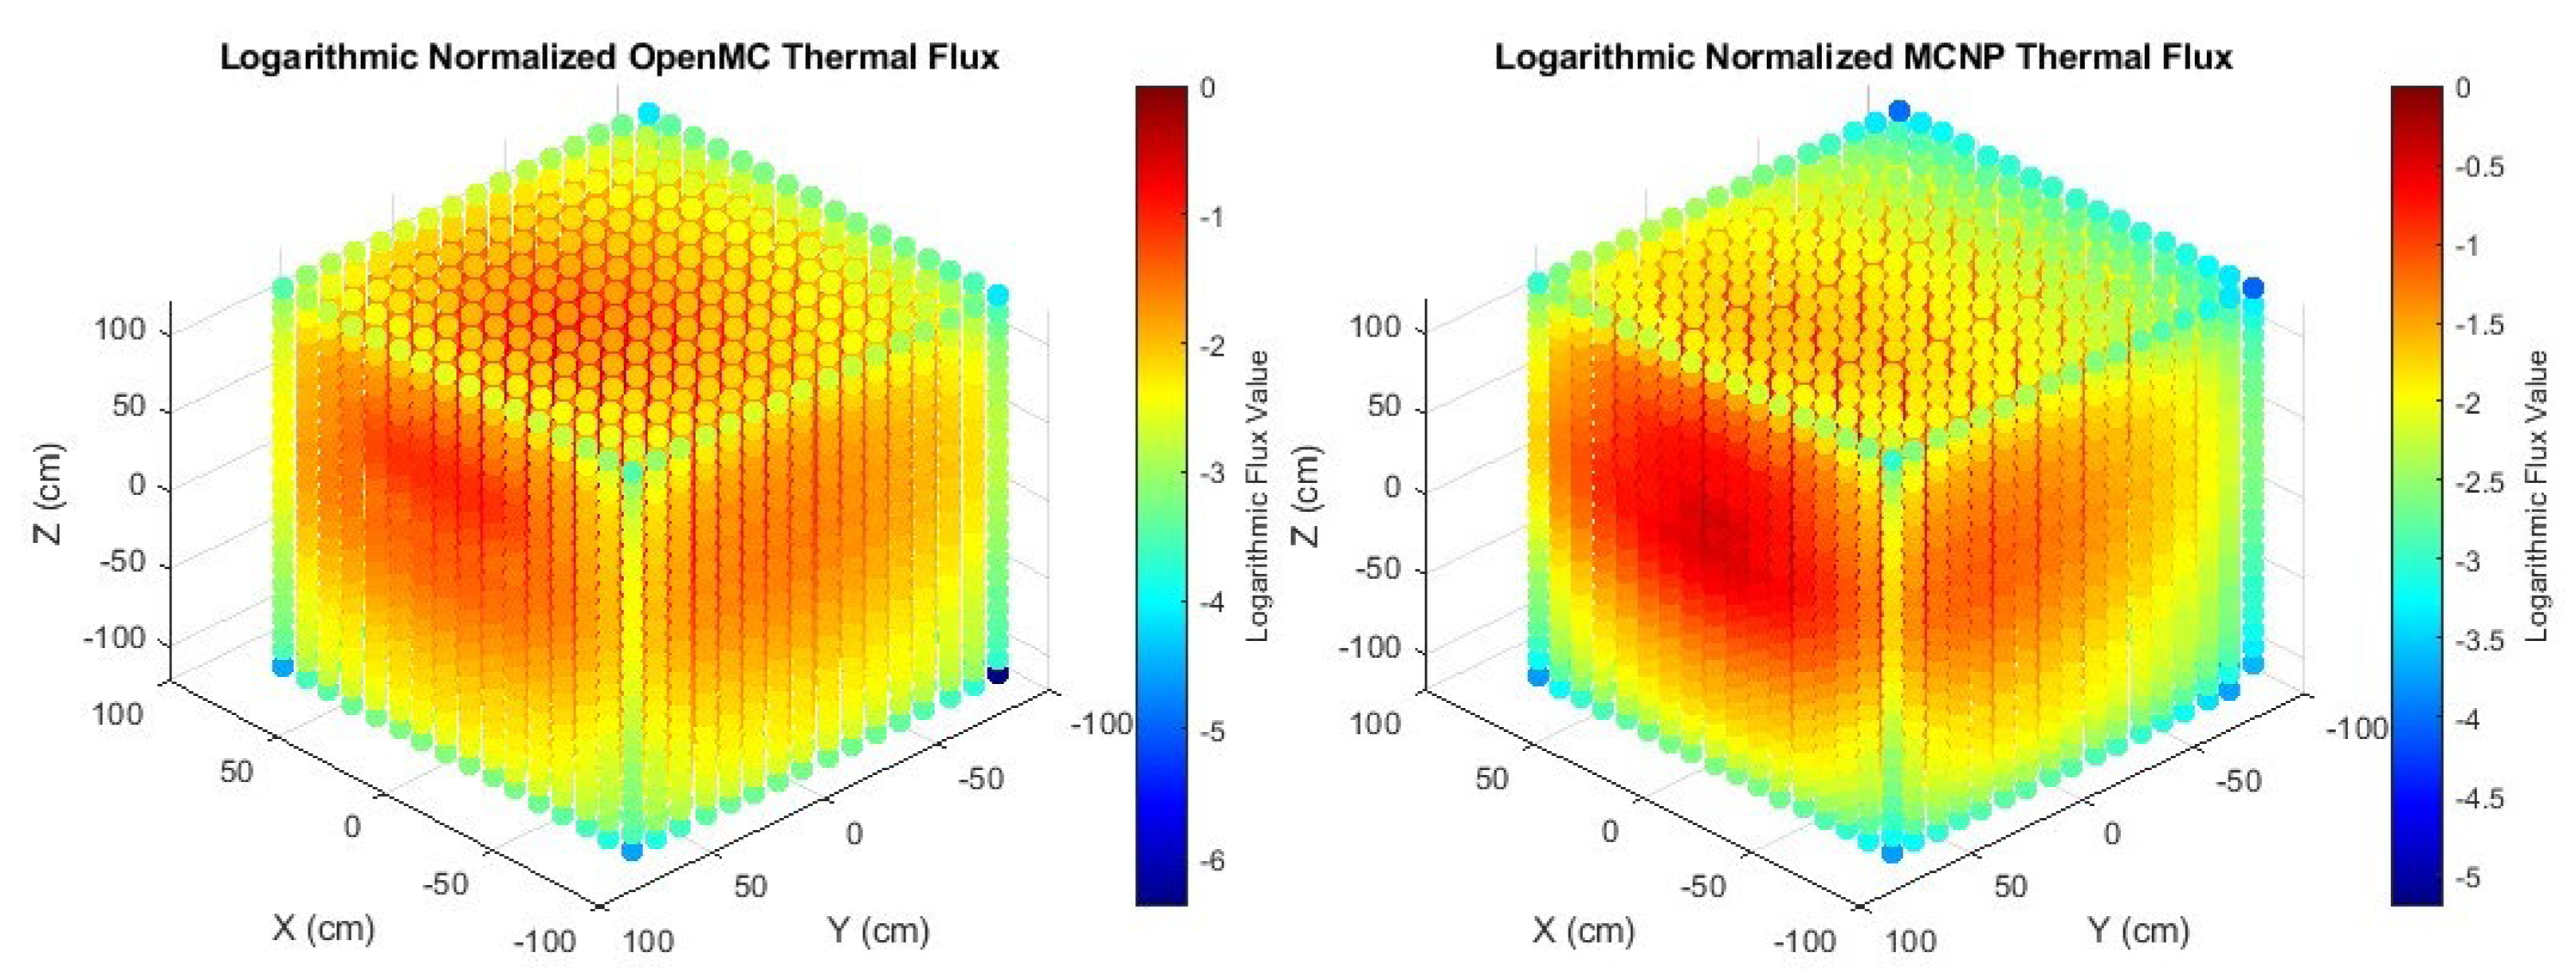
Figure 7.
(a) X-Y planar view of OpenMC defined sources. (b) X-Y planar view of MCNP defined sources.
Figure 7.
(a) X-Y planar view of OpenMC defined sources. (b) X-Y planar view of MCNP defined sources.
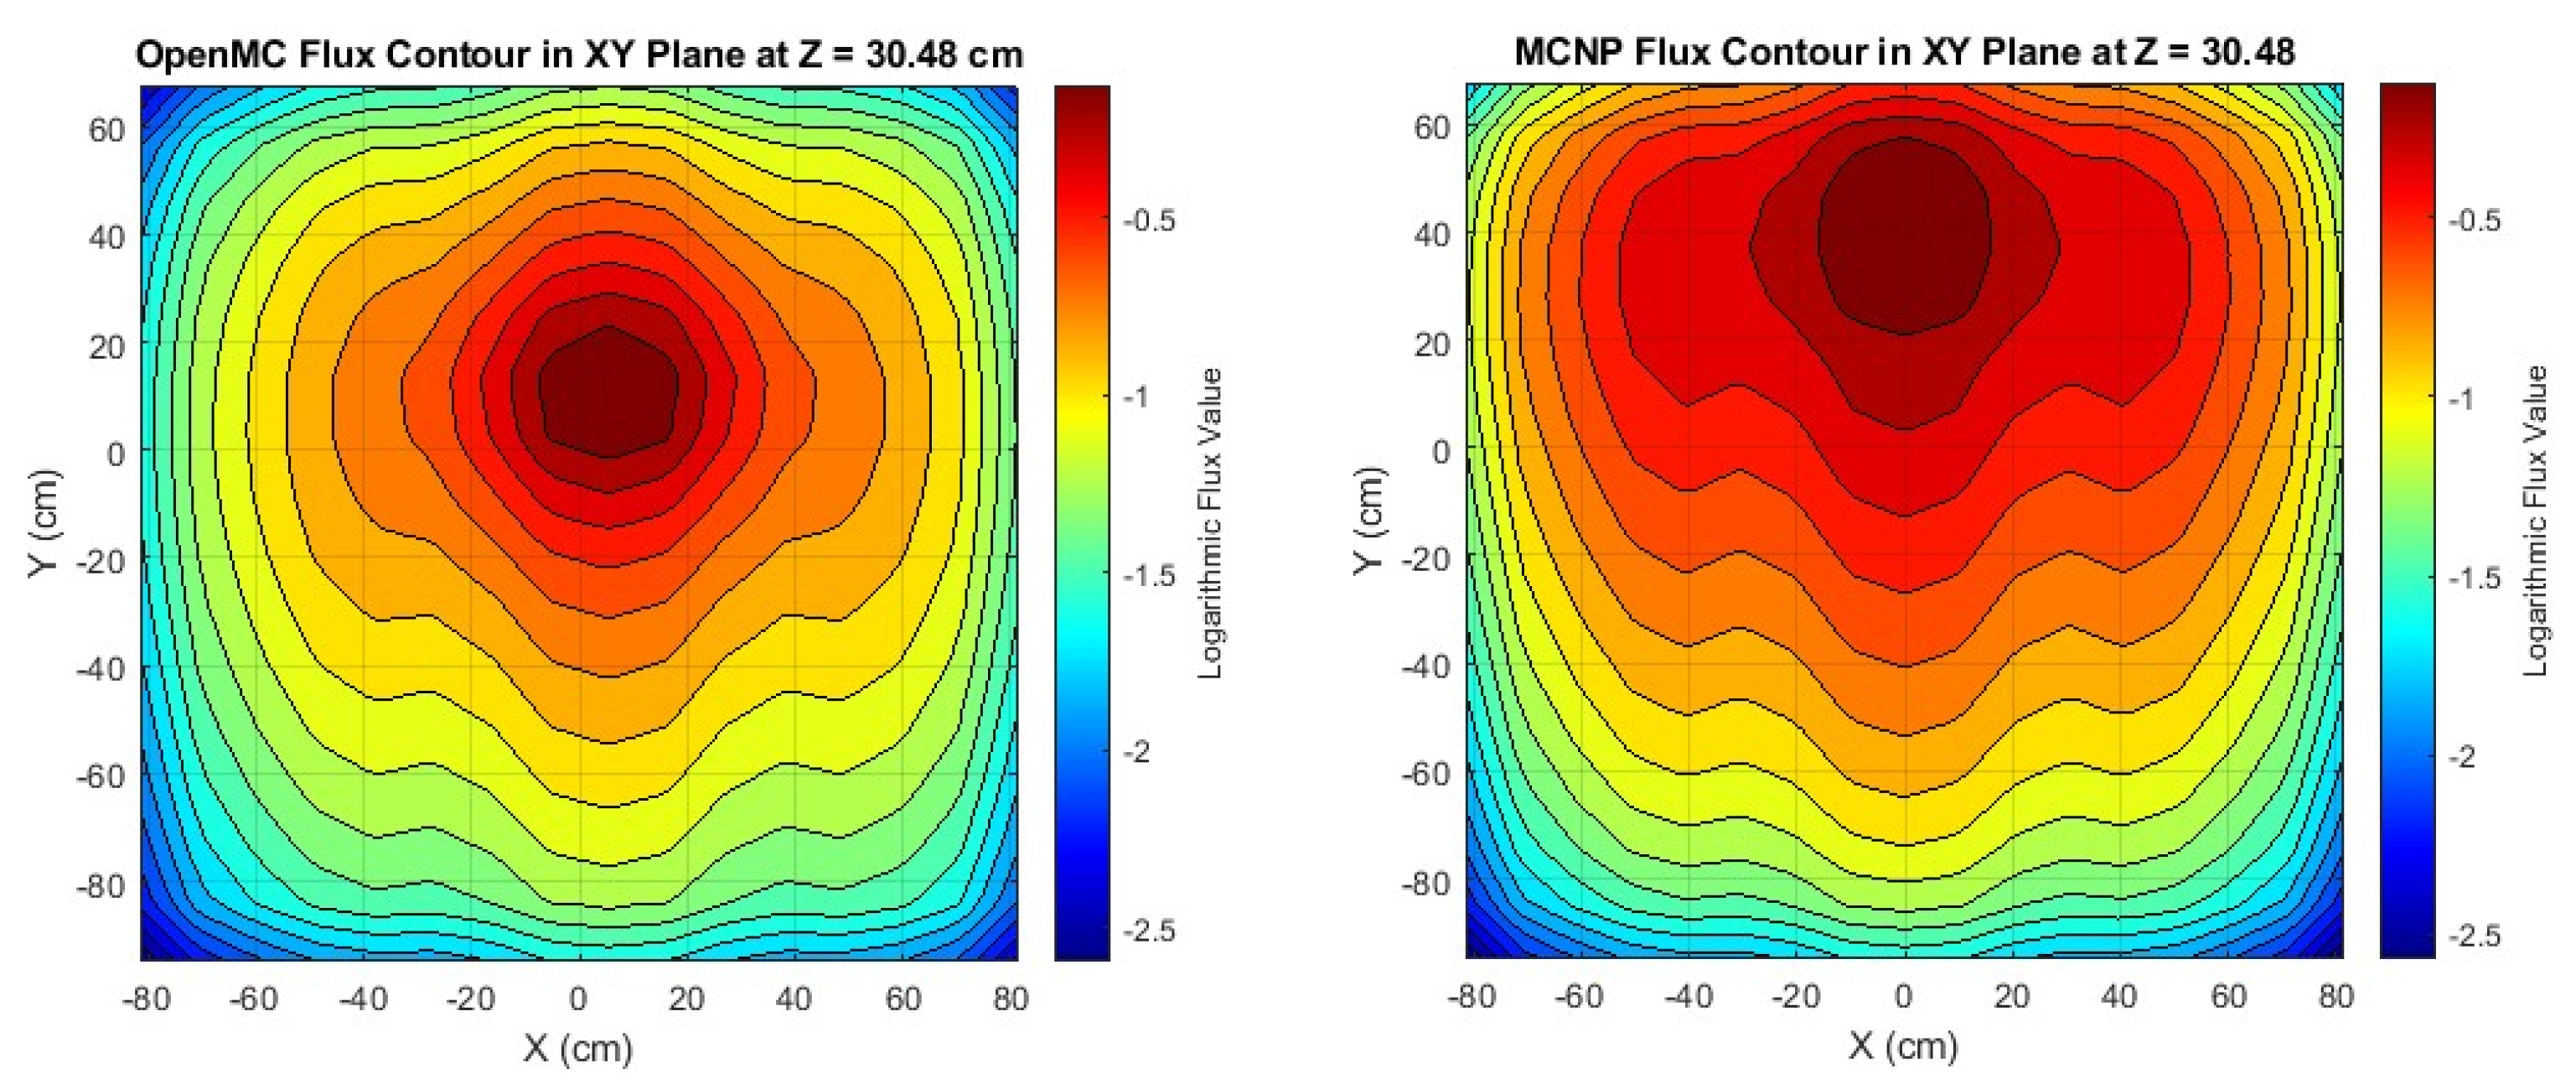
Figure 8.
(a) Y-Z planar view of OpenMC defined sources. (b) Y-Z planar view of MCNP defined sources.
Figure 8.
(a) Y-Z planar view of OpenMC defined sources. (b) Y-Z planar view of MCNP defined sources.
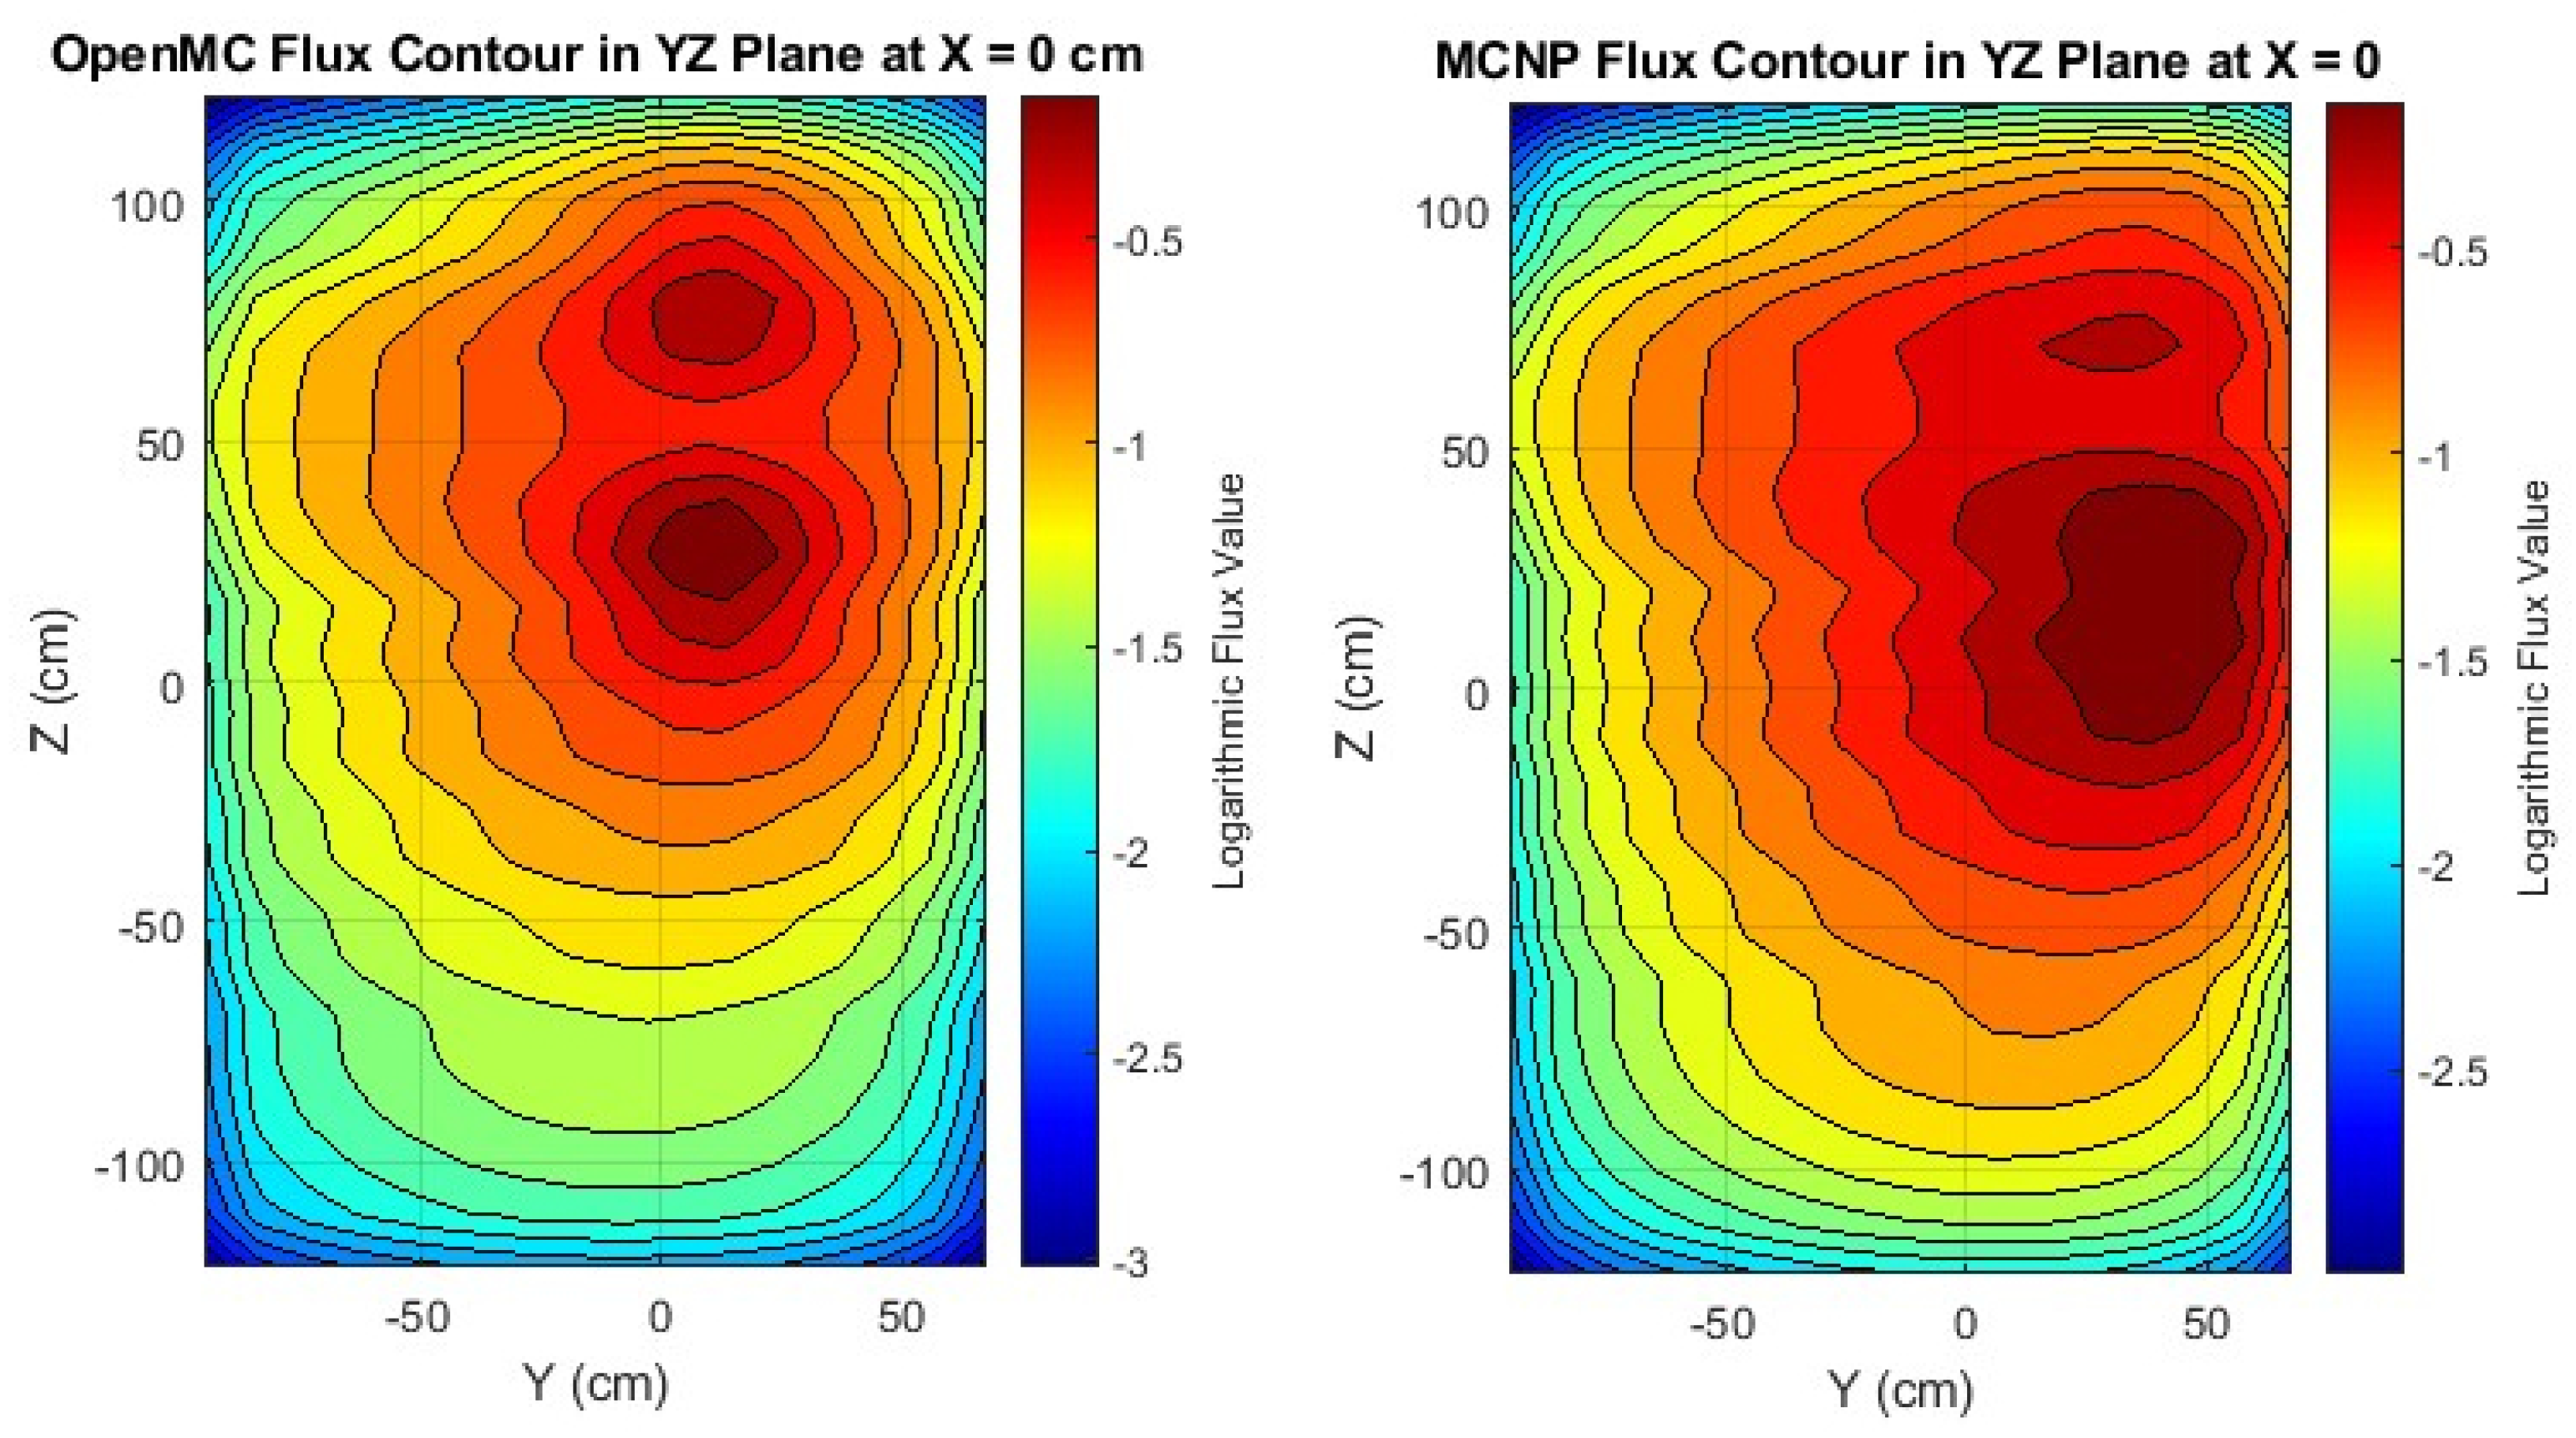
Figure 9.
Experimental setup of 3D printed stand over HPGe within a lead well to minimize contamination.
Figure 9.
Experimental setup of 3D printed stand over HPGe within a lead well to minimize contamination.
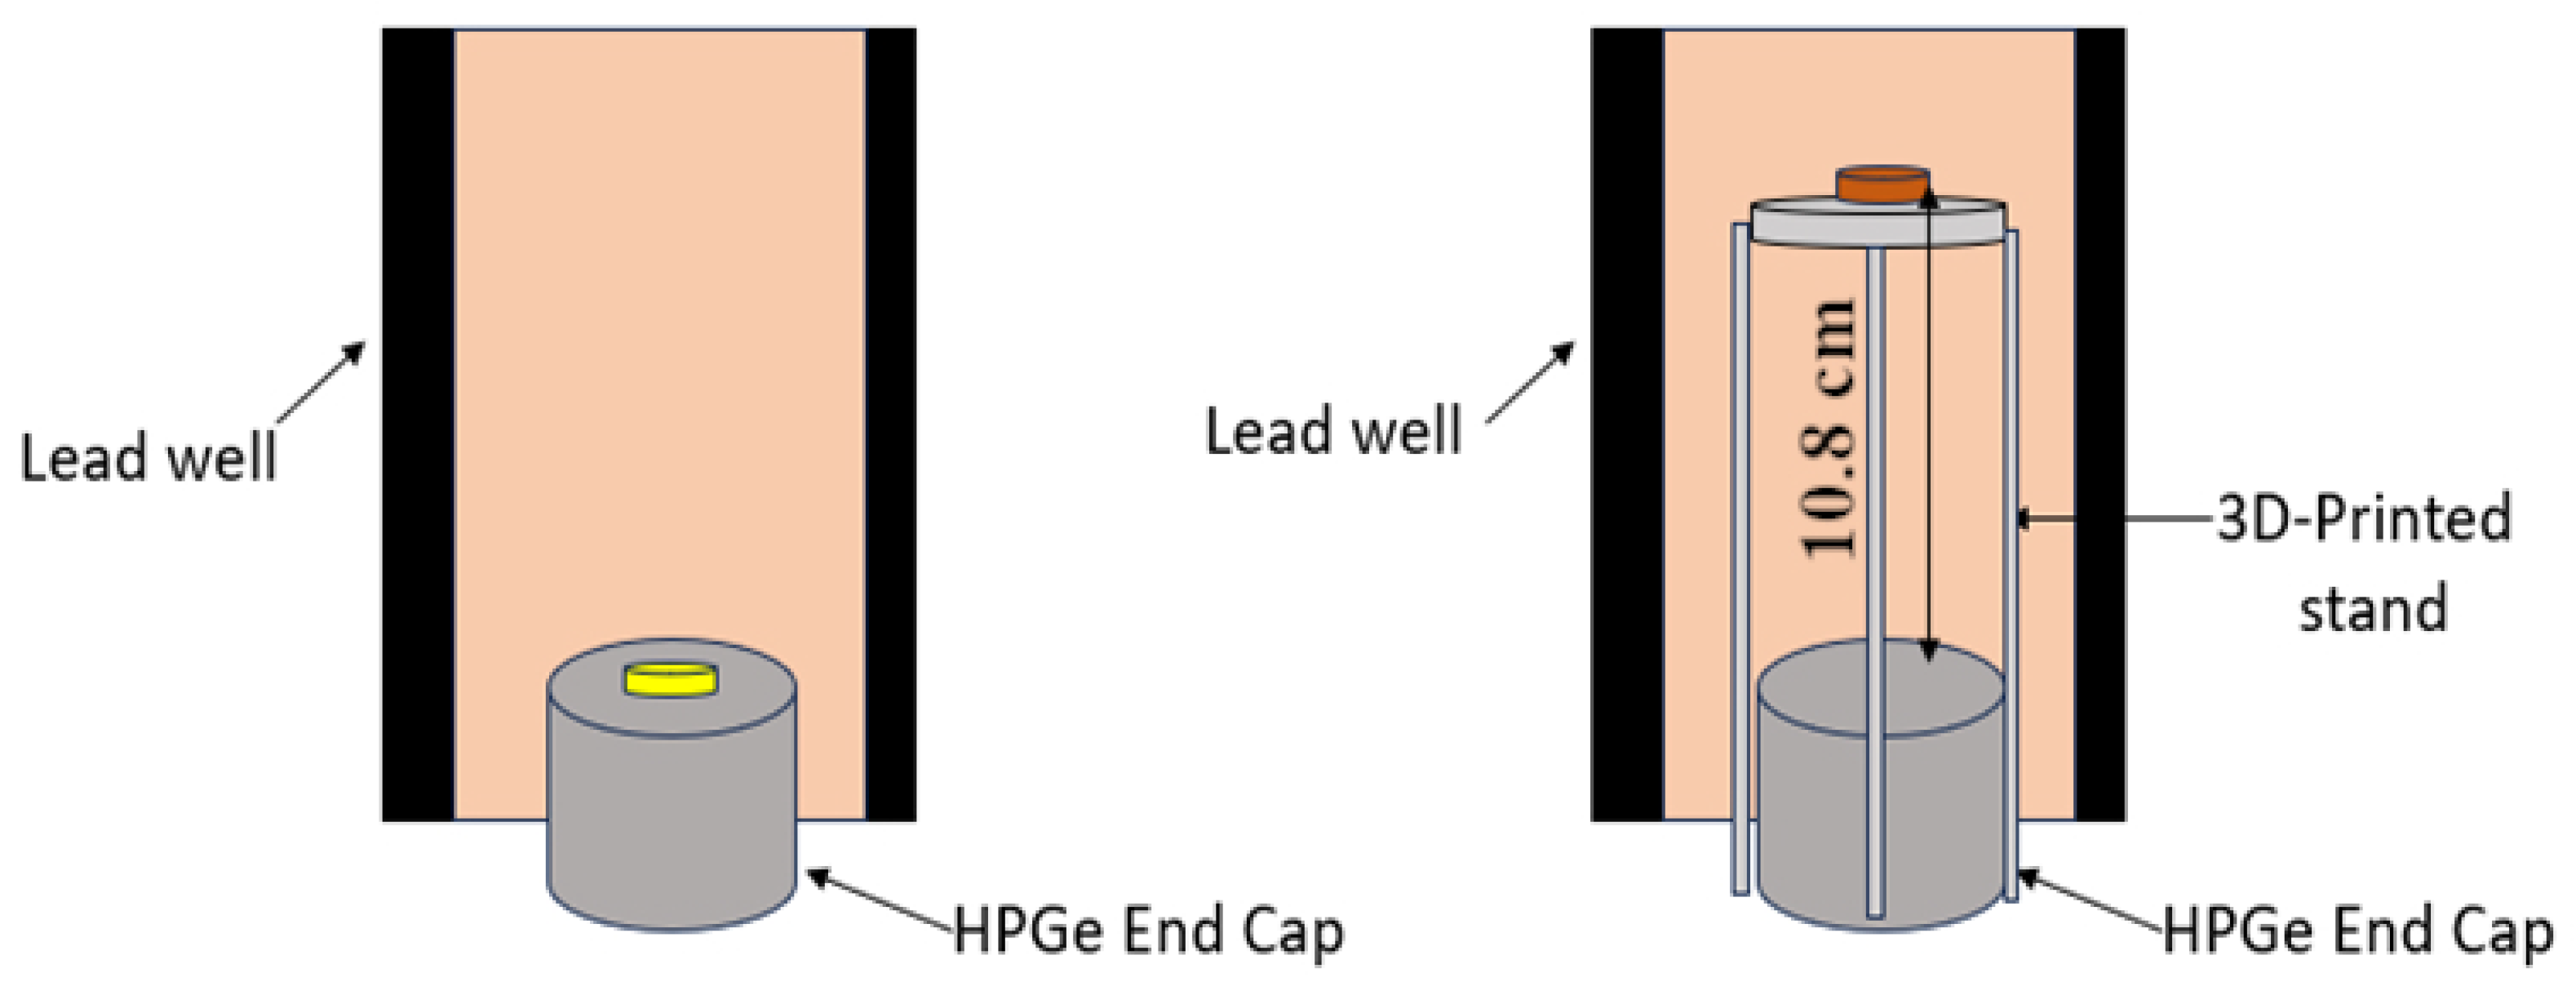
Figure 10.
Comparison of HPGe Energy resolution to ideal resolution.
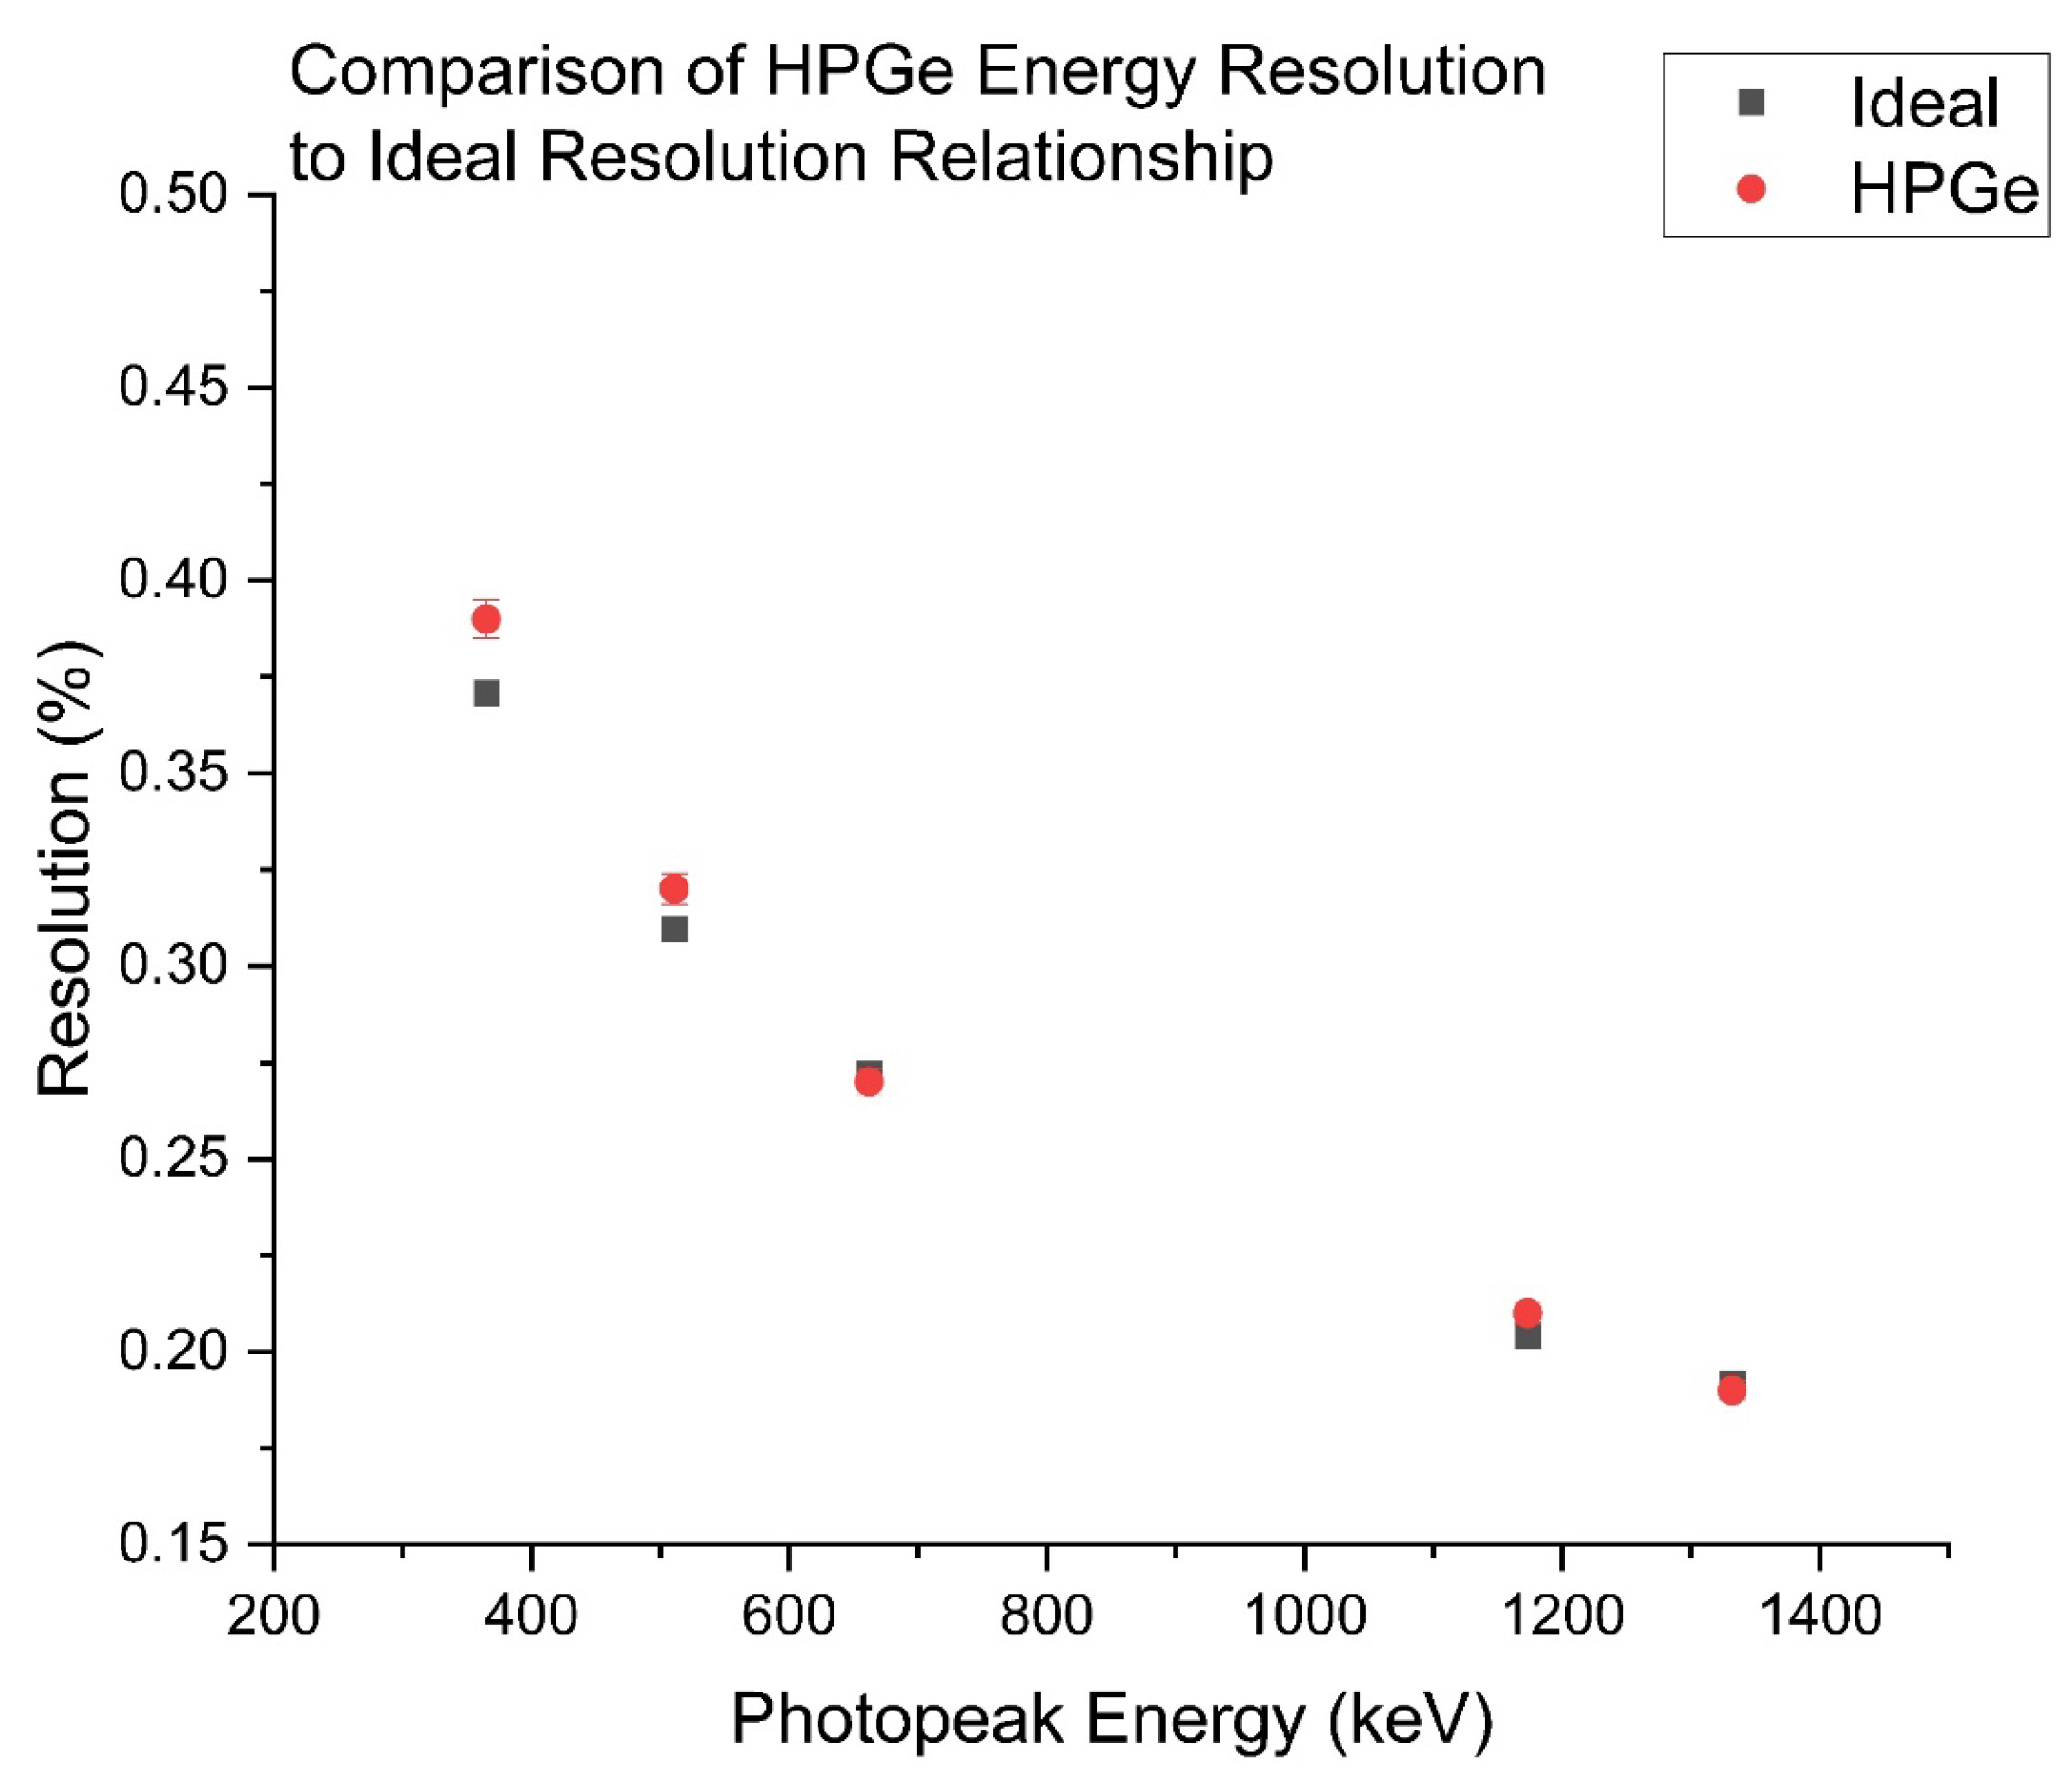
Figure 11.
Absolute Photopeak Efficiency for HPGE Detector used for gold experiments using Ba-133, Co-60, Cs-137.
Figure 11.
Absolute Photopeak Efficiency for HPGE Detector used for gold experiments using Ba-133, Co-60, Cs-137.
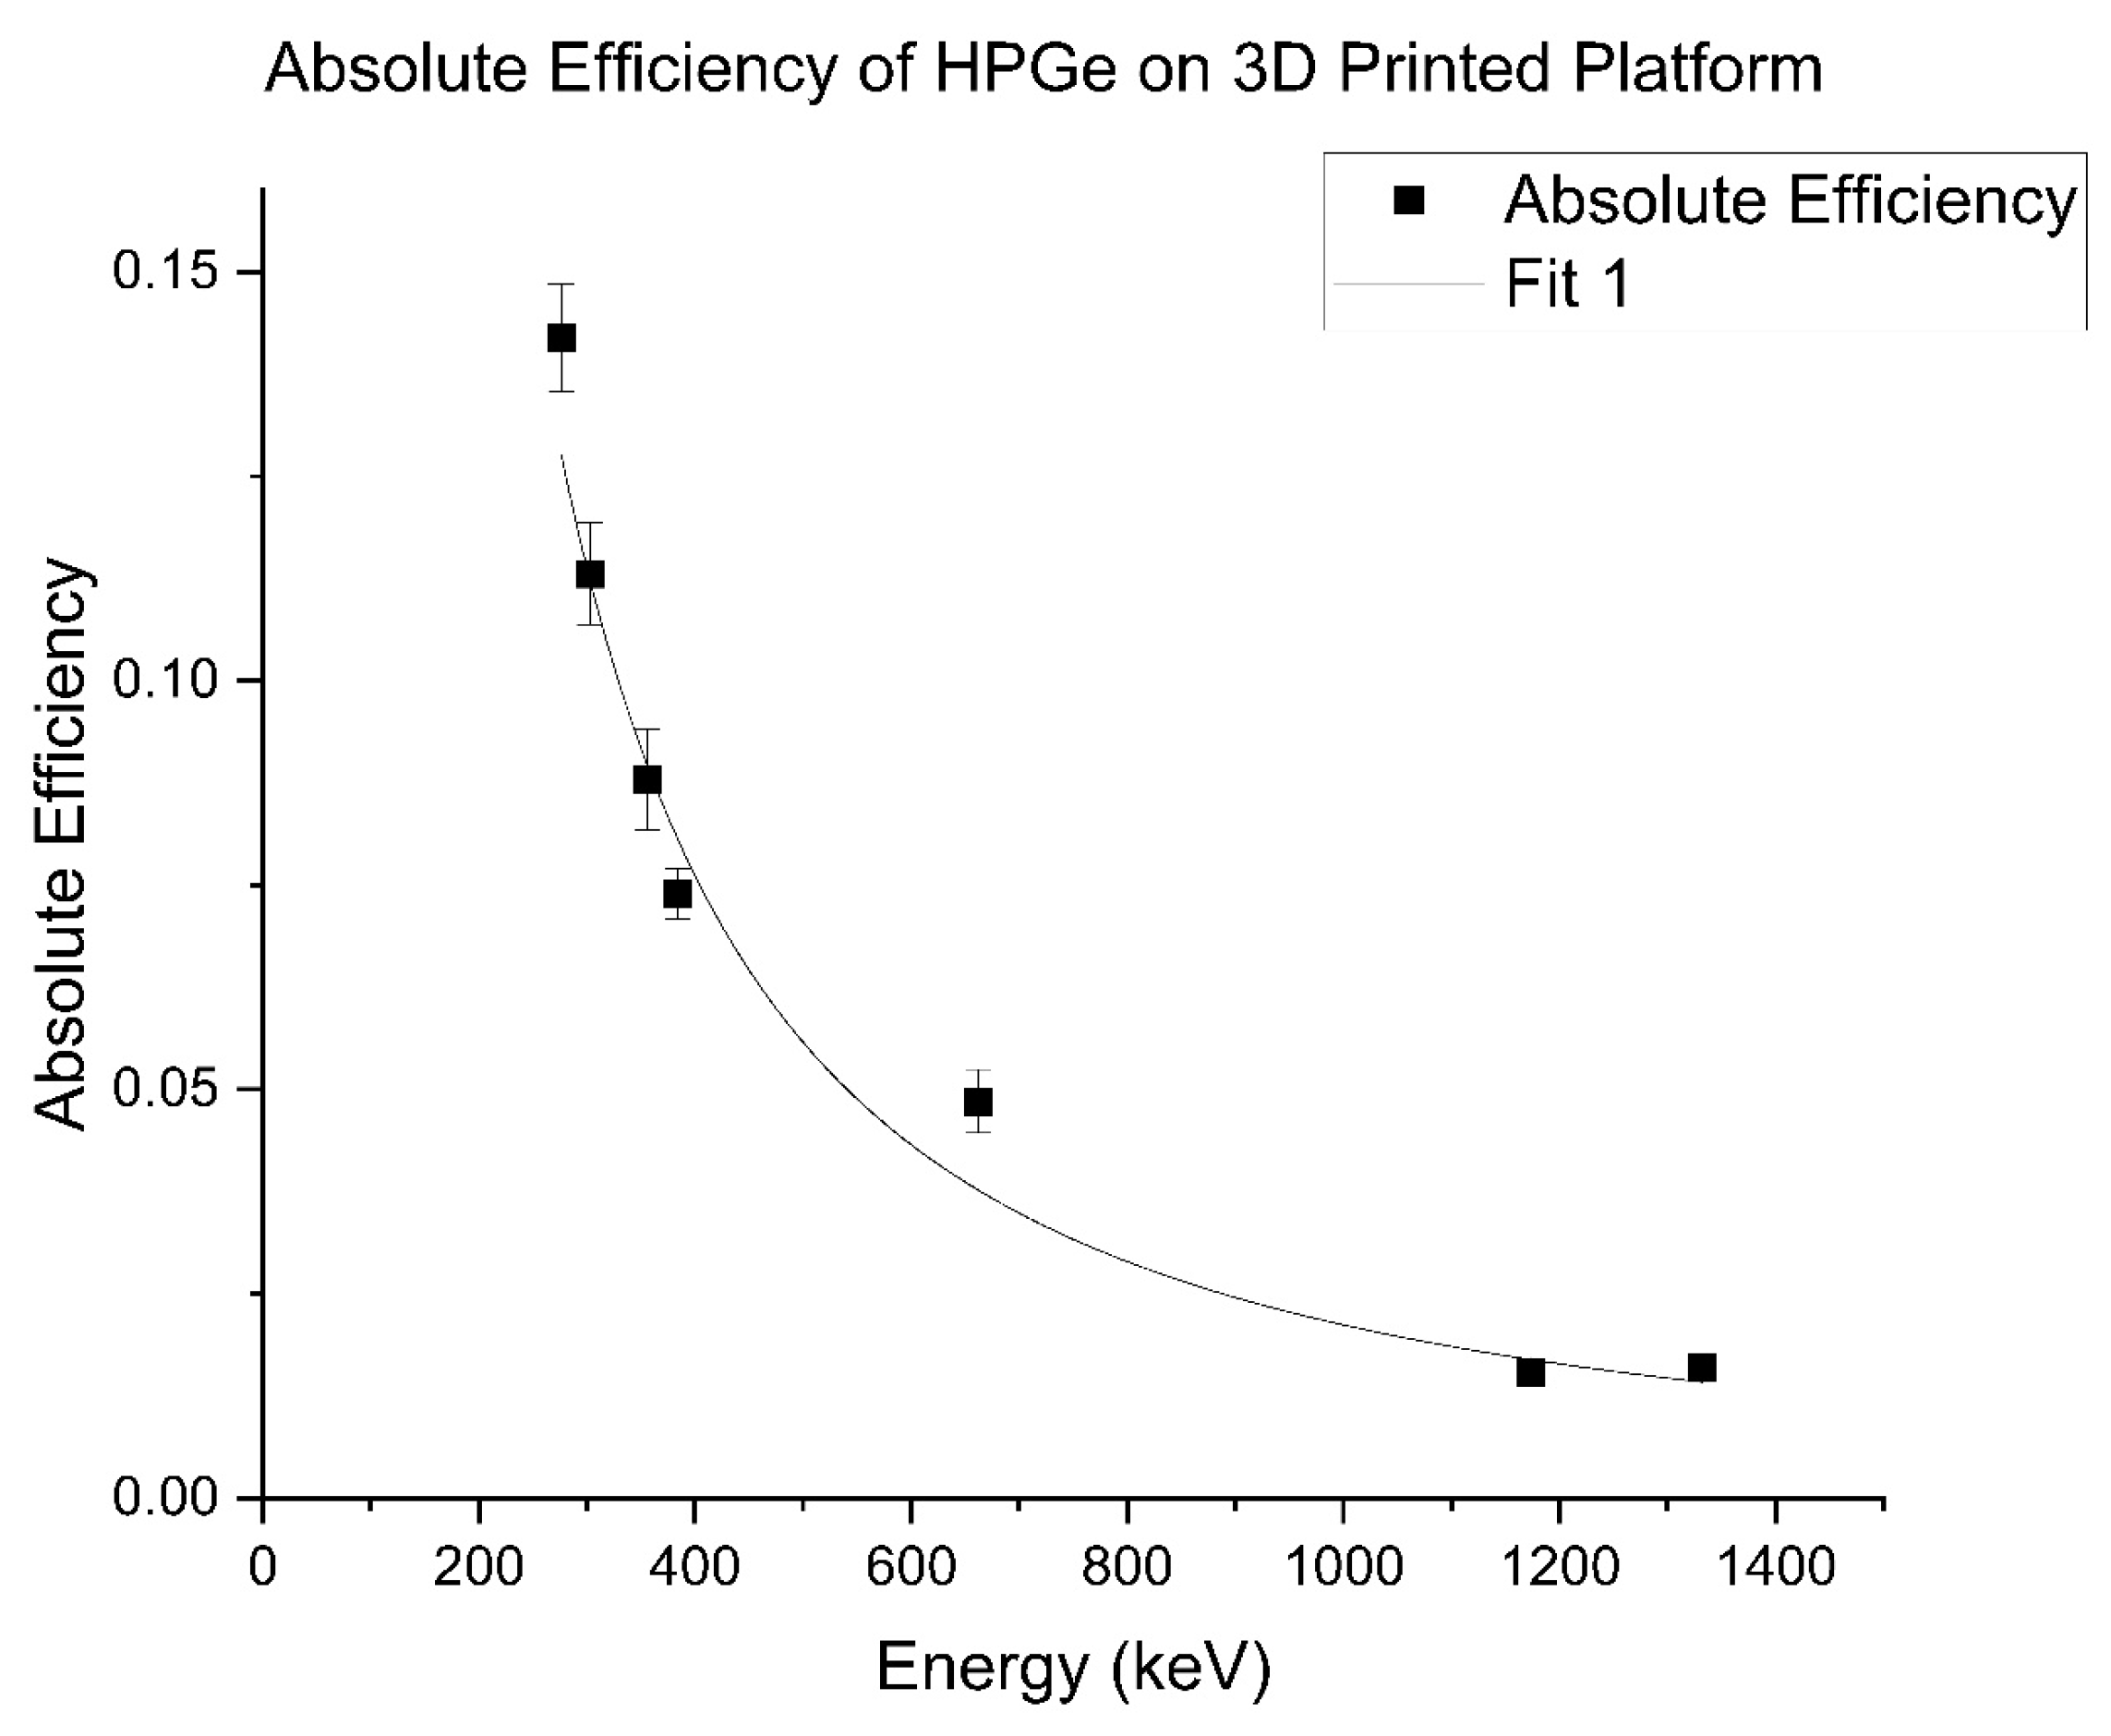
Figure 12.
Comparison of average neutron flux in testbed calculated by gold and indium foils. Error bars represent 1σ uncertainty.
Figure 12.
Comparison of average neutron flux in testbed calculated by gold and indium foils. Error bars represent 1σ uncertainty.
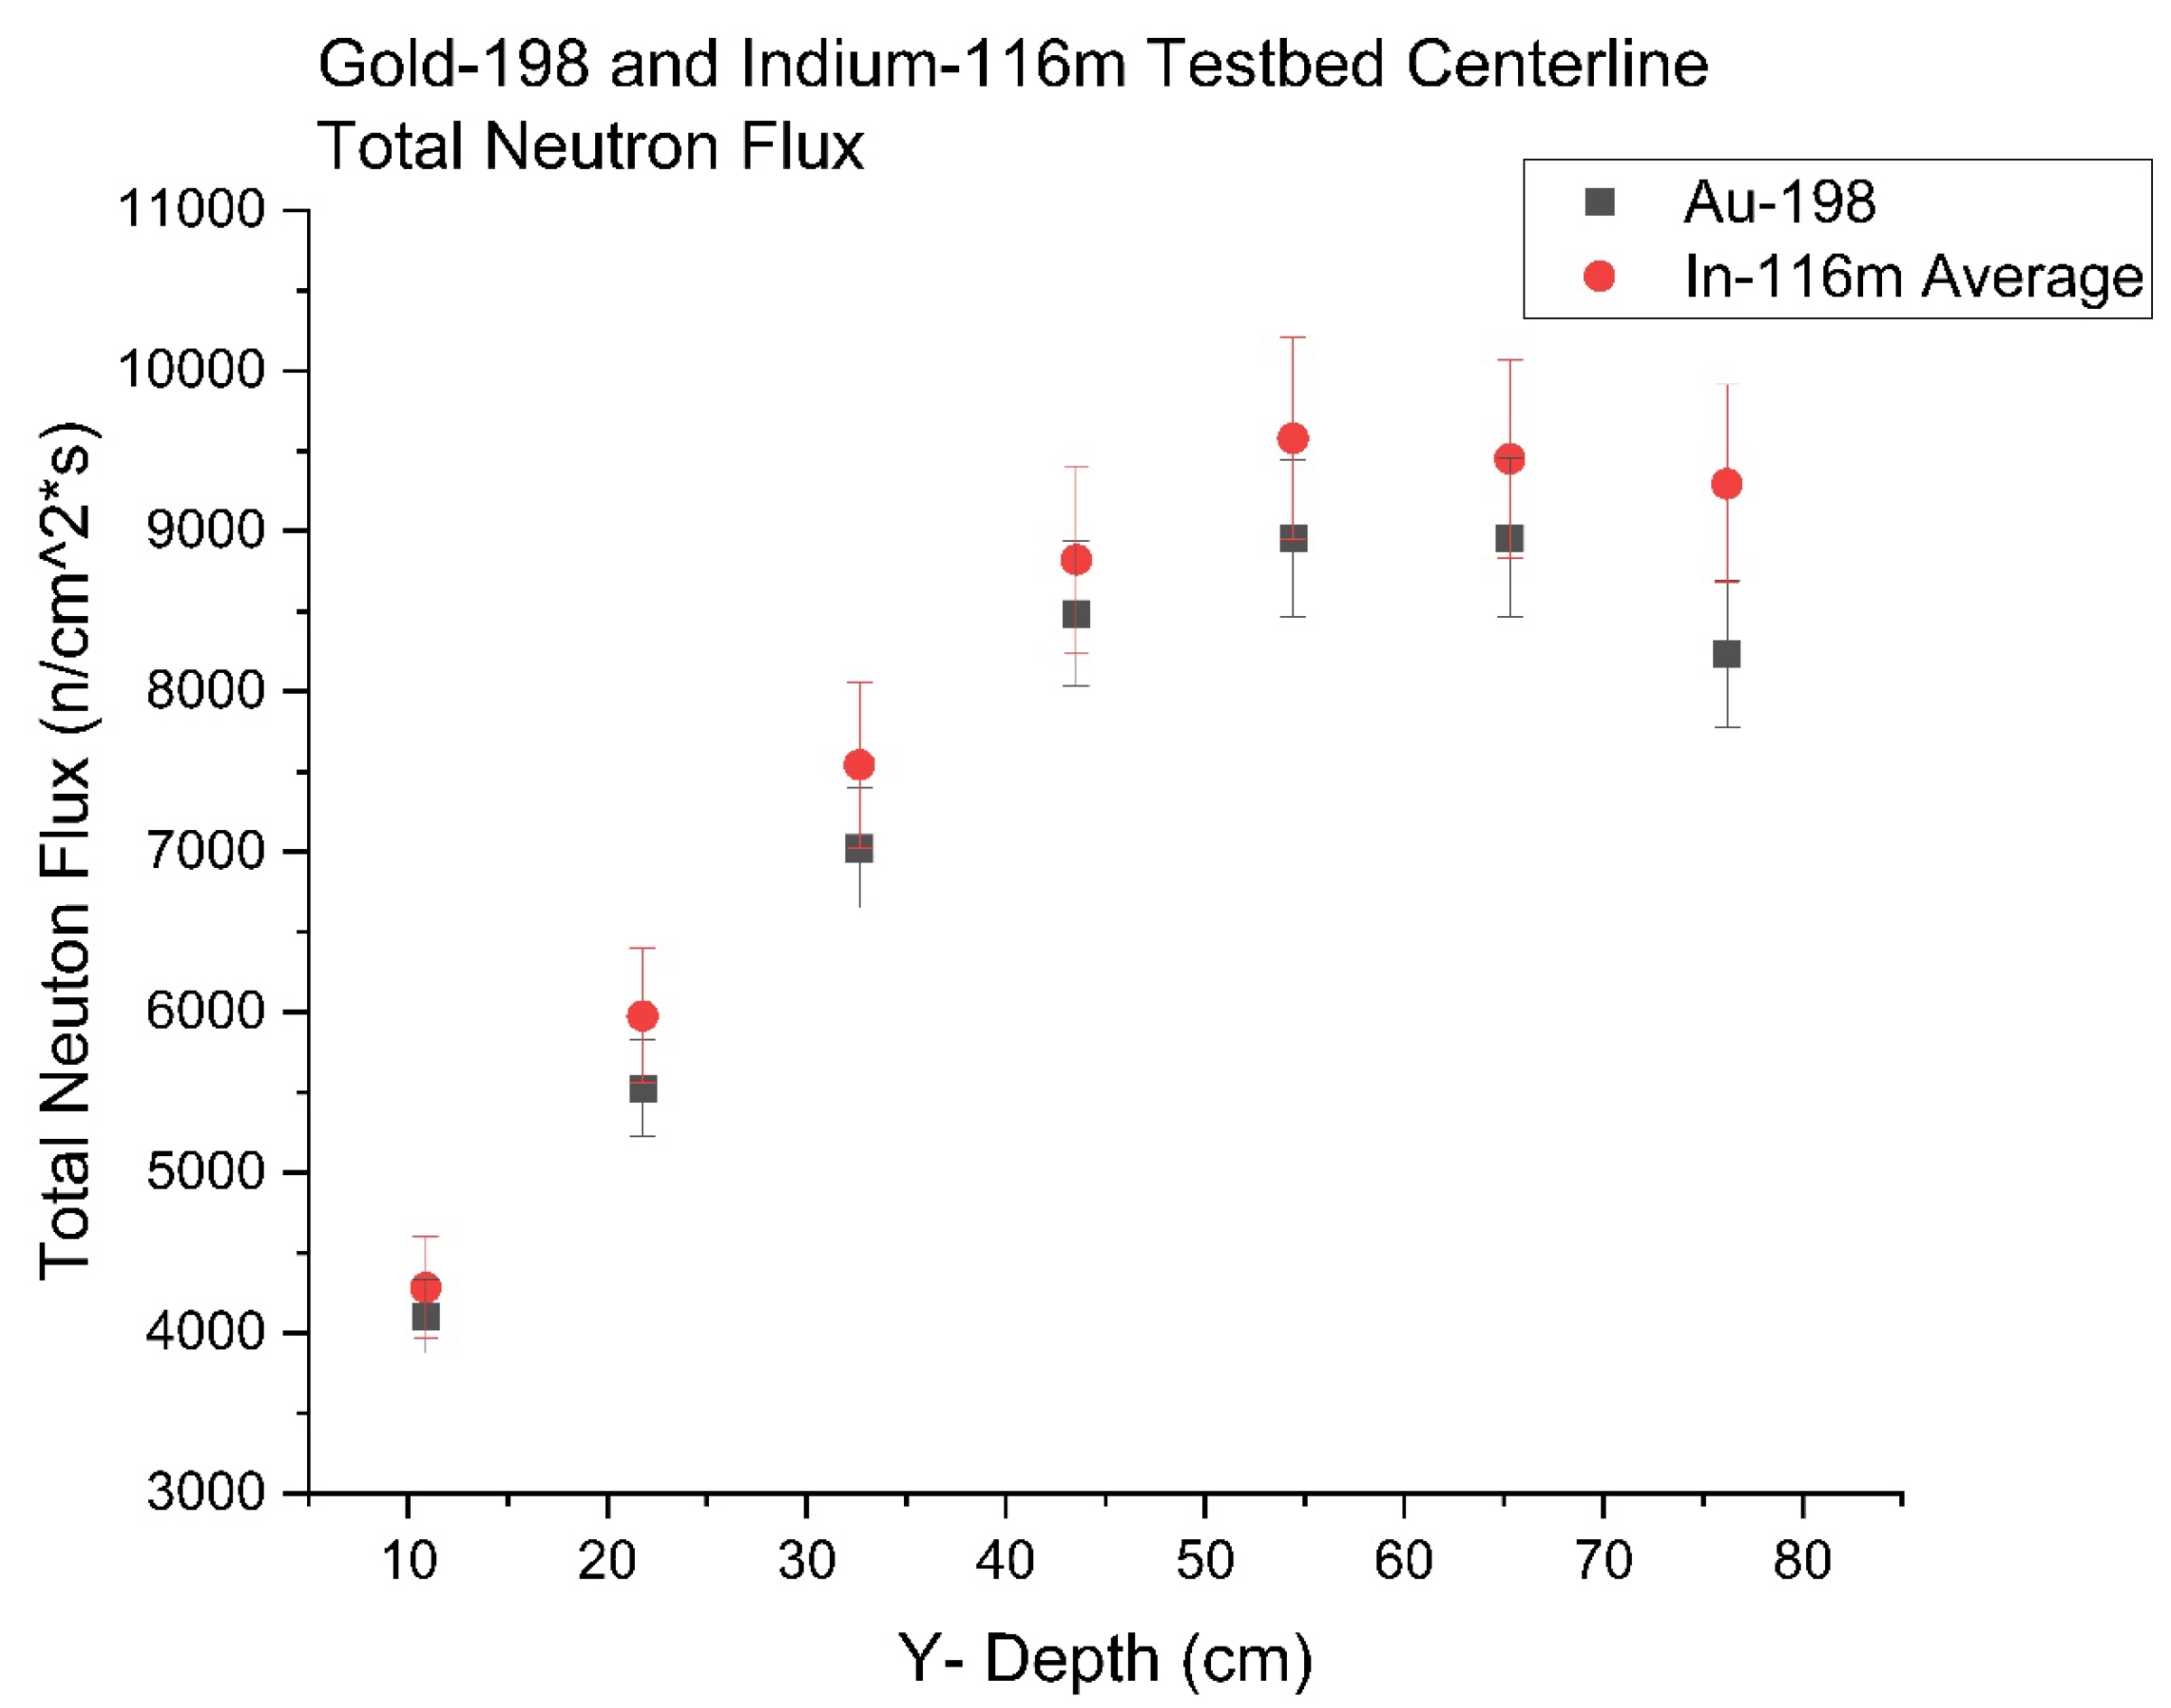
Figure 13.
Refined 7 by 4 gold foil neutron flux along the length of the drawer.
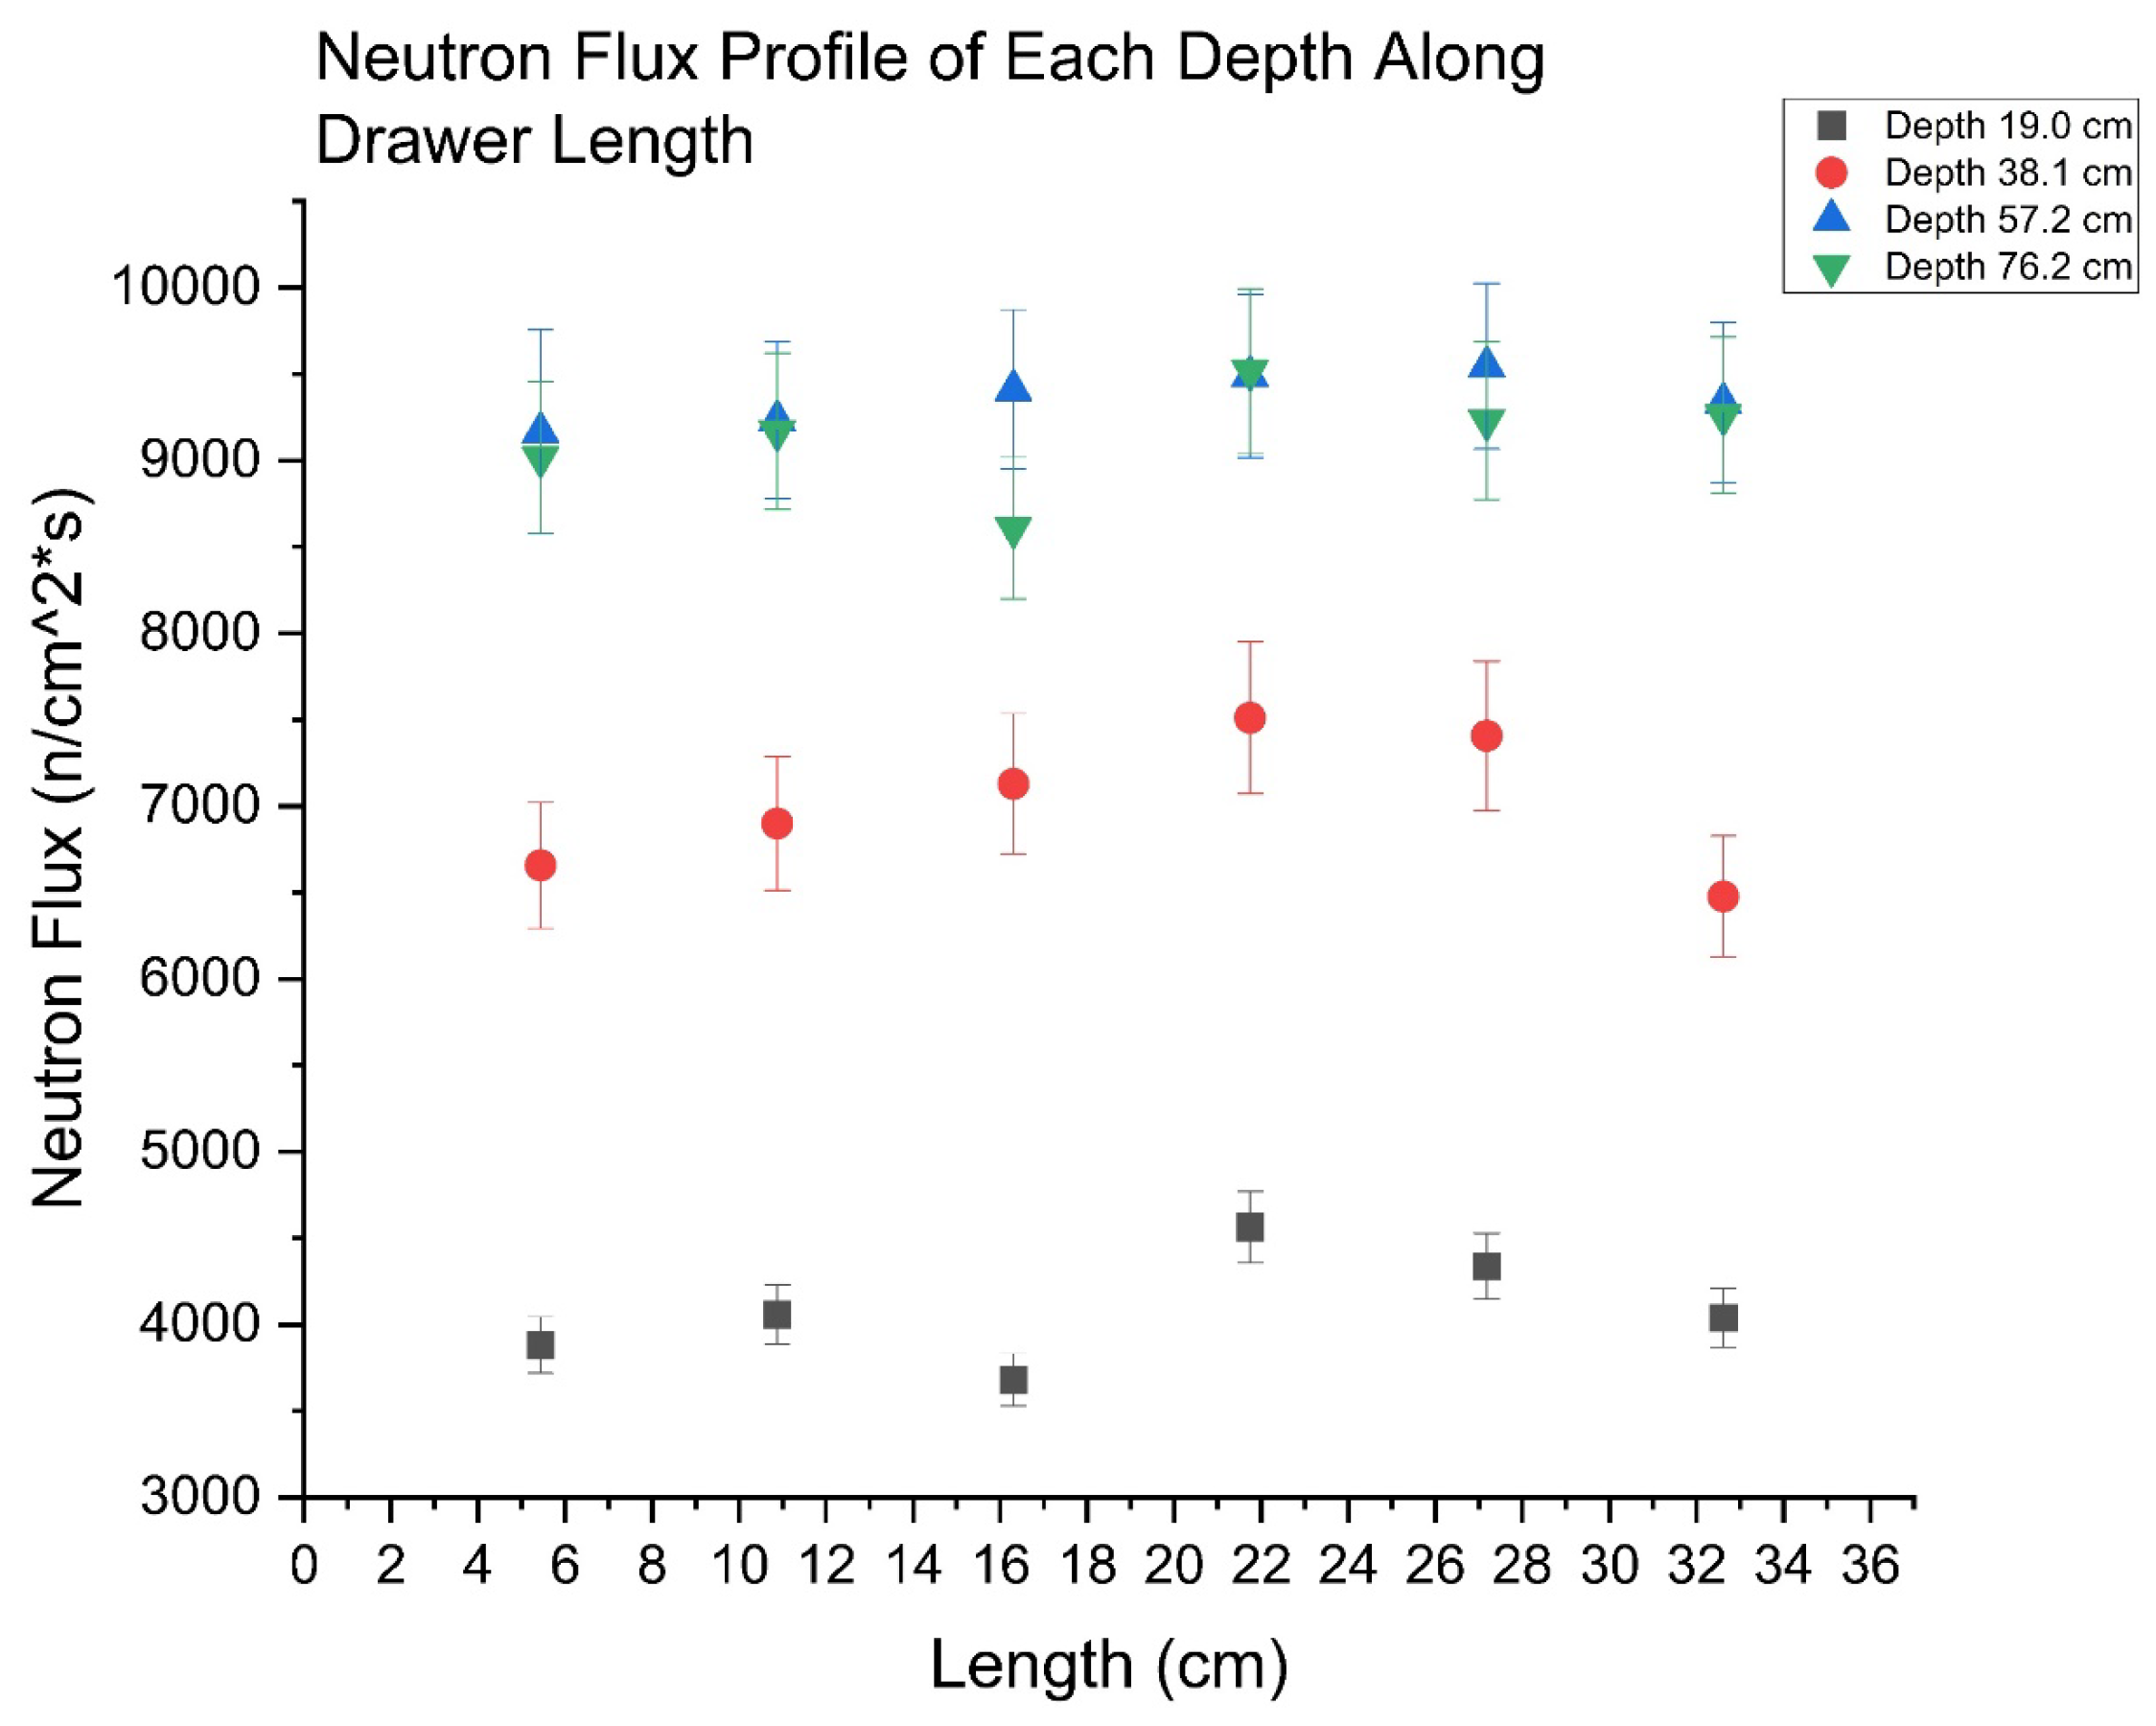
Figure 14.
(a) Average epithermal neutron flux along testbed centerline. (b) Average thermal neutron flux along testbed centerline.
Figure 14.
(a) Average epithermal neutron flux along testbed centerline. (b) Average thermal neutron flux along testbed centerline.
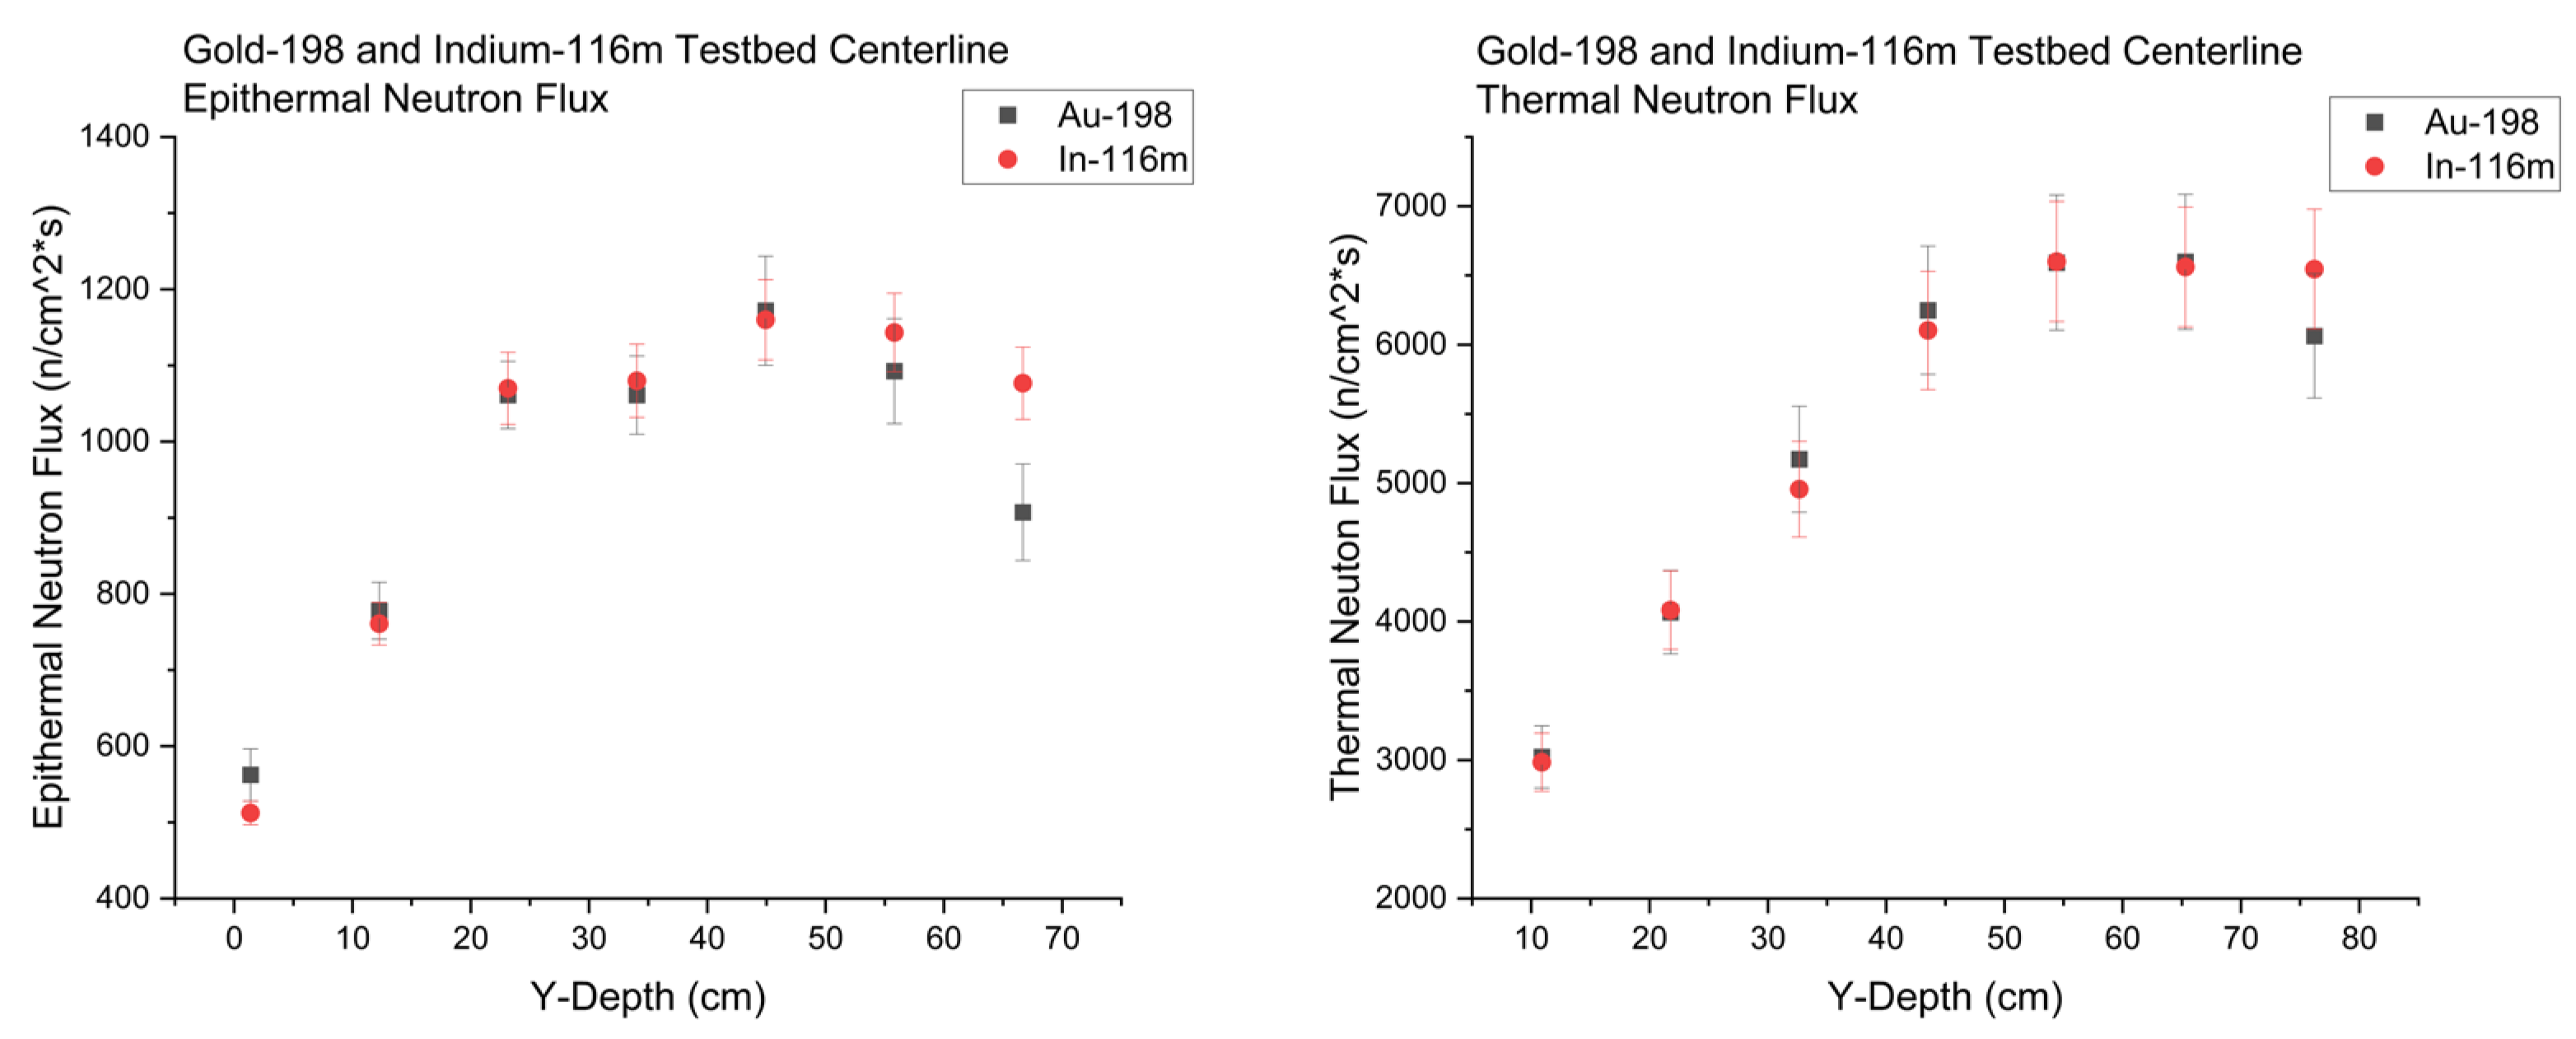
Figure 15.
Flux map of the entire pile as measured by indium foils.
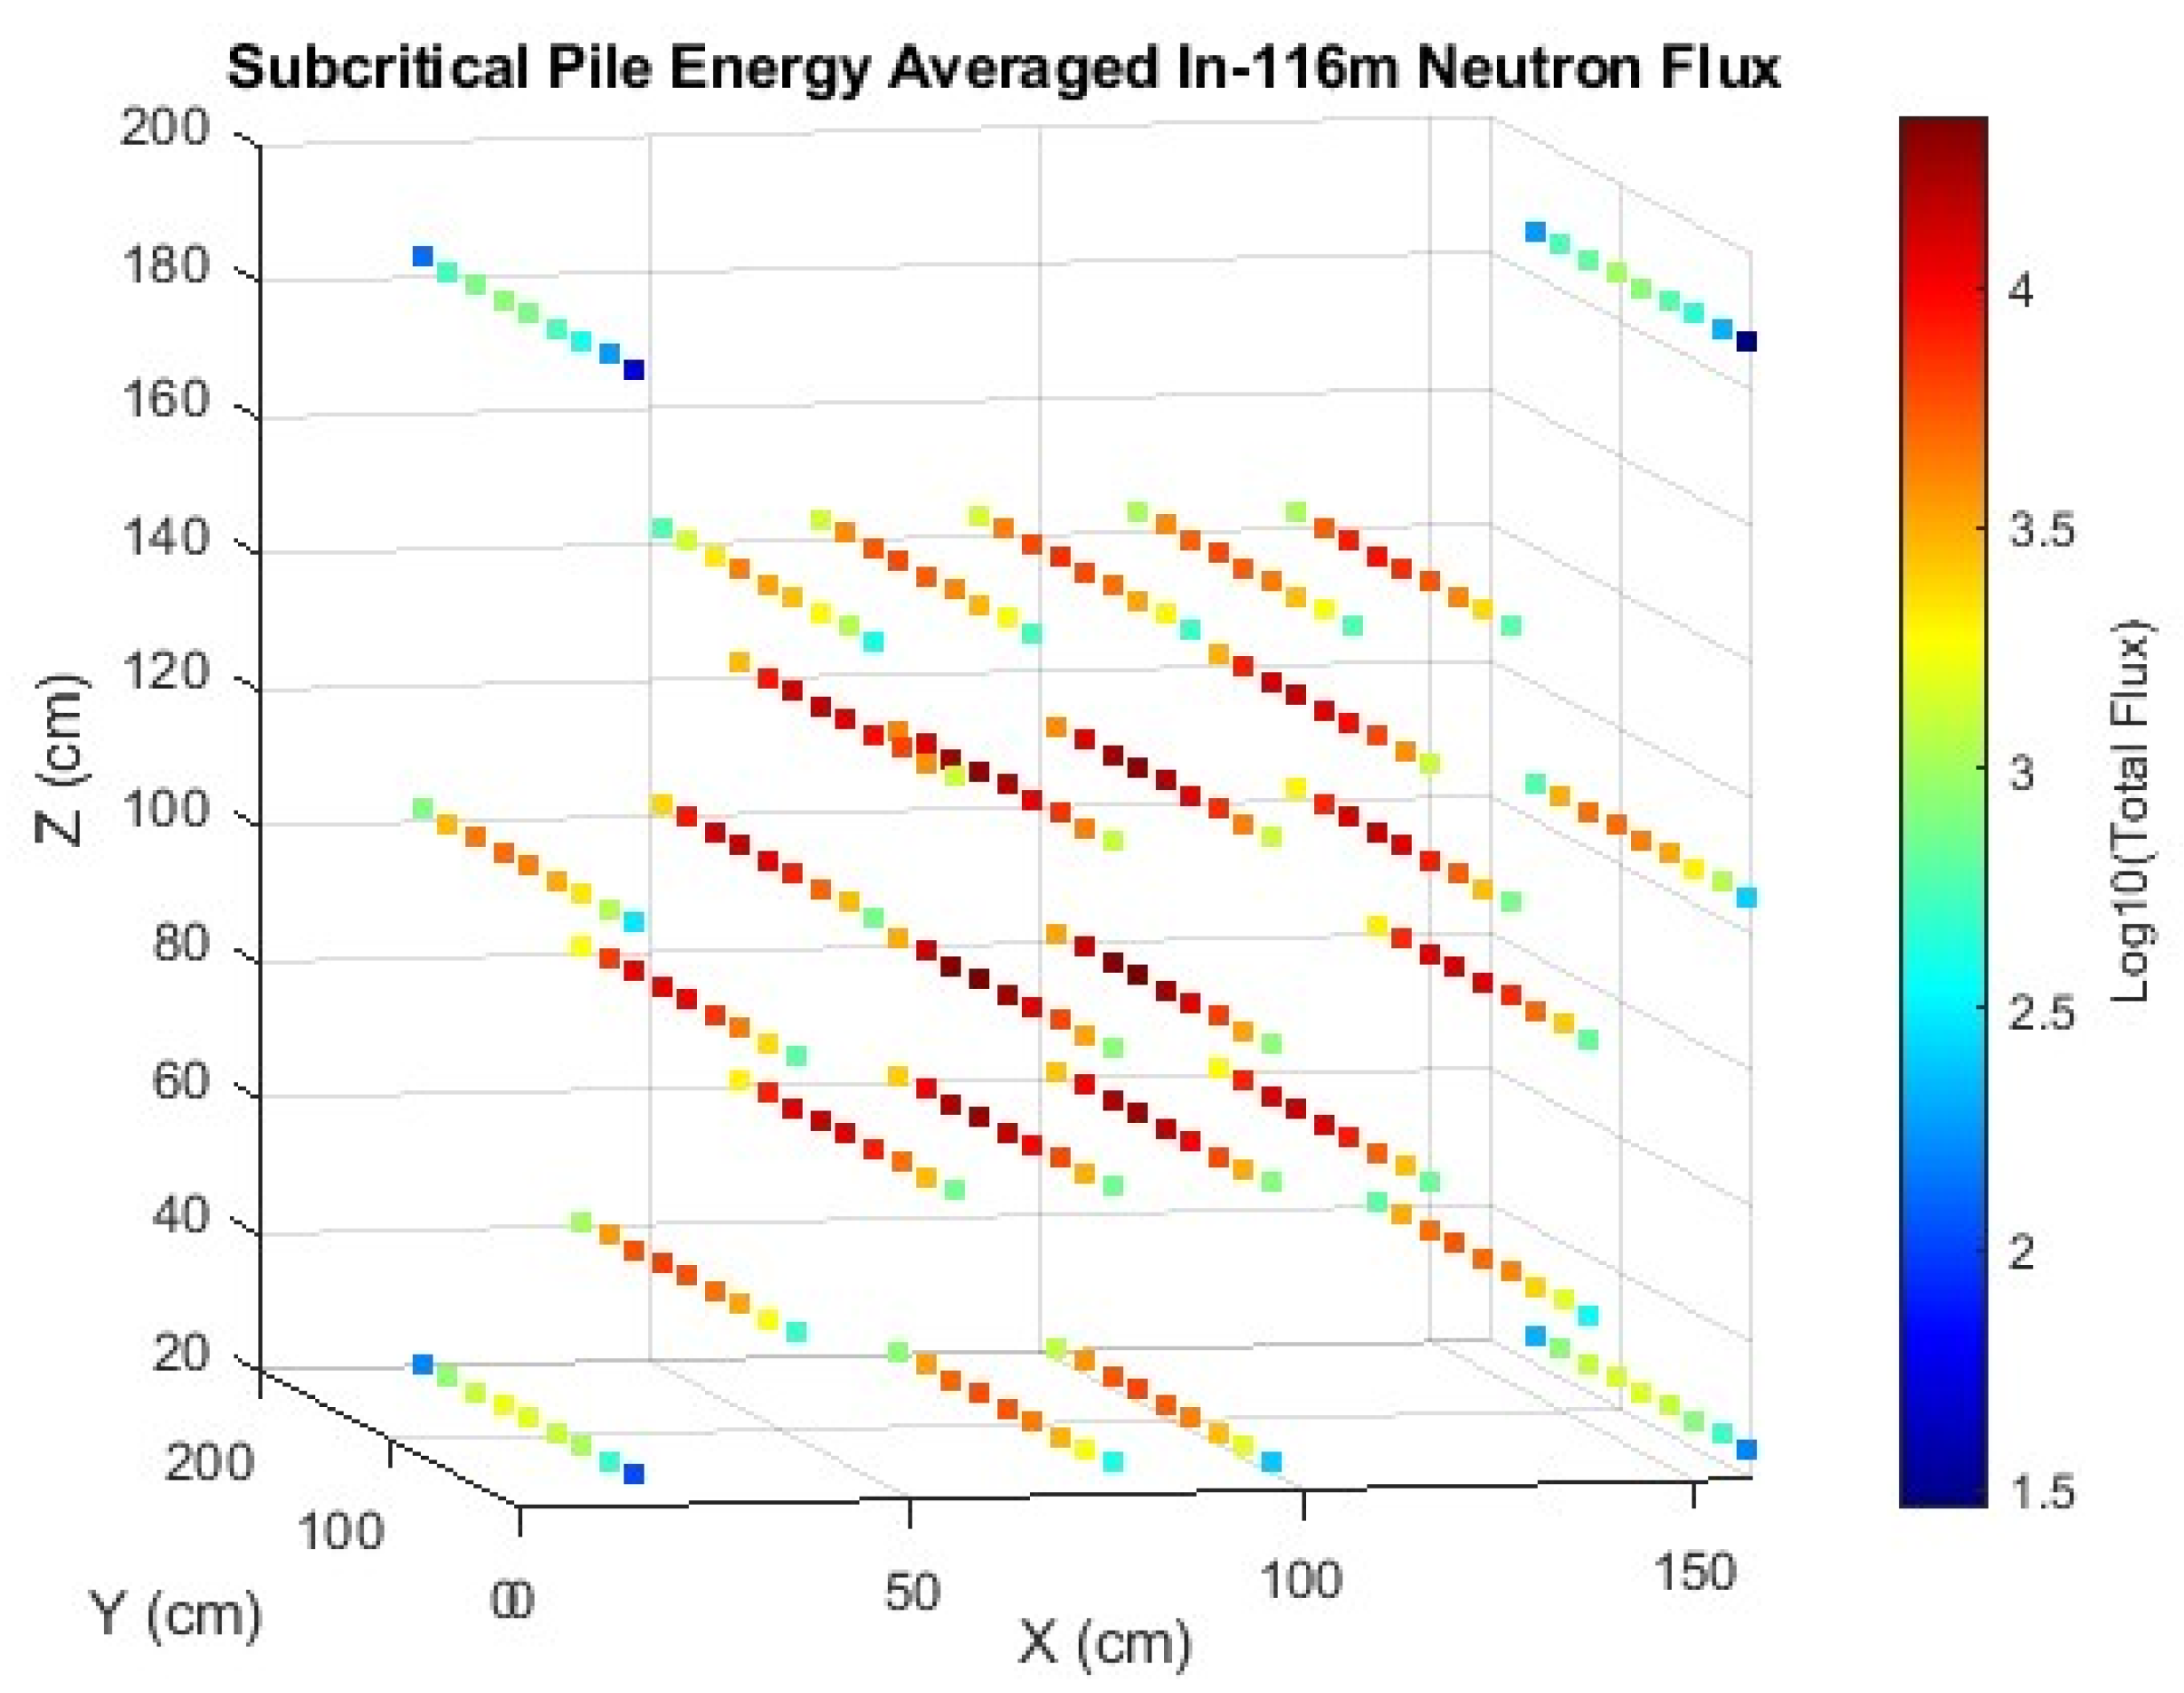
Figure 16.
(a) Gamma energy spectrum taken at 90 centimeters from the front face of pile. (b) Energy calibration for sodium-iodide detector.
Figure 16.
(a) Gamma energy spectrum taken at 90 centimeters from the front face of pile. (b) Energy calibration for sodium-iodide detector.
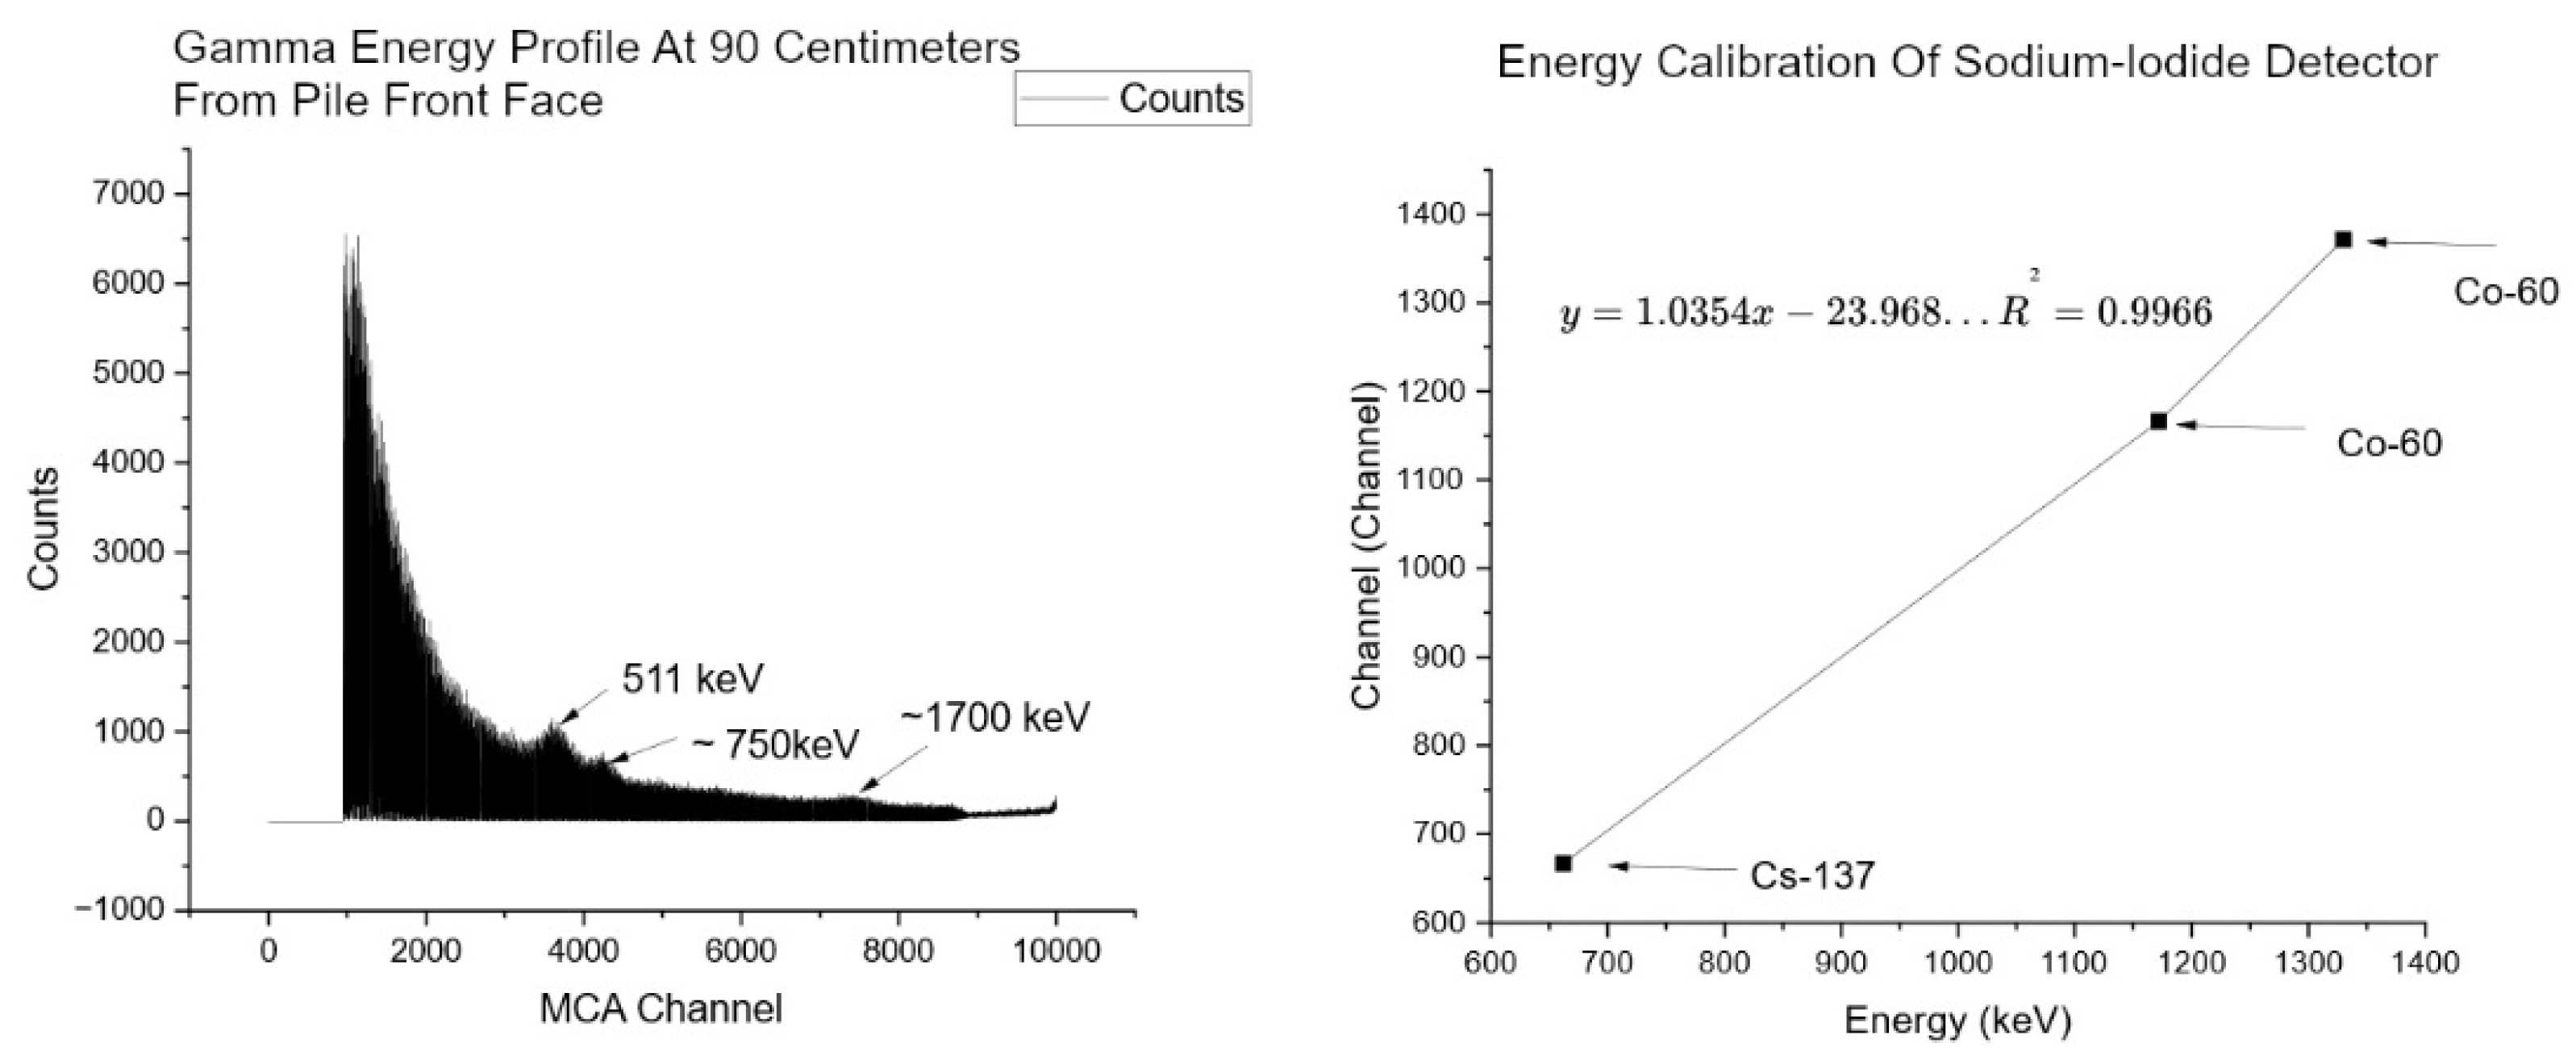
Figure 17.
Comparison of Measured Thermal Flux to Normalized OpenMC and MCNP Tallies within testbed region.
Figure 17.
Comparison of Measured Thermal Flux to Normalized OpenMC and MCNP Tallies within testbed region.
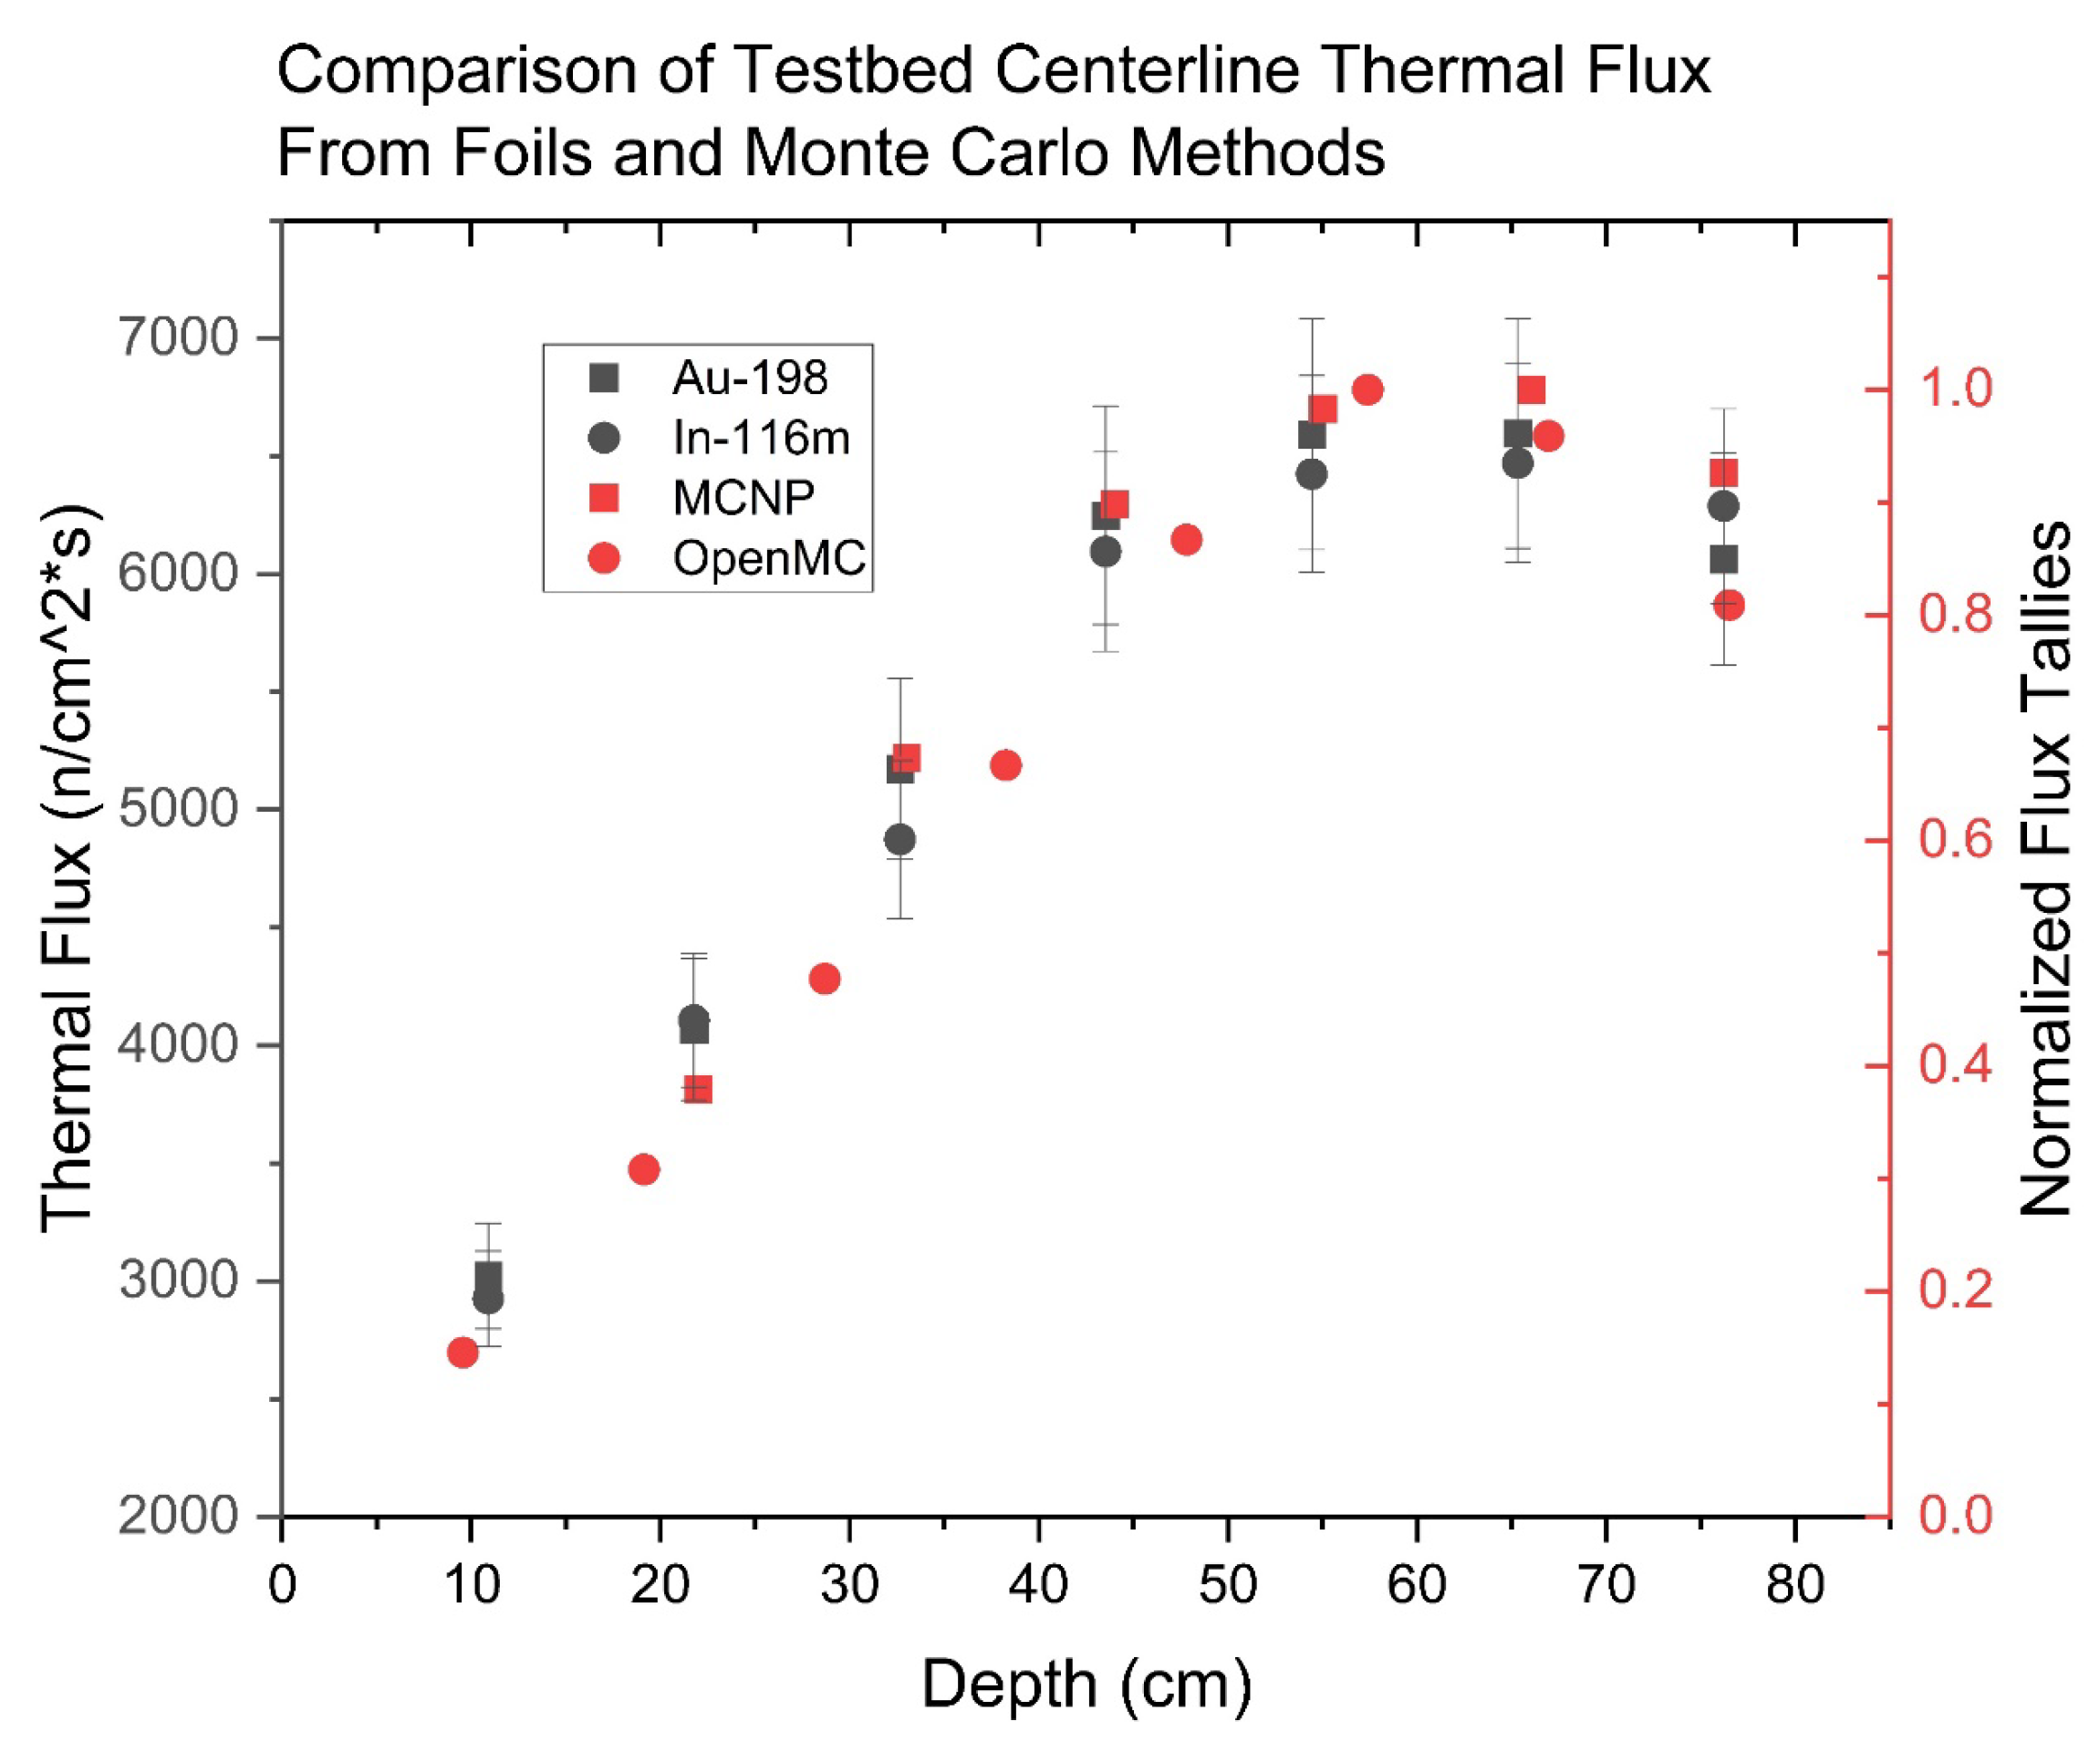
Figure 18.
Normalized In-116m foils compared to MCNP and OpenMC at low neutron flux region within pile.
Figure 18.
Normalized In-116m foils compared to MCNP and OpenMC at low neutron flux region within pile.
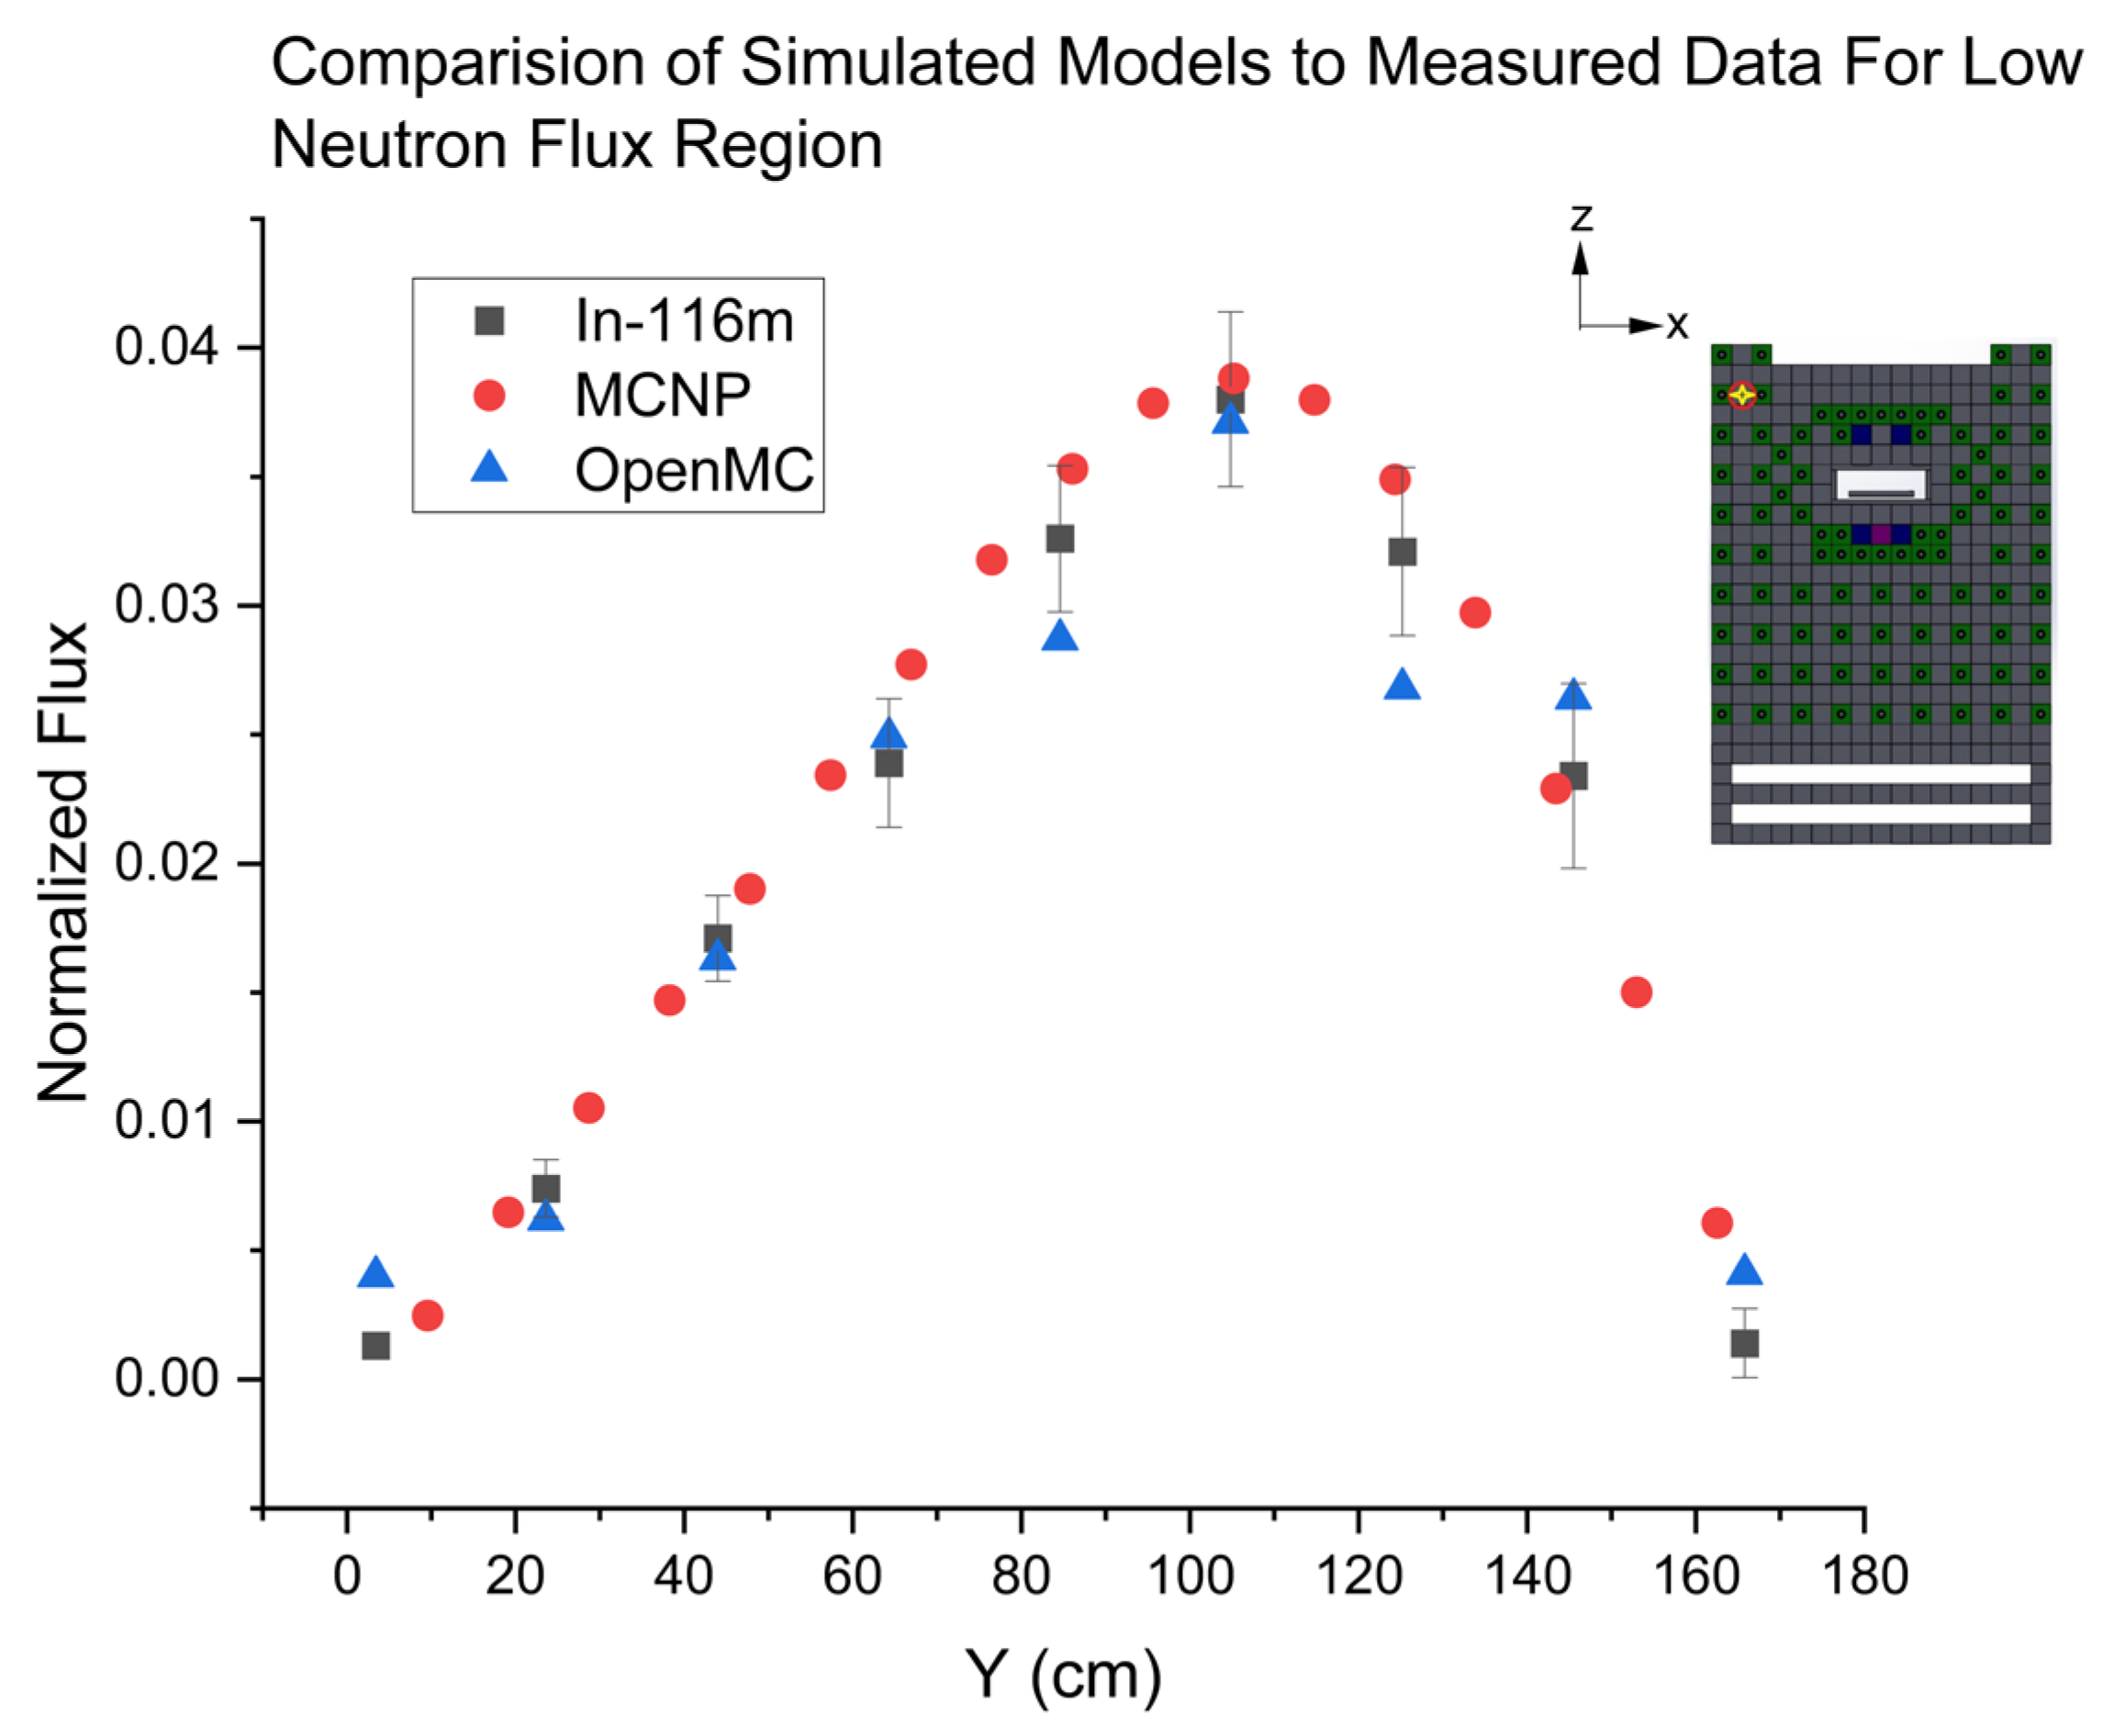
Figure 19.
Normalized In-116m foils compared to MCNP and OpenMC at medium neutron flux region within pile.
Figure 19.
Normalized In-116m foils compared to MCNP and OpenMC at medium neutron flux region within pile.
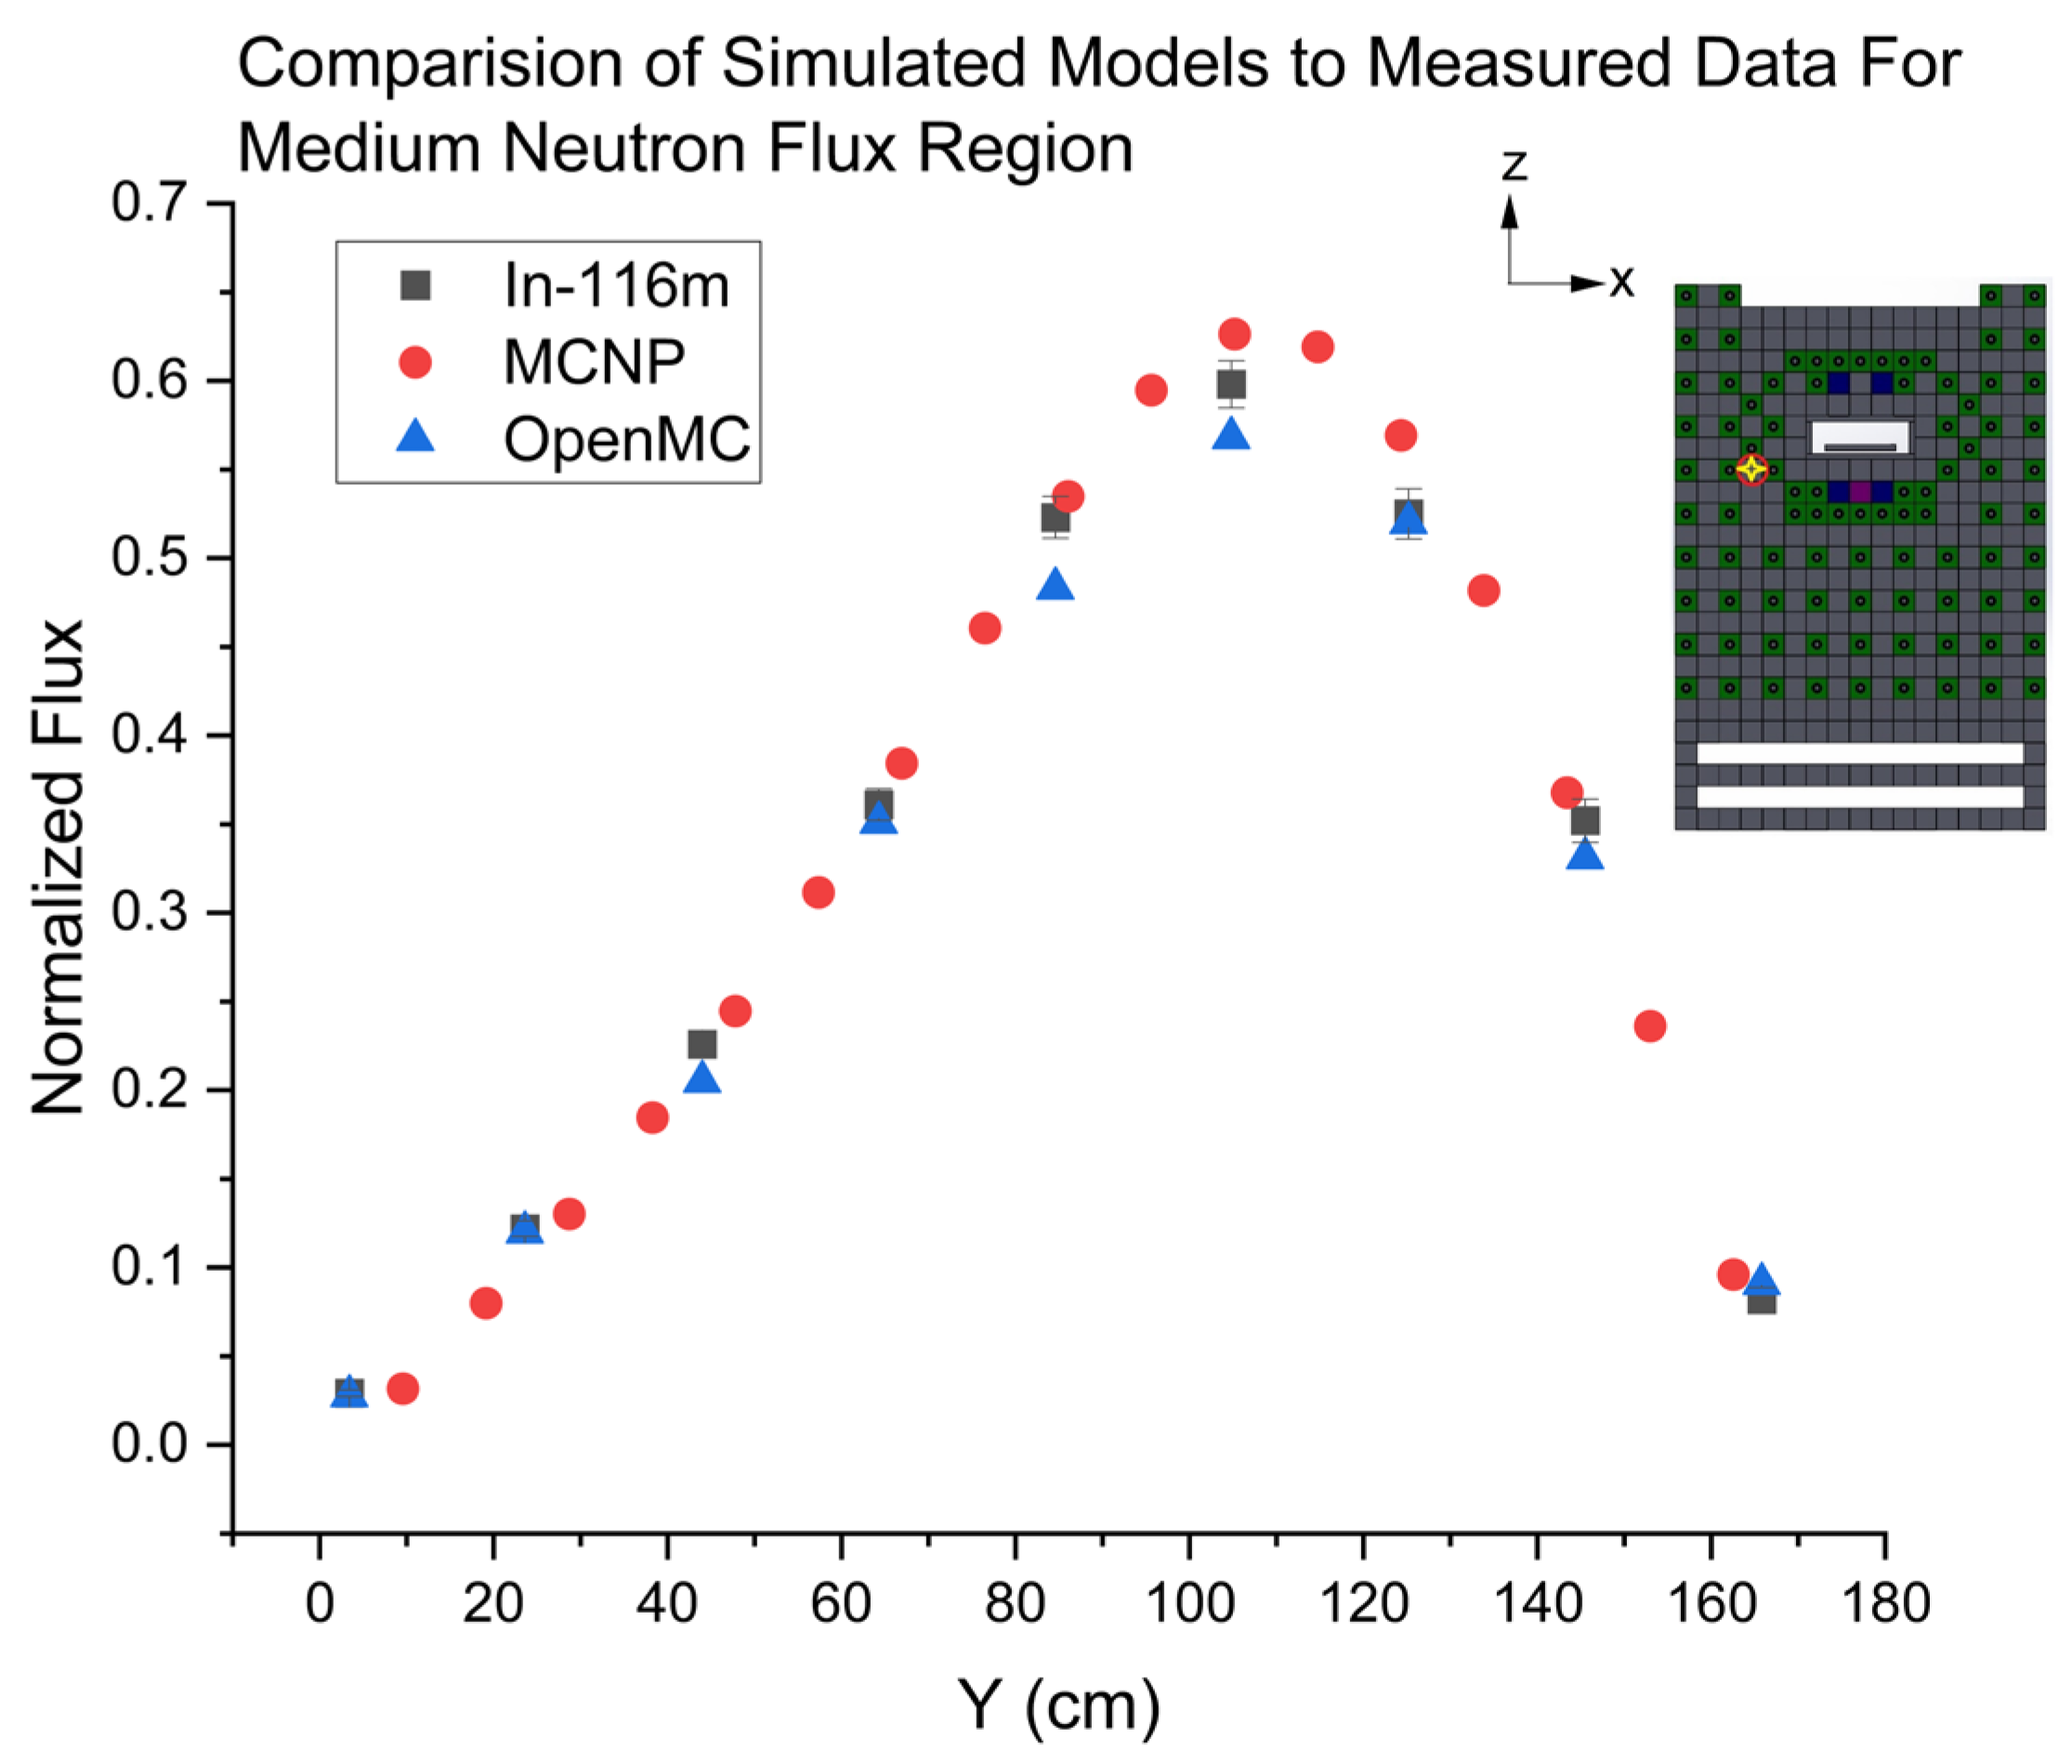
Figure 20.
Normalized In-116m foils compared to MCNP and OpenMC at low neutron flux region within pile.
Figure 20.
Normalized In-116m foils compared to MCNP and OpenMC at low neutron flux region within pile.
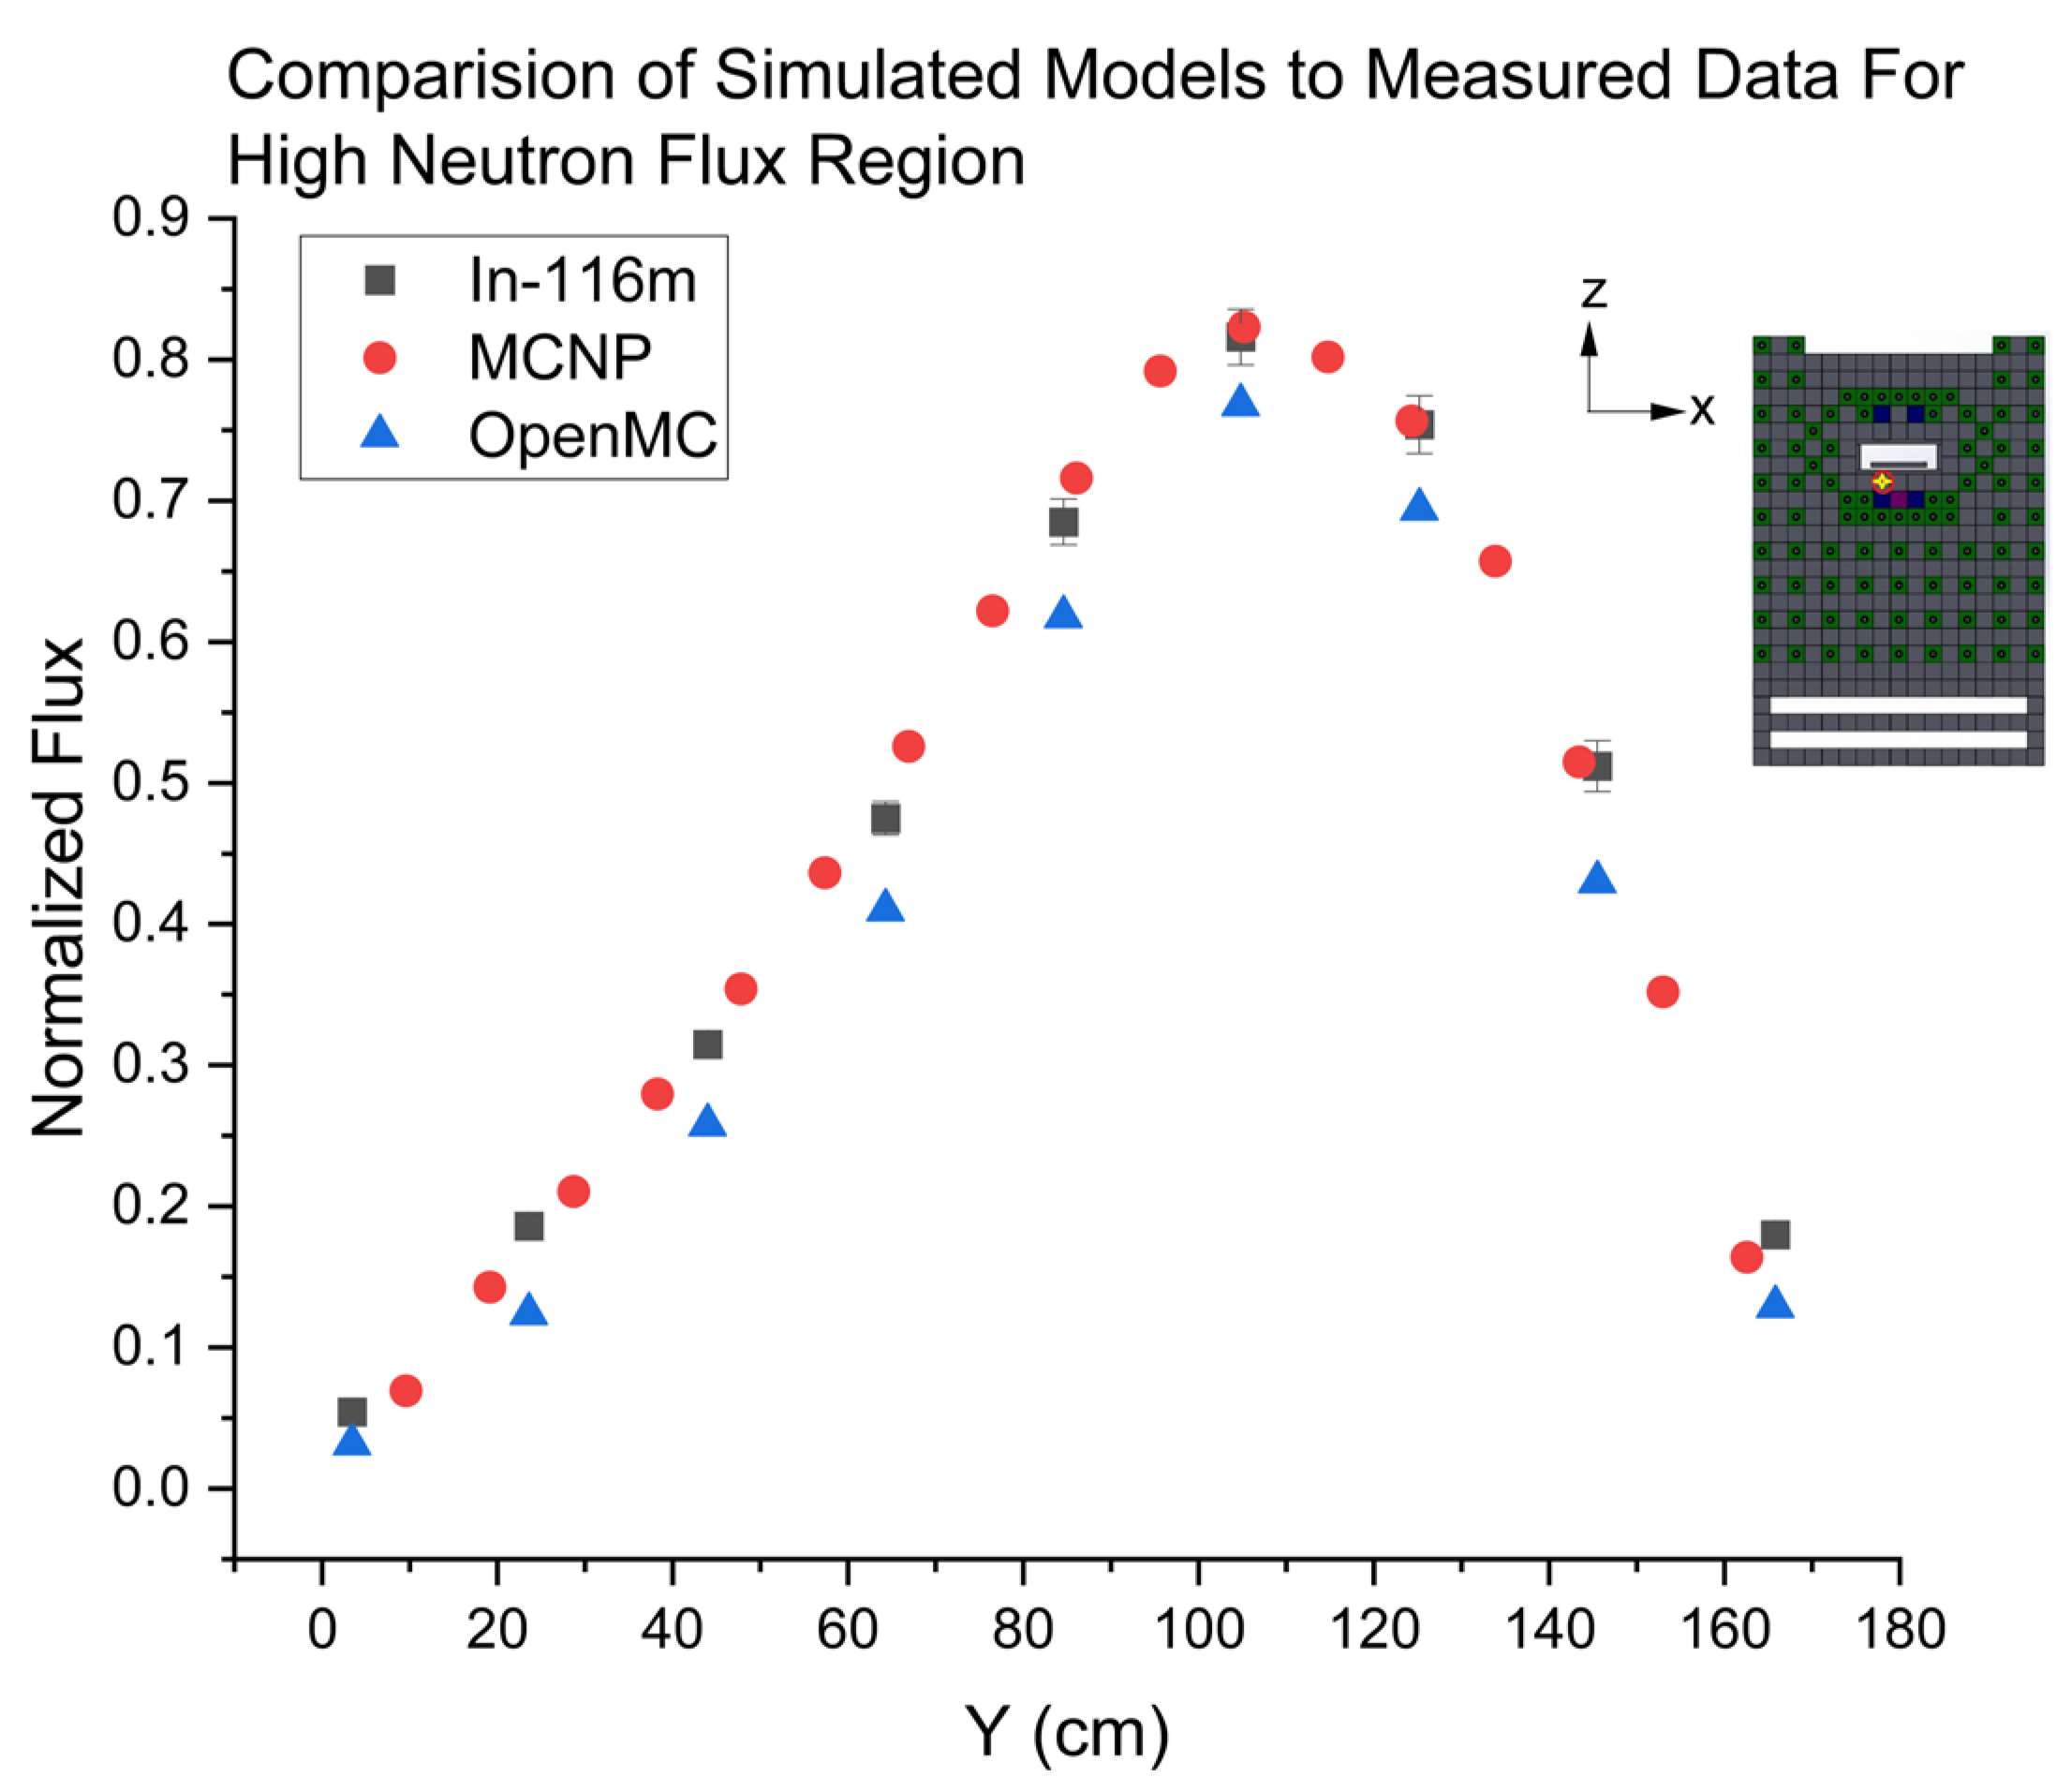
Figure 21.
MCNP calculated microscopic cross-section for absorption within the testbed region for gold-197 and In-115 foils.
Figure 21.
MCNP calculated microscopic cross-section for absorption within the testbed region for gold-197 and In-115 foils.
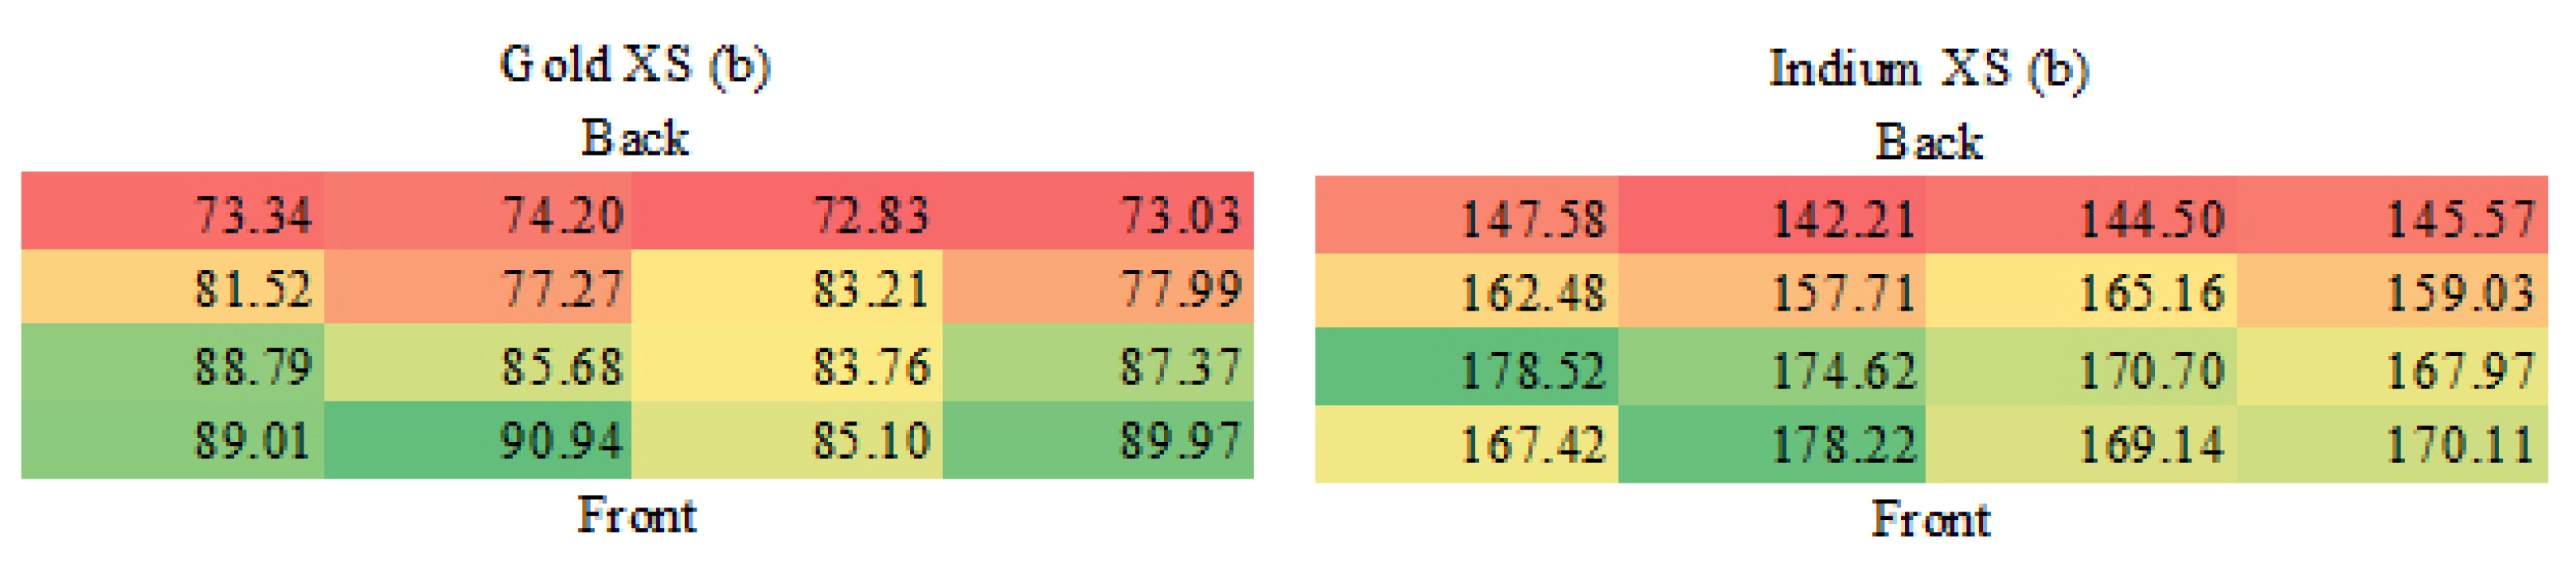
Figure 22.
(a) Neutron energy spectrum within the testbed region. (b) Percent difference in neutron energy compared to testbed average.
Figure 22.
(a) Neutron energy spectrum within the testbed region. (b) Percent difference in neutron energy compared to testbed average.
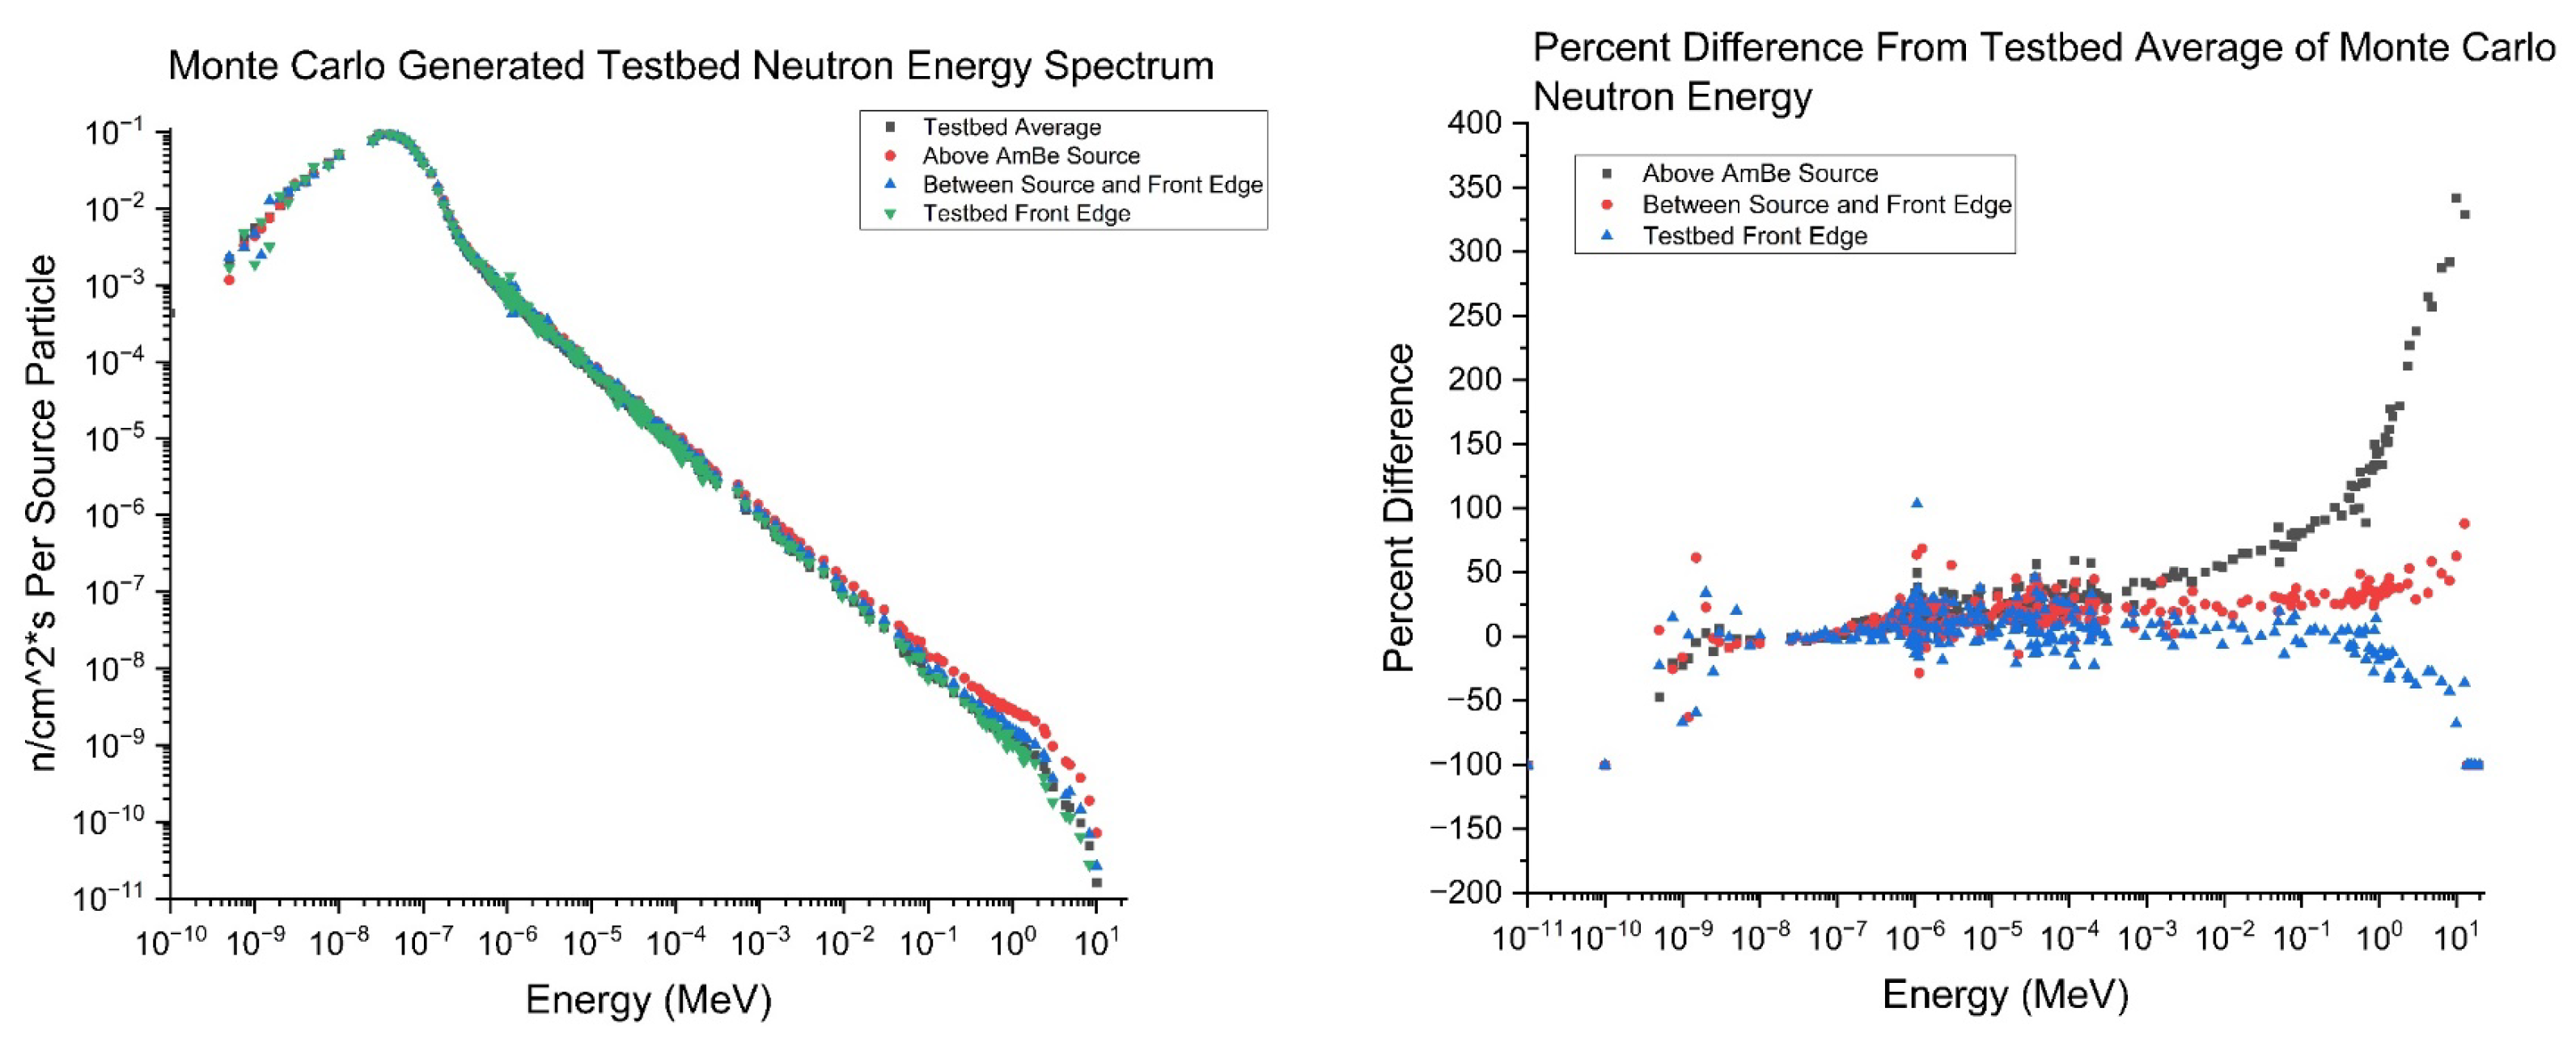
Table 1.
ASTM Standard E262-17 Calculated Flux Variables.
| Characteristic | Gold-198 | Indium-116m |
|---|---|---|
| Rcd Gth Gepi I0 [b] σth [b] Cd Cutoff |
3.80 0.97 0.13 628.00 98.70 N/A |
4.18 0.77 0.14 1557.00 159.60 0.91 |
Table 2.
Measured Energy Resolution of the HPGe Detector.
| Energy (keV) | Resolution (%) | Error1 |
|---|---|---|
| 356 (Ba-133) 511 (Na-22) 662 (Cs-137) 1173 (Co-60) 1332 (Co-60) |
0.39 0.32 0.27 0.21 0.19 |
0.038 0.030 0.027 0.022 0.017 |
1 Background radiation and counts were taken for enough time to reduce error to approximately 10%.
Table 3.
Absolute photopeak efficiencies and branching ratios for indium-116m.
| Energy (keV) | Efficiency (ε) | Branching Ratio |
|---|---|---|
| 416.9 | 3.84E-03 | 0.272 |
| 1097.2 | 1.56E-03 | 0.585 |
| 1293.56 | 1.33E-03 | 0.848 |
Disclaimer/Publisher’s Note: The statements, opinions and data contained in all publications are solely those of the individual author(s) and contributor(s) and not of MDPI and/or the editor(s). MDPI and/or the editor(s) disclaim responsibility for any injury to people or property resulting from any ideas, methods, instructions or products referred to in the content. |
© 2025 by the authors. Licensee MDPI, Basel, Switzerland. This article is an open access article distributed under the terms and conditions of the Creative Commons Attribution (CC BY) license (http://creativecommons.org/licenses/by/4.0/).
Copyright: This open access article is published under a Creative Commons CC BY 4.0 license, which permit the free download, distribution, and reuse, provided that the author and preprint are cited in any reuse.


