
Submitted:
10 February 2025
Posted:
11 February 2025
You are already at the latest version
Abstract
Detecting low nitrogen dioxide concentrations (NO₂) is crucial for environmental monitoring and health protection. In this paper, we report the synergistic effect of decorating nitrogen-doped reduced graphene oxide (N-rGO) with nickel oxide (NiO) nanoparticles for developing highly selective and sensitive chemiresistive NO₂ gas sensors. The N-rGO/NiO sensor was synthesized straightforwardly, ensuring uniform decoration of NiO nanoparticles on the N-rGO surface. Comprehensive characterization using SEM, TEM, XRD, and Raman spectroscopy confirmed the successful integration of NiO nanoparticles with N-rGO and revealed key structural and morphological features contributing to its enhanced sensing performance. As a result. Compared to the N-rGO, the NiO/N-rGO nanohybrids exhibit a boosted response of 5 orders of magnitude towards low concentrations of NO2 (< 1 ppm) at 100 °C. Moreover, the present device has an outstanding performance, high sensitivity, and low limit of detection (< 1 ppb). The findings pave the way for integrating these sensors into advanced applications, including environmental monitoring and IoT-enabled air quality management systems.
Keywords:
N-rGO
; NiO
; NO2
; gas sensing
1. Introduction
In addition to promoting green energy, safeguarding the environment and human health from harmful gases such as NOx, NH3, COx, H2S, and VOCs is a critical priority in advancing a sustainable lifestyle. Among air pollutants, NO2 has garnered significant attention due to its substantial impact on air quality and its association with the formation of ground-level ozone, acid rain, and climate change through disruptions in atmospheric chemical balance. Furthermore, NO2 poses serious health risks, including respiratory disorders, chronic bronchitis, asthma, and various cardiovascular and pulmonary diseases, depending on exposure duration [1,2].
To address these challenges, the development of highly sensitive NO2 gas sensors has become indispensable. Researchers and industries alike share the responsibility of advancing this technology, which has found increasing relevance in cutting-edge applications such as the Internet of Things (IoT) and Micro-Electro-Mechanical Systems (MEMS) [3]. Effective NO2 sensors require several critical attributes, including high selectivity and stability, low power consumption, optimal device architecture, and, most importantly, a carefully chosen sensing material.
Chemiresistive gas sensors have emerged as a preferred choice due to their cost-effectiveness, miniaturization potential, and compatibility with NO2 detection [4,5]. Among sensitive materials, graphene-based substances have gained prominence, thanks to their remarkable properties, including a large surface area, high carrier mobility, and excellent electrical and thermal conductivity [6,7,8]. Nitrogen-doped reduced graphene oxide (N-rGO) stands out among graphene derivatives for applications such as energy storage, catalysis, and gas sensing [9,10,11,12]. Its superior performance in gas sensing compared to pristine graphene stems from features like enhanced bandgap engineering, increased active sites for catalytic activity, a high surface area, defect-rich structure, and low operating temperature. However, its application in chemiresistive NO2 sensors remains under explored [13,14,15].
In parallel, transition metal oxides (TMOs), known for their semiconducting properties, have demonstrated considerable potential as sensitive materials for chemiresistive gas sensors. TMOs offer advantages such as ease of production, high sensitivity, excellent stability, and rapid response/recovery times [16,17,18]. Despite these benefits, challenges such as high operating temperatures and limited selectivity persist [19,20]. TMOs can be categorized into n-type oxides (e.g., SnO2, ZnO, In2O3, WO3, and TiO2) and p-type oxides (e.g., NiO and CuO). In gas sensing, n-type oxides typically exhibit resistance changes upon exposure to reducing or oxidizing gases, while p-type oxides demonstrate the opposite behavior [21].
Nickel oxide (NiO), a p-type metal oxide, boasts unique physical properties, including a wide bandgap (3.6–4 eV), excellent thermal conductivity, and stability. These characteristics make it a versatile material for energy storage, optoelectronics, and gas sensing applications [22,23,24]. However, its role as a sensitive material for chemiresistive gas sensors remains relatively rare, even in combination with other materials like graphene derivatives. Studies have suggested synergistic effects when combining NiO with graphene-based materials for detecting gases such as H2, H2S, NH3, CO, and VOCs [25,26,27,28,29]. Nonetheless, its potential for NO2 detection under optimized conditions remains inadequately explored.
This study aims to bridge this gap by leveraging the complementary properties of N-rGO and NiO to develop enhanced chemiresistive NO2 gas sensors. The sensor materials were synthesized through straightforward methods and evaluated for their performance at sub-ppm NO2 concentrations under varying conditions. Their structural and functional attributes were characterized using techniques such as SEM, TEM, XRD, and Raman spectroscopy. Finally, the gas sensing results and mechanisms are thoroughly discussed, highlighting their significance for future applications.
2. Materials and Methods
2.1. Synthesis of Materials
The synthesis of nitrogen-doped reduced graphene oxide (N-rGO) began with the preparation of graphene oxide (GO) as a precursor, which was synthesized using a modified Hummer’s method [30]. In brief, 50 mg of GO powder was dispersed in 50 mL of distilled water and subjected to ultrasonication for 2 hours to ensure complete dispersion. Subsequently, an appropriate quantity of urea, serving as the nitrogen dopant source, was added to the GO solution and stirred for 30 minutes. The resulting mixture was transferred to a Teflon-lined autoclave and subjected to hydrothermal treatment at 180°C for 12 hours. This process not only reduced the GO to reduced graphene oxide (rGO) but also incorporated nitrogen dopants into the graphene structure, yielding N-rGO.
The synthesis of nickel oxide (NiO) nanoparticles was carried out using the co-precipitation method. Initially, 3 g of hydrated nickel nitrate (NiNO₃·6H₂O) was dissolved in 125 mL of distilled water and stirred at 50°C for 40 minutes. Subsequently, 10 mL of 0.1 M NaOH solution was added dropwise to the mixture until the pH reached 8. The resulting precipitate was thoroughly washed and dried at 80°C. Finally, the dried product was calcined at 400 °C for 3 hours to obtain nickel oxide nanoparticles (NiO NPs).
2.2. Preparation of Sensors
In this stage, the airbrushing technique was employed to decorate nitrogen-doped reduced graphene oxide (N-rGO) with nickel oxide nanoparticles (NiO NPs). The sensor fabrication process is illustrated in Figure 1. To begin, 5 mg of N-rGO powder was dispersed in 10 mL of ethanol and subjected to ultrasonication for 1 hour to create a stable suspension. Separately, 5 mg of NiO NPs was dispersed in 10 mL of ethanol. The deposition process was carried out using airbrushing at a temperature of approximately 55 °C, with nitrogen (N₂) serving as the carrier gas. Initially, the N-rGO suspension was airbrushed onto platinum screen-printed electrodes (alumina substrates from CeramTech GmbH) as chemiresistive gas sensor. Subsequently, NiO NPs were deposited onto the N-rGO layer to complete the decoration process [2]. The film resistance was monitored continuously using a multimeter, ensuring improved reproducibility across devices. The final thickness of the deposited sensing layers was measured to be 50 ± 5 μm.
2.3. Gas sensing measurements
In the final stage of the experiment, the as-fabricated NiO/N-rGO sensors were positioned within an airtight Teflon test chamber with a volume of 35 cm³, designed with two openings to accommodate UV lamps. The chamber was equipped with an inlet for gas delivery and an outlet connected to an exhaust system. The entire setup was integrated into a fully automated gas flow measurement system capable of supplying diluted gas mixtures via mass flow controllers (Bronkhorst High-Tech B.V.). For gas sensing experiments, calibrated gas cylinders balanced in dry synthetic air (Air Premier, purity: 99.999%) were utilized. The sensors' operating temperatures were regulated by connecting their meander heaters to an external power supply (Agilent U8002A).
The sensor responses were recorded using an Agilent 34972A data acquisition system, which continuously monitored the resistance of the sensing materials during exposure to varying concentrations of target gases, including NO₂, ethanol, NH₃, and CO₂. Additionally, the effect of humidity on sensor performance was assessed using a controller evaporator mixer (CEM) to generate a controlled humidity level of 70% RH, simulating real environmental conditions at the optimal operating temperature. The overall gas sensing measurement setup is illustrated in Figure 2.
To optimize power consumption and simulate realistic testing conditions, the total gas flow rate was maintained at a low rate of 100 mL/min. Before measurements, the sensors were stabilized under synthetic dry air for 1 hour at both room temperature and 100°C. Following stabilization, the sensors were exposed to the target gases diluted in synthetic dry air for 15 minutes, followed by a 1-hour recovery period in pure dry air. Throughout the measurements, the temperature inside the test chamber was maintained at 25°C, with a residual ambient humidity of 4% relative humidity (R.H.), equivalent to approximately 1250 ppm of water vapor.
Sensor response, R (%), was defined as follows:
R (%) = [(R0-R)/R0] x 100 (Oxidizing gas)
R (%) = [(R-R0)/R0] x 100 (Reducing gas)
where R0 is the resistance under dry air, and R is the resistance measured during exposure to the target gas.
2.4. Material characterization
The morphological characteristics of the samples were examined using scanning electron microscopy (SEM) with a Quanta 450 instrument from FEI. Furthermore, transmission electron microscopy (TEM) imaging was performed using an ultra-high-resolution transmission electron microscope (UHR-TEM), specifically the Libra® 200MC model. Structural analysis was carried out through X-ray diffraction (XRD) measurements using the Shimadzu Corporation LabX XRD-600 instrument, equipped with CuKα radiation (λ = 1.54056 Å). The XRD patterns were recorded at room temperature over a 2θ range of 10° to 80°. Raman spectroscopy was employed to analyze the structural features of the samples within a wavelength range of 100–3000 cm⁻¹, using a Renishaw inVia Raman Microscope.
3. Results
3.1. Characterization
SEM micrographs provide detailed insights into the morphological characteristics of N-rGO and NiO NPs, and NiO/N-rGO deposited film. As shown in Figure 3a, N-rGO exhibits a distinctive folded 2D graphene flake structure, reflecting the effects of the reduction and nitrogen doping processes [14]. The observed wrinkles and corrugations are likely due to the intercalation of nitrogen atoms within the graphene layers [9]. In contrast, the NiO surface, presented in Figure 3b, reveals a distribution of spherical nanoparticles with comparable sizes. Figure 3c confirms the successful attachment of the deposited NiO NPs onto N-rGO sensing film. This is further supported by TEM analysis results.
Figure 4 showcases the detailed morphological analysis of N-rGO and NiO/N-rGO using High-Resolution Transmission Electron Microscopy (HRTEM), supported by Energy Dispersive Spectroscopy (EDS) data (additional EDS results are provided in Figure S1, supporting information). To prepare the samples, a copper grid was immersed in a NiO/N-rGO suspension dispersed in ethanol and treated with ultrasonication to ensure even distribution.
The HRTEM image in Figure 4a reveals the characteristic two-dimensional nanostructures of graphene, displaying thin, flake-like layers folded around darker regions. In contrast, Figure 4b,c illustrate the successful and uniform decoration of nickel oxide nanoparticles across the N-rGO surface. The NiO nanoparticles exhibit a nanocrystalline structure with an interplanar spacing of 2.28 Å, corresponding to the (200) plane. This spacing, slightly offset by approximately 0.2 nm compared to the standard value (ICDD card number: 73-1519), is attributed to lattice distortions induced by interactions with the N-rGO substrate, as confirmed by XRD analysis [31].
The oxygen functional groups and nitrogen dopants present on the N-rGO surface serve as active sites for heterogeneous nucleation, enabling the formation of densely packed and monodisperse nickel oxide nanoparticles [32]. This distinctive morphological configuration of the NiO/N-rGO hybrid not only highlights the structural integrity of the material but also emphasizes its enhanced reactivity, making it a promising candidate for NO₂ gas sensing applications.
Figure 5a shows the XRD diffractograms for the NiO, N-rGO, and GO samples. The X-ray diffraction (XRD) pattern of the nanocomposite displays distinctive broad peaks, which are localized at 37.08° (111), 43.32° (200), 62.75° (220) and 75.15° (311) [35,36]. These diffraction peaks correspond to the ones observed in the case of NiO nanoparticles. They match with a cubic phase of NiO (ICDD card number: 73-1519), with a lattice constant a = 4.168Å belonging to Fm-3m space [35]. Conversely, the diffractogram of GO displays a broad peak at about 2θ = 11° (001). This peak indicates the presence of oxygen functional groups in the GO structure after the oxidation of graphite [36]. Nevertheless, this distinctive peak of GO vanishes completely in the XRD pattern of N-rGO nanomaterial, and a new characteristic peak appears at 25° (002), This means that most of the oxygen-containing groups in GO were efficiently eliminated after the reduction and doping with nitrogen [37]. This also indicates that the π-conjugated structure of graphene has been restored considerably at the produced rGO.
Raman spectroscopy, a vital technique for identifying structural fingerprints, was utilized to gain detailed insights into the structural characteristics of samples. Figure 5b depicts the Raman spectra of N-rGO, NiO, and NiO/N-rGO nanomaterials within the range of 250 to 2500 cm⁻¹. The N-rGO spectrum exhibits a D band at 1339 cm⁻¹ and a G band at 1570 cm⁻¹ [38]. The intensity ratio of the D band to the G band (Iᴅ/Iɢ) indicates a higher intensity of the D band, confirming the presence of structural defects associated with oxygen functional groups and nitrogen doping. [9]. In the case of NiO, two prominent peaks are observed at 518 cm⁻¹ and 1058 cm⁻¹, corresponding to the Ni-O stretching mode (1LO) and the two-phonon vibration mode (2LO), respectively [39]. The 1LO mode represents the longitudinal optical phonon vibrations of atoms within the crystal lattice, while the 2LO mode involves the simultaneous vibration of two phonons [40]. The Raman spectrum of the NiO/N-rGO nanocomposite integrates all characteristic peaks from both NiO and N-rGO, highlighting the successful formation of the composite material. Additionally, the peak at 518 cm⁻¹ is asymmetric, featuring a shoulder on the left side around 400 cm⁻¹, corresponding to the 1TO peak of the first-order phonon. It is typically absent in an ideal cubic NiO structure. Its presence, however, is attributed to lattice distortions and defect states, resulting in non-stoichiometry within the Ni-O framework, such as nickel and oxygen vacancies. [41]
3.2. Gas sensing characterization
The as-fabricated N-rGO and NiO/N-rGO sensors were evaluated for nitrogen dioxide (NO₂) detection by monitoring their relative resistance changes when exposed to varying NO₂ concentrations. As seen in Figure 6a, initial gas sensing measurements were conducted at NO₂ concentration of 800 ppb under room temperature (RT), 100°C, and 150°C conditions over multiple cycles. The results underscore the significant role of operating temperature in enhancing the sensitivity and reliability of the NiO/N-rGO sensor for NO₂ detection. Upon exposure to NO₂, an oxidizing gas, both sensors exhibited behavior consistent with p-type semiconductors, characterized by a decrease in resistance (Figure 6b,c). This response aligns with previous studies on NO₂ sensing [9] , where the adsorption of NO₂ molecules onto the N-rGO surface triggers charge transfer. Specifically, NO₂ molecules accept electrons from the N-rGO, leading to a reduction in resistance. Both sensors demonstrated stable and reproducible responses to the target gas, with effective baseline recovery after each exposure cycle.
At room temperature, while both sensors exhibited resistance changes (Figure S2), these changes were not distinguishable from baseline drift. The response magnitudes of the as-fabricated N-rGO and NiO/N-rGO sensors were calculated as 5.71% and 7.28%, respectively. This indicates that the incorporation of NiO nanoparticles into N-rGO offers limited improvement in response performance at room temperature. This modest enhancement is attributed to the high activation energy required for the NiO/N-rGO sensor [42]. In contrast, when operated at 100°C, both sensors demonstrated significantly improved responses and a more stable resistance baseline (Figure 6b,c). The calculated responses were 7.28% for N-rGO and 28.25% for NiO/N-rGO. Notably, the NiO/N-rGO sensor exhibited a response magnitude approximately three times higher than that observed at room temperature, indicating a substantial enhancement in sensing performance. This improved response is ascribed to the low activation energy of the NiO/N-rGO sensor influenced by the rise in temperature [42]. However, at 150°C (Figure S2), both sensors exhibited a decreased response to NO₂ gas, further confirming that the optimal operating temperature for achieving excellent sensing performance is 100°C.
The dynamic resistance changes of the as-fabricated sensors were further recorded across a wide range of NO₂ gas concentrations 50, 100, 250, 500, 800, and 1000 ppb at an operating temperature of 100°C, as illustrated in Figure 7a,b. The calculated responses for the N-rGO sensor were 1.18%, 1.75%, 3%, 5.9%, 7.28%, and 7.56%, respectively, while the NiO/N-rGO sensor demonstrated responses of 10%, 12.42%, 15.8%, 22.1%, 28.25%, and 33.63%, respectively. Both sensors exhibited stable and reproducible sensing responses, as evidenced by their small standard deviation errors on the order of 10⁻⁴ [43].
Notably, as depicted in Figure 7c, both sensors demonstrated the capability to detect NO₂ concentrations below 50 ppb, a value significantly lower than the threshold limit of 0.2 ppm (200 ppb) for an 8-hour time-weighted average (TWA) recommended by the American Conference of Industrial Hygienists (ACGIH). The NiO/N-rGO sensor showed a noticeably enhanced response for each exposure to NO₂, outperforming the N-rGO sensor by approximately five orders of magnitude. This significant improvement highlights the remarkable influence of NiO nanoparticles on enhancing the responsiveness of the N-rGO sensing film to NO₂ gas.
The enhanced sensing performance of the NiO/N-rGO sensor can be attributed to the large surface area of the NiO/N-rGO nanohybrids, which promotes efficient charge carrier transfer between NO₂ molecules and the hybrid material. Additionally, XRD and Raman's analysis confirmed the excellent crystallinity of NiO, along with the presence of oxygen vacancies, which may enhance electron mobility and strengthen NiO–NO₂ interactions [44]. This synergistic effect highlights the significant role of NiO nanoparticles in improving gas sensing capabilities, particularly for the detection of trace levels of NO₂.
The sensitivity and limit of detection (LOD) are calculated following the expression shown below:
where b is the slope of the calibration curve (sensitivity) and RMSnoise is the root-mean-square deviation at the baseline [45]. As demonstrated in Table 1, the as-fabricated NiO/N-rGO sensor exhibits significantly improved sensitivity and a lower limit of detection (LOD) (< 1 ppb) compared to its pristine N-rGO counterpart. This enhancement underscores the pivotal role of NiO nanoparticles in augmenting the gas-sensing properties of N-rGO, particularly for NO₂ detection.
The gas sensing performance of N-rGO and NiO-decorated N-rGO was also evaluated for other gases, including CO₂, NH₃, and ethanol. The typical resistance response dynamics for 100 ppm CO₂, 20 ppm ethanol, and 10 ppm NH₃ are presented in Figures S3, respectively (Supplementary Information). A summary of the sensing results for each gas is provided in the histogram in Figure 8a. The results clearly demonstrate that the incorporation of NiO into N-rGO significantly enhances the response to NO₂ while effectively reducing cross-sensitivity to CO₂, NH₃, and ethanol. Even though, NiO was reported as a highly sensitive material for (VOCs) such as ethanol at high operating temperatures (300 °C<) [22]. Therefore, this temperature range is unsuitable for the current application. Operating at such high temperatures could compromise the stability of the N-rGO film and contradict the goal of achieving low power consumption for the device [46].
Ambient moisture interference is a critical parameter in evaluating the sensitivity of gas sensors under working conditions. To investigate this, the prepared sensors were tested in a highly humid environment (70% RH) at 100 °C, alongside an 800 ppb NO₂ concentration. As shown in Figure 8b, the N-rGO sensor exhibited an increased response to ambient moisture, rising from 7.28% under dry conditions to 13.89% at 70% RH. In contrast, the NiO/N-rGO sensor showed a decreased response in the humid environment compared to its dry condition response of 23.26%.
This observation suggests that the p-type sensitivity of N-rGO improves in the presence of NO₂, likely due to water molecules promoting the adsorption of NO₂ through redox reactions. During this process, nitrogen dioxide dissociates into NO₂⁻ and H⁺ ions, facilitating the movement of H⁺ protons. This proton mobility decreases the resistance, resulting in an enhanced electrical response [47]. On the other hand, the notable decrease in sensitivity for the NiO/N-rGO sensor under high humidity can be attributed to two factors. Firstly, the presence of water molecules inhibits the chemisorption of oxygen molecules by covering the surface of NiO/N-rGO with adsorbed moisture. Secondly, the interaction of water molecules with oxygen species leads to the formation of hydroxyl groups on the sensor surface, which partially hinders the adsorption of NO₂ molecules. These factors significantly alter the sensor's resistance and diminish its response to NO₂ gas in a highly humid environment [48,49].
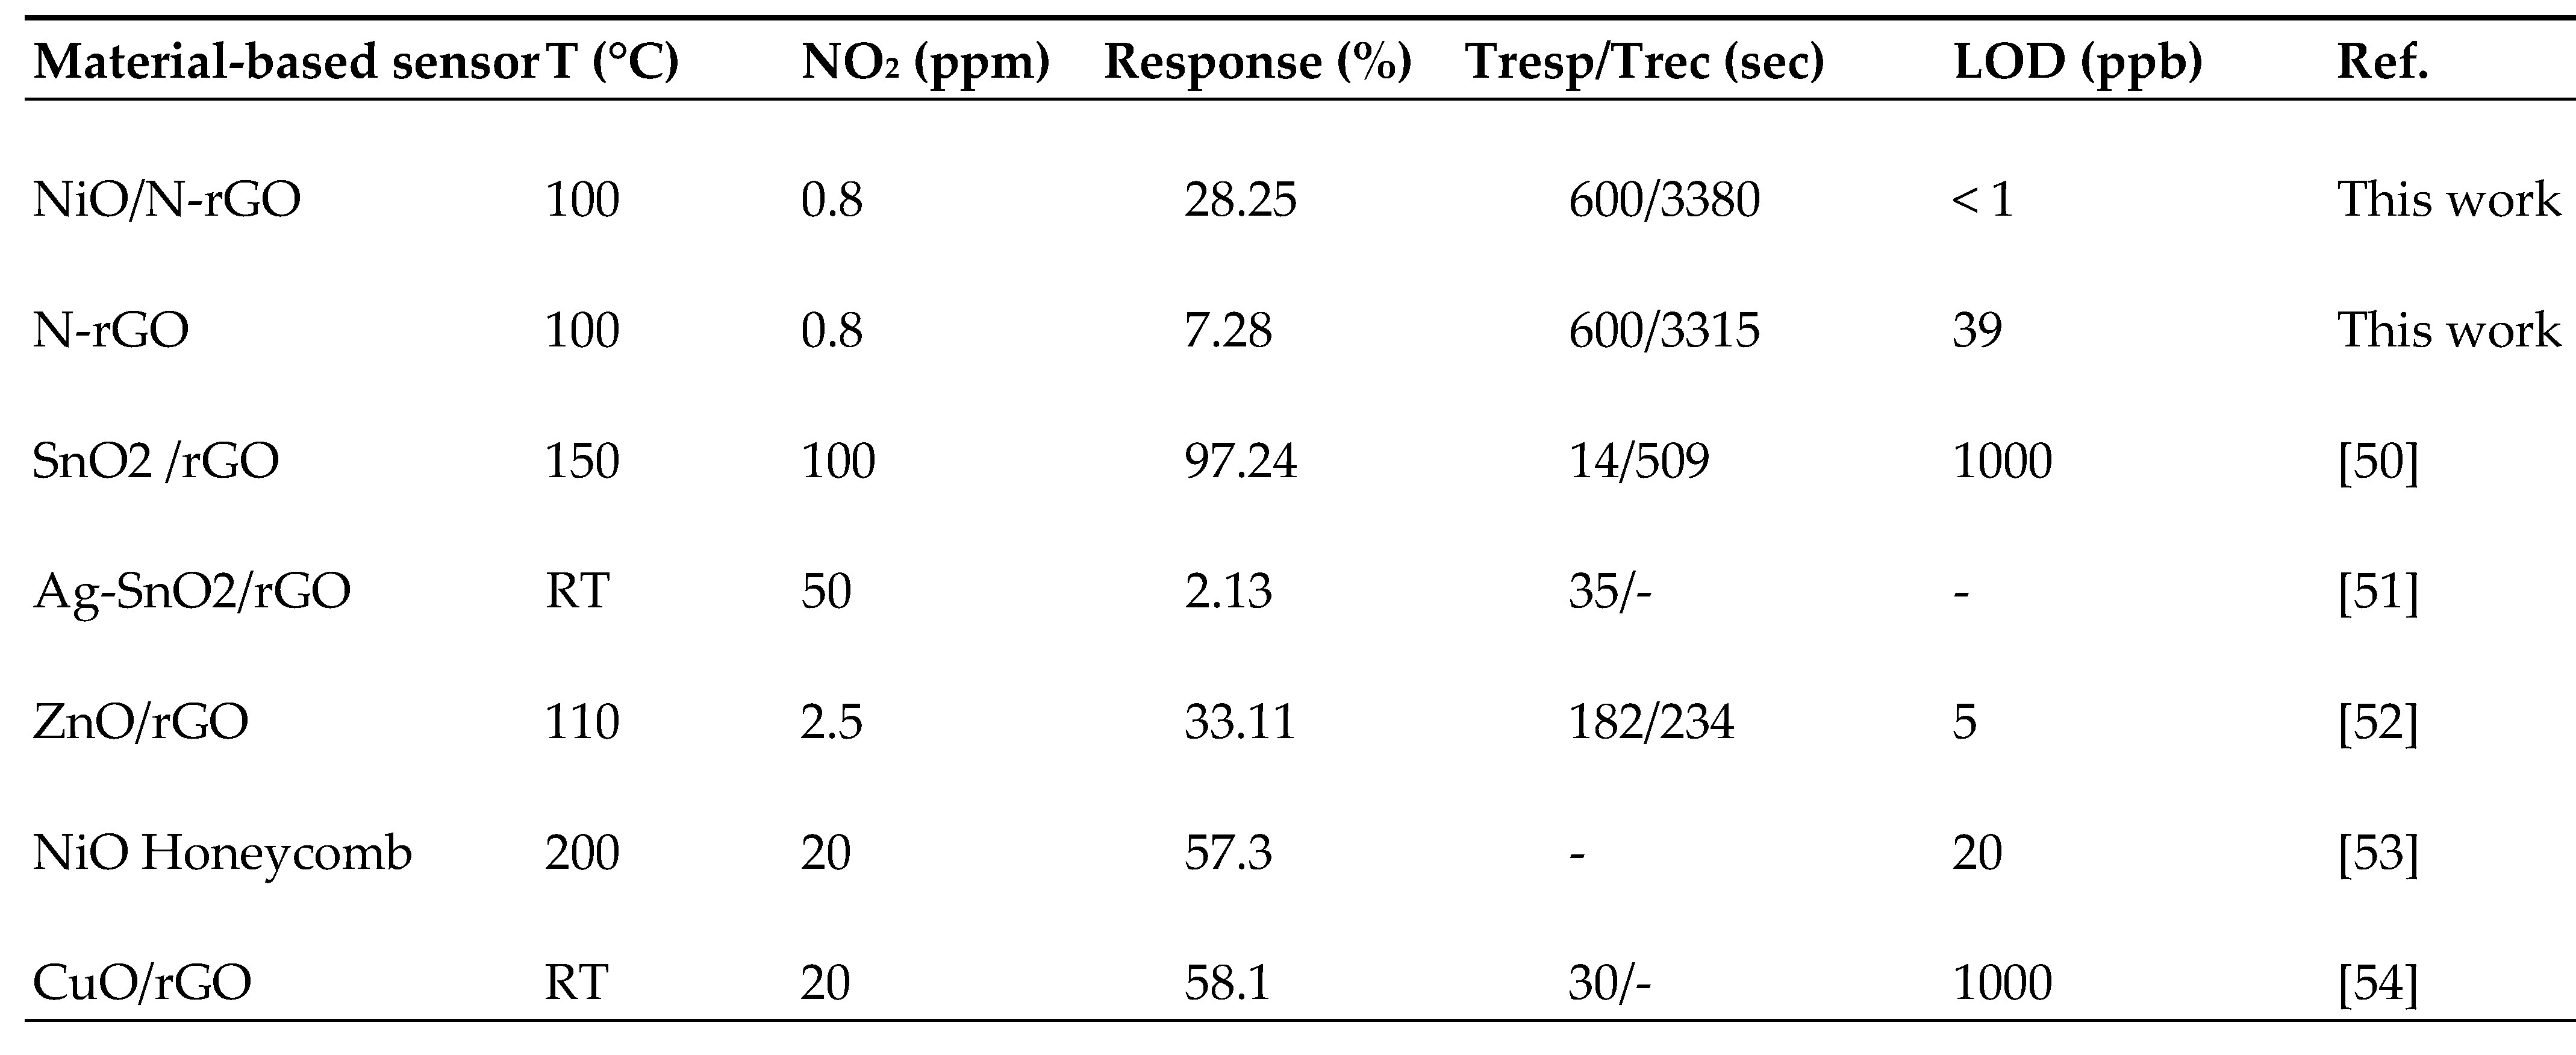
As presented in Table 2, the as-fabricated NiO/N-rGO sensor exhibits a markedly superior response to trace levels of NO₂ gas compared to previously reported MO/graphene-based sensors. This improvement emphasizes the effectiveness of the synergistic interaction between nitrogen-doped reduced graphene oxide and nickel oxide nanoparticles in enhancing NO2 gas sensing performance.
4. Discussion
The interaction mechanism between the NiO/N-rGO sensing film and NO₂ gas molecules is further elucidated in Figure 9.
To begin, it is essential to describe the systematic interaction between pristine N-rGO and NO₂ molecules. Upon exposure to an oxidizing gas like NO₂, the resistance curves exhibit a p-type response, consistent with the intrinsic behavior of reduced graphene oxide (rGO) as a p-type semiconductor [55]. Nitrogen doping, as an element from Group V, enhances n-type conduction in rGO by incorporating pyrrolic, pyridinic, and graphitic bonds within the graphene basal plane as well as donates one p-electron to the aromatic π system [10]. This nitrogen doping introduces excess electrons, promoting stronger interactions with NO₂. Furthermore, nitrogen atoms can bind with the oxygen atoms of NO₂ molecules [56]. In contrast, this study demonstrates that N-rGO exhibits a p-type response toward NO₂, confirming its p-type semiconducting behavior. This phenomenon can be attributed to the interaction between NO₂ molecules and the aromatic π-system of N-rGO, where nitrogen dopants (as verified by EDS analysis) play a crucial role. It is hypothesized that NO₂ molecules withdraw electrons from the π-system at the nitrogen-doped sites, thereby reinforcing the p-type semiconducting behavior of N-rGO. As a result, when N-rGO reacts with NO₂, its Fermi level shifts closer to the valence band, increasing the number of holes in the valence band and thus causing a significant decrease in sensor resistance upon exposure to nitrogen dioxide.
Turning to the NiO/N-rGO sensing film mechanism, Figure 9 illustrates the sequential interactions. Initially, as shown in Figure 9a, when the sensing film is exposed to air, oxygen molecules are adsorbed onto the surface of NiO nanoparticles (NPs). At an operating temperature of 100°C, these oxygen molecules are ionized into O₂⁻ and O⁻ species. On the p-type NiO surface, these ionized oxygen species attract the majority carriers (holes), forming a well-defined Hole Accumulation Layer (HAL).
In the presence of NO₂ gas, as depicted in Figure 9b, the adsorbed NO₂ molecules act as strong electron acceptors and capture electrons from the p-type NiO, forming NO₂⁻. This process significantly increases the hole concentration in the NiO NPs, leading to an expansion of the HAL. Consequently, the potential barrier height decreases due to the high electron affinity of NO₂, which surpasses that of oxygen.
Furthermore, as illustrated in Figure 9c, the hybrid configuration of N-rGO sheets and NiO nanoparticles facilitates the formation of a p-p junction. N-rGO may donate electrons to the NiO NPs, enhancing the binding with NO₂ and O₂ and further widening the depletion layer [57]. Additionally, nitrogen-doped rGO contains active sites, such as nitrogen dopants not bound to NiO NPs, which provide further interaction opportunities with NO₂ gas. N-rGO also serves as an efficient charge transport channel due to its high carrier mobility, enabling faster electron transfer to the electrodes for collection.
These attributes collectively endow the NiO/N-rGO nanohybrids with exceptional NO₂ sensing performance, enhanced sensitivity, stability, and carrier transport efficiency.
5. Conclusions
In summary, we have successfully prepared a NiO/N-rGO nanohybrids-based NO2 gas sensor based on an alumina transducer substrate using facile and inexpensive routes. The sensing material were widely investigated for their main structure and analyzed using SEM, TEM, XRD, and Raman techniques. Interestingly, NiO NPs were well attached to the surface of N-rGO, giving insights into the sensing mechanism, as confirmed by characterization results. Accordingly, the NiO/N-rGO sensor exhibited excellent sensitivity toward trace amounts of nitrogen dioxide (NO2) at a moderate operating temperature of 100°C. This represents the first demonstration of a high-yield synthesis technique that produces NiO/N-rGO nanohybrids, which can be readily deposited on a wide range of substrate materials. At the first test, the sensor showed a very high selectivity toward NO2 (the other gaseous species tested were CO2, ethanol, and NH3). Consequently, NiO NPs proved their potentiality in boosting the sensitivity of N-rGO toward NO2 gas, thanks to the created p-p junctions that facilitate carrier conduction, as explained by the underlying sensing mechanism. The nanomaterial presented robust performances such as high sensitivity and very low limit of detection, showing high prospects for being integrated the next generation of advanced chemoresistive sensors.
Supplementary Materials
The following supporting information can be downloaded at the website of this paper posted on Preprints.org. Figure S1: EDS analysis of (a,b) N-rGO and (c,d) NiO/N-rGO.; Figure S2: Resistance curves of N-rGO and NiO/N-rGO sensors toward 800 ppb of NO2 at room temperature and 150°C. Figure S3: Resistance curves of N-rGO and NiO/N-rGO sensors toward 20 ppm ethanol, 100 ppm of CO2, and 10 ppm NH3 at 100°C.
Author Contributions
Conceptualization, M.B.A.; M.F.N. and E.L..; methodology, C.W.; validation, E.L..; formal analysis, C.W.; investigation, C.W.; resources, M.B.A.; M.F.N. and E.L.; data curation, C.W..; writing—original draft preparation, C.W..; writing—review and editing, M.B.A.; M.F.N. and E.L..; visualization, C.W.; supervision, M.B.A.; M.F.N. and E.L..; funding acquisition, M.B.A.; M.F.N. and E.L. All authors have read and agreed to the published version of the manuscript.
Funding
C. Walleni would like to thank the University of Sousse for its financial support. E. Llobet is supported by the Catalan Institution for Research and Advanced Studies (ICREA) via the 2023 Edition of the ICREA Academia Award.
Data Availability Statement
Data can be obtained from the authors upon request.
Conflicts of Interest
The authors declare no conflicts of interest.
References
- H. Salonen, T. Salthammer, and L. Morawska, Environ Int 130, 104887 (2019).
- I. Manisalidis, E. Stavropoulou, A. Stavropoulos, and E. Bezirtzoglou, Front Public Health 8, (2020).
- H. Mei, F. Zhang, T. Zhou, and T. Zhang, Sensors 24, 7188 (2024).
- P. Recum and T. Hirsch, Nanoscale Adv 6, 11 (2024).
- A. Sharma, S. B. Eadi, H. Noothalapati, M. Otyepka, H.-D. Lee, and K. Jayaramulu, Chem Soc Rev 53, 2530 (2024).
- J. Ma, M. Zhang, L. Dong, Y. Sun, Y. Su, Z. Xue, and Z. Di, AIP Adv 9, (2019).
- W. Yuan and G. Shi, J Mater Chem A Mater 1, 10078 (2013).
- R. Ghosh, M. Aslam, and H. Kalita, Mater Today Commun 30, 103182 (2022).
- C. Walleni, S. B. Malik, G. Missaoui, M. A. Alouani, M. F. Nsib, and E. Llobet, ACS Omega (2024).
- 1H. Wang, T. Maiyalagan, and X. Wang, ACS Catal 2, 781 (2012).
- W. Ouyang, D. Zeng, X. Yu, F. Xie, W. Zhang, J. Chen, J. Yan, F. Xie, L. Wang, H. Meng, and D. Yuan, Int J Hydrogen Energy 39, 15996 (2014).
- A. Ariharan, B. Viswanathan, and V. Nandhakumar, Graphene 06, 41 (2017).
- M. Shaik, V. K. Rao, M. Gupta, K. S. R. C. Murthy, and R. Jain, RSC Adv 6, 1527 (2016).
- Y.-S. Chang, F.-K. Chen, D.-C. Tsai, B.-H. Kuo, and F.-S. Shieu, Sci Rep 11, 20719 (2021).
- A. Mirzaei, S. P. Bharath, J.-Y. Kim, K. K. Pawar, H. W. Kim, and S. S. Kim, Chemosensors 11, 334 (2023).
- C. Wang, L. Yin, L. Zhang, D. Xiang, and R. Gao, Sensors 10, 2088 (2010).
- S. Yang, G. Lei, H. Xu, Z. Lan, Z. Wang, and H. Gu, Nanomaterials 11, 1026 (2021).
- S. Masroor, in Inorganic Anticorrosive Materials (Elsevier, 2022), pp. 85–94.
- N. Khomarloo, E. Mohsenzadeh, H. Gidik, R. Bagherzadeh, and M. Latifi, RSC Adv 14, 7806 (2024).
- G. F. Fine, L. M. Cavanagh, A. Afonja, and R. Binions, Sensors 10, 5469 (2010).
- S. Yang, G. Lei, H. Xu, Z. Lan, Z. Wang, and H. Gu, Nanomaterials 11, 1026 (2021).
- S. K. Ayyala and J. A. Covington, Chemosensors 9, 247 (2021).
- M. P. Deshpande, K. N. Patel, V. P. Gujarati, K. Patel, and S. H. Chaki, Adv Mat Res 1141, 65 (2016).
- C. Walleni, N. Hamdaoui, S. B. Malik, M. F. Nsib, and E. Llobet, SSRN (2023).
- A. A. Khaleed, A. Bello, J. K. Dangbegnon, M. J. Madito, F. U. Ugbo, A. A. Akande, B. P. Dhonge, F. Barzegar, D. Y. Momodu, B. W. Mwakikunga, and N. Manyala, J Mater Sci 52, 2035 (2017).
- T. Kamal, J Alloys Compd 729, 1058 (2017).
- S. Srirattanapibul, P. Nakarungsee, C. Issro, I.-M. Tang, and S. Thongmee, Mater Sci Semicond Process 137, 106221 (2022).
- S. Shanavas, T. Ahamad, S. M. Alshehri, R. Acevedo, and P. M. Anbarasan, Optik (Stuttg) 226, 165970 (2021).
- A. Shanmugasundaram, N. D. Chinh, Y.-J. Jeong, T. F. Hou, D.-S. Kim, D. Kim, Y.-B. Kim, and D.-W. Lee, J Mater Chem A Mater 7, 9263 (2019).
- R. Muzyka, M. Kwoka, Ł. Smędowski, N. Díez, and G. Gryglewicz, New Carbon Materials 32, 15 (2017).
- C. Xu, Y. Li, R. A. Adams, V. G. Pol, Y. Xiao, A. Varma, and P. Chen, J Alloys Compd 884, 160927 (2021).
- X. Li, A. Zhong, S. Wei, X. Luo, Y. Liang, and Q. Zhu, Electrochim Acta 164, 203 (2015).
- M. Salavati-Niasari, F. Davar, and Z. Fereshteh, J Alloys Compd 494, 410 (2010).
- J. P. Saikia, S. Paul, B. K. Konwar, and S. K. Samdarshi, Colloids Surf B Biointerfaces 78, 146 (2010).
- D. Deep Yadav, R. Jha, S. Singh, and A. Kumar, Mater Today Proc 73, 333 (2023).
- R. A. Rochman, S. Wahyuningsih, and A. H. Ramelan, IOP Conf Ser Mater Sci Eng 509, 012119 (2019).
- X. Duan, S. Indrawirawan, H. Sun, and S. Wang, Catal Today 249, 184 (2015).
- R. Beams, L. Gustavo Cançado, and L. Novotny, Journal of Physics Condensed Matter 27, (2015).
- N. Dharmaraj, P. Prabu, S. Nagarajan, C. H. Kim, J. H. Park, and H. Y. Kim, Materials Science and Engineering: B 128, 111 (2006).
- A. Kaschner, A. Hoffmann, and C. Thomsen, Phys Rev B 64, 165314 (2001).
- N. J. Usharani and S. S. Bhattacharya, Ceram Int 46, 5671 (2020).
- S.-Y. Chu, M.-J. Wu, T.-H. Yeh, C.-T. Lee, and H.-Y. Lee, Nanomaterials 13, 1064 (2023).
- S. B. Malik, F. E. Annanouch, R. D′Souza, C. Bittencourt, M. Todorović, and E. Llobet, ACS Appl Mater Interfaces 16, 48585 (2024).
- G. Tan, D. Tang, X. Wang, L. He, T. Mu, and G. Li, Int J Electrochem Sci 17, 220551 (2022).
- J. Li, Y. Lu, Q. Ye, M. Cinke, J. Han, and M. Meyyappan, Nano Lett 3, 929 (2003).
- R. Verma, M. S. Chauhan, S. Pandey, and A. Dandia, Heliyon 9, e17162 (2023).
- W. Yan, M. A. Worsley, T. Pham, A. Zettl, C. Carraro, and R. Maboudian, Appl Surf Sci 450, 372 (2018).
- X. Song, L. Li, X. Chen, Q. Xu, B. Song, Z. Pan, Y. Liu, F. Juan, F. Xu, and B. Cao, Sens Actuators B Chem 298, 126917 (2019).
- H. Bai, H. Guo, J. Wang, Y. Dong, B. Liu, Z. Xie, F. Guo, D. Chen, R. Zhang, and Y. Zheng, Sens Actuators B Chem 337, 129783 (2021).
- A. Choudhari, B. A. Bhanvase, V. K. Saharan, P. H. Salame, and Y. Hunge, Ceram Int 46, 11290 (2020).
- W. Yan, K. Zhu, Y. Cui, Y. Li, T. Dai, S. Cui, and X. Shen, J Alloys Compd 886, 161287 (2021).
- P. Cao, Y. Cai, D. Pawar, S. T. Navale, Ch. N. Rao, S. Han, W. Xu, M. Fang, X. Liu, Y. Zeng, W. Liu, D. Zhu, and Y. Lu, Chemical Engineering Journal 401, 125491 (2020).
- M. M. Gomaa, M. H. Sayed, V. L. Patil, M. Boshta, and P. S. Patil, J Alloys Compd 885, 160908 (2021).
- Jyoti and G. D. Varma, Applied Physics A 126, 143 (2020).
- M. A. Alouani, J. Casanova-Chafer, S. de Bernardi-Martín, A. García-Gómez, F. Salehnia, J. C. Santos-Ceballos, A. Santos-Betancourt, X. Vilanova, and E. Llobet, Chemosensors 12, 256 (2024).
Figure 1.
(a) Sensor preparation and (b) sensor device structure.
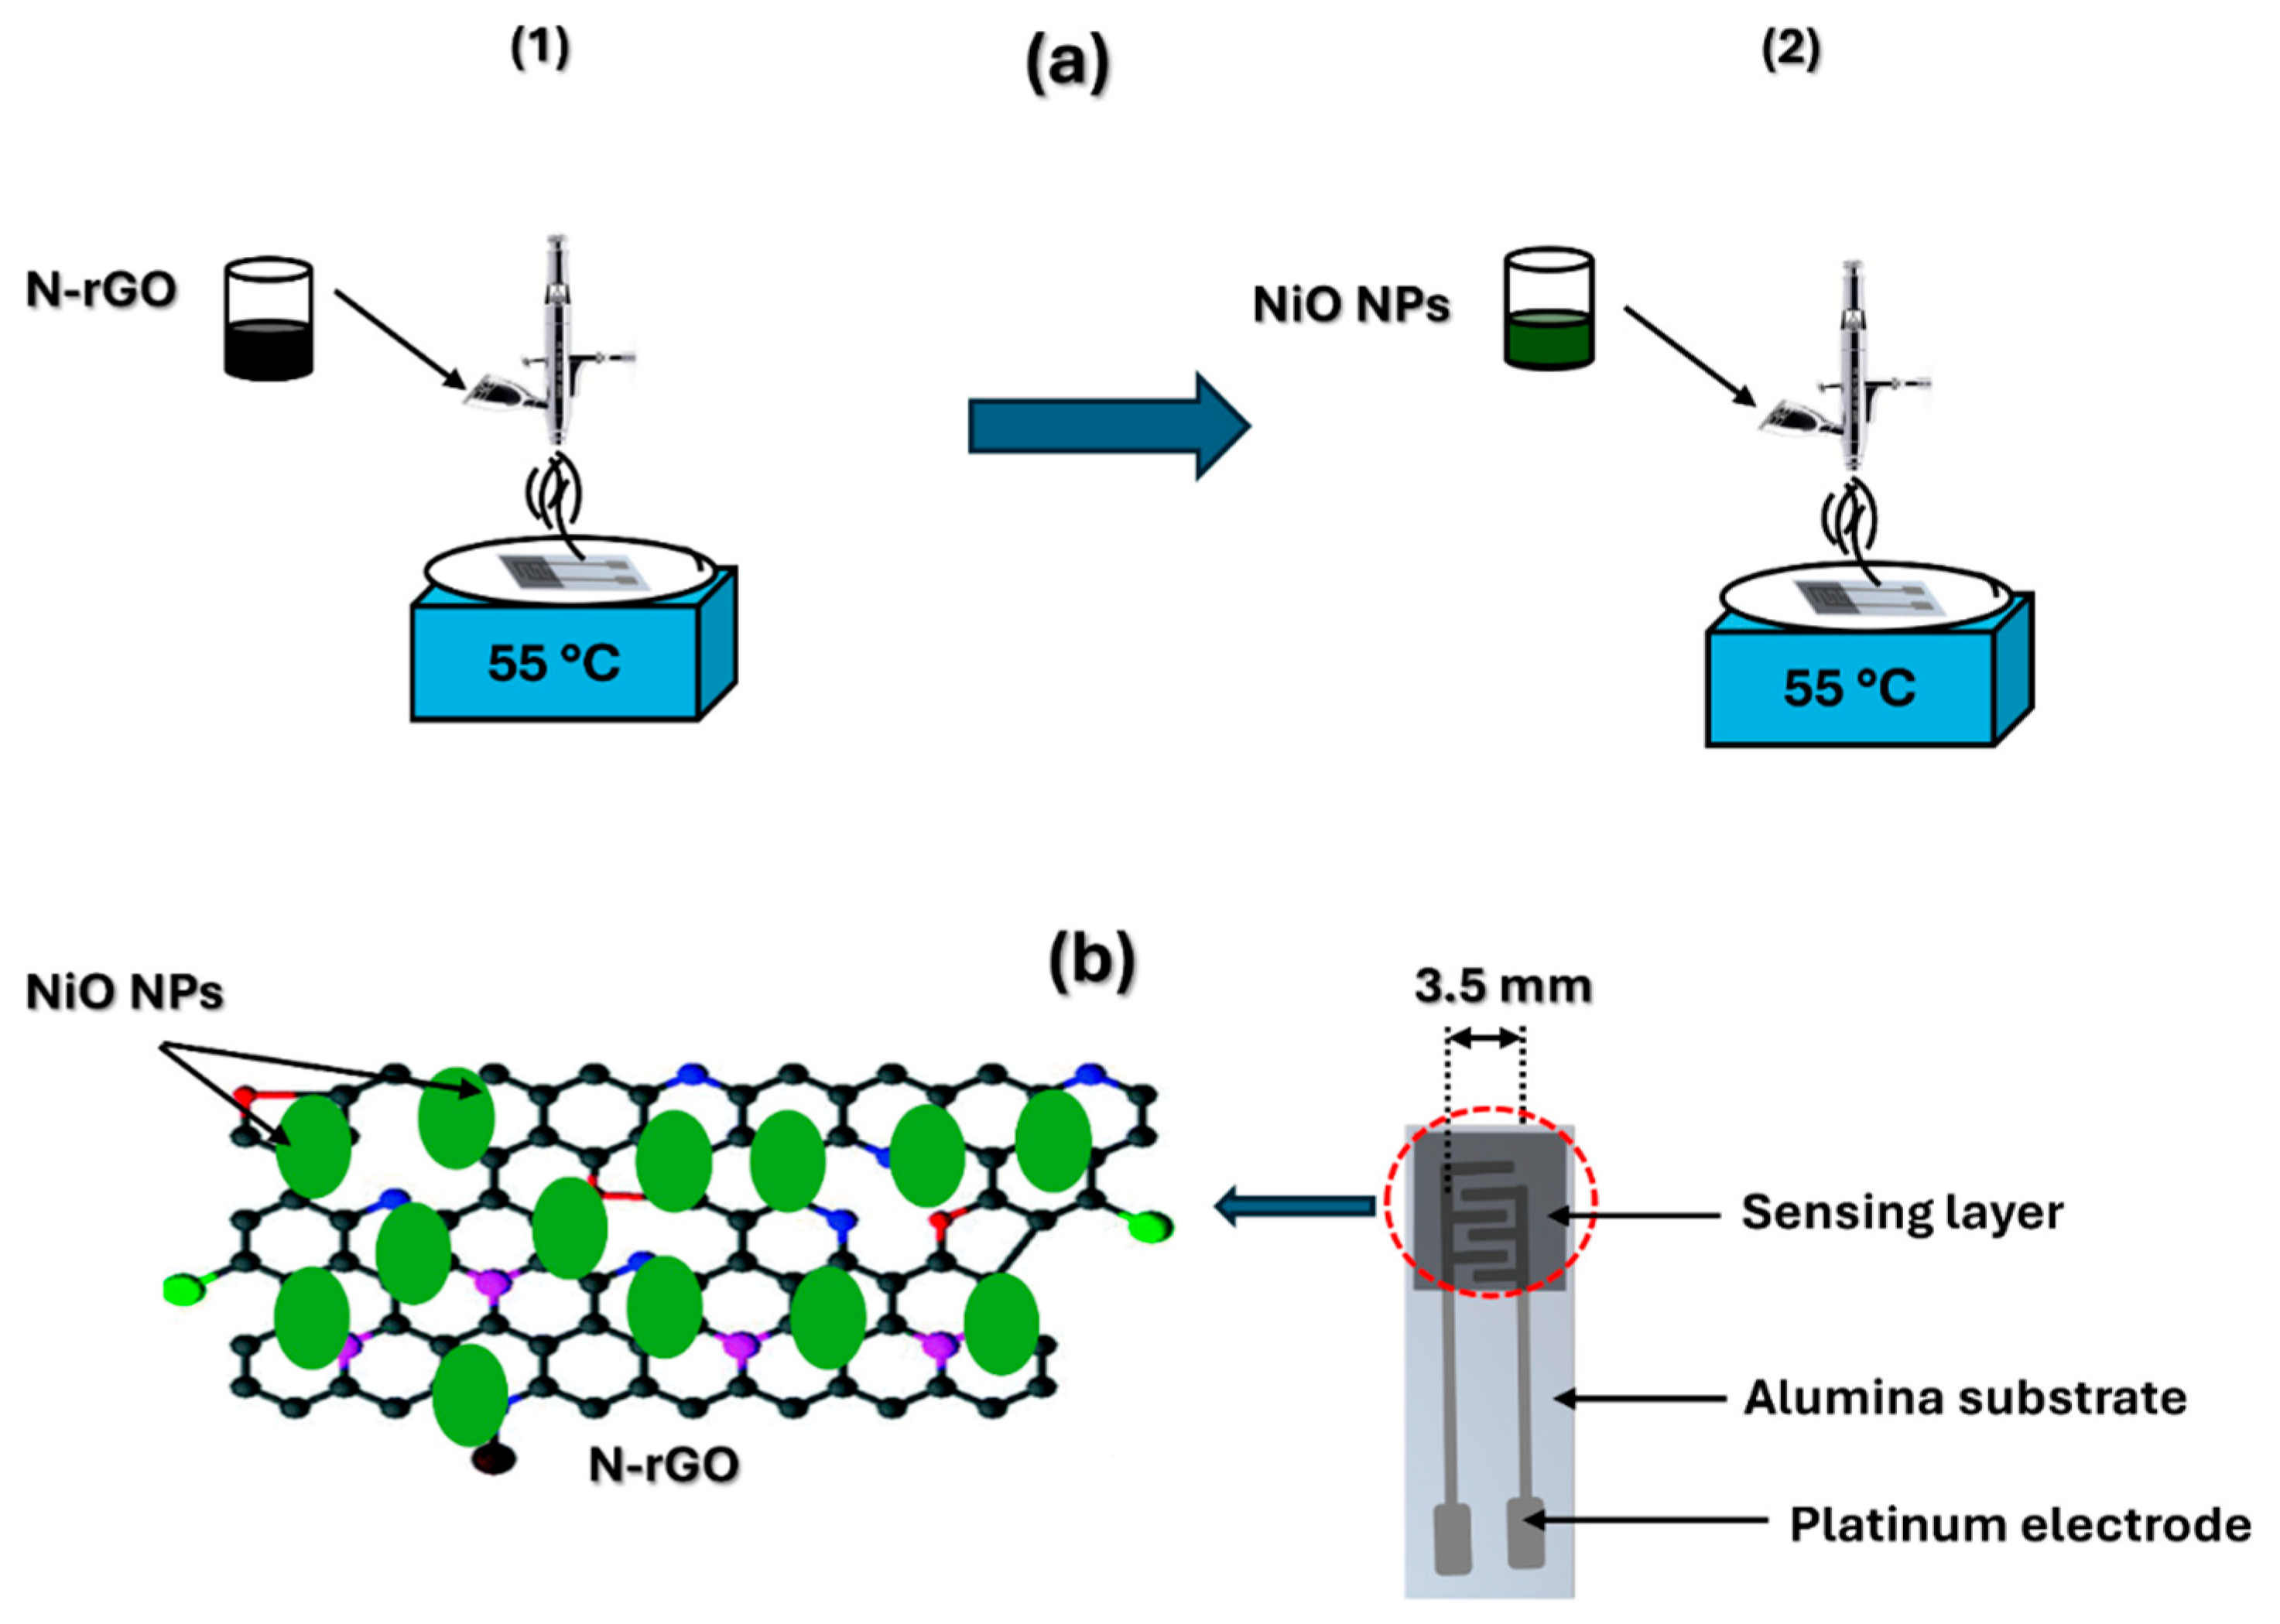
Figure 2.
Experimental set-up of gas sensing measurements.
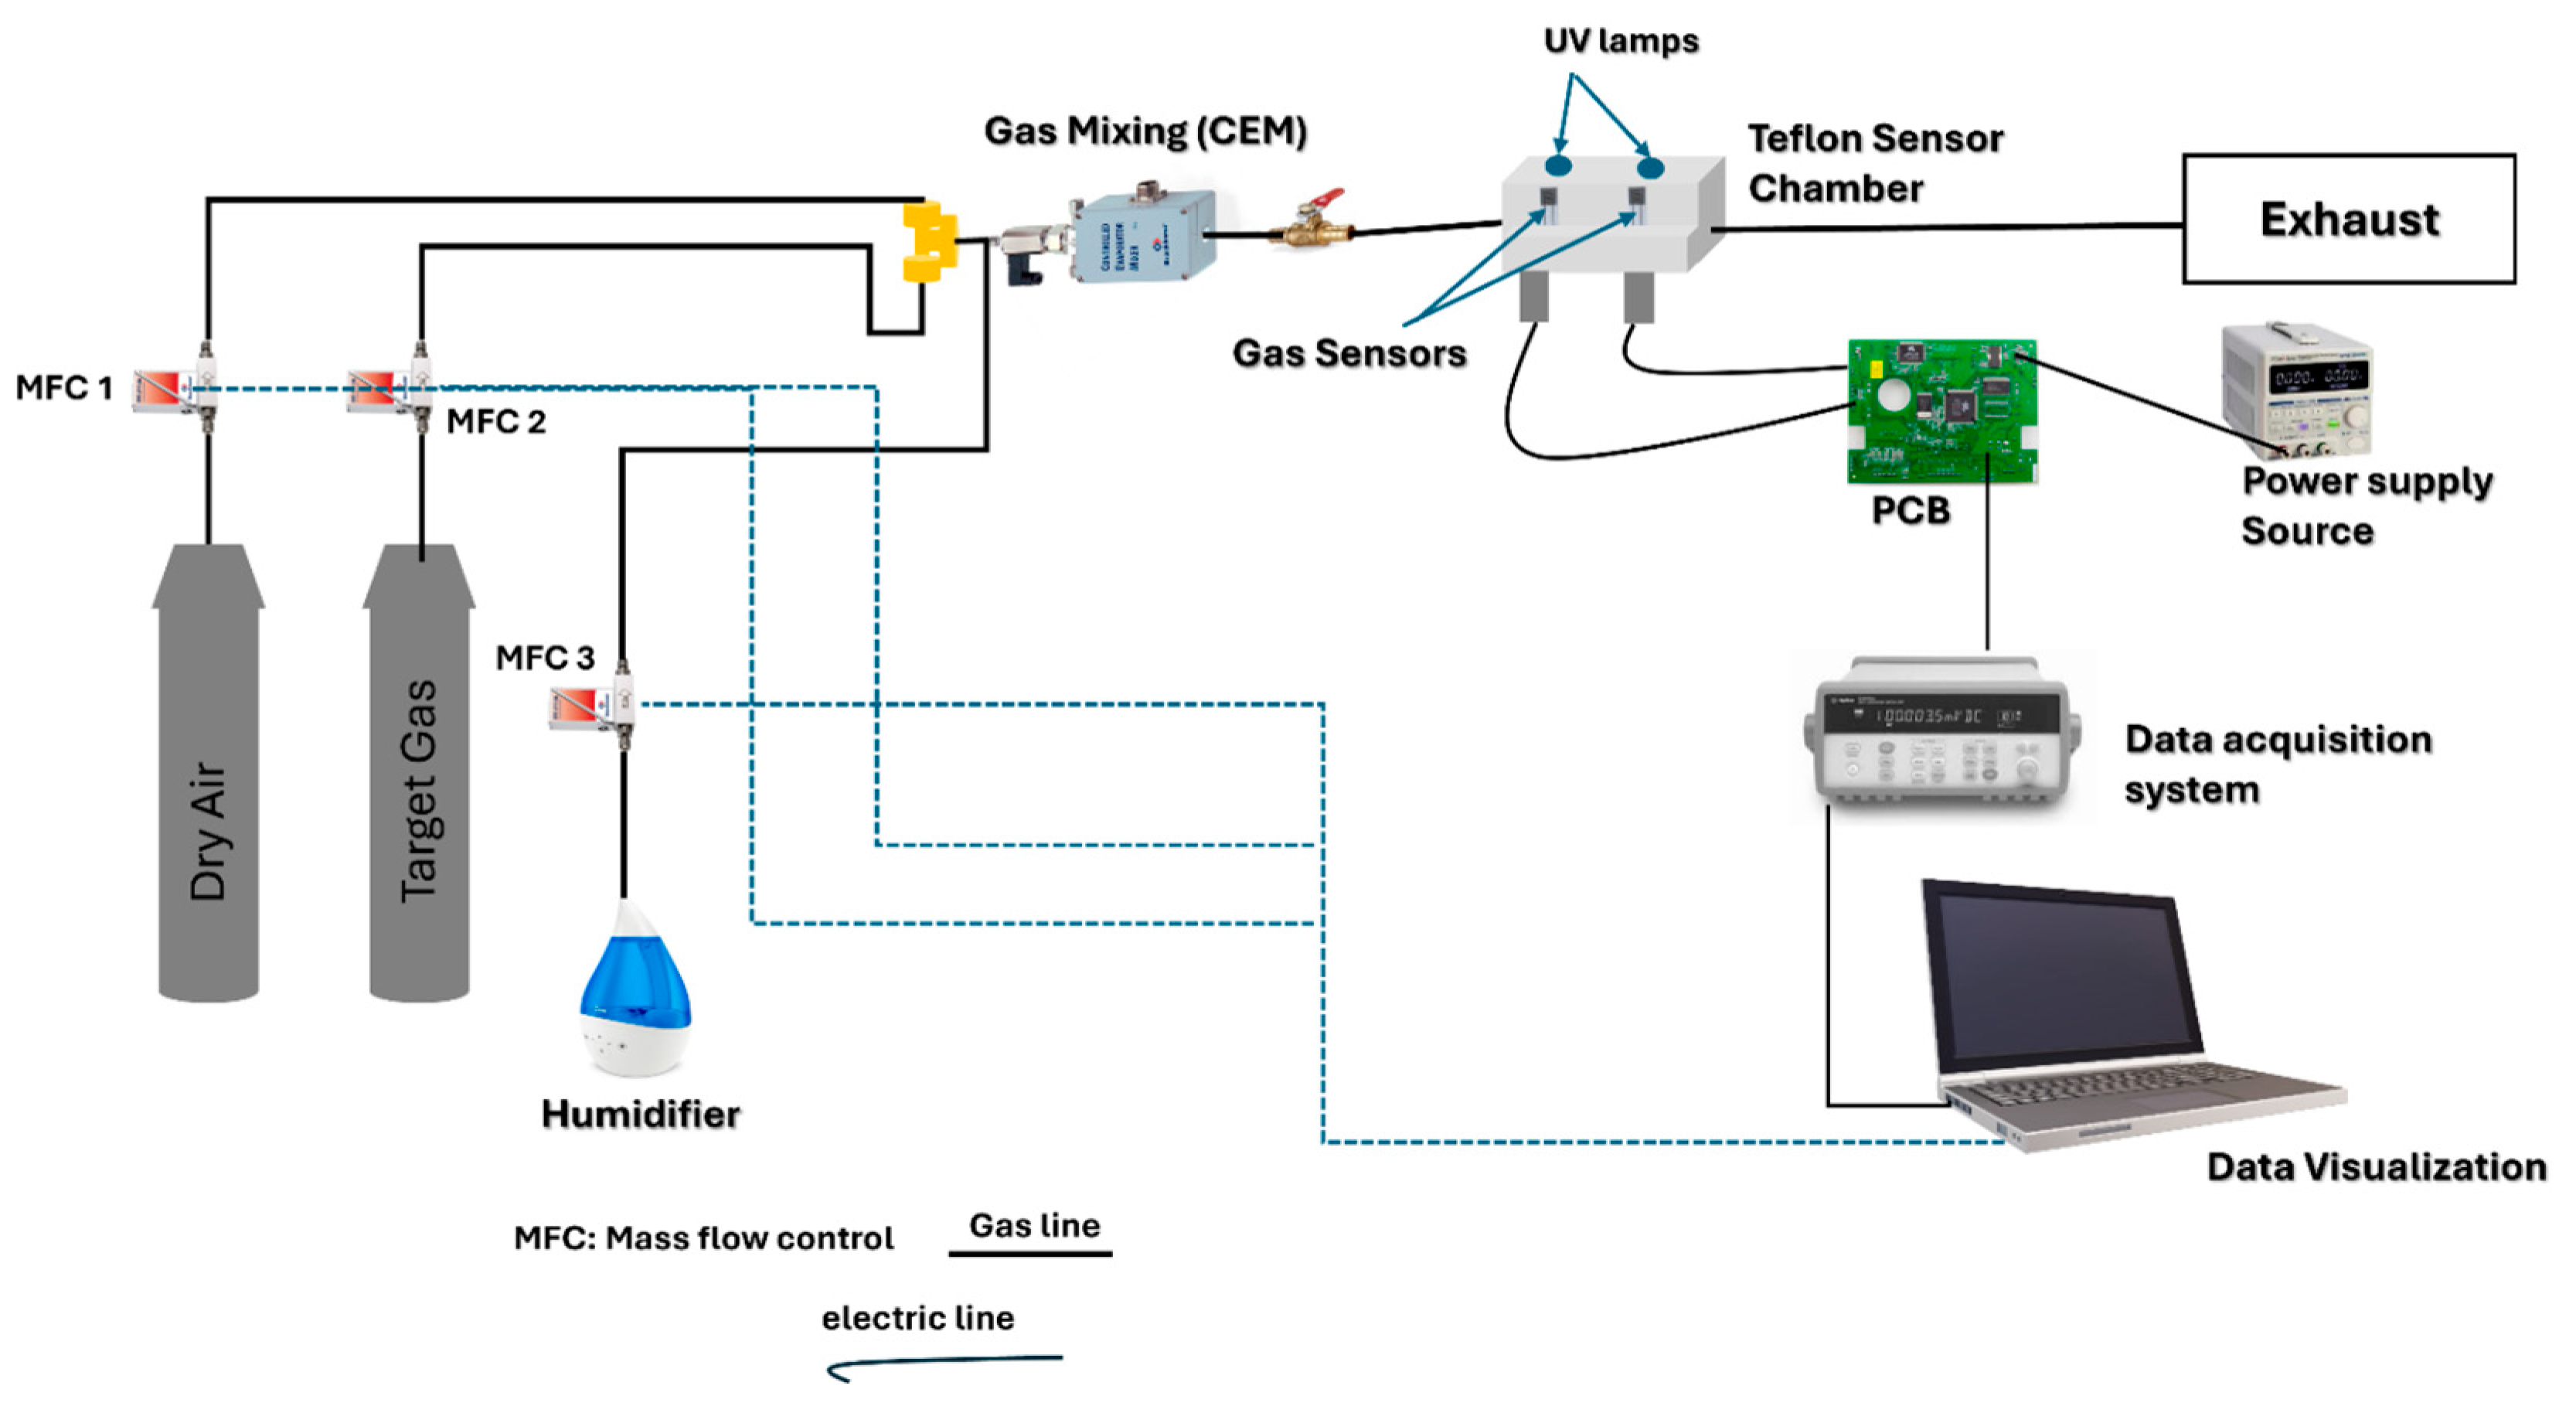
Figure 3.
SEM images of (a) N-rGO and (b) NiO nanoparticles. (c) NiO/N-rGO deposited film.
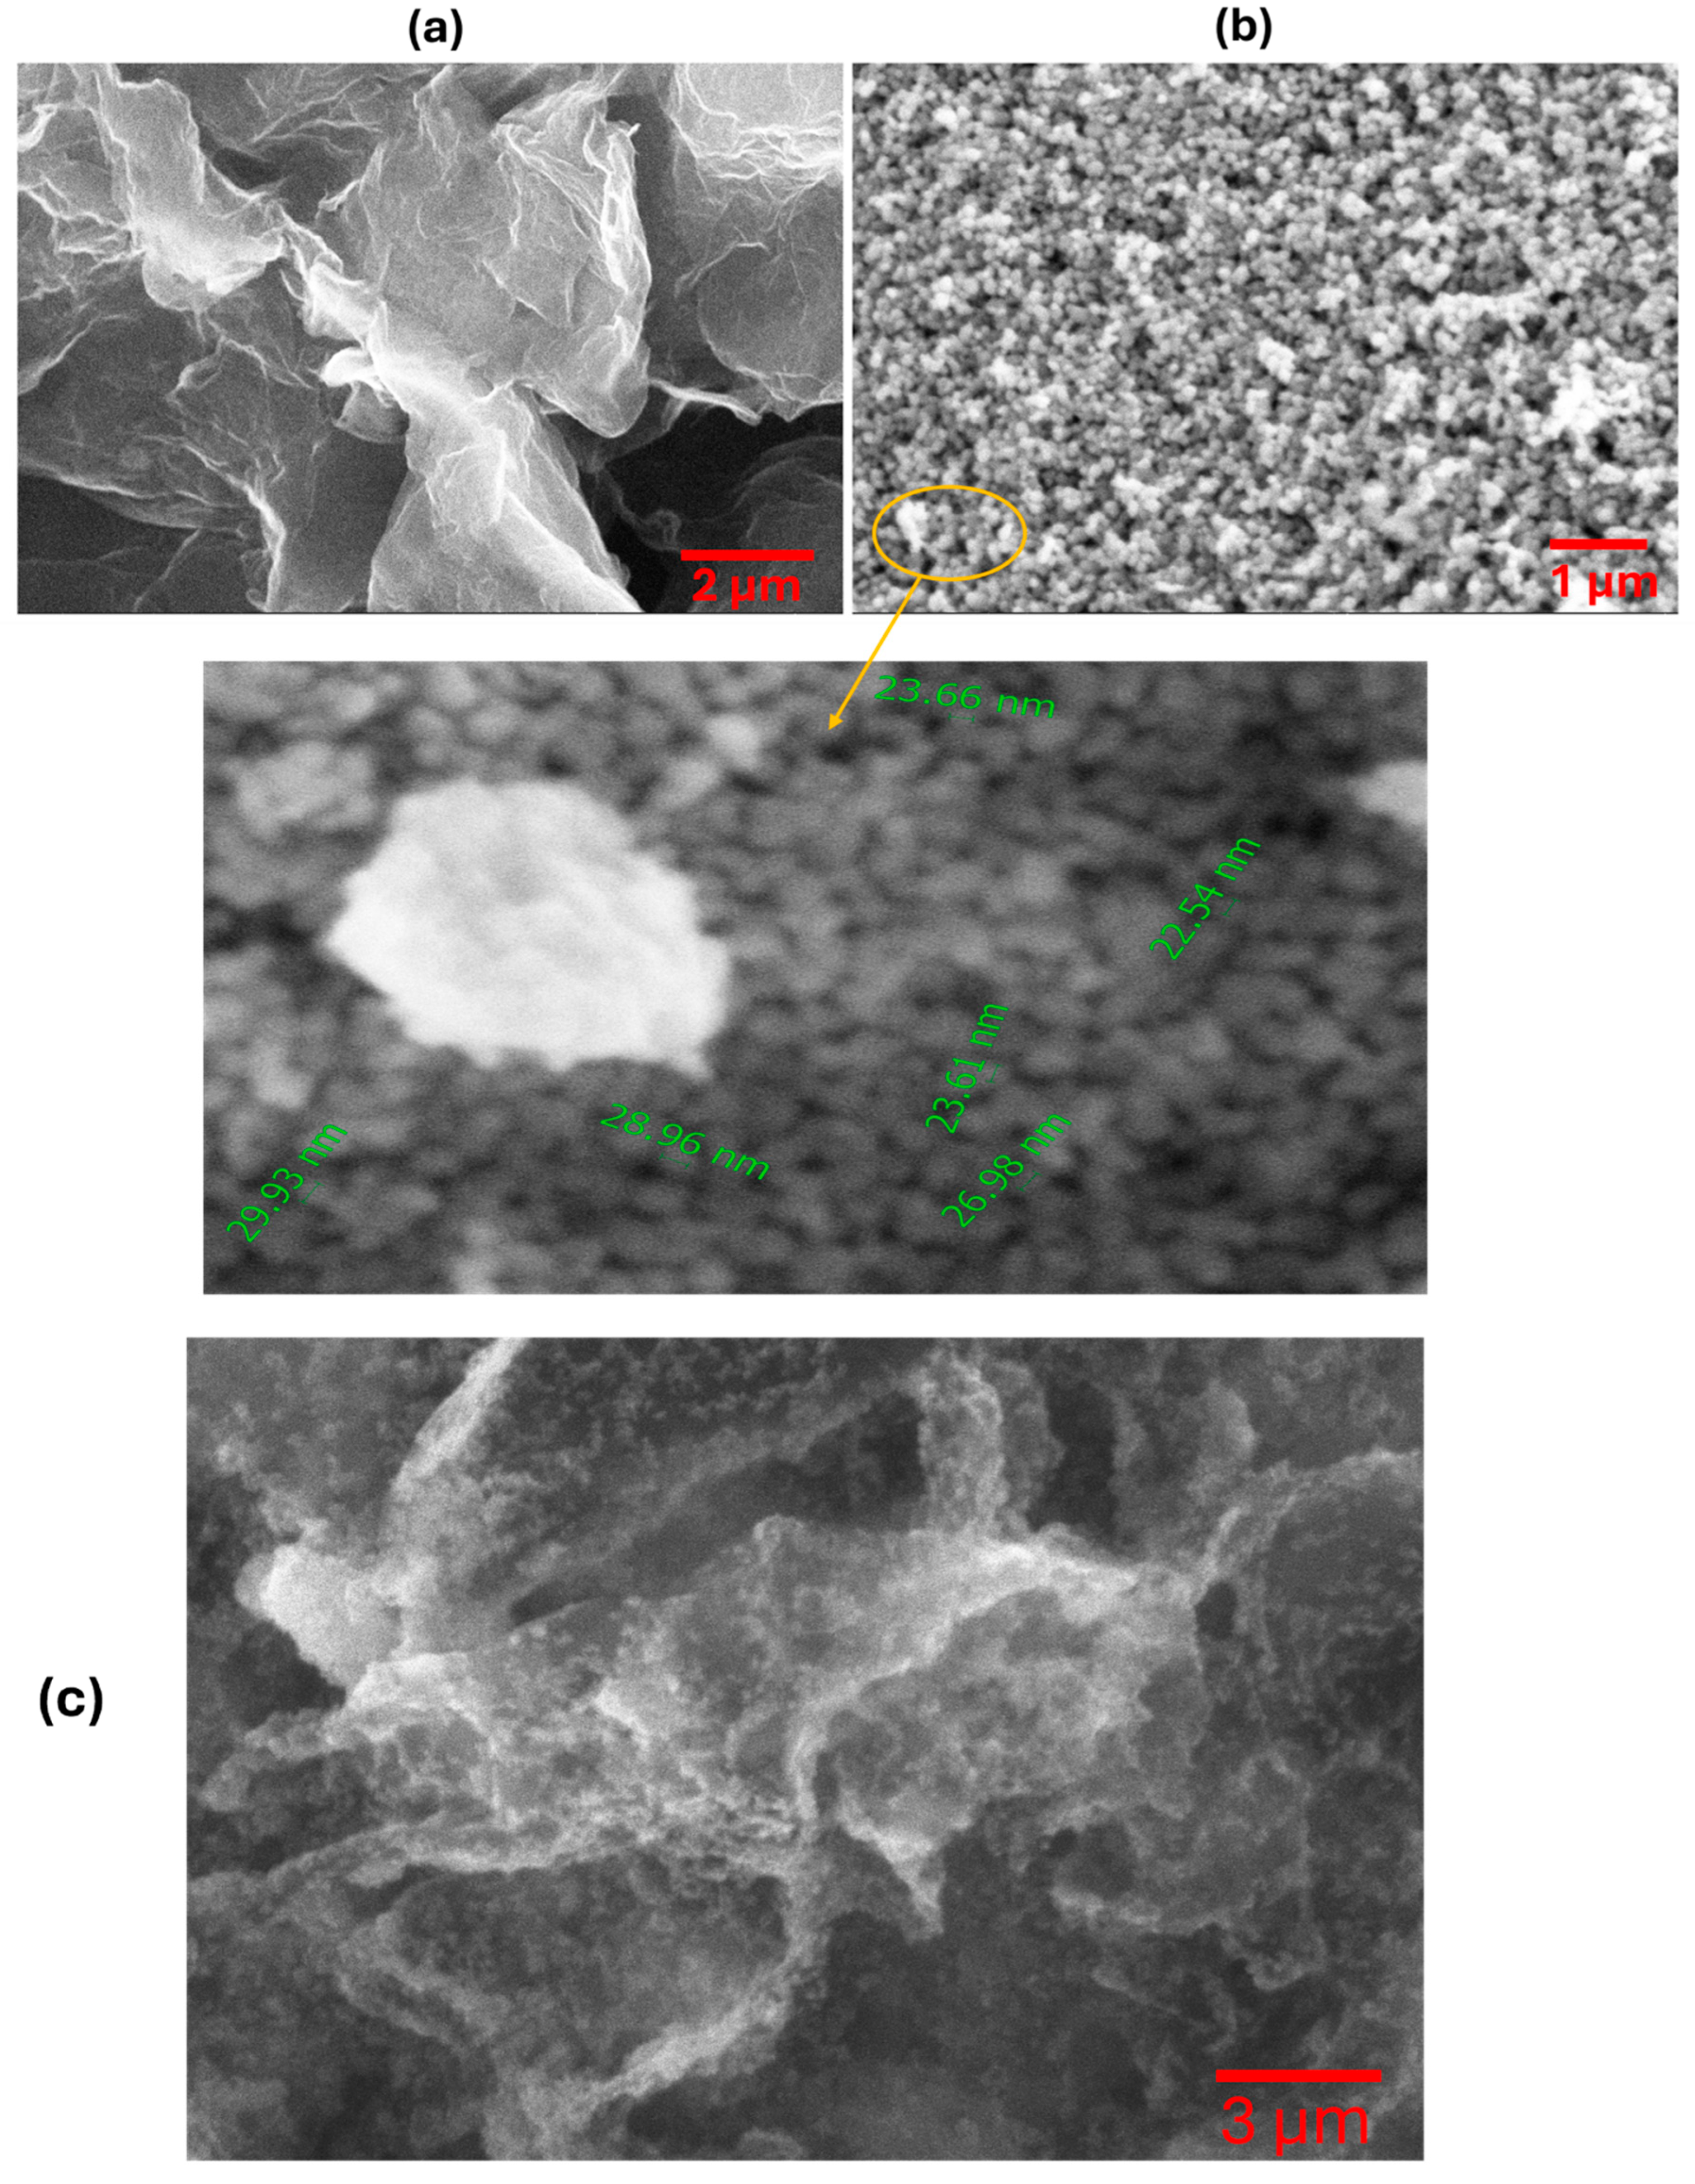
Figure 4.
TEM images of (a) N-rGO and (b-c) NiO/N-rGO.
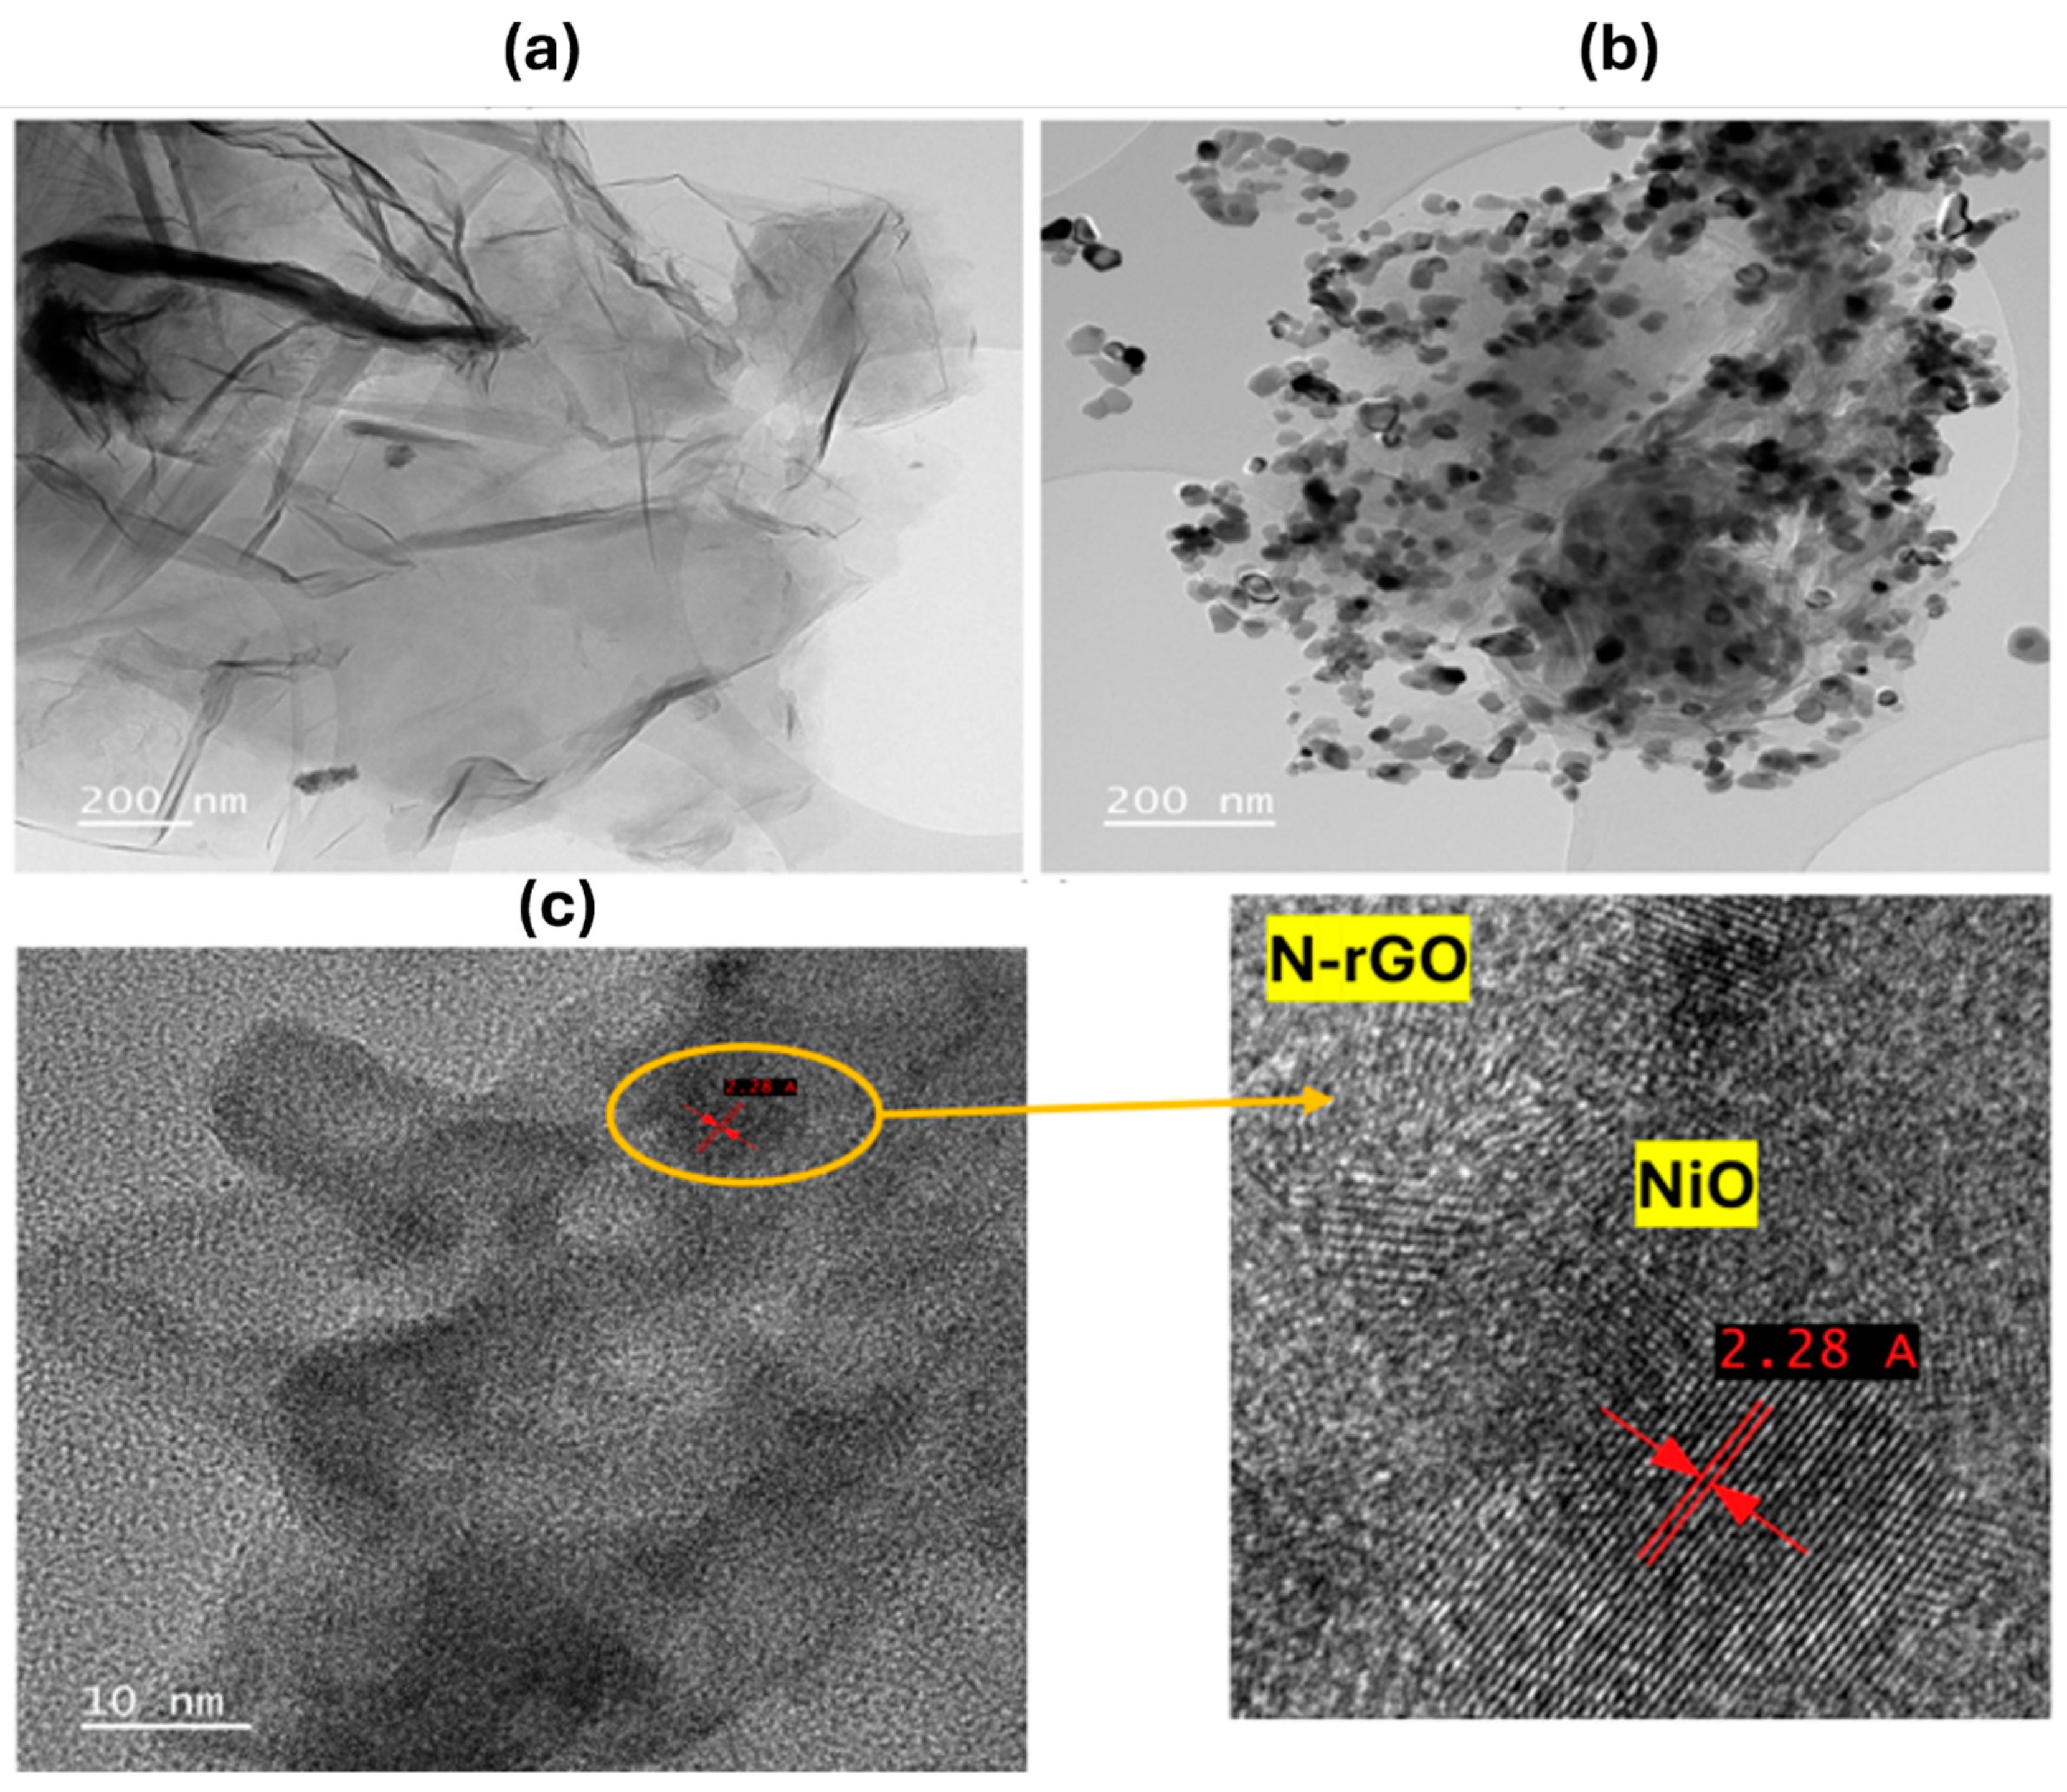
Figure 5.
(a) XRD pattern of GO, N-rGO, and NiO. (b) Raman Spectra of N-rGO, NiO, and NiO/N-rGO.
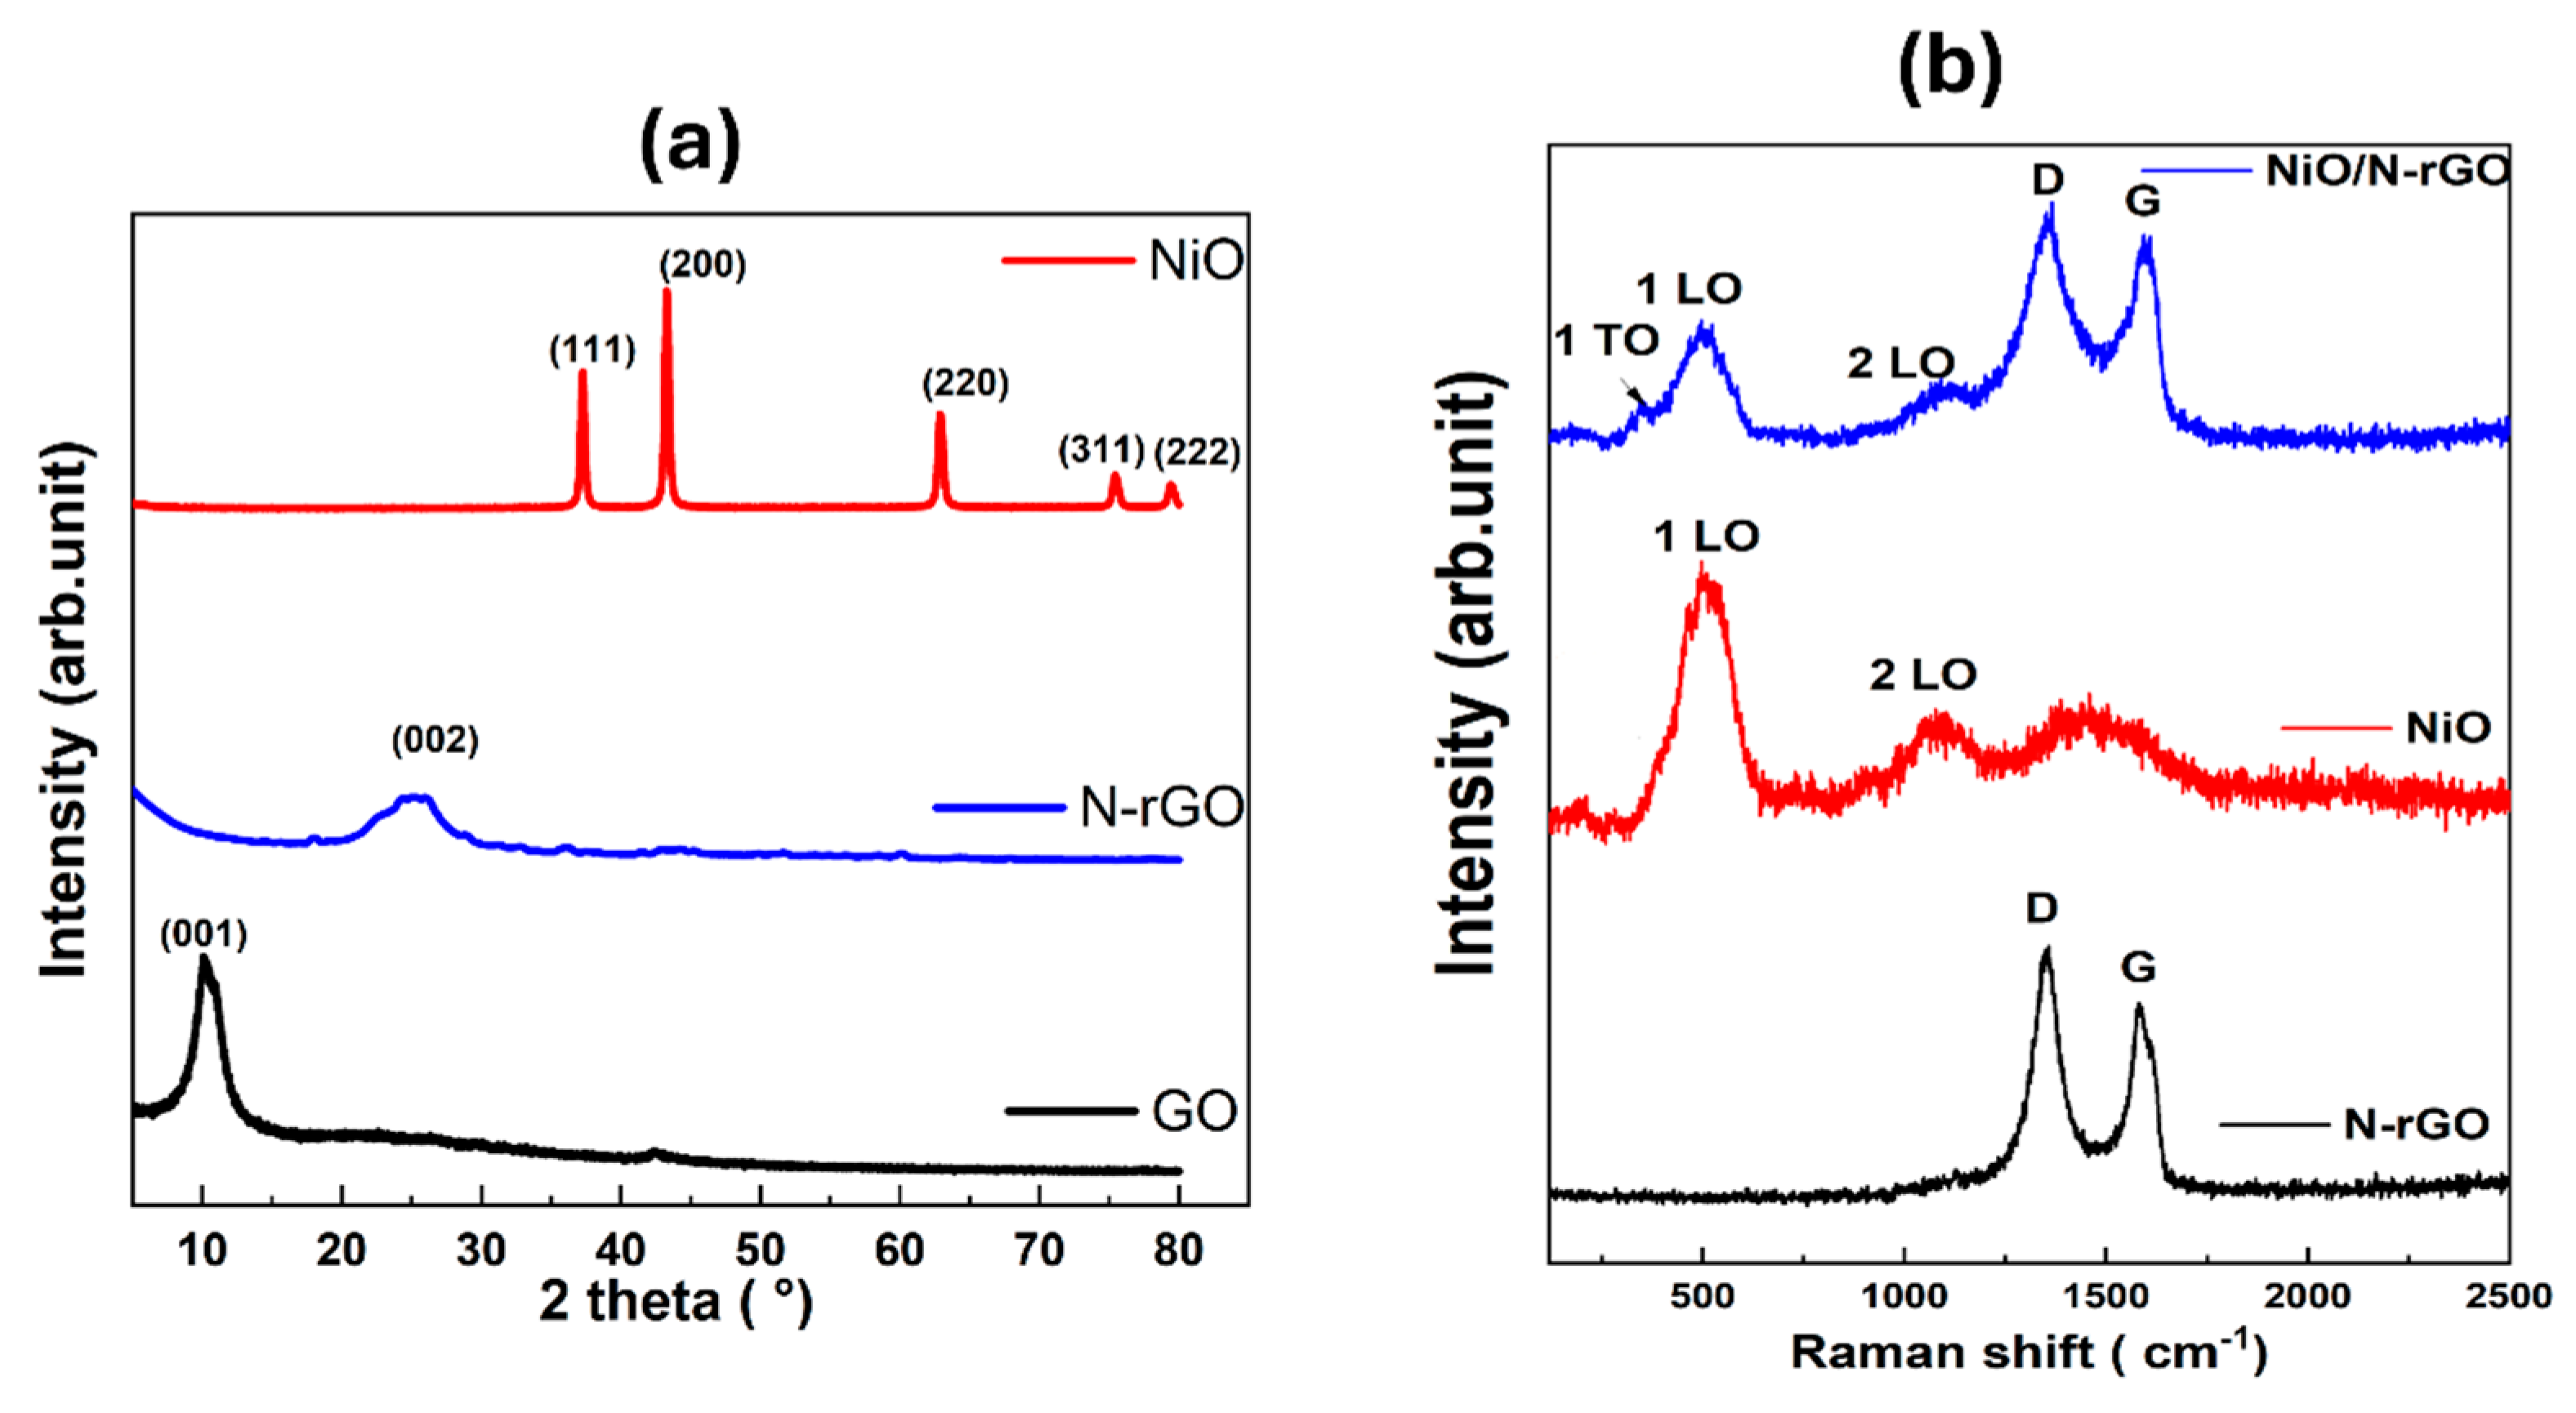
Figure 6.
(a) Sensor responses as a function of their operating temperature toward 800 ppb of NO2. (b) and (c) N-rGO and NiO/N-rGO dynamic response and recovery curves towards repeated exposure cycles of NO2 800 ppb. The sensor operating temperature was 100°C.
Figure 6.
(a) Sensor responses as a function of their operating temperature toward 800 ppb of NO2. (b) and (c) N-rGO and NiO/N-rGO dynamic response and recovery curves towards repeated exposure cycles of NO2 800 ppb. The sensor operating temperature was 100°C.
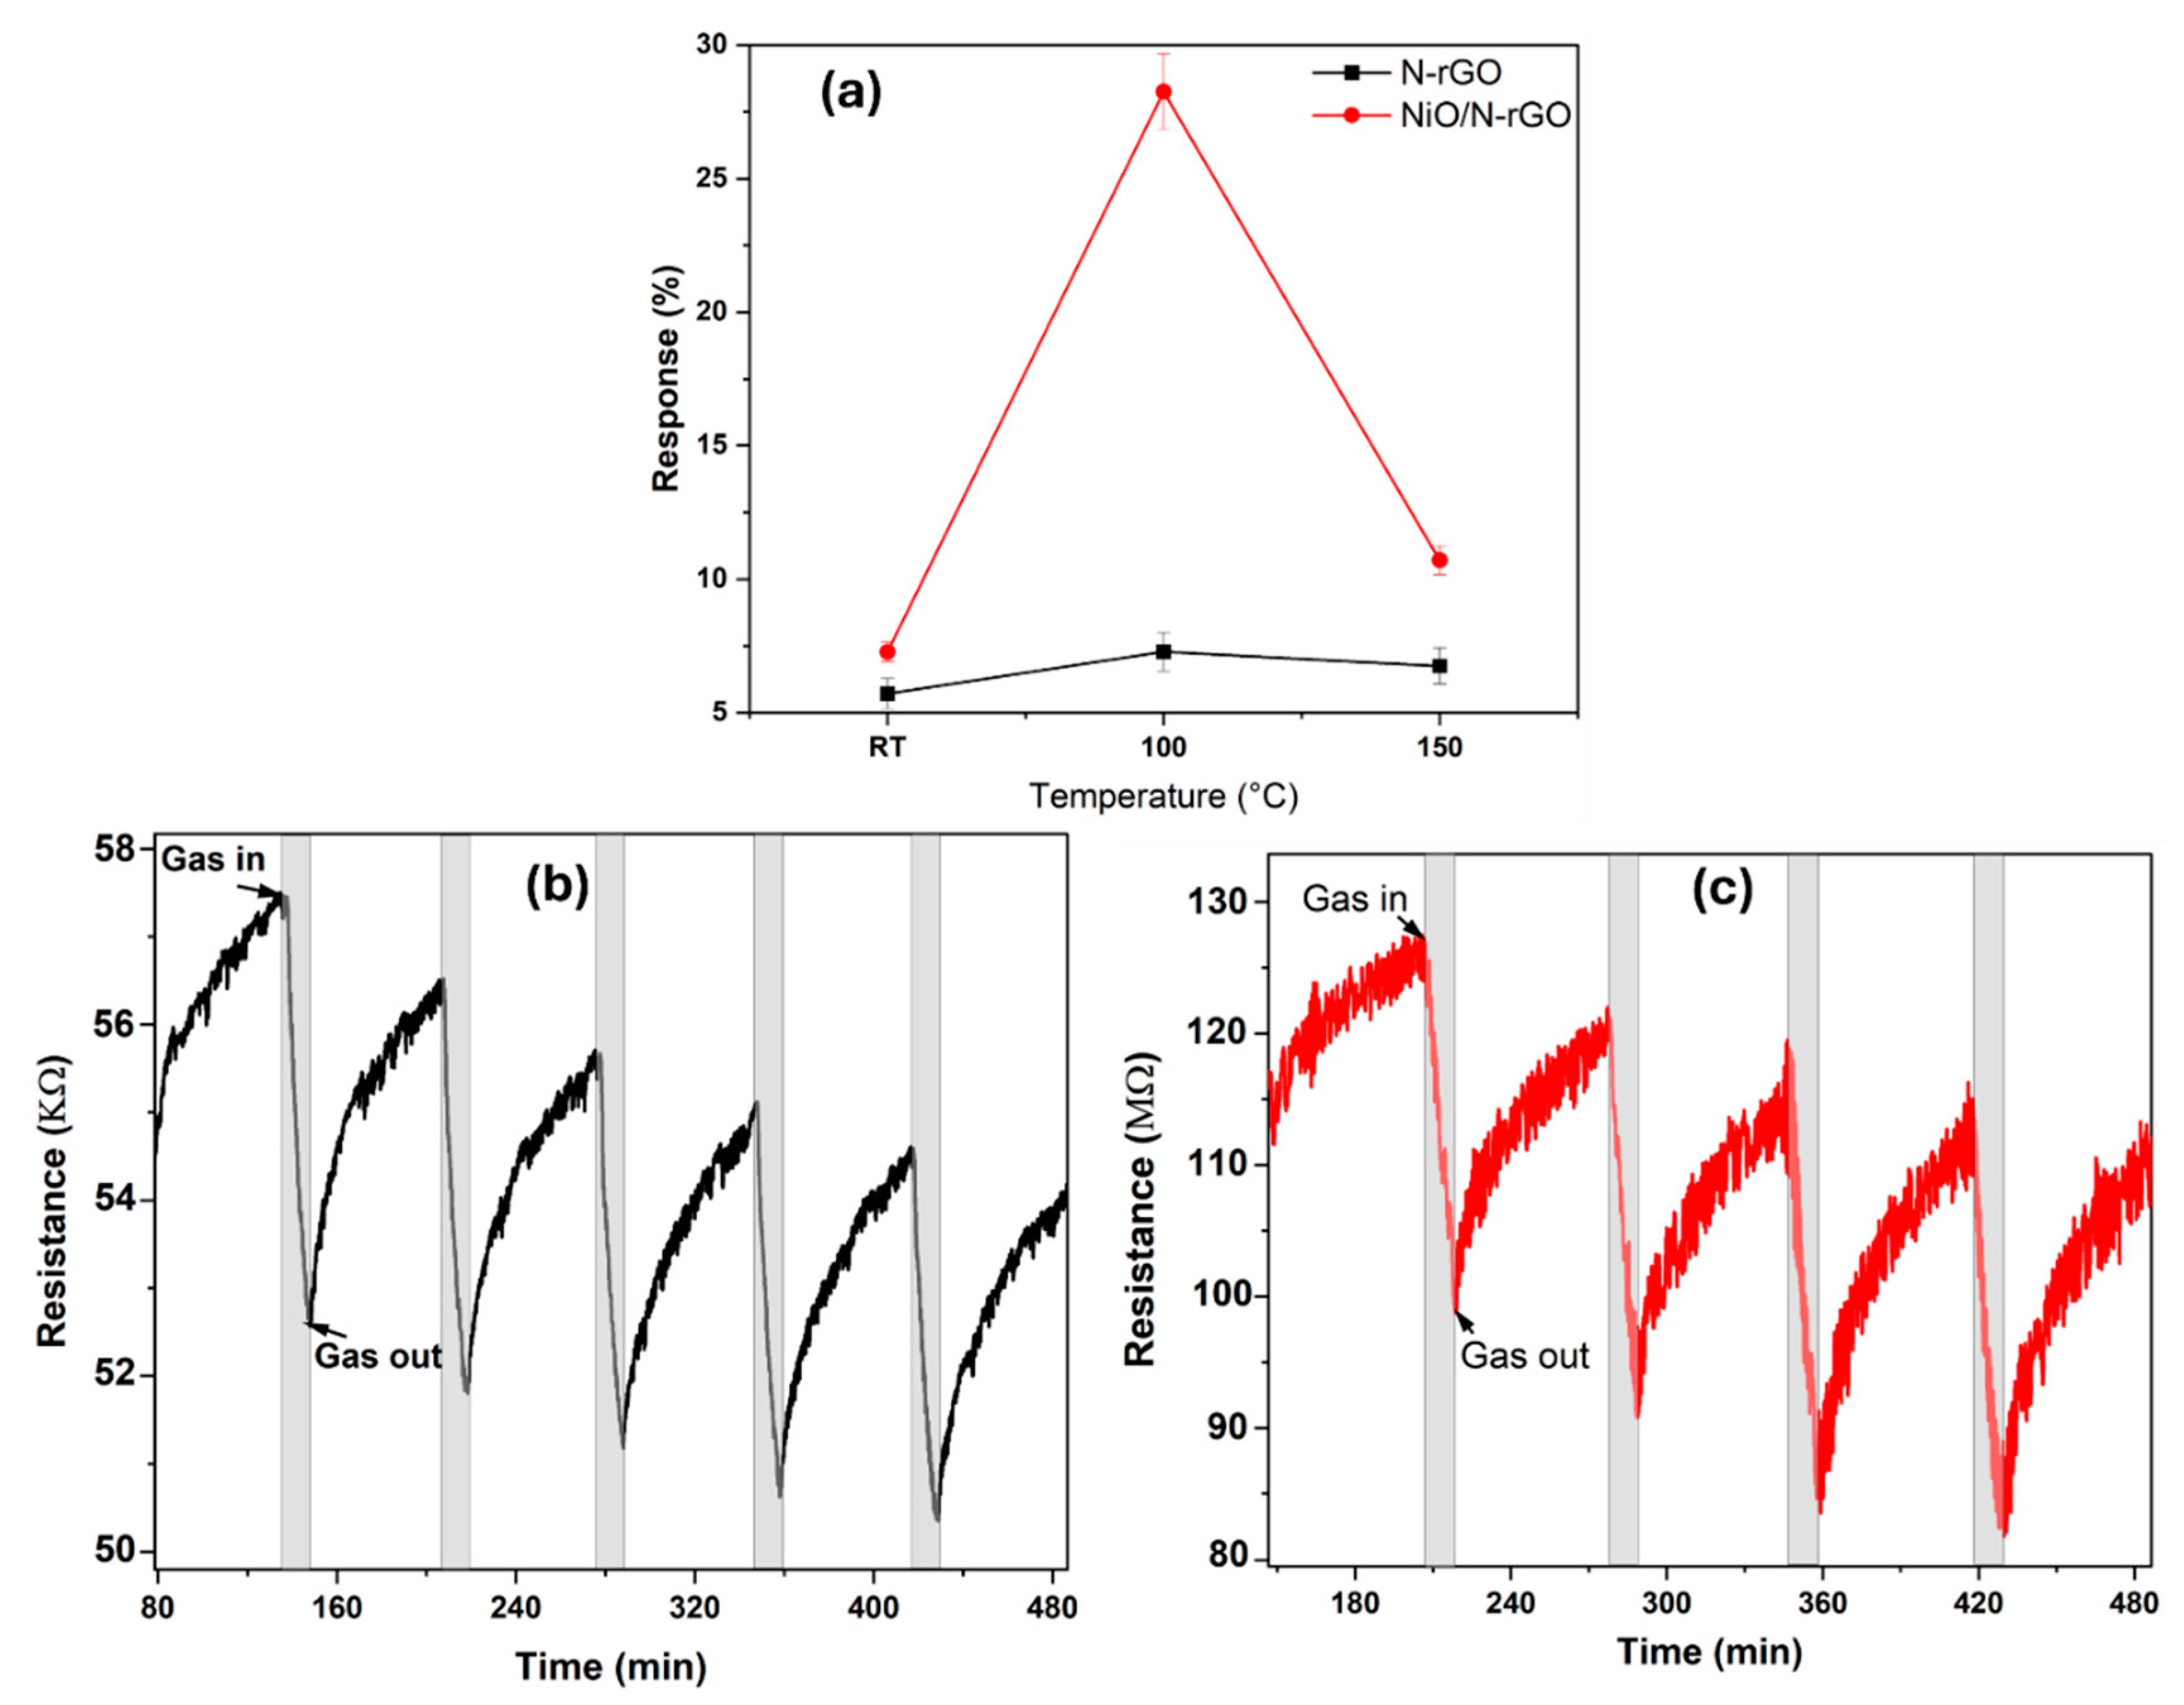
Figure 7.
(a) N-rGO and (b) NiO/N-rGO gas sensing films resistance changes as a function of time toward different NO2 concentrations at 100°C. (c) N-rGO and NiO/N-rGO sensors response as a function of NO2 concentration at 100°C.
Figure 7.
(a) N-rGO and (b) NiO/N-rGO gas sensing films resistance changes as a function of time toward different NO2 concentrations at 100°C. (c) N-rGO and NiO/N-rGO sensors response as a function of NO2 concentration at 100°C.
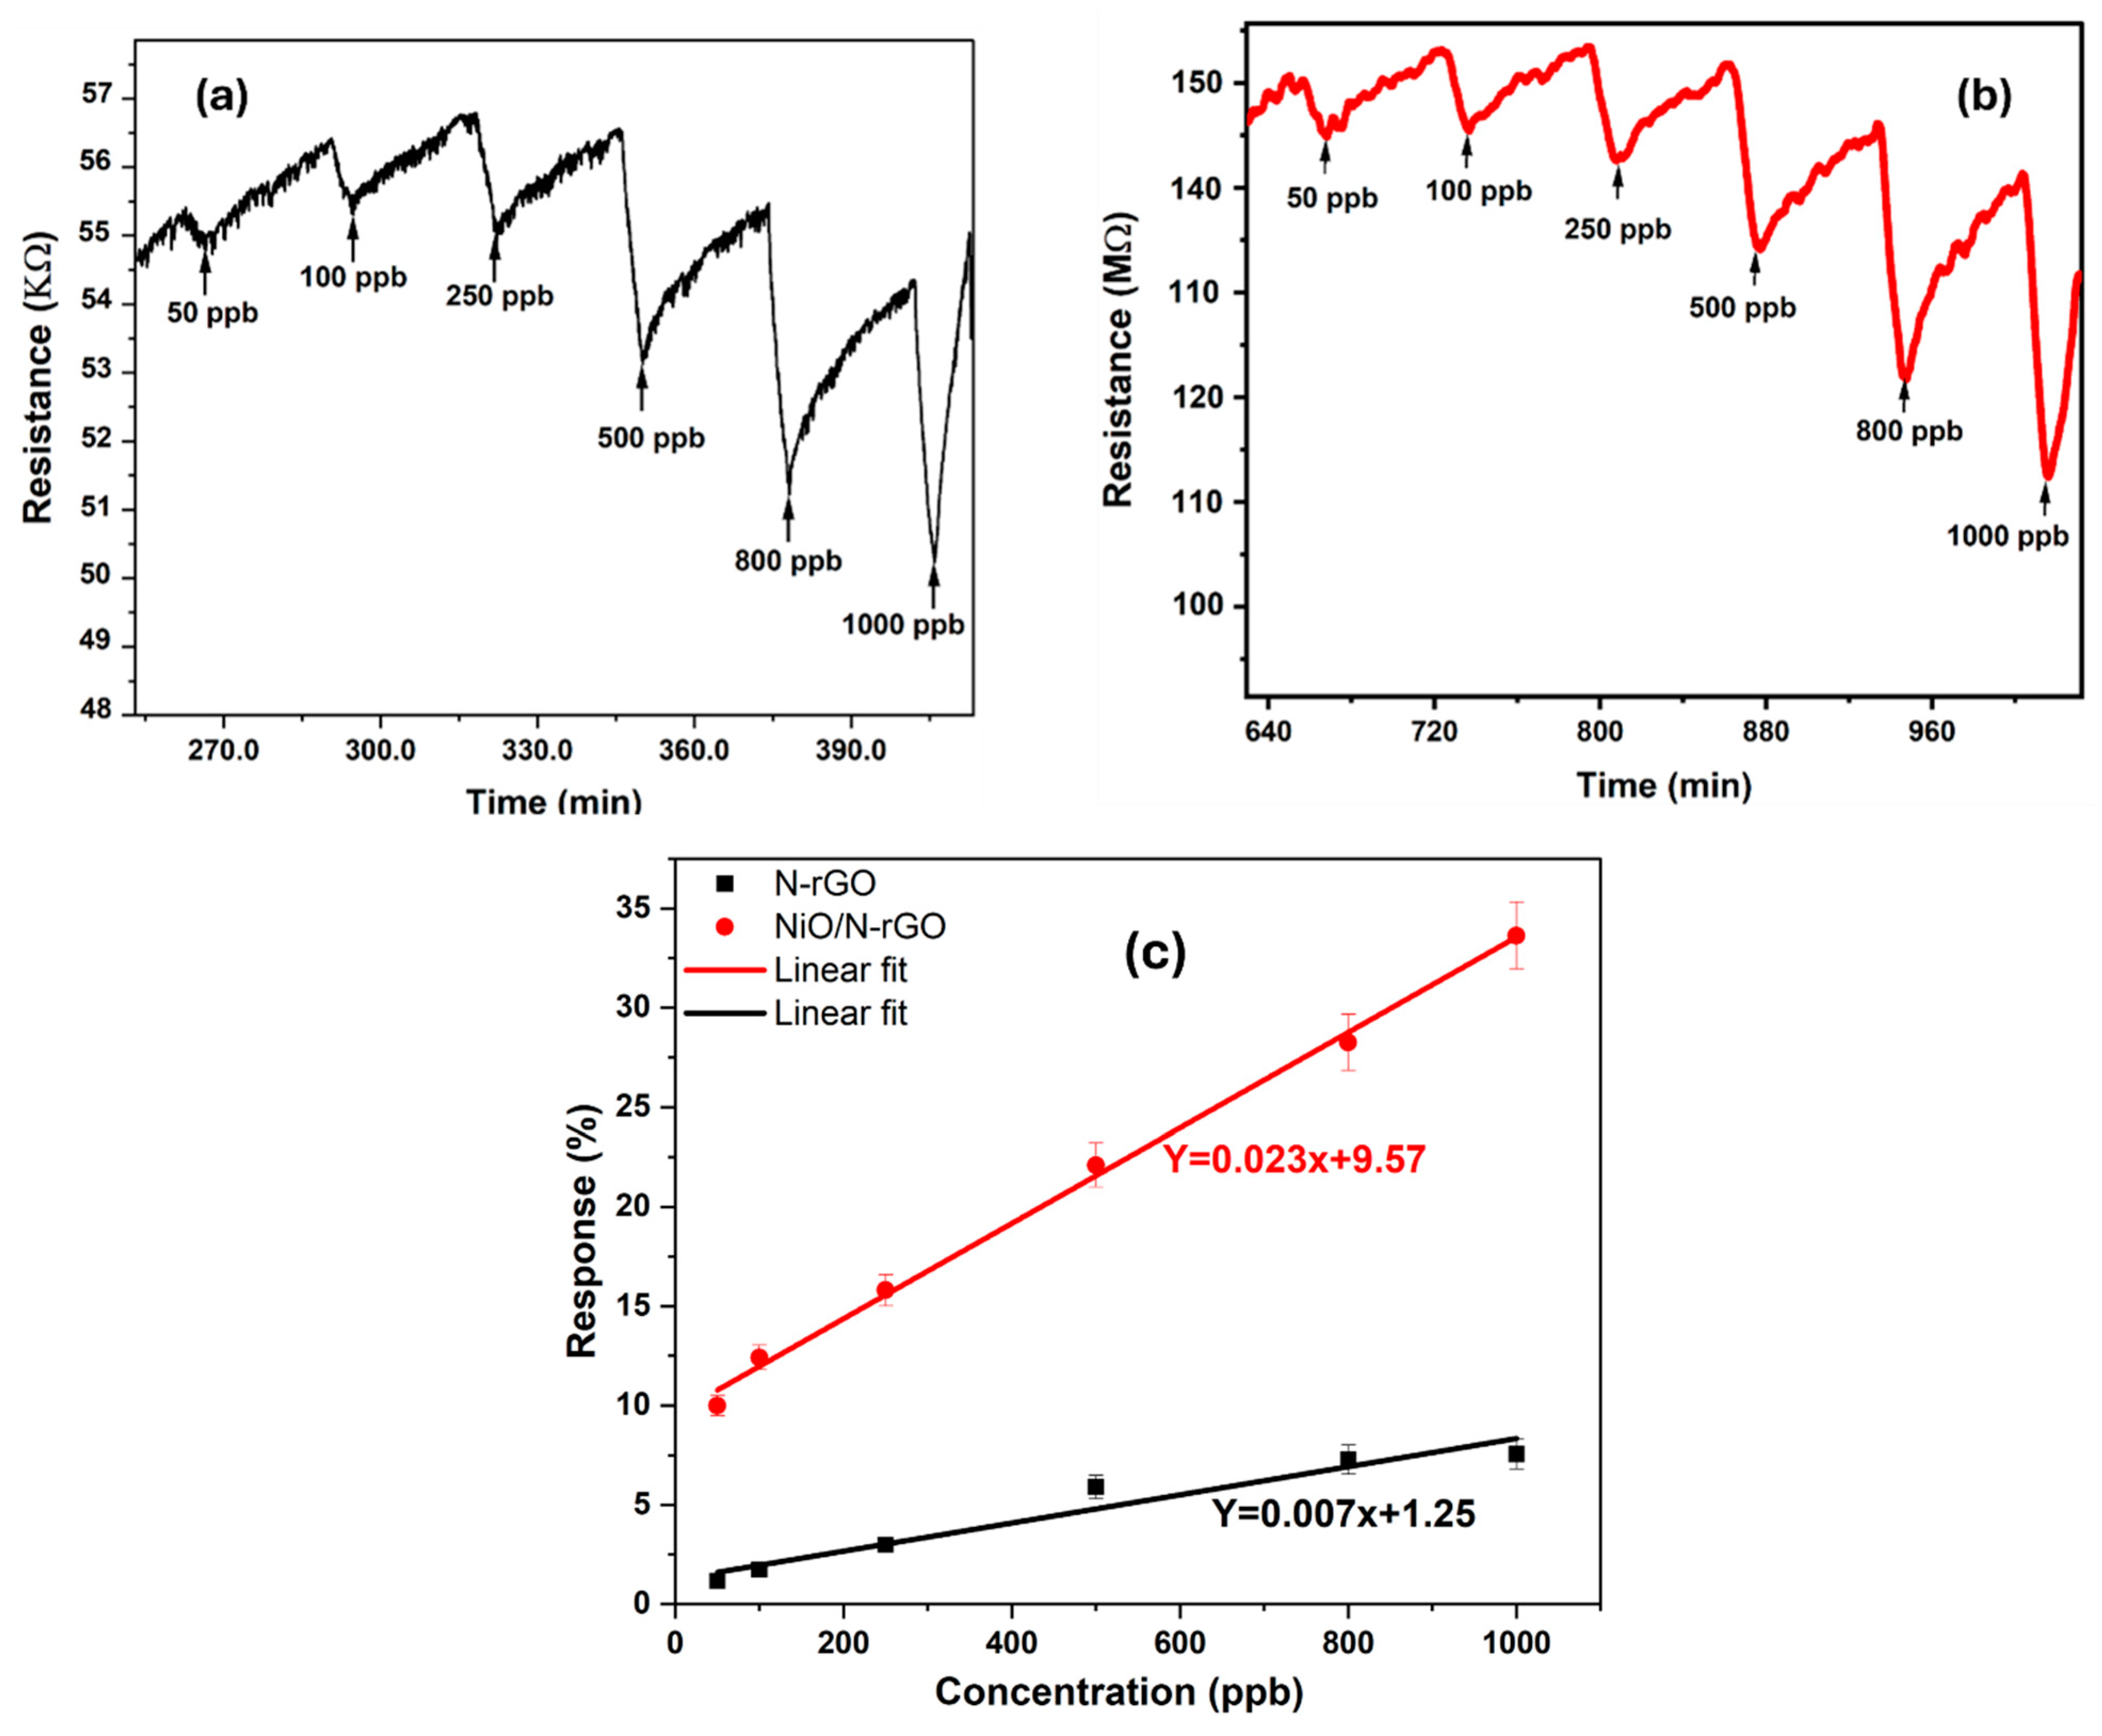
Figure 8.
(a) Response histogram of N-rGO and NiO/N-rGO gas sensors to NO2 (800 ppb), Ethanol (20 ppm), NH3 (10 ppm), and CO2 (100 ppm). N-rGO and NiO/N-rGO sensors resistance variations to 800 ppb of NO2 under 70 % RH. Sensors operated at 100°C.
Figure 8.
(a) Response histogram of N-rGO and NiO/N-rGO gas sensors to NO2 (800 ppb), Ethanol (20 ppm), NH3 (10 ppm), and CO2 (100 ppm). N-rGO and NiO/N-rGO sensors resistance variations to 800 ppb of NO2 under 70 % RH. Sensors operated at 100°C.
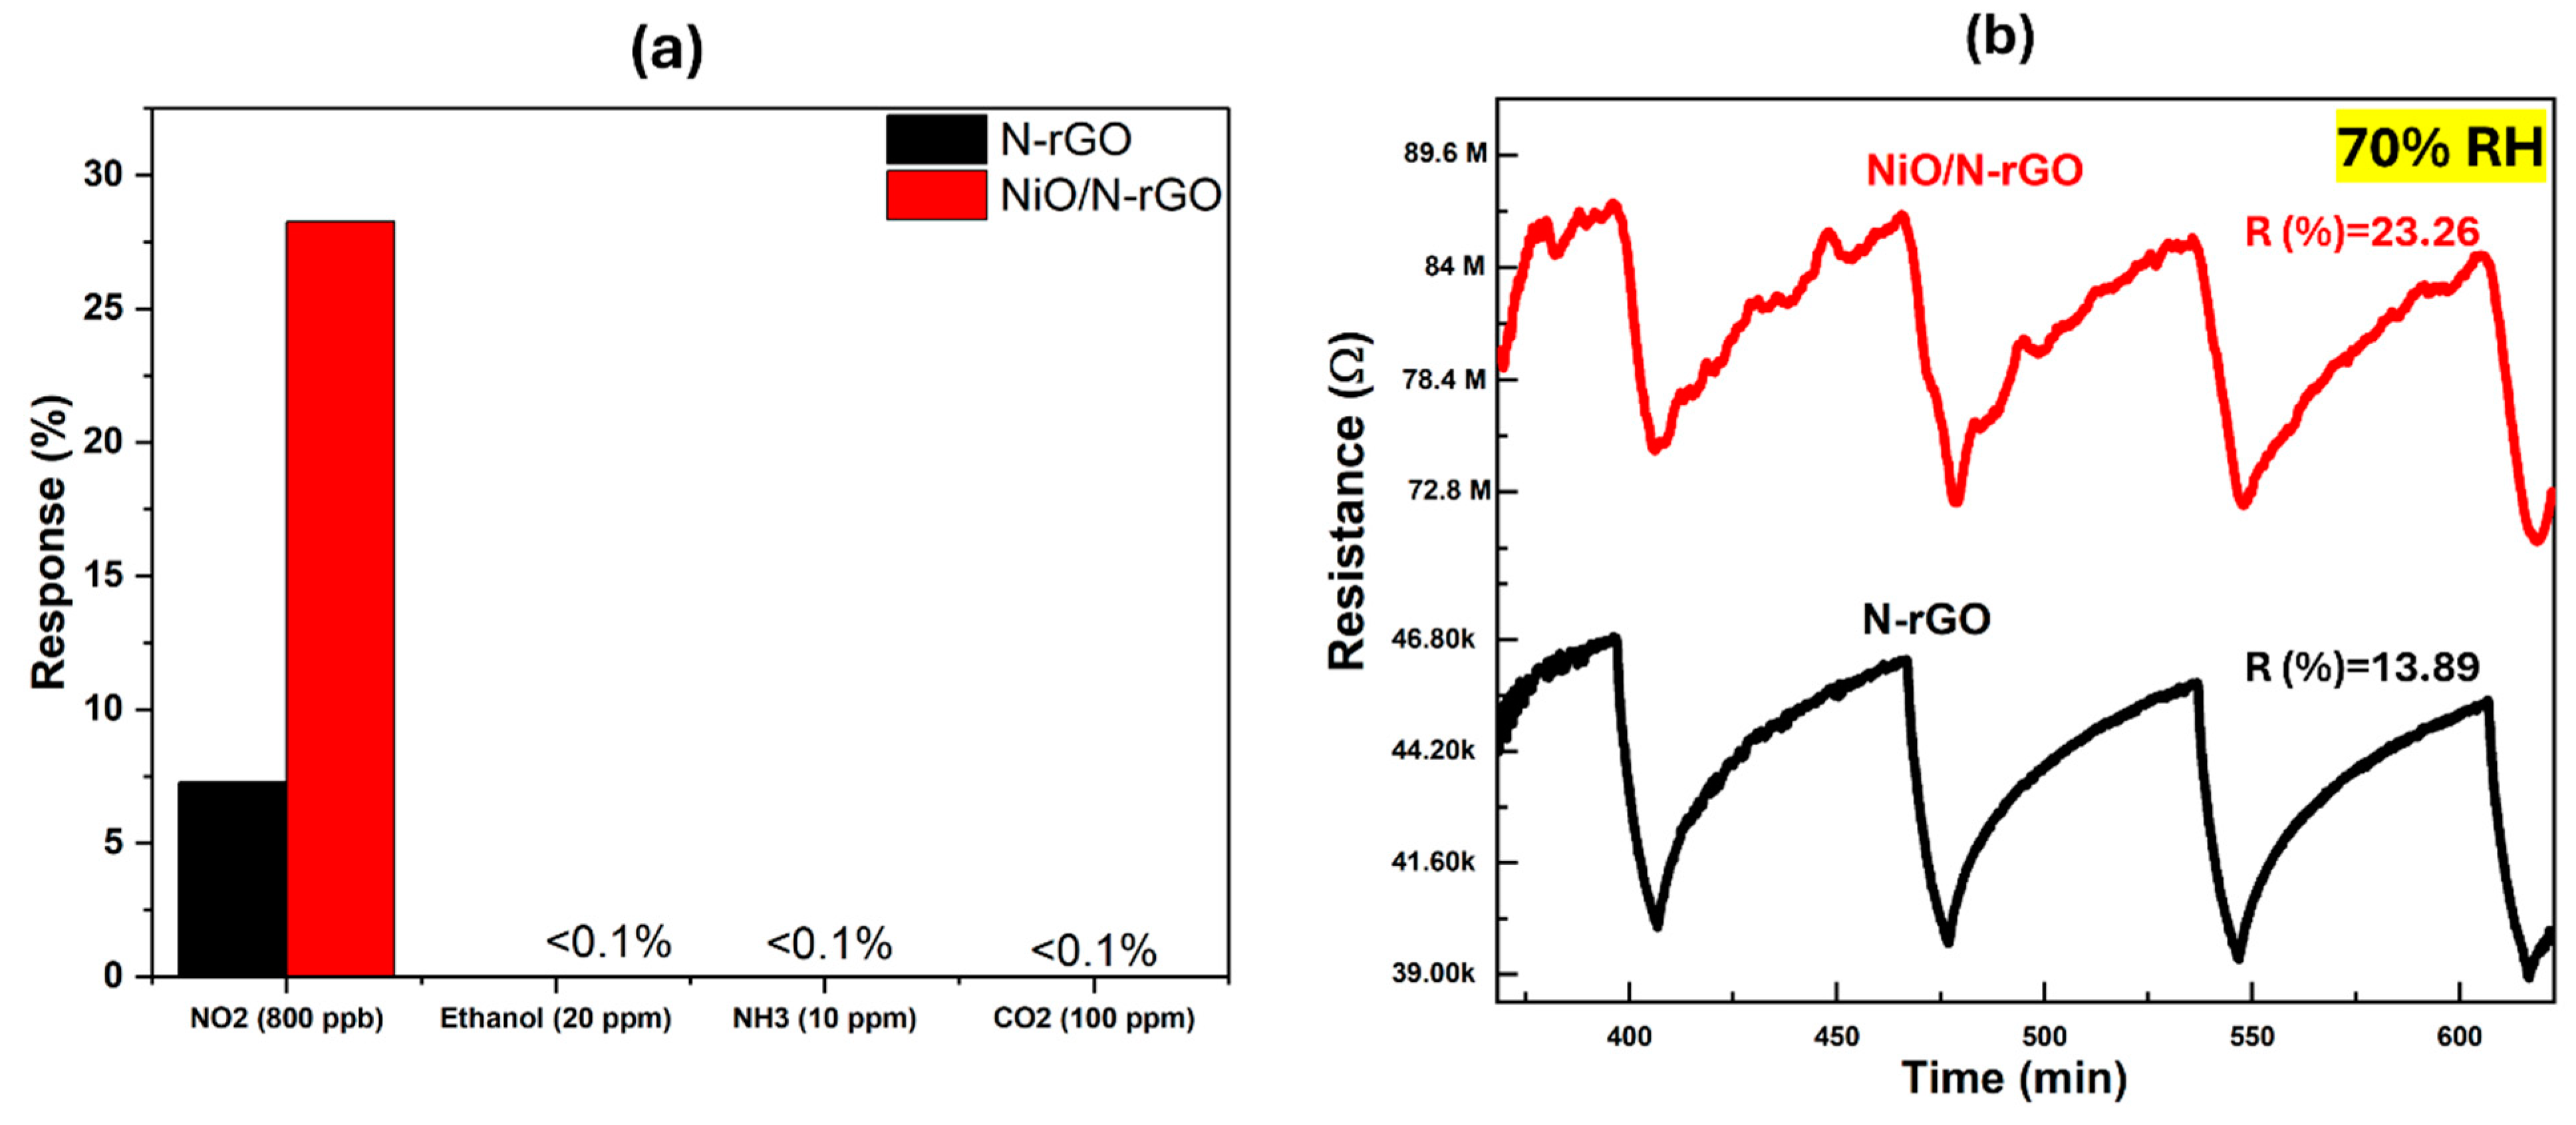
Figure 9.
Formation of core-shell structures of charge carriers in NiO to (a) air (O2), (b) NO2, and (c) the sensing mechanism of NiO/N-rGO sensitivity to NO2 at 100 °C. At the interface between p-type N-rGO and p-type NiO, a Hole Accumulation Layer (HAL) forms in both cases uder air or in the presence of NO2.
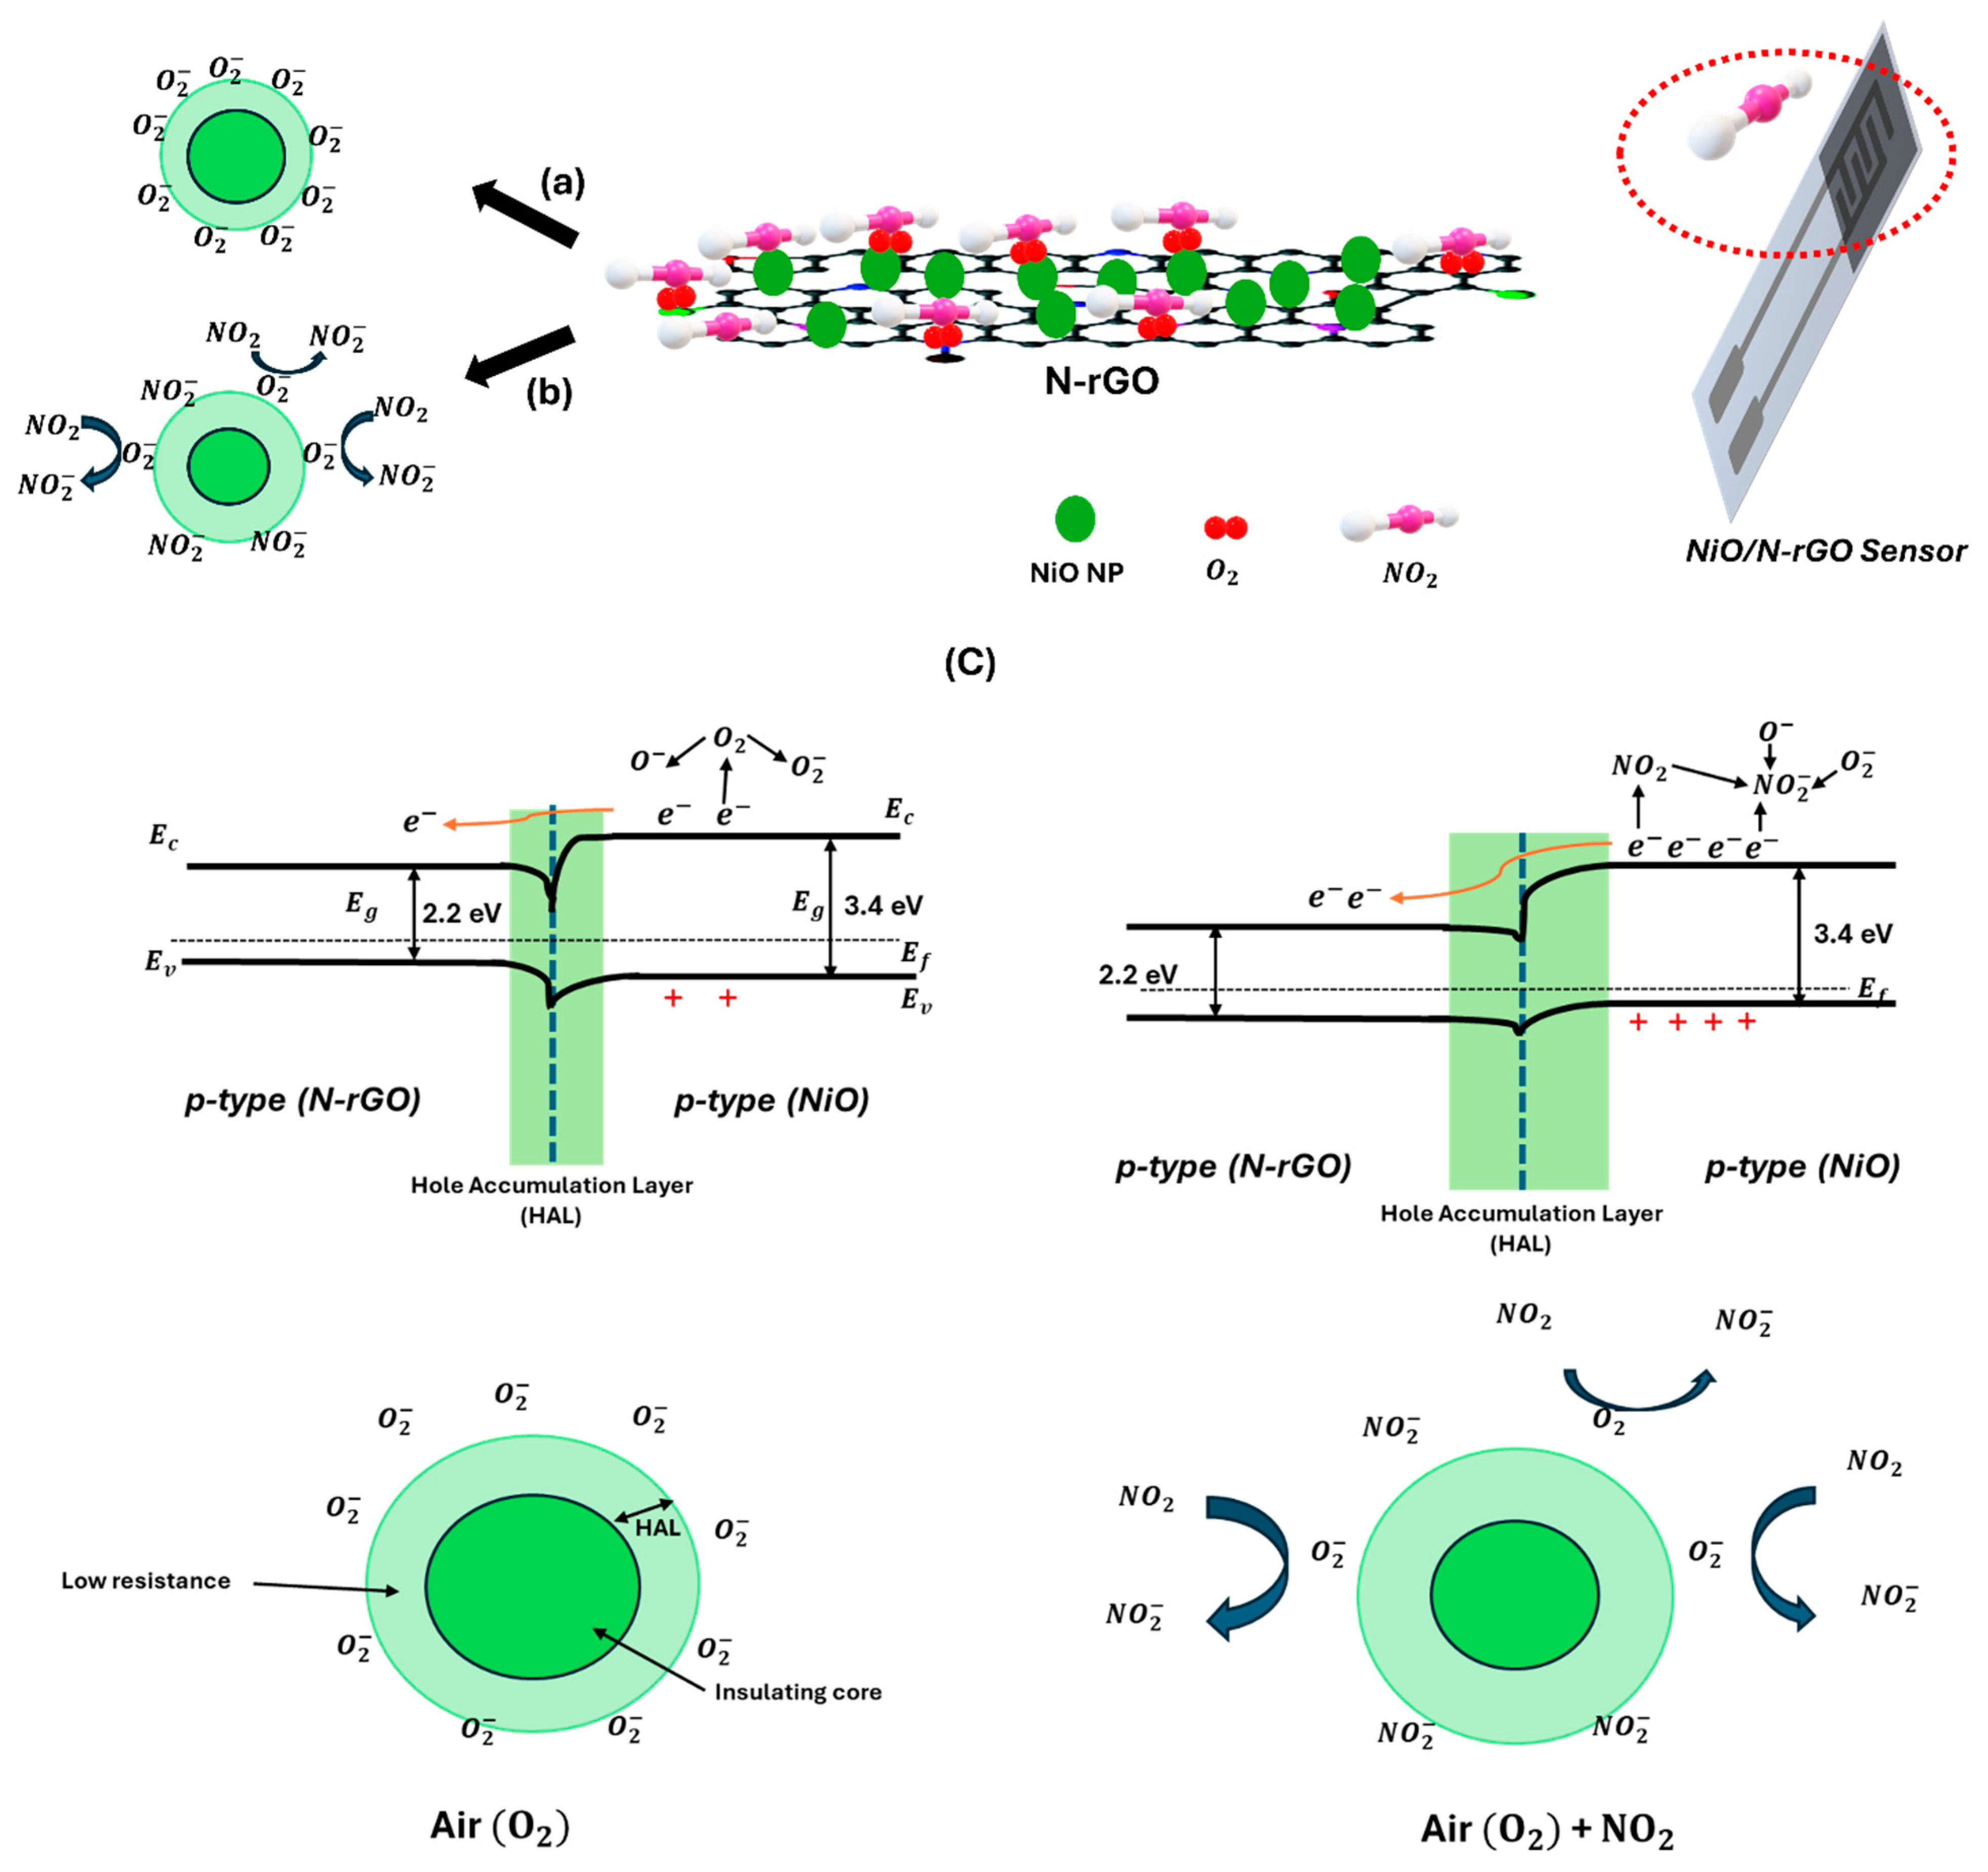

Table 1.
Sensitivity and LOD values.
| Sensors | N-rGO | NiO/N-rGO |
|---|---|---|
| Sensitivity (10-2 ppm-1) | 709 | 2398 |
| LoD (ppb) | 39 | < 1 |
Table 2.
Comparison of the performance in the detection of NO2 between this work and previously reported results.
Table 2.
Comparison of the performance in the detection of NO2 between this work and previously reported results.
Disclaimer/Publisher’s Note: The statements, opinions and data contained in all publications are solely those of the individual author(s) and contributor(s) and not of MDPI and/or the editor(s). MDPI and/or the editor(s) disclaim responsibility for any injury to people or property resulting from any ideas, methods, instructions or products referred to in the content. |
© 2025 by the authors. Licensee MDPI, Basel, Switzerland. This article is an open access article distributed under the terms and conditions of the Creative Commons Attribution (CC BY) license (http://creativecommons.org/licenses/by/4.0/).
Copyright: This open access article is published under a Creative Commons CC BY 4.0 license, which permit the free download, distribution, and reuse, provided that the author and preprint are cited in any reuse.


