Preprint
Article

This version is not peer-reviewed.

Impact of Modified Tabata Training on Segmental Fat Accumulation, Muscle Mass, Muscle Thickness, and Physical and Cardiorespiratory Fitness in Overweight and Obese Participants: A Randomized Control Trial

A peer-reviewed article of this preprint also exists.

Submitted:

07 February 2025

Posted:

08 February 2025

You are already at the latest version

Abstract

This study was to examine changes in body fat, muscle mass, muscle thickness, and physical and cardiorespiratory fitness in overweight and obese individuals following progressive Tabata training. Thirty-six participants were randomly assigned to either a Tabata group (progressive 4 cycles of body-weight high-intensity intermittent training at 75%-85% of maximum perceived exertion, 3 days/week for 12 weeks) and control group. Body composition, muscle thickness, strength and endurance, and peak oxygen uptake (VO2peak) were examined at baseline and after the training and compared between groups. Body fat percentage and fat mass did not change but waist-to-hip ratio was lower in Tabata group (p=0.043). Percentage of muscle mass of right (p=0.026) and left legs (p=0.043) were raised and muscle thickness of biceps, triceps, rectus femoris, and vastus intermedius were increased in Tabata group (all p<0.05) and greater than in control group (p<0.05). Muscle strength and endurance were also increased in Tabata group (p<0.05) as well as VO2peak (p=0.006). Twelve weeks of modified Tabata training effectively increased muscle mass and thickness, and physical and cardiorespiratory fitness, although it did not reduce fat accumulation in overweight and obese. The combination of the training with a dietary intervention may yield more apparent impacts.

Keywords: 
;  ;  ;  ;  

1. Introduction

Excess bodyweight and obesity are a major global health concern [1], with the prevalence of obesity has doubling worldwide. In 2022, 16% of adults were overweight and 43% were obese [2]. These conditios are major risk of various diseases, including cardiovascular, neurodegenerative, respiratory, autoimmunity, non-communicable, musculoskeletal, and major cancers [3,4,5].
Managments of overweight and obesity focus on weight control, abdominal fat reduction, and improved cardiorespiratory fitness [6]. Approaches include dietary therapy, exercise, lifestyle change, medication, and bariatric surgery [6]. American College of Sports Medicine [7] recommend moderate-to-vigorous intensity aerobic exercise for weight control.
High-intensity intermittent training (HIIT) is a form of interval training that alternates brief periods of intense exercise with complete rest [8]. The duration of exercise and rest periods varies from 6 second to 4 minutes, over 2 to 15 weeks [9]. HIIT, such as sprinting or cycling, has been shown to reduce body and abdominal fat, and waist circumference with minimal weight loss, while improving maximal oxygen consumption (VO2max) in obese children, healthy adolescents, overweight women, and adults with type 2 diabetes[10,11].
Tabata training, a form of HIIT, involves 20 seconds of intene exercise followed by 10 second of rest, repeatd for 7-8 sets [12]. Originally developed for cycling[13], it has been adapted for other exercise like running and body-weight workout. Benifits of Tabata training include fat burning, heightened metabolism during and after workouts, and enhancement of anaerobic and aerobic systems [12,13,14]. Previous studies have shown that 4 to 12 weeks of body-weight Tabata training can increases VO2max by 5-18% [15].
Studies examining Tabata training’s health effects in various populations is limited, mainly focusing on athletes, where improvements in muscle gene expression related not only to sports performance but also to health promotion have been demonstrated [16]. Given the high intensity of Tabata training, adherence may be challenging; for example, a study in obese male adolescents reported a 6.3% withdrawal rate [17] and 90% compliance in sedentary adolescents [18]. These findings suggest that the intensity may reduce enjoyment for some participants [19], and a lower-intensity regimen could enhance motivation. Commonly used body-weight exercises in Tabata, such as squats, jumps, and lunges, involve high-impact movements which may be unsuitable for overweight individuals, highlighting the need for modifications.
Hence, the objective of this study was to examine whether modified Tabata training in the form of HIIT yields positive impacts on body fat, fat mass, muscle mass, muscle thickness, and physical and cardiorespiratory fitness. The hypothesis was that the modified Tabata training would improve on these variables in overweight and obesity participants.

2. Materials and Methods

2.1. Study design, randomization and non-blinded

This randomized controlled trial, as shown in the CONSORT flow diagram (Figure 1), recruited overweight or obese individuals who living in Chonburi province starting in September 2022. Eligible participants were stratified blocked randomized into control and Tabata groups. This study was non-blinded, with the same researcher responsible for screening, randomization, allocation, data collection, and analysis.
This study was approved by the Burapha University Institutional Review Board on 24 May 2022 (ID: G-HS018/2565) and registered in the Thai Clinical Trials Registry (ID: TCTR20220518001). All participants gave written informed consent prior to screening.

2.2. Screening of participants

Participants aged 18-30 years with BMI > 22.9 kg/m2 [20] were included. Exclusion criteria comprised certain drug consumption, diseases affecting the cardiovascular, liver, renal, musculoskeletal, infectious, cancer, neurological, or psychiatric systems, as well as, regular smoking and alcohol consumption. A health history questionnaire screened for eligibility.

2.3. Sample size

The sample size was calculated using the means and standard deviations of VO2max according to a previous study [21] that investigated the effects of a 4-week Tabata HIIT intervention in overweight individuals. With α error of 0.05 and a test power of 0.98, the sample size was obtained using G*Power 3.1[22]. Thus, sample size, accounting for a 10% drop out, was 18 per group (36 total).

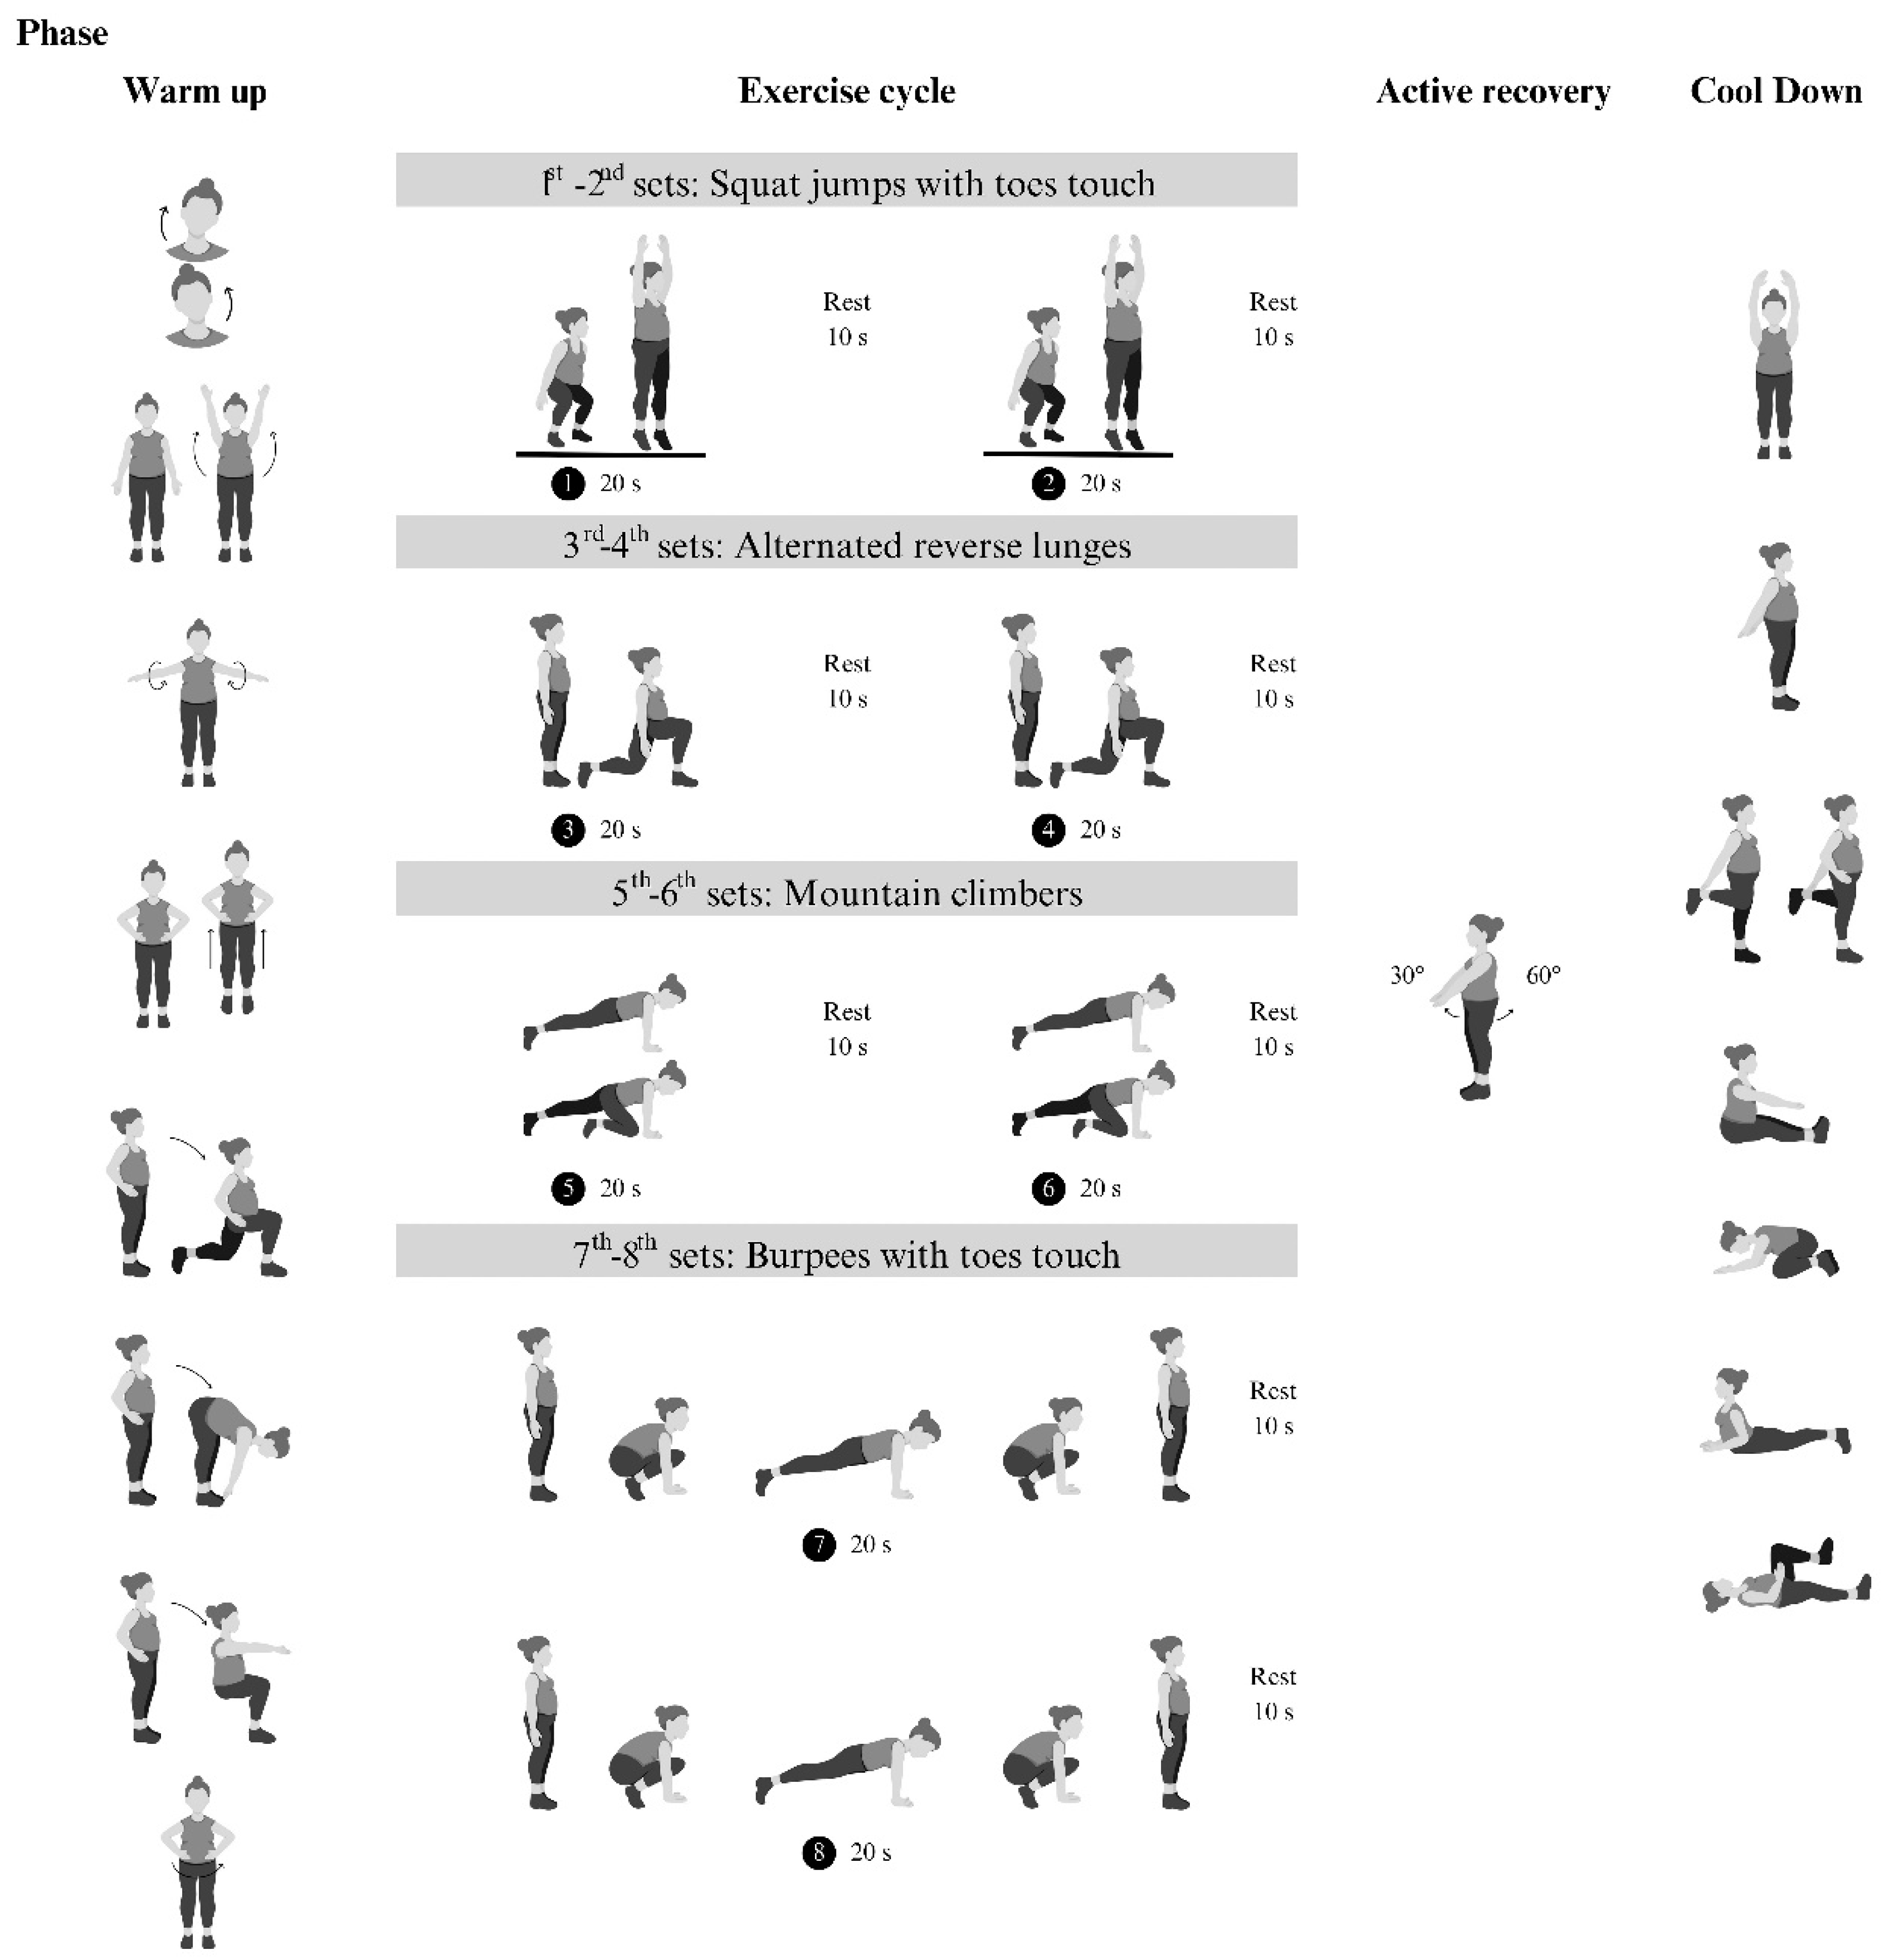
2.4. Tabata training

The modified Tabata training was a progressive home-based program consisting body-weight exercises followed by active rest (Figure 2). Each session included 4-minute exercise cycles (20 seconds of exercise and 10 seconds of rest) followed by 4-minute active rest, totaling 8 minutes per cycle. Participants trained three days a week for 12 weeks, starting with two cycles for the first 4 weeks, then increasing to three cycles from weeks 5-8, and four cycles from weeks 9-12. Exercise intensity was set at 75-85% of maximum perceived exertion, with 4-minute active rest periods where participants swung their arms at 40-50% exertion. Participants received an exercise diagram and video clip to learn the exercises. Their compliance with and adherence were monitored daily through mobile applications.
The control group participants were asked to maintain their physical activity and diet.

2.5. Study end points

The primary outcomes were improvements in body composition including body fat, fat mass, muscle mass and muscle thickness. The secondary outcomes were improvements to fat distribution including waist and hip circumferences and ratio, physical fitness including muscle strength and endurance, and cardiorespiratory fitness including aerobic capacity. Both outcomes were measured before and after the 12-week interventions.

2.5.1. Body composition

Body composition including body weight, BMI, fat percentage, fat and muscle mass, water, protein, mineral, visceral fat, and basal metabolic rate were measured using a bioelectrical impedance analyzer (InBody270, InBody Co., Ltd., Daejeon, Korea).

2.5.2. Muscle thickness

An ultrasound machine (M5 series, Shenzhen Mindray Bio-Medical, China) with a 7.5 MHz probe measured two upper limb muscles (biceps and triceps brachii) and two lower limb muscles (rectus femoris and vastus intermedius) in the dominant limb according to a published protocol [23,24]. Measurement were taken twice and analysis using ImageJ software (Wayne Rasband, NIH, Bethesda, MD, USA) showing high intraclass correlation coefficient (0.999 for biceps and triceps, 0.996 for rectus femoris, 0.989 for vastus intermedius). The average thickness from two images of each muscle was taken for analyses.

2.5.3. Physical fitness

Lower body muscle strength was assessed using the Leg Dynamometer Test [25] (Takei Back/Leg Dynamometer Digital, Japan), measuring quadriceps strength in kilograms. Upper body muscle endurance was evaluated with the YMCA Bench Press Test [25], recording total successful repetitions (reliability r=0.87).

2.5.4. Cardiorespiratory fitness

An incremental treadmill test (Valiant 2 Sport, Lode, Netherlands) following the Bruce protocol[26] determined peak VO2 (VO2peak). Gas and volume calibrations were carried out before each test following the manufacturer’s guidelines. Breath-by-breath analysis was measured via cardiopulmonary exercise testing system and software (MetaMax 3B, Cortex, Leipzig, Germany). Heart rate (HR), breathing frequency, VO2, carbon dioxide production (V̇CO2), respiratory exchange ratio (RER), first ventilatory threshold (VT1) and second VT (VT2) were measured in real time and analyzed. The test was terminated when the participant reached 75-95% of maximum HR (HRmax), volitional fatigue, or met guideline termination criteria [25].

2.5.5. Physical activity level

Participants were instructed not to alter their routine physical activities throughout the study period. The Beacke Habitual Physical Activity Questionnaire [27,28] was employed to determine their activity levels (sedentary or active).

2.6. Statistical analysis

Data were analyzed using SPSS program (IBM Corp., Armonk, NY, USA) and expressed as mean ± standard deviation or median (range). The Kolmogorov-Smirnov test assessed normality, after which appropriate parametric or non-parametric tests were applied. Differences between groups were analyzed using the independent t-test. Since the body composition data were not normally distributed, non-parametric tests (e.g., the Mann-Whitney U test) were employed. Pre- and post-test differences within each groups were analyzed utilizing the dependent t-test, except for the bench press test, which used the Wilcoxon signed-rank test. Statistical significance was set at a p < 0.05. Effect size (ES) was calculated following Cohen’s guidelines, with values above 0.8 denoting large effects, 0.5-0.8 medium effects, and 0.2-0.5 small effects.

3. Results

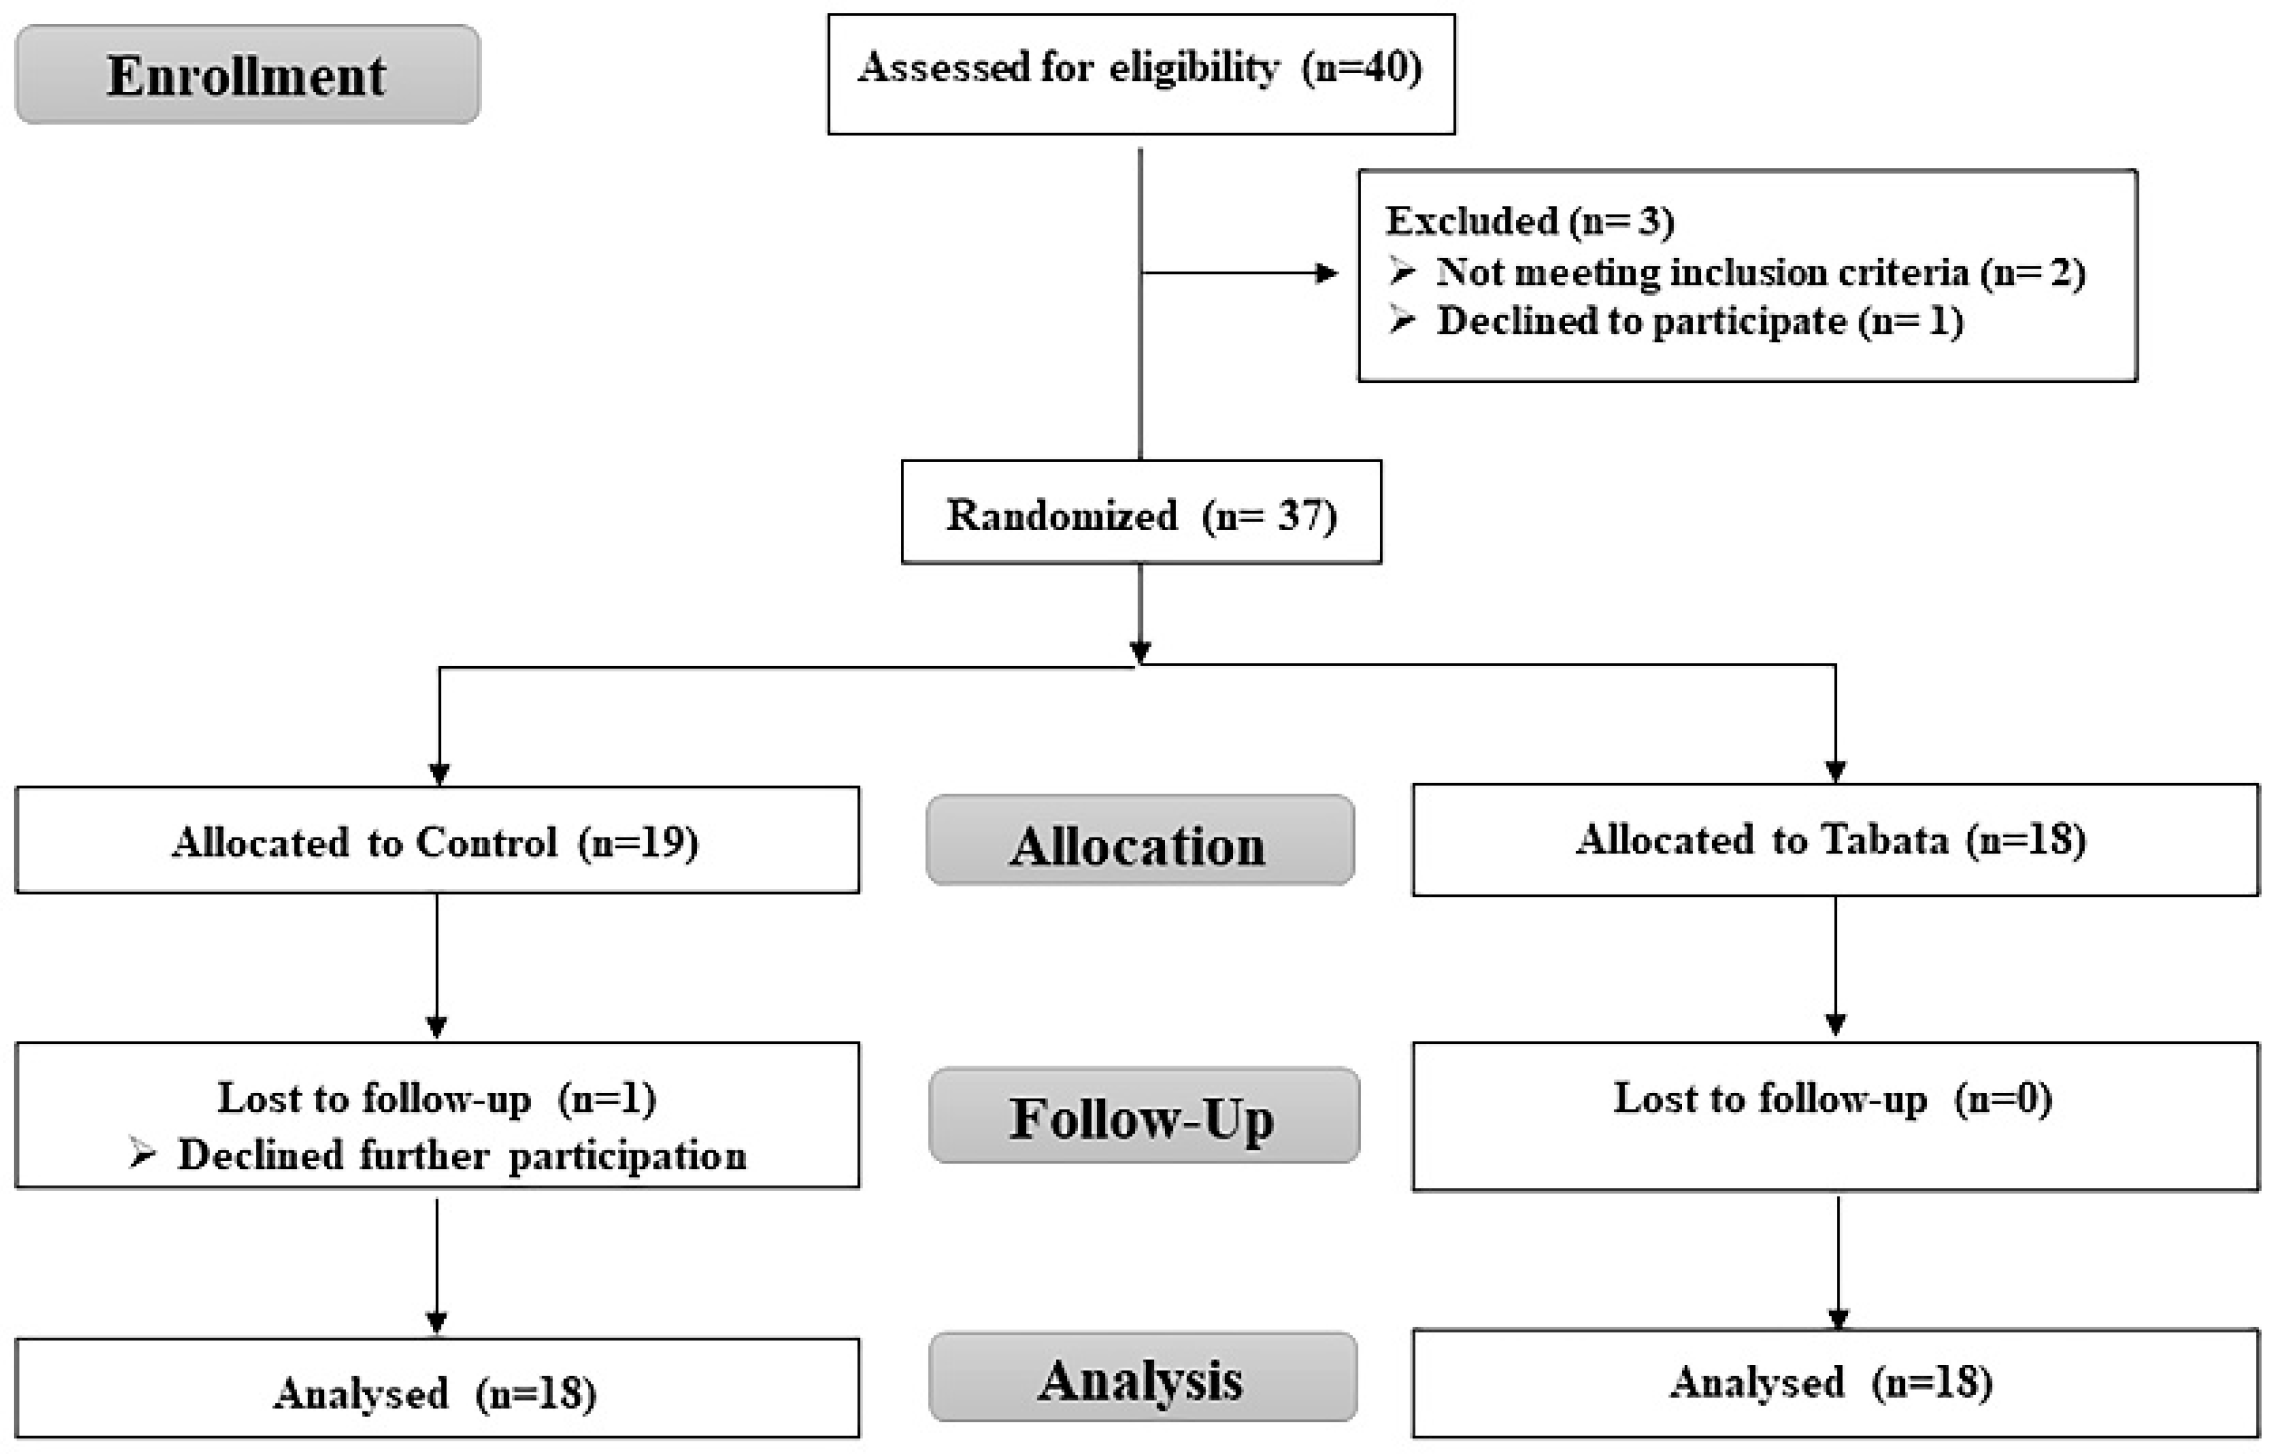
3.1. Participant characteristics and feasibility

Forty volunteers initially registered, 37 met the criteria and 36 completed the study with one control group participant withdrawing. The study enrollment process is illustrated in . Baseline characteristics are detailed in Table 1, with no significant groups differences (all p>0.05).
None of the Tabata group dropped out, and no serious adverse events occurred. The rating of perceive exertion ranged from 7-11 (warm-up), 13-17 (exercise) and 9-11 (cool-down). Minor adverse events, included leg muscle camp and dizziness in two participants, occurred during the 4th cycle of the final week, representing 11.11% of the training group. However, none discontinued training.

3.2. Impact on body composition

Pretest body composition showed no significant groups difference (Table 2, Table 3 and Table 4). After 12 weeks of training, changes in segmental muscle composition were observed. In the control group, both muscle mass and muscle percentage in the right leg decreased, as did the muscle percentage in the left leg compared to pretest values (all p<0.05). Conversely, the Tabata group had maintained muscle mass in both legs. Posttest comparisons between groups revealed that the Tabata group had greater right leg muscle mass by 0.18 ± 0.08 kg (p=0.031, ES=0.22), and improved muscle percentage in both leg (right: 2.08 ± 0.89%, p=0.026, ES=0.63; left: 1.82 ± 0.86%, p=0.043, ES=0.67). The control group increased abdominal fat and fat percentage (all p<0.05), while the Tabata group showed no changes. Notably, the Tabata group had a significantly lower waist-to-hip ratio (WHR) by 0.02 ± 0.01 relative to the control group (p=0.043, ES=0.83).

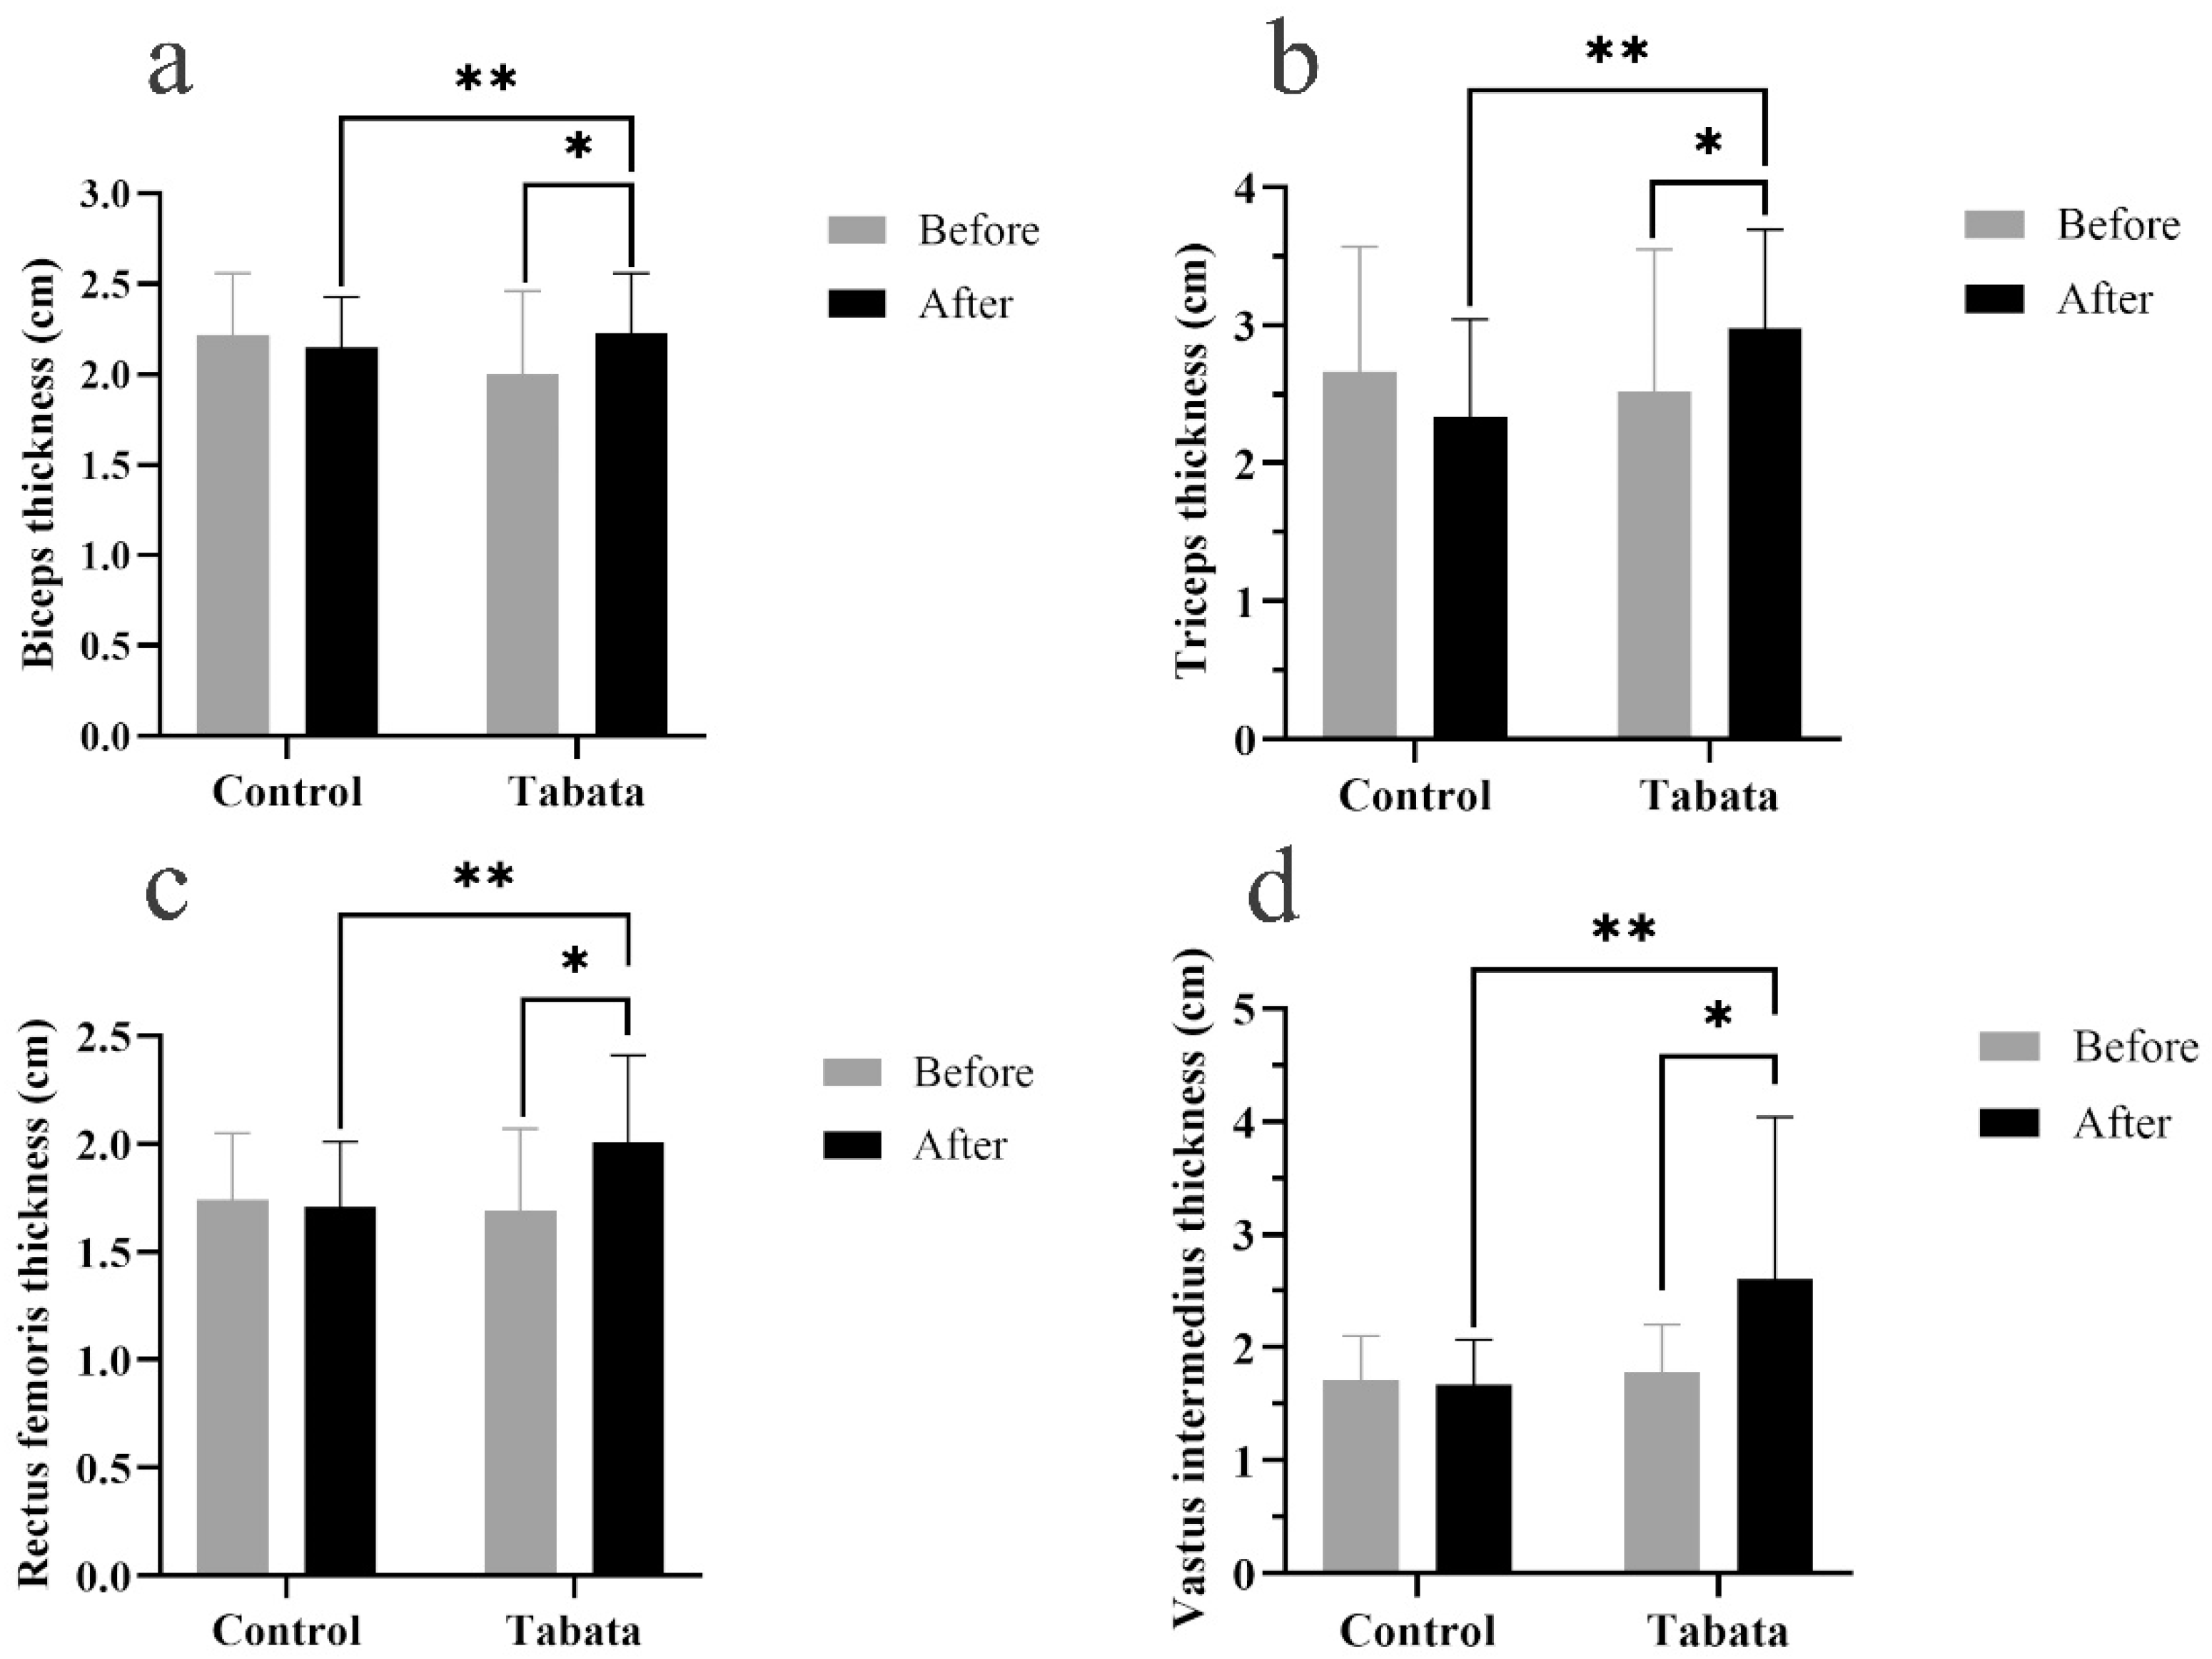
3.3. Impact on muscle thickness

The Tabata group significant increases in muscle thickness: biceps by 0.30 ± 0.08 cm, triceps by 0.78 ± 0.25 cm, rectus femoris by 0.35 ± 0.10 cm, and vastus intermedius by 0.85 ± 0.34 cm compared to both pretest (all p <0.05) and control group (p=0.001, ES=0.26; p=0.028, ES=0.90; p=0.003, ES=0.84; p=0.004, ES=0.88, respectively), as shown in .
Figure 3. Biceps muscle thickness (a), triceps muscle thickness (b), rectus femoris muscle thickness (c), and vastus intermedius muscle thickness (d) of participants in control and Tabata groups before and after 12-weeks intervention.*; p<0.05 vs. before intervention, **; p<0.05 vs. control group.
Preprints 148591 g003
Figure 4. Ultrasound imaging demonstrates muscle thickness of participants in control and Tabata groups before and after 12-weeks intervention. (a) a transverse scan of biceps muscle (BB), with the hyperechoic, curvilinear structure in the lower part of the image representing the humerus (HM). (b) a transverse scan of triceps muscle (TC), where the hyperechoic, curvilinear structure in the lower part of the image corresponds to the HM. (c) a transverse scan of quadriceps muscle, comprising the rectus femoris (RF) and vastus intermedius (VI); the hyperechoic, curvilinear structure in the lower part of the image represents the femur (FM). The solid straight lines indicate the method used to measure the thickness of each muscle.
Preprints 148591 g004

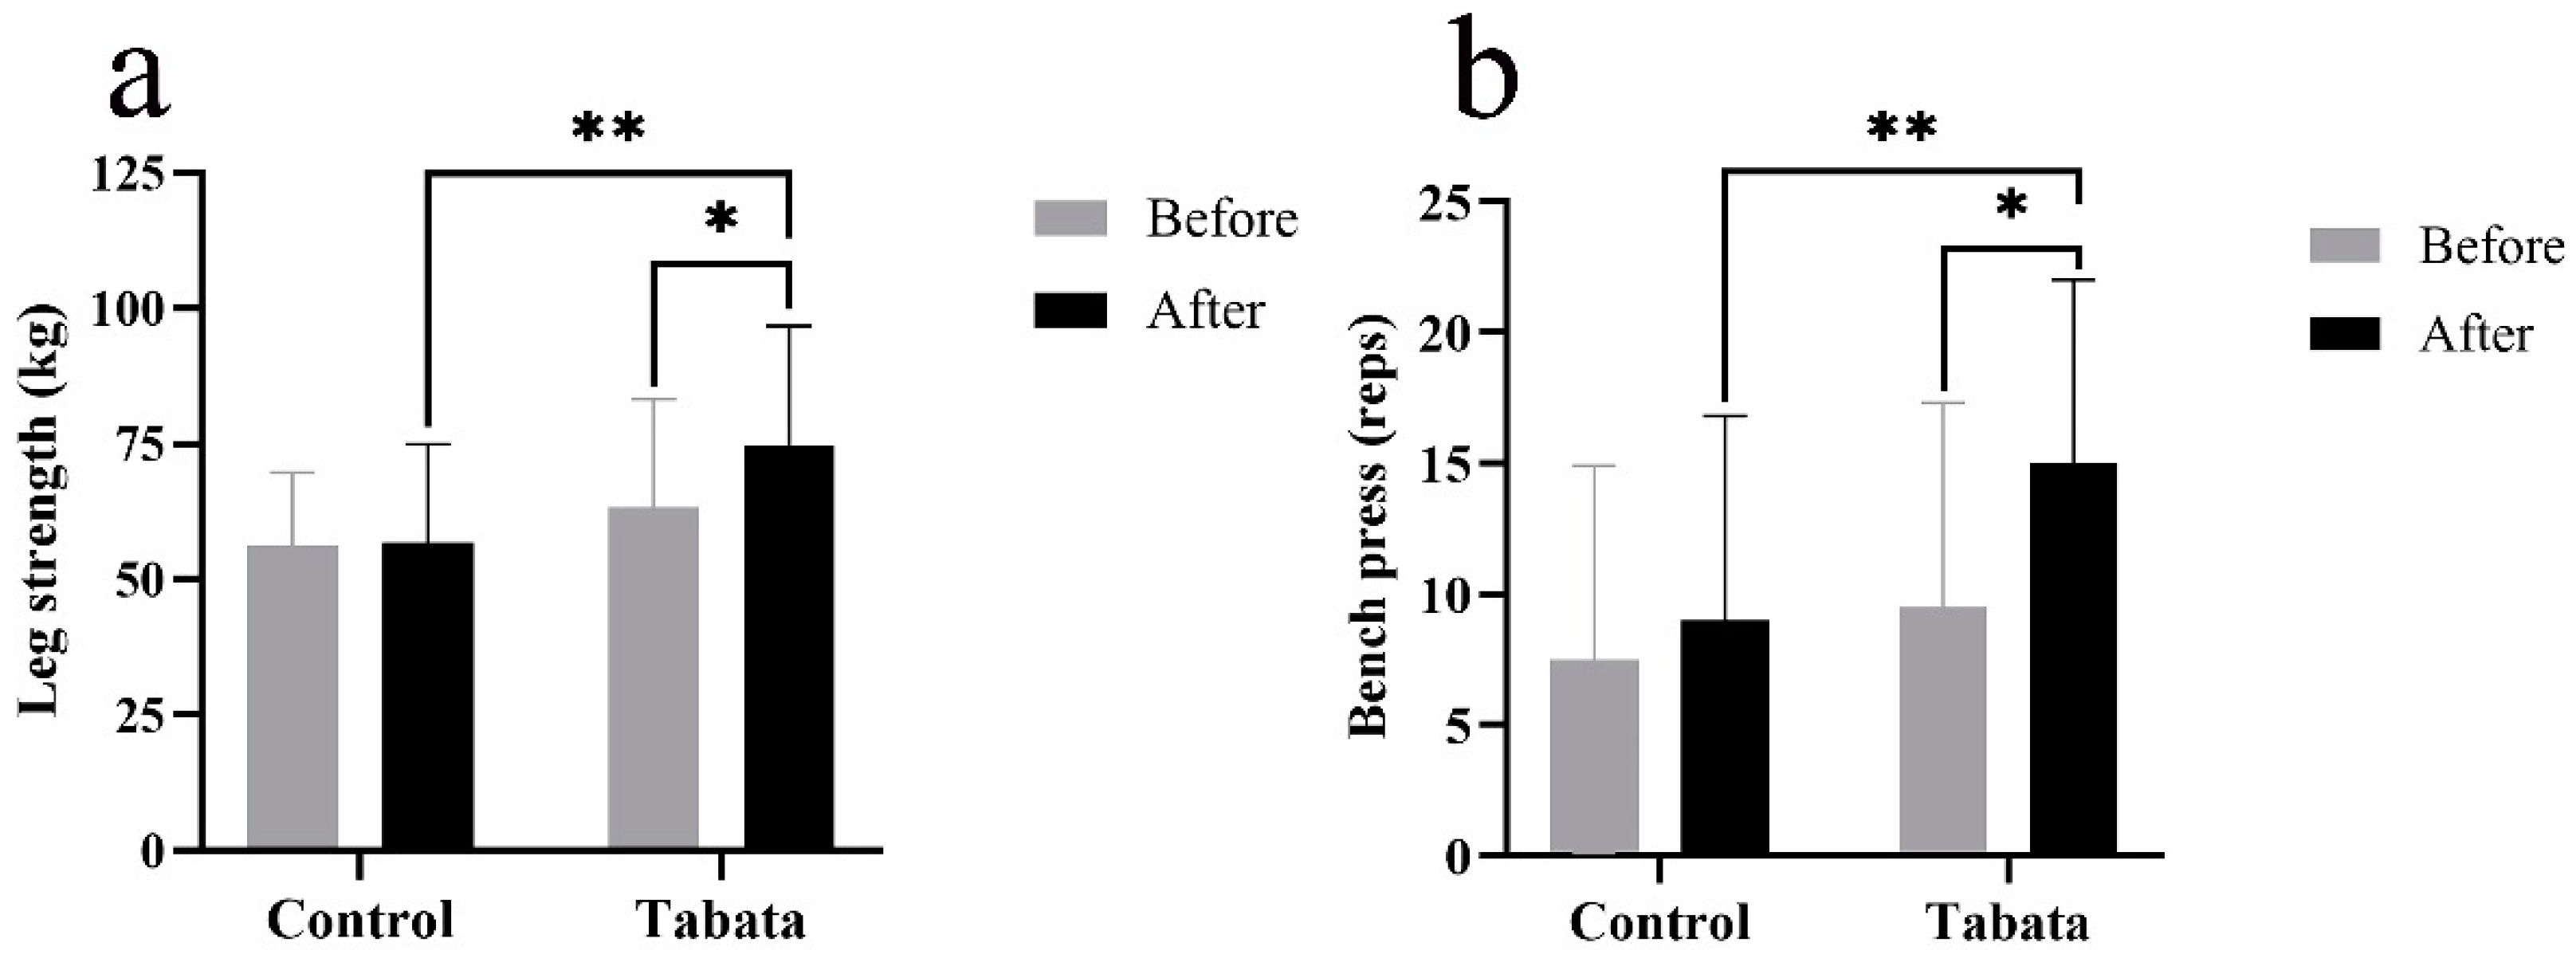
3.4. Impact on physical fitness

Tabata group showed improvement in lower body muscle strength, as evidenced by an increase in weight lifted by 10.93 ± 4.27 kg compared to both the pretest (p=0.004) and the control group (p=0.015, ES=0.89) (a). Upper body muscle endurance also improved, as indicated by an increase in bench press repetitions by 5.00 ± 7.80, compared to both the pretest (p<0.001) and control group (p<0.001, ES=0.47) (b).
Figure 5. Leg muscle strength (a) and arm muscle endurance (Bench press) (b) of participants in control and Tabata groups before and after 12-weeks intervention. *; p<0.05 vs. before intervention, **; p<0.05 vs. control group.
Preprints 148591 g005

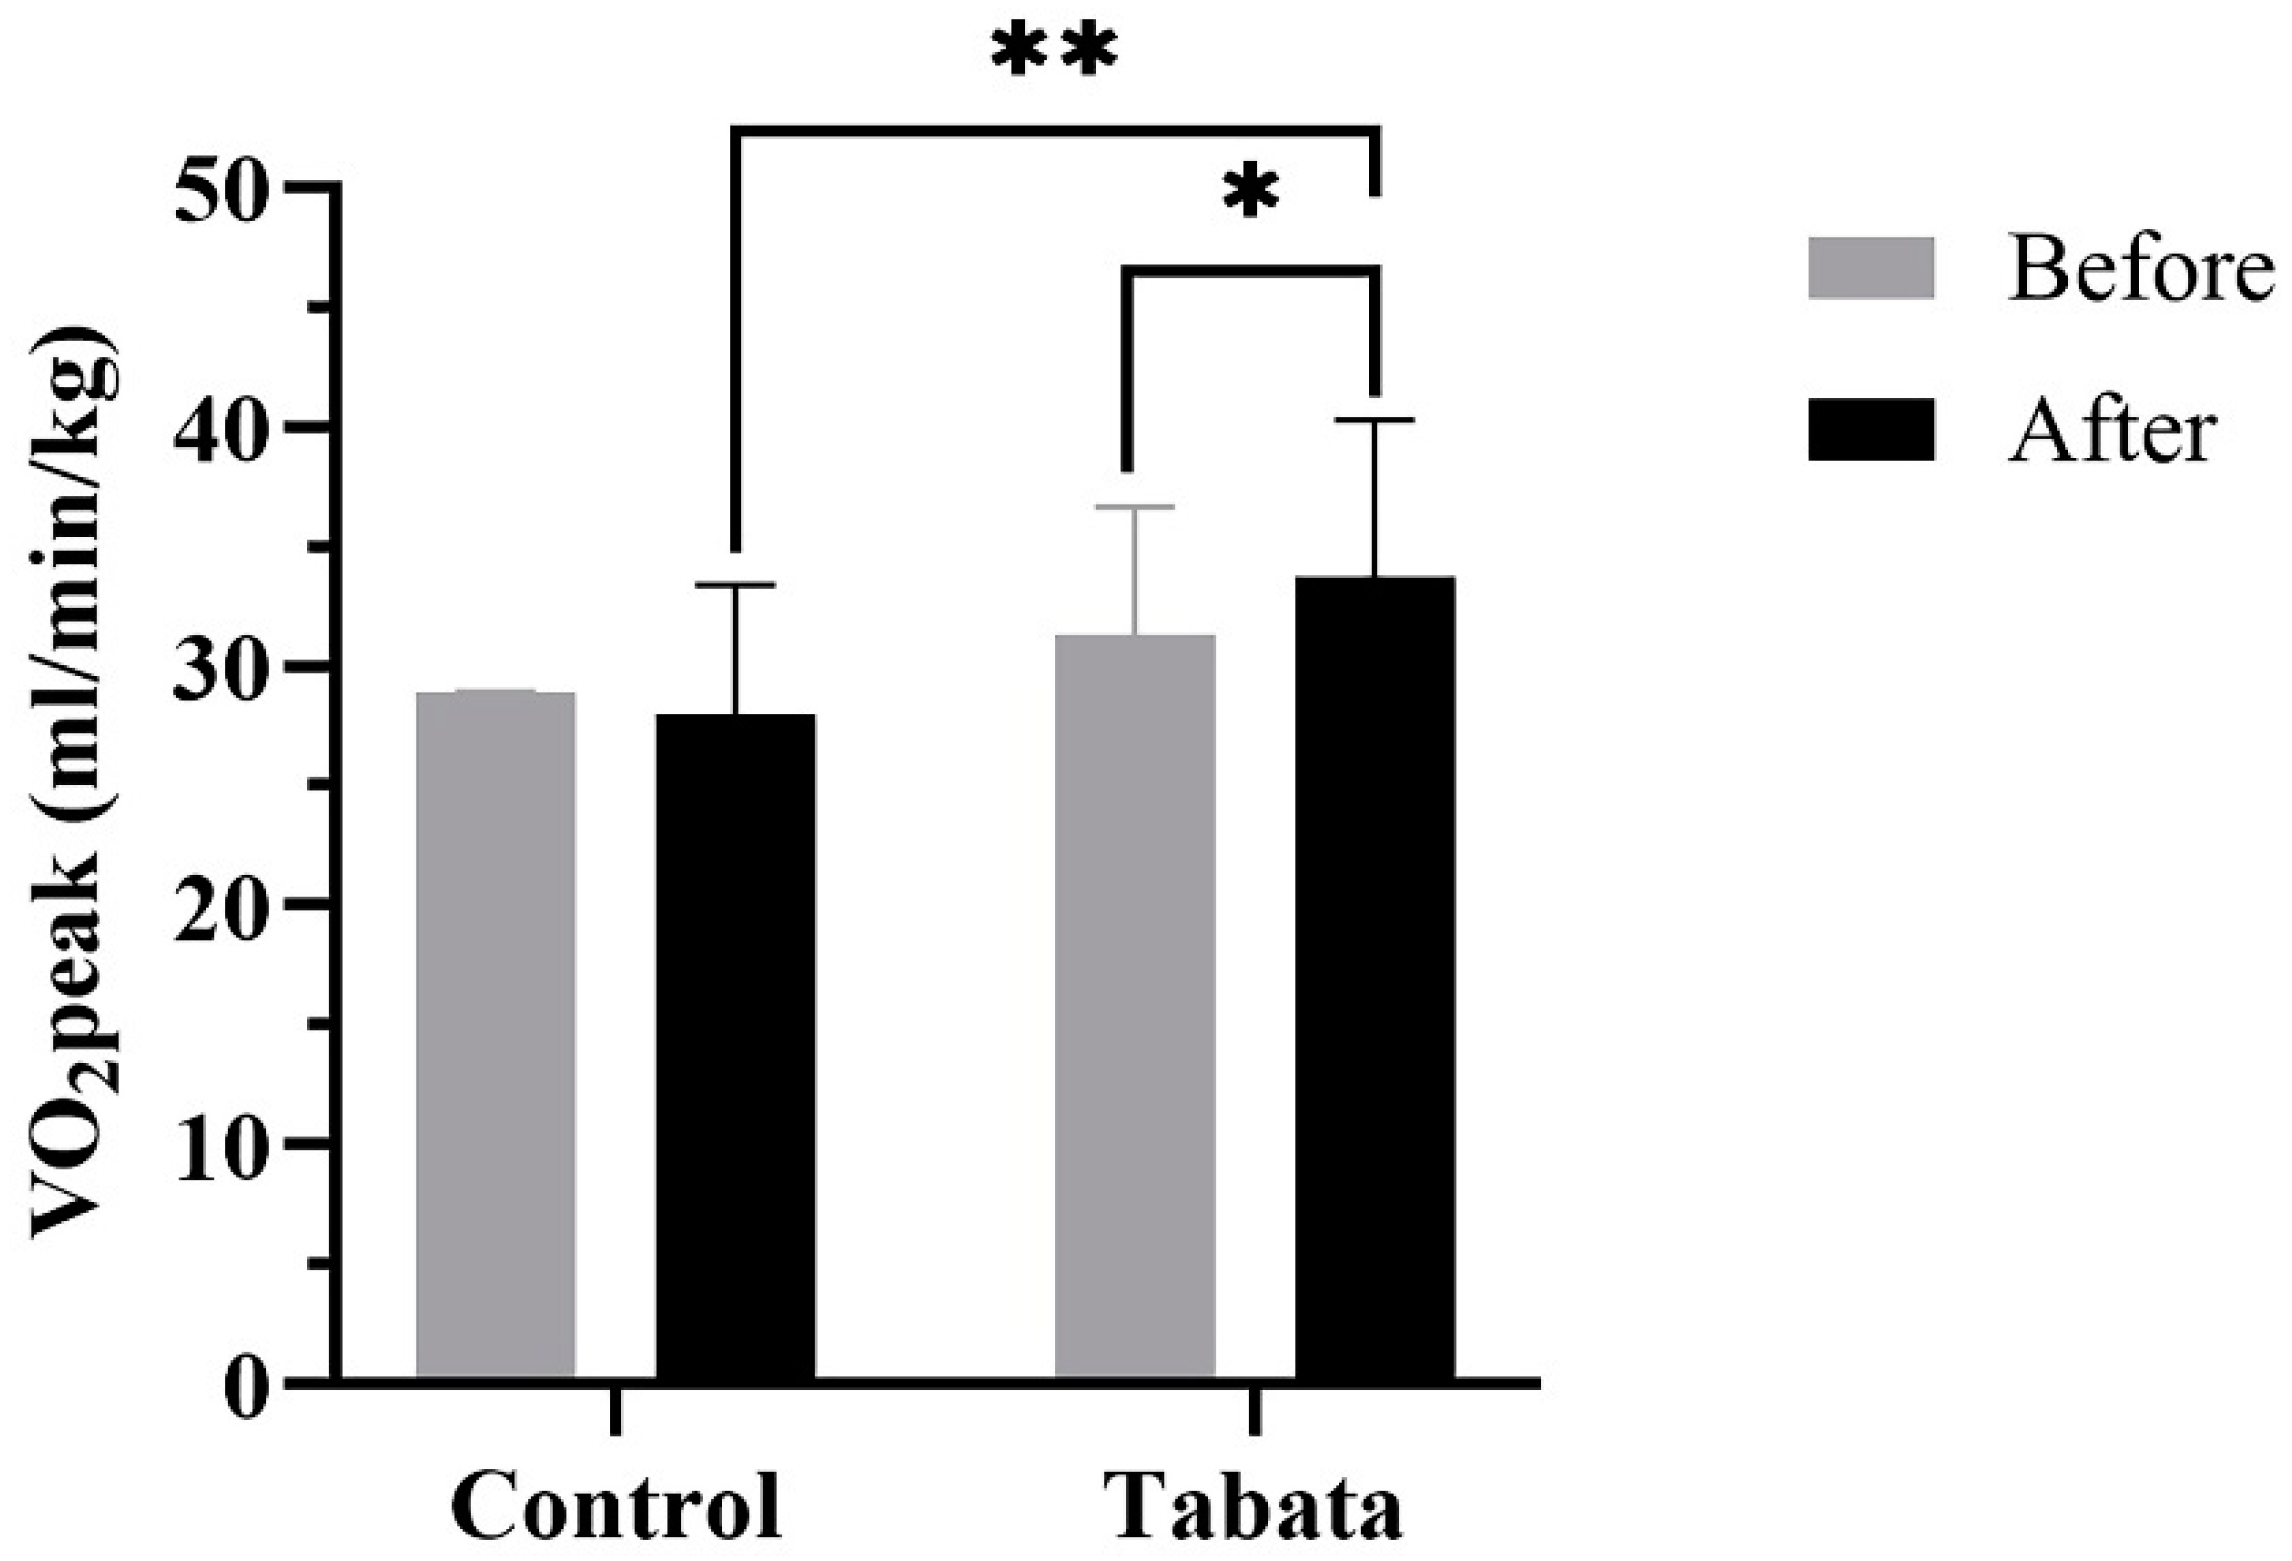
3.5. Impact on cardiorespiratory fitness

There were no significant differences in cardiorespiratory fitness between the two groups at pretest (Table 5 and Figure 6). After 12-week, the control group showed a decrease resting VO2 by 0.50 ± 0.70 L/min/kg (p=0.008). The Tabata group demonstrated greater improvements in anaerobic threshold and aerobic capacity, with increased VT2 (2.33 ± 1.53 mL/min/kg; p=0.013) and VO2peak (3.33 ± 1.12 mL/min/kg; p=0.006, ES=0.56). Breathing frequency and RER increased in both groups, but no significant group differences.

4. Discussion

This randomized control study provides evidence that the 12 weeks of modified Tabata training was safe and effective for overweight and obese participants. The program reduced WHR, enhanced leg muscle mass, and increased arm and leg muscle thickness, which collectively resulted in improvements in leg strength and arm endurance as well as aerobic capacity.
This progressive body-weight HIIT program was design based on biomechanical principles. The four body-weight exercises including squat jumps with toe touches and alternating reverse lunges, primarily targeted the leg muscles (quadriceps, gastrocnemius) and core stabilizers (transversus abdominis, multifidus). Additionally, mountain climbers and burpees with toe touches engaged not only the leg and core muscles, but also upper limb muscles (biceps, triceps, pectoralis). This training was designed to reduce exhaustion and prevent dropout[19]. As expectation, all participants in the Tabata group completed the sessions. To reduce impact on lower limp joints and minimize injury risk during unsupervised exercise, we modified squat jumps and burpees by replacing jumps with standing on tiptoes. No participants experienced joint injuries, thus confirming our initial presuppositions.

4.1. Modified Tabata training improves body proportions

A recent systematic review revealed that HIIT has the potential to facilitate weight loss in overweight and obese individuals [29]. Other investigations also reported the positive effects, such as a 12-week HIIT program reducing body weight by 5.7 kg (8.3-3.1 kg) in obese adults [30,31]. However, the Tabata group did not demonstrate changes in either body weight or BMI; only minor changes were observed, similar to previous study [32]. Furthermore, a systematic review also showed that HIIT can induce modest body composition improvements in overweight individuals without affecting body weight [33].
Following the12-week HIIT intervention, the Tabata group displayed reduced WHR, leading to a more proportionate physique, similar to a previous study that showed reduced WHR and visceral fat in obese women [34]. However, only minimal reductions in other body composition indices were observed. The insignificance might be attributed to the lower exercise intensity in this study (75-85% HRmax) relative to previous studies which rendered more positive results (90-95% HRmax). This can be highlighted whereby heterogeneities in intensity and duration gain diverse outcomes. For example, Astorino et al. used 12-week HIIT protocol (~75-95% HRmax) did not affect body weight and WHR [35]. Similarly, two recent studies revealed no changes in body weight or body composition in sedentary, overweight, or obese individual following HIIT [36]. From a mechanistic point of view, two possible explanations for the lack of body weight or composition improvements are increased energy intake from exercise’s effect on appetite and decreased non-exercise activity thermogenesis to compensate for the increase in exercise-induced energy expenditure [37,38].

4.2. Modified Tabata training improves muscle thickness

HIIT has been demonstrated effective in overweight and obese populations in terms of increasing muscle thickness. Previous studies reported increase in vastus lateralis muscle thickness after 12 weeks of HIIT (Δ change = -3.17 ± 3.36 cm2) compared to traditional strength training, e.g., sprints, (Δ change = -0.34 ± 2.36 cm2). The effects of HIIT on upper-body muscle thickness are less well documented; however, when HIIT protocols incorporate upper-body resistance exercises, such as push-ups, they also lead to increased muscle thickness [39]. Meanwhile, this study’s findings align with previous studies whereby exercise types engaging both upper and lower limb muscles e.g., mountain climbers and burpees with toe touches, led to increased upper limb muscle thickness [40].
The hypertrophic effects of HIIT are attributed to increased muscle fiber recruitment, metabolic stress, and hormonal responses, including elevate levels of growth hormone and testosterone - both of which are linked to muscle growth [41,42]. The nature of HIIT induces metabolic stress which is a key factor driving muscle hypertrophy [43].

4.3. Modified Tabata training improves muscle strength and endurance

Studies demonstrated that HIIT, particularly with sprinting or jumping, improves lower body strength due to its high intensity [44]. Again, the effects on upper body strength is generally less pronounced. Yet, when HIIT protocols include upper-body resistance exercises such as push-ups, can improve in upper-body strength [45]. Our study is consistent with prior research i.e. exercises involving both upper and lower limb muscles contribute to increased muscle strength40.The enhancement of strength by HIIT is thought to result from several factors including the recruitment of fast-twitch muscle fiber and neuromuscular adaptations [46].
Besides that, studies on HIIT’s effects on muscle endurance are limited. However, HIIT has been demonstrated to augment muscle endurance by enhancing muscular enzyme content and activity [14]. A 4-week running and body-weight HIIT study reported enhance muscle endurance, as evidenced by more burpees and toes-to-bar repetitions [47]. These findings are consistent with our study of increase in bench press repetition. Moreover, sprint and cycling HIIT increased mitochondrial [48] and glycolytic enzyme activites [16]. These changes indicate that HIIT enhances protein expression, muscle adaptation, and energy expenditure in both anaerobic and aerobic systems.

4.4. Modified Tabata training improves cardiorespiratory fitness

Tabata group enhanced aerobic capacity. In line with this, a systematic review encompassing 15 randomized controlled trials indicated HIIT more effective than traditional exercise in increasing VO2max [32]. Previous studies with obese and elderly participants also showed that 12-16 weeks of HIIT improved VO2max and cardiovascular health. These studies also highlighted HIIT’s effectiveness in reducing enhancing cardiovascular health [49,50]. One of the possible important changes post modified Tabata training in the form of HIIT may enhance muscle buffer capacity which results in proportional glycolytic ATP production [51,52]. Furthermore, as reported in a review by Torma et al.[53], HIIT activates key pathways that enhance mitochondrial biogenesis and angiogenesis in skeletal muscle.
What’s more, after identifying significant differences between the control and Tabata groups, Pearson correlation analysis revealed a positive correlation between VO2peak and VT2 (r = 0.844, p<0.001). Kendall correlation analysis identified a negative relationship between WHR and VT2 (r = - 0.456, p = 0.008). The observed relationships suggest that modified Tabata training might enhance VO2peak, potentially due to more efficient utilization of anaerobic energy pathways. Besides, as visceral fat proportion increases, aerobic energy pathways declines.

4.5. Limitations of study

The study has several limitations. Firstly, the exercise program was home-based, with an adherence rate 89.87% and 100% compliance in the Tabata group. Exercise frequency and intensity were monitored online, and participants recorded their perceived exertion. To ensure accuracy and maintain intensity, participants were required to visit the research room every 4 weeks for guidance amid subsequent sessions. Although monitored online, supervised programs may yield better adherence and control. Future study should implement supervised exercise programs in a controlled setting and HR tracking should be used to enhance reliability. Secondly, eating behaviors were not strictly controlled due to being ecologically practicable and reliant on self-reported data. This limitation is particularly relevant the control group, as changes in body composition could be influenced by unreported dietary factors. In future research, implementing more stringent dietary control or more reliable monitoring methods is recommended. Lastly, the impact of variables like increased protein intake and metabolic hormones (e.g., growth hormone, testosterone) was unaccounted for. Hence, future study ought to consider the factors.

5. Conclusions

Modified Tabata training, a progressively body-weight HIIT over 12 weeks proved safe and effective for overweight and obese participants. It improves in WHR, leg muscle mass, and arm and leg muscle thickness. Furthermore, these improvements led to improvements in physical fitness due to increased muscle strength and endurance, and cardiorespiratory fitness through increased aerobic capacity. These results suggest that such training displays potential in terms of improving body proportion and overall health among overweight and obese populations.

Author Contributions

Conceptualization, P.P. and T.P.; methodology, P.P. and T.P.; software, T.P.; validation, T.P., formal analysis, T.P.; investigation, T.P.; resources, P.P.; data curation, T.P.; writing—original draft preparation, T.P.; writing—review and editing, P.P.; visualization, T.P.; supervision, P.P.; project administration, P.P.; funding acquisition, P.P. All authors have read and agreed to the published version of the manuscript.

Funding

This research was funded by National Research Council of Thailand, grant number N41A660293/2566; Graduated School, grant number 0118/2565 and Faculty of Allied Health Sciences, Burapha University.

Institutional Review Board Statement

The study was conducted in accordance with the Declaration of Helsinki, and approved by the Institutional Review Board of Burapha University (protocol ID: G-HS018/2565 and approval date 24 May 2022).

Informed Consent Statement

Informed consent was obtained from all subjects involved in the study.

Data Availability Statement

The data are available by request to the corresponding author.

Acknowledgments

The authors appreciate all volunteers participated in this study.

Conflicts of Interest

The authors declare no conflicts of interest.”.

Abbreviations

The following abbreviations are used in this manuscript:
BB Biceps muscle
BF Body fat
BMI Body mass index
BMR Basal metabolic rate
BW Body weight
DBP Diastolic blood pressure
ES Effect size
FFM Fat-free mass
FMs Fat mass
FM Femur
HM Humerus
HIIT High-intensity intermittent training
HR Heart rate
HRmax Maximal heart rate
MAP Mean arterial pressure
MM Muscle mass
RER Respiratory exchange ratio
RF Rectus femoris muscle
RR Respiratory rate
SBP Systolic blood pressure
SpO2 Partial oxygen saturation
TC Triceps muscle
VCO2 Carbon dioxide production
VI Vastus intermedius muscle
VO2 Oxygen uptake
VO2max Maximal oxygen consumption
VT Ventilatory threshold
WHO World health organization
WHR Waist-hip ratio

References

  1. Murray, C.J.L.; Aravkin, A.Y.; Zheng, P.; Abbafati, C.; Abbas, K.M.; Abbasi-Kangevari, M.; Abd-Allah, F.; Abdelalim, A.; Abdollahi, M.; Abdollahpour, I.; et al. Global burden of 87 risk factors in 204 countries and territories, 1990&#x2013;2019: a systematic analysis for the Global Burden of Disease Study 2019. The Lancet 2020, 396, 1223–1249. [Google Scholar] [CrossRef]
  2. Okunogbe, A.; Nugent, R.; Spencer, G.; Powis, J.; Ralston, J.; Wilding, J. Economic impacts of overweight and obesity: current and future estimates for 161 countries. BMJ Glob Health 2022, 7. [Google Scholar] [CrossRef]
  3. Safaei, M.; Sundararajan, E.A.; Driss, M.; Boulila, W.; Shapi'i, A. A systematic literature review on obesity: Understanding the causes & consequences of obesity and reviewing various machine learning approaches used to predict obesity. Computers in Biology and Medicine 2021, 136, 104754. [Google Scholar] [CrossRef]
  4. Pati, S.; Irfan, W.; Jameel, A.; Ahmed, S.; Shahid, R.K. Obesity and Cancer: A Current Overview of Epidemiology, Pathogenesis, Outcomes, and Management. Cancers (Basel) 2023, 15. [Google Scholar] [CrossRef]
  5. Chatterjee, A.; Gerdes, M.W.; Martinez, S.G. Identification of Risk Factors Associated with Obesity and Overweight—A Machine Learning Overview. Sensors 2020, 20, 2734. [Google Scholar] [CrossRef]
  6. Expert Panel Report: Guidelines (2013) for the management of overweight and obesity in adults. Obesity (Silver Spring), 2. [CrossRef]
  7. ACSM. ACSM information on high-intensity interval training. 2014.
  8. Tschakert, G.; Hofmann, P. High-Intensity Intermittent Exercise: Methodological and Physiological Aspects. International journal of sports physiology and performance 2013, 8. [Google Scholar] [CrossRef] [PubMed]
  9. Boutcher, S.H. High-intensity intermittent exercise and fat loss. J Obes 2011, 2011, 868305. [Google Scholar] [CrossRef]
  10. Cooper, S.B.; Dring, K.J.; Nevill, M.E. High-Intensity Intermittent Exercise: Effect on Young People's Cardiometabolic Health and Cognition. Curr Sports Med Rep 2016, 15, 245–251. [Google Scholar] [CrossRef]
  11. Cassidy, S.; Thoma, C.; Hallsworth, K.; Parikh, J.; Hollingsworth, K.G.; Taylor, R.; Jakovljevic, D.G.; Trenell, M.I. High intensity intermittent exercise improves cardiac structure and function and reduces liver fat in patients with type 2 diabetes: a randomised controlled trial. Diabetologia 2016, 59, 56–66. [Google Scholar] [CrossRef]
  12. Tabata, I. Tabata training: one of the most energetically effective high-intensity intermittent training methods. J Physiol Sci 2019, 69, 559–572. [Google Scholar] [CrossRef]
  13. Tabata, I.; Nishimura, K.; Kouzaki, M.; Hirai, Y.; Ogita, F.; Miyachi, M.; Yamamoto, K. Effects of moderate-intensity endurance and high-intensity intermittent training on anaerobic capacity and VO2max. Med Sci Sports Exerc 1996, 28, 1327–1330. [Google Scholar] [CrossRef]
  14. Tabata, I.; Irisawa, K.; Kouzaki, M.; Nishimura, K.; Ogita, F.; Miyachi, M. Metabolic profile of high intensity intermittent exercises. Med Sci Sports Exerc 1997, 29, 390–395. [Google Scholar] [CrossRef] [PubMed]
  15. Viana, R.B.; de Lira, C.A.B.; Naves, J.P.A.; Coswig, V.S.; Del Vecchio, F.B.; Gentil, P. Tabata protocol: a review of its application, variations and outcomes. Clin Physiol Funct Imaging 2019, 39, 1–8. [Google Scholar] [CrossRef] [PubMed]
  16. Miyamoto-Mikami, E.; Tsuji, K.; Horii, N.; Hasegawa, N.; Fujie, S.; Homma, T.; Uchida, M.; Hamaoka, T.; Kanehisa, H.; Tabata, I.; et al. Gene expression profile of muscle adaptation to high-intensity intermittent exercise training in young men. Sci Rep 2018, 8, 16811. [Google Scholar] [CrossRef]
  17. Chuensiri, N.; Suksom, D.; Tanaka, H. Effects of High-Intensity Intermittent Training on Vascular Function in Obese Preadolescent Boys. Child Obes 2018, 14, 41–49. [Google Scholar] [CrossRef]
  18. Logan, G.R.; Harris, N.; Duncan, S.; Plank, L.D.; Merien, F.; Schofield, G. Low-Active Male Adolescents: A Dose Response to High-Intensity Interval Training. Med Sci Sports Exerc 2016, 48, 481–490. [Google Scholar] [CrossRef] [PubMed]
  19. Ekkekakis, P.; Hall, E.E.; Petruzzello, S.J. The relationship between exercise intensity and affective responses demystified: to crack the 40-year-old nut, replace the 40-year-old nutcracker! Ann Behav Med 2008, 35, 136–149. [Google Scholar] [CrossRef]
  20. World Health Organization. Regional Office for the Western, P. The Asia-Pacific perspective : redefining obesity and its treatment; Sydney : Health Communications Australia: 2000.
  21. Triyulianti S, P.A. , Utami R. The Effect of High Intensity Interval Training on Maximal Oxygen Uptake (VO2max) in Overweight Adolescents. International Journal of Aging Health and Movement 2023, 5, 21–28. [Google Scholar] [CrossRef]
  22. Faul, F.; Erdfelder, E.; Lang, A.-G.; Buchner, A. G*Power 3: A flexible statistical power analysis program for the social, behavioral, and biomedical sciences. Behavior Research Methods 2007, 39, 175–191. [Google Scholar] [CrossRef]
  23. Hentzen, J.; van Wijk, L.; Buis, C.; Viddeleer, A.; Bock, G.; van der Schans, C.; Dam, G.; Kruijff, S.; Klaase, J. Impact and risk factors for clinically relevant surgery-related muscle loss in patients after major abdominal cancer surgery: study protocol for a prospective observational cohort study (MUSCLE POWER). International Journal of Clinical Trials 2019, 6, 138. [Google Scholar] [CrossRef]
  24. Spineti, J.; Figueiredo, T.; Miranda, H.; de Salles, B.; Oliveira, L.; Simão, R. The effects of exercise order and periodized resistance training on maximum strength and muscle thickness. International SportMed Journal 2014, 15, 374–390. [Google Scholar]
  25. American College of Sports, M. ACSM's guidelines for exercise testing and prescription; Sixth edition. Philadelphia : Lippincott Williams & Wilkins, [2000] ©2000: 2000.
  26. Bruce, R.A. Exercise testing of patients with coronary heart disease. Principles and normal standards for evaluation. Ann Clin Res 1971, 3, 323–332. [Google Scholar] [PubMed]
  27. Jalayondeja, C.; Jalayondeja, W.; Vachalathiti, R.; Bovonsunthonchai, S.; Sakulsriprasert, P.; Kaewkhuntee, W.; Bunprajun, T.; Upiriyasakul, R. Cross-Cultural Adaptation of the Compendium of Physical Activity: Thai Translation and Content Validity. J Med Assoc Thai 2015, 98 Suppl 5, S53–59. [Google Scholar]
  28. Baecke, J.A.; Burema, J.; Frijters, J.E. A short questionnaire for the measurement of habitual physical activity in epidemiological studies. Am J Clin Nutr 1982, 36, 936–942. [Google Scholar] [CrossRef]
  29. Sanca-Valeriano, S.; Espinola-Sánchez, M.; Caballero-Alvarado, J.; Canelo-Aybar, C. Effect of high-intensity interval training compared to moderate-intensity continuous training on body composition and insulin sensitivity in overweight and obese adults: A systematic review and meta-analysis. Heliyon 2023, 9, e20402. [Google Scholar] [CrossRef]
  30. D'Amuri, A.; Sanz, J.M.; Capatti, E.; Di Vece, F.; Vaccari, F.; Lazzer, S.; Zuliani, G.; Dalla Nora, E.; Passaro, A. Effectiveness of high-intensity interval training for weight loss in adults with obesity: a randomised controlled non-inferiority trial. BMJ Open Sport Exerc Med 2021, 7, e001021. [Google Scholar] [CrossRef] [PubMed]
  31. Airin, S.; Linoby, A.; Mohamad Zaki, M.S.; Baki, H.; Sariman, H.; Esham, B.; Mohd Azam, M.Z.; Mohamed, M.N. The Effects of High-Intensity Interval Training and Continuous Training on Weight Loss and Body Composition in Overweight Females. In Proceedings of the Proceedings of the International Colloquium on Sports Science, Exercise, Engineering and Technology 2014 (ICoSSEET 2014), Singapore, 2014//, 2014.
  32. Türk, Y.; Theel, W.; Kasteleyn, M.J.; Franssen, F.M.E.; Hiemstra, P.S.; Rudolphus, A.; Taube, C.; Braunstahl, G.J. High intensity training in obesity: a Meta-analysis. Obes Sci Pract 2017, 3, 258–271. [Google Scholar] [CrossRef]
  33. Wewege, M.; van den Berg, R.; Ward, R.E.; Keech, A. The effects of high-intensity interval training vs. moderate-intensity continuous training on body composition in overweight and obese adults: a systematic review and meta-analysis. Obes Rev 2017, 18, 635–646. [Google Scholar] [CrossRef]
  34. Ardavani, A.; Aziz, H.; Smith, K.; Atherton, P.J.; Phillips, B.E.; Idris, I. The Effects of Very Low Energy Diets and Low Energy Diets with Exercise Training on Skeletal Muscle Mass: A Narrative Review. Adv Ther 2021, 38, 149–163. [Google Scholar] [CrossRef]
  35. Astorino, T.A.; Schubert, M.M.; Palumbo, E.; Stirling, D.; McMillan, D.W. Effect of two doses of interval training on maximal fat oxidation in sedentary women. Medicine & Science in Sports & Exercise 2013, 45, 1878–1886. [Google Scholar]
  36. Tjønna, A.E.; Stølen, T.O.; Bye, A.; Volden, M.; Slørdahl, S.A.; Ødegård, R.; Skogvoll, E.; Wisløff, U. Aerobic interval training reduces cardiovascular risk factors more than a multitreatment approach in overweight adolescents. Clinical science 2009, 116, 317–326. [Google Scholar] [CrossRef]
  37. King, N.A.; Caudwell, P.; Hopkins, M.; Byrne, N.M.; Colley, R.; Hills, A.P.; Stubbs, J.R.; Blundell, J.E. Metabolic and behavioral compensatory responses to exercise interventions: barriers to weight loss. Obesity 2007, 15, 1373–1383. [Google Scholar] [CrossRef]
  38. Melanson, E.L.; Keadle, S.K.; Donnelly, J.E.; Braun, B.; King, N.A. Resistance to exercise-induced weight loss: compensatory behavioral adaptations. Medicine and science in sports and exercise 2013, 45, 1600. [Google Scholar] [CrossRef]
  39. Blue, M.N.; Smith-Ryan, A.E.; Trexler, E.T.; Hirsch, K.R. The effects of high intensity interval training on muscle size and quality in overweight and obese adults. Journal of science and medicine in sport 2018, 21, 207–212. [Google Scholar] [CrossRef]
  40. Abe, T.; DeHoyos, D.V.; Pollock, M.L.; Garzarella, L. Time course for strength and muscle thickness changes following upper and lower body resistance training in men and women. Eur J Appl Physiol 2000, 81, 174–180. [Google Scholar] [CrossRef]
  41. Wideman, L.; Weltman, J.; Hartman, M.; Johannes, D.; Weltman, A. Growth Hormone Release During Acute and Chronic Aerobic and Resistance Exercise. Sports medicine (Auckland, N.Z.) 2002, 32, 987–1004. [Google Scholar] [CrossRef]
  42. Francois, M.E.; Little, J.P. Effectiveness and safety of high-intensity interval training in patients with type 2 diabetes. Diabetes Spectr 2015, 28, 39–44. [Google Scholar] [CrossRef]
  43. Zaroni, R.S.; Brigatto, F.A.; Schoenfeld, B.J.; Braz, T.V.; Benvenutti, J.C.; Germano, M.D.; Marchetti, P.H.; Aoki, M.S.; Lopes, C.R. High Resistance-Training Frequency Enhances Muscle Thickness in Resistance-Trained Men. J Strength Cond Res 2019, 33 Suppl 1, S140–s151. [Google Scholar] [CrossRef]
  44. McRae, G.; Payne, A.; Zelt, J.G.; Scribbans, T.D.; Jung, M.E.; Little, J.P.; Gurd, B.J. Extremely low volume, whole-body aerobic-resistance training improves aerobic fitness and muscular endurance in females. Appl Physiol Nutr Metab 2012, 37, 1124–1131. [Google Scholar] [CrossRef]
  45. Caparrós-Manosalva, C.; Garrido-Muñoz, N.; Alvear-Constanzo, B.; Sanzana-Laurié, S.; Artigas-Arias, M.; Alegría-Molina, A.; Vidal-Seguel, N.; Espinoza-Araneda, J.; Huard, N.; Pagnussat, A.S.; et al. Effects of high-intensity interval training on lean mass, strength, and power of the lower limbs in healthy old and young people. Frontiers in Physiology 2023, 14. [Google Scholar] [CrossRef]
  46. Laursen, P.B.; Jenkins, D.G. The scientific basis for high-intensity interval training: optimising training programmes and maximising performance in highly trained endurance athletes. Sports Med 2002, 32, 53–73. [Google Scholar] [CrossRef] [PubMed]
  47. Menz, V.; Marterer, N.; Amin, S.B.; Faulhaber, M.; Hansen, A.B.; Lawley, J.S. Functional vs. Running low-volume high-intensity interval training: Effects on vo2max and muscular endurance. Journal of sports science & medicine 2019, 18, 497. [Google Scholar]
  48. Gibala, M.J.; McGee, S.L. Metabolic adaptations to short-term high-intensity interval training: a little pain for a lot of gain? Exerc Sport Sci Rev 2008, 36, 58–63. [Google Scholar] [CrossRef] [PubMed]
  49. Rohmansyah, N.A.; Ka Praja, R.; Phanpheng, Y.; Hiruntrakul, A. High-Intensity Interval Training Versus Moderate-Intensity Continuous Training for Improving Physical Health in Elderly Women. Inquiry 2023, 60, 469580231172870. [Google Scholar] [CrossRef]
  50. Tjønna, A.E.; Lee, S.J.; Rognmo, Ø.; Stølen, T.O.; Bye, A.; Haram, P.M.; Loennechen, J.P.; Al-Share, Q.Y.; Skogvoll, E.; Slørdahl, S.A.; et al. Aerobic Interval Training Versus Continuous Moderate Exercise as a Treatment for the Metabolic Syndrome. Circulation 2008, 118, 346–354. [Google Scholar] [CrossRef]
  51. Bo, B.; Guo, A.; Kaila, S.J.; Hao, Z.; Zhang, H.; Wei, J.; Yao, Y. Elucidating the primary mechanisms of high-intensity interval training for improved cardiac fitness in obesity. Front Physiol 2023, 14, 1170324. [Google Scholar] [CrossRef]
  52. Sharp, R.L.; Costill, D.L.; Fink, W.J.; King, D.S. Effects of eight weeks of bicycle ergometer sprint training on human muscle buffer capacity. Int J Sports Med 1986, 7, 13–17. [Google Scholar] [CrossRef]
  53. Torma, F.; Gombos, Z.; Jokai, M.; Takeda, M.; Mimura, T.; Radak, Z. High intensity interval training and molecular adaptive response of skeletal muscle. Sports Med Health Sci 2019, 1, 24–32. [Google Scholar] [CrossRef] [PubMed]
Figure 1. CONSORT flow diagram.
Preprints 148591 g001
Figure 2. Phases of exercise training: warm up, 4-minute exercise cycle (body-weight-bearing based on Tabata training method), 4-minute active recovery, and cool down.
Preprints 148591 g002
Figure 6. Peak oxygen consumption (VO2peak) of participants in control and Tabata groups before and after 12-weeks intervention.*; p<0.05 vs. before intervention, **; p<0.05 vs. control group.
Preprints 148591 g006
Table 1. Physical and physiological characteristics of participants.
Control group
(n = 18)
Tabata group
(n = 18)
Number 18 18
Sex (n, male:female) 5:13 5:13
Age (years) 21.61 ± 2.06 20.72 ± 1.32
WHO BMI classification
(n, overweight:obese)
2:16 5:13
Physical activity score
- Pretest 7.01 ± 1.07 ± 0.99
- Posttest 6.96 ± 0.79 7.31 ± 1.22
Physical activity level
- Sedentary (n, %) 3 (17%) 3 (17%)
- Active (n, %) 11 (61%) 12 (66%)
- Athletic (n, %) 4 (22%) 3 (17%)
HR (/min) 77.22 ± 9.35 77.00 ± 9.83
RR (/min) 18.33 ± 3.29 16.11 ± 2.03
SBP (mmHg) 118.65 ± 16.16 118.31 ± 11.77
DBP (mmHg) 74.41 ± 12.54 73.94 ± 8.54
MAP (mmHg) 89.15 ± 13.04 88.73 ± 9.00
SpO2 (%) 97.78 ± 1.21 97.50 ± 1.29
BMI, Body Mass Index; DBP, Diastolic Blood Pressure; HR, Heart Rate; MAP, Mean Arterial Pressure; RR, Respiratory Rate; SBP, Systolic Blood Pressure; SpO2, Partial Oxygen Saturation; WHO, World Health Organization.
Table 2. Whole body composition of participants.
Control group (n = 18) Tabata group (n = 18) p-value of change between groups
Pretest Posttest Mean
change
Pretest Posttest Mean
change
BW (kg) 74.25 ± 19.70 73.85 ± 17.80 -0.20 ± 4.77 73.85 ± 28.05 74.70 ± 25.80 1.45 ± 2.78 0.281
Height (cm) 163.00 ± 9.06 163.11 ± 8.86 0.00 ± 0.00 163.00 ± 9.06 163.16 ± 8.77 -0.05 ± 0.23 0.956
BMI (kg/m2) 27.10 ± 5.15 28.00 ± 4.72 -0.05 ± 1.73 27.00 ± 7.47 27.75 ± 7.98 0.40 ± 1.13 0.269
MM (kg) 23.35 ± 7.80 23.55 ± 7.78 -0.30 ± 1.15 23.30 ± 9.85 23.60 ± 10.55 0.20 ± 1.38 0.290
FMs (kg) 31.00 ± 11.13 30.00 ± 9.52 0.25 ± 2.68 29.20 ± 15.20 30.85 ± 14.48 0.75 ± 3.97 0.529
BF (%) 40.20 ± 10.25 39.60 ± 10.73 0.80 ± 2.22 41.10 ± 11.90 39.90 ± 15.02 -0.15 ± 3.90 0.927
FFM (kg) 42.65 ± 13.02 42.80 ± 12.93 -0.70 ± 1.88 42.75 ± 16.63 43.15 ± 17.00 0.45 ± 2.48 0.361
BMR (kcal) 1,291.50
± 281.25
1,295.00
± 280.25
-16.00
± 41.25
1,293.50
± 359.75
1,302.00
± 368.00
9.5 ± 53.75 0.361
Water (L) 31.20 ± 9.55 31.30 ± 9.67 -0.45 ± 1.33 31.30 ± 12.08 31.60 ± 12.50 0.25 ± 1.83 0.384
Protein (kg) 8.45 ± 2.68 8.50 ± 2.55 -0.10 ± 0.35 8.40 ± 3.20 8.50 ± 3.60 0.10 ± 0.33 0.300
Mineral (kg) 3.11 ± 0.87 3.01 ± 0.80 -0.05 ± 0.14 2.98 ± 1.11 3.00 ± 1.10 0.10 ± 0.23 0.293
WHR 0.92 ± 0.06 0.94 ± 0.06* 0.02 ± 0.03 0.91 ± 0.06 0.89 ± 0.06** -0.01 ± 0.03 0.043
BF, Body Fat; BMI, Body Mass Index; BMR, Basal Metabolic Rate; BW, Body Weight; FFM, Fat-free mass; FMs, Fat Mass; MM, Muscle Mass; WHR, Waist-hip ratio. *; p<0.05 vs. before intervention, **; p<0.05 vs. control group.
Table 3. Segmental muscular composition of participants.
Control group (n = 18) Tabata group (n = 18) p-value of change
between groups
Pretest Posttest Mean change Pretest Posttest Mean change
Right arm (kg) 2.38 ± 0.66 2.40 ± 0.65 0.01 ± 0.10 2.44 ± 0.70 2.45 ± 0.71 0.01 ± 0.10 0.937
Right arm (%) 93.38 ± 9.00 94.08 ± 8.17 0.70 ± 4.36 96.60 ± 12.35 96.80 ± 13.30 0.20 ± 3.51 0.707
Left arm (kg) 2.35 ± 0.64 2.35 ± 0.63 -0.00 ± 0.11 2.38 ± 0.66 2.43 ± 0.69 0.04 ± 0.10 0.198
Left arm (%) 92.20 ± 8.17 92.11 ± 7.05 -0.09 ± 4.76 94.78 ± 12.71 95.98 ± 13.50 1.19 ± 3.51 0.363
Right leg (kg) 7.20 ± 1.50 7.04 ± 1.49* -0.16 ± 0.24 7.41 ± 1.88 7.43 ± 1.88** 0.02 ± 0.24 0.031
Right leg (%) 93.71 ± 6.55 91.56 ± 6.11* -1.72 ± 2.58 96.18 ± 8.03 96.22 ± 8.44** 0.06 ± 2.45 0.026
Left leg (kg) 7.13 ± 1.48 6.84 ± 1.78 -0.29 ± 0.84 7.38 ± 1.83 7.42 ± 1.84 0.04 ± 0.25 0.117
Left leg (%) 92.78 ± 6.02 91.06 ± 6.26* -1.72 ± 2.58 95.87 ± 7.59 95.97 ± 8.23** 0.10 ± 2.60 0.043
Abdomen (kg) 20.75 ± 4.10 20.79 ± 4.06 0.04 ± 0.61 20.95 ± 4.30 21.17 ± 4.37 0.22 ± 0.52 0.358
Abdomen (%) 94.56 ± 5.16 94.80 ± 4.49 0.23 ± 2.80 95.99 ± 7.25 96.50 ± 7.84 0.50 ± 2.11 0.750
*; p<0.05 vs. before intervention, **; p<0.05 vs. control group.
Table 4. Segmental fat composition of participants.
Control group (n = 18) Tabata group (n = 18) p-value of changebetween groups
Pretest Posttest Mean
change
Pretest Posttest Mean
change
Right arm (kg) 2.69 ± 1.38 2.63 ± 1.32 0.33 ± 0.21 2.58 ± 1.50 2.71 ± 1.56 0.09 ± 0.25 0.445
Right arm (%) 321.72
± 161.12
324.39
± 153.33
2.67 ± 25.11 308.11
± 170.64
322.76 ± 43.70 11.03
± 31.57
0.385
Left arm (kg) 2.62 ± 1.37 2.66 ± 1.32 0.04 ± 0.22 2.63 ± 1.50 2.67 ± 1.54 0.07 ± 0.25 0.675
Left arm (%) 324.87
± 161.29
329.37
± 154.56
4.50 ± 25.21 313.80
± 173.20
319.14
± 183.72
8.95 ± 31.53 0.643
Right leg (kg) 4.85 ± 1.93 4.72 ± 1.59 -0.12 ± 0.56 4.75 ± 1.74 4.87 ± 1.94 0.12 ± 0.41 0.138
Right leg (%) 226.24
± 82.10
220.52
± 69.46
-5.71
± 23.97
217.58
± 80.25
222.93 ± 89.87 5.29 ± 18.89 0.134
Left leg (kg) 4.82 ± 1.89 4.68 ± 1.58 -0.13 ± 0.52 4.72 ± 1.71 4.85 ± 1.90 0.12 ± 0.39 0.100
Left leg (%) 225.03
± 80.70
219.66
± 68.57
-5.36
± 23.46
216.13
± 78.25
221.43 ± 88.22 5.35 ± 18.93 0.142
Abdomen (kg) 15.20 ± 3.84 15.58 ± 3.88* 0.37 ± 0.82 15.05 ± 4.83 15.26 ± 1.18 0.21 ± 1.11 0.625
Abdomen (%) 316.30
± 88.06
324.00
± 87.19*
7.70 ± 16.94 305.77
± 102.02
309.73
± 108.02
3.96 ± 23.14 0.583
*; p<0.05 vs. before intervention.
Table 5. Cardiorespiratory fitness of participants.
Control group (n = 18) Tabata group (n = 18) p-value of change
between groups
Pretest Posttest Mean change Pretest Posttest Mean
change
Rest
HR (beats/min) 94.44 ± 10.31 92.00 ± 11.90 -2.44 ± 7.51 91.72 ± 10.39 90.16 ± 10.40 -1.55 ± 8.84 0.747
BF (breaths/min) 20.16 ± 3.85 19.50 ± 3.83 -0.66 ± 2.97 21.05 ± 4.24 21.66 ± 5.20 0.61 ± 2.70 0.186
RER 0.80 ± 0.05 0.84 ± 0.03* 0.04 ± 0.06 0.81 ± 0.04 0.86 ± 0.04* 0.04 ± 0.06 0.740
VO2 (L/min) 0.33 ± 0.07 0.29 ± 0.07* -0.04 ± 0.04 0.36 ± 0.07 0.34 ± 0.08** -0.02 ± 0.06 0.265
VO2 (ml/min/kg) 4.44 ± 0.92 3.94 ± 0.80* -0.50 ± 0.71 4.66 ± 0.77 4.44 ± 0.86 -0.22 ± 1.00 0.344
Exercise
HR (/min) 177.22
± 14.28
181.44
± 7.90
4.22
± 9.72
186.00
± 8.40
191.00
± 9.57
5.00
± 8.68
0.802
HR (% age-predicted maximum HR) 89.33 ± 7.15 91.46 ± 4.03 2.13 ± 4.89 93.34 ± 4.45 95.86 ± 5.14 2.51 ± 4.34 0.806
VT1 (ml/min/kg) 17.22 ± 4.60 16.06 ± 3.19 -1.17 ± 3.29 19.89 ± 3.20 18.06 ± 3.62 -1.83 ± 3.91 0.584
VT2 (ml/min/kg) 25.56 ± 6.54 22.17 ± 4.72* -3.39 ± 4.79 27.78 ± 4.62 26.72 ± 5.69** -1.06 ± 4.39 0.137
VO2peak (L/min) 2.18 ± 0.48 2.14 ± 0.49 -0.04 ± 0.24 2.42 ± 0.62 2.43 ± 0.63** 0.01 ± 0.28 0.323
BF (/min) 45.94 ± 9.25 54.44 ± 10.19* 8.50 ± 9.30 48.11 ± 8.87 62.22 ± 12.75* 14.11 ± 12.96 0.145
RER 1.06 ± 0.06 1.29 ± 0.05* 0.23 ± 0.08 1.07 ± 0.05 1.29 ± 1.28* 0.21 ± 0.08 0.625
SV (ml) 76.38 ± 17.04 74.20 ± 15.99 -2.17 ± 9.41 79.86 ± 18.31 78.62 ± 18.99 -1.24 ± 15.98 0.767
CO (L/min) 13.47 ± 2.98 13.19 ± 3.02 -0.28 ± 1.52 14.92 ± 3.85 14.50 ± 3.49 -0.42 ± 2.83 0.481
BF, Breathing Frequency; CO, Cardiac Output; HR, Heart Rate; RER, Respiratory Exchange Ratio; SV, Stroke Volume; VO2, Oxygen Consumption; VT1, First Ventilator Threshold; VT2, Second Ventilator Threshold; VO2peak, Peak Oxygen Consumption; *; p<0.05 vs. before intervention, **; p<0.05 vs. control group.
Disclaimer/Publisher’s Note: The statements, opinions and data contained in all publications are solely those of the individual author(s) and contributor(s) and not of MDPI and/or the editor(s). MDPI and/or the editor(s) disclaim responsibility for any injury to people or property resulting from any ideas, methods, instructions or products referred to in the content.
Copyright: This open access article is published under a Creative Commons CC BY 4.0 license, which permit the free download, distribution, and reuse, provided that the author and preprint are cited in any reuse.
Prerpints.org logo

Preprints.org is a free preprint server supported by MDPI in Basel, Switzerland.

Subscribe

Disclaimer

Terms of Use

Privacy Policy

Privacy Settings

© 2025 MDPI (Basel, Switzerland) unless otherwise stated