1. Introduction
Densely populated urban areas with an increasing demand of services require the development of proper strategies for resilience enhancement of urban infrastructure and lifeline systems to natural hazards [
1,
2]. To achieve this in earthquake-prone regions, a proper assessment of the seismic demand expected to occur in the infrastructure systems is required. This led to a growing interest in the research community towards vulnerability assessment of transportation assets comprised of different types of structures, considering a holistic approach where each component affects the behavior of the whole system. Regarding seismic performance, important interaction effects have been observed to occur in structures that are closer to each other, modifying considerably their seismic demands. Thus, more robust methodologies and analysis models should be implemented in order to be able to capture such effects, considering that infrastructure assets comprised of several types of structures sharing the same space will be increasingly common [
3,
4].
Multiple research groups have studied the interaction between surface and underground structures, implementing several methodologies. These include advanced 3D numerical modeling [
3,
4] experimental small-scale with shaking table [
5,
6] or centrifugal tests [
7] and also large-scale research involving real instrumented structures [
8]. Overall, these studies have provided significant contributions, showing that structural proximity, soil characteristics, frequency content of the input motion, height and fundamental vibration modes of on-ground structures, type of foundation, tunnel diameter and burial depth are the key variables that define the cases where interaction is beneficial or detrimental for the seismic performance of the structure. Regarding the interaction among surface structures, significant advances have been made through recent studies [
9,
10,
11,
12] calling this new subject Site-City or Structure-Soil-Structure interaction, SSSI. In the particular case of the Mexico City Basin, MCB, it has been identified some anomalous beating cycles in the recorded seismic “free-field motions” of recent earthquakes. Some researchers have associated this signal pollution with SSSI effects [
13,
14,
15], which are exacerbated by the very low stiffness and almost negligible damping of the shallow layer of the MCB soft clay, the large impedance of such a layer with stiff soils at shallow depth, and the resonance of the buildings with the soil natural frequency and with the seismic motion. Under those characteristics, wave fields radiated from nearby buildings are trapped in shallower layers, which are propagated as surface waves, affecting neighboring structures.
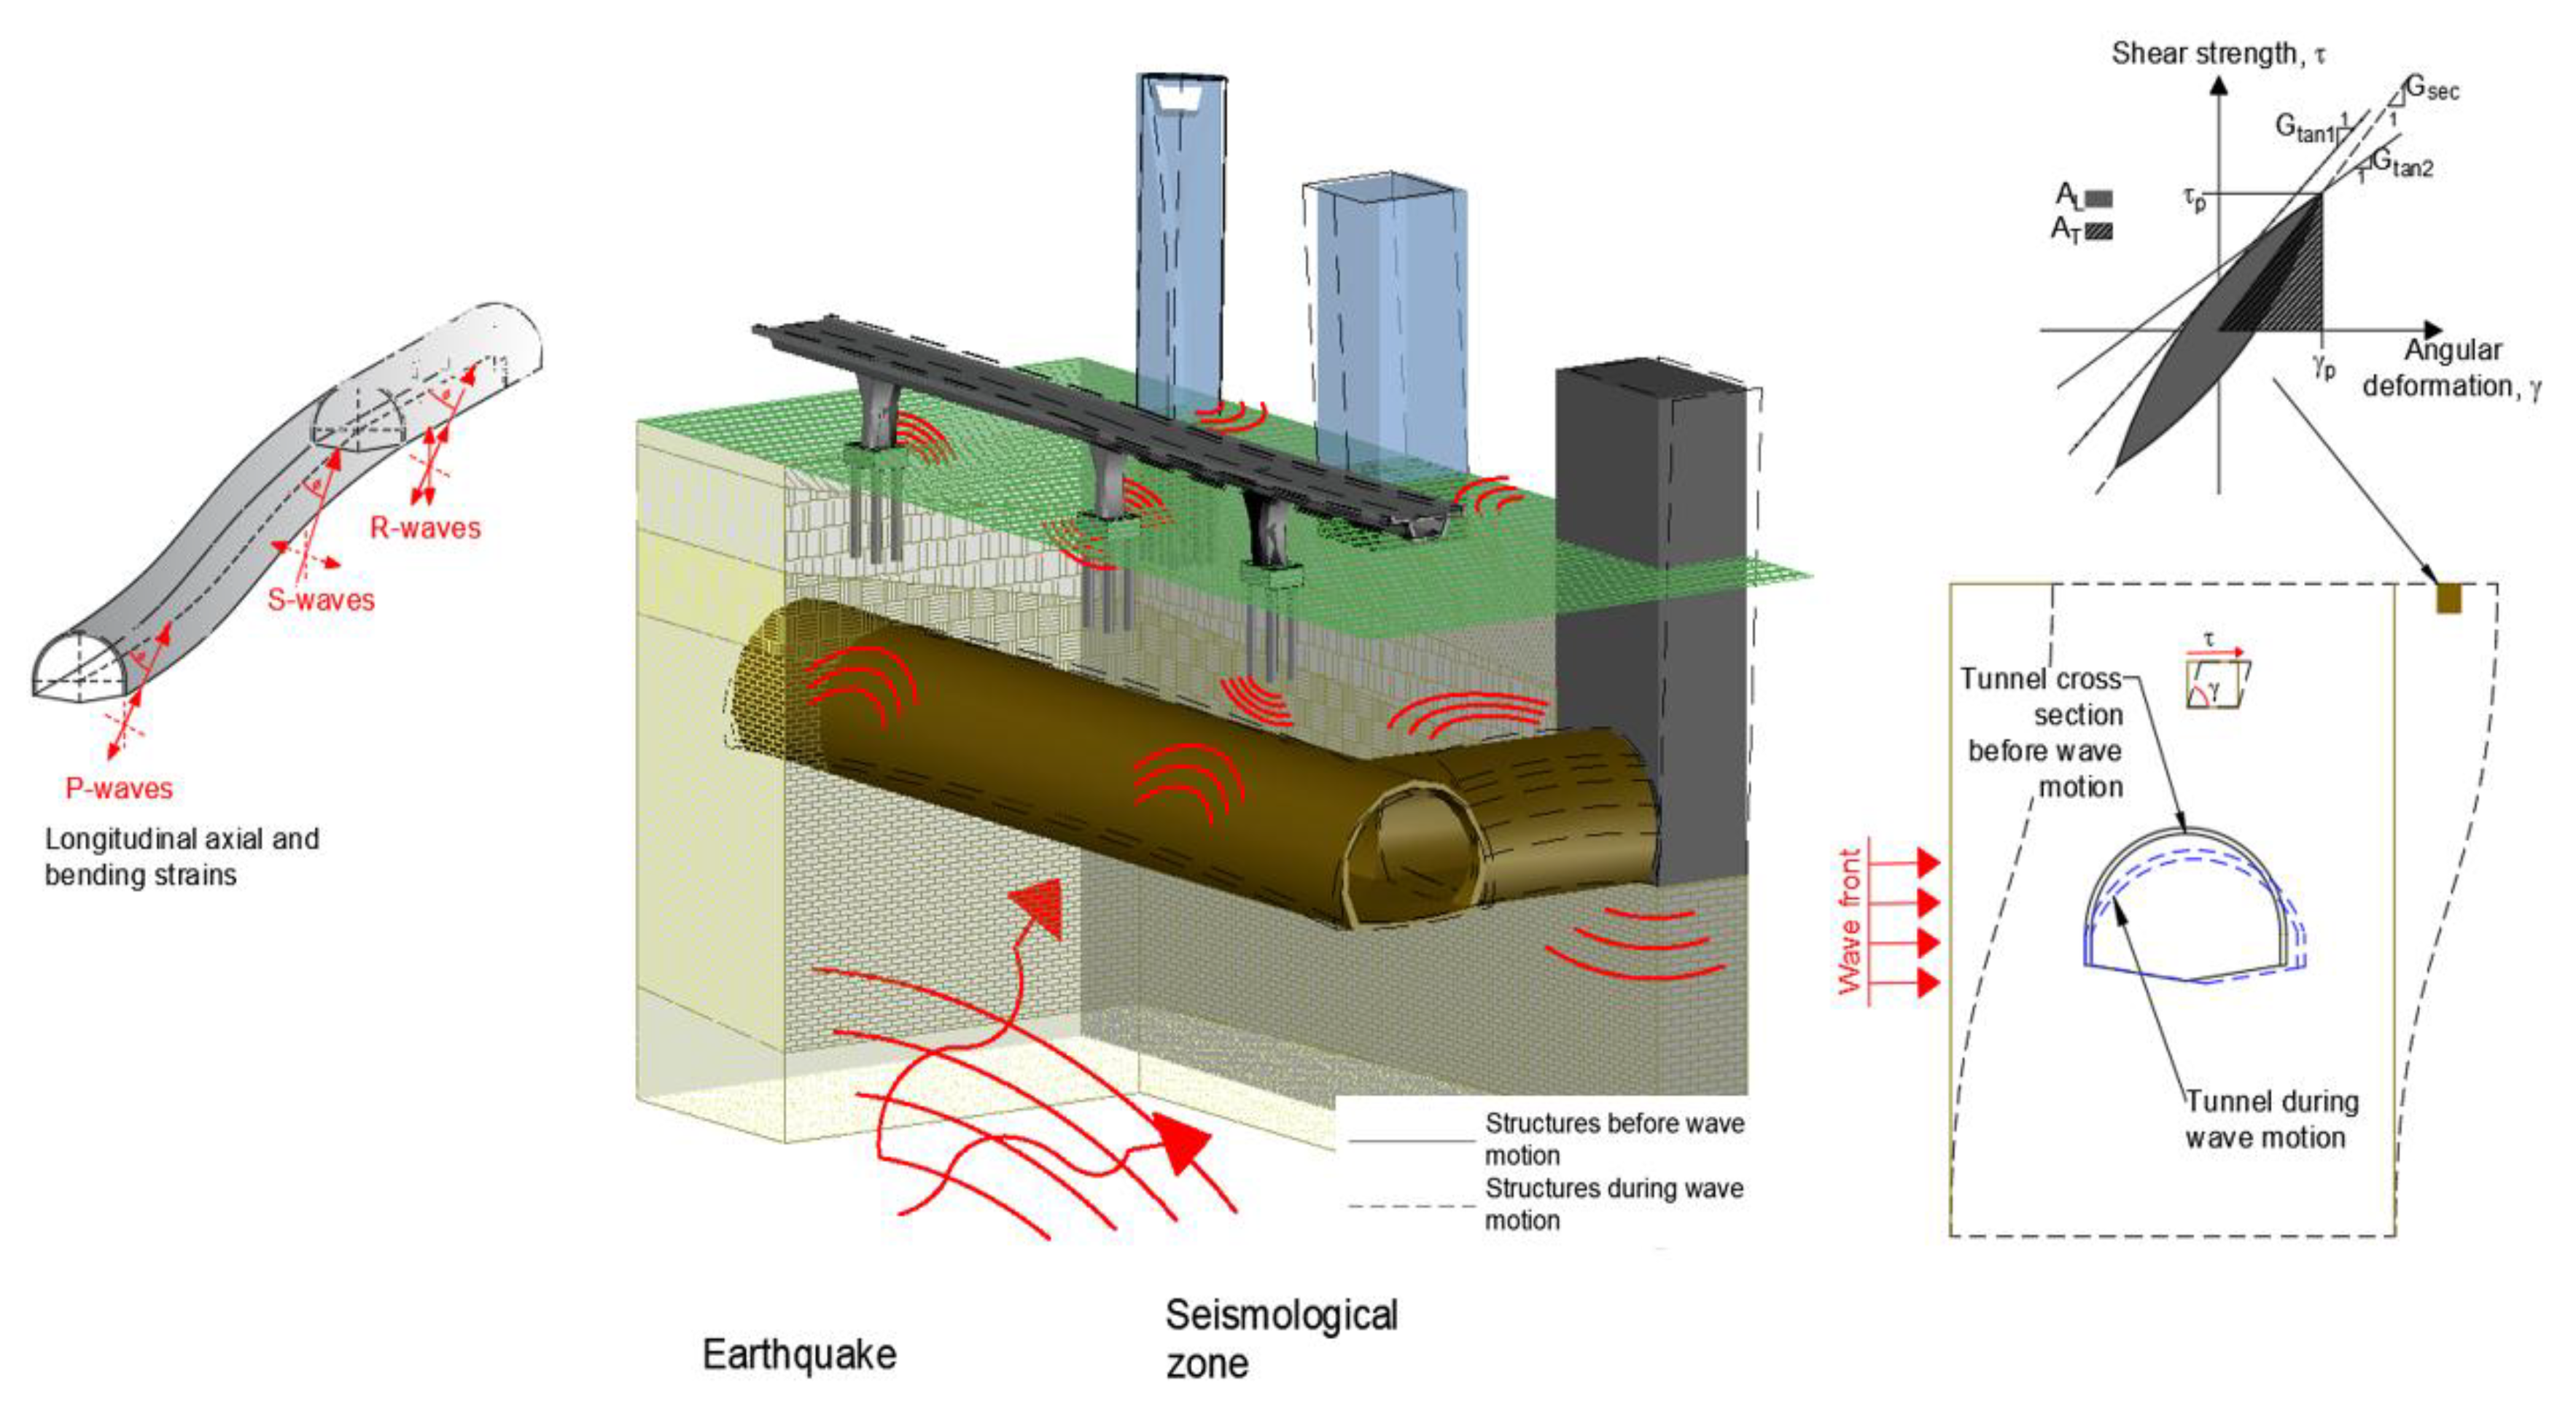
Considering both phenomena, there is a complex interaction between the incident, reflected, and diffracted seismic waves by underground structures, and those generated by the swaying of the surface structures during earthquakes, as depicted in
Figure 1.
Although, such contributions have provided valuable insights to the interaction problem, they have considered very idealized conditions, such as plane-strain models, one degree of freedom oscillators as surface structures, harmonic time history excitations, among others. This leads to several opportunities for further research on the subject, and more importantly, ignoring the interaction effects among structures can mean potentially expensive, and in some cases unsafe structure designs. In the worst-case scenario, interaction effects can increase the seismic demand of the structures in terms of internal forces, drifts, or displacements, reaching or exceeding a particular damage level, which can be directly associated with potential economic losses.
This paper presents a parametric study of the seismic interaction in building-tunnel-bridges systems, commonly found in the urban environment of the MCB. Based on simulations with 3D numerical models, the study examines the effects of varying the frequency content and duration of the input motion, the distance between the building and the bridge, and the tunnel position relative to the structures, on the seismic performance of the system. The case study is supposed to be located in a typical stratigraphy section of the lacustrine deposits of the MCB, where the aforementioned SSSI effects have been observed.
2. Definition of the Infrastructure Assets System
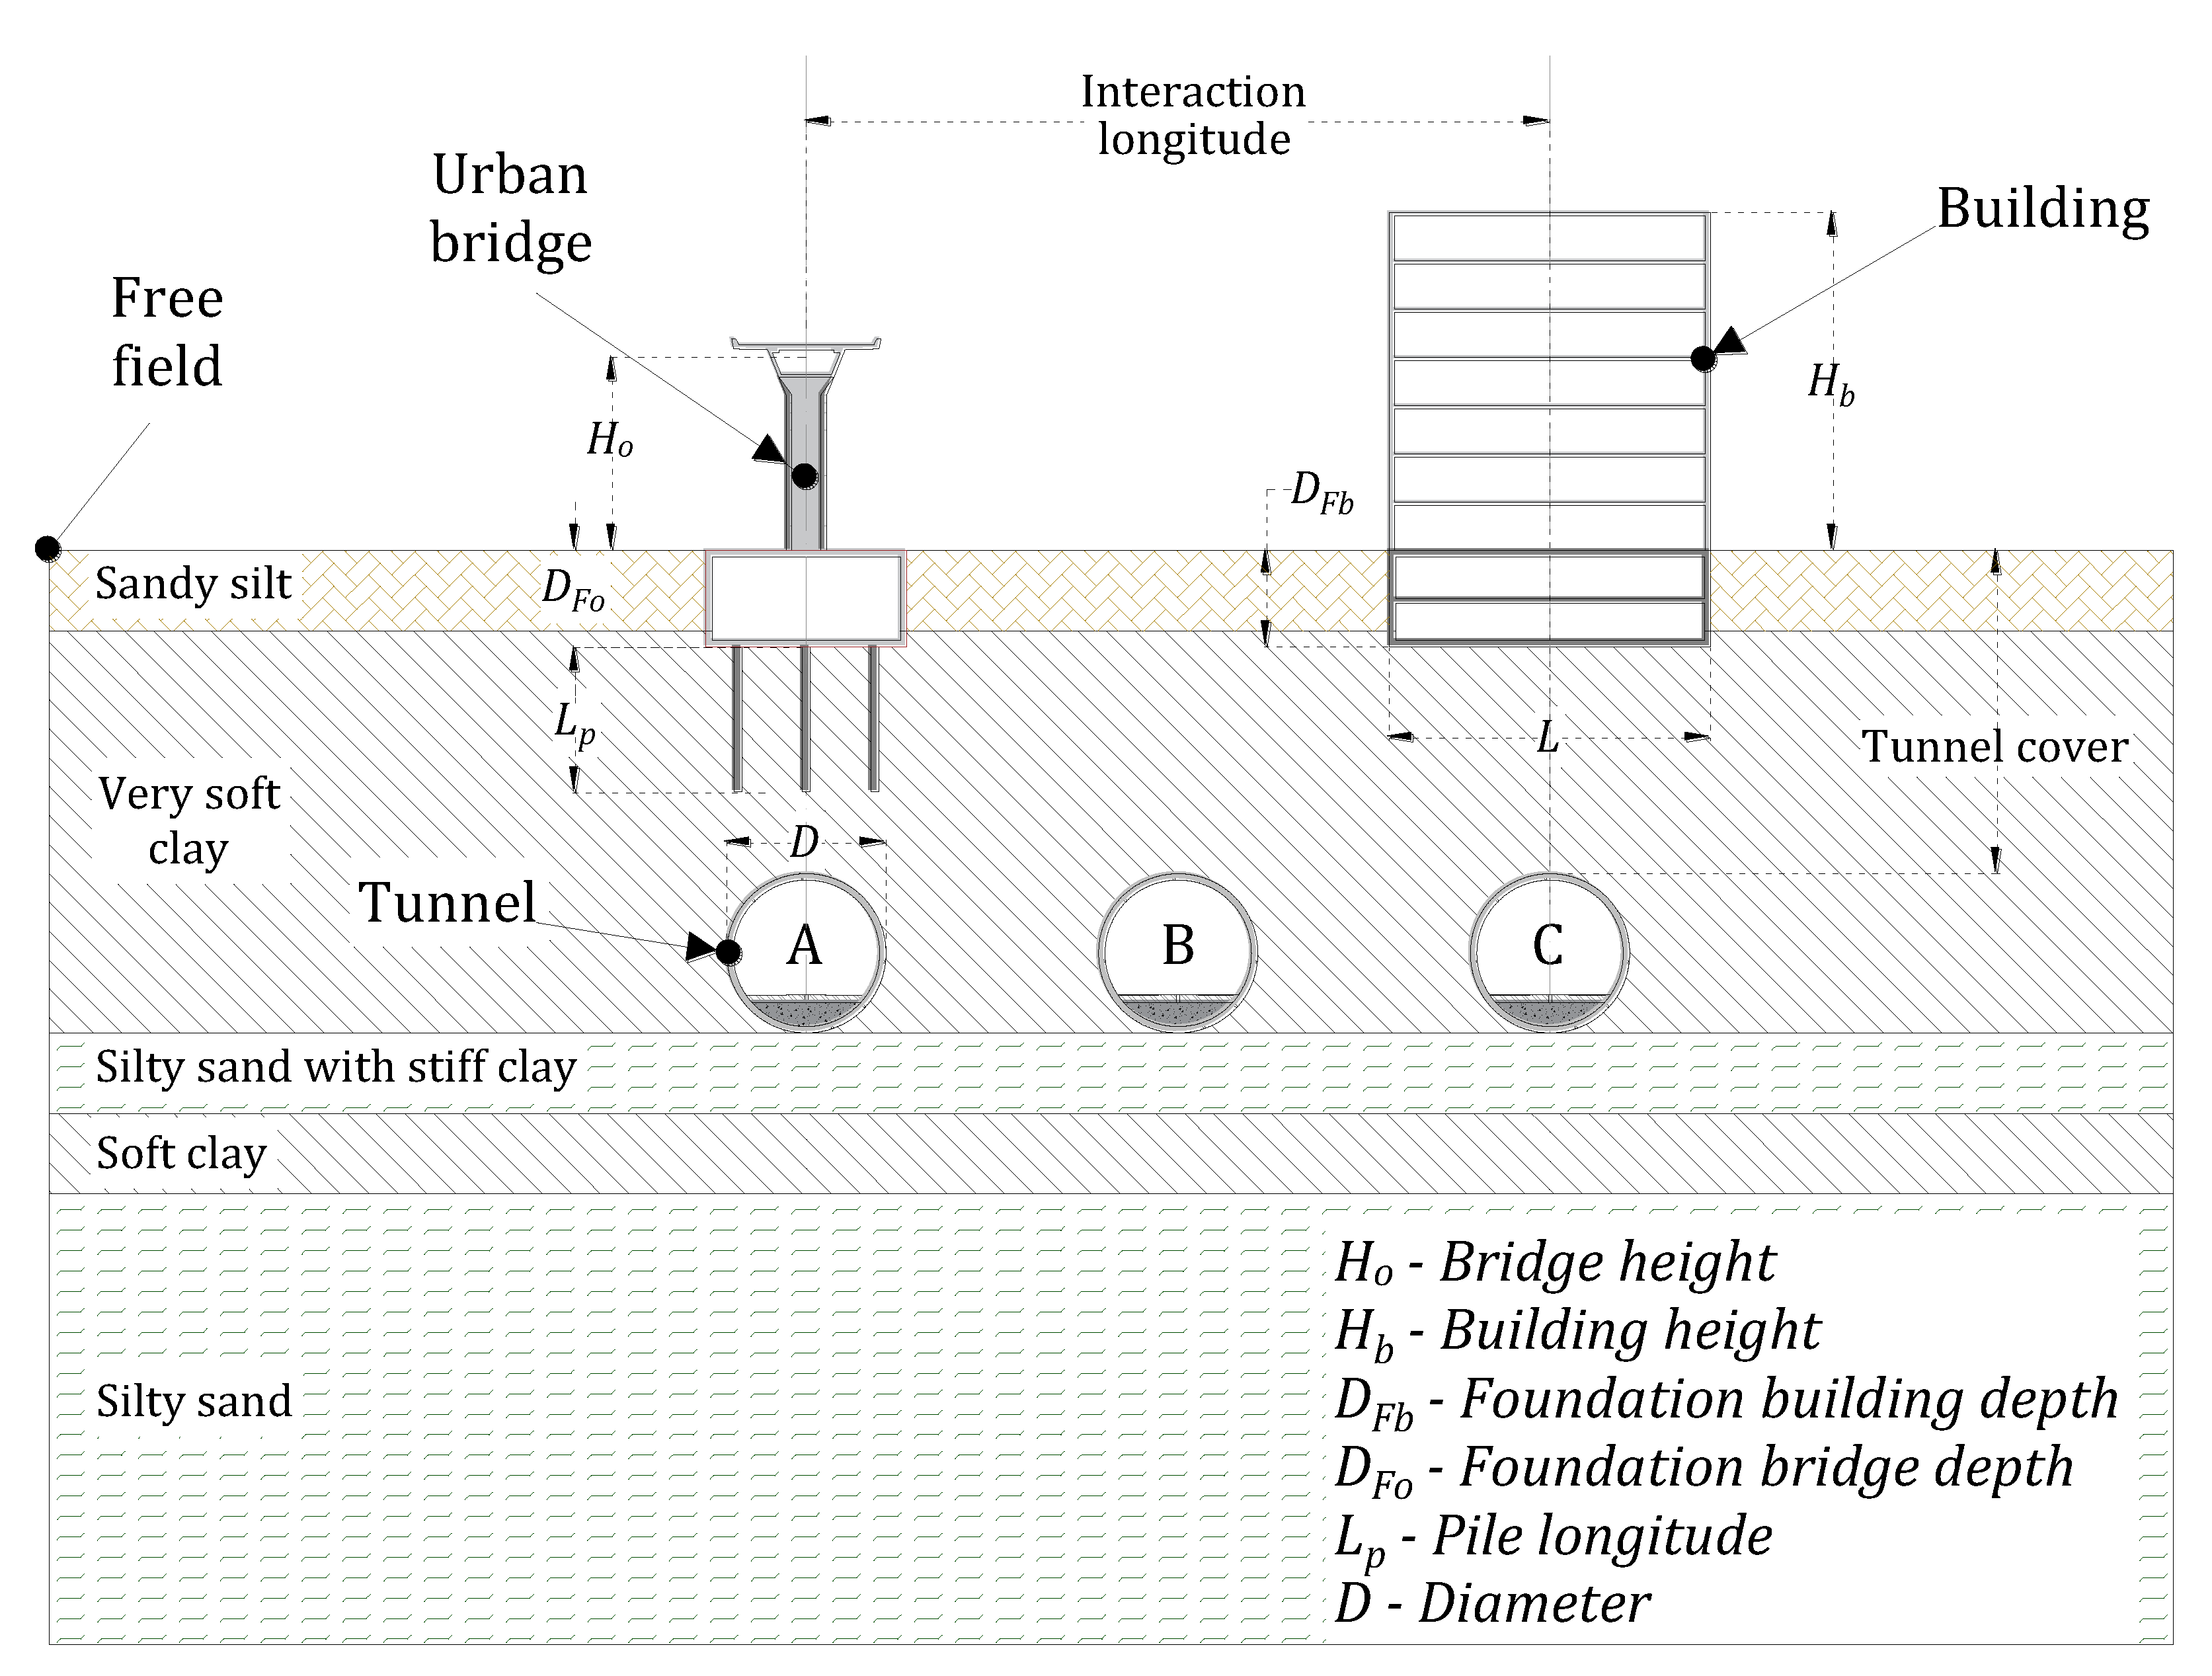
The tunnel-soil-building-bridge interaction in soft clays was studied considering a common typology observed around the MCB, as depicted in
Figure 2. Based on this schema, the tridimensional finite difference models were developed in the program FLAC3D [
16]. The tunnel diameter, D, was set to 10 m, the building height, Hb, and length, L, were 21 m and 20 m, respectively, and the urban bridge height, Ho, was assumed to be 12 m, corresponding with common typologies found in Mexico City. The building is supported by a 6m deep, 20m side square box foundation, and the bridge foundation is composed by a 6 m deep, 12.5 m side square box with 9 m deep friction piles. The depth of the tunnel was kept constant and equal to two times the tunnel diameter (i.e., 20 m). The distance between the building and the bridge, called inhere “interaction longitude”, was considered from 10 to 30 meters, which corresponds to 1 to 3 times the tunnel diameter. For each interaction longitude, the tunnel position was varied as follows: case A) corresponds to the tunnel underneath the bridge, case B) to the tunnel between the building and the bridge, and case C) to the tunnel underneath the building (
Figure 2).
Table 1 compiled the cases considered for parametric study.
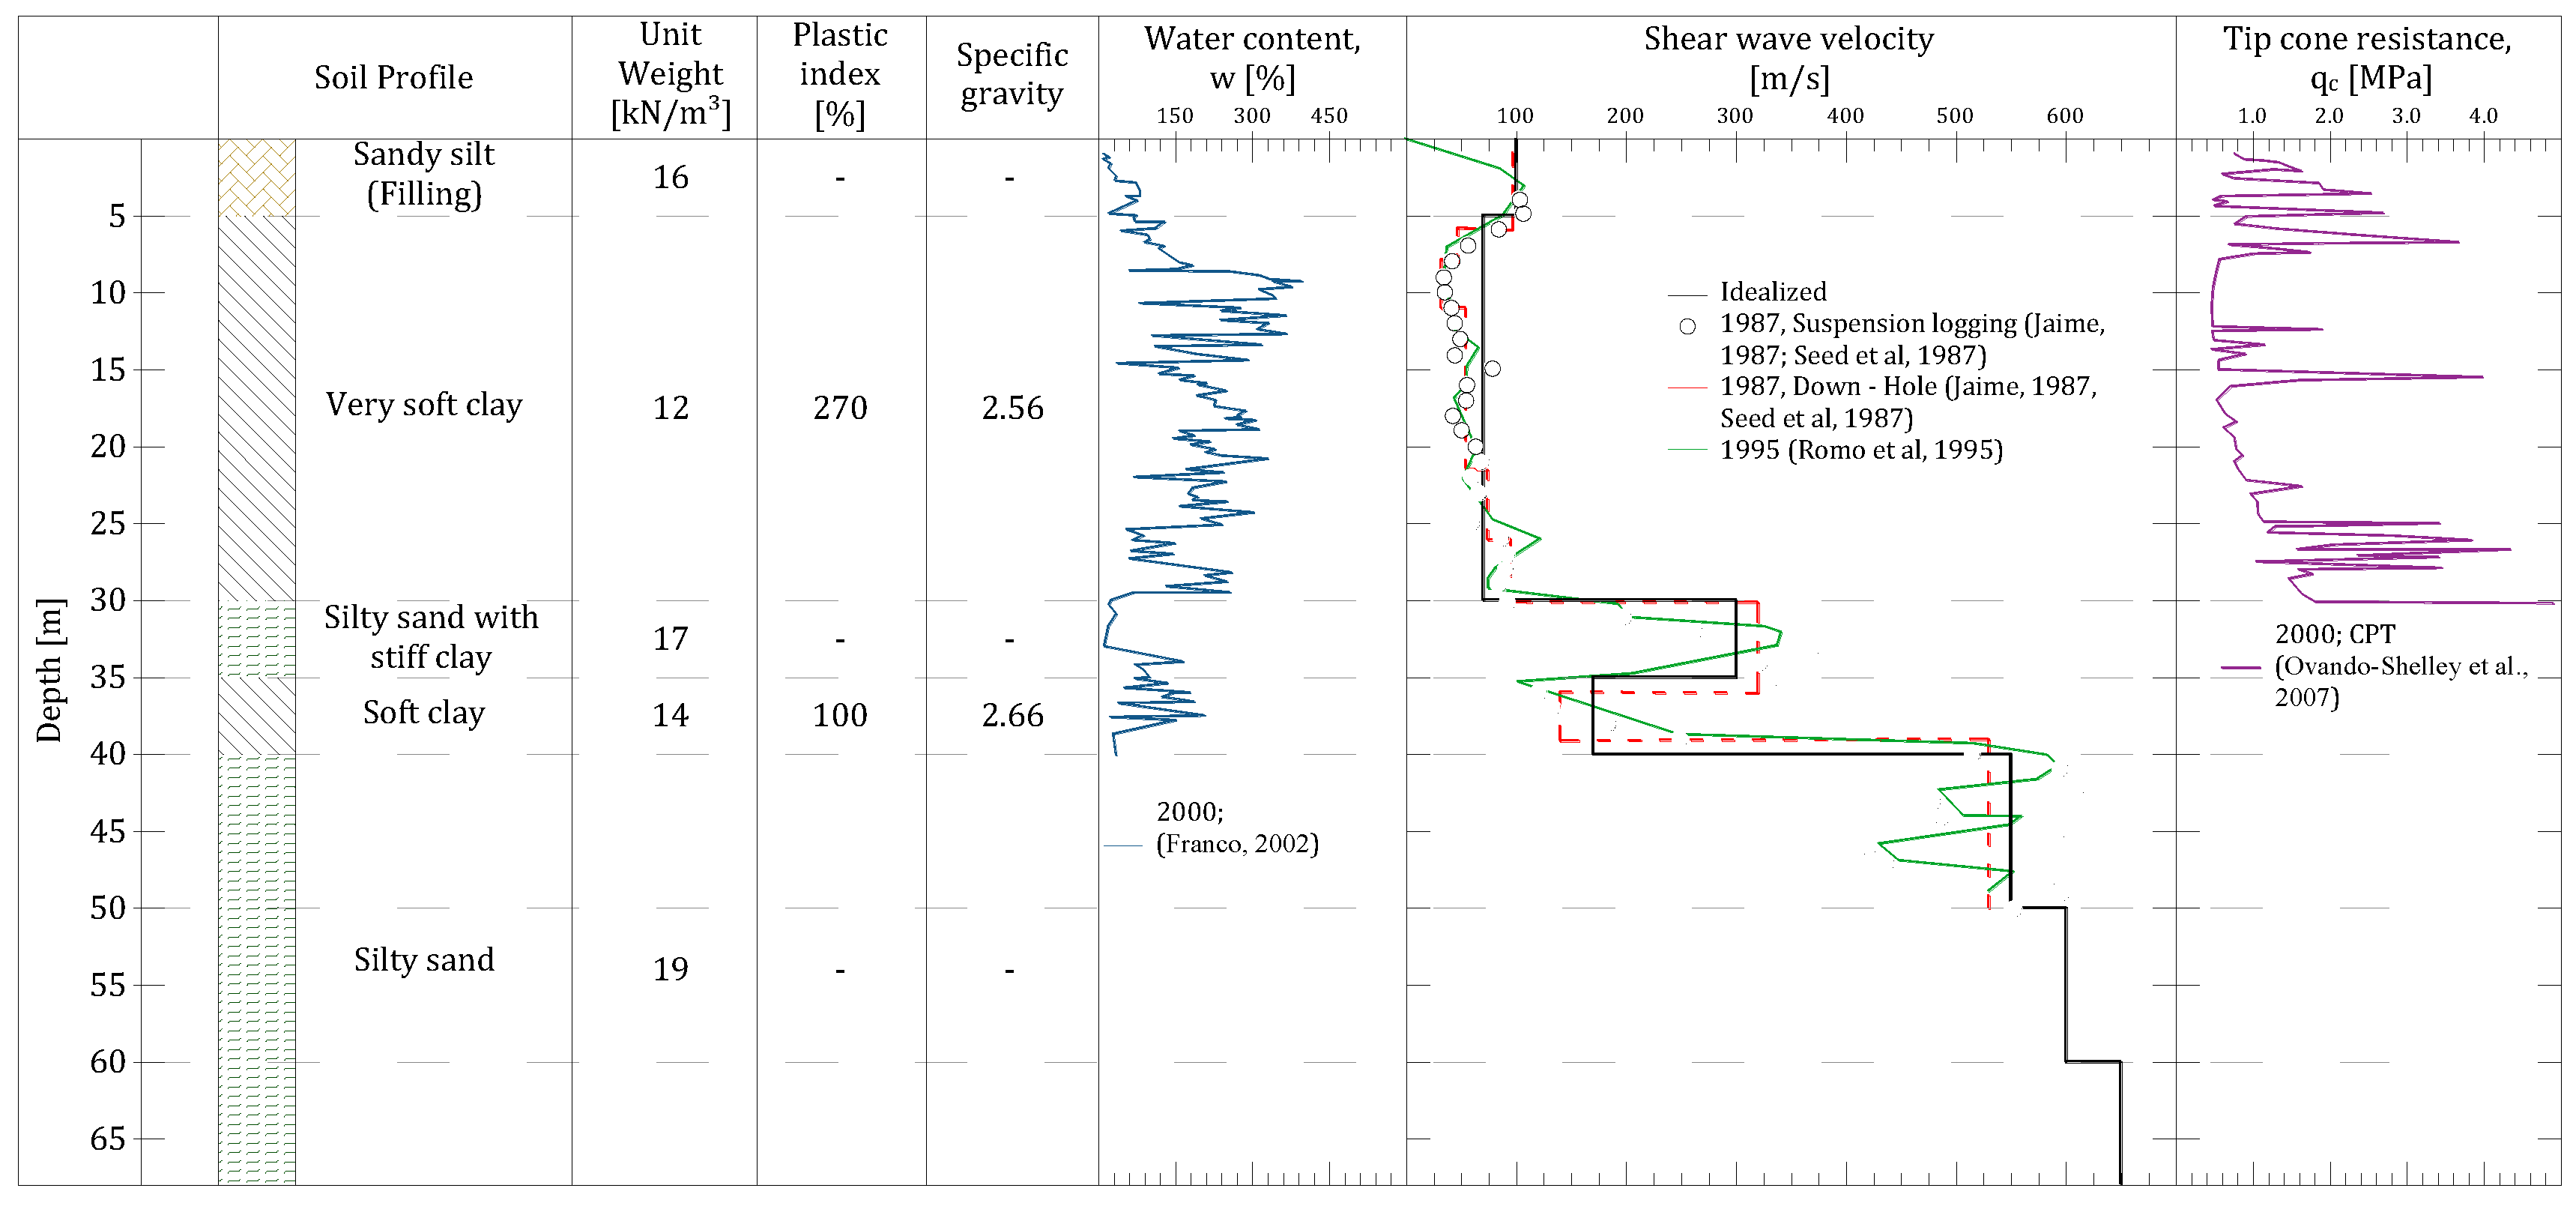
2.1. Soil Profile and Dynamic Properties
The studied site is located in the so-called Zone IIIb, in Mexico City, where high plasticity clays are found| (i.e., PI>200). The dynamic properties and seismic response of the site has already been calibrated by several authors [
17,
18] to study the seismic effects of past strong earthquakes. To continue with the previous research presented by Mayoral & Mosqueda [
3,
4,
19] it was deemed appropriate to use this geotechnical profile, to study the seismic interaction effects discussed above among the structures considered in
Figure 2.
Figure 3 summarizes the soil stratigraphy of the studied site, some index properties and results of the CPT.
Figure 3 also shows the shear wave velocity distribution, which was obtained in previous research [
17], with various techniques including suspension logging and down-hole.
The key factors that contribute to the very high amplification of the seismic ground motion recorded in past earthquakes in the MCB are the very low stiffness (
Figure 3), and the quasi-linear elastic behavior and very low damping of the soft clay. The last two characteristics have been associated with their very high plasticity (PI > 200), in accordance with the relation found by Darendeli & Stokoe [
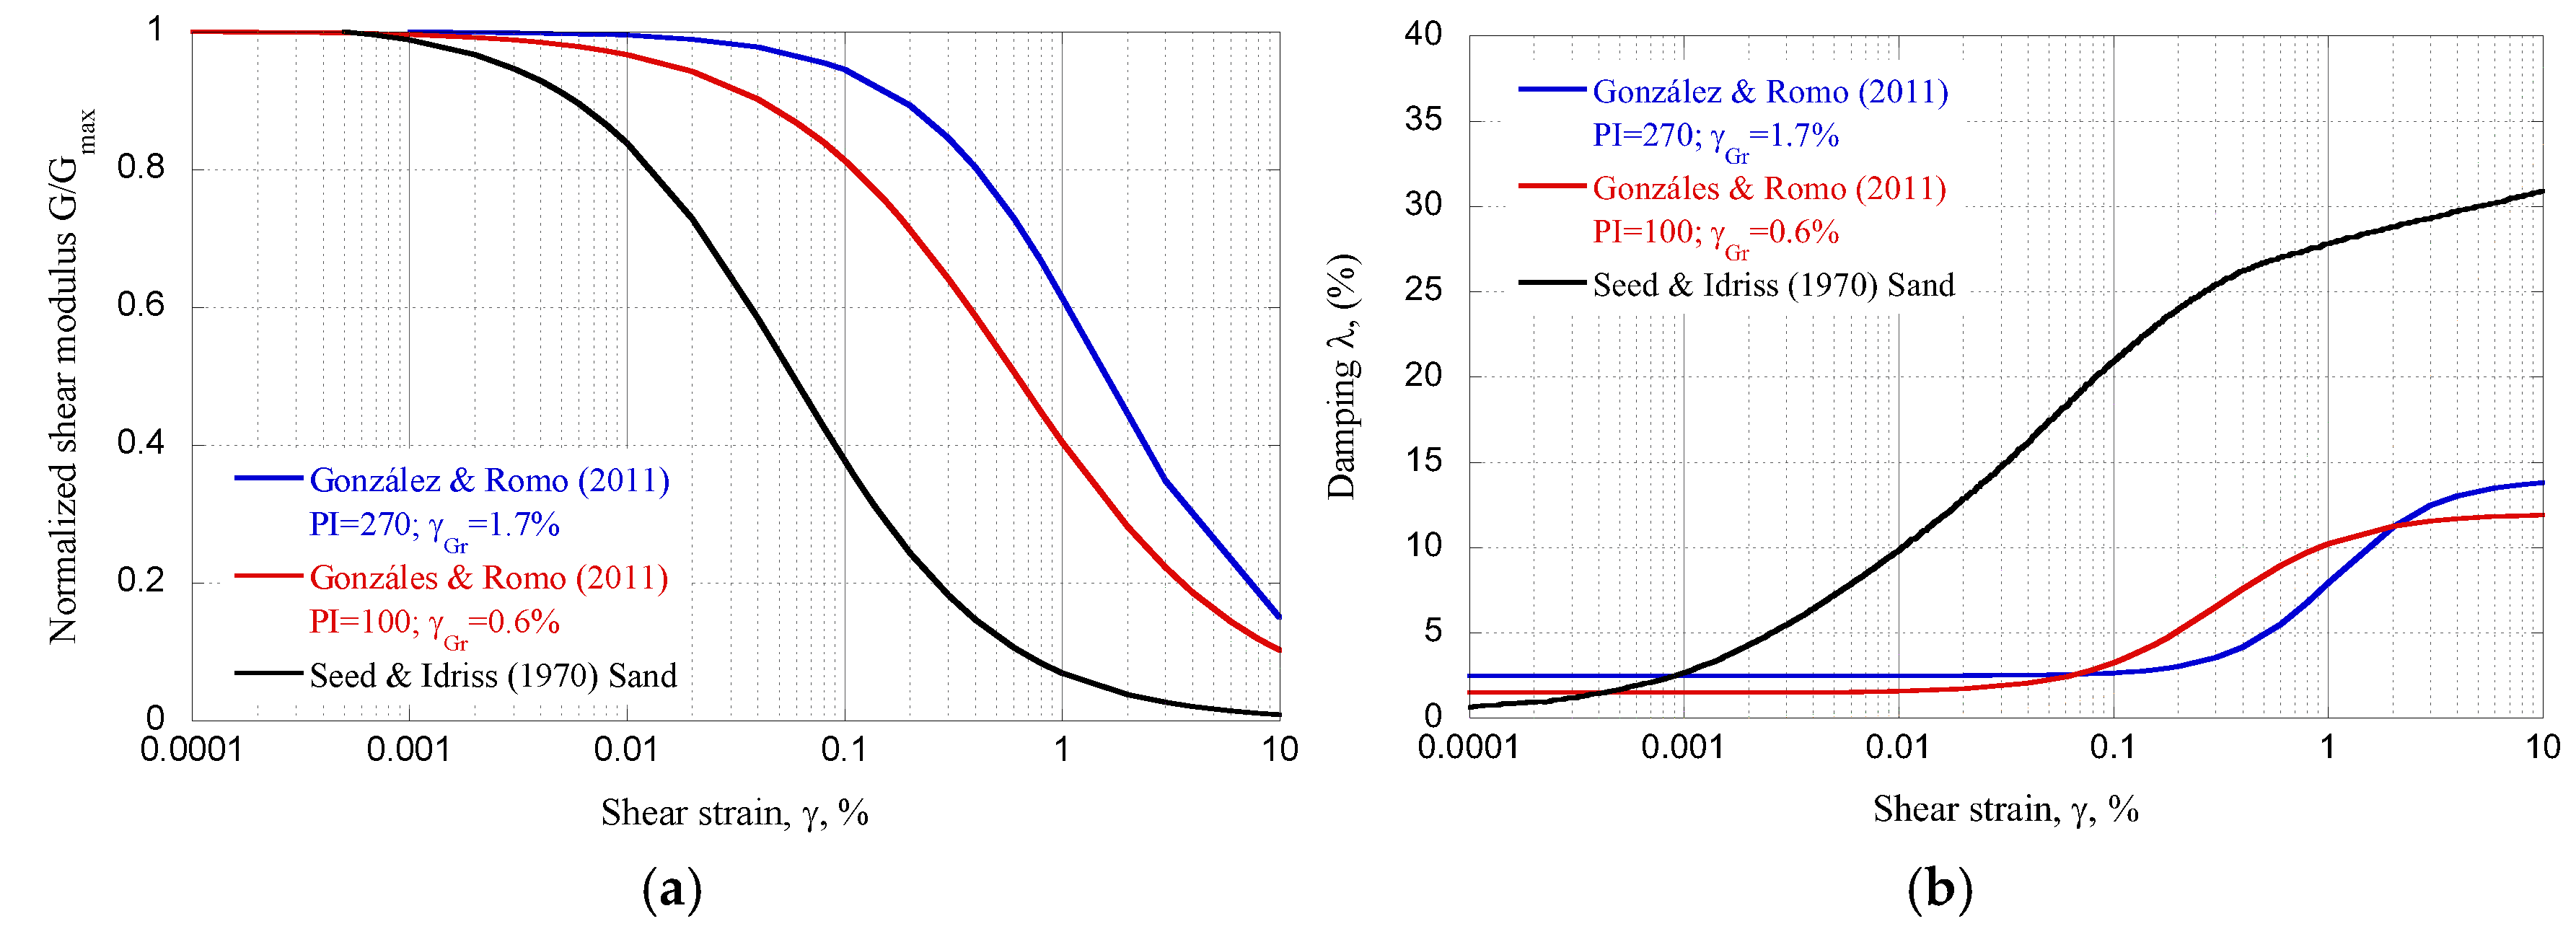
20]. To represent adequately this behavior the González and Romo’s model [
21] were used to estimate the normalized modulus degradation and damping curves for clays (
Figure 4). Through series of resonant column and cyclic triaxial tests, the authors related the model parameters to the plastic index, PI, of the high plasticity clays. For the non-plastic materials, as the silty sands, the models proposed by Seed and Idris [
22] were used to characterize their behavior during the seismic load.
Figure 4 depicts the normalized modulus degradation and damping curves used in the numerical analyses in this study. It should be mentioned that similar curves have been used in 1-D wave propagation analyses to reproduce the measured response during past earthquakes, and successful results were obtained [
17].
2.3. Building Characteristics
Following the previous study presented by Mayoral & Mosqueda [
3,
4,
19], the same tunnel and building characteristics were considered in this research. The building was intended to have seven floors, 3 m high each, a square footprint with a 20 m side, and a compensated box-like foundation with 6 m deep. This structure configuration was chosen due to exhibited major damage during the 2017 Mexico City earthquake [
23,
24,
25]. Following the method proposed and validated by Romo & Barcena [
26], the structure was simplified as a shear beam comprised of solid elements, with equivalent stiffness, ki, and mass, mi, for each story i. The dimensions of the equivalent shear beam are the same as those of the building considered. The structural period can be estimated with the expression (1).
Table 2 presents the properties of buildings considered in the analysis.
where, mi is the mass of each floor, and ki is stiffness of each floor
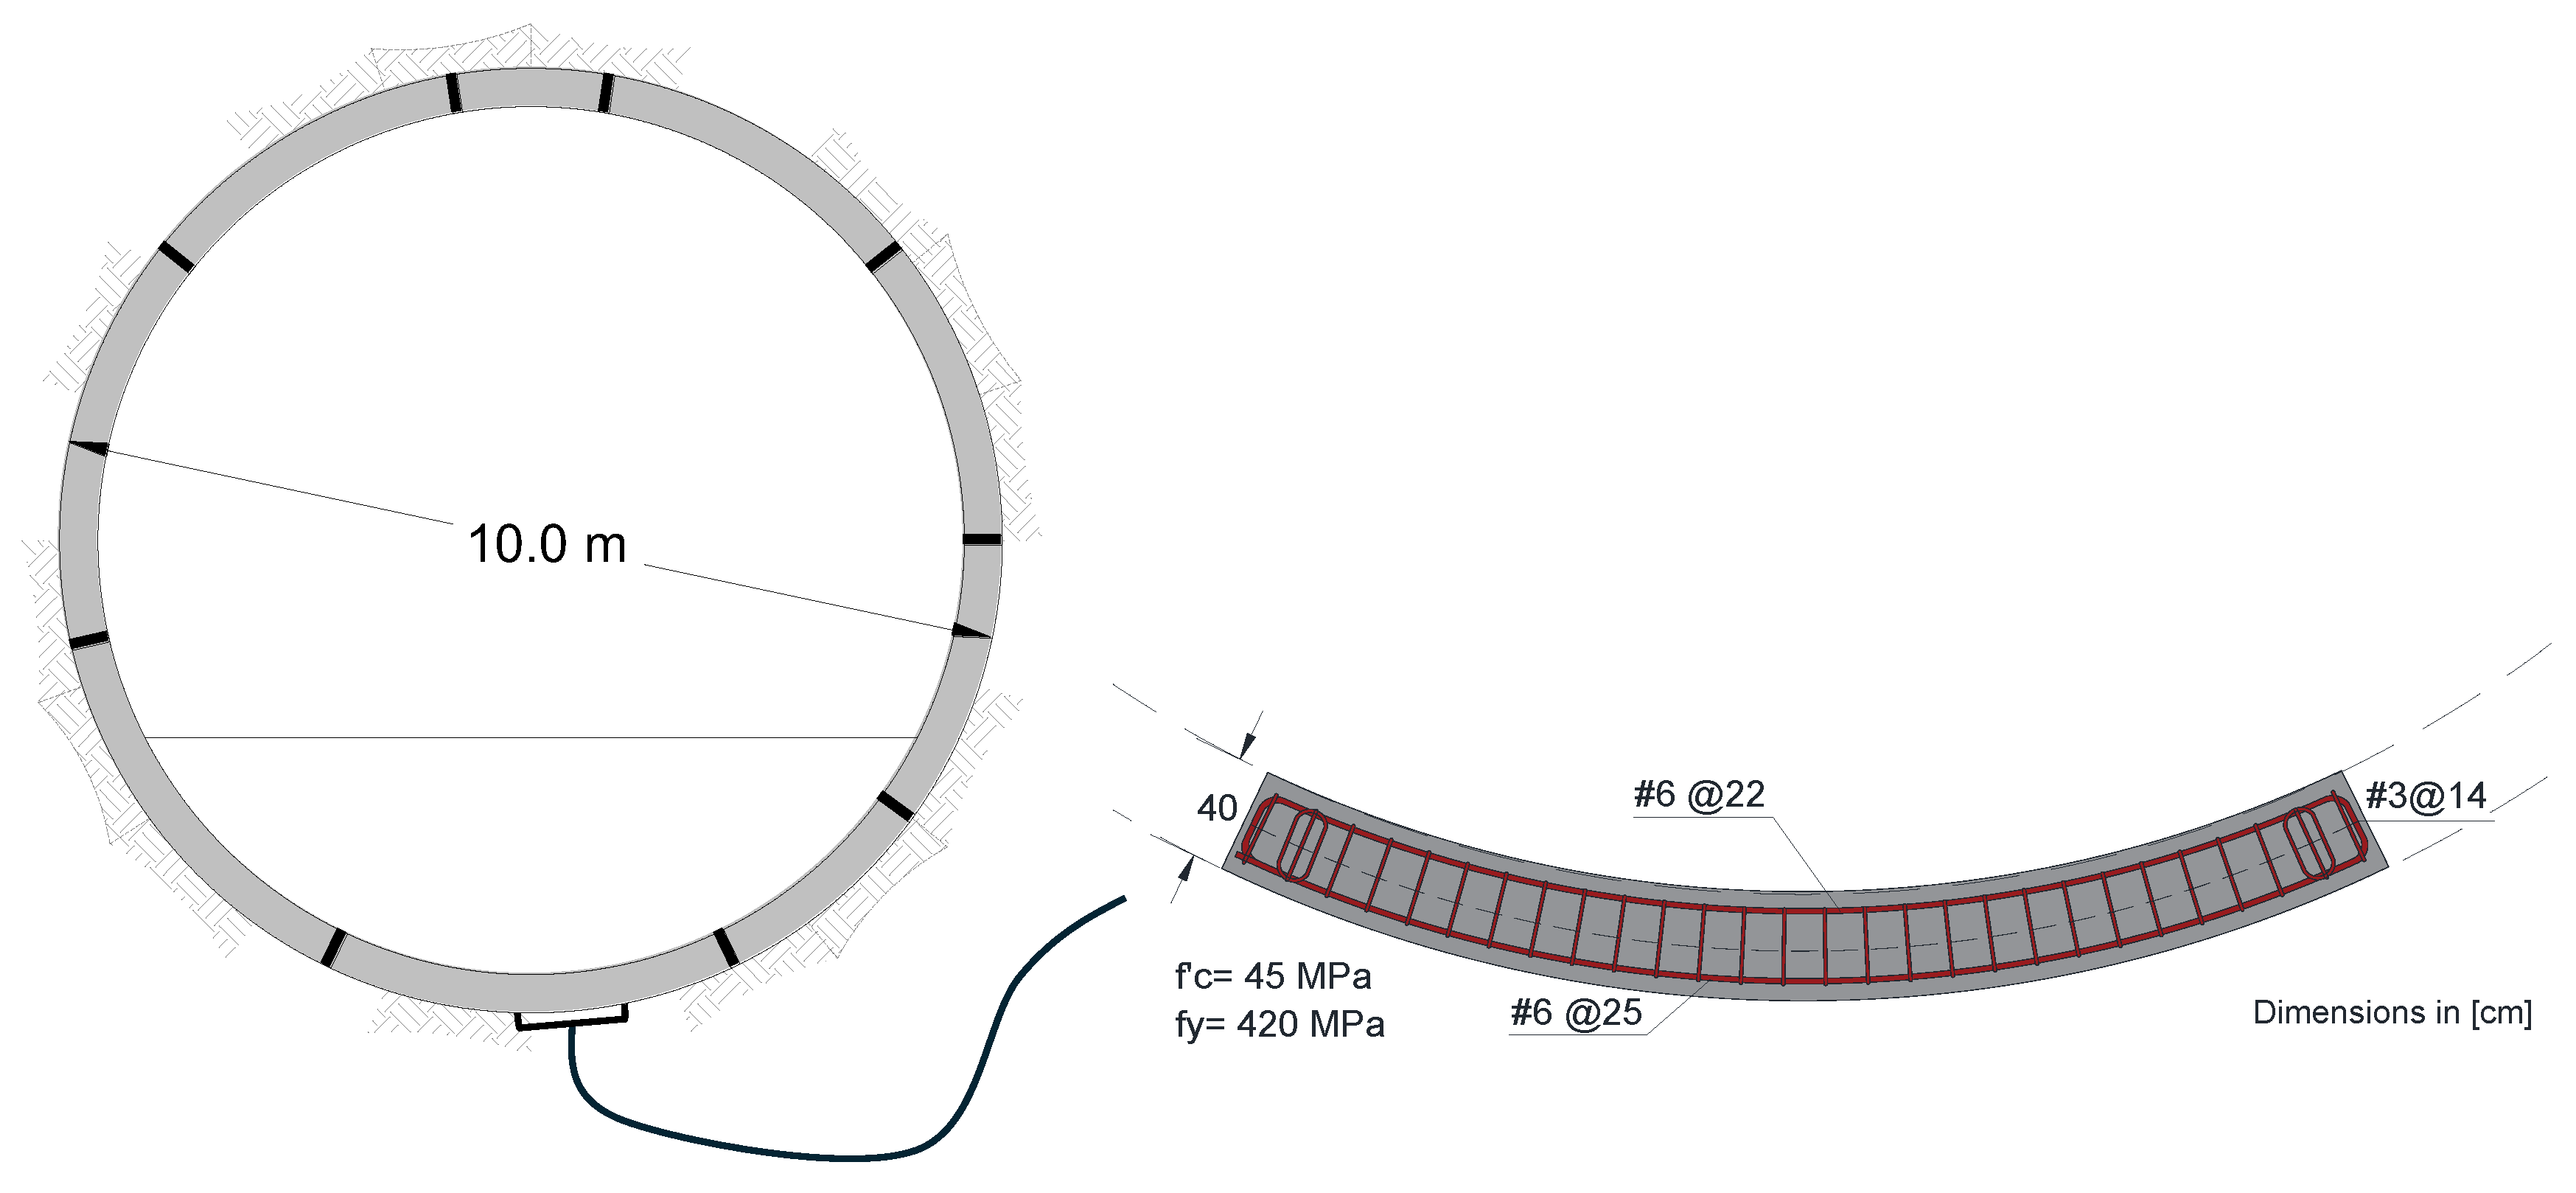
2.4. Tunnel Description
According to typical tunnel configuration used in the soft clays of Mexico City, the tunnel geometry was projected through a circular section with an external diameter of 10 m. The tunnel lining is made up of a 0.4 thick reinforced concrete with a compression strength of f’c= 45 MPa, at 28 days, and rebar reinforcement with a yield stress of fy= 420 MPa, distributed according to
Figure 5b. More details about the considerations adopted for modeling the tunnel lining can be found in [
27].
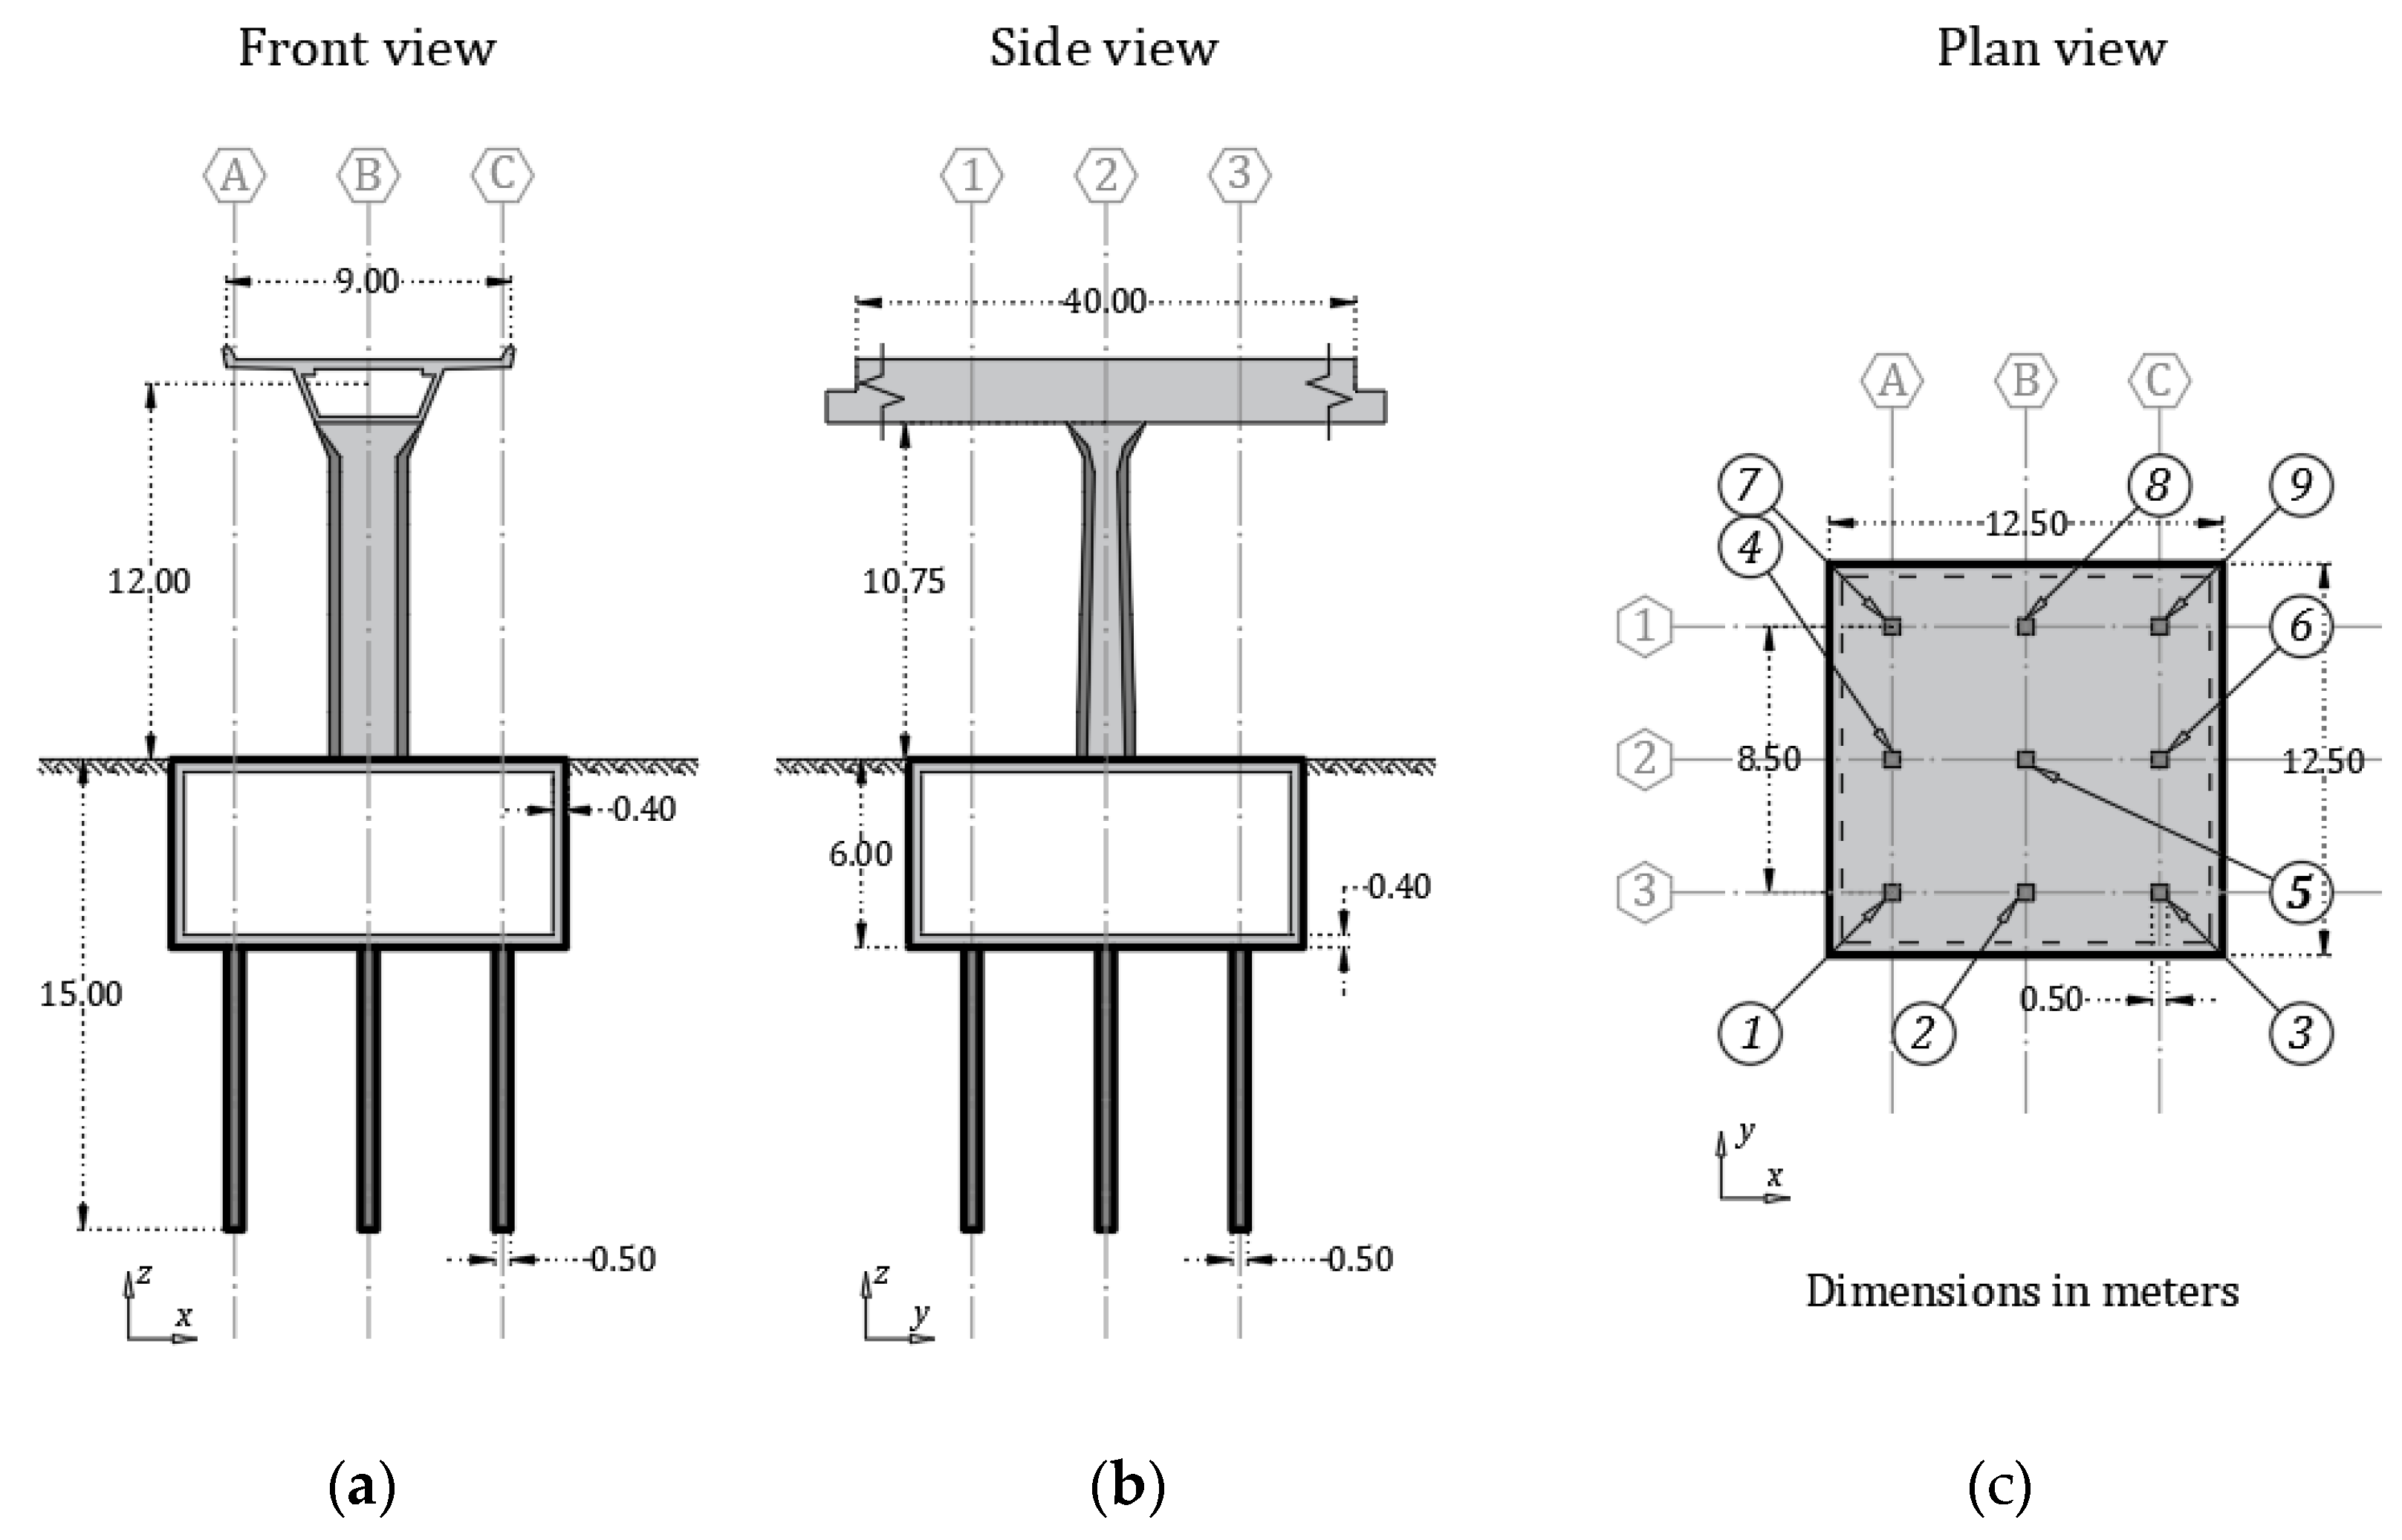
2.4. Urban Bridge Description
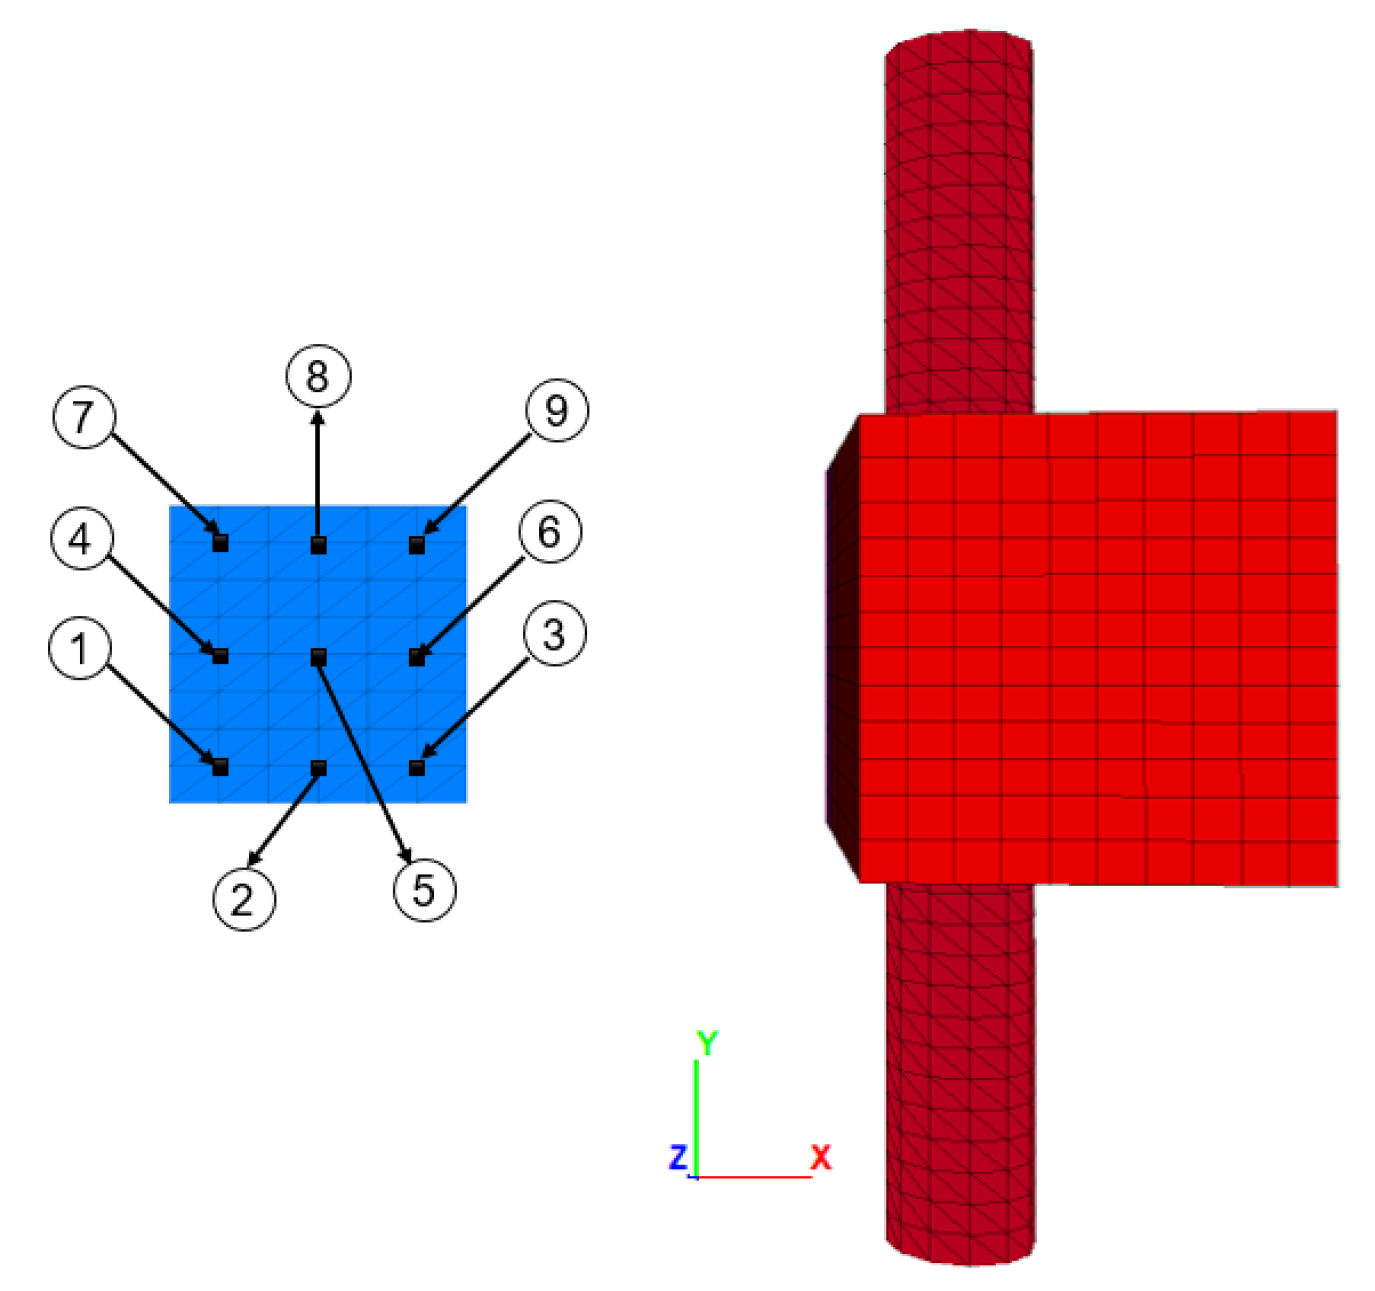
The typology of the urban overpass was defined based on common types found in Mexico City, which are made of precast pre-stressed concrete structures. The superstructure of the bridge is comprised of a 9 m wide hollow beam with a trapezoidal section. The substructure is comprised of a 12 m height precast column with a hollow rectangular section which is structurally tied with the beam. The foundation of the bridge is composed by two main elements: a box-type foundation with a square footprint of 12.5 m side and 6 m depth, and by 9 concrete piles with a square section of 0.5 m side and 12.5 m length. (
Figure 6). To simulate the superstructure of the bridge, beam elements were used with an equivalent density and stiffness parameters to take into account the effects of the real superstructure as the rocking, generated by the mass distribution [
28]. The walls and slabs of the box-type foundation were simulated with shell elements, and the concrete piles with pile elements, which are basically beam elements coupled with normal and tangential springs that are defined in function of the surrounding soil parameters. The pile element parameter was defined following the procedure described by Yeganeh et al., [
29], which allows the pile-soil to slip during ground shaking. Therefore, when a pile is loaded vertically or horizontally, a relative displacement between the pile and the host medium can occur. For all the foundation elements, an unconfined compression strength of 30 MPa was assumed.
The fixed-base period of the bridge in the transverse and longitudinal directions were determined by three procedures: as a first approximation, it was estimated by simplifying its behavior to a single degree of freedom system with the stiffness of an elastic cantilever beam; on the other hand, it was obtained by solving the eigenvalue problem between the stiffness and mass matrices of the idealized system in the numerical model; and, finally, the results were confirmed by a numerical simulation of a free vibration test on the idealized structure. As a result, it was established that the fixed-base period of the bridge including the foundation in the transverse and longitudinal directions is 0.45 and 0.60 s, respectively (
Table 3). More details about the characteristics of the urban bridge can be found in [
30].
3. Characterization of the Seismic Hazard
The interaction effects generated in the tunnel-soil-building-bridge system were studied against two input motions, with variations in their frequency content, duration and seismic intensity. The seismic hazard of Mexico City is controlled by two main sources: interplate earthquakes originated between the Cocos and North American plates along the Mexican subduction zone (subduction events), and intra-slab earthquakes that occur within the subducted Cocos plate by the internal stresses (normal events). The two most destructive earthquakes occurred in Mexico City have been originated by such seismic sources. In the first place is M8.1, 1985 Michoacan earthquake which resulted in significant damage and deaths in Mexico City despite having the zone of energy released at about 300 km away from the city. In second place is the recent Mw 7.1, 2017 intraplate earthquake, which occurred 150 km from Mexico City at a depth of 55 km, and caused significant building collapses. Although both seismic events triggered severe damage in the city, remarkable differences have been identified between them, particularly in the frequency content, intensity and duration. Intraplate events showed more energy at higher frequencies than interface events, affecting different zones and buildings of the city. It is worth to mention that, in both cases, significant amplification of the seismic motion and duration elongation of the seismic waves were identified, which was attributed to the extremely soft clay layer of Mexico City. This indicates that the seismic risk in Mexico City is strongly correlated with the site effects in the area. Recent published papers described in more detailed the observed damage patterns of both earthquakes and the interaction effects identified [
23,
24,
25,
31,
32,
33,
34].
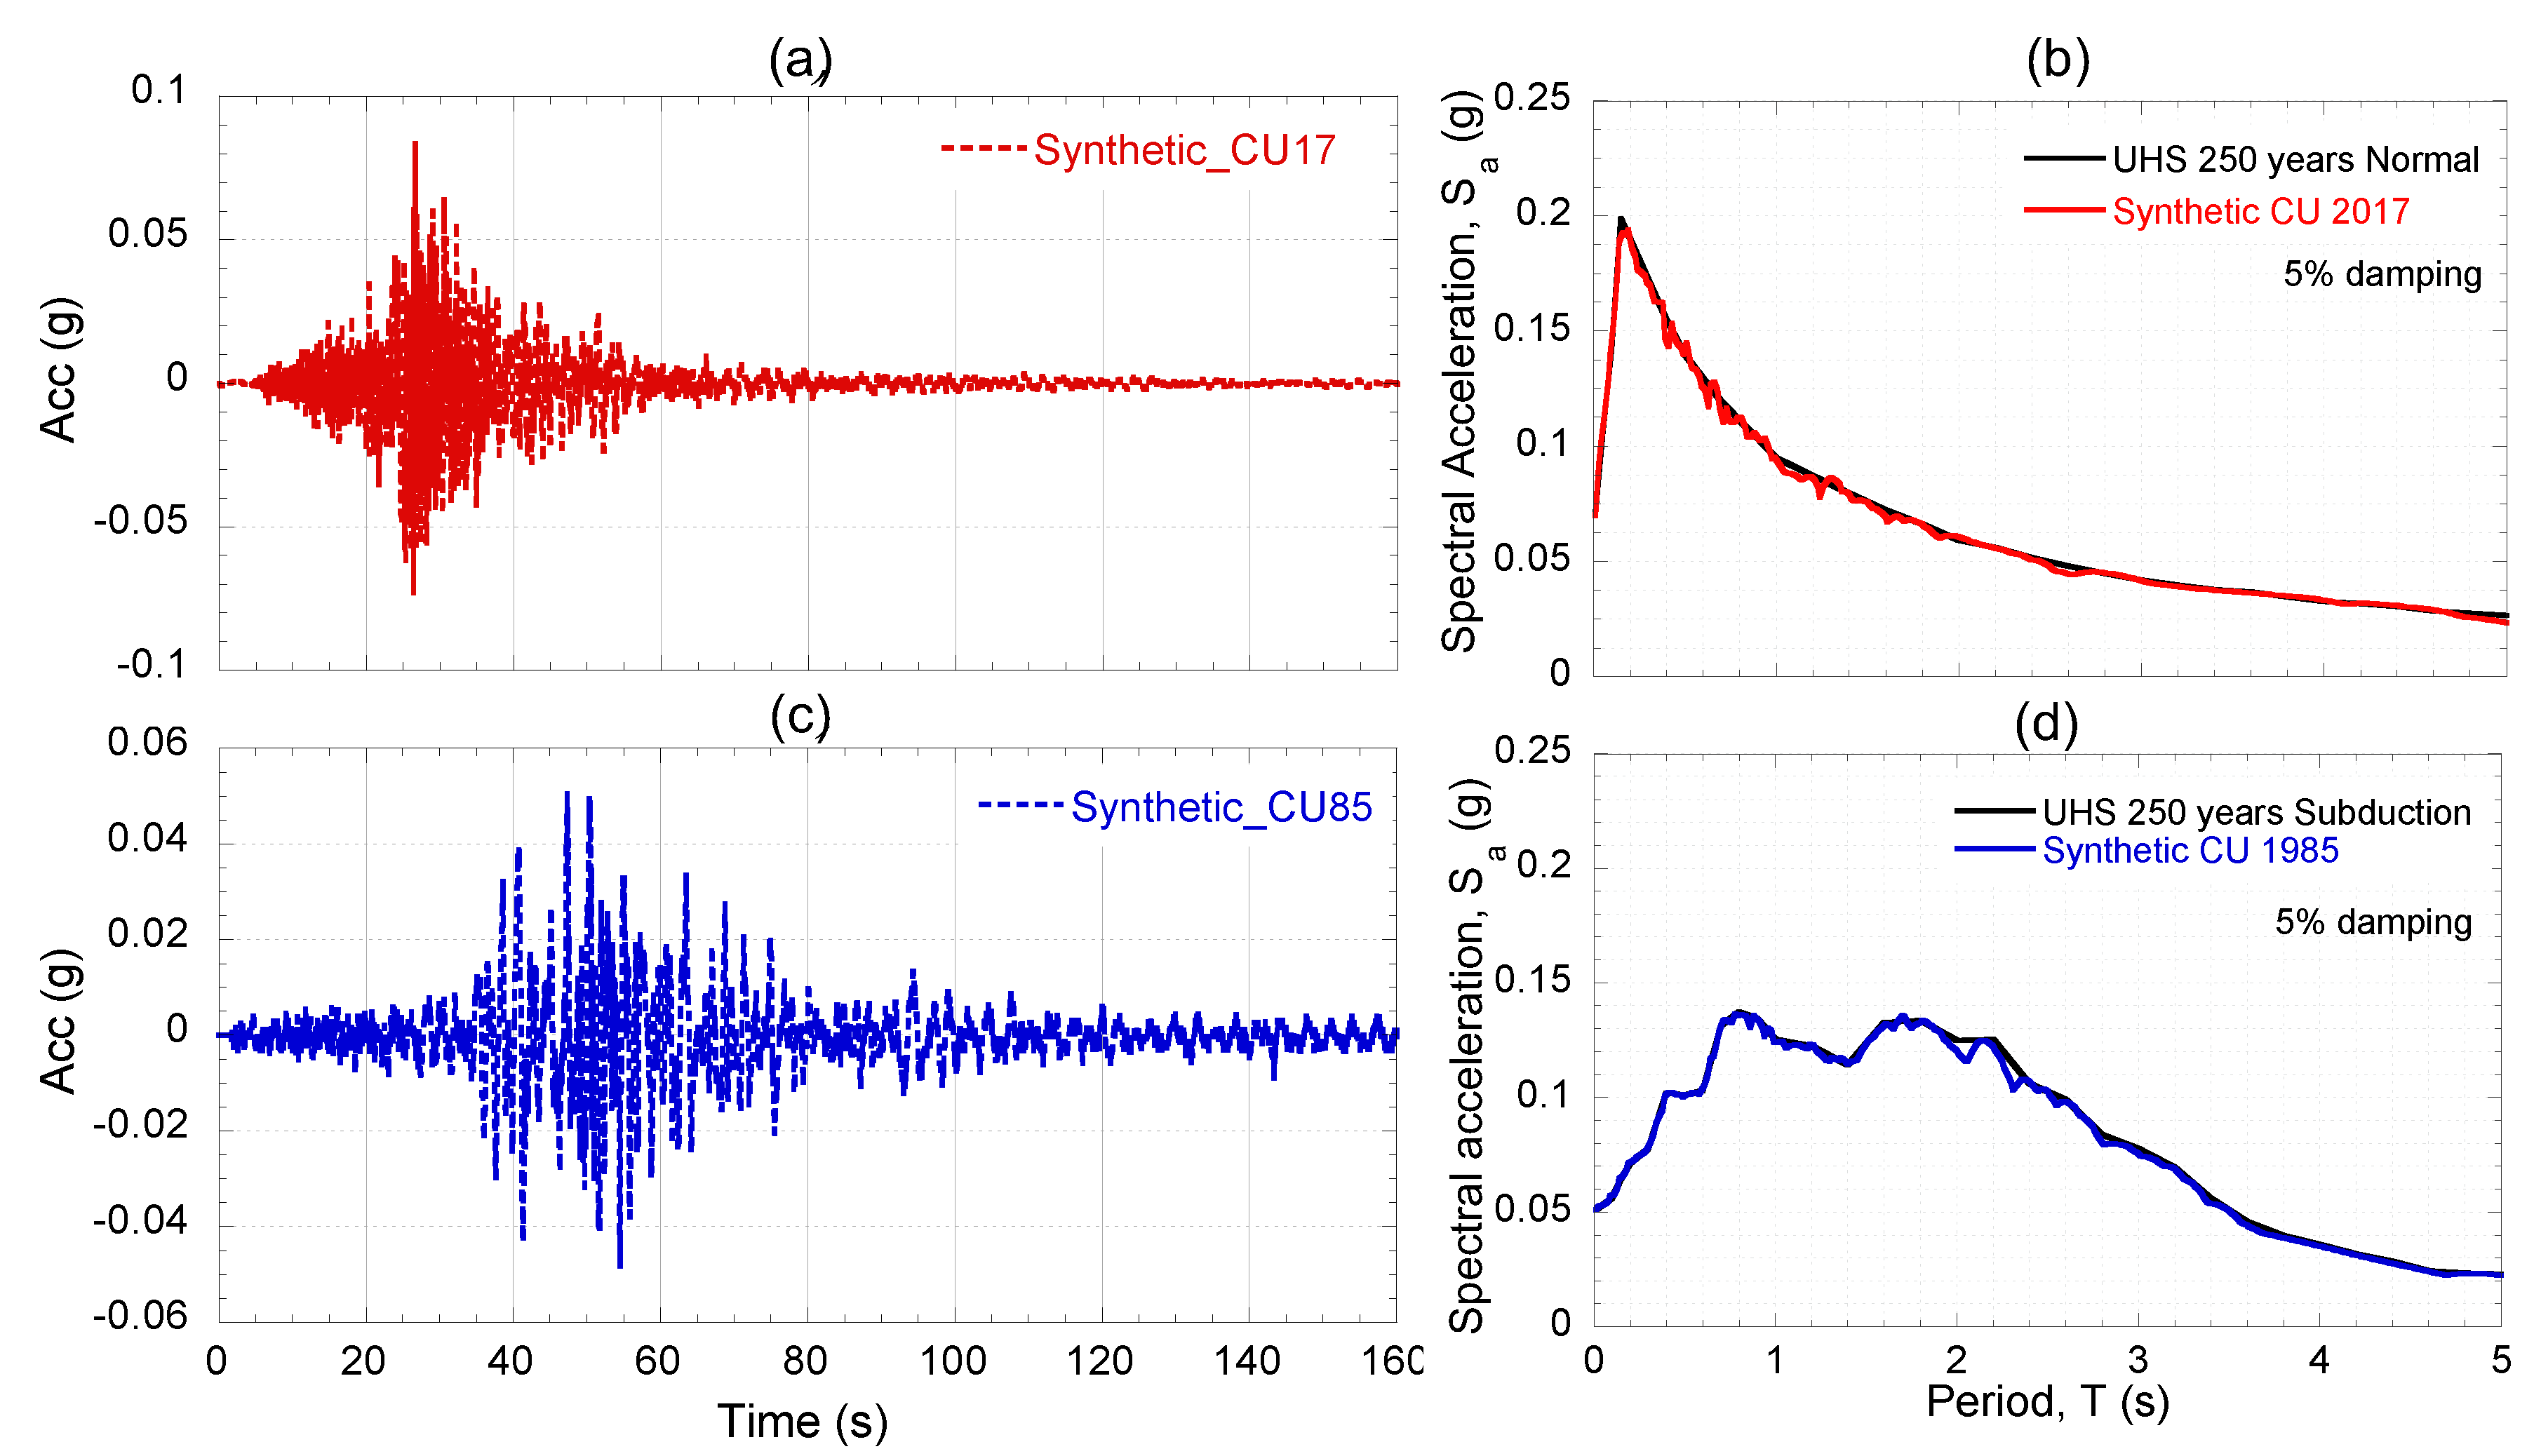
Based on the above description, the tunnel-building-bridge system was evaluated for both, intraplate and interface type earthquakes. For this purpose, the ground motions recorded at station CUP5 during the September 1985 earthquake (interface) and September 2017 (intraplate), which is located at a rock outcrop, were used as seed ground motion. The acceleration histories were adjusted to the uniform hazard spectra, UHS, developed for a return period of 250 years for the base design earthquake, depending on seismic source, in order to take into account a seismic intensity in accordance with the hazard level advised by the local building code [
35]. The chosen time history, commonly referred as seed ground motion, was modified by applying the method developed by Lilhanand and Tseng [
36] and modified by Abrahamson [
37] in order to match the response spectrum of the modified acceleration time history with the UHS. As can be seen in
Figure 7 the response spectrum calculated from the above methodology, reasonably matches with the target spectrum. The seed ground motions characteristics are compiled in
Table 4.
3.1. Free Field Site Response Analyses
Initially, the computer code SHAKE [
38] was used to conduct one-dimensional equivalent linear site response analyses and deconvolve the motion to the base of the soil-column. Afterwards, the soil column was simulated with FLAC3D and to apply the input motion at the base of the model, the compliant-base approach was considered, for which the seismic motion was applied as a shear stress history in order to produce an acceleration that is comparable to the target acceleration. In such a procedure, the recommended steps of Itasca [
16] for the seismic analyses were followed until reproducing adequately the target response spectra at the base and top of the model. To validate the model for the site response analysis, the records of the seismic station SCT of the 2017 earthquake were used as target. In Mayoral & Mosqueda [
3], the response spectra calculated with the results of the numerical model was compared with the response of the SCT record, and good match was achieved, as described in Mayoral & Mosqueda [
4]. Following this validation, the same features for the 3D model were considered in the current study.
4. Numerical Model
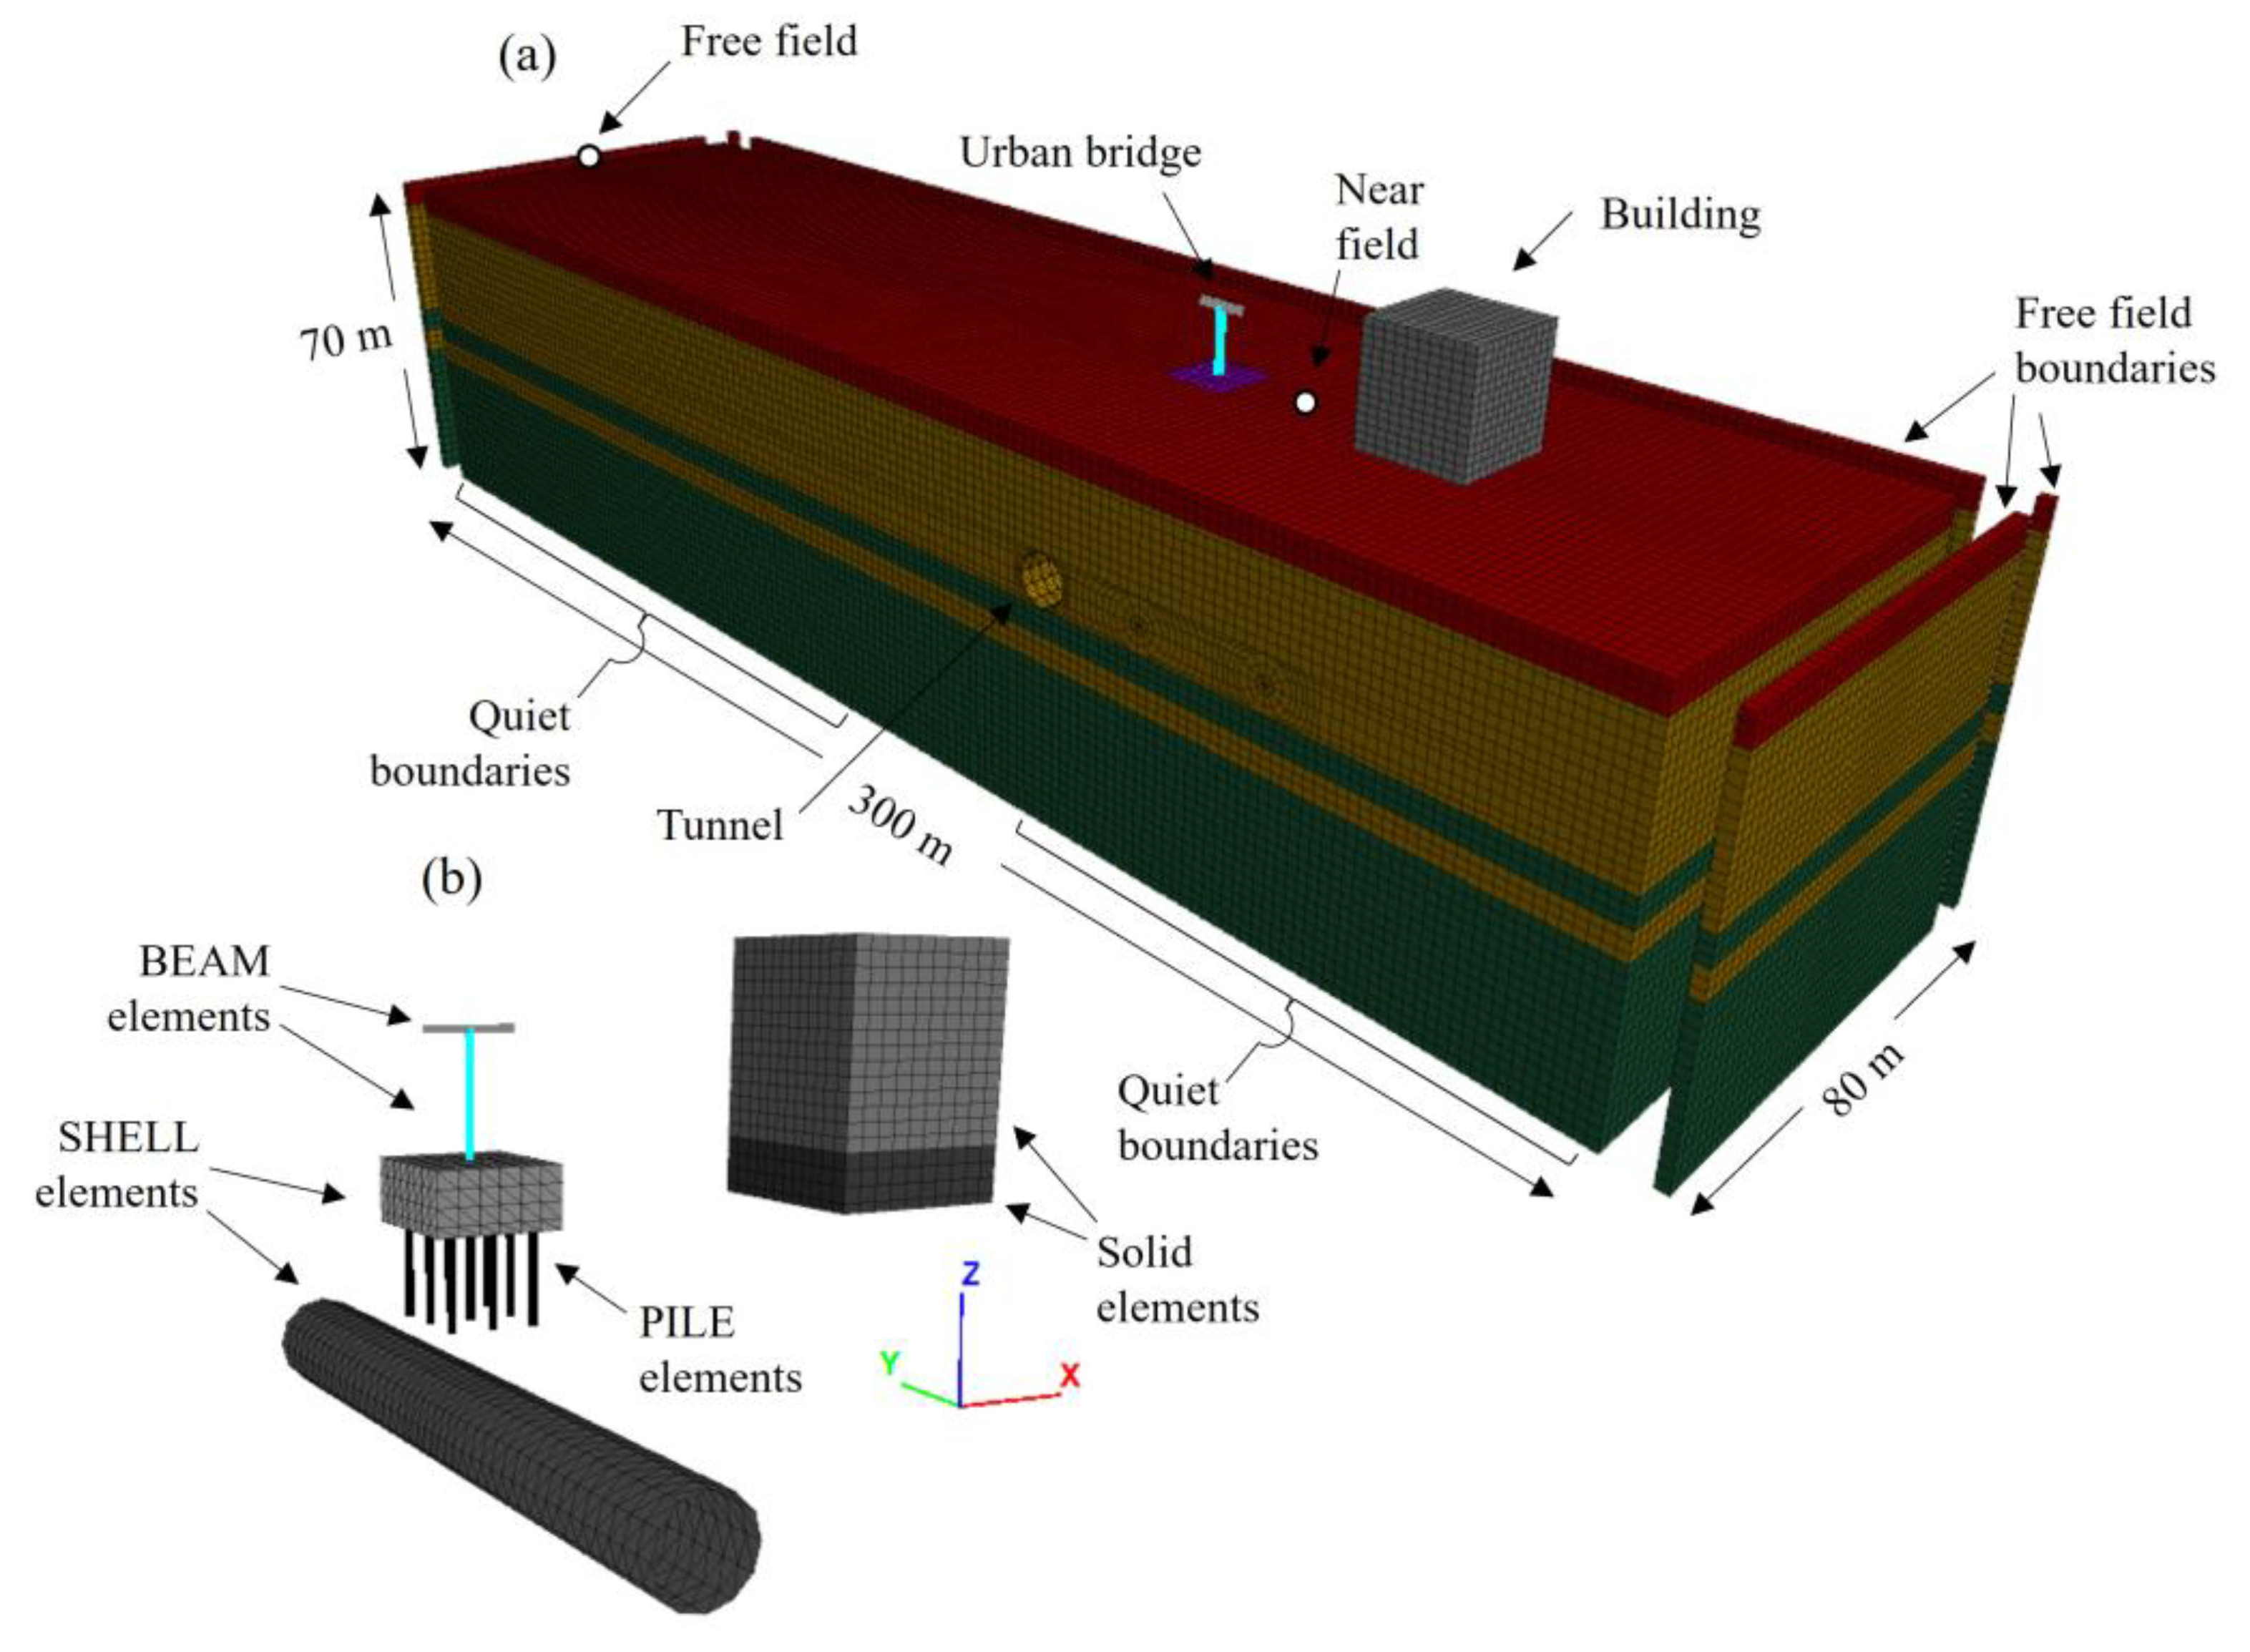
The tunnel-building-bridge seismic interaction was established throughout numerical models developed with the software FLAC3D. The model has 166,263 solid elements and 239,548 nodes, representing the building and the soil. The minimum thickness of the elements was stated in 2 m based on the recommendation provided by Kuhlemeyer and Lysmer [
39] to adequately simulate wave transmission through the mesh. Similar element sizes have been employed in previous research, and good agreement has been found between FLAC3D and SHAKE models [
40,
41]. Waves reflection at the model base was avoided using quiet boundary conditions, with the Lysmer & Kuhlemeyer [
39] formulation. For the horizontal faces of the model, the free field boundaries formulation of FLAC3D were used as dynamic boundary condition. Whit this condition, a free field grid that has the same properties of the lateral faces, is coupled with the main grid through viscous dashpots to simulate quite boundary. Additionally, the free field grid applies to the main grid the unbalanced forces resulted during the seismic motion, in order to prevent distortion of the plane waves traveling upward at the lateral boundaries.
When such a boundary condition is applied, the main grid’s lateral boundaries are coupled to a free-field grid with the same properties as the lateral faces using viscous dashpots to simulate a quiet boundary, and the unbalanced forces from the free-field grid are applied to the main-grid boundary. In such a way that plane waves traveling upward suffer no distortion at the boundary because the free-field grid provides circumstances identical to those in an infinite model [
16].
To represent soil behavior the Mohr-Coulomb failure criterion was used, and the structure elements were simulated with an elastic stress-strain relationship. The lining of the tunnel and the box foundation of the bridge were simulated by SHELL elements, the superstructure idealized by BEAM elements, and the piles by PILE elements.
Figure 8a shows the numerical model for the tunnel-building-bridge seismic interaction analyses with the considered boundary conditions, and
Figure 8b the structural elements considered.
During the dynamic simulation, the soil elements develop hysteretic closed loops of load-unload cycles, nevertheless the Mohr-Coulomb model is not capable of reproducing that behavior. Therefore, to simulate the soil nonlinearities, the hysteretic model Sig3, available in FLAC3D, was implemented. This model permits the simulation of stiffness degradation and generation of damping during cyclic stress-strains loops. Although it is not a complete constitutive model, it can be used as a supplement to provide material damping. It should be stated that, with this model, stress depends only on the deformation and not the number of cycles, and the corresponding damping is given directly by the hysteresis loop during cyclic loading. The Sig3 model is defined according to Eq. (1):
where G/G
max is the normalized secant modulus, L is the logarithmic strain defined as L= log10(γ), and a, b, and x0, are fitting curve parameters used by the sig3 model, to be matched with the modulus degradation curves.
Table 5 summarizes the Mohr-Coulomb parameters of each material, as well as the parameters of the hysteretic model Sig3. These parameters were defined by a fitting process using the least square method to reproduce the stiffness degradation and damping curves of
Figure 4. The fitting was prioritized on the G/Gmax curves, considering that in a nonlinear response history analysis, the characterization of the transient ground response is in function of the evolving shear strains during the seismic loading, which diverges from the steady state response used to derive the experimental damping curves.
The coupling springs of the pile elements was calculated with the following equations, which simulate the shear and normal interface behavior at the pile–soil contact.
Table 6 shows the calculated pile-soil spring values.
Where:
α= value of this parameter depends on the condition of the pile surface. For the rough surface (like the cast–in–situ pile), it is suggested to be equal to 1 [
34].
Csoil and φsoil= cohesion and internal friction angle of the soil adjacent to the pile.
P= exposed perimeter of the pile.
K and G= bulk and shear moduli of the soil adjacent to the pile.
Δzmin= smallest width of an adjoining zone in the normal direction
Dpile= pile diameter
and = cohesion and frictional strength components of the shear springs
, and = cohesion, frictional and tensional strength components of the normal springs
and = stiffness of the shear and normal springs.
5. Tunnel-Bridge-Building Seismic Interaction
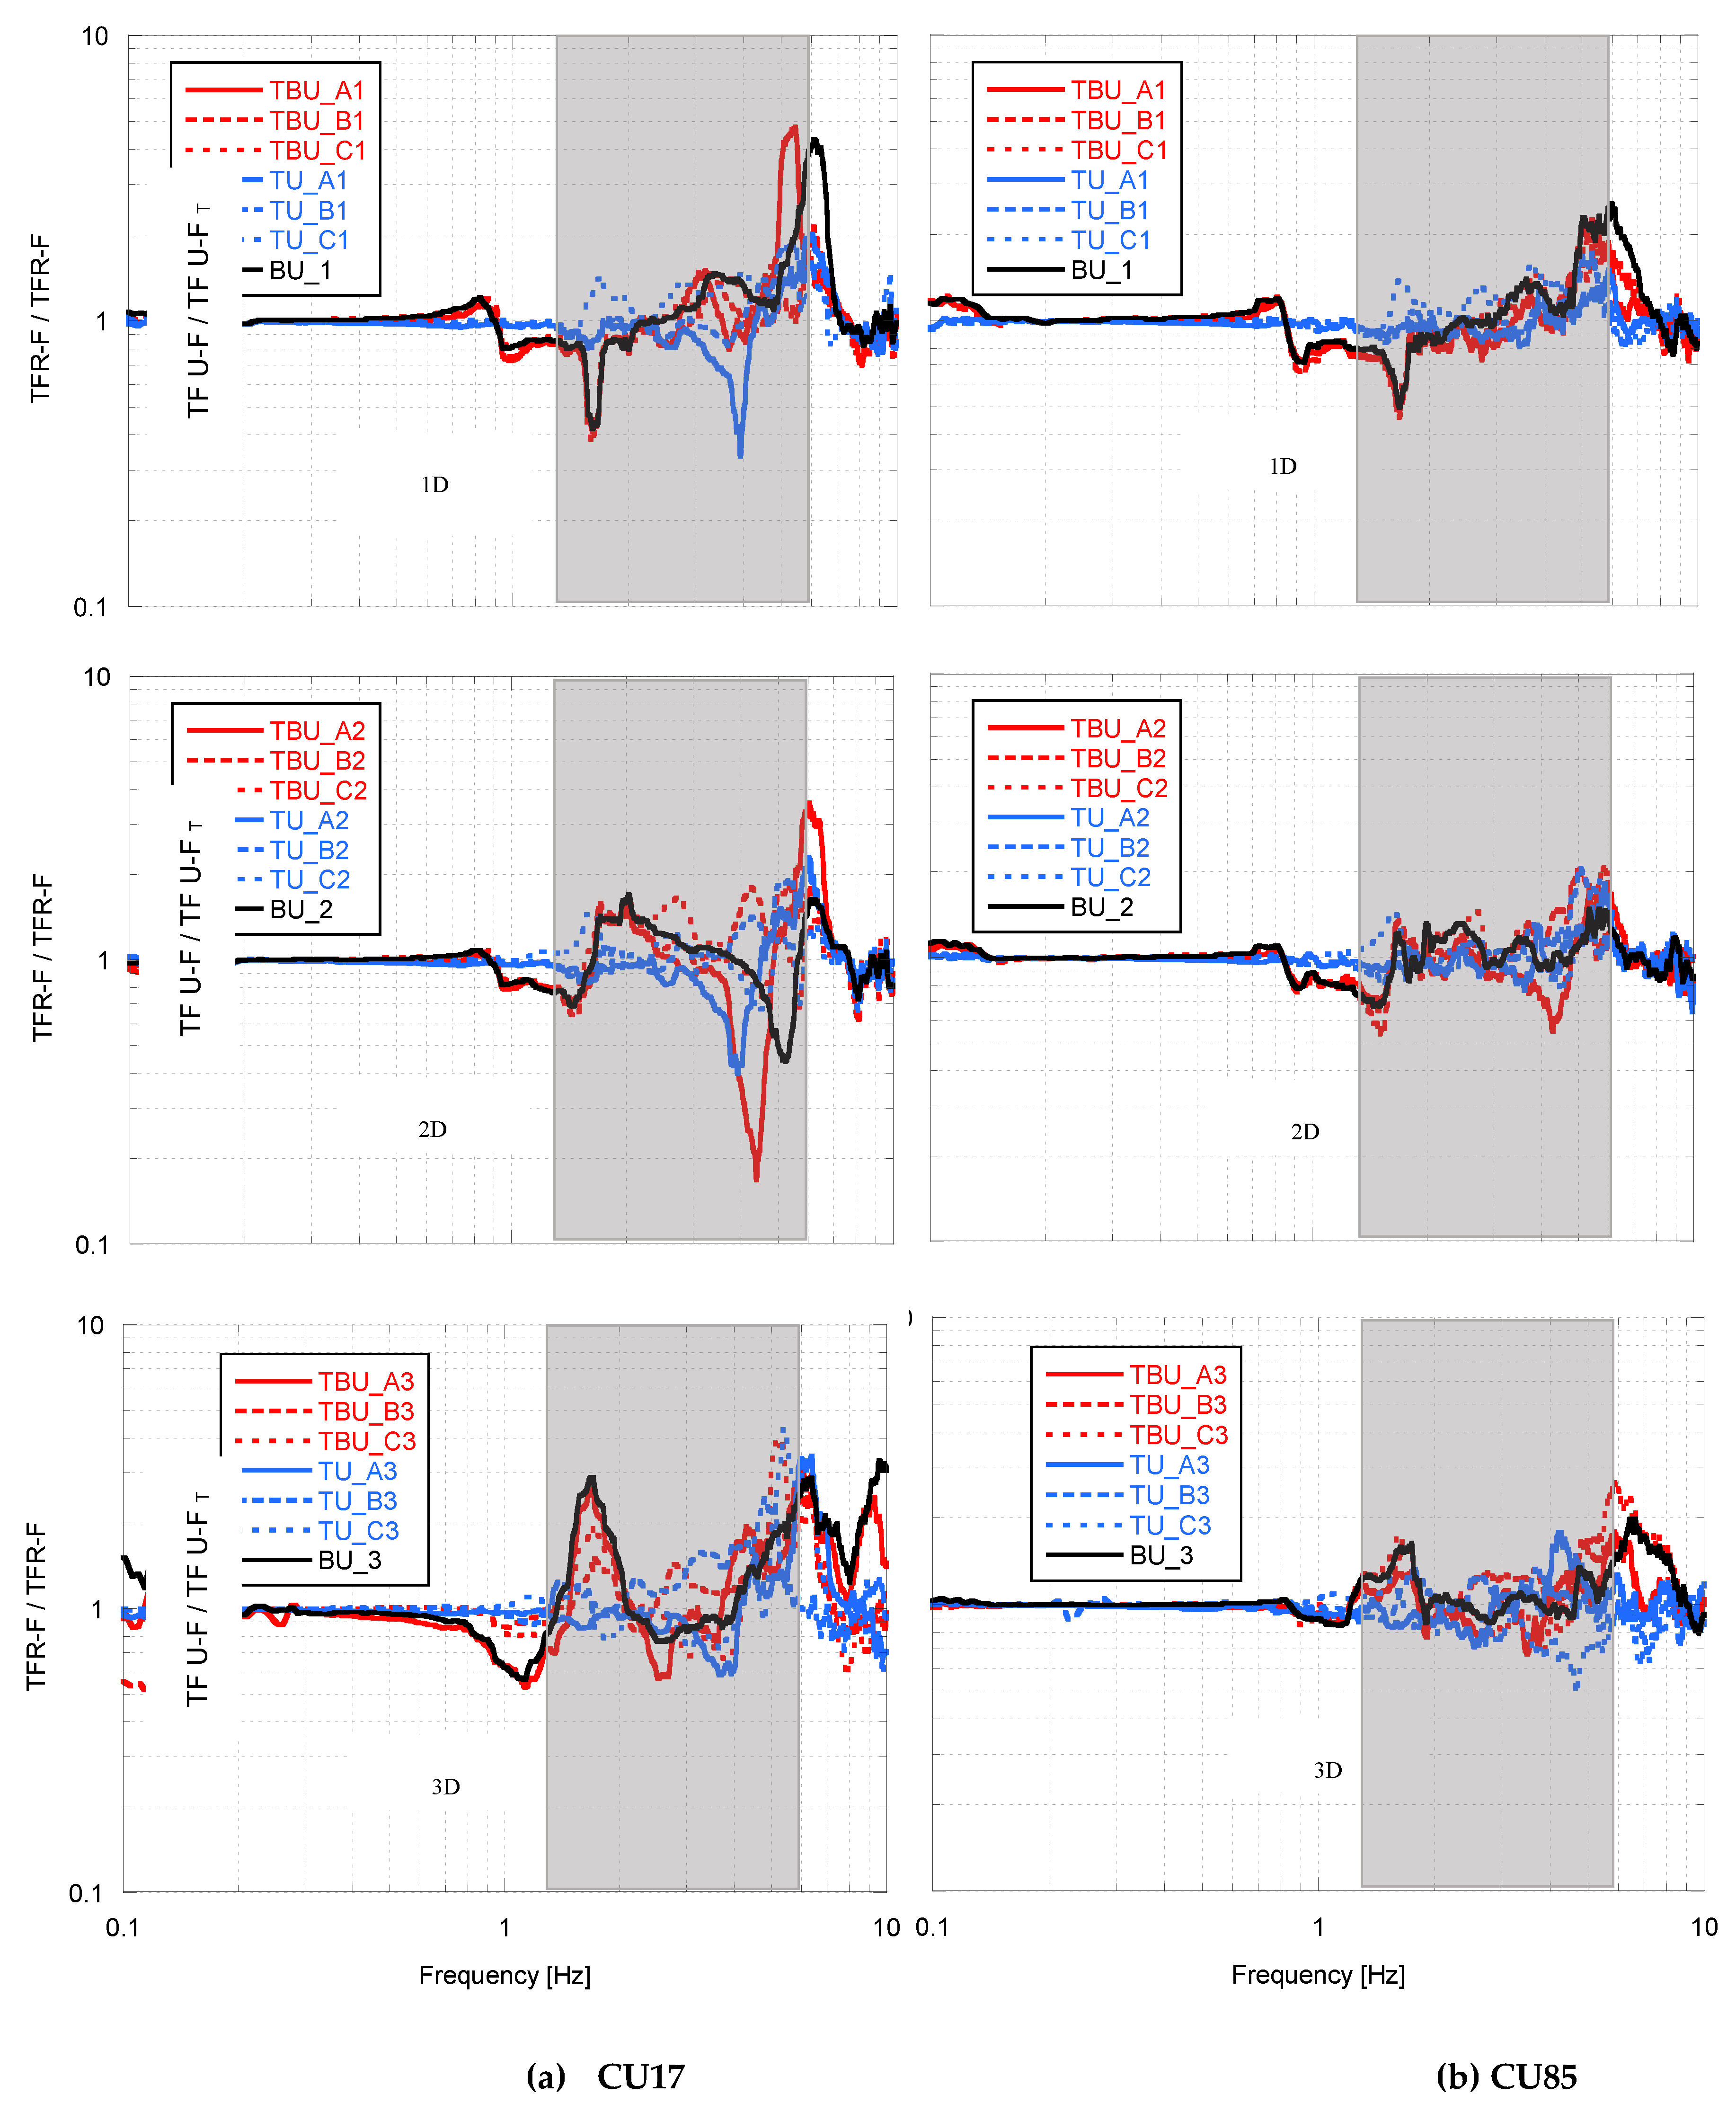
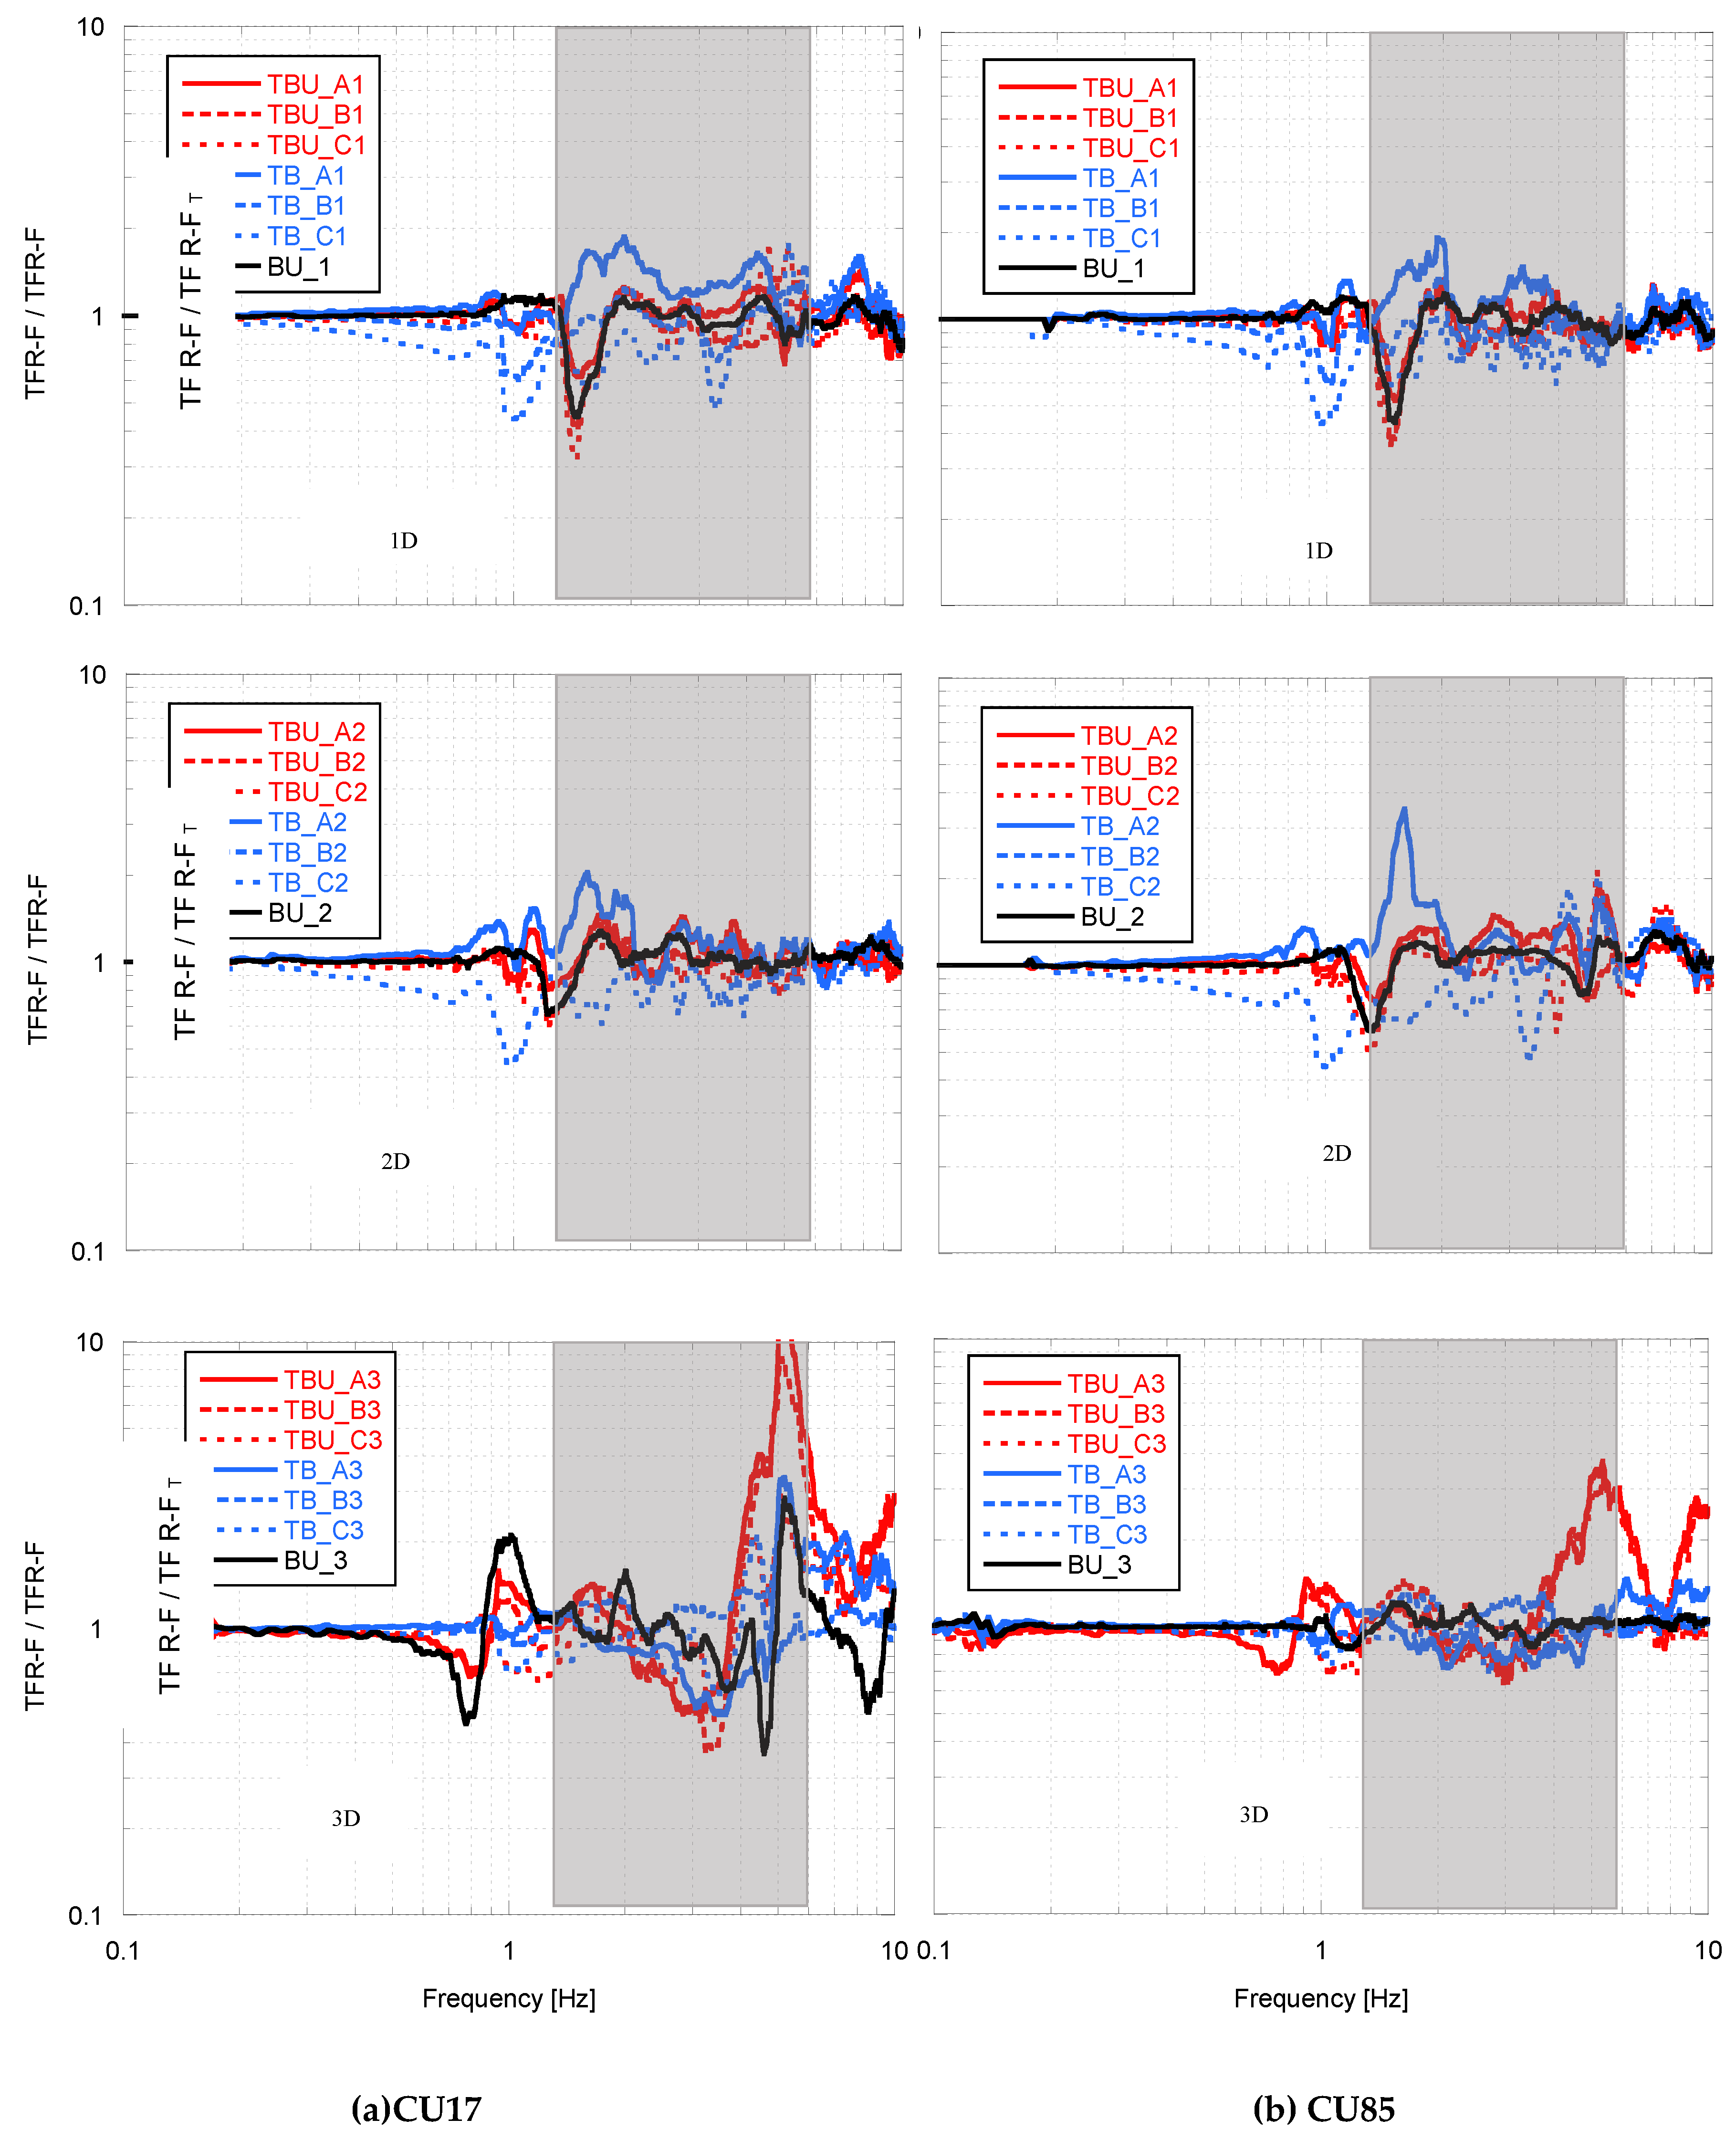
The deconvolved input motions calculated in the free field response analyses was employed in the dynamic analyses of the tunnel-soil-bridge-building model, using the same compliant-base approach. For both CU17 and CU85 input motions, the shear stress histories were applied in the two orthogonal directions “x” (i.e., transversal) and “y” (i.e., longitudinal) at the model’s base, considering 100% in each direction. To study the seismic interaction effect on the tunnel-bridge-building system, the results were presented in terms of the “Interaction factor for the urban bridge”, Tuf (
Figure 9 and
Figure 10), which is the transfer function computed between the upper deck of the bridge and its foundation without the presence of the adjacent structures, TF U-F, divided by the transfer function between upper deck of the bridge and its foundation with the presence of the structures in the different scenarios, TF U-F
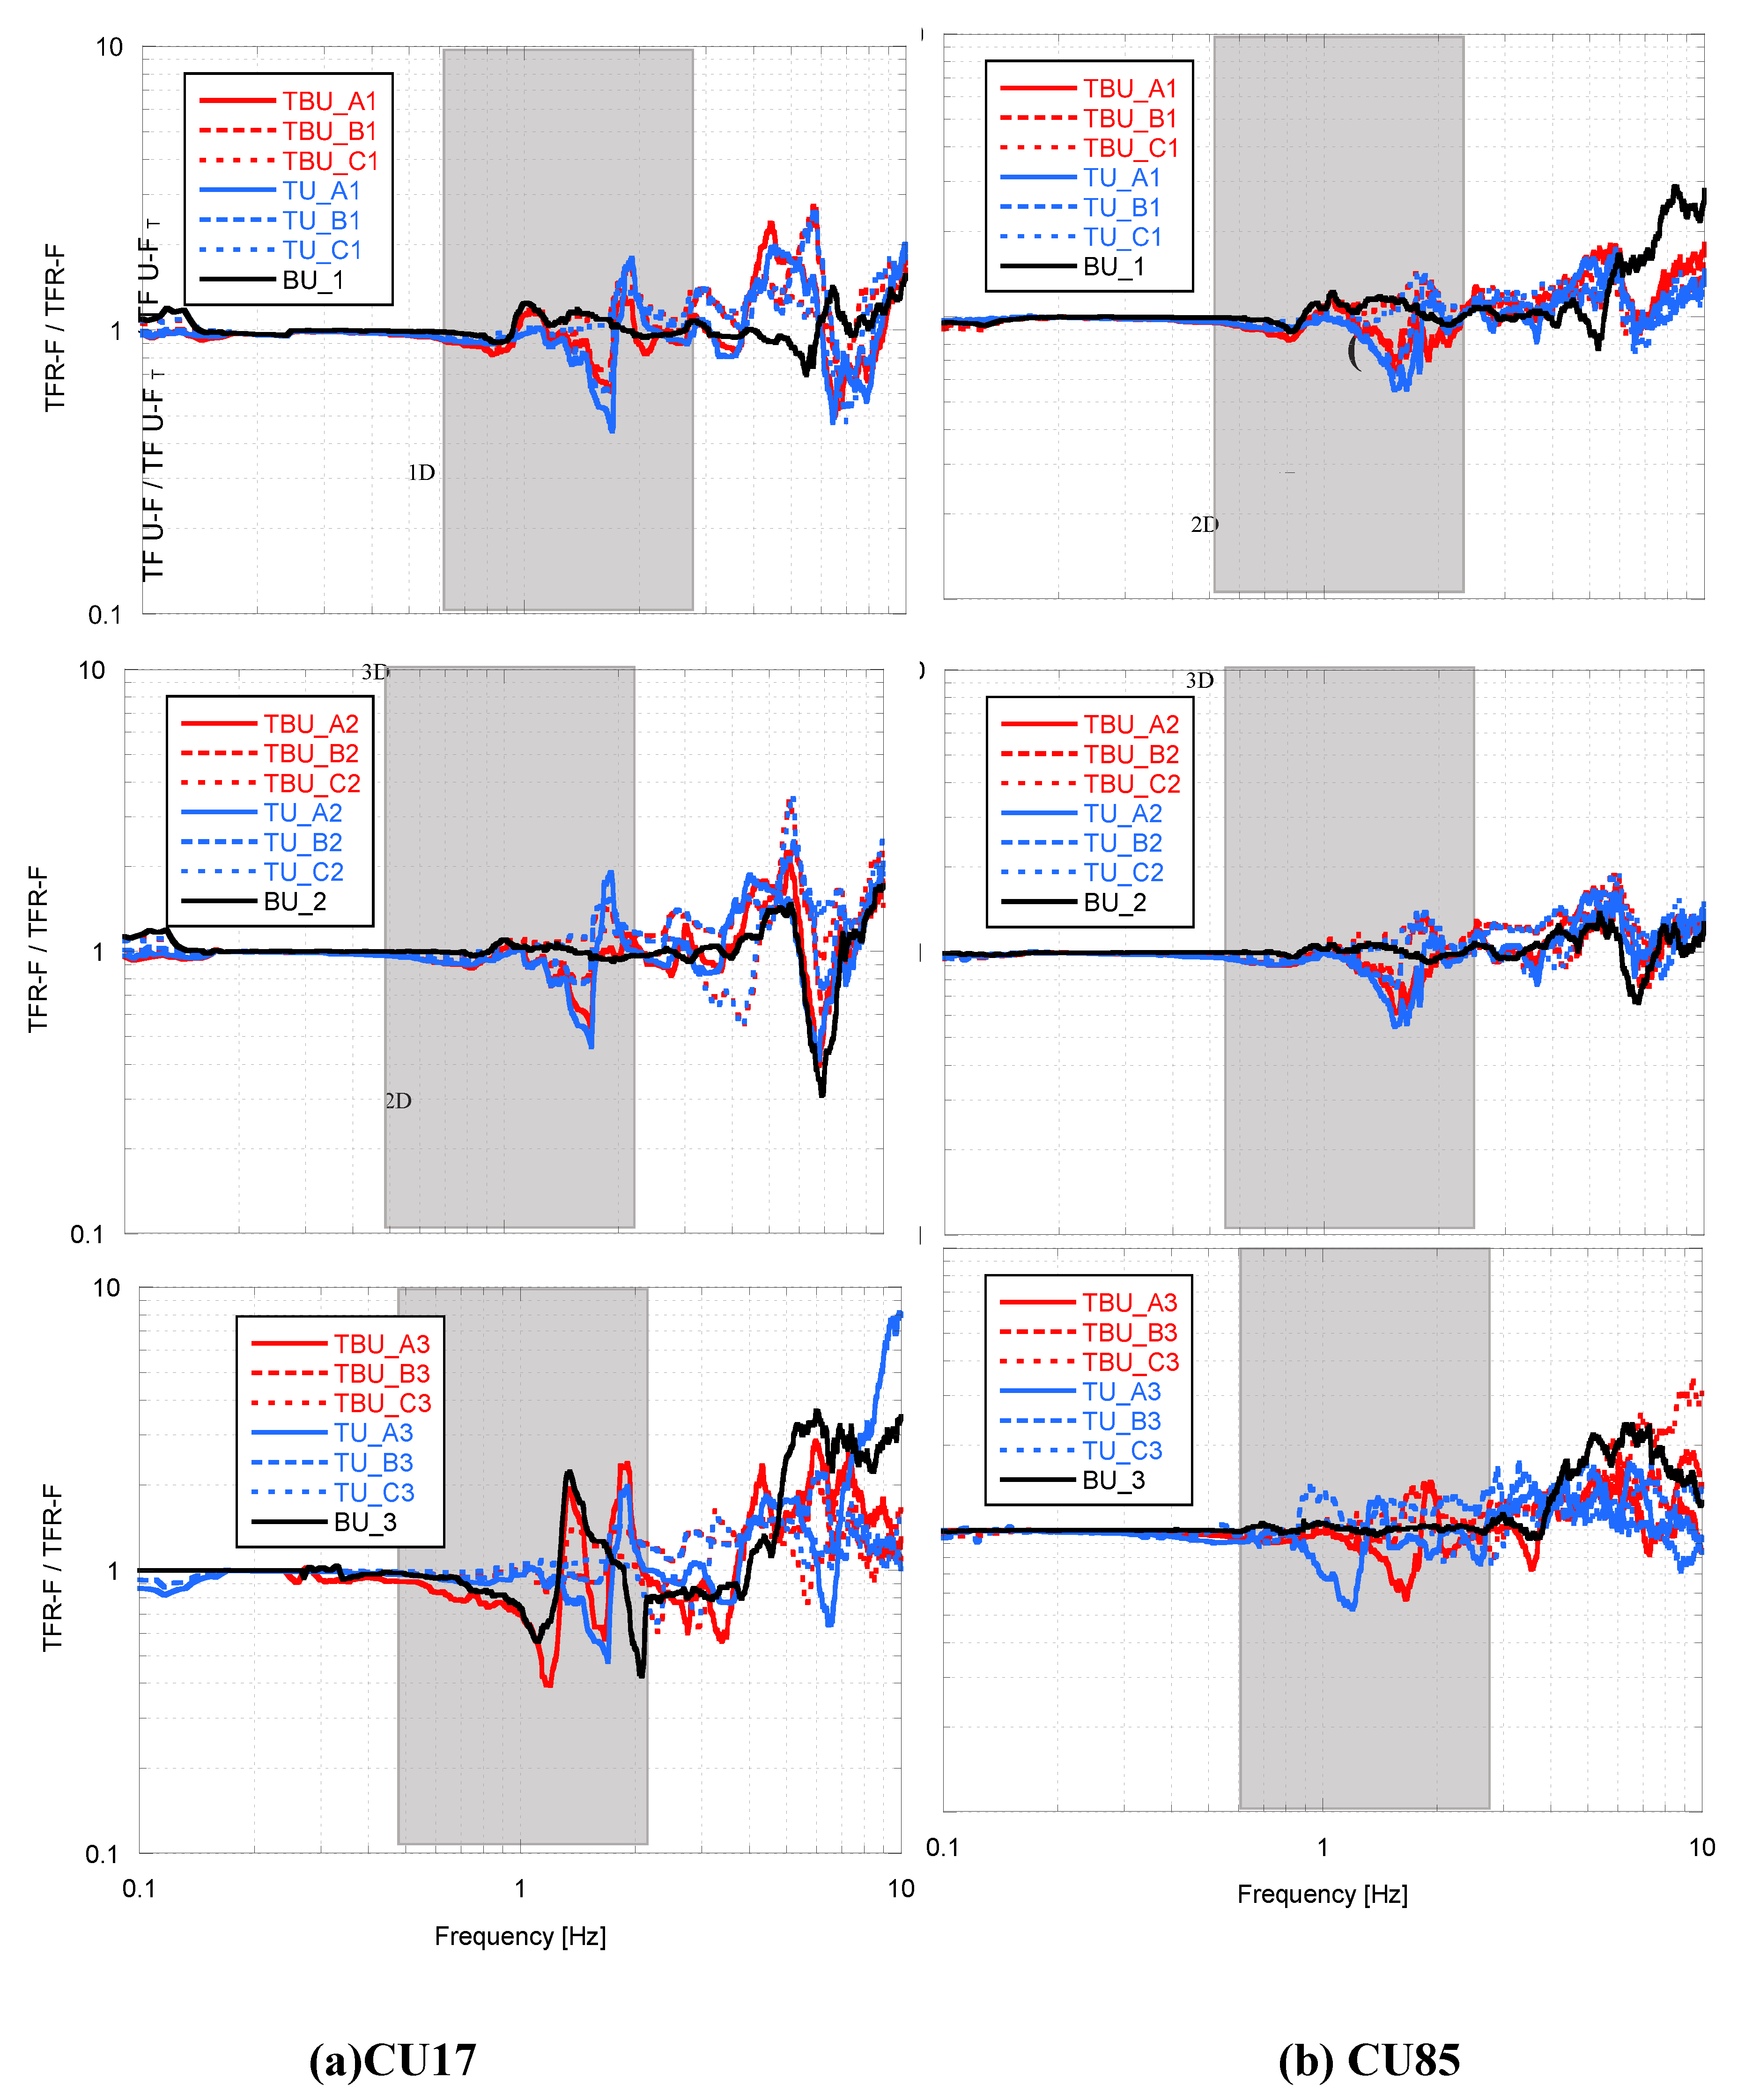
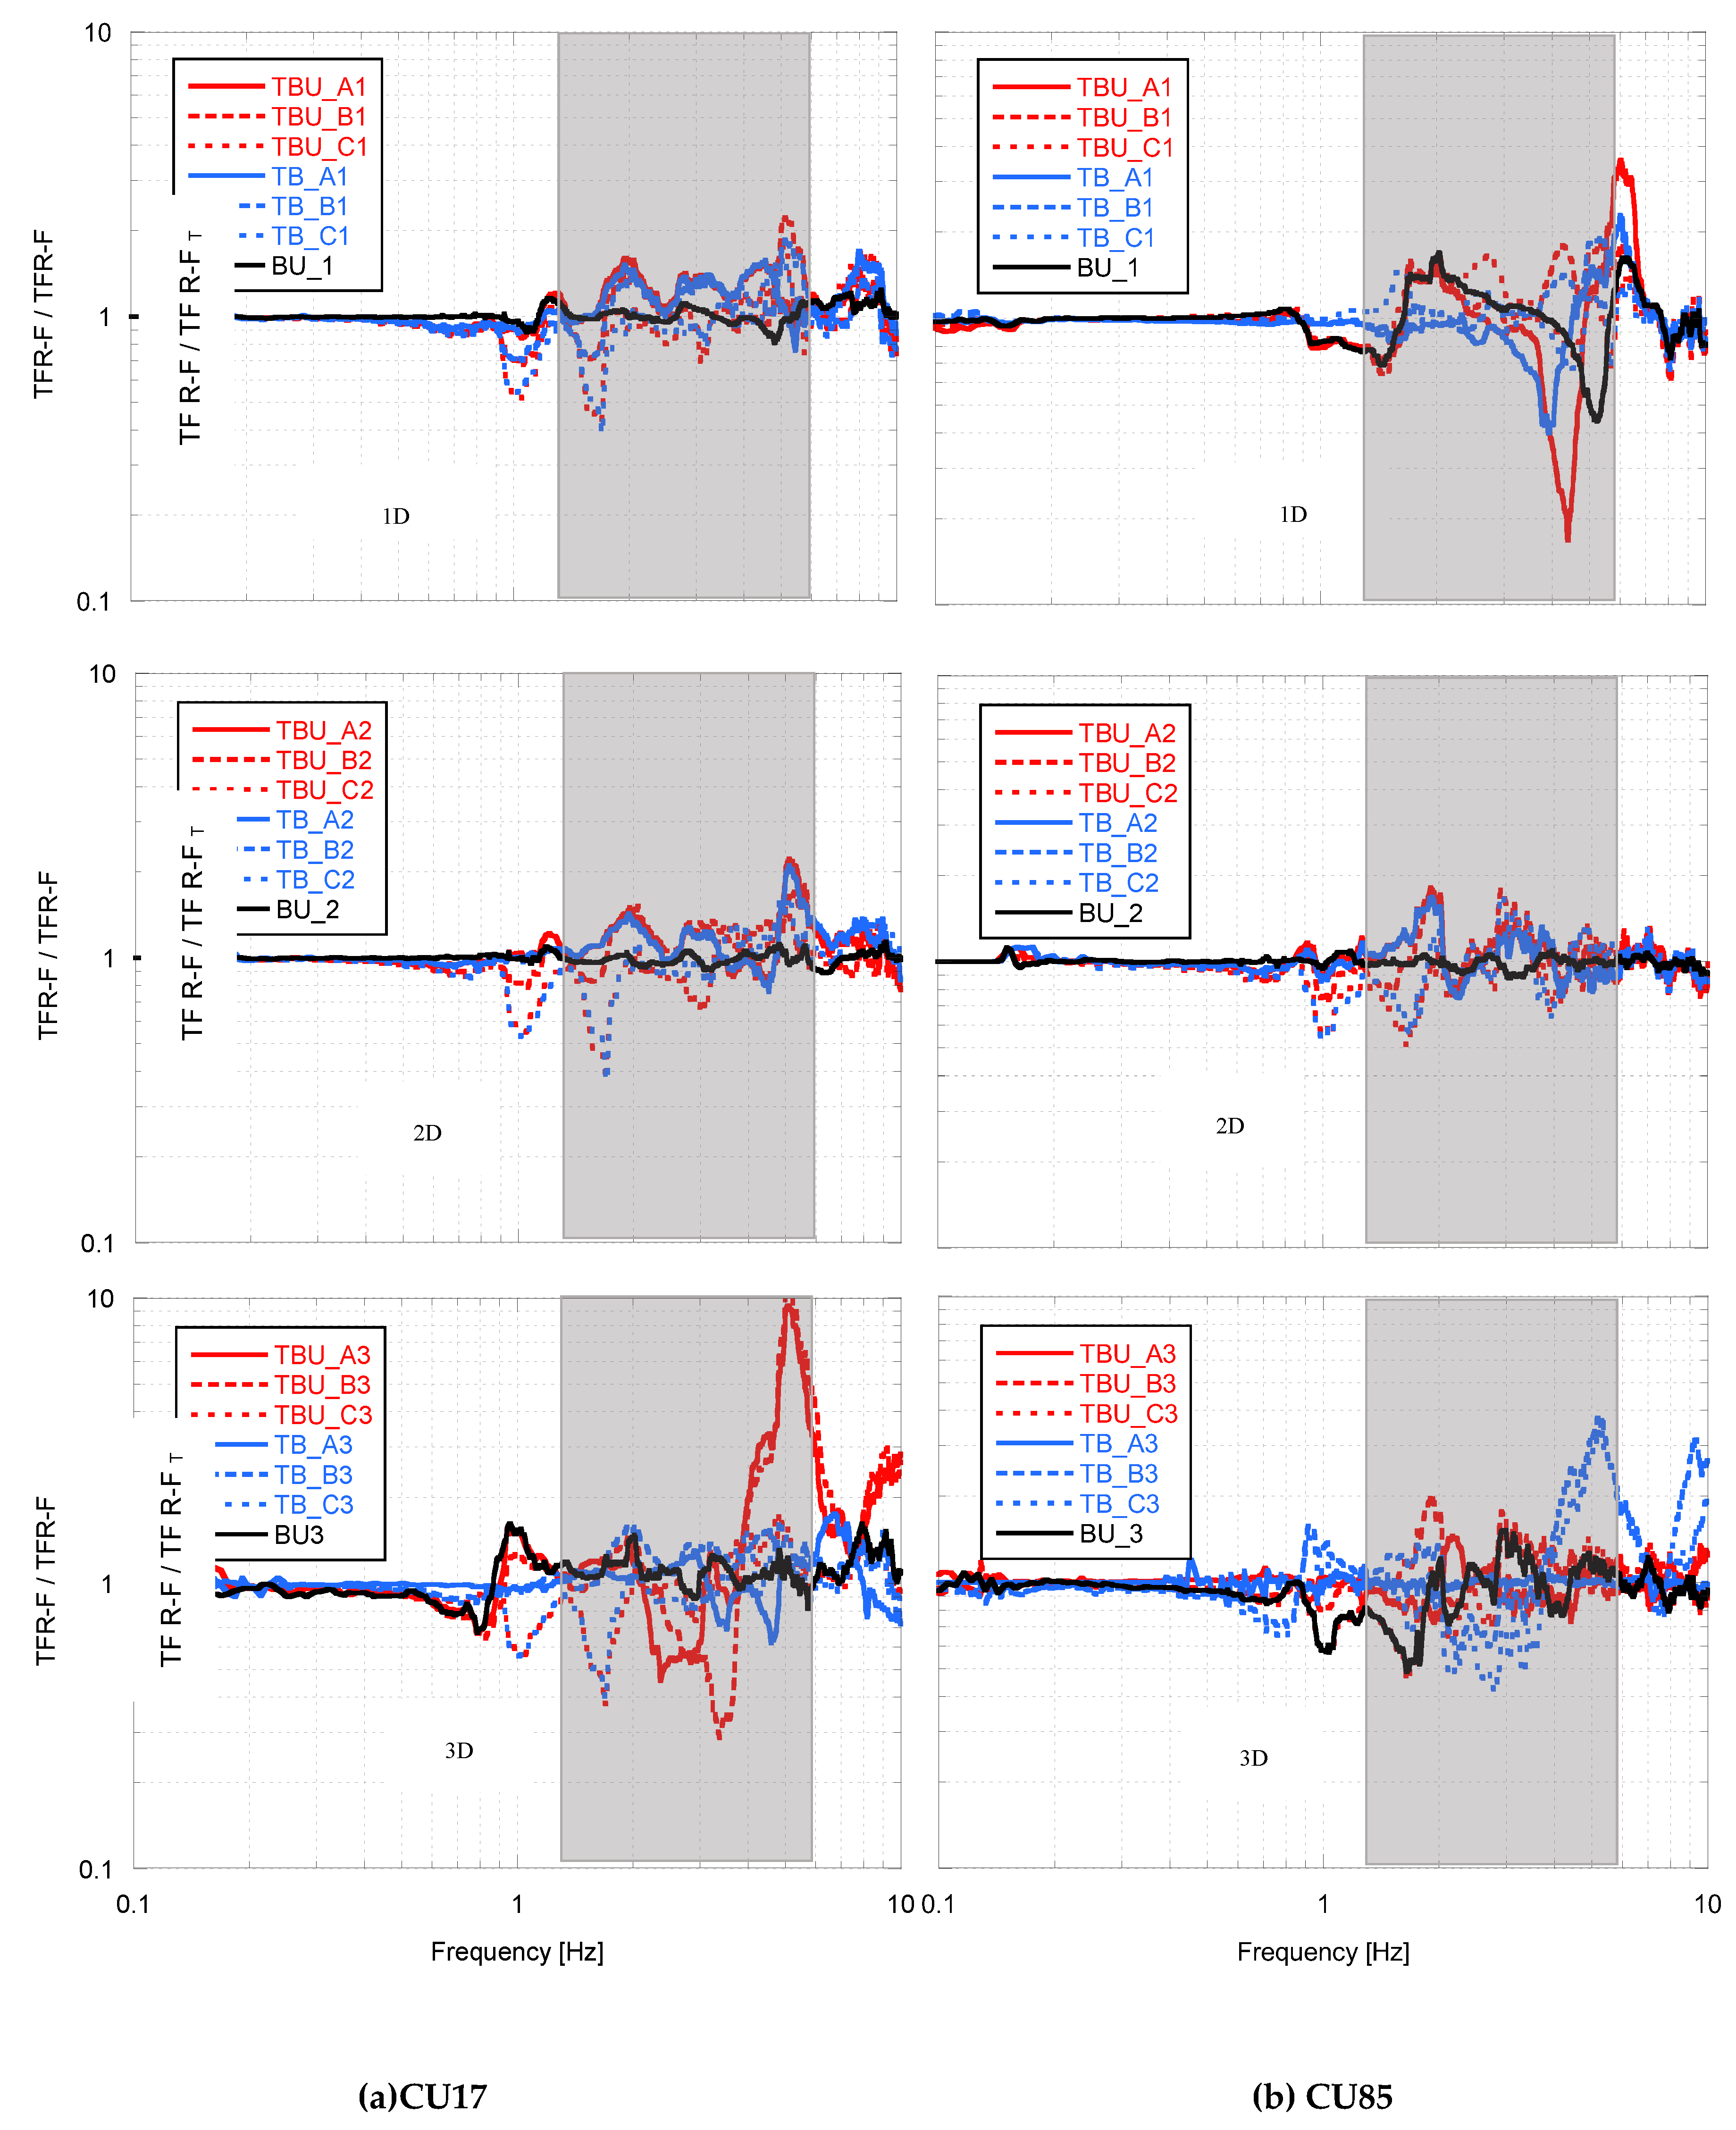
T. Similarly, the “Interaction factor for the building”, Tbf (
Figure 11 and
Figure 12), was defined. These results are presented for all the scenarios considered in
Figure 2 and
Table 1, for the transversal and longitudinal components. Tuf and Tbf allow us to clearly show the effect of the amplification potential and energy distribution within the frequency content of interest. Values of Tuf and Tbf above one corresponds to beneficial interaction (i.e., the building and bridge amplification potential decreases due to the adjacent structures), whereas a value below one means detrimental interaction (i.e., the building and bridge amplification potential increases due to the adjacent structures). These relationships based on the transfer functions allow us to assess the amplification potential and energy distribution for each frequency. In all cases, the relevant frequency is indicated, depending on the fundamental period of the structure and direction analyzed, which are equal to Tb= 0.45 and 0.6 s (2.2 and 1.6 Hz) for the bridge in the transverse and longitudinal direction, respectively, and Te=1.0 s (1.0 Hz) for the building in both directions. The characteristic elastic site period of the soil Tpe
2.0 s (0.5 Hz) is also within this range.
First of all, it can be clearly appreciated in all cases (
Figure 9,
Figure 10,
Figure 11 and
Figure 12) the interaction between structures is greater for high frequencies (> 1 Hz) and that is almost negligible for low frequencies (< 1 Hz). Also, the interaction is bigger for the CU17 synthetic ground motion which concentrates its energy on higher frequencies than the CU85. This can be associated partially with the dispersion and wave scattering effect of the short waves which corresponds to the high frequency seismic motion component. When there is a heterogeneity within a uniform soil strata wave scattering can be occur. Although this does not affect the total amount of energy carried by seismic motion, at the limits of heterogeneities, scattering tends to disorganize a wave field through reflection and refraction. In such a way that the amplitudes of waves, especially at higher frequencies, are dispersed over different wave lengths [
42]. Therefore, in systems formed by several vibration structures (bridges and buildings) located above a soil media with heterogeneities (such as tunnels), it is most probable that their seismic response would be affected in high frequencies.
Figure 9 and
Figure 10 show the interaction factor for the bridge, it is also clear that for frequencies around 1 and 2 Hz the amplification potential is affected by the presence of the building. While for higher frequencies, the presence of tunnel increases the amplification potential. Also, the interaction between the three structures decreases in the frequency range of interest when the tunnel moves away from the bridge (Case TBU_C). This can be clearly appreciated by comparing the black line (“BU” which represents the case of urban bridge and building without the tunnel) with the red lines (“TBU” which represent the cases with the three structures in their different positions), due to in almost all the cases the within the relevant frequency range these lines are very similar. This suggest that that the presence of the building have greater impact on the seismic response of the bridge within these frequencies, nevertheless as the frequency increase the red lines tend to be more similar to the blue lines (“TU” which represents the case of urban bridge with the tunnel in the different positions), which suggest that the tunnel have greater impact on higher frequencies. Similar effects can be appreciated on the building response, and in addition there is a clear amplification potential (i.e., detrimental interaction) in both directions, as the tunnel gets closer to the building underneath its foundation, as shown by all the discontinuous lines (i.e., cases B and C).
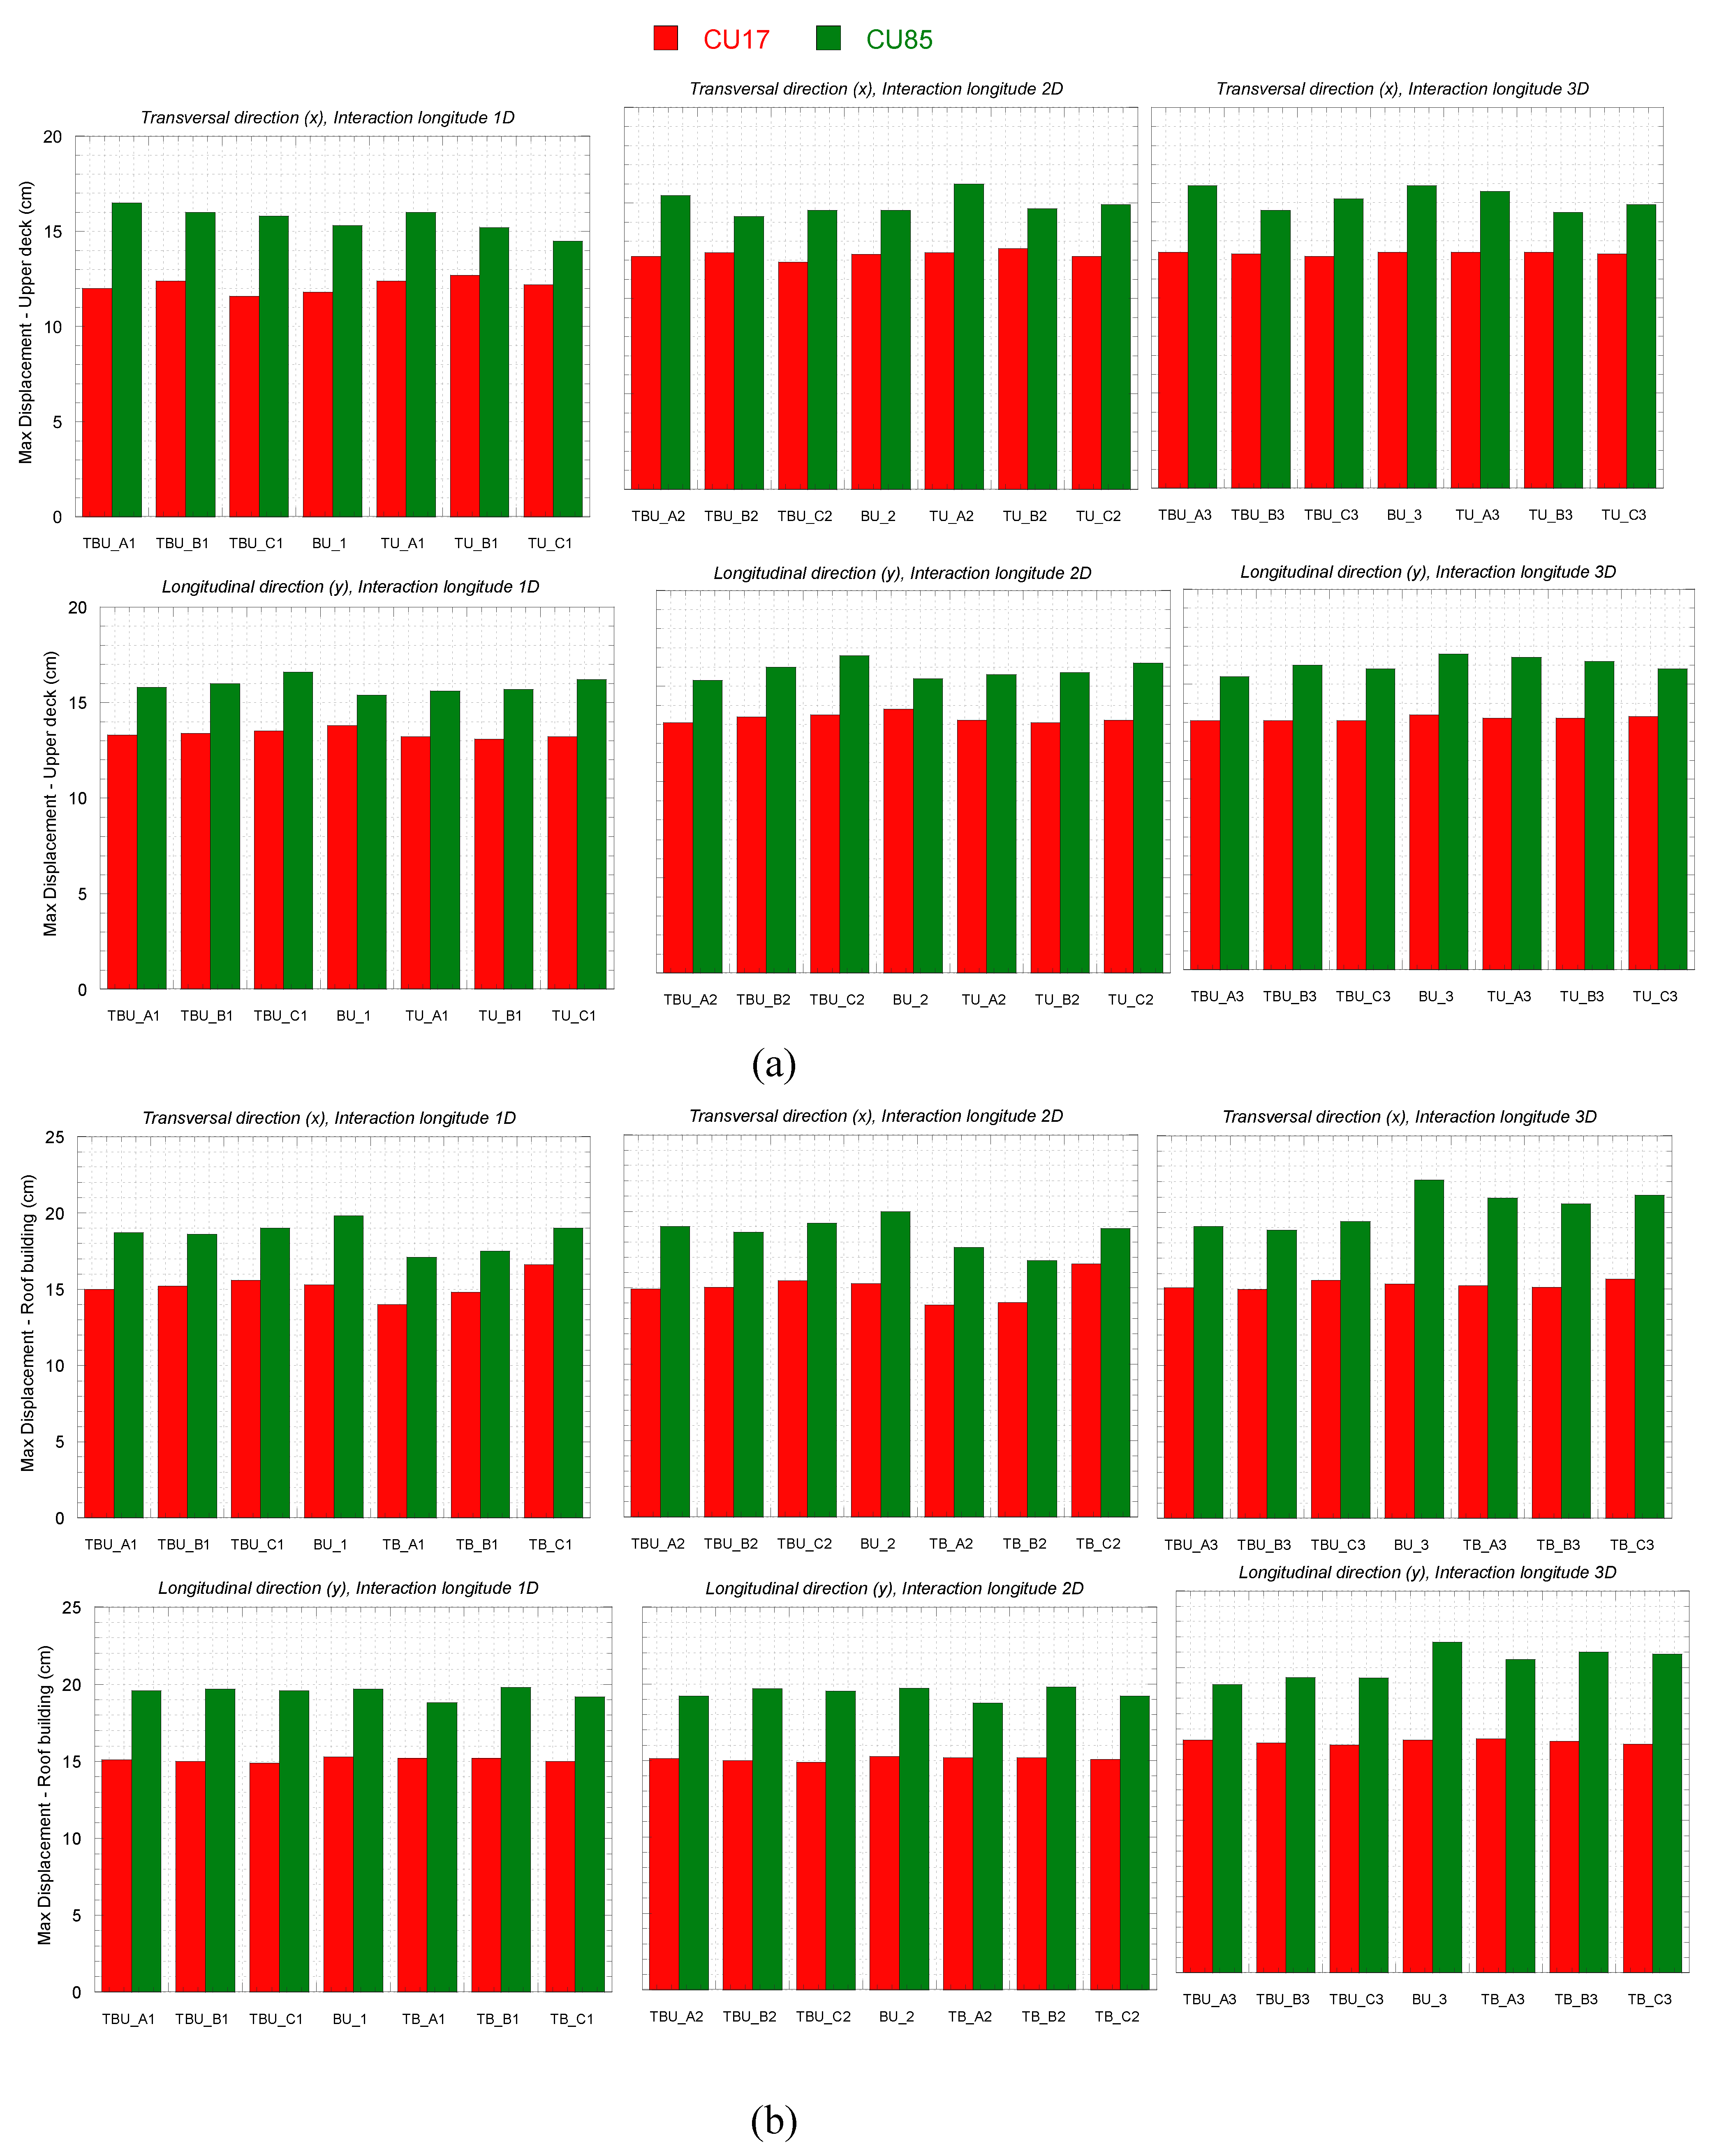
The above results agree with the maximum displacements computed at the upper deck bridge and building roof (
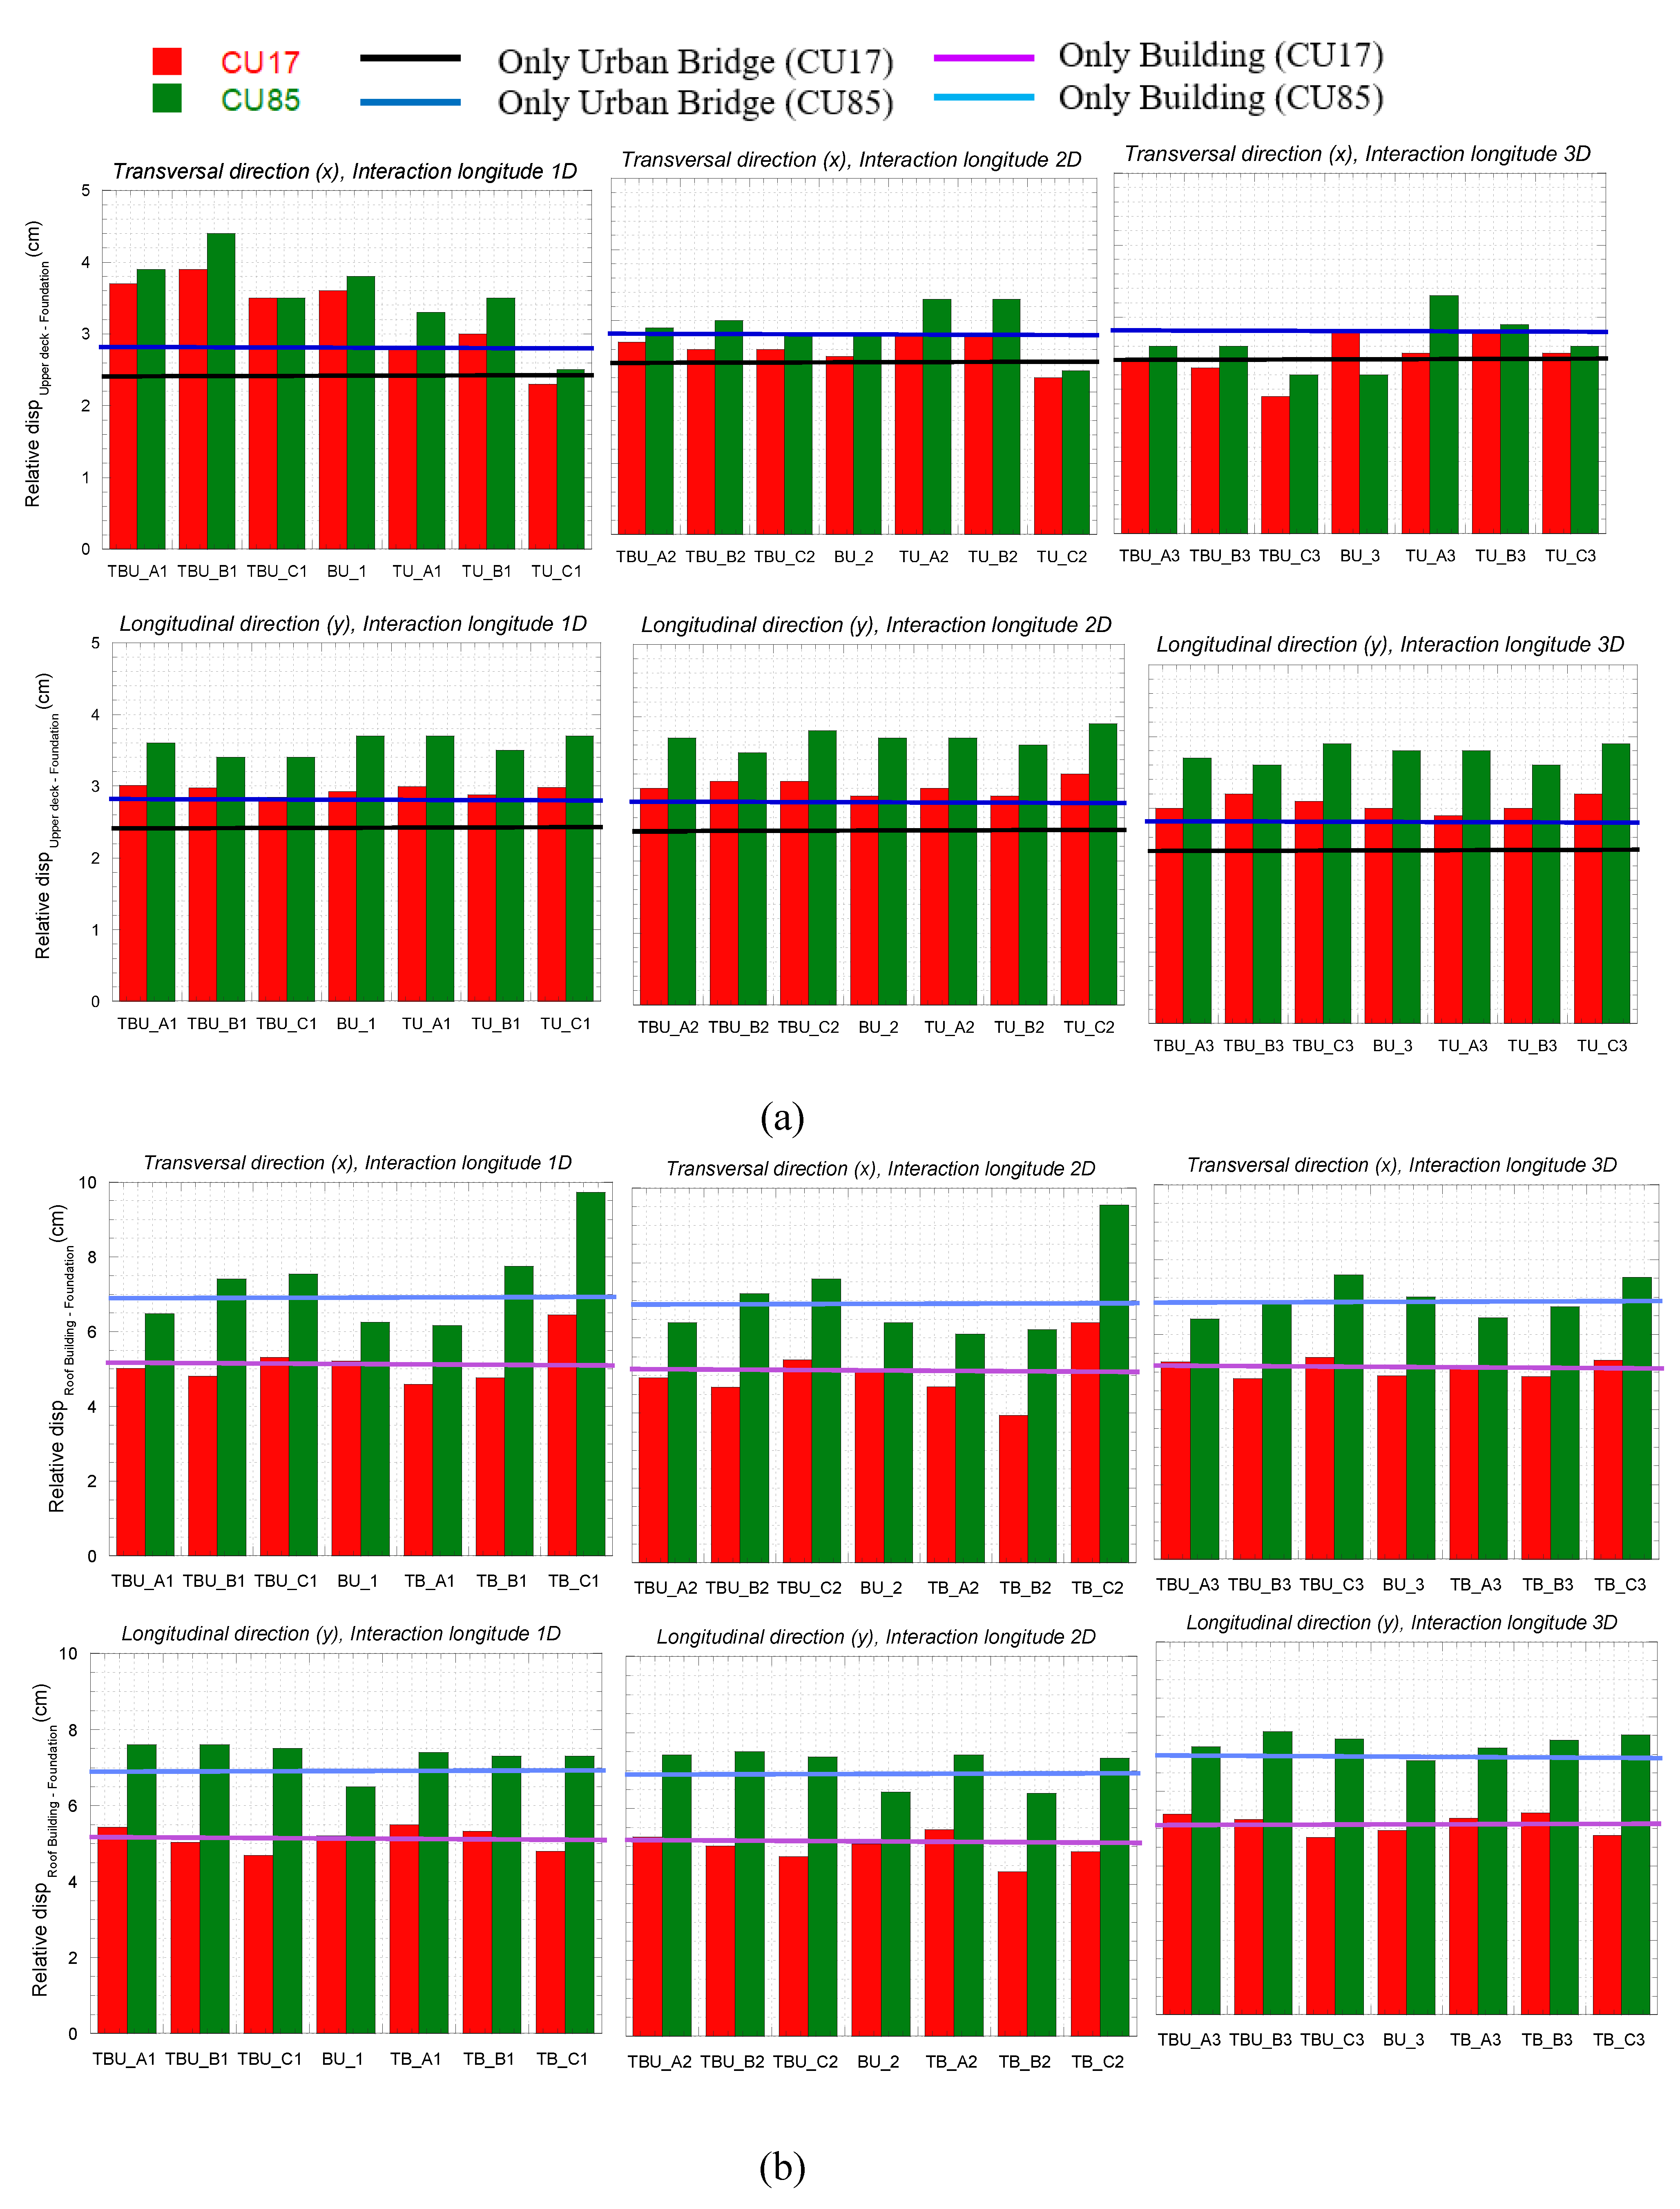
Figure 13). It is clear that as the tunnel moves away it has less impact on the calculated displacements of the bridge and the roof of the building. In order to evaluate the seismic demand of the structures with more detail, the relative displacement between the base and the top of the structures was monitored during the seismic analyses. Detrimental interaction can be clearly observed on the maximum relative displacement of the upper deck and the building roof (
Figure 14), computed as the maximum absolute value of the instantaneous relative displacement between the center of the upper deck bridge and the building roof and the base of its box foundation. In general, it can be seen that the maximum relative displacement is greater in the transverse (x) direction than in the longitudinal (y) direction; and that normal and subduction earthquakes produce a greater variation in the transverse direction. For subduction earthquakes, the maximum relative displacement is observed in the transverse direction when the tunnel is under the bridge. This amplification increases when distance between the bridge and the building is less (i.e., 1D in comparison with 3D). The amplification in relative displacement is higher for the building envelope in the cases TB_C1 and TB_C2, which corresponds to the tunnel beneath the building. In addition, the differences between the relative displacements with normal and subduction earthquakes is more evident in the building, resulting with greater values for CU85 which can be associated with its frequency content which is closer to that of the structure.
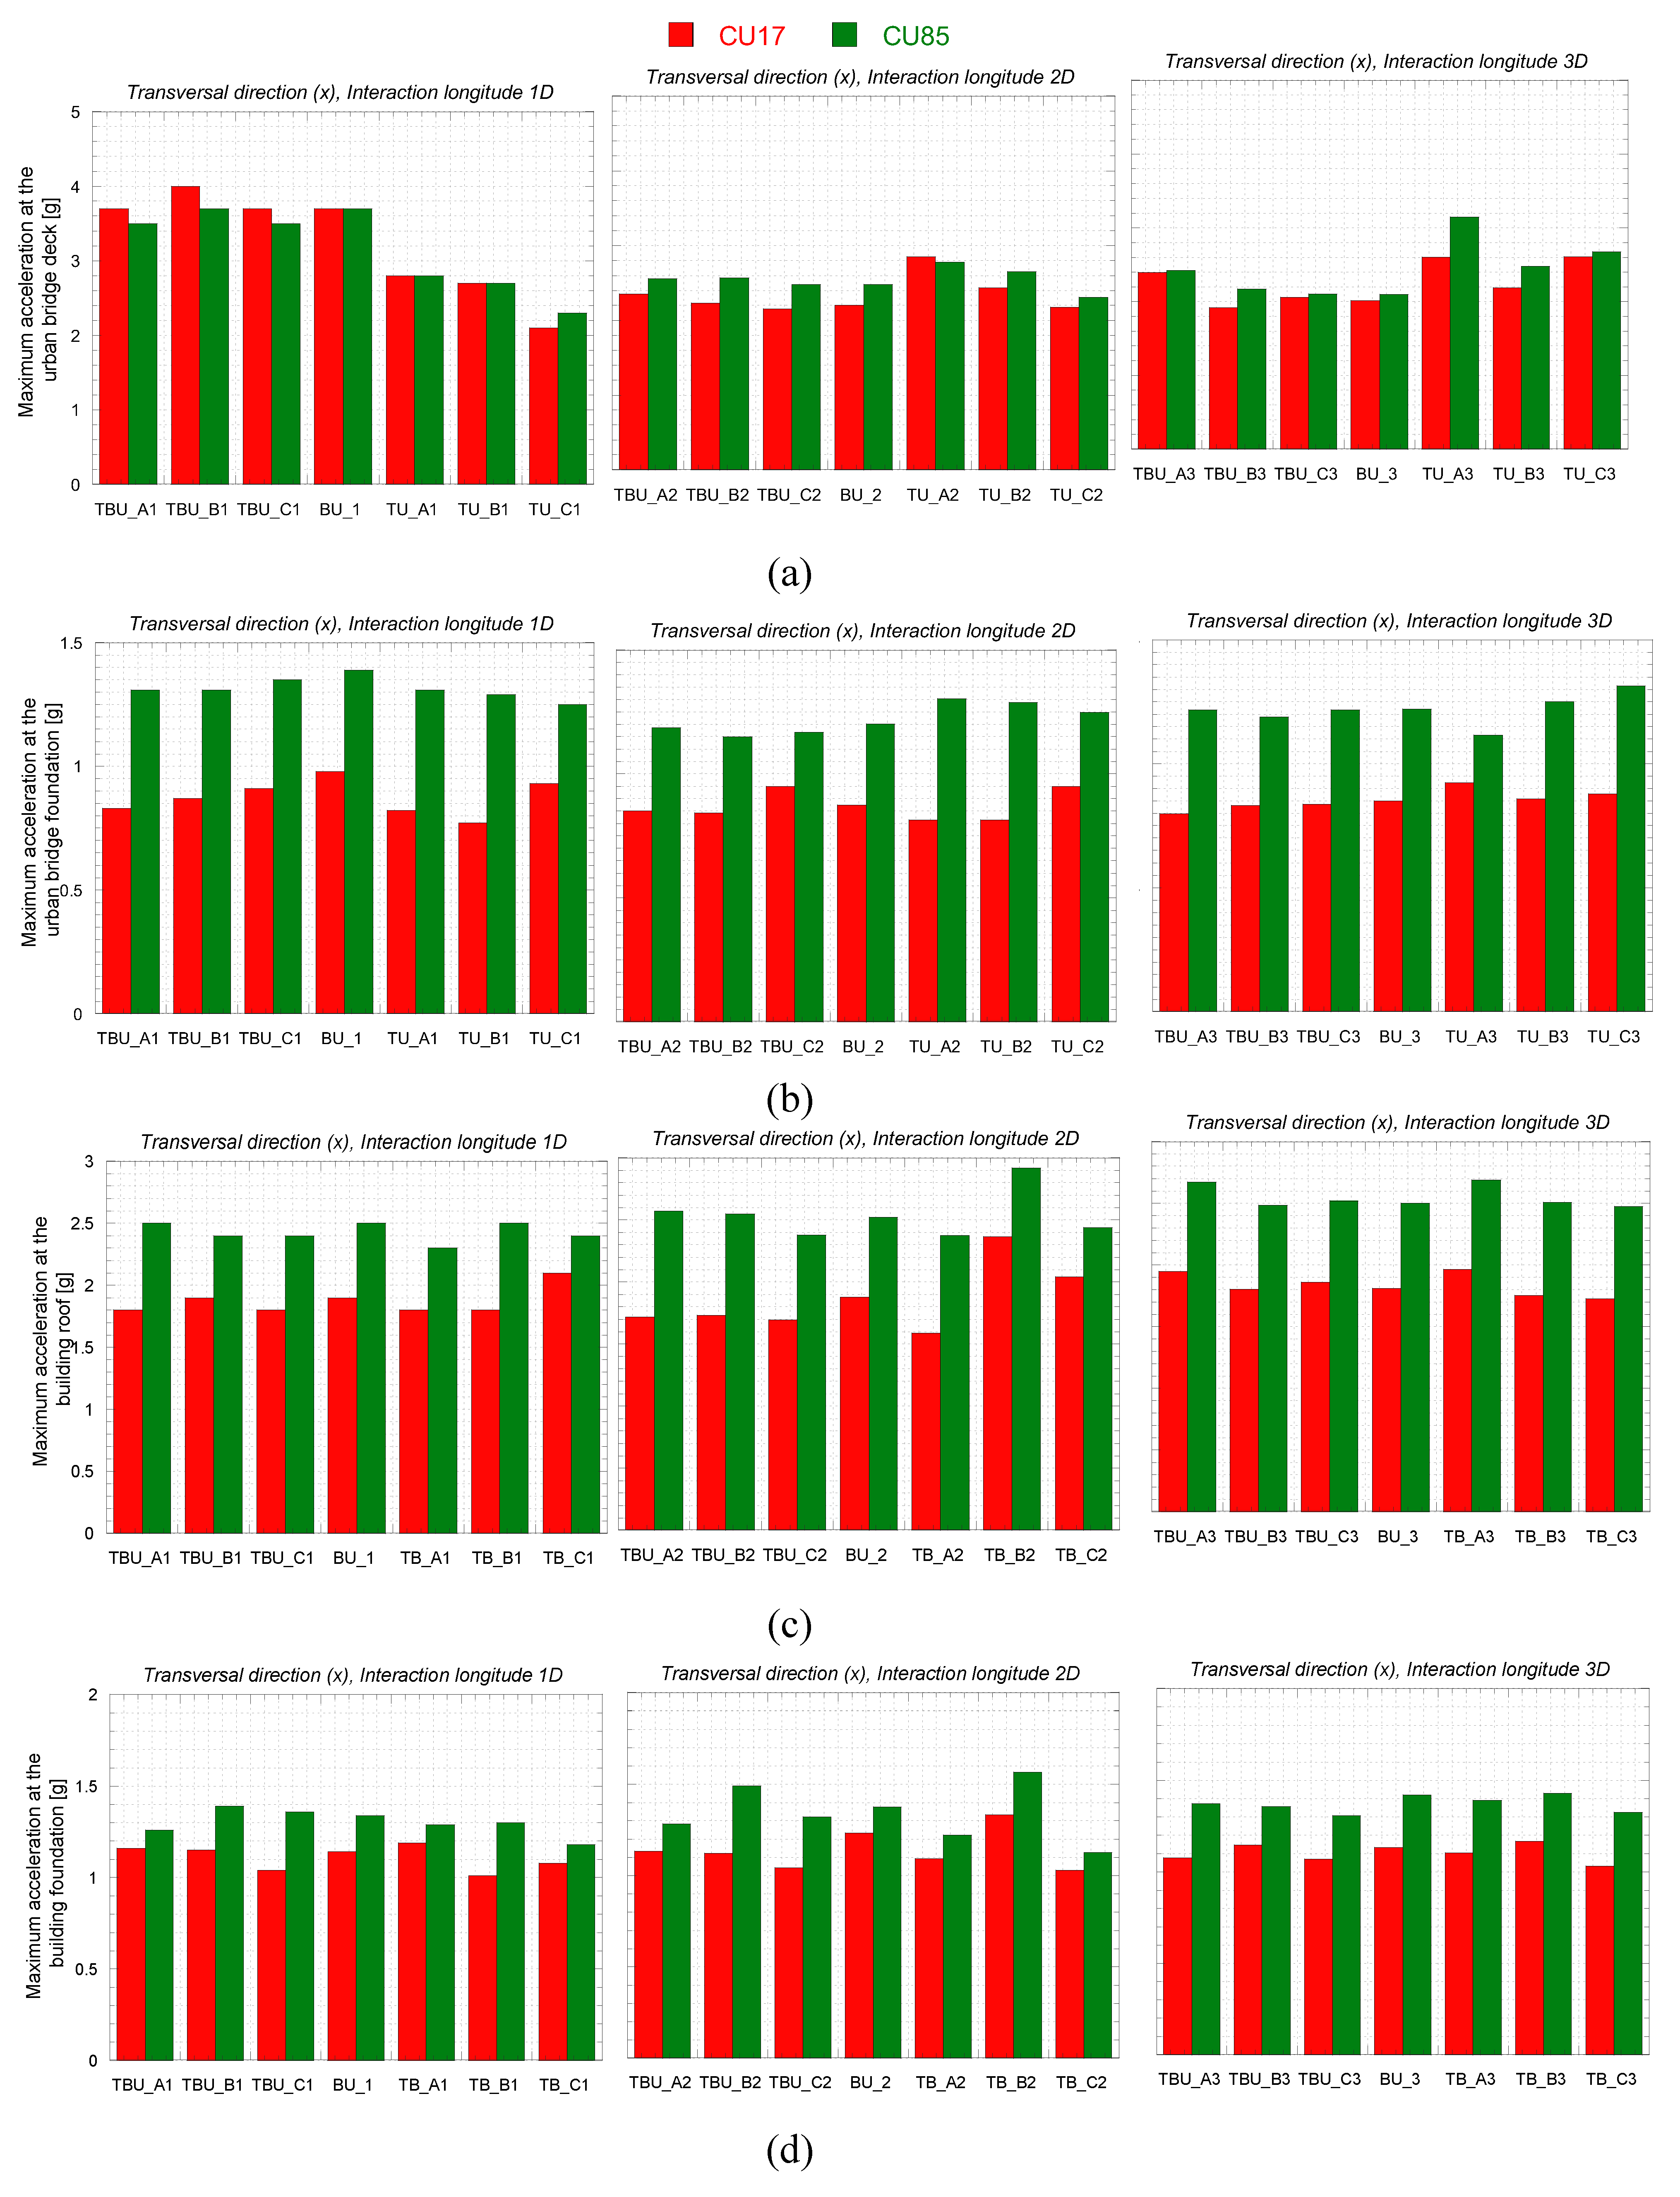
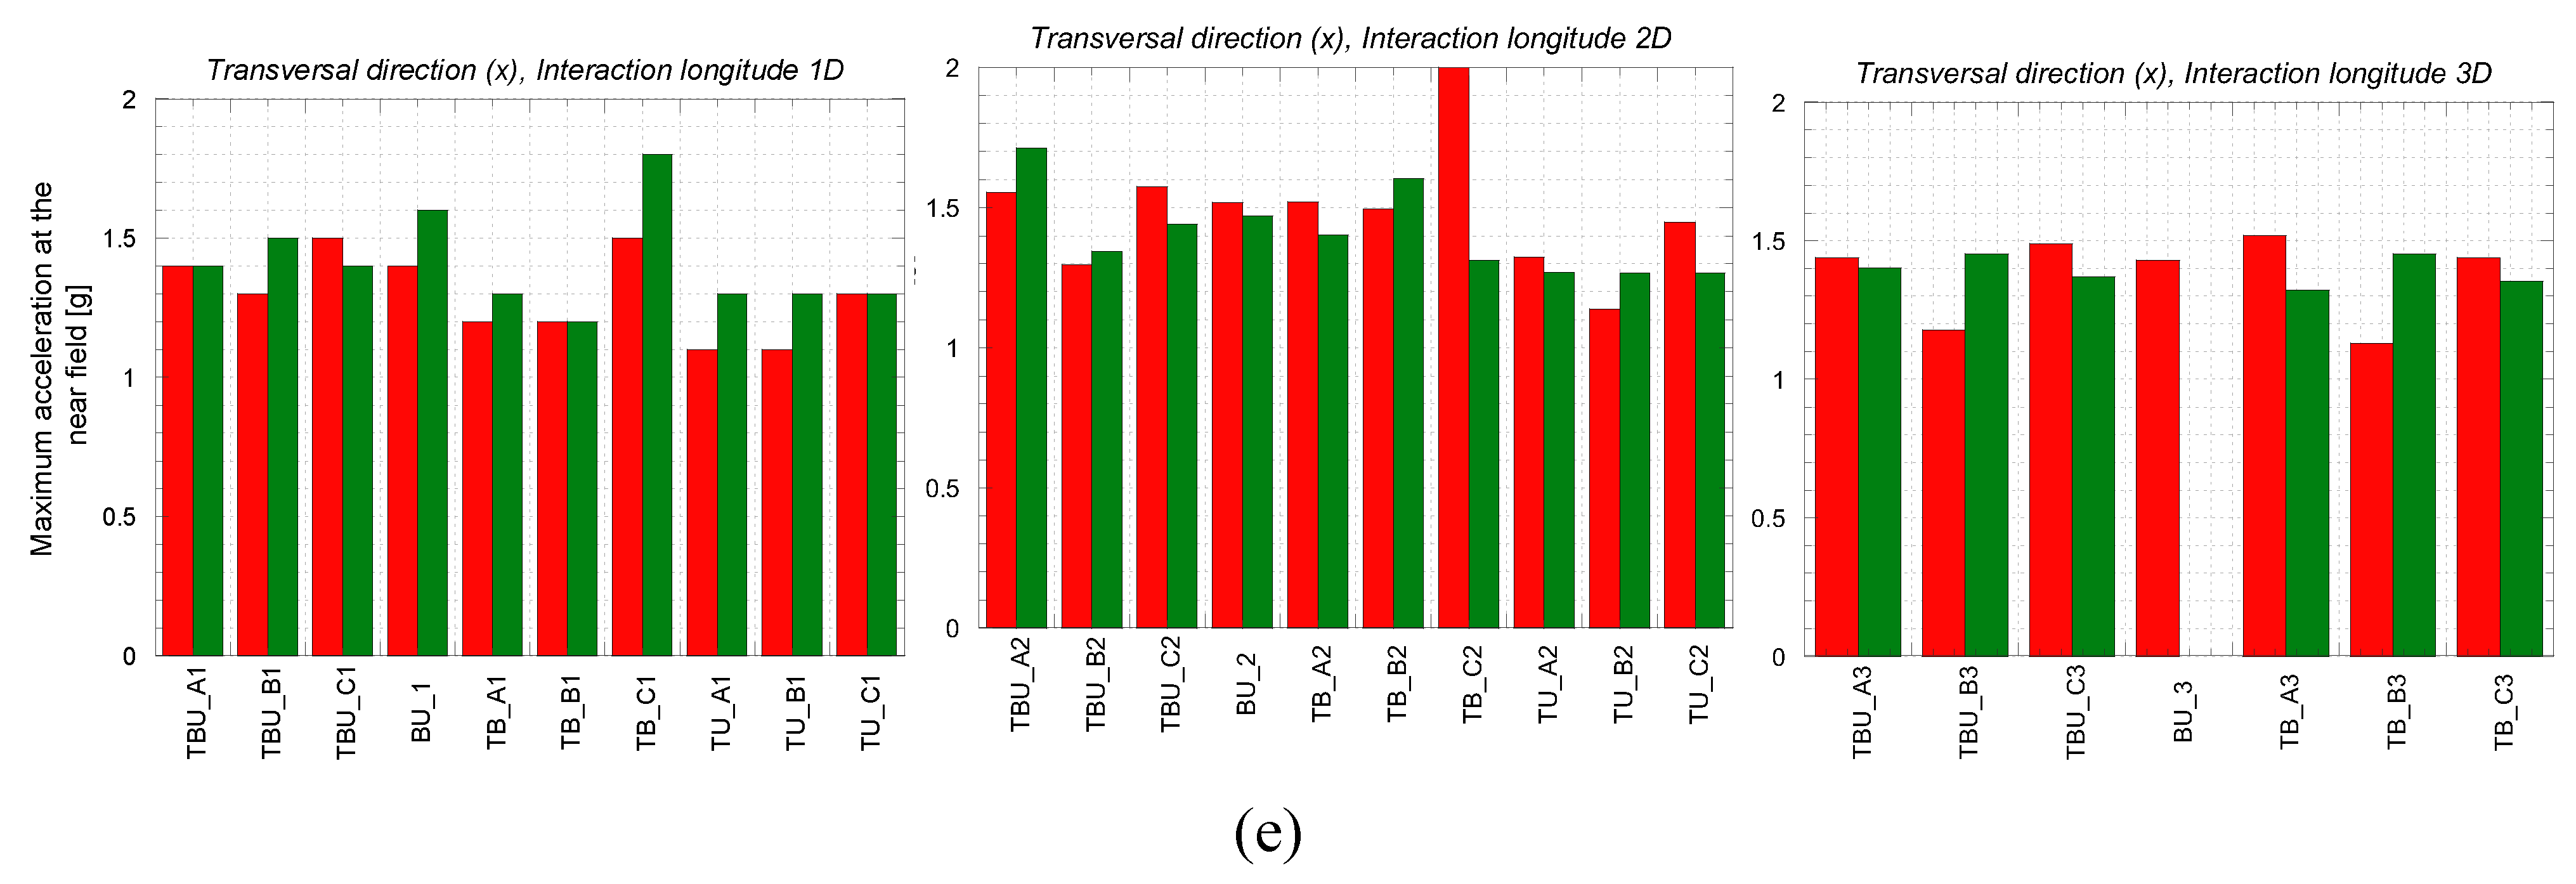
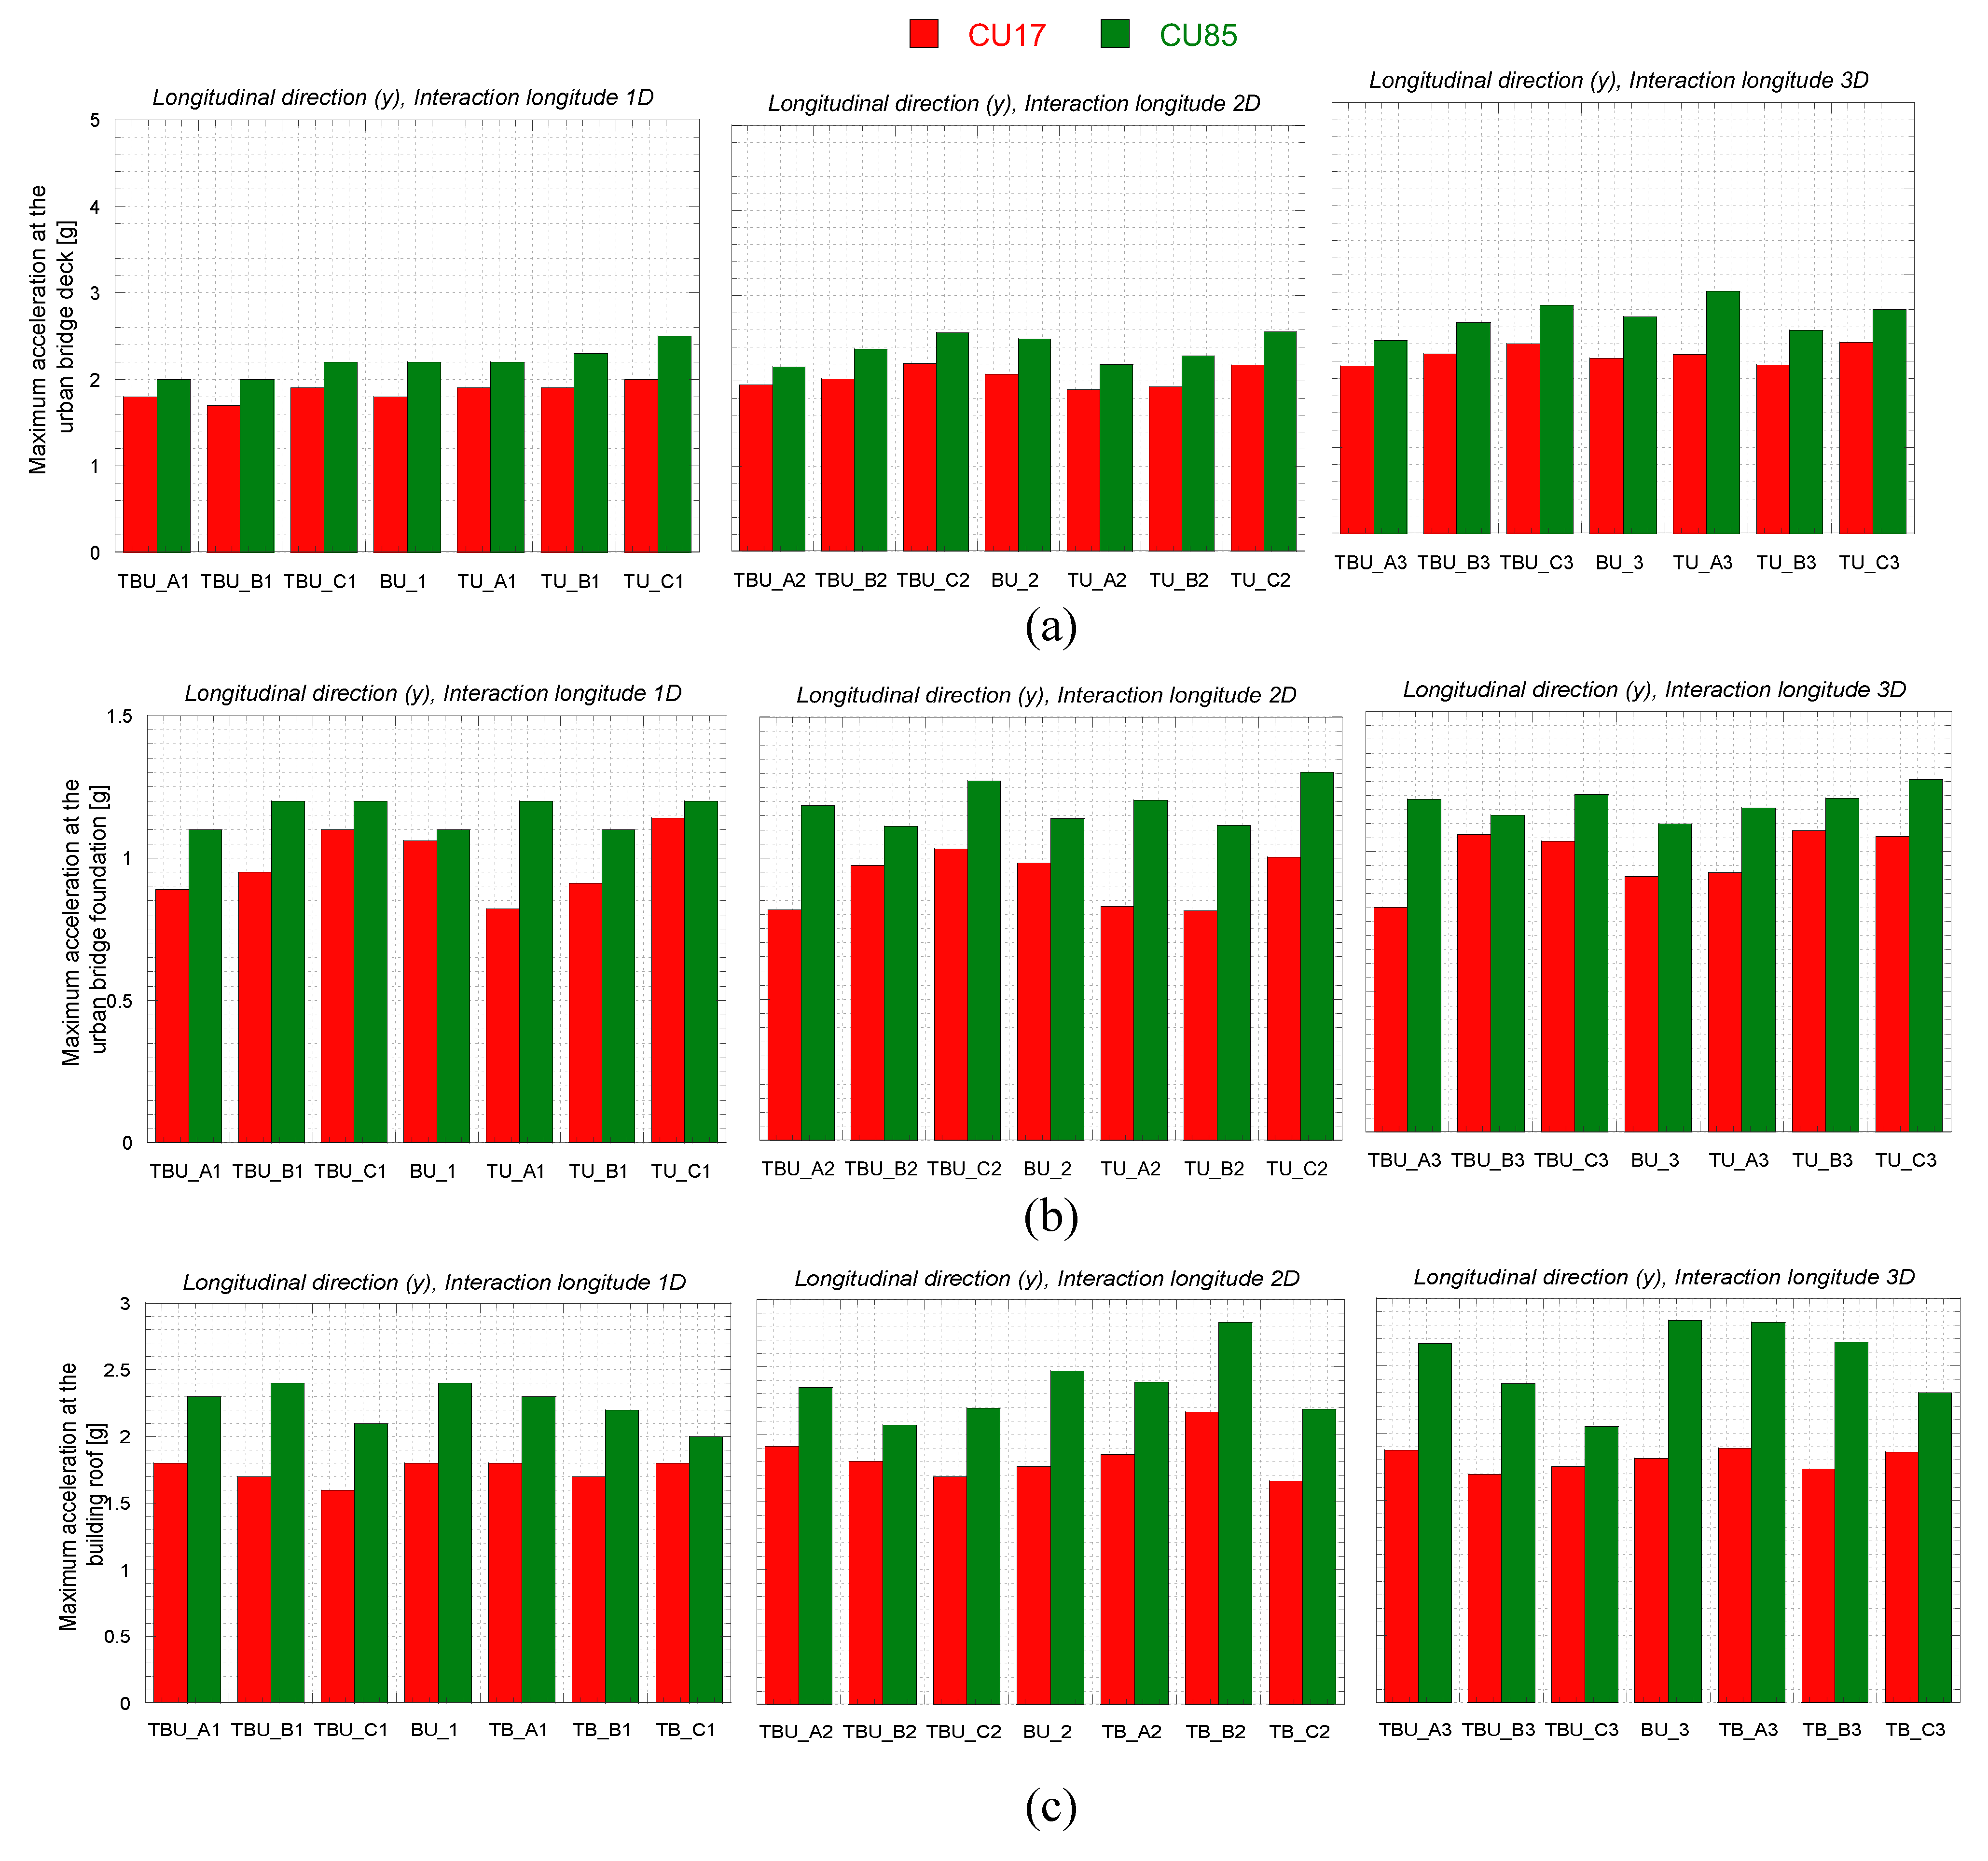
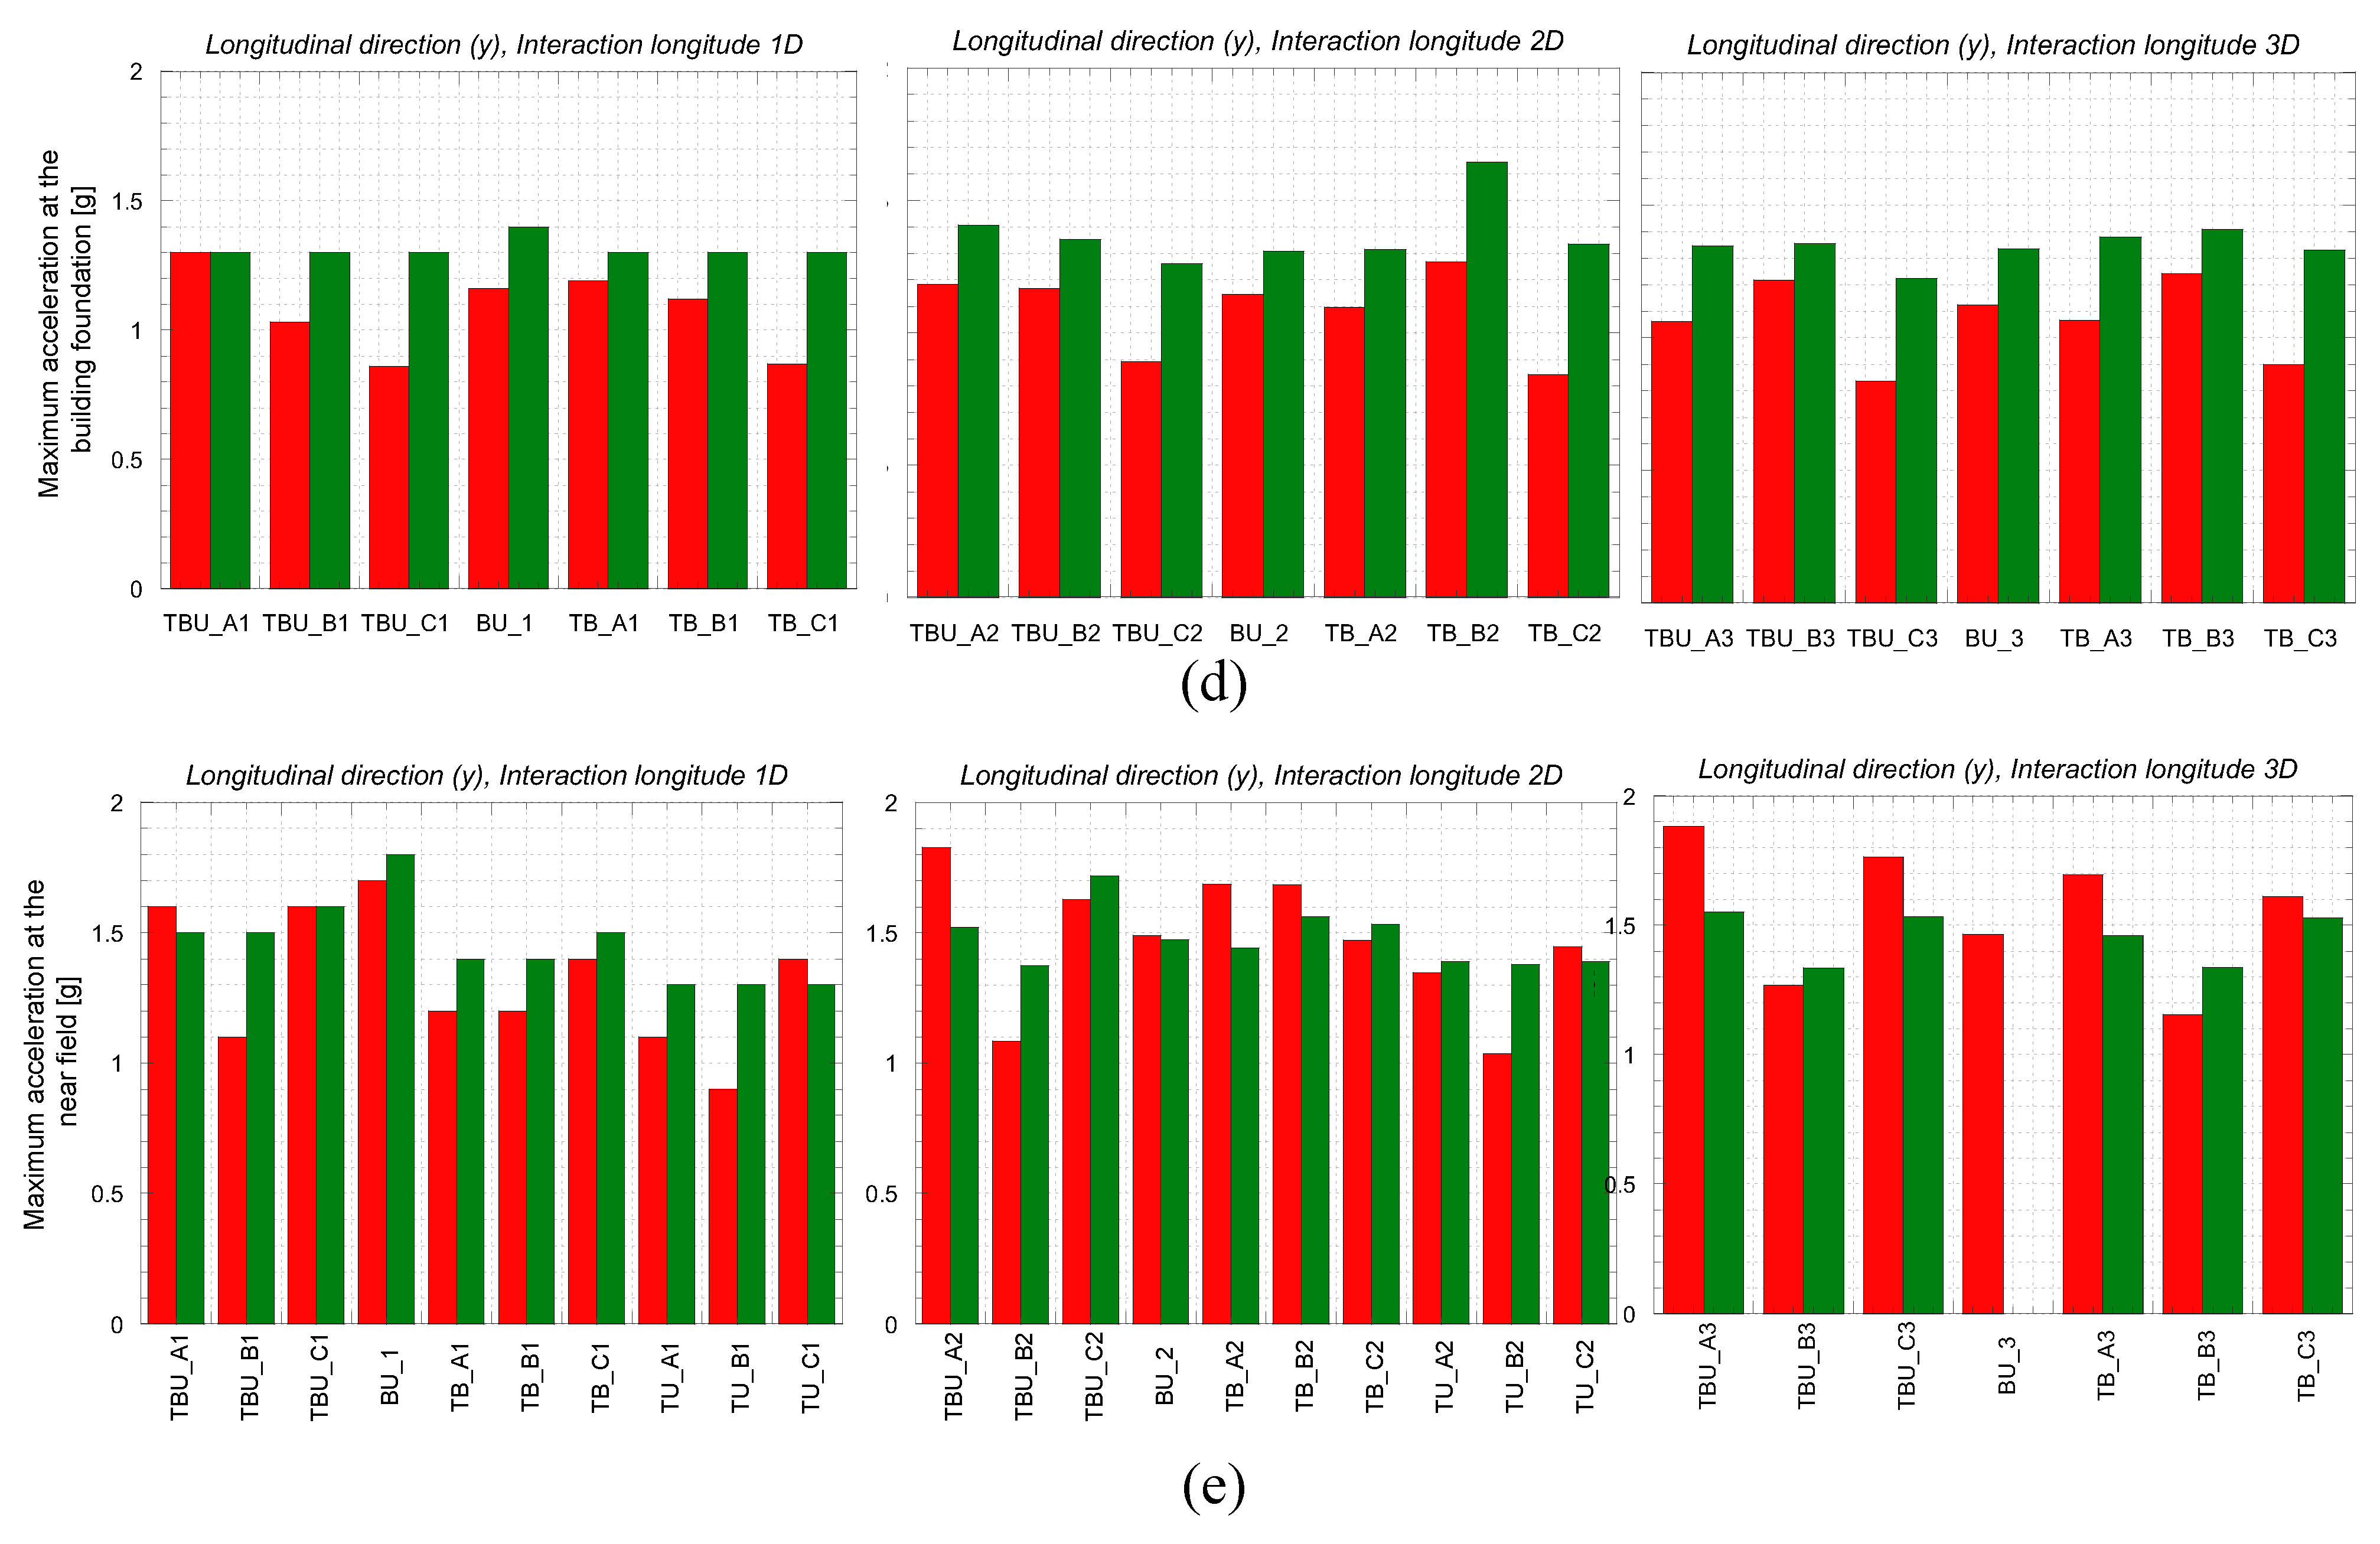
Figure 15 and
Figure 16 present the calculated peak acceleration at the urban bridge deck and its foundations, the building roof and its foundations, and the near field. The detrimental interaction observed at the building associated with the tunnel (when the tunnel is located below the structure and at 2D) causes an increase in the maximum calculated acceleration at the building roof (
Figure 15b). The decrease is minor as the tunnel gets away from the bridge. This agrees with the maximum acceleration computed at the bridge and building foundation, where the maximum acceleration decreases when the tunnel is underneath the bridge and building respectively. Interestingly, for the acceleration computed at the near field, the presence of the tunnel induces a slight amplification when the tunnel is underneath the bridge and the building, for 2D.
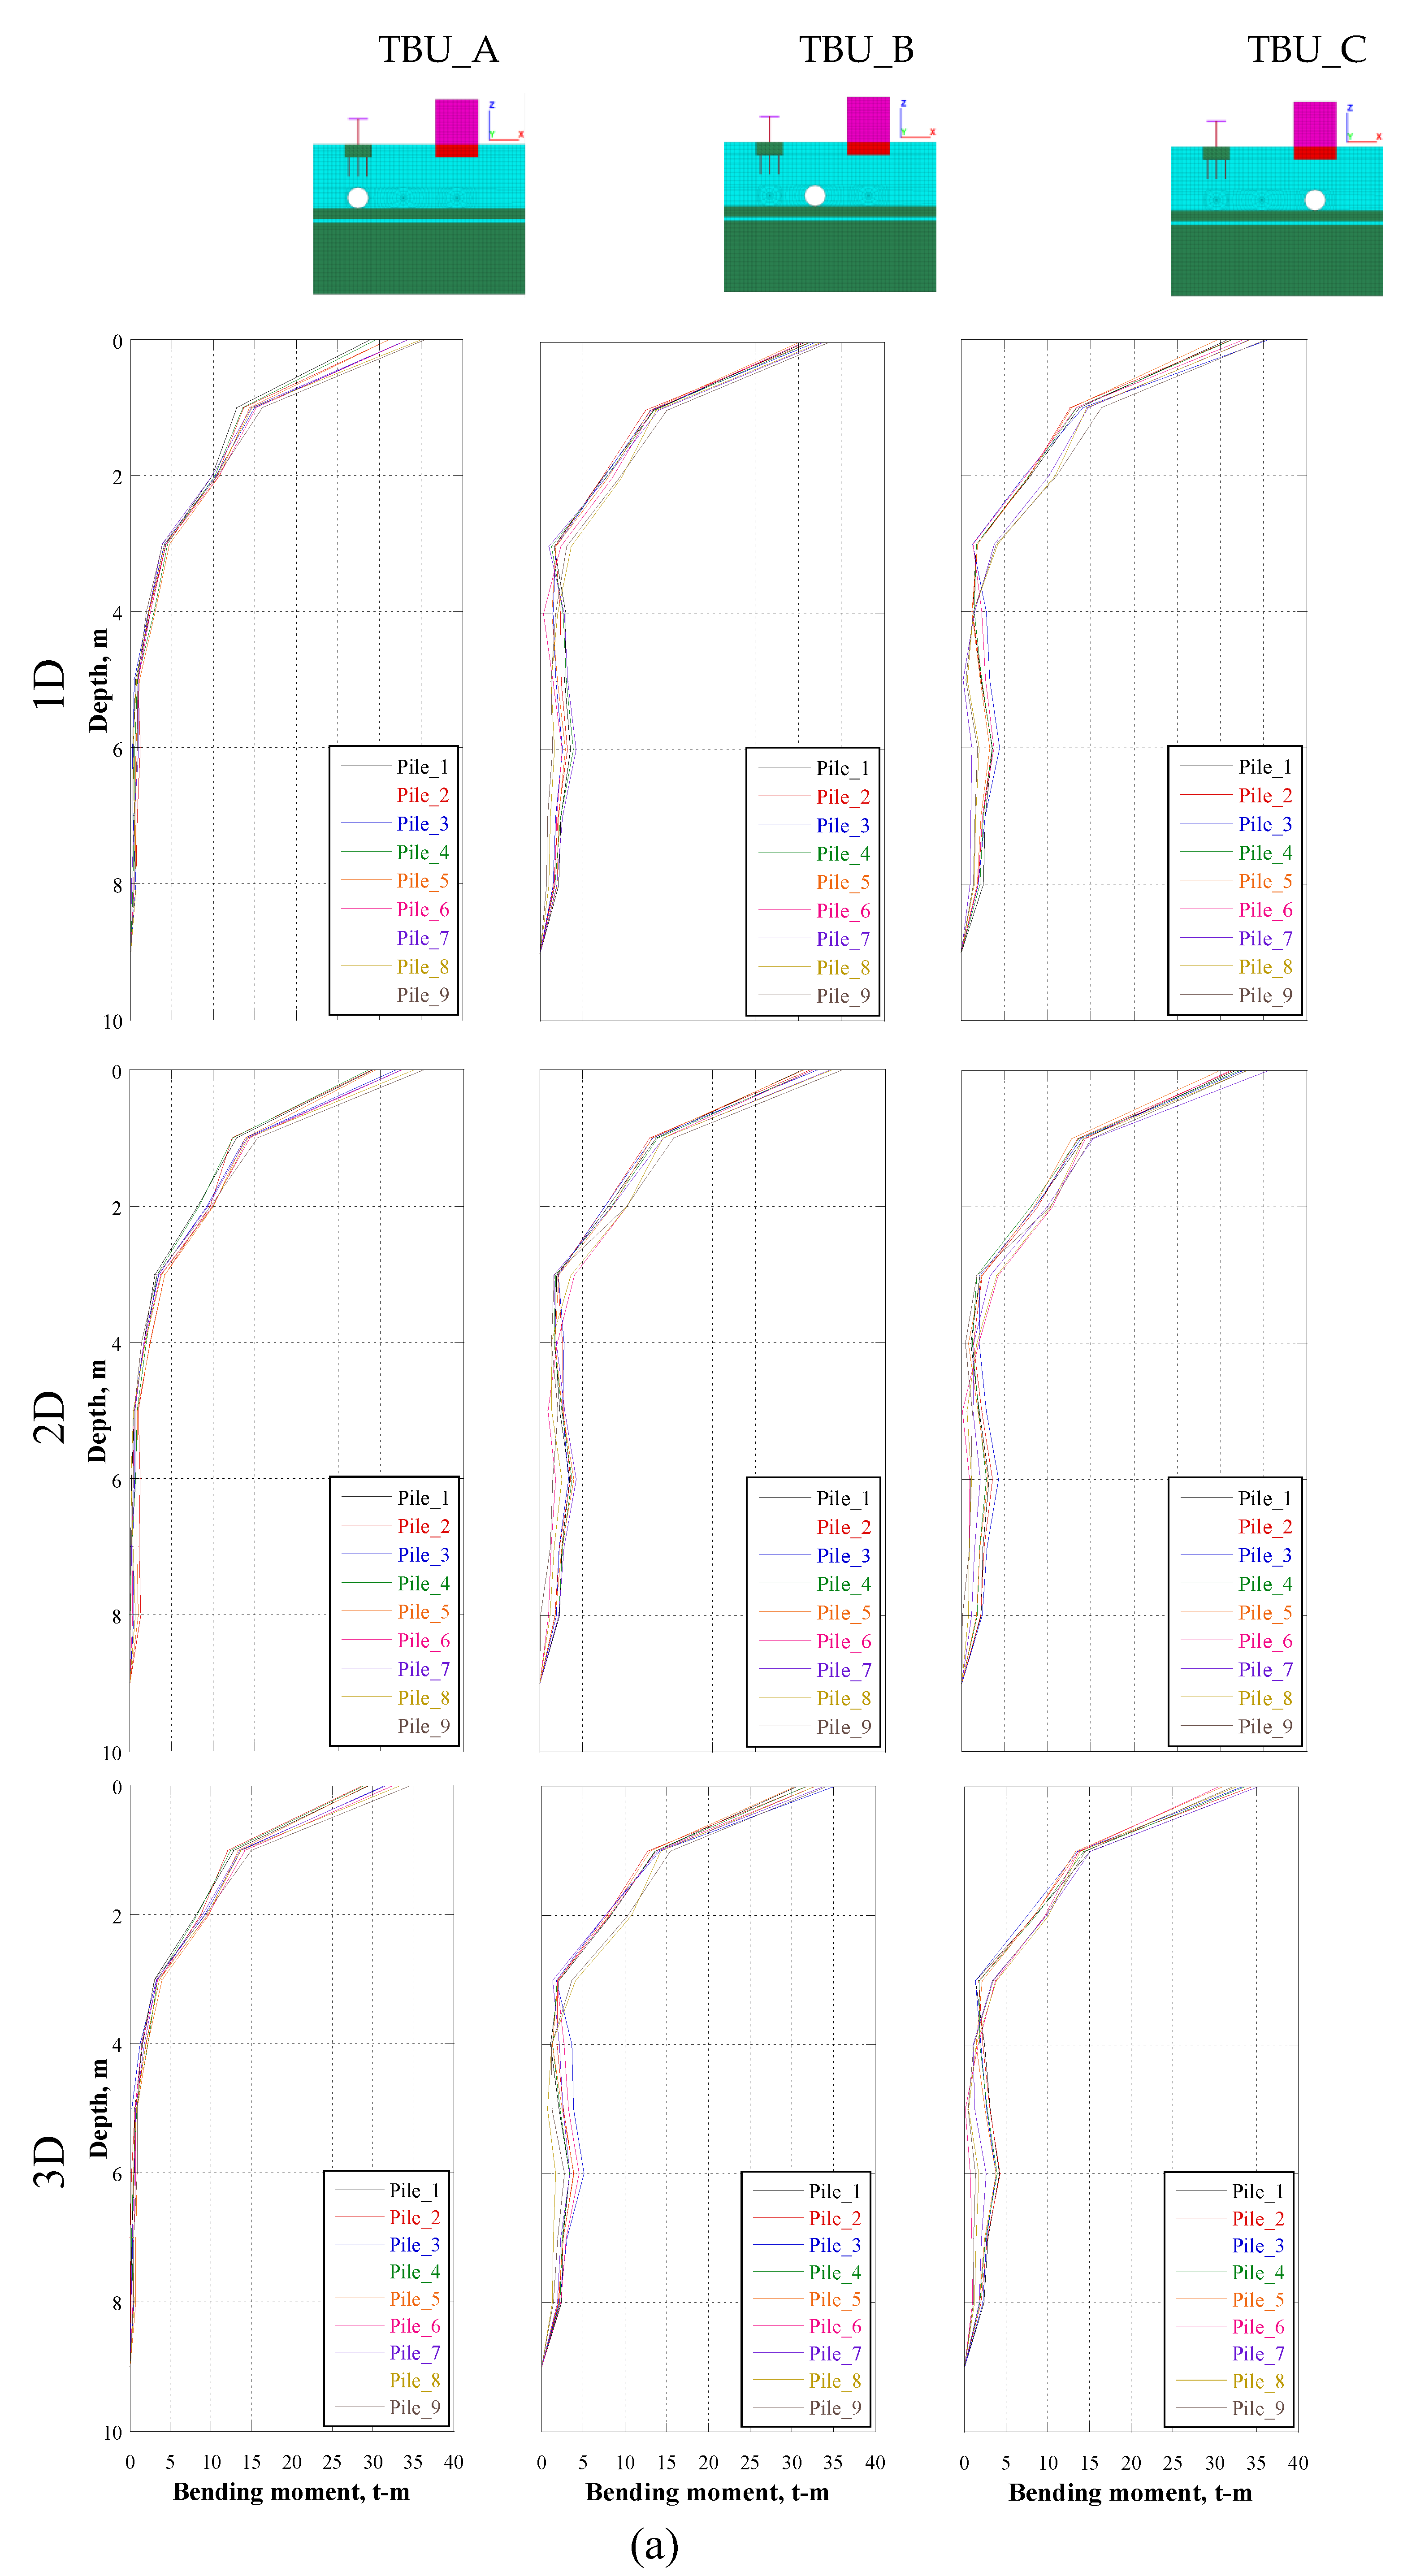
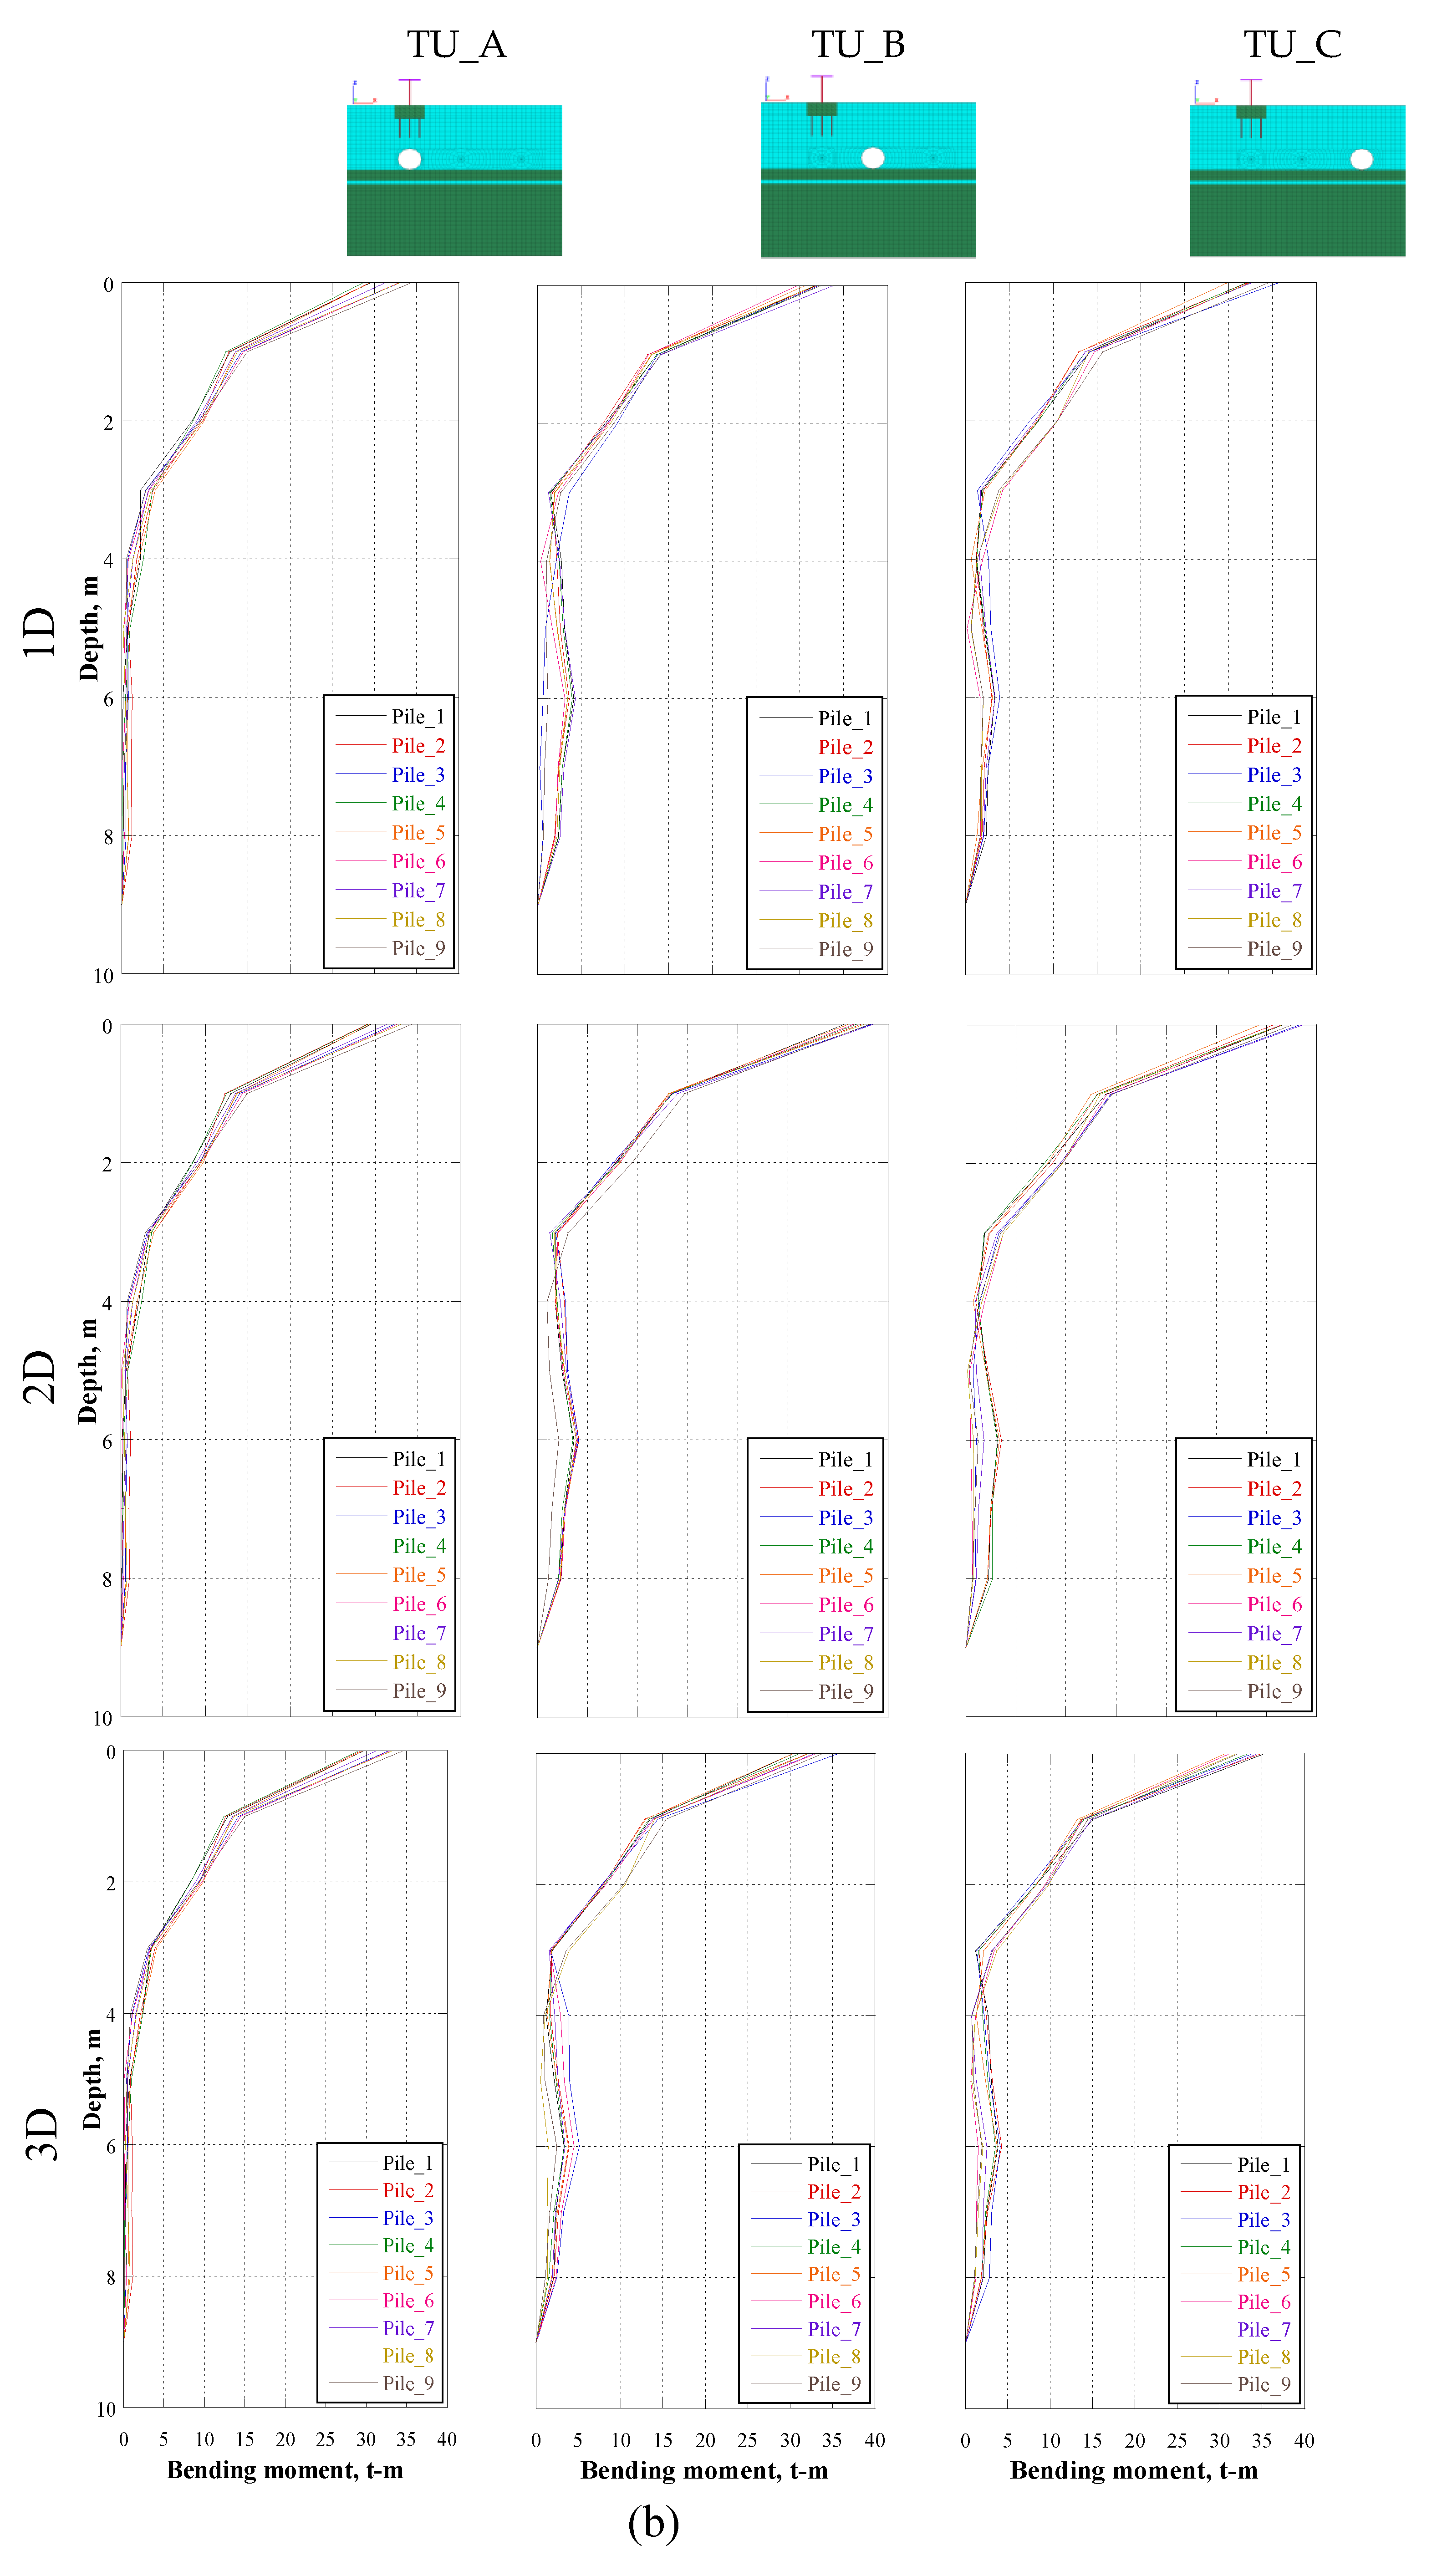
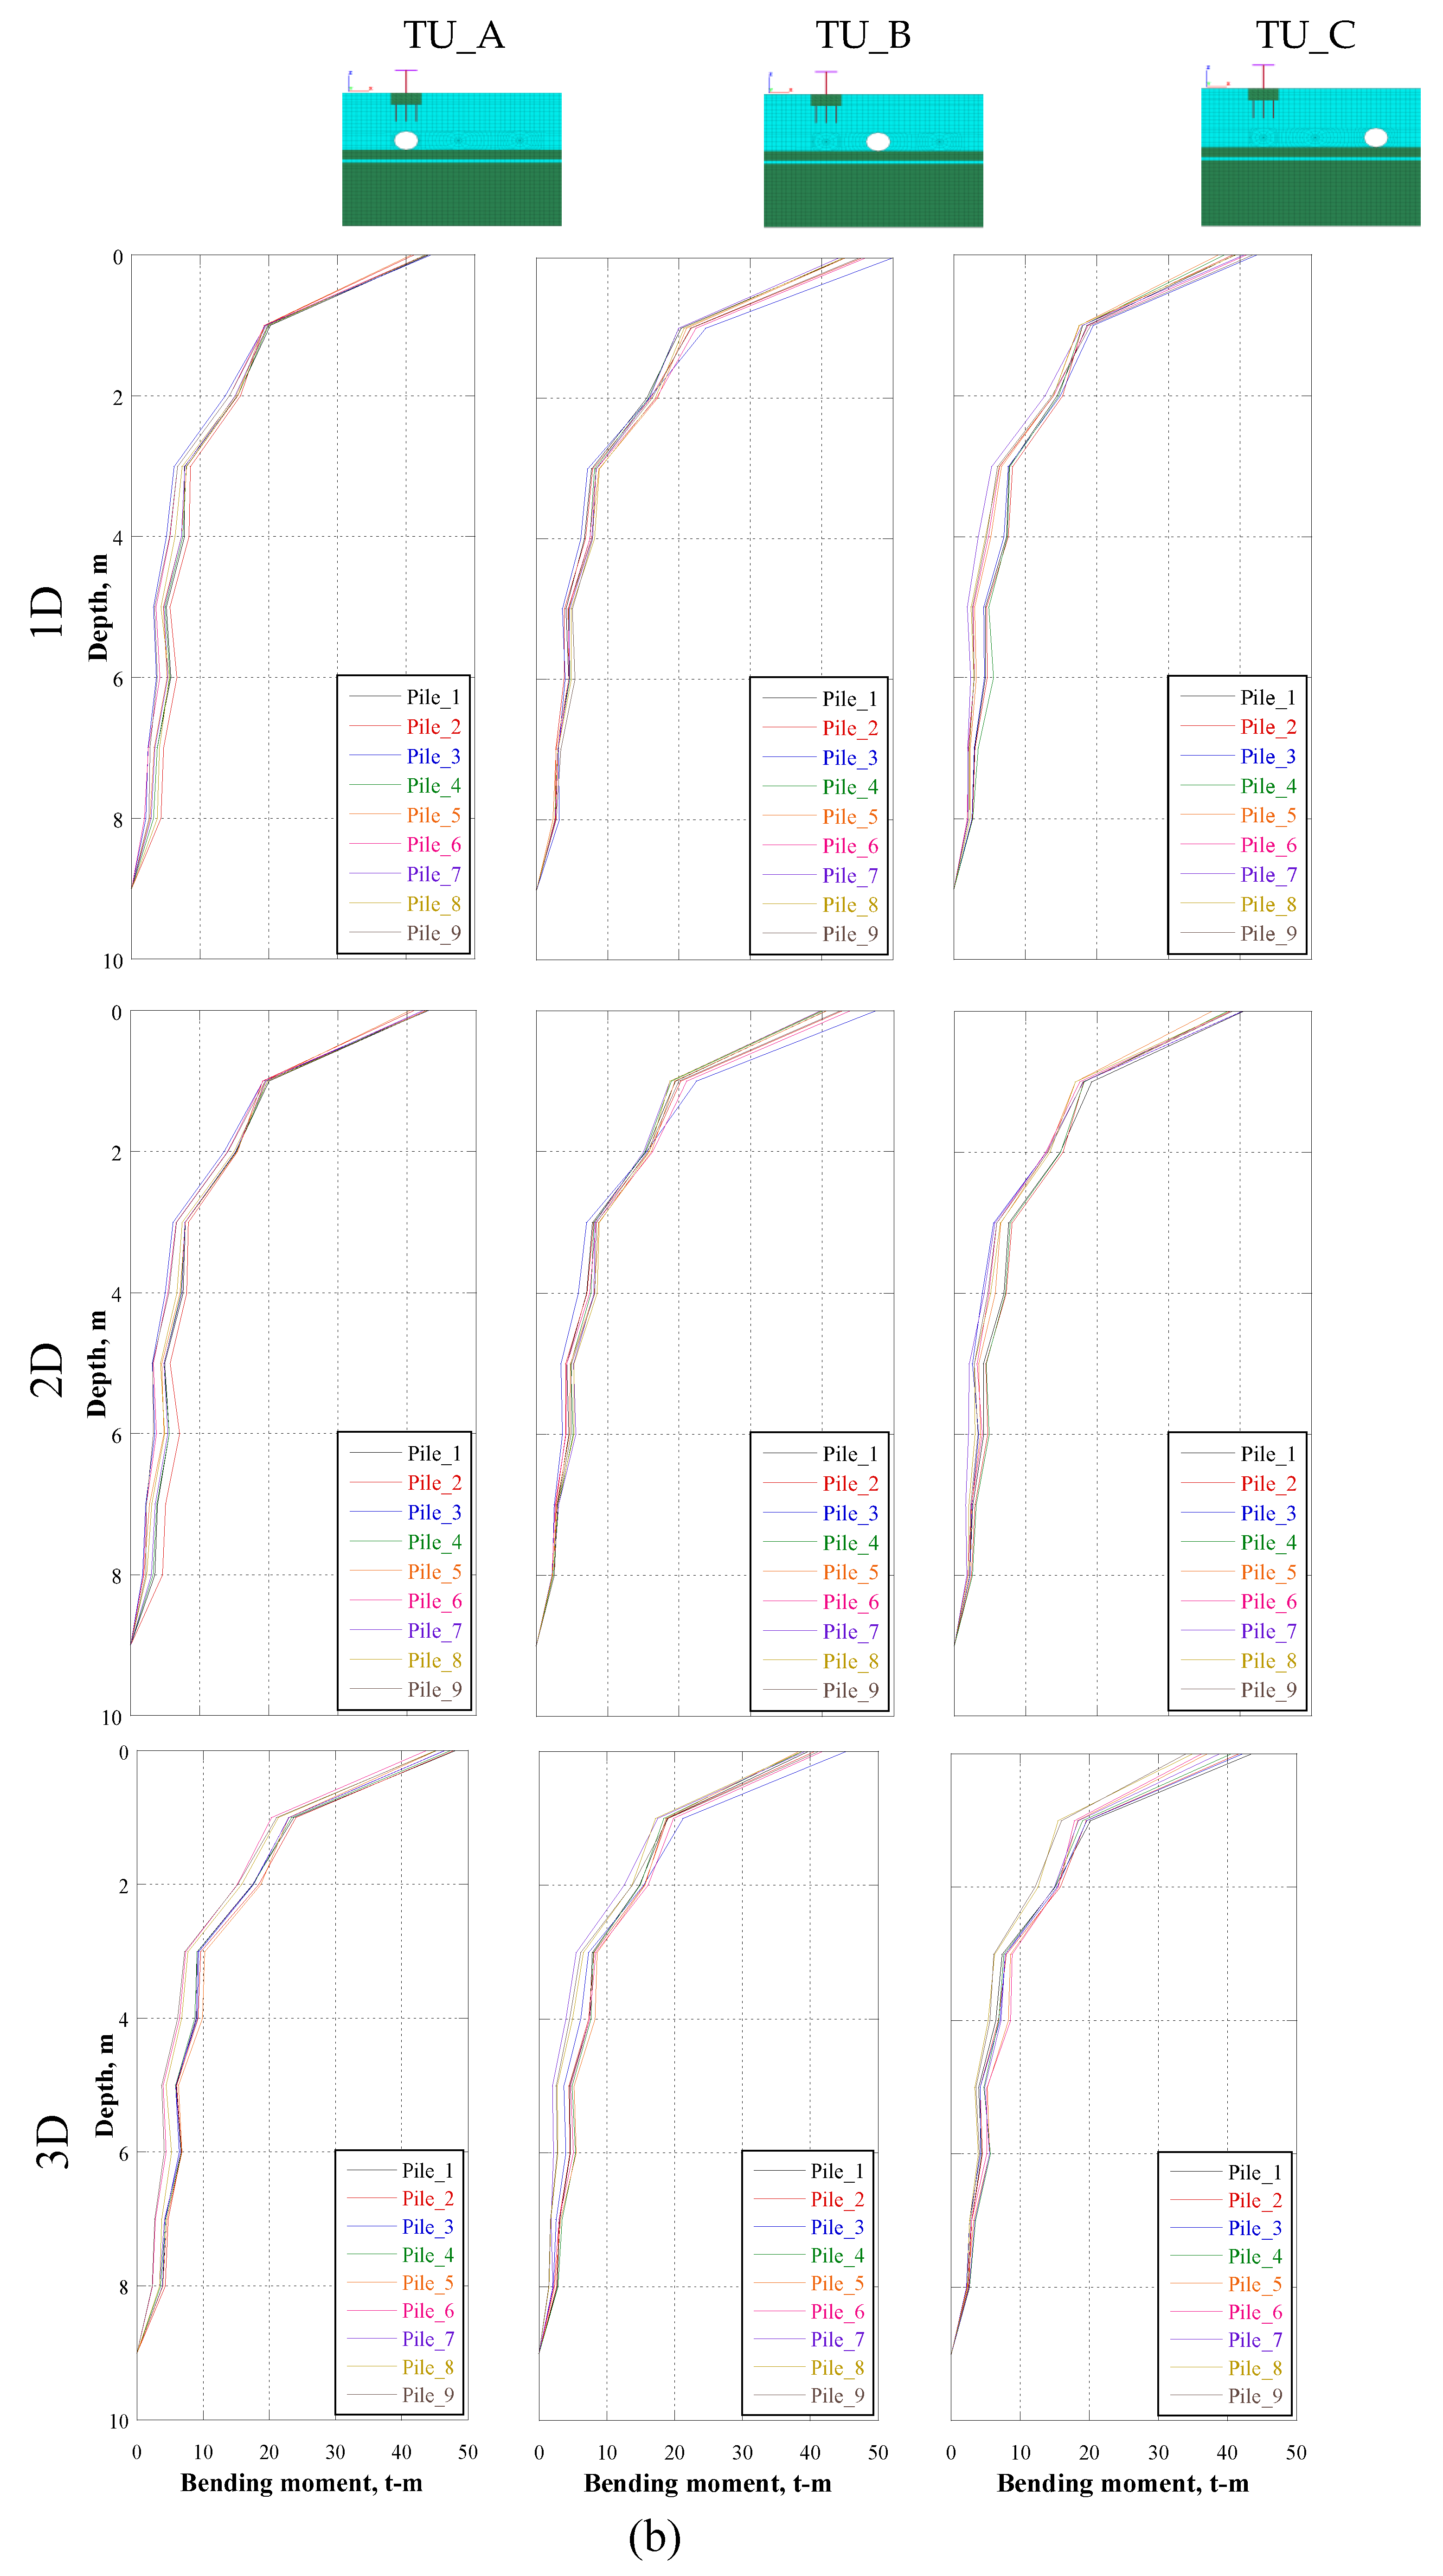
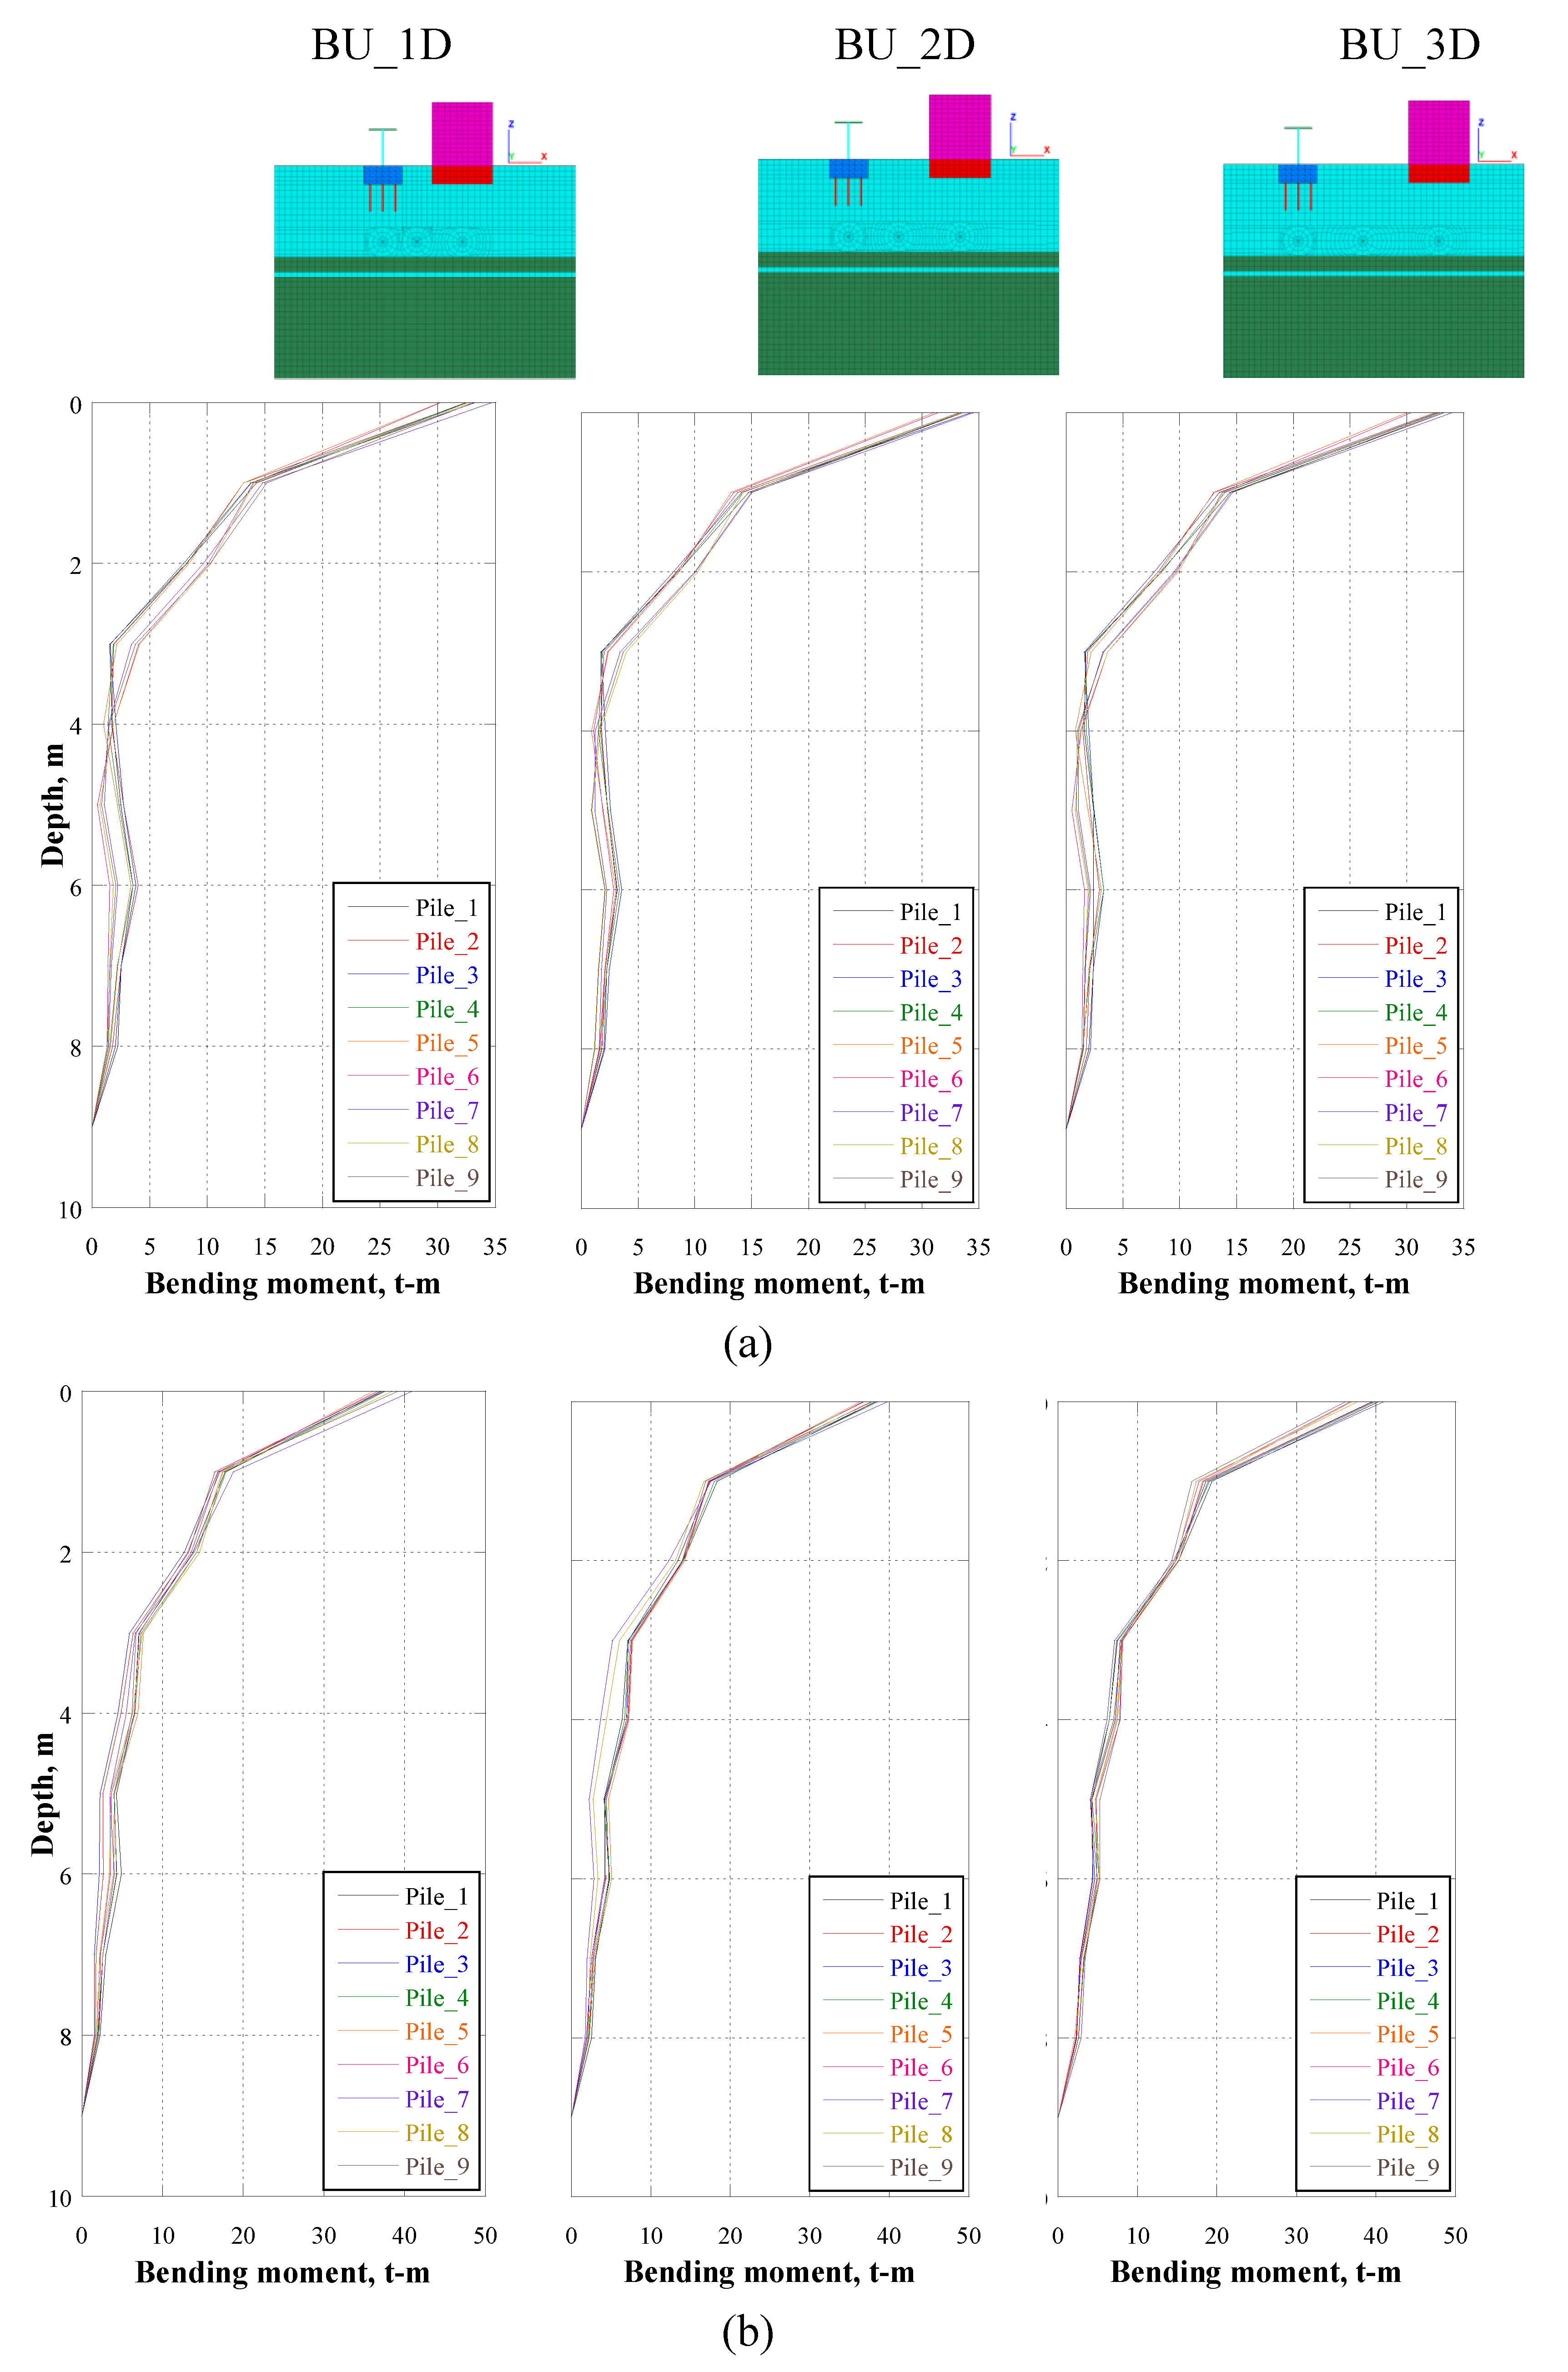
In addition to the detrimental effects on the bridge and the building due to the presence of the tunnel, the bending moment and shear force acting on the piles also increases due to the presence of the tunnel.
Figure 18,
Figure 19 and
Figure 20 depicts the maximum shear force and bending moment in the cross-section of each bridge pile at the instant of maximum horizontal displacement of the foundation for CU17 and CU85 earthquake for cases TBU_A, TBU_B, TBU_C, TU_A, TU_B, TU_C, BU_1, BU_2, BU_3, for 1D, 2D AND 3D diameters. It is clear that the presence of the tunnel (cases TU_A2, TU_B2 and TU_C2) leads to an increase of the bending moment, compared to the case without the presence of the tunnel (i.e., cases D1, D2, D3), for normal and subduction earthquakes. It is evident that the bending moment is larger when the tunnel is between the bridge and the building at a distance of 2D.
Figure 17.
Plan view of pile distribution.
Figure 17.
Plan view of pile distribution.
Figure 18.
Bending moment at the instant of maximum horizontal displacement of the foundation for CU17 earthquake for a) TBU and b) TU.
Figure 18.
Bending moment at the instant of maximum horizontal displacement of the foundation for CU17 earthquake for a) TBU and b) TU.
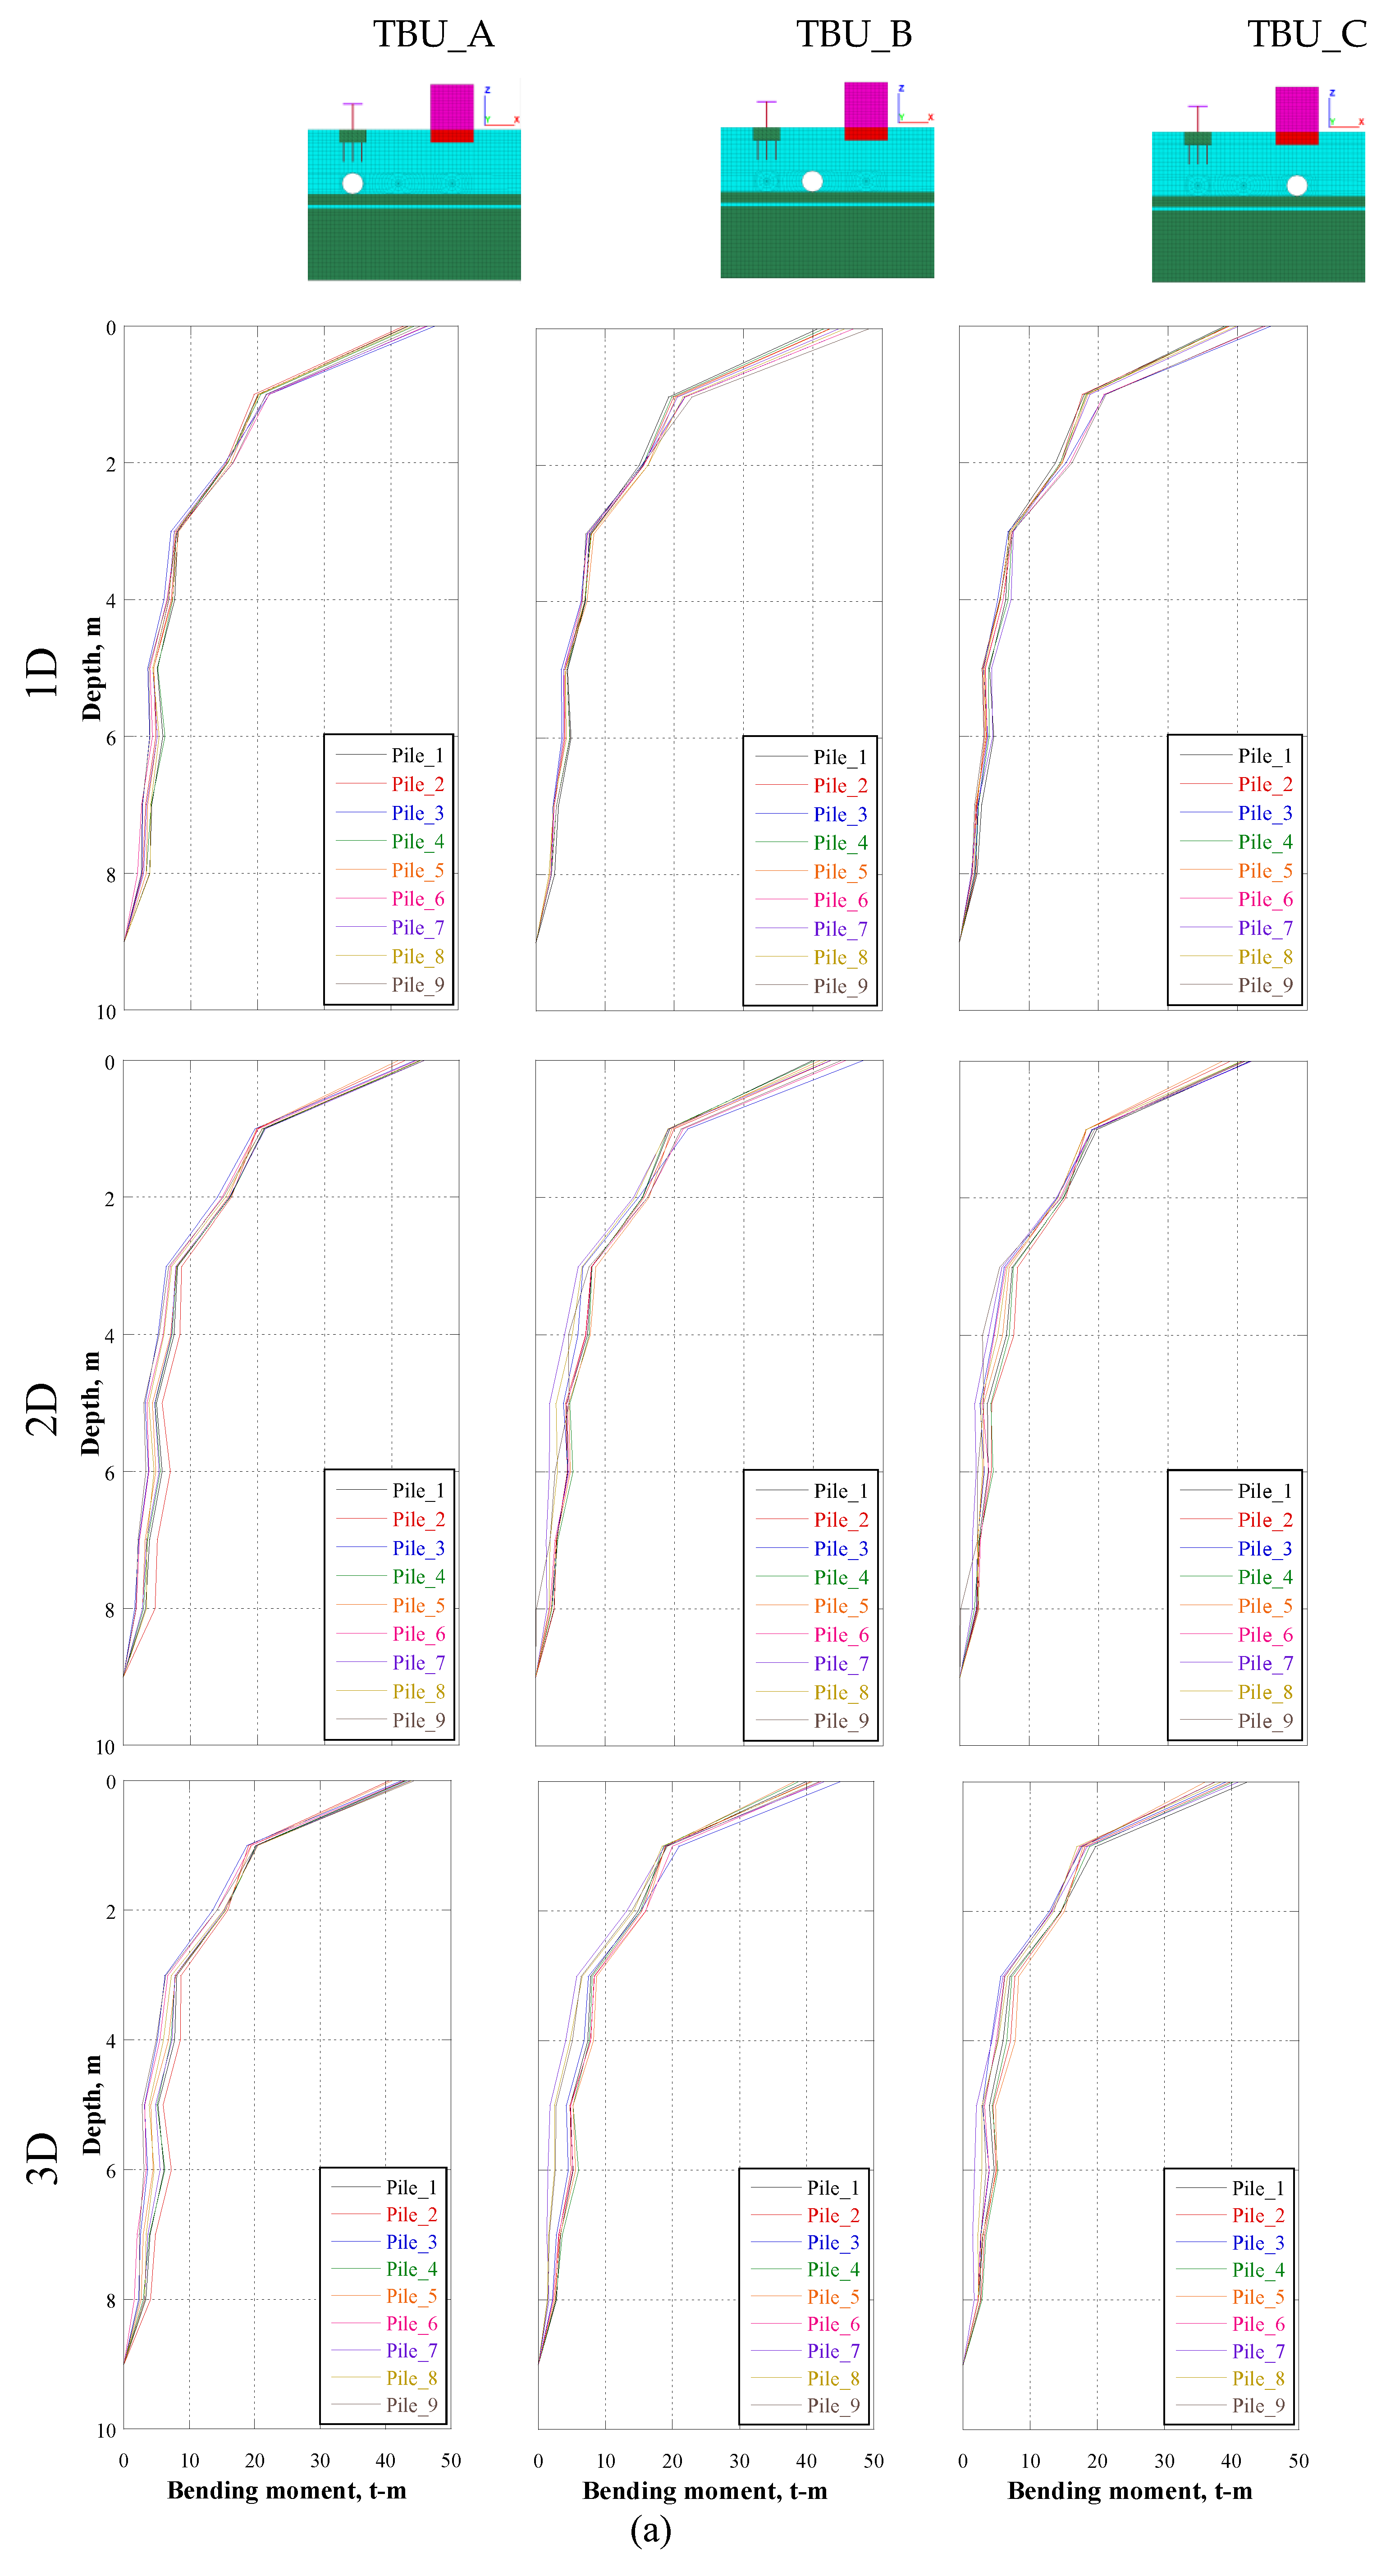
Figure 19.
Bending moment at the instant of maximum horizontal displacement of the foundation for CU85 earthquake for a) TBU and b) TU.
Figure 19.
Bending moment at the instant of maximum horizontal displacement of the foundation for CU85 earthquake for a) TBU and b) TU.
Figure 20.
Bending moment at the instant of maximum horizontal displacement of the foundation for (a) CU17 and (b) CU85 earthquakes.
Figure 20.
Bending moment at the instant of maximum horizontal displacement of the foundation for (a) CU17 and (b) CU85 earthquakes.
6. Conclusions
This study addressed the seismic interaction effects of on-ground and underground structures in soft soil conditions, considering as a case study a bridge-building-tunnel system found in Mexico City. Series of three-dimensional finite difference models were developed to explore the proximity effect among the structures in their seismic demand. Two input motions were considered in the parametric analyses, with differences in their frequency content, seismic intensity, and duration.
The main findings revealed that seismic interaction among the structures in soft-soil conditions is highly frequency-dependent, due to remarkable differences were observed between the seismic response generated by two input motions. For all the studied scenarios, interaction effects were strongest at high frequencies (> 1 Hz), with wave scattering and dispersion as the main contributors on the interaction mechanism, particularly when the tunnel was located beneath the bridge or the building. Focusing on the bridge performance, it could be observed that the tunnel induces an amplification potential when is located beneath up to 20%, nevertheless such effect is exceeded by the presence of the building that generated an increase in the column drift up to 60% when is located at 1D of distance. The seismic demand of the pile foundation was also influenced by the tunnel’s proximity, with an increase in the internal forces as the tunnel gets closer.
Regarding the seismic performance of the building, the presence of the tunnel influence widely the seismic demand, with an increase up to 10% in relative displacements and greater accelerations observed at the roof level. Such effects were most notable when the tunnel is beneath the building, and for the inter slab earthquake with a frequency content closer to the fundamental period of the structure, Tf = 1.0 s (1.0 Hz), and the characteristic elastic site period of the soil (0.5 Hz). On the other hand, minor interaction effect was observed by the presence of the bridge, due to modification in the seismic demand was less than 6% in comparison to the seismic response of the building isolated. This was associated with the difference in mass of both structures, with the building having five times the mass of bridge.
The findings of the study emphasize the need of taking into account relative distances between structures as well as the frequency content of seismic motion as key variables in designing and retrofitting of earthquake resistant structures. Regarding mitigation strategies for detrimental interaction, frequency-dependent barriers could be implemented in order to take the vibration of structure out of phase of the incoming waves.
References
- Vicente, R.; Ferreira, T.; Maio, R. Seismic Risk at the Urban Scale: Assessment, Mapping and Planning. Procedia Economics and Finance 2014, 18, 71–80. [CrossRef]
- Kappos, A.; Sextos, A.; Stefanidou, S.; Mylonakis, G.; Pitsiava, M.; Sergiadis, G. Seismic Risk of Inter-Urban Transportation Networks. Procedia Economics and Finance 2014, 18, 263–270. [CrossRef]
- Mayoral, J.M.; Mosqueda, G. Seismic Interaction of Tunnel-Building Systems on Soft Clay. Soil Dynamics and Earthquake Engineering 2020, 139, 106419. [CrossRef]
- Mayoral, J.M.; Mosqueda, G. Foundation Enhancement for Reducing Tunnel-Building Seismic Interaction on Soft Clay. Tunnelling and Underground Space Technology 2021, 115, 104016. [CrossRef]
- Li, Y.; Tian, Y.; Zong, J. Shaking Table Test on Seismic Response of Tunnel-Soil Surface Structure System Considering Soil-Structure Interaction. Shock and Vibration 2022, 2022. [CrossRef]
- Wang, G.; Yuan, M.; Miao, Y.; Wu, J.; Wang, Y. Experimental Study on Seismic Response of Underground Tunnel-Soil-Surface Structure Interaction System. Tunnelling and Underground Space Technology 2018, 76, 145–159. [CrossRef]
- Hashash, Y.M.A.; Dashti, S.; Musgrove, M.; Gillis, K.; Walker, M.; Ellison, K.; Basarah, Y.I. Influence of Tall Buildings on Seismic Response of Shallow Underground Structures. Journal of Geotechnical and Geoenvironmental Engineering 2018, 144. [CrossRef]
- Mayoral, J.M.; Alcaraz, M.; Tepalcapa, S. Seismic Performance of Soil–Tunnel–Building Systems in Stiff Soils. Earthquake Spectra 2023, 39, 1214–1239. [CrossRef]
- Vicencio, F.; Alexander, N.A. Dynamic Structure-Soil-Structure Interaction in Unsymmetrical Plan Buildings Due to Seismic Excitation. Soil Dynamics and Earthquake Engineering 2019, 127. [CrossRef]
- Vicencio, F.; Alexander, N.A. Seismic Evaluation of Site-City Interaction Effects between City Blocks. Front Built Environ 2024, 10. [CrossRef]
- Chávez-García, F.J.; Cárdenas-Soto, M. The Contribution of the Built Environment to the ‘Free-Field’ Ground Motion in Mexico City. Soil Dynamics and Earthquake Engineering 2002, 22, 773–780. [CrossRef]
- Guéguen, P.; Colombi, A. Experimental and Numerical Evidence of the Clustering Effect of Structures on Their Response during an Earthquake: A Case Study of Three Identical Towers in the City of Grenoble, France. Bulletin of the Seismological Society of America 2016, 106, 2855–2864. [CrossRef]
- Kham, M.; Semblat, J.F.; Bard, P.Y.; Dangla, P. Seismic Site-City Interaction: Main Governing Phenomena through Simplified Numerical Models. Bulletin of the Seismological Society of America 2006, 96, 1934–1951. [CrossRef]
- Wirgin, A.; Bard, P.-Y. Effects of Buildings on the Duration and Amplitude of Ground Motion in Mexico City; 1996; Vol. 86.
- Guéguen, P.; Bard, P.-Y.; Chávez-García, F.J. Site-City Seismic Interaction in Mexico City-Like Environments: An Analytical Study; 2002; Vol. 92.
- Itasca Consulting Group Fast Lagrangian Analysis of Continua in 3 Dimensions (FLAC3D), User’s Guide 2019.
- Seed, H.B.; Romo, M.P.; Sun, J.I.; Jaime, A.; Lysmer, J. The Mexico Earthquake of September 19, 1985—Relationships between Soil Conditions and Earthquake Ground Motions. Earthquake Spectra 1988, 4, 687–729. [CrossRef]
- Romo, M.P. Clay Behavior, Ground Response and Soil-Structure Interaction Studies In. State of the Art Paper, Proceedings of the third international conference on recentadvances in geotechnical engineering and soil dynamics 1995, II, 1039–1051.
- Mayoral, J.M.; De La Rosa, D.; Alcaraz, M.; Barragan, E. Tunnel-Soil-Bridge Seismic Interaction on Soft Clay. Soil Dynamics and Earthquake Engineering 2023, 164. [CrossRef]
- Darendeli, M.B.; Stokoe, K.H. II.(2001).“Development of a New Family of Normalized Modulus Reduction and Material Damping Curves.” Geotechnical Engineering Rep 2001.
- González Blandón, C.M.; Romo Organista, M.P. ESTIMACIÓN DE PROPIEDADES DINÁMICAS DE ARCILLAS. Revista de Ingeniería Sísmica 2011, 84, 1–23.
- Seed, H.; Idriss, I.M. Soil Moduli and Damping Factors for Dynamic Response Analyses; Berkeley, California, 1970.
- Román-De La Sancha, A.; Mayoral, J.M.; Hutchinson, T.C.; Candia, G.; Montgomery, J.; Tepalcapa, S. Assessment of Fragility Models Based on the Sept 19th, 2017 Earthquake Observed Damage. Soil Dynamics and Earthquake Engineering 2019, 125, 105707. [CrossRef]
- Mayoral, J.M.; Asimaki, D.; Tepalcapa, S.; Wood, C.; Roman-de la Sancha, A.; Hutchinson, T.; Franke, K.; Montalva, G. Site Effects in Mexico City Basin: Past and Present. Soil Dynamics and Earthquake Engineering 2019, 121, 369–382. [CrossRef]
- Franke, K.W.; Candia, G.; Mayoral, J.M.; Wood, C.M.; Montgomery, J.; Hutchinson, T.; Morales-Velez, A.C. Observed Building Damage Patterns and Foundation Performance in Mexico City Following the 2017 M7.1 Puebla-Mexico City Earthquake. Soil Dynamics and Earthquake Engineering 2019, 125. [CrossRef]
- Romo, M.P.; Bárcena, A. Análisis de la Interacción Dinámica Suelo-Estructura en la Ciudad de México; 1994.
- f, J.M.; Pérez, M.; Roman, A. Integrated Geoenvironmental Models for Performance Assessment of Tunnels in Soft Soils. Journal of Performance of Constructed Facilities 2025.
- Mayoral, J.M.; Romo, M.P. Seismic Response of Bridges with Massive Foundations. Soil Dynamics and Earthquake Engineering 2015, 71, 88–99. [CrossRef]
- Yeganeh, N.; Bolouri Bazaz, J.; Akhtarpour, A. Seismic Analysis of the Soil-Structure Interaction for a High Rise Building Adjacent to Deep Excavation. Soil Dynamics and Earthquake Engineering 2015, 79, 149–170. [CrossRef]
- Mayoral, J.M.; Rosales, J.; Pérez, M. Three-Dimensional Seismic Environment Effects on Bridge Fragility. Soil Dynamics and Earthquake Engineering 2025.
- Mayoral, J.M.; Pérez, M. Basin Boundary Seismic Effects in Mexico City Southern Region. Bulletin of Earthquake Engineering 2023. [CrossRef]
- Mayoral, J.M.; De la Rosa, D.; Tepalcapa, S. Topographic Effects during the September 19, 2017 Mexico City Earthquake. Soil Dynamics and Earthquake Engineering 2019, 125, 105732. [CrossRef]
- Mayoral, J.M.; Tepalcapa, S.; Roman-de la Sancha, A.; El Mohtar, C.S.; Rivas, R. Ground Subsidence and Its Implication on Building Seismic Performance. Soil Dynamics and Earthquake Engineering 2019, 126, 105766. [CrossRef]
- Wood, C.M.; Woodfield, L.J.; Rahimi, S.; Rosado-Fuentes, A.; Sánchez-Sesma, F.J.; Cruz-Jiménez, H.; Mayoral, J.M.; de la Rosa, D. Shear Wave Velocity and Site Period Measurements for the Western Portion of the Mexico City Basin Following the Mw7.1 2017 Puebla–Morelos, Mexico, Earthquake. Earthquake Spectra 2022. [CrossRef]
- RCDF Reglamento de Construcciones Para El Distrito Federal. Mexico: Administracion Publica Del Distrito Federal, Jefatura de Gobierno, Normas Técnicas Complementarias Para Diseño Por Sismo; 2023.
- Lilhanand, K.; Tseng, W.S. Development and Application of Realistic Earthquake Time Histories Compatible with Multiple Damping Response Spectra. Proceedings of Ninth World Conference on Earthquake Engineering 1988, 2, 819–824.
- Alatik, L.; Abrahamson, N. An Improved Method for Nonstationary Spectral Matching. Earthquake Spectra 2010, 26, 601–617. [CrossRef]
- Schnabel, P.B.; Lysmer, J.; Seed, H.B. SHAKE: A Computer Program for Earthquake Response Analysis of Horizontally Layered Sites, Software 1972.
- Lysmer, J.; Kuhlemeyer, R.L. Finite Dynamic Model for Infinite Media. Journal of the engineering mechanics division 1969, 95, 859–877. [CrossRef]
- Mayoral, J.M.; Argyroudis, S.; Castañon, E. Vulnerability of Floating Tunnel Shafts for Increasing Earthquake Loading. Soil Dynamics and Earthquake Engineering 2016, 80, 1–10. [CrossRef]
- Mayoral, J.M.; Castañon, E.; Albarran, J. Regional Subsidence Effects on Seismic Soil-Structure Interaction in Soft Clay. Soil Dynamics and Earthquake Engineering 2017, 103, 123–140. [CrossRef]
- Kramer, S.L.; Stewart, J.P. Geotechnical Earthquake Engineering; Second edtion.; CRC Press: Boca Raton, 2024; ISBN 9781003512011.
Figure 1.
Dynamic interaction between underground and on-ground structures (Modified from [
3]).
Figure 1.
Dynamic interaction between underground and on-ground structures (Modified from [
3]).
Figure 2.
Schematic representation of the idealized problem, for tunnel-building-urban bridge interaction.
Figure 2.
Schematic representation of the idealized problem, for tunnel-building-urban bridge interaction.
Figure 3.
Soil stratigraphy of the studied site, including index properties, and shear wave velocity distribution.
Figure 3.
Soil stratigraphy of the studied site, including index properties, and shear wave velocity distribution.
Figure 4.
(a) Normalized shear stiffness degradation, G/Gmax, and (b) damping λ curves.
Figure 4.
(a) Normalized shear stiffness degradation, G/Gmax, and (b) damping λ curves.
Figure 5.
(a) Tunnel cross section, (b) primary lining, and (c) secondary lining.
Figure 5.
(a) Tunnel cross section, (b) primary lining, and (c) secondary lining.
Figure 6.
Schematic representation of the urban bridge (a) front, (b) side, and (c) plan view.
Figure 6.
Schematic representation of the urban bridge (a) front, (b) side, and (c) plan view.
Figure 7.
Input motions considered in the seismic analyses (a) Synthetic acceleration history for the CU17 earthquake (intraplate) (b) Response spectra and UHS for intraplate event (c) Synthetic acceleration history for the CU85 earthquake (interface) (d) Response spectra and UHS for interface event.
Figure 8.
(a) Global domain of the 3D numerical model and boundary condition used in the dynamic interaction analysis, and (b) structural elements used to simulate the underground and on-ground structures.
Figure 8.
(a) Global domain of the 3D numerical model and boundary condition used in the dynamic interaction analysis, and (b) structural elements used to simulate the underground and on-ground structures.
Figure 9.
Interaction factor for the bridge in the transversal (X) direction under different scenarios for (a) the CU17, and (b) the CU85 synthetic ground motion.
Figure 9.
Interaction factor for the bridge in the transversal (X) direction under different scenarios for (a) the CU17, and (b) the CU85 synthetic ground motion.
Figure 10.
Interaction factor for the bridge in the longitudinal (Y) direction under different scenarios for (a) the CU17, and (b) the CU85 synthetic ground motion.
Figure 10.
Interaction factor for the bridge in the longitudinal (Y) direction under different scenarios for (a) the CU17, and (b) the CU85 synthetic ground motion.
Figure 11.
Interaction factor for the building in the transversal (X) direction under different scenarios for (a) the CU17, and (b) the CU85 synthetic ground motion.
Figure 11.
Interaction factor for the building in the transversal (X) direction under different scenarios for (a) the CU17, and (b) the CU85 synthetic ground motion.
Figure 12.
Interaction factor for the building in the longitudinal (Y) direction under different scenarios for (a) the CU17, and (b) the CU85 synthetic ground motion.
Figure 12.
Interaction factor for the building in the longitudinal (Y) direction under different scenarios for (a) the CU17, and (b) the CU85 synthetic ground motion.
Figure 13.
Maximum displacements in the transversal (X) and longitudinal (Y) directions computed at the (a) Upper deck of the bridges, and (b) at the building roof of the building.
Figure 13.
Maximum displacements in the transversal (X) and longitudinal (Y) directions computed at the (a) Upper deck of the bridges, and (b) at the building roof of the building.
Figure 14.
Maximum relative displacements in the transversal (X) and longitudinal (Y) directions computed at the (a) urban bridge, and (b) building.
Figure 14.
Maximum relative displacements in the transversal (X) and longitudinal (Y) directions computed at the (a) urban bridge, and (b) building.
Figure 15.
Maximum acceleration computed at the (a) urban bridge deck, (b) bridge foundation, (c) building roof, (d) building foundation and (e) near field for the transversal (X) direction.
Figure 15.
Maximum acceleration computed at the (a) urban bridge deck, (b) bridge foundation, (c) building roof, (d) building foundation and (e) near field for the transversal (X) direction.
Figure 16.
Maximum acceleration computed at the (a) urban bridge deck, (b) bridge foundation, (c) building roof, (d) building foundation and (e) near field for the longitudinal (Y) direction.
Figure 16.
Maximum acceleration computed at the (a) urban bridge deck, (b) bridge foundation, (c) building roof, (d) building foundation and (e) near field for the longitudinal (Y) direction.
Table 1.
Tunnel-building-urban bridge cases considered.
Table 1.
Tunnel-building-urban bridge cases considered.
| Interaction Longitude (diameters) |
Position of the tunnel for the
Tunnel-Building-Bridge scenarios |
Position of the tunnel for the
Tunnel-Bridge scenarios |
Position of the tunnel for the
Tunnel-Building scenarios |
Building-Bridge without tunnel |
| A |
B |
C |
A |
B |
C |
A |
B |
C |
| 1 |
TBU_A1 |
TBU_B1 |
TBU_C1 |
TU_A1 |
TU_B1 |
TU_C1 |
TB_A1 |
TB_B1 |
TB_C1 |
BU_1 |
| 2 |
TBU_A2 |
TBU_B2 |
TBU_C2 |
TU_A2 |
TU_B2 |
TU_C2 |
TB_A2 |
TB_B2 |
TB_C2 |
BU_2 |
| 3 |
TBU_A3 |
TBU_B3 |
TBU_C3 |
TU_A3 |
TU_B3 |
TU_C3 |
TB_A3 |
TB_B3 |
TB_C3 |
BU_3 |
Table 2.
Building structural fundamental period.
Table 2.
Building structural fundamental period.
| Stories |
Basements
Levels |
Te estimated for stiff buildings
Stories*0.1
(s) |
Te estimated for flexible buildings
Stories*0.2
(s) |
Te calculated
using expression 1
(s) |
Height
(m) |
| 7 |
2 |
0.7 |
1.4 |
1.01 |
21.0 |
Table 3.
Rigid base fundamental period of the bridge.
Table 3.
Rigid base fundamental period of the bridge.
| Direction |
Structural period (s) |
| Transversal |
0.45 |
| Longitudinal |
0.60 |
Table 4.
Earthquakes considered in the analysis.
Table 4.
Earthquakes considered in the analysis.
| Seismogenic zone |
Earthquake name |
Year |
Mw,
Moment magnitude |
PGA,
Peak ground acceleration
(g) |
TD
(s) |
Frequency content
(Hz) |
Arias intensity
(cm/s) |
| Intraplate |
Puebla-Mexico City (CU, Mexico), CU17 |
2017 |
7.1 |
0.059 |
29.6 |
0.23 to 3.5 |
12.7 |
| Interface |
Michoacan (CU, Mexico), CU85 |
1985 |
8.1 |
0.033 |
49.7 |
0.38 to 1.36 |
15.5 |
Table 5.
Dynamic properties of soil elements.
Table 5.
Dynamic properties of soil elements.
| Strata |
Mohr-Coulomb properties |
Elastic properties |
Sig3 hysteretic model |
Estimated level of nonlinearity |
γ
(kN/m³) |
c
(kPa) |
φ
(°) |
Gmax (GPa) |
ν |
a |
b |
x0 |
γ (%) |
G/Gmax
|
λ(%) |
| Sandy silt |
16.0 |
30 |
35 |
12.0 |
0.30 |
1.014 |
-0.480 |
-0.600 |
0.01 - 0.15 |
0.4 - 0.9 |
9 - 21 |
| Very soft clay |
12.0 |
40 |
0 |
5.6 |
0.45 |
1.000 |
-0.460 |
0.320 |
0.13 - 0.69 |
0.8 - 0.95 |
3 - 4 |
| Silty sand with stiff clay |
17.0 |
15 |
27 |
126.0 |
0.30 |
1.014 |
-0.480 |
-1.250 |
0.02 - 0.04 |
0.7 - 0.8 |
11 - 14 |
| Soft clay |
14.0 |
80 |
0 |
34.7 |
0.45 |
1.000 |
-0.490 |
-0.020 |
0.01 - 0.11 |
0.85 - 1.0 |
2 - 3 |
| Silty sand |
19.0 |
15 |
40 |
390 to 613 |
0.28 |
1.014 |
-0.550 |
-1.500 |
0.01 - 0.02 |
0.8 - 0.9 |
5 - 6 |
Table 6.
Coupling spring properties of the PILE elements.
Table 6.
Coupling spring properties of the PILE elements.
| Soil |
(kN/m) |
(°) |
(MPa) |
(kN/m) |
(°) |
(MPa) |
| Very soft clay |
60 |
0.1 |
1077 |
180 |
0.1 |
270 |
|
Disclaimer/Publisher’s Note: The statements, opinions and data contained in all publications are solely those of the individual author(s) and contributor(s) and not of MDPI and/or the editor(s). MDPI and/or the editor(s) disclaim responsibility for any injury to people or property resulting from any ideas, methods, instructions or products referred to in the content. |
© 2025 by the authors. Licensee MDPI, Basel, Switzerland. This article is an open access article distributed under the terms and conditions of the Creative Commons Attribution (CC BY) license (http://creativecommons.org/licenses/by/4.0/).