Submitted:
07 February 2025
Posted:
07 February 2025
You are already at the latest version
Abstract
Japan is facing challenges associated with its super-aging society, including increased social security burdens and a rise in the elderly workforce due to a declining younger labor force. Extending healthy life expectancy is one countermeasure, necessitating lifestyle improvements such as frailty prevention and ensuring adequate sleep duration. This study investigated the relationship between heart rate variability (HRV) and sleep duration among older adults (aged ≥65) using electrocardiogram (ECG) and three-axis accelerometer data from the Allostatic State Mapping by Ambulatory ECG Repository (ALLSTAR) database, recorded between January 2019 and March 2021. Inclusion criteria required sinus rhythm and recording durations ≥80%. Continuous 24-hour ECG and accelerometer data were analyzed for 55,154 participants (mean age 76±6). Results consistently showed significant differences in HRV metrics, including MRRI, SDRR, ULF, LF, HF, and LF/HF, across sleep duration groups (G1–G4). Short-sleep groups (G4) exhibited decreased MRRI and SDRR and increased LF/HF, suggesting active lifestyles but reduced HRV. Conversely, long-sleep groups (G1) showed increased MRRI and reduced LF/HF but exhibited age-related declines in SDRR and ULF. These findings indicate that both insufficient and excessive sleep may contribute to HRV reduction in older adults. This study provides critical insights for improving elderly lifestyles through tailored interventions in exercise and sleep management.
Keywords:
heart rate variability (HRV)
; sleep duration
; older adults
; electrocardiogram (ECG)
; lifestyle interventions
1. Introduction
Japan is facing an aging society, and with the decline in the birthrate and the resulting decrease in the number of young workers, the country is encountering challenges such as an increased burden on social security systems and a rise in the number of elderly workers. One measure to address this situation is to extend healthy life expectancy, which necessitates lifestyle improvements, such as frailty prevention and ensuring adequate sleep.
However, as we age, our basal metabolic rate decreases. This decline results in nutrients consumed not being efficiently used as energy but instead stored as fat in the body. Additionally, as energy is not properly distributed throughout the body, the functions of blood vessels, internal organs, and muscles deteriorate. A reduction in lean body mass, such as muscle, further contributes to decreased energy metabolism during activity. While the primary cause of the decline in basal metabolic rate associated with aging is attributed to the loss of skeletal muscle mass, this factor alone does not fully account for the phenomenon. A decrease in the metabolic rate of individual organs is also considered a significant contributor. Numerous studies support this view, including those related to elderly metabolism [1,2,3], elderly pharmacokinetics [4,5,6,7,8,9,10,11,12,13,14,15], and energy requirements and aging [16,17,18,19,20], which highlight unique metabolic phenomena in the elderly.
In recent years, new findings have emerged regarding the activities and sleep of the elderly. For example, exercise has been emphasized as crucial for preventing obesity, which occurs when energy intake exceeds energy expenditure [21]. Additionally, short sleep duration has been identified as a risk factor for obesity [22].
Heart rate variability (HRV), widely recognized as an indicator of autonomic nervous system function, has become an essential tool for assessing the health of the elderly. Studies have shown a correlation between heart rate indicators and basal metabolic rate, indicating that a higher basal metabolic rate is associated with a higher pulse rate. HRV is also used as a measure of the body’s ability to respond to physiological stress and maintain overall health [23,24,25,26,27,28,29].
Therefore, in this study, we focused on the relationship between heart rate variability and sleep duration, aiming to quantitatively evaluate this relationship.
2. Materials and Methods
2.1. Study Design and Population
In this study, we used data from the Allostatic State Mapping by Ambulatory ECG Repository (ALLSTAR) database, which includes comprehensive records of electrocardiogram (ECG) and triaxial accelerometer data collected between January 2019 and March 2021 (https://allstar.jpn.org/). Among the data of the elderly (aged 65 years or older), the selection criteria were sinus rhythm of 80% or more and recording time of 80% or more. The data of 2019 (n=23,547, 76±6 years old), 2020 (n=25,402, 76±6 years old), 2021 (n=6,205, 76±6 years old), and a total of 55,154 people. Data that met these conditions and were eligible for analysis were used.
2.2. Data Collection
Continuous 24-hour ECG and three-axis accelerometer data were collected using Holter ECG recorder (pico 303, Suzuken Co., Ltd., Nagoya, Japan). The sampling frequency for ECG-derived RR intervals (RRI) was set at 125 Hz, while the sampling frequency for accelerometer data was 31.25 Hz.
Holter ECG The device has a built-in non-volatile memory that does not require a backup battery, and records 24-hour ECG signals as well as 3D acceleration information. A button battery (CR2032) is already attached to the back of the device, and attaching the back cover puts the device in recording standby mode, so it is easy to attach. It records 3 channels (CH) with 3 electrodes. With the standard electrode placement, which is attached to the upper right chest, left subclavian, and left lower rib,
CH1: CM5 induction = V5 equivalent
CH2: NASA induction = V1 induction, which makes it easy to see the P wave
CH3: Auxiliary induction = auxiliary induction that can be used when the pico main unit fixed electrode is missing (difference potential between CH1 and CH2)
Three-Axis Accelerometer; physical activity levels and sleep patterns were assessed using accelerometer data recorded simultaneously with ECG. Sleep duration was estimated based on periods of minimal physical activity, as determined by accelerometer thresholds validated. The three-axis accelerometer within the device allowed for posture estimation by calculating the roll, pitch, and yaw angles. This was achieved by leveraging the property that, under static conditions, the accelerometer primarily detects gravitational acceleration. The sensor outputs a vector aligned with the reaction force direction, enabling estimation of the body’s orientation relative to gravity. The fundamental principle behind accelerometer-based posture detection is that, irrespective of the object’s orientation, the gravitational direction serves as a constant reference point. Using this reference, the current posture can be deduced. This method enabled the accurate analysis of body position and movement states during data collection. All devices were calibrated prior to use to ensure the reliability of the collected data, which served as the foundation for analyzing the relationship between heart rate variability and sleep duration among older adults.
If we define the vector of the sensor coordinate system output by the acceleration sensor as (ax, ay, az), and the rotation angles of roll, pitch and yaw that rotate this into the global coordinate system as (r, p, y),
the result of the rotation is always facing the sky in the global coordinate system, so we can express it as (0, 0, g) when we take the acceleration of gravity. If we consider each of these vectors as a matrix, we can express them using the following formula, together with the rotation matrix,
In order to obtain the rotation matrix (Equation 2) that is a composite of the three rotations, the final rotation can be obtained by multiplying the rotation matrix in order (Equations 3-5). Each rotation matrix indicates the rotation about the rotation axis.
R = Rz(y) ⋅ Ry(p) ⋅ Rx(r)
Roll (r): Rotation around the X-axis (front-back axis)
Pitch (p): Rotation around the Y-axis (left-right axis)
Yaw (y): Rotation around the Z-axis (up-and-down axis)
2.3. Three Axis Accelerometer and Supine Position Detection Algorithm
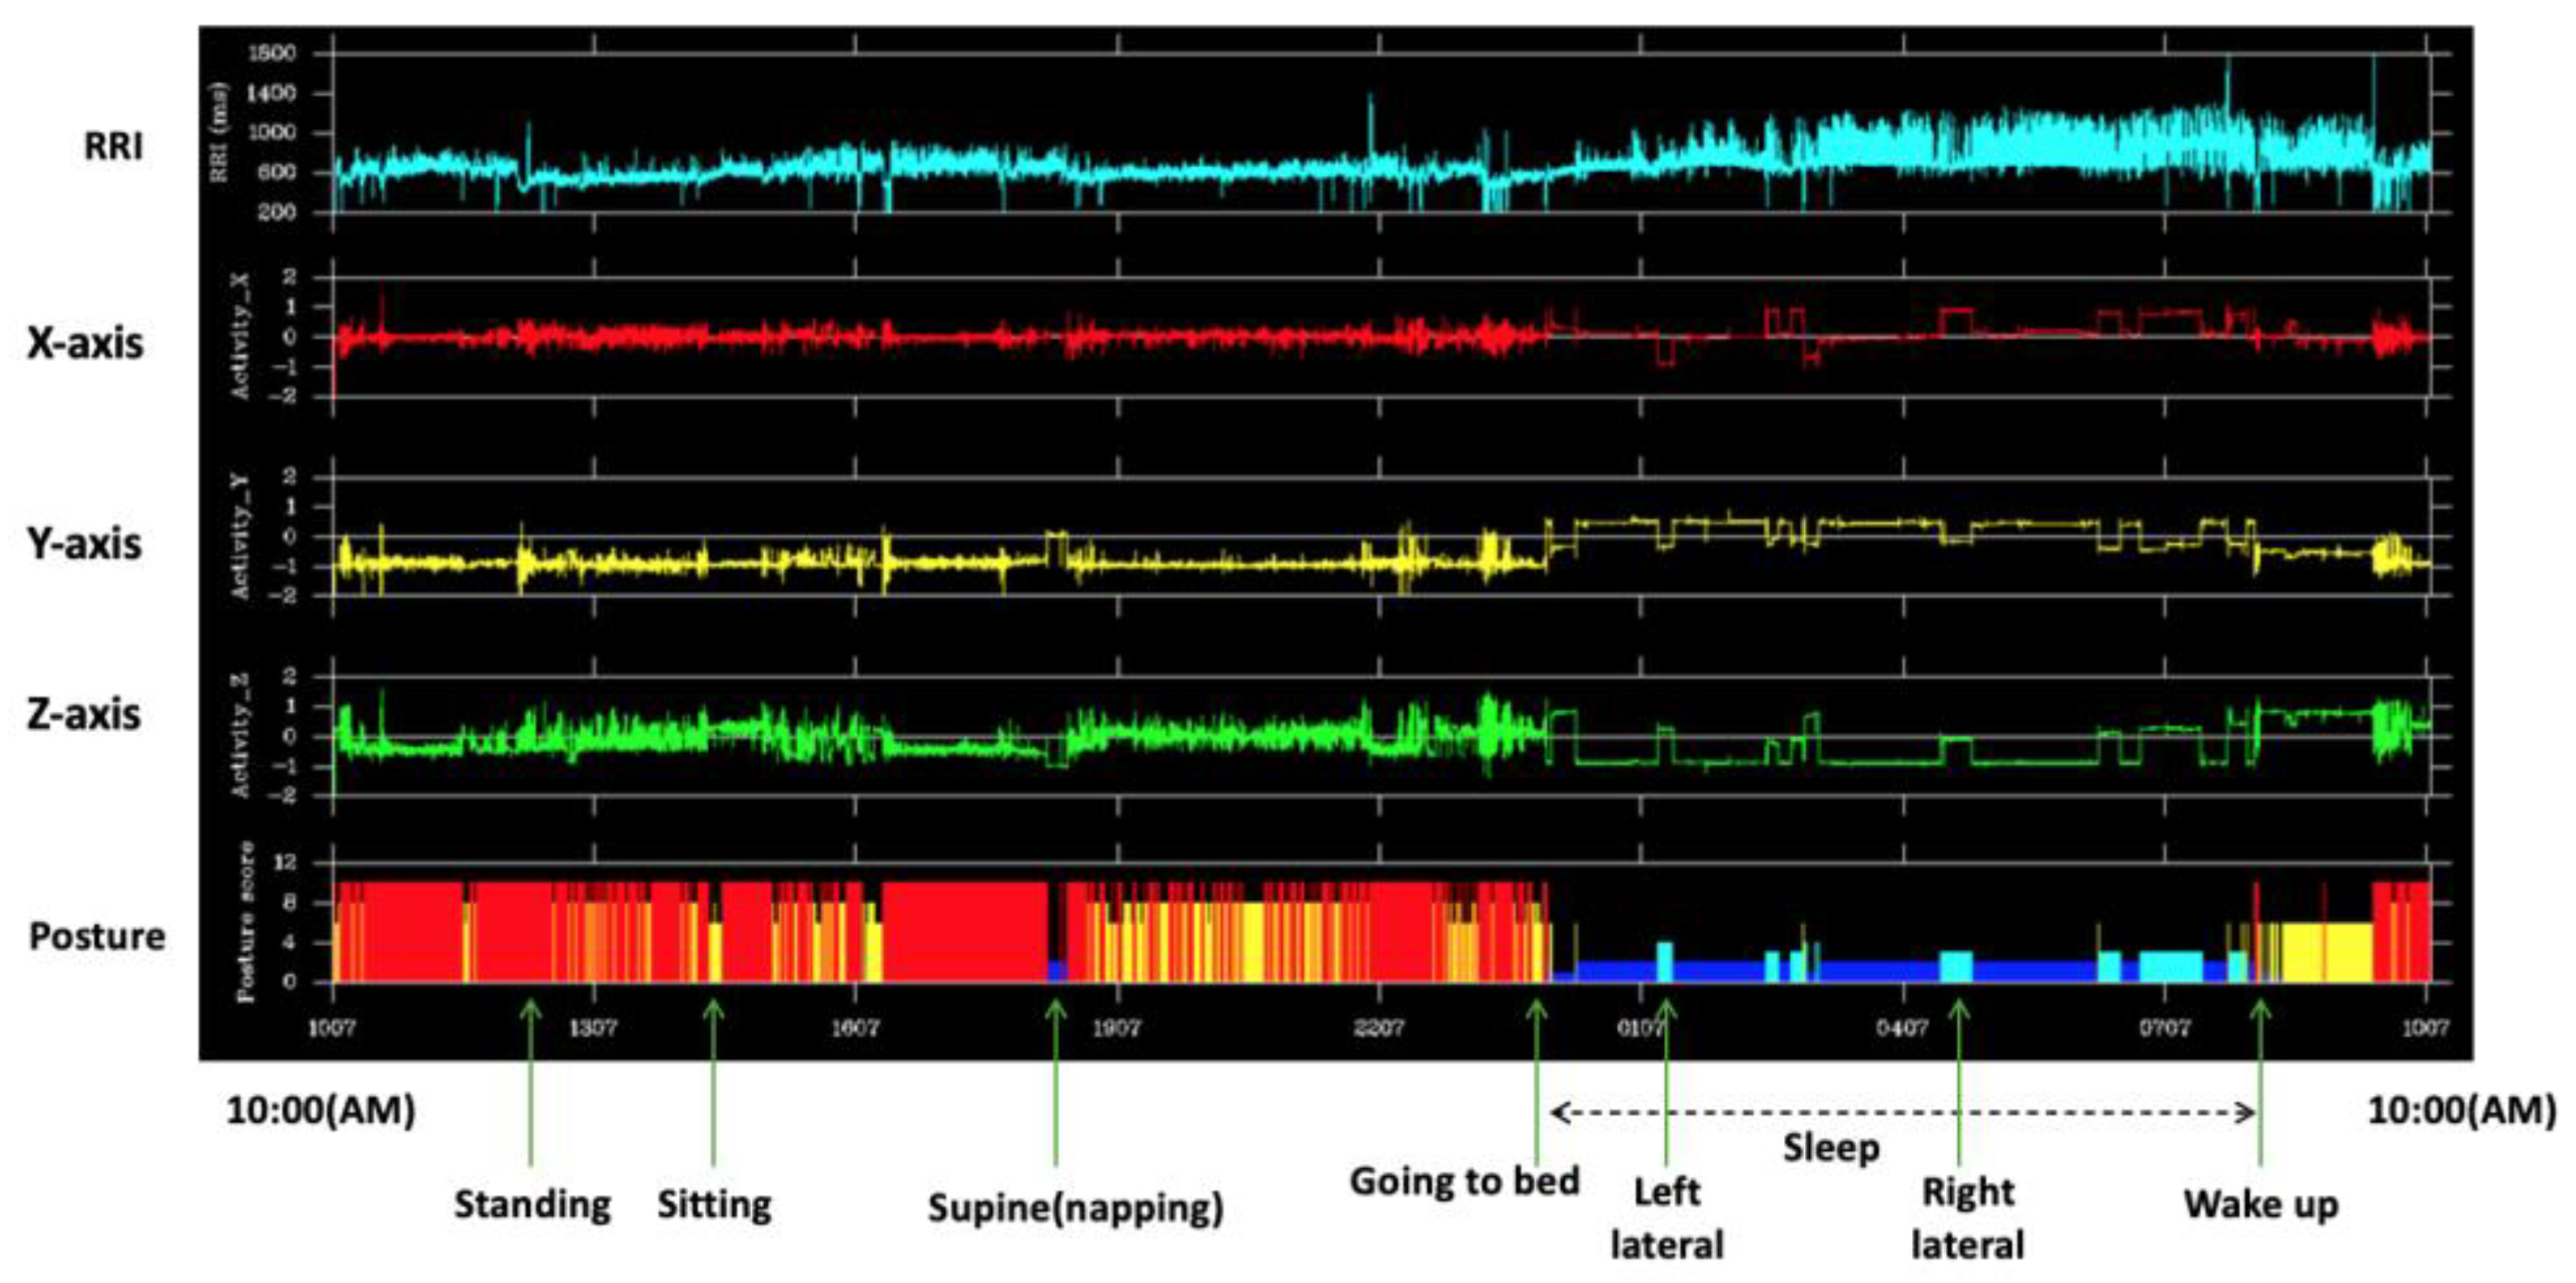
For the discrimination of four types of supine postures (supine, prone, right-sided, and left-sided), we first resampled the x(t), y(t), and z(t) output from the Holter electrocardiograph at 10 Hz. Next, we focused on y(t) to determine whether the posture was supine or not. The supine and prone postures were discriminated by z(t), and the right and left side supine postures were discriminated by x(t) (Figure 1).
2.4. Sleep Duration Categorization
The lying-down rate for each hour was calculated using the lying-down detection algorithm. The lying-down rate increased to 50% between 21:00 and 21:59, and it was estimated that people went to bed during this time. The lying-down rate decreased to 50% between 6:00 and 6:59, and it was estimated that people got up during this time period, it is estimated that people get up during this time (Figure 2). By focusing on the average value of the percentage of people in the supine position during the 10-hour period from 21:00 to 7:00, we divided the subjects into four groups using quartiles (long sleep group: G1, slightly long sleep group: G2, slightly short sleep group: G3, short sleep group: G4). The average sleep time for each group is shown in Table 1.
RRI and Three-axis bio-acceleration outputs from the Holter ECG are shown respectively. The posture is shown in the bottom row and horizontal axis is time.
Figure 2.
Estimation of nighttime sleep duration and grouping.
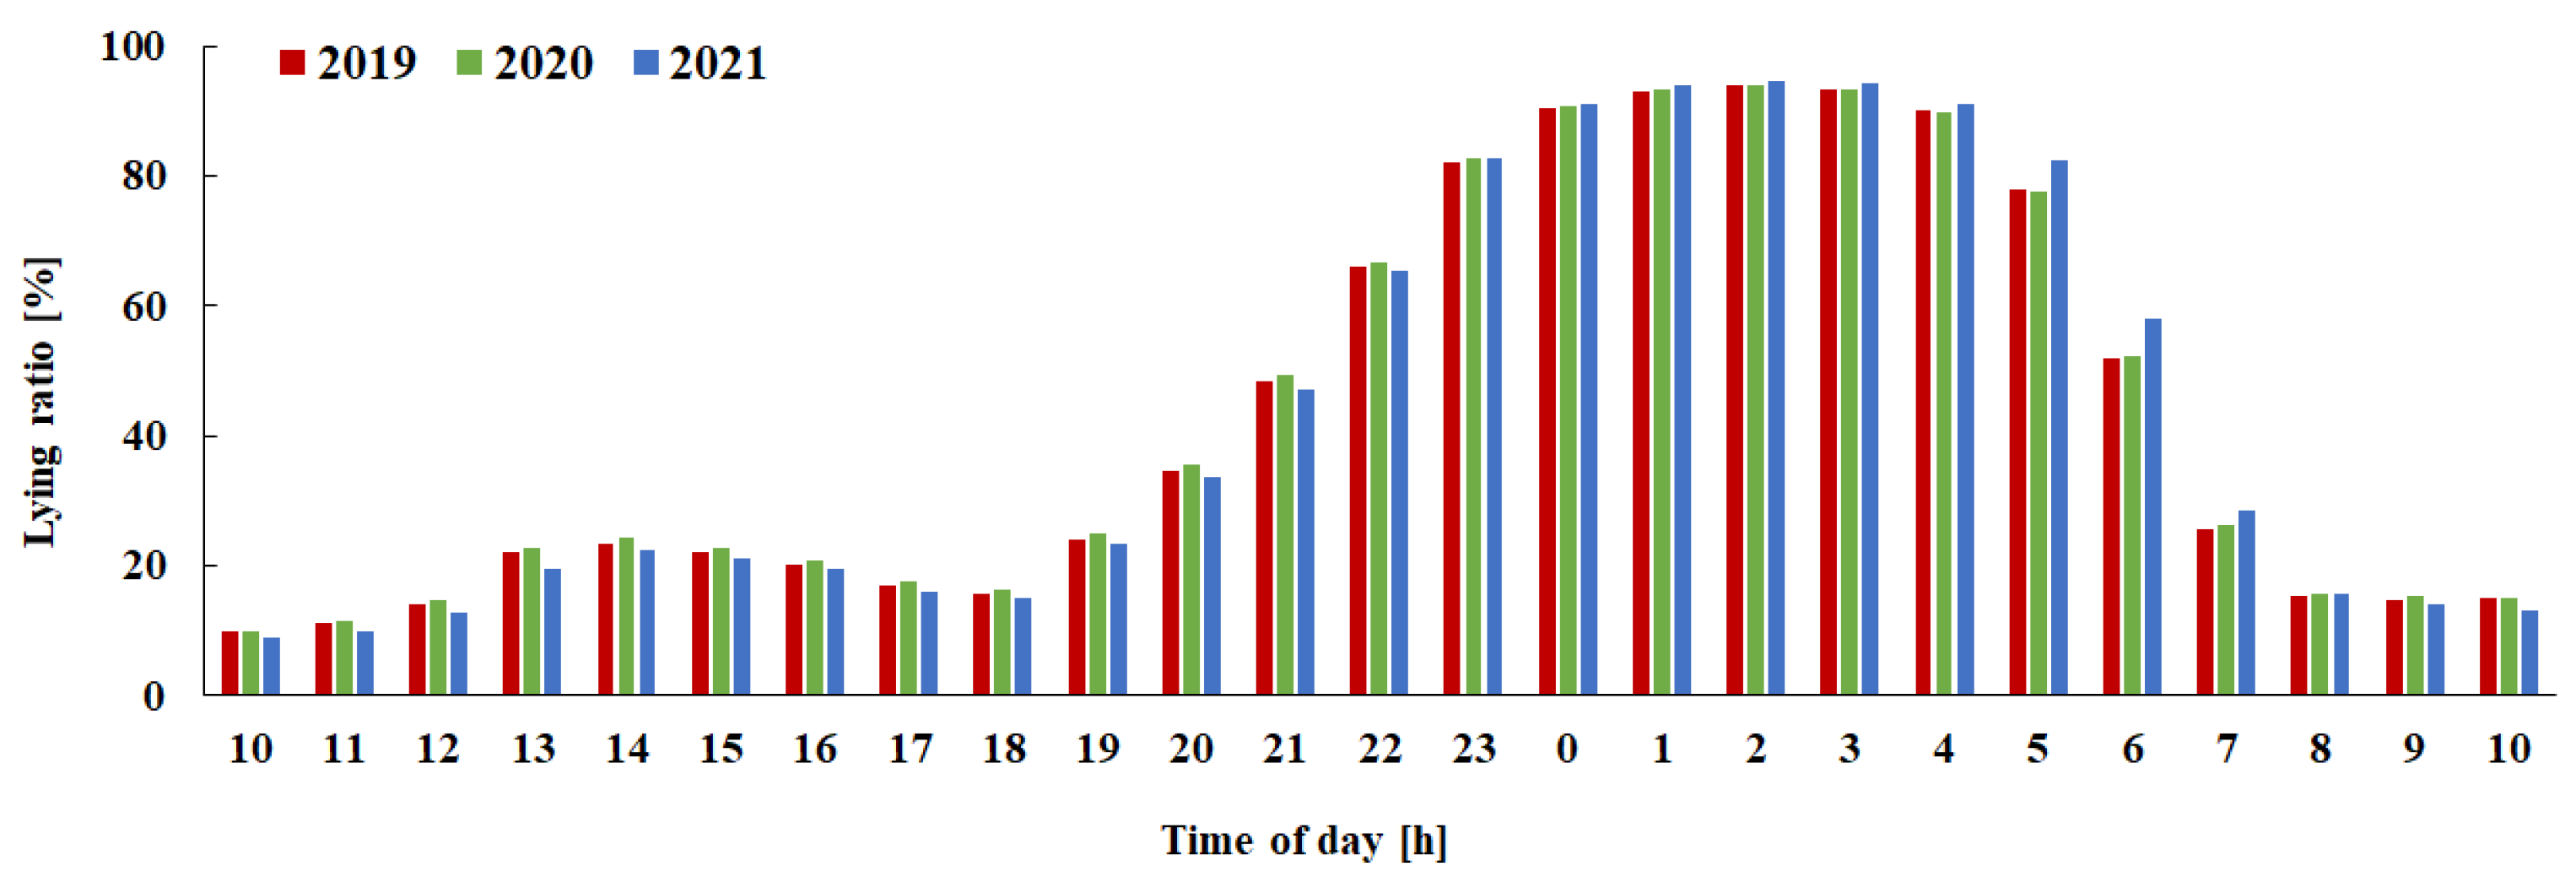
The vertical axis shows the percentage of lying down time, and the horizontal axis shows time of day. The red bars show data for 2019, green shows for 2020, and blue shows for 2021.

Table 1.
Average sleep time for each group [h] (Mean ± SD).
| Year | G1 | G2 | G3 | G4 |
|---|---|---|---|---|
| 2019 | 9.3 ± 0.3 | 8.4 ± 0.2 | 7.6 ± 0.2 | 6.2 ± 1.0 |
| 2020 | 9.4 ± 0.3 | 8.4 ± 0.2 | 7.6 ± 0.2 | 6.2 ± 1.0 |
| 2021 | 9.4 ± 0.3 | 8.5 ± 0.2 | 7.4 ± 0.2 | 6.4 ± 0.9 |
2.5. Heart Rate Variability Metrics
The following eight types of heart rate variability metrics were calculated using the discrete Fourier transform (DFT) algorithm, which calculates the DFT quickly using the Fast Fourier Transform (FFT) from the RRI time series for one day, which had been resampled at 2Hz. FFT is a general non-parametric method for calculating power spectral density, and by using FFT, the signal was converted from the time domain to the frequency domain. The spectrum function, which is expressed as a power value per unit frequency width (1 Hz width) so that it is not dependent on the frequency resolution Δ f of the FFT calculation, is the Power Spectral Density Function (PSD), and is suitable for evaluating non-periodic signals (irregular signals, random signals) that are continuous spectra.
- ●
- Mean RRI interval: MRRI
- ●
- Standard deviation: SDRR (smaller values indicate a predominance of sympathetic nervous system activity)
- ●
- Ultra-low frequency power (ULF: < 0.0033 Hz): An indicator reflecting circadian rhythm
- ●
- Very low frequency power (VLF: 0.0033-0.04 Hz): An indicator reflecting vasomotor activity and thermoregulation
- ●
- Low frequency power (LF: 0.04-0.15 Hz): An indicator reflecting baroreflex sensitivity
- ●
- High frequency component power (HF: 0.15-0.45Hz): An indicator reflecting parasympathetic nervous system activity
- ●
- LF/HF ratio: An indicator reflecting sympathetic nervous system activity and the proportion of time spent in the supine position (a high value indicates a low proportion of time spent in the supine position, so this is an indicator that is considered over long periods of time)
- ●
- High frequency component peak frequency (HFF): An indicator reflecting the number of respiratory cycles
2.6. Statistical Analysis
HRV indices were compared across sleep duration groups using one-way analysis of variance (ANOVA) with Bonferroni’s post-hoc test for multiple comparisons. Statistical significance was set at p < 0.05. All analyses were conducted using IBM SPSS Statistics (version 28.0.1.0, Armonk, NY, USA). Values of HRV indices were expressed as mean and standard error.
2.7. Ethical Considerations
This study was conducted in accordance with the principles of the Declaration of Helsinki. The ALLSTAR database does not contain any personal information such as the names or addresses of the study participants, but approval was obtained from the ethics committee for the secondary use of the data (Nagoya City University Hospital Ethics Review Committee, Approval Number 60-00-070, August 17, 2020). All participants signed a written informed consent form at the time of data collection.
3. Results
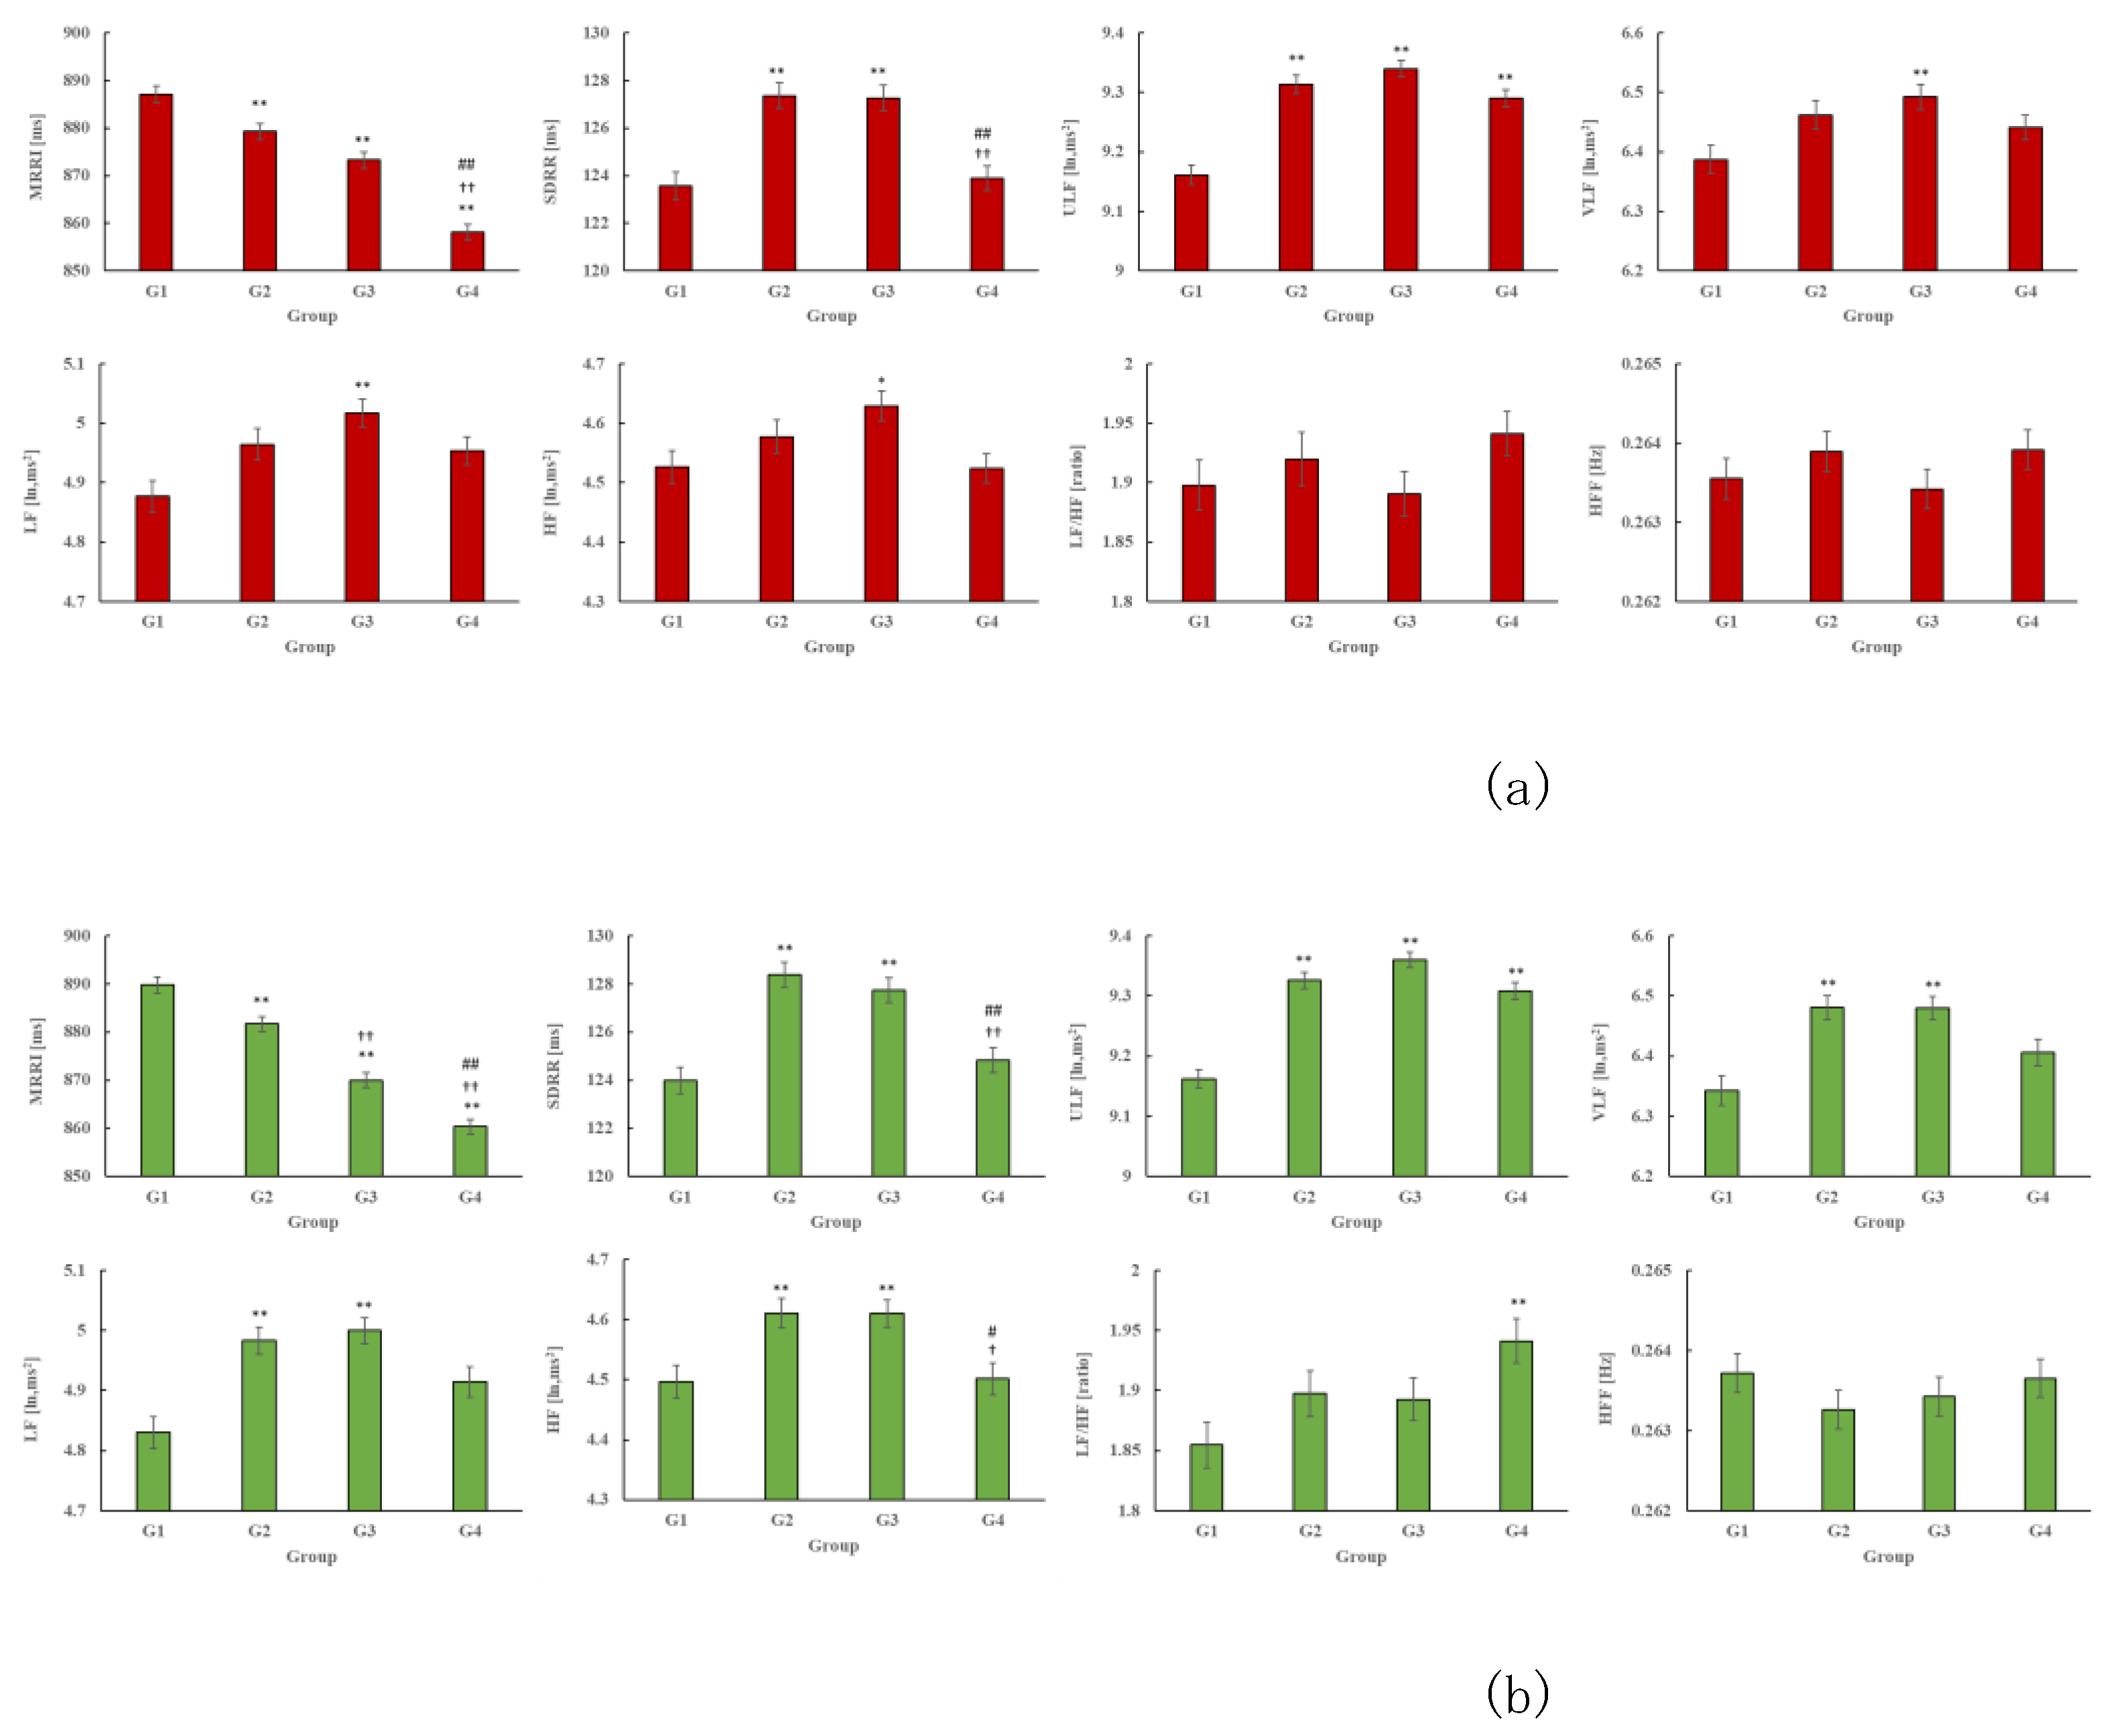
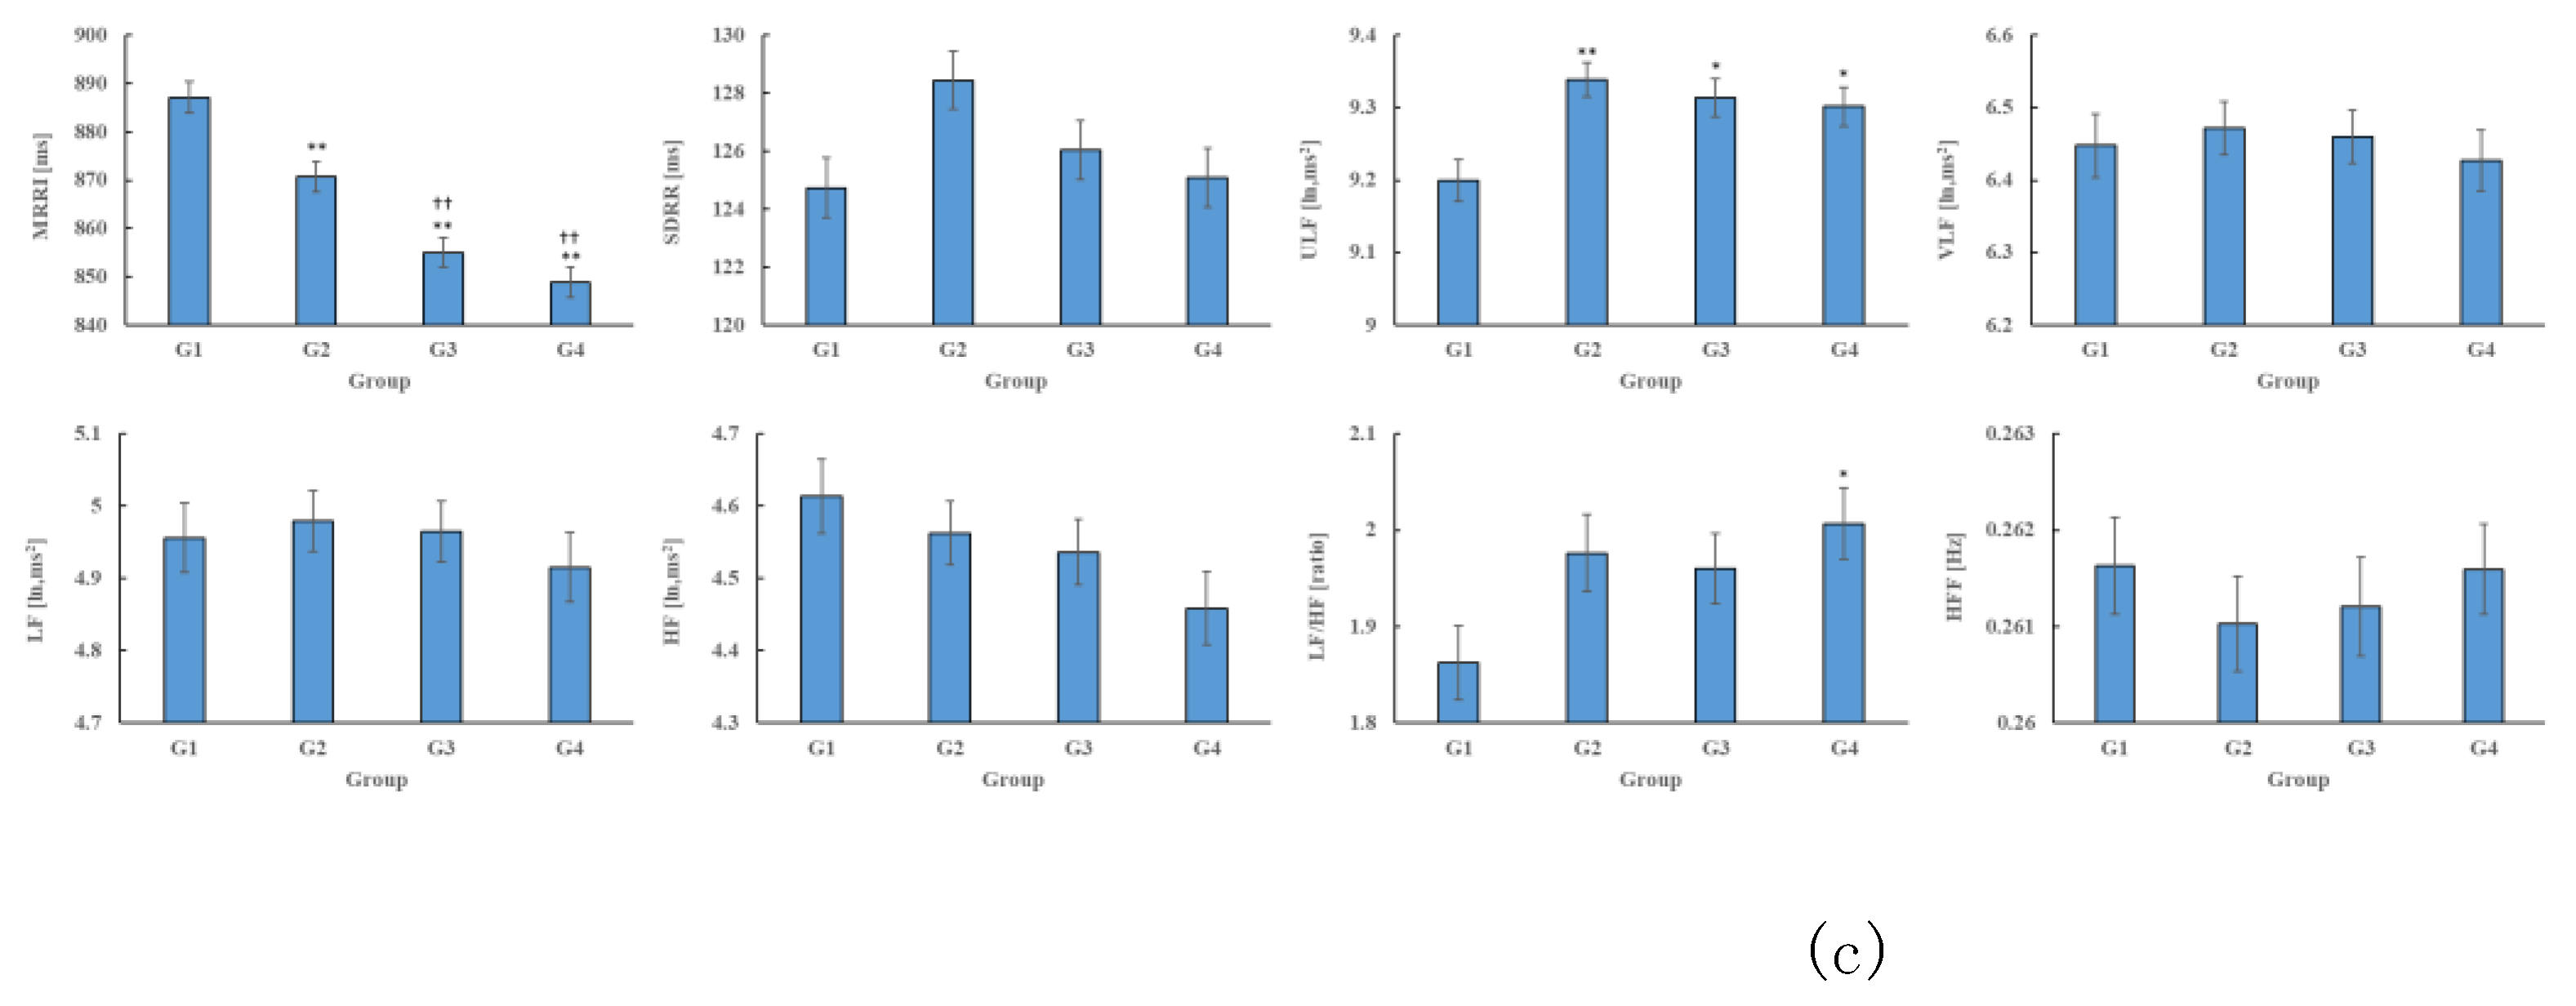
The HRV indices for each group are shown in Figure 2. Across the three years (2019–2021), the MRRI of G1 was higher and ULF was lower compared to G2, G3, and G4 (P<0.001). In 2019 and 2020, SDRR was lower in G1 and G4 compared to G2 and G3 (P<0.001). Additionally, in 2019, the VLF, LF, and HF were lower in G1 compared to G3 (P<0.05). In 2020, VLF, LF, and HF were also lower in G1 compared to G2 and G3 (P<0.01), while the LF/HF ratio showed a higher tendency in G4 compared to G1 in both 2020 and 2021 (P<0.01).
Figure 3.
HRV indicators for each group (a), (b), and (c) indicate the HRV index for 2019, 2020, and 2021, respectively.
Figure 3.
HRV indicators for each group (a), (b), and (c) indicate the HRV index for 2019, 2020, and 2021, respectively.
4. Discussion
From these results, it was thought that the group with short sleep duration (G4) was leading an active lifestyle and that HRV was declining, based on the decrease in MRRI and SDRR and the increase in LF/HF. In addition, the group with long sleep duration (G1) showed a decrease in SDRR and ULF despite an increase in MRRI and a decrease in LF/HF. This suggests that HRV declines with age, and that this effect is particularly pronounced in older people.
The findings of this study indicate that HRV indices decrease with aging, which is largely consistent with previous studies. On the other hand, we succeeded in uncovering a novel insight that has not been thoroughly explored in prior research—namely, that groups with shorter sleep durations tend to exhibit higher levels of physical activity. This result provides an important contribution to understanding the relationship between sleep and physical activity.
Numerous studies have investigated the relationship between sleep duration and lifespan [30,31,32,33,34,35,36,37,38], showing that sleep duration shortens with aging, sleep becomes more fragmented, and its quality declines. For example, children up to adolescence typically require about 9 hours of sleep, which decreases during the mid-teenage years, stabilizing around 7 hours in the twenties. In older adults, sleep duration is suggested to decrease further, to about 5–6 hours [30]. This reduction is partially attributed to a decline in basal metabolic rate, leading to a lower energy replenishment need through sleep.
Additionally, among older adults, going to bed early despite a lack of sleepiness may contribute to poor sleep onset and increased instances of waking up during the night. From this perspective, rather than focusing on sleep duration, increasing physical activity may be a more desirable strategy for maintaining health in older age. However, it has also been reported that sleep quality declines as the number of chronic conditions increases with age [38]. This suggests that unresolved issues remain regarding the relationship between HRV and sleep quality. Future studies should aim to examine these aspects in greater detail to deepen our understanding of the interplay between aging, sleep, physical activity, and HRV.
5. Conclusions
In this study, we analyzed ALLSTAR, a comprehensive big dataset, to explore the intricate relationship between heart rate variability (HRV) and sleep duration in older adults. The findings revealed that both excessively long and short sleep durations may be associated with decreased HRV, emphasizing the potential impact of sleep patterns on autonomic nervous system function in older adults. These results underscore the importance of maintaining an optimal balance in sleep duration as a critical factor for preserving cardiovascular and overall health during aging. As people age, changes in sleep patterns naturally occur, even among healthy older adults. These changes include shallower sleep, more frequent awakenings during the night, and earlier morning awakenings. Additionally, the presence of diseases that interfere with sleep can lead to various sleep disorders, such as insomnia and sleep apnea syndrome. This highlights the need for further research to better understand the relationship between sleep quality and HRV indices. Moreover, this study draws attention to the interplay between sleep duration and physical activity levels and their combined effects on HRV and broader health outcomes in older adults. As part of a comprehensive health promotion strategy for aging populations, establishing regular exercise routines and consistent sleep patterns is crucial. These approaches are expected to foster healthier aging and reduce the burden of age-related health issues, ultimately contributing to improved quality of life in older adults.
Supplementary Materials
The following supporting information can be downloaded at the website of this paper posted on Preprints.org, Holter ECG database ALLSTAR (https://allstar.jpn.org/) used in this study can be obtained by going through the application process for research use.
Author Contributions
Conceptualization, E.Y. and Y.Y.; methodology, Y.Y.; software, Y.Y.; validation, E.Y., and Y.Y.; formal analysis, E.Y.; investigation, E.Y.; resources, E.Y.; data curation, Y.Y.; writing—original draft preparation, E.Y.; writing—review and editing, E.Y.; visualization, Y.Y.; supervision, E.Y.; project administration, E.Y.; funding acquisition, E.Y. All authors have read and agreed to the published version of the manuscript.
Funding
Please add: This research received no external funding.
Institutional Review Board Statement
The study was conducted in accordance with the Declaration of Helsinki, and approved by the Institutional Review Board of Nagoya City Universityy Hospital Ethics Committee (protocol code 60-00-070, August 17, 2020).
Informed Consent Statement
Informed consent was obtained from all subjects involved in the study.
Data Availability Statement
The database used for the analysis is available upon request. For details, please refer to the web page. Allostatic State Mapping by Ambulatory ECG Repository (ALLSTAR) https://allstar.jpn.org/
Conflicts of Interest
The authors declare no conflicts of interest.
Abbreviations
The following abbreviations are used in this manuscript:
| ECG | Electrocardiogram |
| HRV | Heart Rate Variability |
| RRI | RR Interval |
| MRRI | Mean RRI interval |
| SDRR | Standard deviation of RRI |
| ULF | Ultra-low frequency power (< 0.0033 Hz) |
| VLF | Very low frequency power (0.0033-0.04 Hz) |
| LF | Low frequency power (0.04-0.15 Hz): |
| HF | High frequency component power (0.15-0.45Hz) |
| LF/HF | LF/HF ratio |
| HFF | High frequency component peak frequency |
References
- Bloesch, D.; Schutz, Y. Energy Metabolism in the Elderly. Soz Präventivmed 1989, 34(2), 67–70. [CrossRef]
- Newberry, C.; Dakin, G. Nutrition and Weight Management in the Elderly. Clin. Geriatr. Med. 2021, 37(1), 131–140. [CrossRef]
- Mishra, M.; Wu, J.; Kane, A.E.; Howlett, S.E. The Intersection of Frailty and Metabolism. Cell Metab. 2024, 36(5), 893–911. [CrossRef]
- Klotz, U. Pharmacokinetics and Drug Metabolism in the Elderly. Drug Metab. Rev. 2009, 41(2), 67–76. [CrossRef]
- Benedetti, M.S.; Whomsley, R.; Canning, M. Drug Metabolism in the Paediatric Population and in the Elderly. Drug Discov. Today 2007, 12(15–16), 599–610. [CrossRef]
- Pelkonen, O. Metabolism and Pharmacokinetics in Children and the Elderly. Expert Opin. Drug Metab. Toxicol. 2007, 3(2), 147–148. [CrossRef]
- Herrlinger, C.; Klotz, U. Drug Metabolism and Drug Interactions in the Elderly. Best Pract. Res. Clin. Gastroenterol. 2001, 15(6), 897–918. [CrossRef]
- Mayersohn, M. Pharmacokinetics in the Elderly. Environ. Health Perspect. 1994, 102 Suppl 11, 119–124. [CrossRef]
- Wynne, H. Drug Metabolism and Ageing. J. Br. Menopause Soc. 2005, 11(2), 51–56. [CrossRef]
- Turnheim, K. Drug Therapy in the Elderly. Exp. Gerontol. 2004, 39(11–12), 1731–1738. [CrossRef]
- Williams, L.; Lowenthal, D.T. Drug Therapy in the Elderly. South Med. J. 1992, 85(2), 127–131. [CrossRef]
- Ishizaki, T. Drug Therapy in the Elderly. Nihon Ronen Igakkai Zasshi 1992, 29(1), 10–16. [CrossRef]
- Sadean, M.R.; Glass, P.S. Pharmacokinetics in the Elderly. Best Pract. Res. Clin. Anaesthesiol. 2003, 17(2), 191–205. [CrossRef]
- Nadai, M.; Katoh, M. Changes in Pharmacokinetics in Elderly Patients. Nihon Rinsho 2013, 71(6), 999–1003. PMID: 23855202.
- Péhourcq, F.; Molimard, M. Pharmacokinetics in the Elderly. Rev. Mal. Respir. 2002, 19(3), 356–362. PMID: 12161702.
- Roberts, S. B.; Dallal, G. E. Energy Requirements and Aging. Public Health Nutrition. [CrossRef]
- Clegg, M. E.; Williams, E. A. Optimizing Nutrition in Older People. Maturitas 2018, 112, 34–38. [CrossRef]
- Jensen, G. L.; McGee, M.; Binkley, J. Nutrition in the Elderly. Gastroenterology Clinics of North America 2001, 30, 313–34. PMID: 11432294. [CrossRef]
- Panda, A.; Booth, S. L. Nutritional Aspects of Healthy Aging. Medical Clinics of North America 2022, 106, 853–863. PMID: 36154704. [CrossRef]
- Lee, P. H.; Chan, C. W. Energy Intake, Energy Required and Mortality in an Older Population. Public Health Nutrition 2016, 19, 3178–3184. PMID: 27406257. [CrossRef]
- Levine, J. A., Lanningham-Foster, L., McCrady, S. K., Krizan, A. C., Olson, L. R., Kane, P. H., Jensen, M. D., & Clark, M. M. (2005). Interindividual variation in posture allocation: possible role in human obesity. Science, 307(5709), 584–586. [CrossRef]
- Tasali, E., Wroblewski, K., Kahn, E., Kilkus, J., & Schoeller, D. A. (2022). Effect of Sleep Extension on Objectively Assessed Energy Intake Among Adults With Overweight in Real-life Settings: A Randomized Clinical Trial. JAMA Internal Medicine, 182(4), 365–374. [CrossRef]
- Shaffer, F.; Ginsberg, J.P. An Overview of Heart Rate Variability Metrics and Norms. Front. Public Health 2017, 5, 258. [CrossRef]
- Pinto, A.M.; Bordoli, C.; Buckner, L.P.; Kim, C.; Kaplan, P.C.; Del Arenal, I.M.; Jeffcock, E.J.; Hall, W.L. Intermittent Energy Restriction is Comparable to Continuous Energy Restriction for Cardiometabolic Health in Adults with Central Obesity: A Randomized Controlled Trial; The Met-IER Study. Clin. Nutr. 2020, 39, 1753–1763. [CrossRef]
- Debain, A.; Loosveldt, F.A.; Knoop, V.; Costenoble, A.; Lieten, S.; Petrovic, M.; Bautmans, I.; Gerontopole Brussels Study Group. Frail Older Adults Are More Likely to Have Autonomic Dysfunction: A Systematic Review and Meta-Analysis. Ageing Res. Rev. 2023, 87, 101925. [CrossRef]
- Rocha, A.S.L.; Siqueira, V.B.; Maduro, P.A.; Batista, L.D.S.P.; Schwingel, P.A. Reference Values for Heart Rate Variability in Older Adults: A Systematic Review. Psychophysiology 2024, 61, e14661. [CrossRef]
- Grässler, B.; Thielmann, B.; Böckelmann, I.; Hökelmann, A. Effects of Different Exercise Interventions on Heart Rate Variability and Cardiovascular Health Factors in Older Adults: A Systematic Review. Eur. Rev. Aging Phys. Act. 2021, 18, 24. [CrossRef]
- Rocha, A.S.L.; de Barros Siqueira, V.; Maduro, P.A.; Batista, L.D.S.P.; Neves, V.R.; Gambassi, B.B.; Schwingel, P.A. Do Older People with Poor Sleep Quality Have Worse Cardiac Autonomic Control? Can. Geriatr. J. 2023, 26, 276–282. [CrossRef]
- Sato, M.; Betriana, F.; Tanioka, R.; Osaka, K.; Tanioka, T.; Schoenhofer, S. Balance of Autonomic Nervous Activity, Exercise, and Sleep Status in Older Adults: A Review of the Literature. Int. J. Environ. Res. Public Health 2021, 18, 12896. [CrossRef]
- Hirshkowitz, M.; Whiton, K.; Albert, S.M.; Alessi, C.; Bruni, O.; DonCarlos, L.; Hazen, N.; Herman, J.; Adams Hillard, P.J.; Katz, E.S.; et al. National Sleep Foundation’s updated sleep duration recommendations: Final report. Sleep Health 2015, 1, 233–243. [CrossRef]
- Ohayon, M.M.; Carskadon, M.A.; Guilleminault, C.; Vitiello, M.V. Meta-analysis of quantitative sleep parameters from childhood to old age in healthy individuals: Developing normative sleep values across the human lifespan. Sleep 2004, 27, 1255–1273. [CrossRef]
- Li, J.; Vitiello, M.V.; Gooneratne, N.S. Sleep in Normal Aging. Sleep Med. Clin. 2022, 17, 161–171. [CrossRef]
- Chaput, J.P.; Dutil, C.; Featherstone, R.; Ross, R.; Giangregorio, L.; Saunders, T.J.; Janssen, I.; Poitras, V.J.; Kho, M.E.; Ross-White, A.; et al. Sleep timing, sleep consistency, and health in adults: A systematic review. Appl. Physiol. Nutr. Metab. 2020, 45 (Suppl. 2), S232–S247. [CrossRef]
- Gulia, K.K.; Kumar, V.M. Sleep disorders in the elderly: A growing challenge. Psychogeriatrics 2018, 18, 155–165. [CrossRef]
- Chaput, J.P.; Dutil, C.; Featherstone, R.; Ross, R.; Giangregorio, L.; Saunders, T.J.; Janssen, I.; Poitras, V.J.; Kho, M.E.; Ross-White, A.; et al. Sleep duration and health in adults: An overview of systematic reviews. Appl. Physiol. Nutr. Metab. 2020, 45 (Suppl. 2), S218–S231. [CrossRef]
- Tian, L.; Ding, P.; Kuang, X.; Ai, W.; Shi, H. The association between sleep duration trajectories and successful aging: A population-based cohort study. BMC Public Health 2024, 24, 3029. [CrossRef]
- Bah, T.M.; Goodman, J.; Iliff, J.J. Sleep as a therapeutic target in the aging brain. Neurotherapeutics 2019, 16, 554–568. [CrossRef]
- Foley, D.; Ancoli-Israel, S.; Britz, P.; Walsh, J. Sleep disturbances and chronic disease in older adults: Results of the 2003 National Sleep Foundation Sleep in America Survey. J. Psychosom. Res. 2004, 56, 497–502. [CrossRef]
Figure 1.
Example of applying the supine position detection algorithm.
Disclaimer/Publisher’s Note: The statements, opinions and data contained in all publications are solely those of the individual author(s) and contributor(s) and not of MDPI and/or the editor(s). MDPI and/or the editor(s) disclaim responsibility for any injury to people or property resulting from any ideas, methods, instructions or products referred to in the content. |
© 2025 by the authors. Licensee MDPI, Basel, Switzerland. This article is an open access article distributed under the terms and conditions of the Creative Commons Attribution (CC BY) license (http://creativecommons.org/licenses/by/4.0/).
Copyright: This open access article is published under a Creative Commons CC BY 4.0 license, which permit the free download, distribution, and reuse, provided that the author and preprint are cited in any reuse.


