
Submitted:
06 February 2025
Posted:
07 February 2025
You are already at the latest version
Abstract
Background/objectives: The functional threshold power (FTP) 20-min test (FTP20) is popular amongst cyclists and coaches due to the theory it can predict the power output that can be sustained for 60-mins. However, little is known in terms of the reliability and validity of this construct, therefore the aim of this study was to assess the reliability of the FTP20 test and the construct validity of this test to predict 60-min power. Methods: Twenty-two male trained cyclists (age = 32 ± 10 years, body mass (BM) = 77.2 ± 6.8 kg, maximal oxygen uptake (V̇O2max) = 59.4 ± 5.6 ml.kg-1.min-1 BM) completed four trials consisting of a V̇O2max test, a familiarisation trial of the FTP20, two experimental FTP20 tests, and a time to volitional exhaustion (TLIM) at 95% FTP20. Results: The repeatability for mean power output (MPO) during the FTP20 was excellent (r = 0.94, CI 0.82, 0.98, p<0.001). Mean TLIM (at 95% FTP20) was 42 ± 17-min, with six participants within 10-min of the 60-min suggested threshold. Conclusions: These results suggest that the FTP20 is reliable, however it does not predict 60-min power with a high level of validity. Future research should explore adapting the calculation of FTP whereby the intensity may be lowered (i.e., 80-90% MPO of FTP20), particularly as most participants’ TLIM was far below the suggested 60-min time frame.
Keywords:
Threshold
; FTP
; Training
; Physiology
; Exercise Performance
; Time to Exhaustion
1. Introduction
In recent years, the adoption of cycling power meters has become more prevalent, with many athletes using them to evaluate both training and race performances [1]. It was first proposed by Allen and Coggan [2] that power meters could serve as a practical method to determine a field-based equivalent to the maximal lactate steady-state (MLSS), thereby proposing the notion of a functional threshold power (FTP), which is defined as the maximal mean power output (MPO) that can be sustained for ~60 mins in a ‘quasi-steady state’. Although it’s use is highly contentious, FTP has now become the most common method of exercise prescription and training monitoring purposes by athletes, coaches, and online platforms (TrainingPeaks, Intervals.ICU, Zwift etc.). When the construct of FTP was originally proposed, the testing method required athletes to complete a 60-min time trial as this was shown to predict actual competitive (40 km) performance more appropriately than a range of other predictors such as maximum oxygen uptake (V̇O2max), skeletal muscle capillarization, fibre type, and mitochondrial content [3].
More recently, a condensed version of the FTP test has become popular that only requires cyclists to perform a 20-min time trial (FTP20) [2]. Consequently, this offers significant practical benefits to the traditional 60-min time trial (TT) due to the reduced time to complete, and reduction in post-exercise fatigue that may interfere with other training sessions [2]. Due to the shorter duration of FTP20, 95% of mean power output (MPO) achieved during the FTP20 is considered as the cyclist’s estimation of FTP and this intensity should be sustainable for approximately 60-mins as demonstrated by Allen and Coggan [2]. Whilst this may potentially be a credible method of estimation, there is a paucity of literature to suggest this method is reliable and valid to predict the highest power that a cyclist can maintain for 60-mins. Cyclists and coaches therefore, run the risk of using FTP to determine and evaluate exercise training zones inappropriately, which could subsequently have negative consequences on training (i.e., session intensity) and competitive performance (i.e., pacing strategies).
Despite these potential negative consequences, there are a considerable number of methods to determine FTP and set threshold zones are available, including commercially available devices and software [4]. This is of concern if the appropriate scientific evaluation has either not been conducted or does not support the use of this method. Several studies have reported the reliability of the of FTP20 [5,6,7,8]. In studies using elite athletes, MacInnis et al. [8] reported that the reliability of a 20-min cycling TT displayed excellent reliability (CV% = 1.4; Intraclass correlation coefficient, ICC = 0.99, p<0.001) with a technical error of measurement (TEM) of 4.6 W. In the same study, linear regression analysis also compared the relationship between FTP20 and 60-min TT MPO and found this method was suitable to predict FTP (r = 0.92, p < 0.001), suggesting the test is suitable to predict FTP. Nonetheless, this study was conducted in a small sample (n = 8) and within a highly trained/elite cohort of cyclists (V̇O2max = 65.1 - 71.1 ± 4.7 ml.kg-1.min-1). Cyclists of this trained status are not only known to be able to produce more repeatable efforts compared to lesser trained individuals [9], but they are also likely to be able to maintain power output at a higher percentage of peak power output (PPO) and have higher absolute critical power [10]. Conversely, the most likely group to perform such predictive tests are recreational athletes, due to interactions with platforms such as Zwift™ which has more than 3 million subscribers [11] and offers FTP20 in order to prescribe exercise intensity domains. Whilst the FTP20 performed using online platforms such as Zwift™ have been shown to be repeatable [12], Borszcz et al. [5] reported that cyclists of the sub-elite training status (V̇O2max = 59.4 ± 5.9 ml∙kg-1∙min-1) were only able to sustain FTP20 for 50.9 ± 15.7 minutes, which suggests that the validity of the FTP20 to predict 60 min maximal power output is questionable. In addition, the authors used a fixed workload, which does not reflect the quasi-steady state nature of real-world cycling. The purpose of this study therefore was to assess the reliability of the condensed FTP20 test and to assess the construct validity of FTP20 to predict 60-min max power output.
2. Methods
Participants
Twenty-two male trained cyclists completed the study (age = 32 ± 9 years, body mass (BM) = 76.7 ± 6.3 kg, V̇O2max = 59.4 ± 5.6 ml.kg-1.min-1 BM, PPO = 366 ± 38 W) [13]. All participants were frequent cyclists with a minimum of two sessions per week, and some were members of clubs registered with British Cycling (n = 9/22). All participants were aware of FTP, however, only five participants had used it previously to inform training. The study had institutional ethical approval (1680 /R(B) /2018 /Apr /HELS FAEC) and informed consent was obtained from all subjects involved in the study. The study was conducted in accordance with the decleration of Helsinki.
Study Overview
Participants visited the laboratory on five separate occasions at approximately the same time of day (± 1-h) and in a euhydrated state. In visit one, an incremental ramp test to assess maximal oxygen consumption (V̇O2max) and PPO was completed. Participants then completed a further four trials, whereby a full familiarisation trial of the 20 min TT was completed (FTP20), followed by two experimental trials of the same protocol. Finally, on a separate occasion a time to volitional exhaustion (TLIM) test at 95% of MPO of the FTP20 test was completed. The FTP was determined by calculating the MPO achieved during the two FTP20 tests. Trials were separated by a minimum of 3 days and maximum of 7 days and completed within a five-week period. Nutritional intake was also recorded 24-h prior to each trial, and participants were required to replicate this intake for each trial. Participants were encouraged to prepare as they normally would for an intense training ride or race. Other pre-testing dietary controls included abstinence from alcohol and any other acutely ingested ergogenic supplements or compound (i.e., caffeine, nitrates) for the 24-h prior to each trial.
Incremental Ramp Test Procedure
Expired gas samples were determined using an online breath-by-breath gas analyser (Metalyzer 3B, Cortex, Germany) continuously for rate of oxygen consumption (V̇O2), expired carbon dioxide (V̇CO2), and respiratory exchange ratio (RER). Data were averaged over the highest rolling 30 s period of exercise to determine V̇O2max. The protocol was conducted on an electromagnetically braked cycle ergometer (Excalibur Sport, Lode, Netherlands) as per a previously described method [14]. Heart rate (HR) (Polar, FT1, Finland) and rating of perceived exertion (RPE) (6-20 scale) [15] were monitored every 1-min, and blood lactate (BLa) was recorded pre- and post-exercise. All participants achieved the set criteria of a valid maximal test as outlined by Bird and Davison [16].
FTP20 Procedure
All trials were performed on a cycle ergometer (Wattbike Pro, Nottingham, UK) in the participants preferred seat geometry, which was recorded and replicated for each trial. This cycle ergometer has previously been shown to be valid and reliable at the power outputs used in this study [17]. Participants were permitted to use their preferred cycling attire and pedals, and these were kept consistent for all trials. Participants were asked to treat each FTP20 as a race, and to complete as much work within the given time. They were also blinded from all available variables except for time elapsed and cadence. Prior to each trial, a self-selected warm-up was conducted, and this was replicated for each subsequent trial. This was selected due to pilot work revealing athletes (n = 25) would use their own warm-up prior to the FTP test, rather than the recommended one by Allen and Coggan [2].
In the familiarisation trial, measures for RPE for overall body exertion (RPE-O), legs (RPE-L), and HR were measured at rest and every 5-min of the exercise. In experimental trials, procedures were identical with the addition of a fingertip capillary blood sample collected every 5 min for BLa and expired gas samples were collected for 1 min every 5 min for V̇O2, V̇CO2, and RER. Consistent verbal encouragement was provided during each trial, and all trials were conducted in a temperature and humidity-controlled laboratory (18 ± 1◦C; 40 ± 5%).
Time to Volitional Exhaustion Test Procedure
Participants were required to cycle at 95% of MPO based on the FTP20 tests, which was determined as the intensity they should be able to sustain for 60-mins. A self-selected cadence was used (range 70-100 r.min-1) and this was kept consistent throughout the trial until volition exhaustion (TLIM). If MPO dropped 1% below FTP, the participants were given one warning and were required to increase their power back to within 1% of FTP. On the second occurrence the test was terminated. This small degree of freedom was given to participants due to the quasi-steady state nature of cycling in the real world [5], therefore a fixed power output was avoided. The participant was blinded to all available variables except for time elapsed, mean power output and cadence (rev.min-1). Participants were allowed to ingest fluids ad libitum that could contain carbohydrates, as per previous research [8]. This was permitted as this would better reflect the nutritional strategy of a cyclist during a 60 min TT. During the TLIM, respiratory measures for V̇O2, V̇CO2, RER were measured every 10 min, alongside lactate, HR, RPE-O, and RPE-L. All measurements were repeated immediately post-exercise upon the participant reaching TLIM.
Statistical Analysis
Normality was checked using standard geographical methods and the Shapiro Wilk test. To assess differences in MPO between the FTP20 tests, a paired t test was used. To assess physiological or perceptual responses across the FTP20 tests (every 5 min) a two-way repeated measures ANOVA was used with Bonferroni post-hoc pairwise comparisons for HR, V̇O2, V̇CO2, RER, lactate, RPE-O, and RPE-L. Partial eta squared (pƞ2) effect size was reported and interpreted as small (0.01), medium (0.06) or large (0.14) [18]. To assess reliability, Intraclass Correlation Coefficient (ICC) were calculated using a two-way mixed effects model, with consistency and average measures used for interpretation. The r value is reported, along with confidence intervals of the ICC estimate and significance. Interpretation was decided by the r value, with values less than 0.5, between 0.5 and 0.75, between 0.75 and 0.9, and greater than 0.90 are indicative of poor, moderate, good, and excellent reliability, respectively [19]. Significance was accepted at p<0.05. Mean and standard deviation (±) is reported unless otherwise stated. Statistical procedures were completed using Statistical Package for the Social Sciences (SPSS) (V28, IBM, Chicago, USA).
3. Results
Mean power for the two FTP20 tests displayed excellent reliability (r = 0.94, CI 0.82, 0.98, p<0.001). The mean power difference between the first and second FTP20 was 5 W (271 ± 30 vs. 276 ± 26 W; p = 0.020; Figure 1). Blood lactate displayed excellent reliability (r = 0.92, CI 0.86, 0.96, p<0.001), with no differences at any time point (p = 0.516, ɳ2 = 0.038). The repeatability of V̇O2 was good (r = 0.86, CI 0.69, 0.95, p<0.001), and no significant differences at any time point were observed (p = 0.812, ɳ2 = 0.035). A similar level of reliability and difference was seen for V̇CO2 (r = 0.89, CI 0.76, 0.97, p<0.001; p = 0.757, ɳ2 = 0.045), and RER displayed moderate reliability (r = 0.52, CI -0.03, 0.84, p = 0.029) with no significant differences at any time point (p = 0.135, ɳ2 = 0.180). Heart rate displayed excellent reliability (r = 0.94, CI 0.88, 0.97, p<0.001), with no significant differences between the two FTP20’s (p = 0.686, ɳ2 = 0.016). Perceptual responses for RPE-O displayed excellent reliability (r = 0.941, 0.89, 0.97, p <0.001) with no differences between the FTP20 tests (p = 0.918, ɳ2 = 0.008). Similarly, RPE-L displayed excellent reliability (r = 0.916, 0.85, 0.96, p <0.001) and no significant differences between the FTP20’s (p = 0.277, ɳ2 = 0.059; Table 1).
The TLIM was highly variable (CV: 41%), with a median of 41 min and a range between 13 to 74 minutes (Figure 2). The mean TLIM to exhaustion was 42 ± 17 min. Time course mean changes in HR, V̇O2, V̇CO2, RER, lactate, RPE-L, and RPE-O are depicted in Table 2. Only 6/22 participants were within 10-minutes of the 60-min target, and many were at least 20-min below (9/22).
4. Discussion
This study aimed to assess the reliability and construct validity of the FTP20 to predict 60-min power in a group of recreational cyclists. This study reports that whilst FTP20 displays excellent reliability, the construct validity of this test to predict 60-min power output is poor. Based on the excellent reliability of the FTP20 test, this could be used as a method to detect adaptations from training schedules, particularly given the practical nature of the test. Many participants were far below the 60-min predicted TLIM and based on no participants achieving 20-mins above this threshold, it suggests the calculated FTP (95% of MPO from a FTP20) is too intense for recreational cyclists to sustain for 60-mins. This is likely to be a result of gross mechanical efficiency differences, which have previously been reported between different levels of trained cyclists [20]. Consequently, coaches and cyclists need to be cautious when employing this type of test to assist with creating thresholds for efforts around 60-mins. Future research should look to investigate the percentage of FTP20 which most appropriately represents a 60-min effort and assess if this further improves the construct validity of the test.
The reliability of FTP20 was excellent in the current study, which suggests it could be a useful tool for performance analysis [6,7,8] and determining the effectiveness of training and intervention strategies. The difference between the two trials was less than 2% and only one participant reported an intra-individual CV of >5% (5.6%) in the current study. These findings corroborate with multiple studies such as MacInnis et al. [8] who reported similar excellent reliability, albeit in a small sample size, and McGrath et al. [6] who reported an ICC of 0.98, and a mean bias of 2 W in limits of agreement (LOA) analysis. The reliability was slightly stronger in MacInnis et al. [8] and McGrath et al. [6] compared to the present study, however, this is likely due to the higher training status of participants who generally can produce more repeatable results [9]. Nonetheless, the current study adds novelty in that it shows excellent reliability in a much larger sample size than MacInnis et al. [8] (n = 22 vs. 8) and in recreational cyclists, as opposed to elite cyclists. The current study is therefore more generalisable to a larger group of cyclists, many of whom use FTP to influence their training through commercially available software that is more accessible than laboratory testing. It is suggested based on the study’s findings that FTP20 could be used to detect changes that have occurred from training, rather than to predict any performance capability beyond 20-mins.
The findings of the present study, however, question the construct validity of FTP20 testing in that this test can predict 60-min maximal power output in recreational cyclists [2]. Most of the participants in this study could not reach the 60-min threshold, suggesting that the intensity of FTP20 predicts is too high. This agrees with findings from Borszcz et al. [5] who reported similar TLIM results to the current study (42 ± 17 min vs. 51 ± 16 min). In contrast, McGrath et al. [6] reported that 17 out of 19 participants were able to reach the 60-min timepoint at FTP20. Reasons for this might have been due to the training status of participant or the methodological approach to the exhaustions test in each respective study. Specifically, the current study and Borszcz et al. [5] recruited participants of a similar training status, whereas McGrath et al. [6] had participants with a higher training status. This might explain why participants in the McGrath et al. [6] study could reach the 60 min threshold as they would be more accustomed to these types of efforts. Moreover, McGrath et al. [6] opted to stop participants once 60-mins had been reached, therefore it is unclear whether 17 of the 19 participants who completed 60-mins could have sustained FTP for a longer duration. In addition, the variance in power output for the 60-min TT has not been reported and therefore could have been higher than the 1% degradation in performance used in this study as justification for termination of the testing protocol. It is clear from the current study nonetheless, that in lesser trained individuals the 95% of MPO is too intense, and therefore future research may wish to explore the use of 90% or 85% of MPO to increase the validity of this construct for recreational cyclists.
A limitation of this study is that the recommended warm-up by Allen and Coggan [2] was not used, as it was preferred that a self-selected warm-up was conducted. This could have impacted the validity, and it is a topic of discussion anecdotally amongst cyclists and coaches that following the warm-up suggested by Allen and Coggan [2] might improve the validity of the ability to sustain FTP20 for 60-mins. However, in pilot work participants (n = 25) highlighted that they would still opt for their own warm-up when attempting the FTP20. Moreover, in a study using the recommended warm up, a 60-min TTE was still highly variable [5]. It was therefore appropriate to assess the validity of this test in the current study using real world cyclist’s warm-up strategies. A further limitation was the lack of second TLIM test, as this would have assessed whether practice/familiarisation to a 60-min TT would have improved the validity. This could have been suitable for those that were within 10-min of the 60-min threshold, as this could be, at least theoretically, variation that is eliminated through more attempts at the protocol. Conversely, this would be the case for only 6/22 participants in the current study, therefore for most this would likely not be possible.
5. Conclusions
The current study reports that the construct validity of the FTP20 test to predict 60-min power is poor, and coaches and male cyclists should exercise caution when using such forms of testing to develop exercise prescription for certain cycling populations. A positive finding of the study is that a 20-min TT test is reliable so this test could be used to assess training adaptations. It could also be used for training prescription purposes and monitoring of cyclists [5]. Future research should attempt to assess whether a lower threshold (i.e., FTP20 – 10% or 15% MPO) leads to an improved ability for the FTP20 to predict 60-min TT performance more suitably in recreational cyclists.
Supplementary Materials
Not applicable
Author Contributions
Conceptualization, LAG; methodology, LAG, AS.; formal analysis, LAG, AS, BD; investigating, LAG, JW, GD, SS, AW, AS, BD, DB; data curation, LAG, JW, GD, SS, AW, BD, DB.; writing—original draft preparation, LAG; writing—review and editing, JW, GD, SS, AW, AS, BD, DB; supervision, LAG; project administration, LAG, DB, AW, BD; All authors have read and agreed to the published version of the manuscript.
Funding
This research received no external funding
Institutional Review Board Statement
The study was conducted in accordance with the Declaration of Helsinki, and approved by the Institutional Review Board of Birmingham City University ( (1680 /R(B) /2018 /Apr /HELS FAEC) (April, 2018)
Informed Consent Statement
Informed consent was obtained from all subjects involved in the study.
Data Availability Statement
Data available upon reasonable request to the corresponding author.
Acknowledgments
We thank the participants for their hard efforts in this work.
Conflicts of Interest
The authors declare no conflicts of interest.
Abbreviations
The following abbreviations are used in this manuscript:
| FTP | Functional Threshold Power |
| FTP20 | 20-min test |
| BM | Body mass |
| V̇O2max | Maximal oxygen uptake |
| TLIM | Time to volitional exhaustion |
| MPO | Mean power output |
| MLSS | Maximal lactate steady state |
| TT | Time trial |
| CV | Coefficient of variation |
| TEM | Technical error or measure |
| PPO | Peak power output |
| V̇O2 | rate of oxygen consumption |
| V̇CO2 | expired carbon dioxide |
| RER | Respiratory exchange ratio |
| HR | Hear rate |
| RPE | Rate of perceived exertion |
| BLa | Blood lactate |
| ICC | Intraclass correlation co-efficient |
| ANOVA | Analysis of variance |
References
- Passfield, L. , Hopker, J. G., Jobson, S., Friel, D., & Zabala, M. (2017). Knowledge is power: Issues of measuring training and performance in cycling. J Sports Sci, 35, 1426–1434. [CrossRef]
- Allen, H. , and Coggan, A. (2010) Training and Racing with a Power Meter, 2nd ed.; Velo Press: Boulder, CO, USA.
- Coyle, E. F. , Feltner, M. E., & Kautz, S. A. (1992). Physiological and Biomechanical Factors Associated with Elite Endurance Cycling Performance. Med Sci Sports Exerc, 23, 93–107. [CrossRef]
- Mackey, J and Horner, K. (2021). What is known about the FTP20 test related to cycling? A scoping review. J Sports Sci, 39, 2735–2745. [CrossRef]
- Borszcz, F. K. , Tramontin, A. F., Bossi, A. H., Carminatti, L. J., & Costa, V. P. (2018). Functional threshold power in cyclists: validity of the concept and physiological responses. Int J Sports Med, 39, 737–742. [CrossRef]
- McGrath, E. , Mahony, N., Fleming, N., & Donne, B. (2019). Is the FTP test a reliable, reproducible and functional assessment tool in highly-trained athletes? Int J Sports Sci Coach, 12, 1334. [CrossRef]
- Lillo-Beviá, J. R. , Courel-Ibáñez, J., Cerezuela-Espejo, V., Morán-Navarro, R., Martínez-Cava, A., & Pallarés, J. G. (2022). Is the functional threshold power a valid metric to estimate the maximal lactate steady state in cyclists? J Strength Cond Res, 36, 167–173. [CrossRef]
- MacInnis, M. J. , Thomas, A. C., & Phillips, S. M. (2019). The reliability of 4-min and 20-min time trials and their relationships to functional threshold power in trained cyclists. Int J Sports Physiol Perform, 14, 38–45. [CrossRef]
- Currell, K. , and Jeukendrup, A. E. (2008). Validity, reliability and sensitivity of measures of sporting performance. Sports Med 38, 297–316. [CrossRef] [PubMed]
- Leo, P. , Simon, D., Hovorka, M., Lawley, J., Mujika, I. (2022). Elite versus non-elite cyclist – Stepping up to the international/elite ranks from U23 cycling. J Sports Sci, 40, 1874–1884. [CrossRef]
- Reed, R. (2021). Do you even Zwift? The indoor cycling platform is having a moment. Forbes (Feb 17, 2021). Available at https://www.forbes.com/sites/robreed/2021/02/17/do-you-even-zwift-the-indoor-cycing-platform-is-having-a-moment/?sh=644014073f86. Accessed 02/012/2022.
- Matta, G. , Edwards, A., Roelands, B., Hettinga,F., Hurst, P. (2022). Reproducibility of 20-min time trial performance on a virtual cycling platform. Int J Sports Med, 43, 1190–1195. [CrossRef]
- McKay, A. K. , Stellingwerff, T., Smith, E. S., Martin, D. T., Mujika, I., Goosey-Tolfrey, V. L.,... & Burke, L. M. (2021). Defining training and performance caliber: a participant classification framework. Int J Sports Physiol Perform, 17, 317–331. [CrossRef]
- Gough, L. A. , Deb, S. K., Sparks, A. S., & McNaughton, L. R. (2017). The reproducibility of blood acid base responses in male collegiate athletes following individualised doses of sodium bicarbonate: a randomised controlled crossover study. Sports Med, 47, 2117–2127. [CrossRef]
- Borg, G. (1982). Ratings of perceived exertion and heart rates during short-term cycle exercise and their use in a new cycling strength test. Int J Sports Med, 3, 153–158. [CrossRef]
- Bird, S. R. , & Davison, R. (1997). BASES physiological testing guidelines. London: Routledge, UK.
- Hopker, J. , Myers, S., Jobson, S. A., Bruce, W., & Passfield, L. (2010). Validity and reliability of the Wattbike cycle ergometer. Int J Sports Med. 31, 731–736. [CrossRef] [PubMed]
- Cohen, J. (1988). Statistical Power Analysis for the Behavioral Sciences. L. Erlbaum Associates.
- Koo, T. K. , & Li, M. Y. (2016). A guideline of selecting and reporting intraclass correlation coefficients for reliability research. J Chiropr Med. 15(2), 155–163. [CrossRef] [PubMed]
- Sallet P, Mathieu R, Fenech G, Baverel G. (2006). Physiological differences of elite and professional road cyclists related to competition level and rider specialization. J Sports Med Phys Fitness, 46, 361–365. [CrossRef]
Figure 1.
Power output (watts) for FTP1 and FTP2. Bars represent mean (±SD) and lines represent individual data. No significant difference between trials (p>0.05).
Figure 1.
Power output (watts) for FTP1 and FTP2. Bars represent mean (±SD) and lines represent individual data. No significant difference between trials (p>0.05).
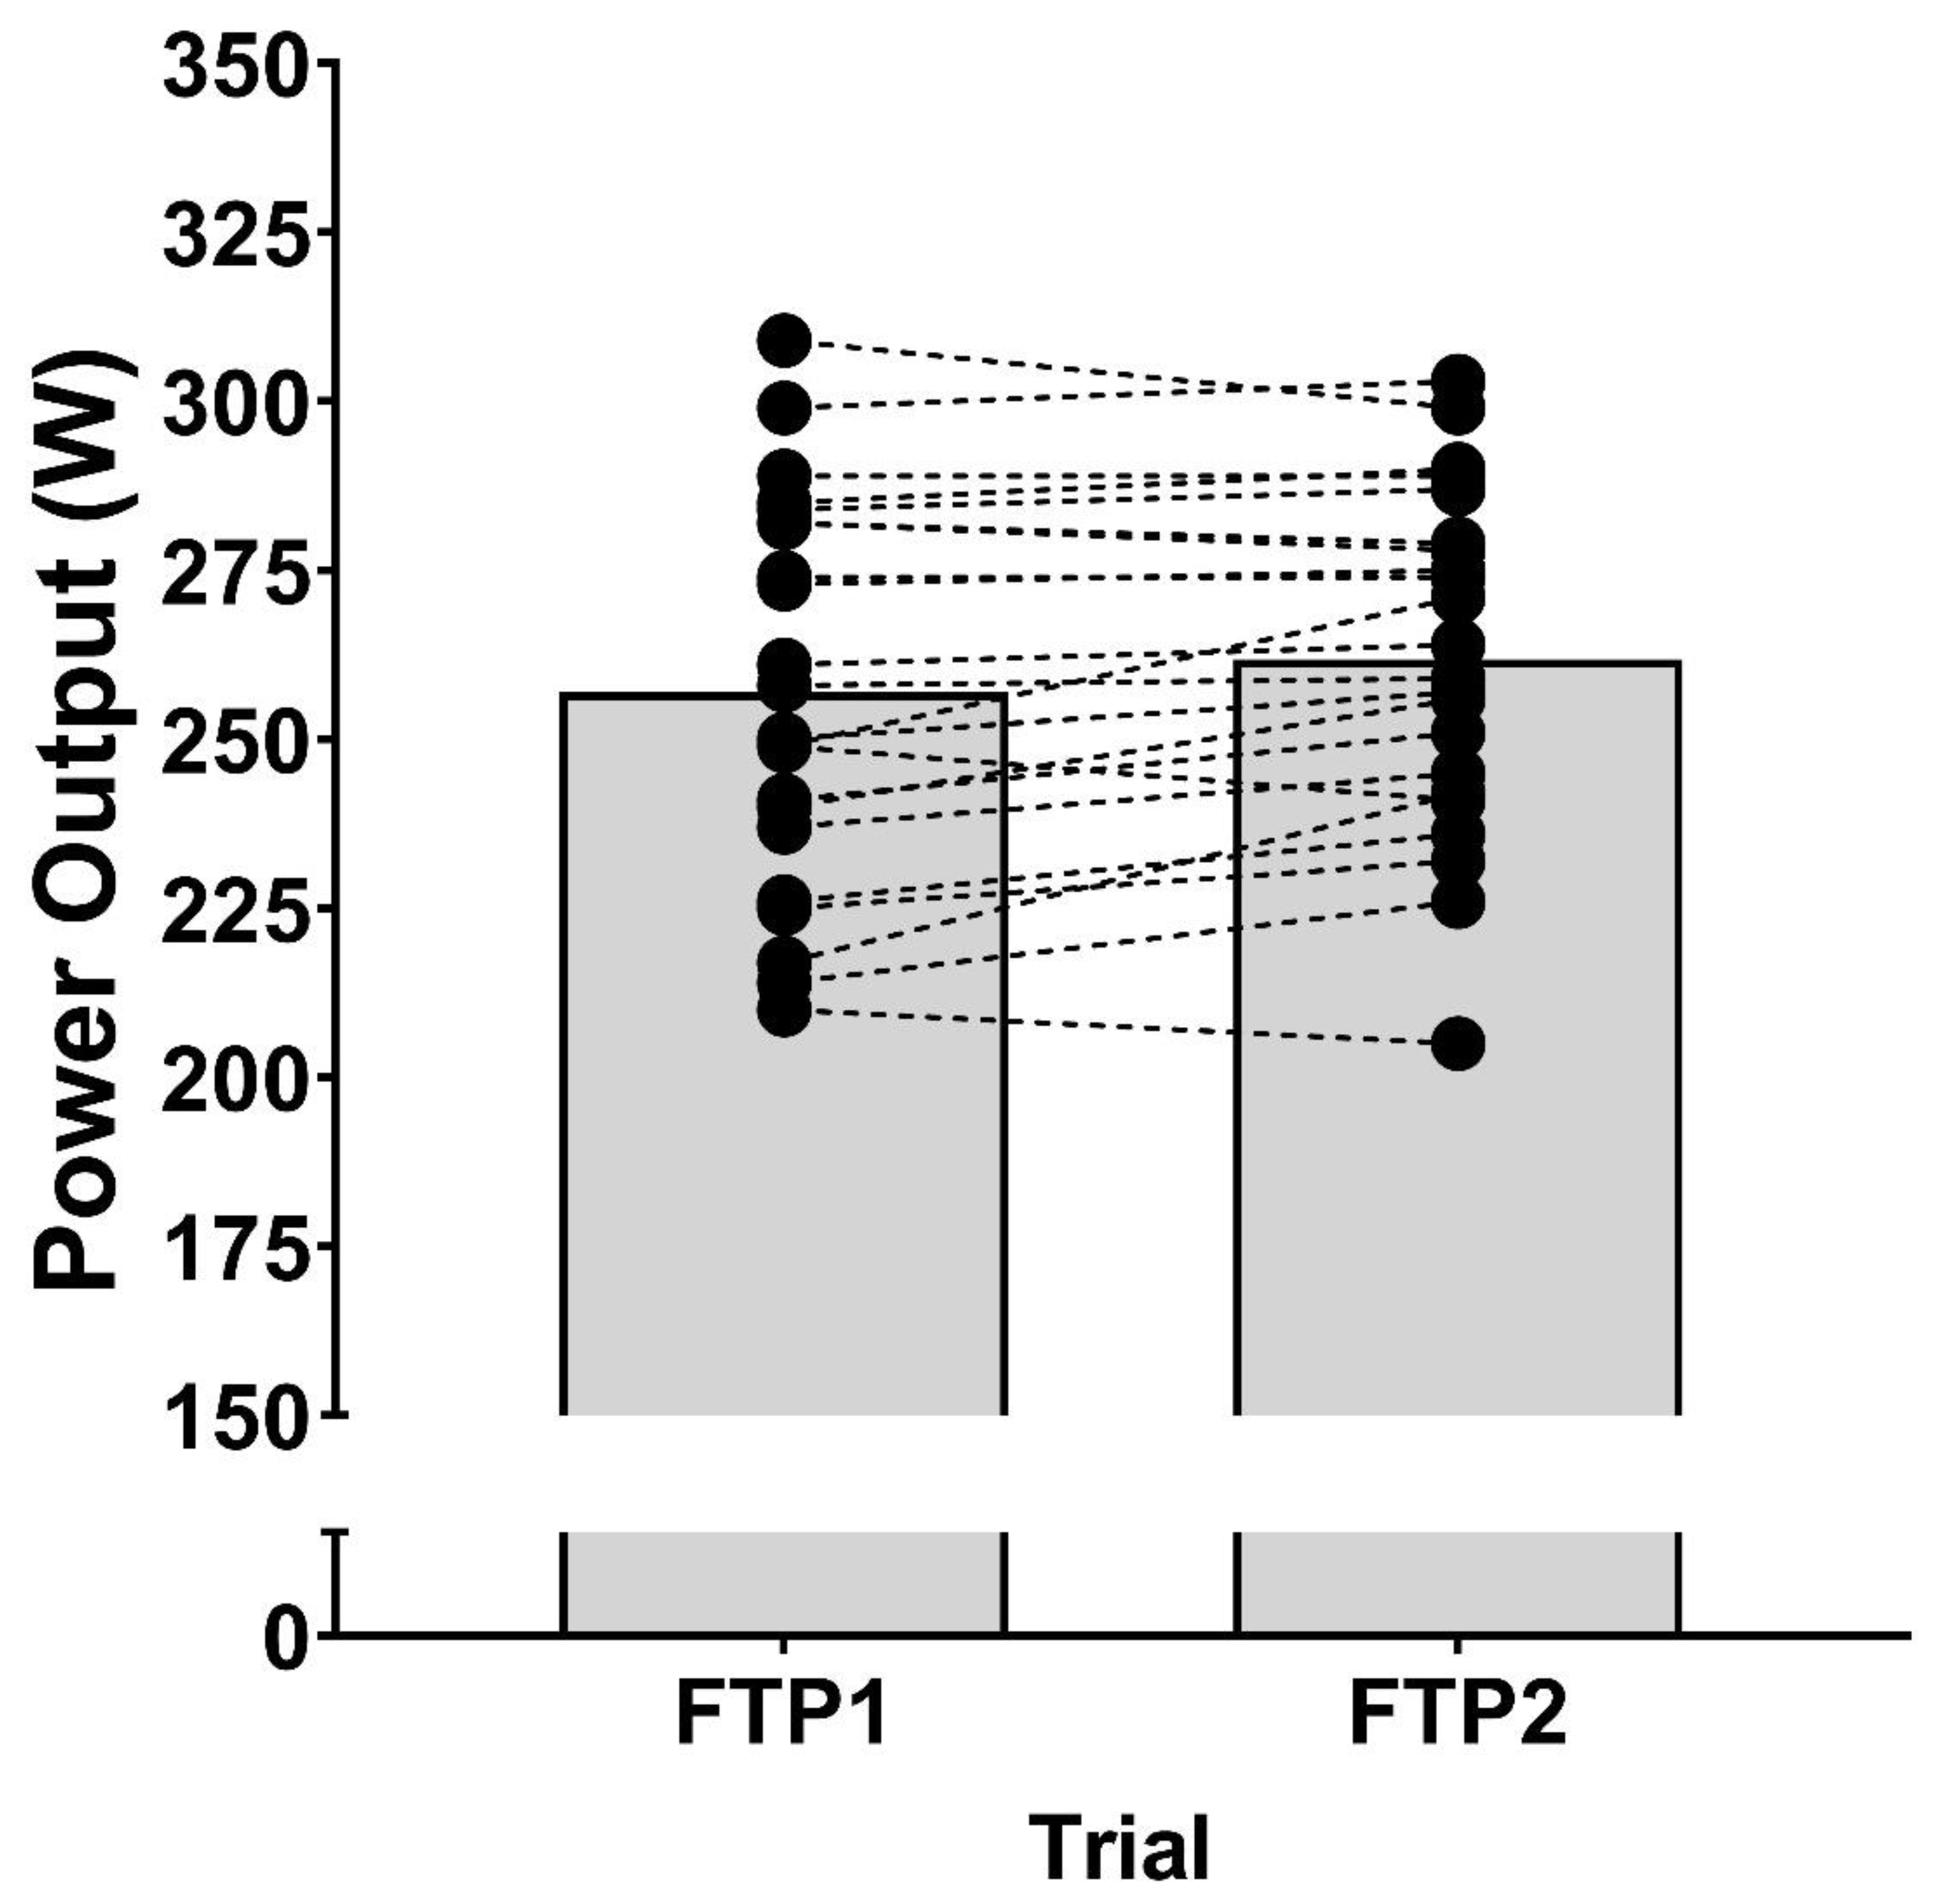
Figure 2.
Time to volition tolerance (TLIM). Bar represents mean (±SD) and solid dots represent individual data.
Figure 2.
Time to volition tolerance (TLIM). Bar represents mean (±SD) and solid dots represent individual data.
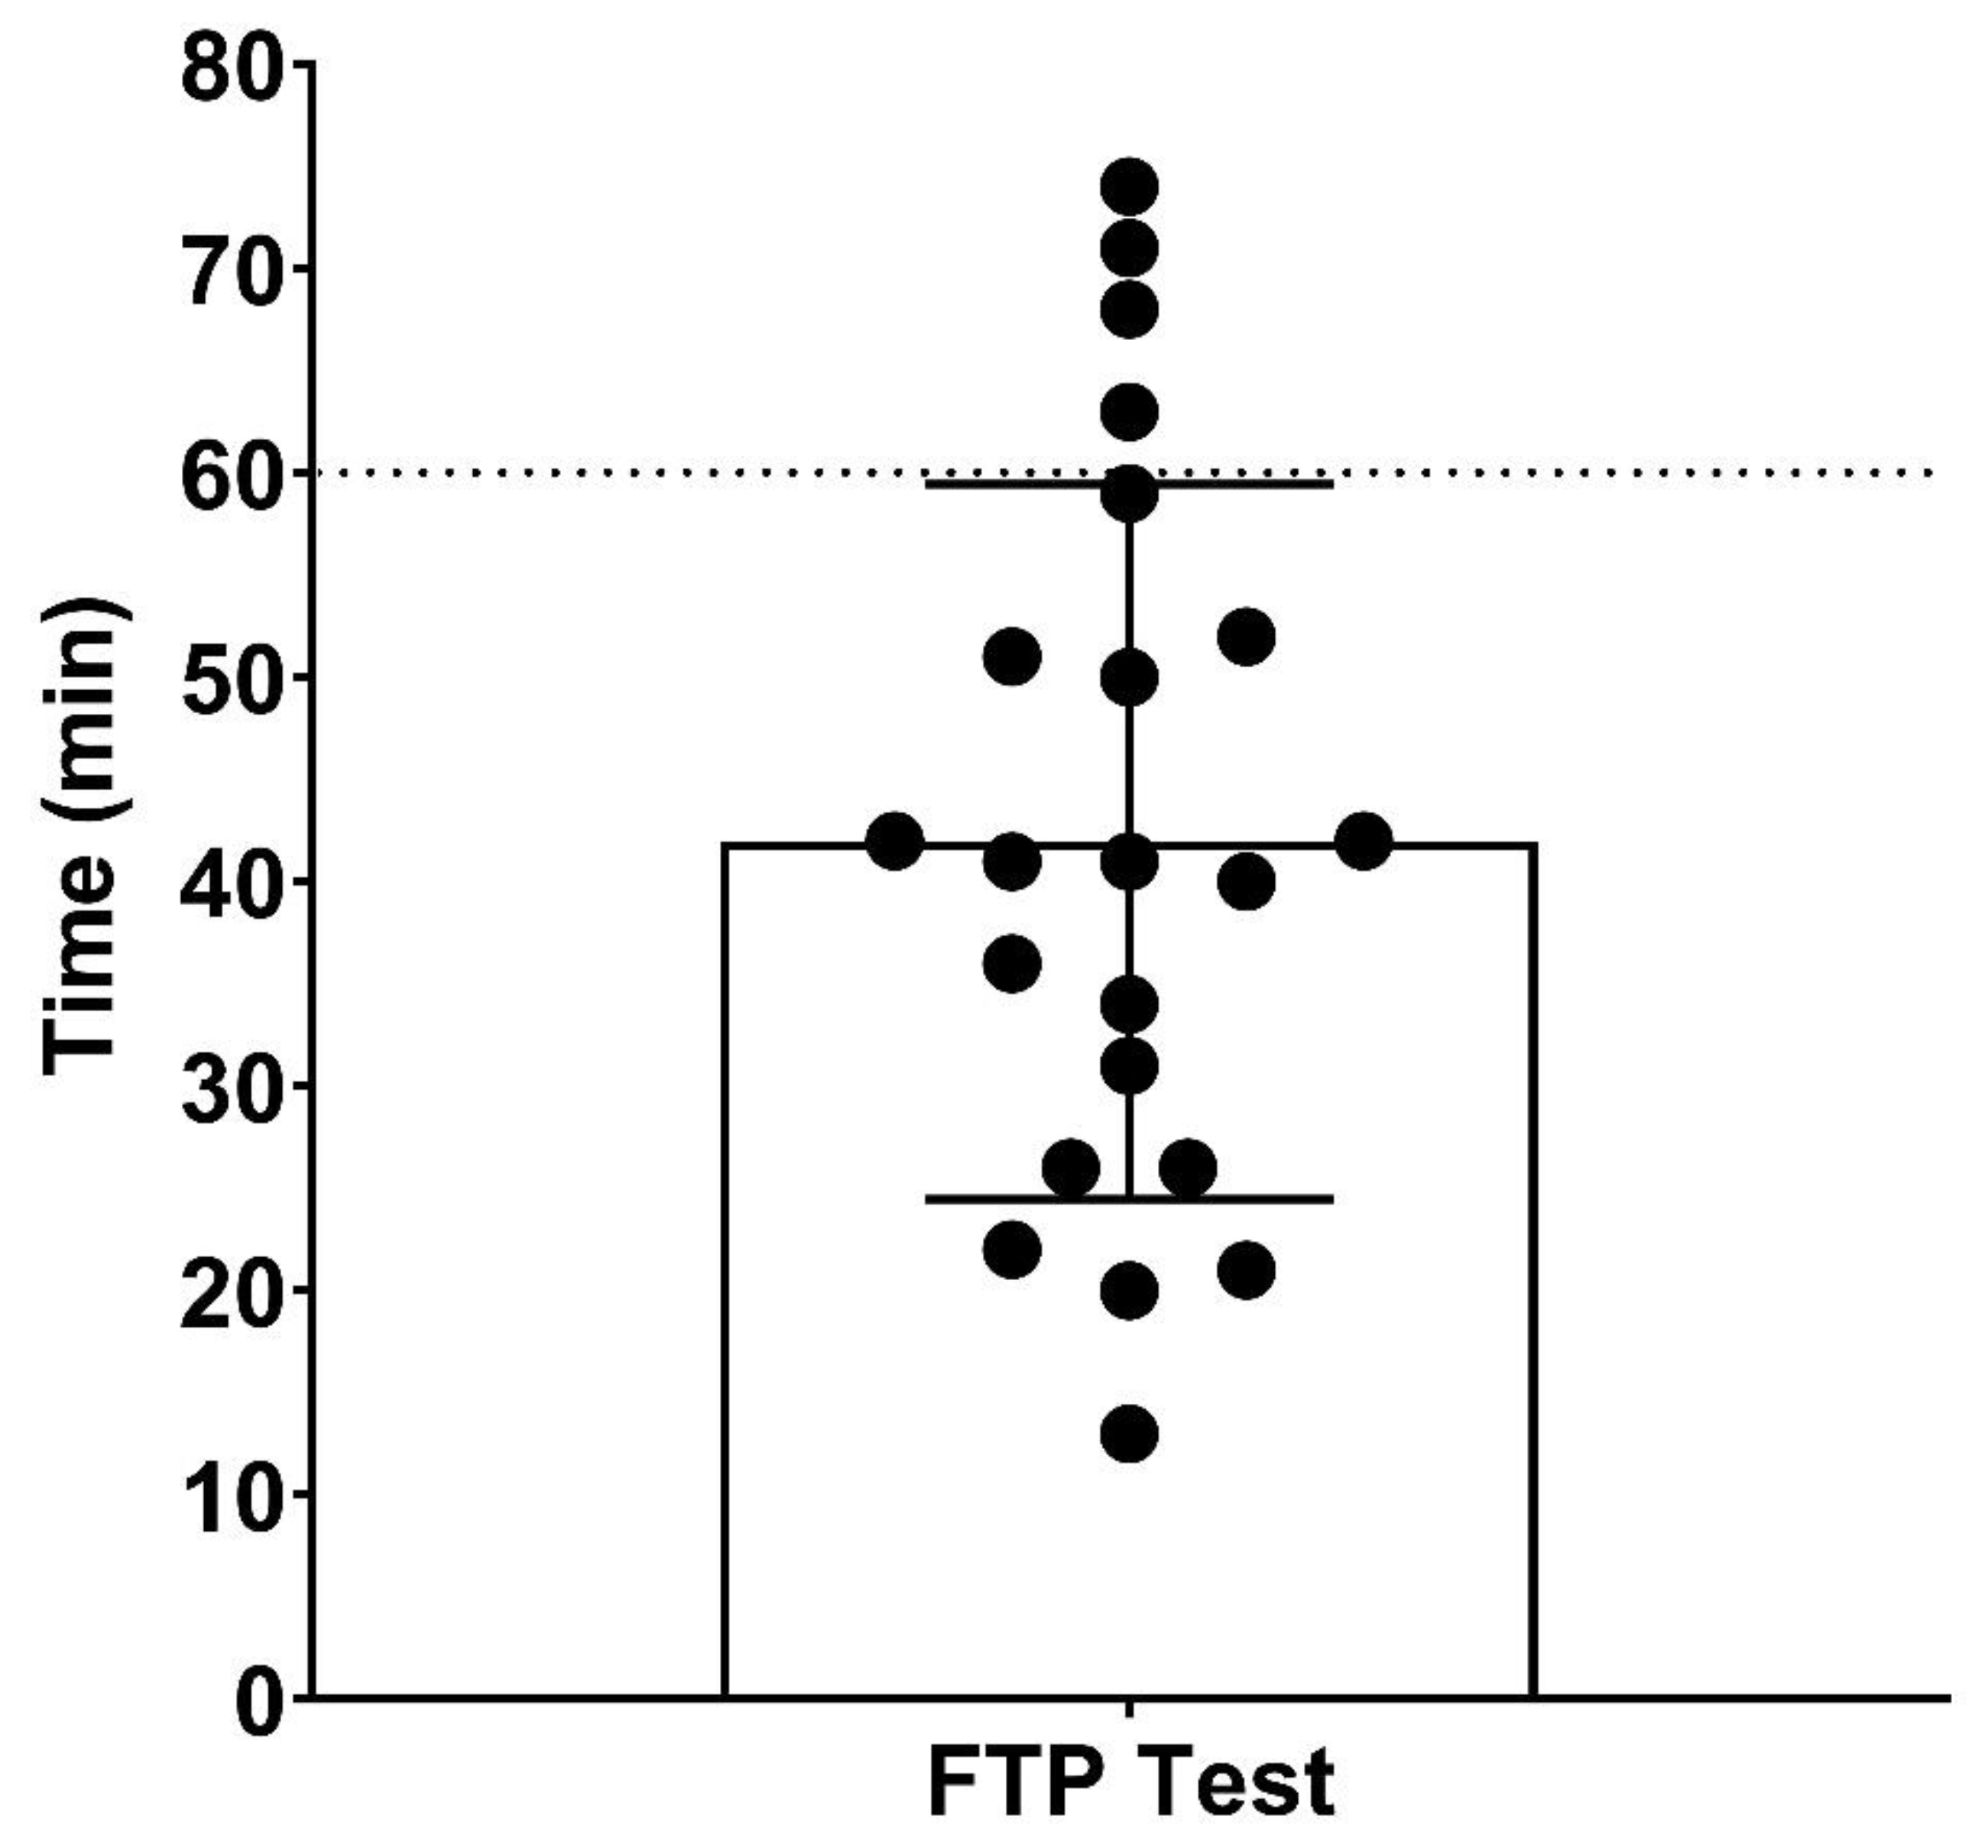

Table 1.
Mean (±SD) data for the repeated FTP20 tests.
| Time Point (min) | ||||||||||
|---|---|---|---|---|---|---|---|---|---|---|
| Rest | 5 | 10 | 15 | 20 | ||||||
| Variable | FTP1 | FTP2 | FTP1 | FTP2 | FTP1 | FTP2 | FTP1 | FTP2 | FTP1 | FTP2 |
|
V̇O2 (L∙min-1) |
0.49 ± 0.12 | 0.49 ± 0.12 | 3.63 ± 0.65 | 3.59 ± 0.66 | 3.85 ± 0.54 | 3.78 ± 0.46 | 3.96 ± 0.55 | 3.82 ± 0.52 | 4.25 ± 0.86 | 4.06 ± 0.50 |
|
VCO2 (L∙min-1) |
0.52 ± 0.15 | 0.46 ± 0.13 | 3.96 ± 0.61 | 3.82 ± 0.46 | 3.85 ± 0.50 | 3.81 ± 0.48 | 3.89 ± 0.59 | 3.86 ± 0.43 | 4.05 ± 0.48 | 4.11 ± 0.58 |
|
Heart rate (b∙min-1) |
69 ± 2 | 61 ± 7 | 159 ± 12 | 159 ± 11 | 166 ± 11 | 166 ± 9 | 168 ± 10 | 169 ± 9 | 174 ± 9 | 175 ± 7 |
|
Lactate (mmol∙L-1) |
1.4 ± 0.4 | 1.2 ± 0.4 | 10.2 ± 3.1 | 10.7 ± 4.1 | 12.0 ± 3.9 | 11.8 ± 3.8 | 13.2 ± 4.2 | 12.8 ± 4.1 | 14.6 ± 3.2 | 14.5 ± 2.9 |
|
RPE-O (AU) |
- | 15 ± 2 | 15 ± 2 | 16 ± 2 | 16 ± 2 | 17 ± 1 | 18 ± 1 | 19 ± 1 | 19 ± 1 | |
|
RPE-L (AU) |
- | - | 15 ± 2 | 15 ± 2 | 17 ± 1 | 16 ± 1 | 18 ± 1 | 18 ± 1 | 19 ± 1 | 19 ± 1 |
Table 2.
Mean (±SD) data for the time to volitional tolerance (TLIM) test.
| Time Point (min) | |||||||||
|---|---|---|---|---|---|---|---|---|---|
| Variable | Rest | 10 | 20 | 30 | 40 | 50 | 60 | 70 | End |
| Participants* (n) | 22 | 22 | 21 | 16 | 13 | 8 | 5 | 2 | 22 |
|
V̇O2 (L∙min-1) |
0.54 ± 0.13 | 3.62 ± 0.47 | 3.60 ± 0.42 | 3.56 ± 0.35 | 3.50 ± 0.35 | 3.64 ± 0.47 | 3.75 ± 0.20 | 3.49 ±0.22 | 3.68 ± 0.40 |
|
VCO2 (L∙min-1) |
0.57 ± 0.19 | 3.58 ± 0.46 | 3.48 ± 0.30 | 3.36 ± 0.25 | 3.39 ± 0.21 | 3.52 ± 0.26 | 3.47 ± 0.19 | 3.22 ±0.22 | 3.48 ± 0.40 |
|
Heart rate (b∙min-1) |
66 ± 7 | 158 ± 10 | 164 ± 11 | 163 ± 12 | 165 ± 9 | 165 ± 8 | 167 ± 12 | 165 ± 11 | 175 ± 8 |
|
Lactate (mmol∙L-1) |
1.2 ± 0.4 | 7.0 ± 3.3 | 8.4 ± 4.1 | 8.0 ± 3.8 | 8.2 ± 3.5 | 8.4 ± 2.7 | 10.8 ± 4.3 | 11.0 ± 4.0 | 13.7 ± 2.6 |
|
RPE-O (AU) |
- | 14 ± 2 | 15 ± 2 | 16 ± 2 | 16 ± 2 | 17 ± 2 | 17 ± 2 | 16 ± 1 | 19 ± 1 |
|
RPE-L (AU) |
- | 16 ± 3 | 16 ± 2 | 17 ± 1 | 18 ± 2 | 18 ± 2 | 18 ± 2 | 18 ± 0 | 19 ± 1 |
(*) represents the number of participants reaching this time point in the TLIM.
Disclaimer/Publisher’s Note: The statements, opinions and data contained in all publications are solely those of the individual author(s) and contributor(s) and not of MDPI and/or the editor(s). MDPI and/or the editor(s) disclaim responsibility for any injury to people or property resulting from any ideas, methods, instructions or products referred to in the content. |
© 2025 by the authors. Licensee MDPI, Basel, Switzerland. This article is an open access article distributed under the terms and conditions of the Creative Commons Attribution (CC BY) license (http://creativecommons.org/licenses/by/4.0/).
Copyright: This open access article is published under a Creative Commons CC BY 4.0 license, which permit the free download, distribution, and reuse, provided that the author and preprint are cited in any reuse.


