Preprint
Article

This version is not peer-reviewed.

Empirical Models for Estimating Draught and Vertical Reaction Forces of a Duckfoot Tool in Compacted Soil: Effects of Moisture Content, Depth, Width, and Speed

A peer-reviewed article of this preprint also exists.

Submitted:

05 February 2025

Posted:

06 February 2025

You are already at the latest version

Abstract

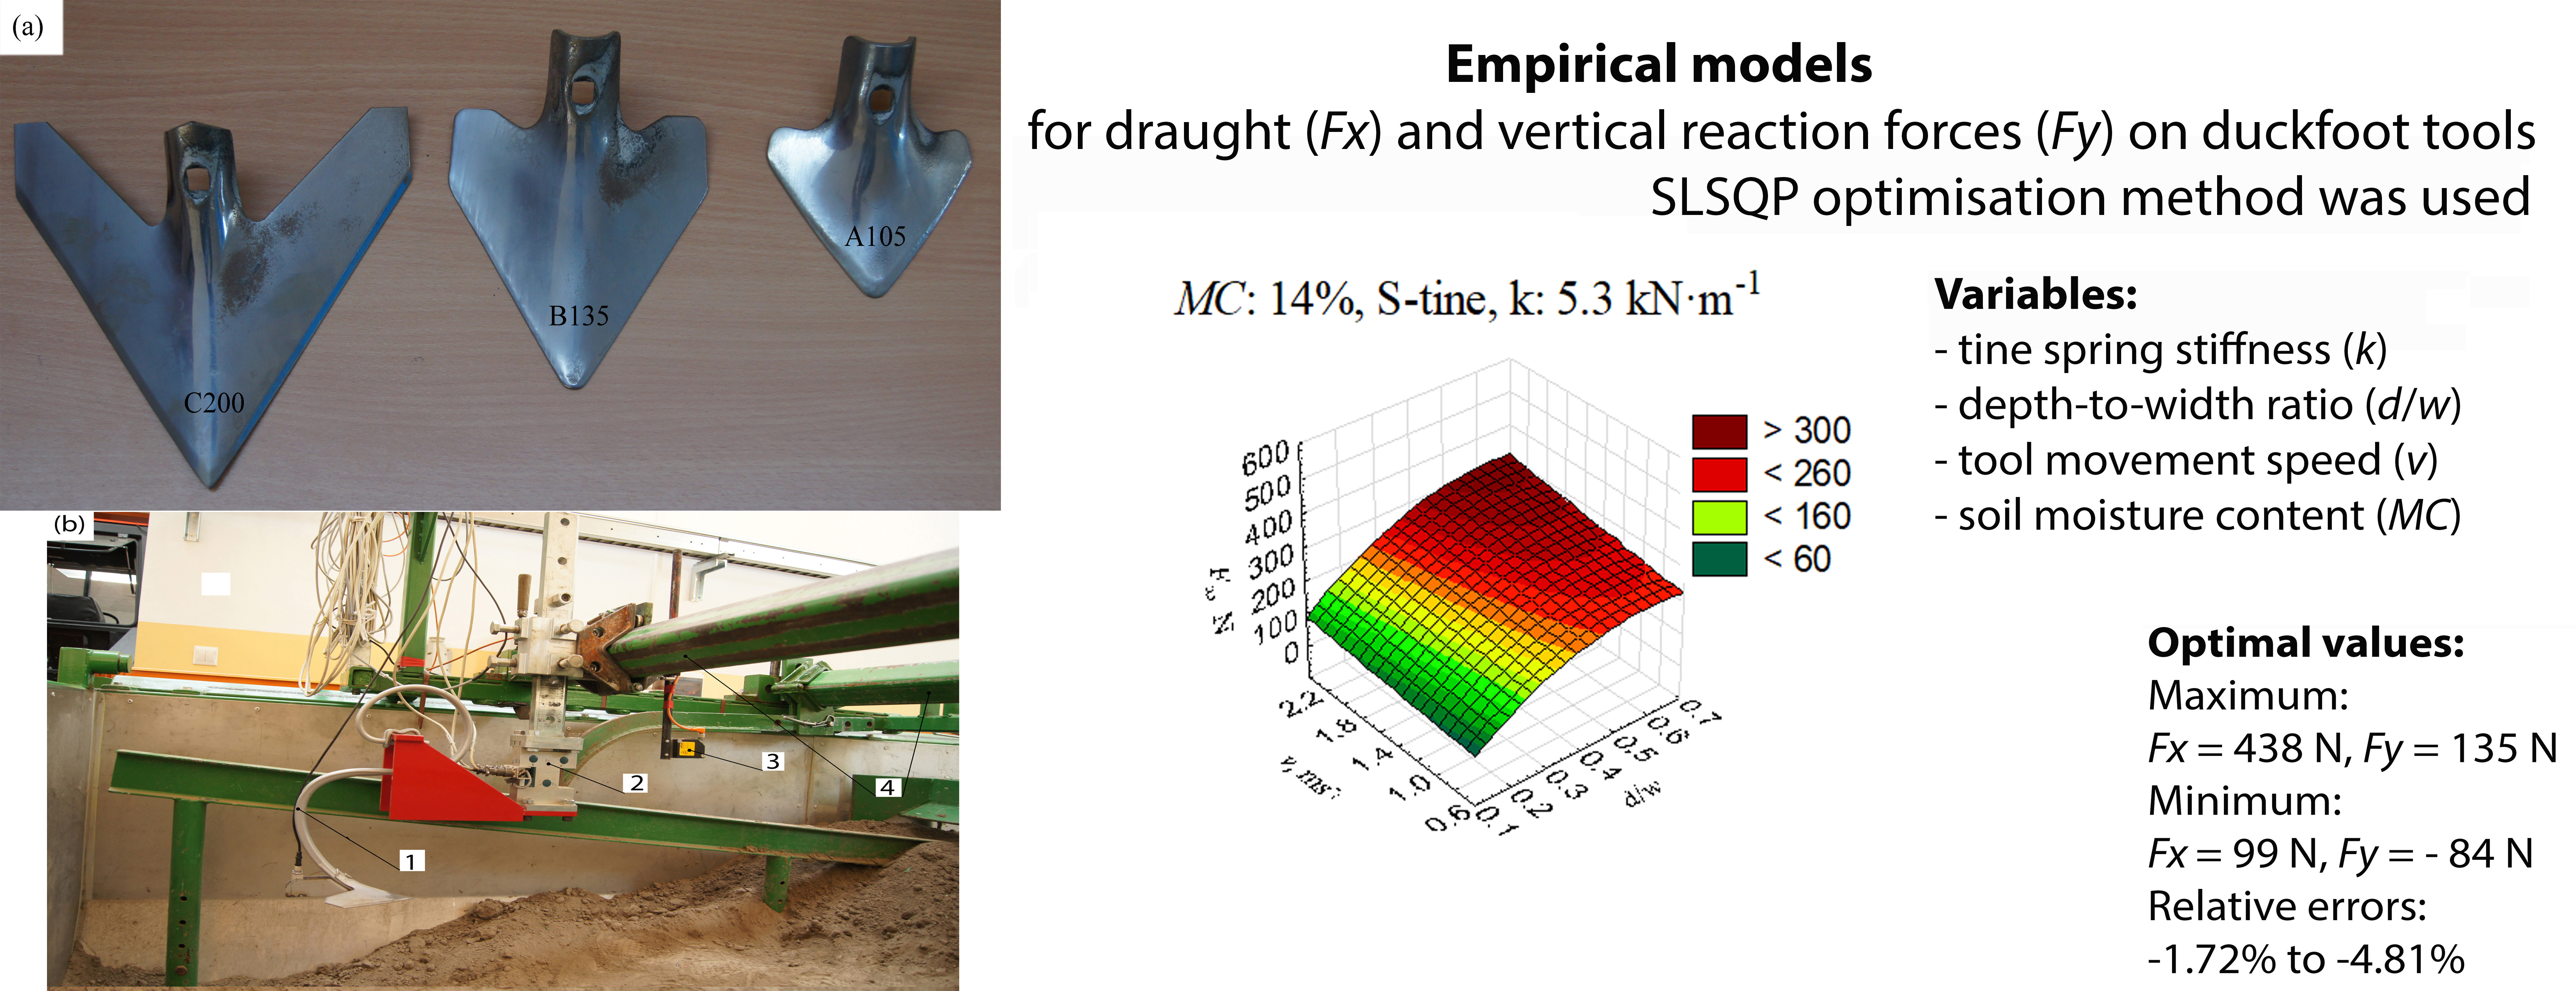
The paper presents the development of empirical mathematical models of draught force, Fx, and vertical force, Fy acting on duckfoots attached to the tines with different stiffness and working in various soil conditions. The models consider technical variables such as stiffness, k, tool depth-to-width ratio, d/w, tool movement speed, v, and soil moisture content, MC, which have not been thoroughly analysed in the literature. The correlation coefficients for predicting Fx and Fy values were 0.4996 and 0.6227, respectively. Statistical analysis confirmed the significant effect of these parameters on the forces acting on the tools, with the variables d/w and v having the most critical impact on Fx and Fy. The SLSQP (Sequential Least Squares Programming) optimisation method was used to determine the optimal values of technical variables. The maximum value of Fx was 438.55 N, and the minimum was 98.98 N, with variable values at the edges of the studied ranges. Similarly, Fy values of 135.25 N and -84.55 N, respectively, were obtained. Optimisation results showed good fitness with experimental results, and minor relative errors confirmed the accuracy of the model predictions. The justification of the research results allowed us to conclude that there is no basis for rejecting the explanatory hypotheses. The developed models have a generalisable value in the analysed ranges, and further research should focus on creating more universal, theoretical models of soil-tool interactions.

Keywords: 
;  ;  ;  

1. Introduction

Soil compaction in agriculture is a significant problem caused by various factors such as the use of machinery, intensive farming, and improper soil management [1]. Anti-compaction techniques include reducing pressure on the soil, working with the soil at optimal moisture, and increasing organic matter content [2]. The compression rate of soils increases with clay content, affecting soil strength and limiting plant growth [3]. High wheel pressure on the soil can lead to deep substrate compaction, resulting in a permanent reduction of yield [3]. This condition worsens as agricultural machinery's weight increases [4]. Soil compaction changes soil structure, reducing aeration and root development and contributing to environmental problems [5], limiting access to water for the proper development of plants [6]. To improve compacted soil structure, especially in row crops, new tools combine classic knives and vertical mini-discs to remove weeds and prevent the plants from being buried in the rows. These mechanical improvements in inter-row crops are critical to chemical-free weed control [7]. Mechanical inter-row weeding tools have effectively reduced herbicide use in sugarcane cultivation, significantly impacting weed coverage and yields [8]. In addition, the experiments showed that weed cover was reduced considerably with treatments combining mechanical and chemical weed control compared to the crop itself, and cereal yields were slightly reduced only under certain conditions [9]. These results highlight the importance of cultivator design and working speed and the effectiveness of combining mechanical and chemical weed control methods for effective weed management in row crops. Combining different inter-row tillage tools can increase the effectiveness of weed removal. However, more research is needed to reduce crop damage while maintaining high crop protection efficiency [10]. The interrelated phenomena related to the technology of treatments, soil compaction and the ecological aspect of inter-row cultivation require the search for technical solutions to limit the forces needed to overcome soil resistance with the most favourable cultivation parameters.
Understanding the forces acting on tillage tools is critical to optimising soil tillage processes and improving energy efficiency in agriculture. The draught and vertical forces exerted on the duckfoot of row cultivators significantly impact the overall performance of agricultural implements in terms of fuel consumption, soil loosening, and operational efficiency [11]. These forces are influenced by various factors, including soil structure and moisture, working depth, tool geometry, and working speed, as well as the stiffness of the duckfoots attachment tines [12]. Proper consideration of these parameters is crucial for modelling and successful application in precision agriculture [13].
The available results of the research on cultivator tools focused primarily on assessing draught force, which is the force needed to pull the tool through the soil. The role of key soil parameters, such as soil moisture and bulk density, has been widely recognised as significantly impacting pulling power [14]. In particular, it has been shown that moisture content plays a crucial role in soil preservation during soil cultivation. When the moisture content is low, the soil becomes more resistant to penetration, which requires more force to crack and move the soil. Conversely, the soil takes a plastic form with higher moisture, reducing the force on the tools. However, this can increase pulling, complicating the tool's functionality [15].
In addition to soil moisture, the working depth significantly impacts the draught and vertical forces on the tillage implements. Deeper tillage increases the volume of soil cut off and loosened, leading to a proportional increase in draught forces. Studies consistently show that working depth is one of the main factors affecting pulling power, with deeper operations requiring more pulling power due to the increased soil mass cut off by the implement [16]. For example, it has been shown that increasing depth causes a significant increase in both draught and vertical forces, especially in heavy, cohesive soils where the mechanical strength of the soil becomes a critical factor [17].
Tool geometry is another significant factor in draught and vertical forces. Duckfoot tools are widely used in agricultural cultivation due to their wide wings, which are designed to cut and lift large amounts of soil. The width of the implement affects the contact area with the soil, which means that more soil rests on the wider tines, thus increasing the resistance that the duckfoot should overcome. In addition, the shape and angle of the tool's cutting edge can significantly impact the forces acting on the tool, as sharper edges or smaller rake angles can reduce draught force and improve cutting performance [18].
Working speed is also a critical parameter that affects the forces acting on the tillage implements. Studies have shown that the draught force increases with increasing working speeds due to the inertia of the soil mass accelerated by the tool [19].
The inter-row cultivator caused unacceptable soil movement and damage to the plants at 6.11 and 7.82 km h–1 [20]. Another study found that an inter-row cultivator was more effective at reducing weed populations than a standard row cultivator [21]. Ultimately, choosing the suitable inter-row cultivator significantly impacts the efficiency of weed removal and minimising damage to crops depending on the speed and depth of work [22]. The conclusion is that properly selecting an inter-row cultivator is crucial for effective weed control and minimising crop damage depending on soil conditions and work speed.
Stiff and resilient tines play a crucial role in the weeding elements of the row cultivator. The choice between rigid and flexible tines on a row cultivator has a significant impact on the effectiveness of weed control and the reduction of plant damage, highlighting the need to consider the choice of cultivator and its operating parameters carefully. In analysing the effect of tool vibration on draught forces, discrete element method simulations show a significant impact of tool vibration on draught forces [23]. For a 200 mm comprehensive tool mounted to a rigid tine, working at depths of 35, 100, and 150 mm in light sand with a soil density of 2510 kg·m–3, the relative error of the prediction of draught force based on McKyes' model was 24.6%, 27.0%, and 32.0%, respectively (the model was overestimated) [24].
Despite much research on draught forces, less focus has been placed on vertical forces, which play a crucial role in understanding the tool's ability to penetrate and lift soil [25]. Vertical forces are fundamental in tools such as duckfoot, where the wings are designed to lift and crack the soil, and failure to take these forces into account can result in an inaccurate prediction of the performance of the loosening tool [26].
While previous studies have provided valuable information on the effects of individual factors – such as soil moisture, depth, width, and speed – on the forces acting on tillage tools [27], there remains a significant gap in understanding how these factors interact consistently with complex tools, such as duckfoot attached to tines with varying stiffness. Most models in the literature focus on more straightforward tools, such as narrow chisels with simple geometry [28] and wide duckfoots that cut, lift, and crack soil. The lack of empirical data on vertical forces limits the accuracy of existing models, especially in the context of tools that work at shallow depths [29].
The research problem is the identified gap in the current state of knowledge about the combined effects of soil moisture, depth, tool width, working speed, and especially tine stiffness on both draught and vertical forces acting on comprehensive duckfoot tools. From the current knowledge, the depth-to-tool width ratio is more important than their absolute values [30], which will be used in the developed mathematical models. There is, therefore, a need to create comprehensive empirical models based on which it will be possible to evaluate these forces under different field conditions and use these models to optimise the performance of tools operating in various field environments. Considering variable factors, interactions between the tillage tool and the soil are essential for minimising agronomic and environmental problems (Damanauskas and Janulevich, 2022).
Based on the research problem, the following scientific hypotheses were formulated: 1) Soil moisture, the ratio of depth to width of the duckfoot, the movement speed, and the stiffness of the tine flexible significantly impact both the draught and vertical forces acting on duckfoots. An increased tool depth-to-width ratio and movement speed will result in greater draught forces, and a lower tine stiffness will have a measurable effect on reducing horizontal and vertical forces. It will be incorporated into the developed models, improving accuracy compared to existing models; 2) Mathematical empirical models developed in this study will allow for predicting forces in a two-dimensional 2D system in different soil conditions and tool configurations. Empirical models focus mainly on linear relationships and interactions and include nonlinear variables. Models will be validated for optimal conditions based on relative errors.
The scientific novelty of this study lies in developing comprehensive mathematical, empirical models that will allow for the simultaneous evaluation of both draught and vertical forces for duckfoot under different operating conditions. While previous research has primarily focused on draught forces and simpler tool geometries, this study will fill the gap by addressing vertical forces, which are critical to understanding the behaviour of tools for penetration, lifting, crushing, cracking, and soil spreading. The models presented in the manuscript consider the existing essential soil and implement parameters, such as soil moisture and movement speed, as well as the duckfoot depth-to-width ratio and, in particular, tine stiffness. Based on the developed models, it is possible to fully understand the forces acting on the duckfoot, which is essential for optimising the implementation design and energy efficiency in modern precision agriculture. The model's optimisation will allow us to indicate the optimal working conditions of tillage tools and determine the minimum and maximum values of forces in a 2D system.

2. Materials and Methods

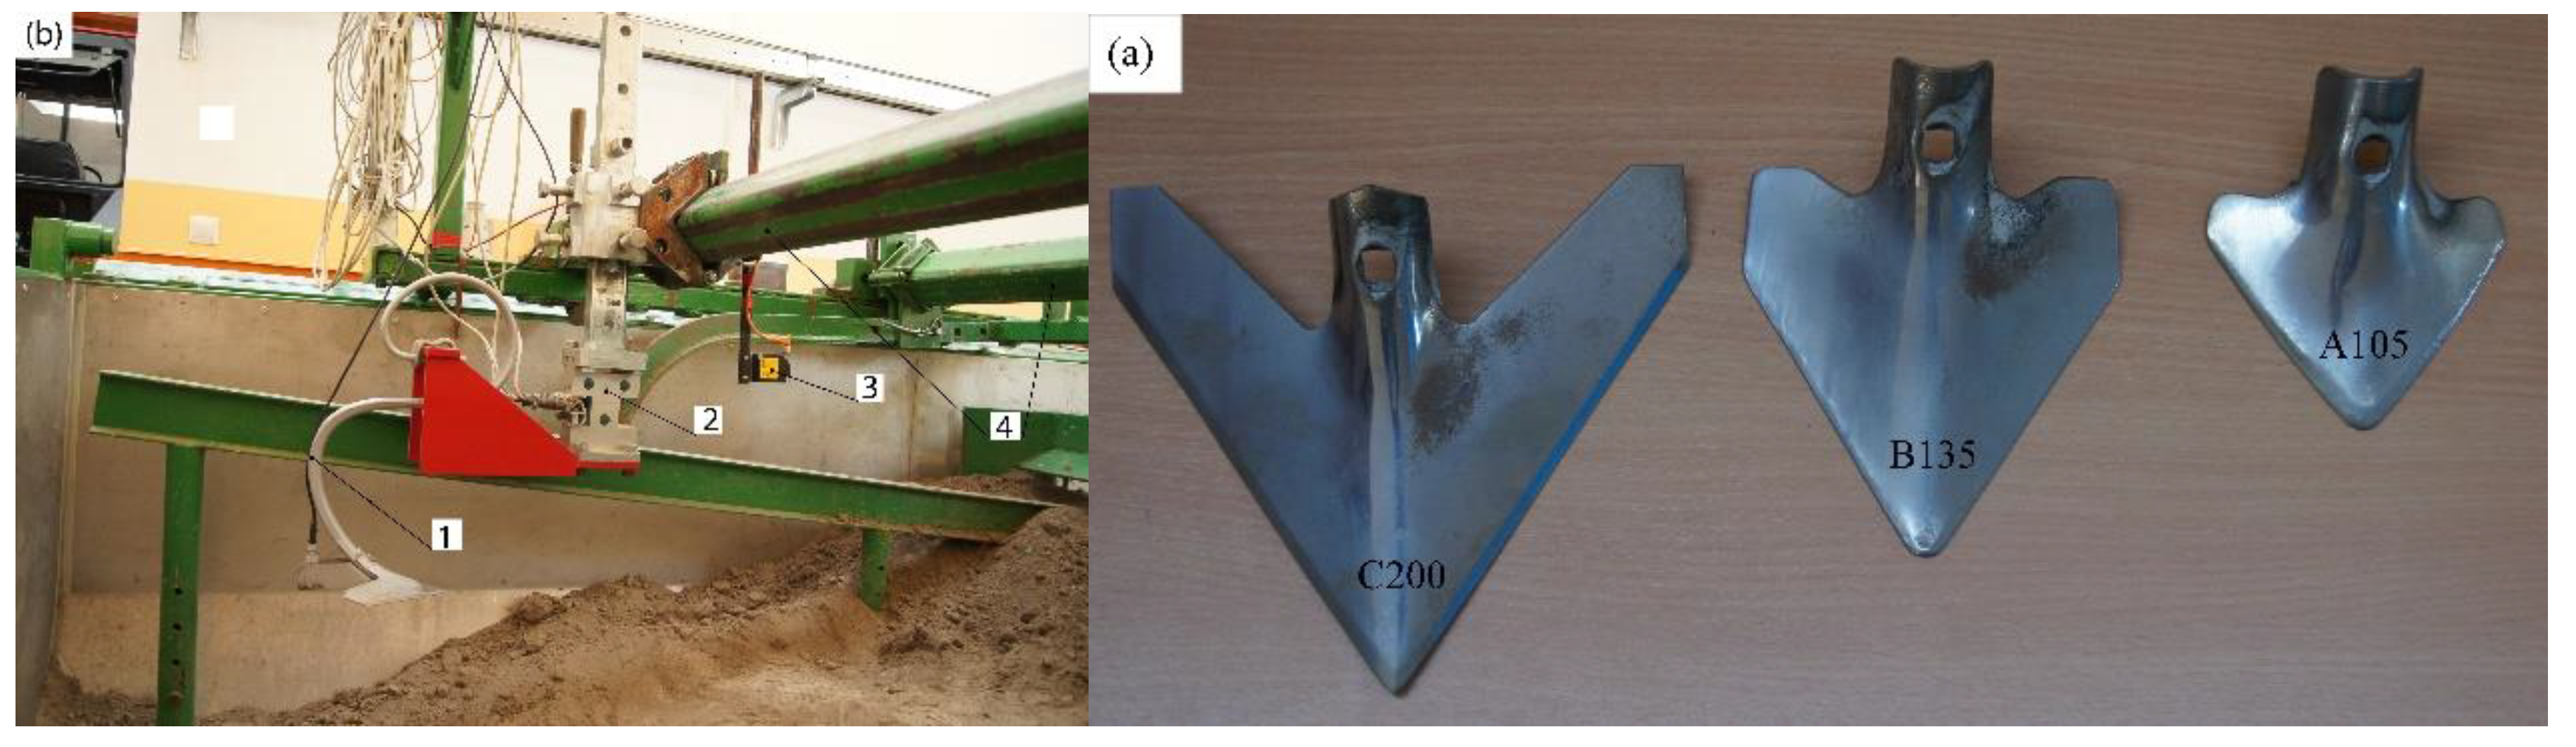
2.1. Soil Properties and Test Object

Detailed data are included in the literature to date [32], and this article provides information subordinated to empirical modelling. The research was conducted in a soil bin on light clay sand with a bulk density of 1535 ± 11 kg·m⁻³ (ISO 11272:2017) and soil compactness of 486 ± 25 kPa (ASAE S313.3). The soil was kept at two moisture levels of 10% and 14% and, according to the classification [33], has been classified as cohesive materials because the value of the flow index (flowability) ffc was in the range of 1 < ffc < 2.
Three duckfoots, A105, B135, and C200, with widths of 105, 133, and 202 mm, respectively, were used for the study (Figure 1a). Duckfoots are mounted to S and VCO tines, with stiffness of 5.3 kN·m⁻¹ and 8.3 kN·m⁻¹, respectively.

2.2. Soil Bin with Equipment and Measurement Procedure

The experiments were conducted in a soil bin (Figure 1b) at the Department of Biosystems Engineering, Institute of Mechanical Engineering of the Warsaw University of Life Sciences. The tine and duckfoot assembly was pulled by a tool trolley driven by an electric motor with a geared motor. The movement speed of the duckfoot trolley was measured with an optical sensor, and the horizontal, vertical, and lateral forces (this force was not analysed in the article) with an integrated sensor (CS3D, ZEPWN, Marki, Poland). The working depth was determined and controlled using a laser distance meter (LDS 100-500P-S, Beta Sensorik) combined with a 3000 mm long horizontal displacement indicator with a sensitivity of 0.3163 mV V⁻¹ mm⁻¹ (WS12-3000-R1K-L10-M, ASM GmbH, Germany). The measurement data was stored on a computer via a high-speed digital interface board from Hottinger Baldwin DMCplus. The measurement and control system was controlled by CATMAN 2.1 software, which provided simultaneous data acquisition and movement control with a sampling rate of 50 Hz.
For each round, the loosened soil to a depth of 0.22 ± 0.02 m was levelled and compacted with a smooth roller weighing 360–520 kg. The tests were carried out at three working depths of duckfoots: 30, 50, and 70 mm and movement velocities: 0.84, 1.67, and 2.31 m·s⁻¹. These variables were combined into a 3 × 2 × 3 × 3 × 2-factor experiment with three or four blocks (replications). A total of 350 tests were made, as some tests were made four times due to too large measurement errors.

2.3. Data Analysis

The effects of depth-to-width ratio (duckfoot type), working speed, tine stiffness (tine type), and soil moisture content were accounted for by determining the mean and standard deviation (SD) values from the force transducer signals. Time series were analysed, defined as any sequence of observations made in time, where time was the independent variable and the observed value was the dependent variable. Soil scientists often analyse sequences of observations of naturally occurring processes made in time (or space) [34]. Correlation coefficients between factors and forces Fx and Fy were analysed using the Pearson test. Knowledge from the results of the correlation coefficients was used to formulate empirical models [35].

2.4. General Formula of the Empirical Model

For the draught force Fx and the vertical force component Fy, mathematical, empirical models were determined to bind the independent variables: tine stiffness k, depth-to-width ratio d/w, the movement speed v, and soil moisture MC, using a general regression equation, to analyse the effect of the studied parameters on the dependent variables Fx and Fy, Eq. 1.
F x , y = β 0 + i = 1 4 β i x i + i = 1 4 β i i x i 2 + i = 1 3 j = i + 1 4 β i j x i x j + + i = 1 2 j = i + 1 3 k = j + 1 4 β i j k x i x j x k + β 1234 x 1 x 2 x 3 x 4 ,
where Fx,y – draught force (horizontal) Fx, vertical force Fy; xi,ji,j-th independent variable (factor); x1 = k – stiffness; x2 = d/w – ratio of depth to width; x3 = v – movement speed; x4 = MC – soil moisture content; β0, βi, βii, βij, βijk – regression coefficients.
The developed formula of the empirical model is in the form of Eq. 2.
F x , y = β 0 + β 1 k + β 2 d w + β 3 v + β 4 M C + β 5 k 2 + β 6 d w 2 + β 7 v 2 + β 8 M C 2 + β 9 k d w + + β 10 k v + β 11 k M C + β 12 d w v + β 13 d w M C + β 14 v M C + β 15 k d w v + β 16 k d w M C + + β 17 k v M C + β 18 d w v M C + β 19 k d w v M C
For the estimation of regression coefficients and the regression model, the Levenberg-Marquardt method was chosen as the most effective and fastest converging method, the algorithm of which is described in detail in the literature [36]. The final formula of the models included statically significant regression coefficients, which were left behind after the backward stepwise modelling procedure. Discrimination of regression coefficients was performed using the Student's t-test. The fit of mathematical models was assessed based on the F-Fisher-Snedecor test and the p-value for the model. Statistical conclusions were formulated at the probability level of 0.05. The statistical analysis was conducted using the standard statistical package Statistica v.13.3 (StatSoft Poland Ltd., Cracow).
For the developed empirical models, partial derivatives concerning independent variables k, d/w, v, and MC were determined, and an optimisation process was carried out to find the maximum and minimum values of Fx and Fy. The system of four equations from partial derivatives was solved numerically using the SLSQP method, available in the open-source Python software's minimise function from the SciPy library. The numerical analysis took into account the initial conditions of the decision variables k0 = 5.3 kN·m⁻¹, d0/w0 = 0.15, v0 = 0.84 m·s⁻¹ and MC0 = 10%, and the constraints on the range of variables used: stiffness k = [5.3, 8.3] in kN·m⁻¹, depth-width ratio d/w = [0.15, 0.67] (dimensionless quantity), movement speed v = [0.84, 2.31] in m·s⁻¹ and soil moisture MC = [10, 14] in %. For the values of the optimal parameters, the values of the objective functions Fx and Fy were calculated, and relative errors were determined concerning the values tested for the same operating parameters.

3. Results and Discussion

3.1. Results of the Statistical Analysis

Based on the analysis of variance and the matrix of correlation coefficient values, the statistical analysis results provided important information about the influence of individual independent variables and their interaction with the draught forces, Fx, and vertical forces, Fy. The study showed that the key variables influencing the forces acting on duckfoots were tine stiffness, k, tool depth-to-width ratio, d/w, tool movement speed, v, and soil moisture, MC. Each of these variables had a statistically significant effect on the forces Fx and Fy, which was confirmed by the values of the F-Fisher-Snedecor coefficients and the significance level p < 0.0001 for most of the analysed principal factors and their interactions (Table 1).
The ratio of the depth to the width of the tool, d/w, showed the most significant impact on the differentiation of draught and vertical force values. This variable had the relatively highest values of the Pearson correlation coefficients, amounting to 0.326 for draught Fx and 0.547 for force Fy (Table 2). Higher values of correlation coefficients for a variable d/w indicated a direct relationship between a change in the depth-to-width ratio and an increase in the forces acting on the tools. The importance of this variable has also been confirmed in the literature, where many studies have shown that a more excellent value of the ratio d/w increased the resistance of the cut soil, which in response translated into increased draught and vertical forces, which affected the efficiency of cultivation and energy consumption by the tool [30].
The second important variable was the movement speed of the tool, v, which positively affected the values of draught and vertical forces. The correlation coefficients for speed were 0.257 for Fx and 0.168 for Fy. These results supported the findings of previous studies that indicated that an increase in the speed of working implement movement led to increased draught forces, which was associated with dynamic effects of acceleration and soil deformation [37]. The high movement speed of the working implements contributed to higher soil resistance, increasing the tool's energy consumption, but it could also promote more efficient soil loosening under certain conditions.
Tool stiffness, k, was another critical variable that affected the values of draught and vertical forces. The correlation coefficient for this variable was 0.165 for Fx and 0.031 for Fy, which suggested that the stiffness of the spring used to make the duckfoots mounting tines had a more significant impact on the Fx than Fy. The literature emphasises the importance of the stiffness of the working elements of tillage tools in the context of the forces acting on the tools. Studies show that tools with higher rigidity are more effective on hard soil, while flexible tools can generate less pulling resistance, which confirms the results obtained [38].
Soil moisture, MC, showed a minimally negative effect on the values of both forces. This result was in line with previous studies that showed that sandy soil with a low proportion of clay particles with higher moisture content has lower pulling resistance due to lower soil cohesion and better tool slippage in moist soil layers [39]. Lower soil-tool adhesion force in conditions of increased moisture reduces the pulling resistance, which can also lead to more effective tool operation. However, it should be emphasised that other soil species may show different properties with increasing moisture.
The analysis of interactions between variables allows us to conclude that most of the analysed interactions had a significant impact on the values of forces Fx and Fy. Dual interactions such as stiffness, soil moisture (k × MC), depth-to-width ratio, and tool movement speed (d/w × v) statistically affected both forces. These results indicate that independent variables do not act alone but, when combined, can produce synergies and significantly influence force values, underscoring the importance of analysing interactions in tillage tool research [40].
The analysis of variance also showed that triple interactions such as stiffness, soil moisture, and depth-to-width ratio (k × MC × d/w) had a very significant impact on the values of the Fx and Fy (p < 0.0001). This indicates the complexity of the processes involved in soil-tool interactions, which requires consideration not only of individual factors but also of multiple combinations of factors in predictive models. These relationships are consistent with the observations of other researchers, who suggest that models that consider the interactions of many variables are more precise and effective in predicting the actual forces acting on the tools [41].
Overall, statistical analysis provided vital information on the influence of individual variables and their interaction with the values of draught and vertical forces. The most important factors were the tool's depth-to-width ratio and the movement speed, while the stiffness and soil moisture had a more minor but still significant impact on the forces acting on the tools. These results confirm the complexity of soil-tool interactions, which requires considering multiple variables and their combinations in developing predictive models.

3.2. Mathematical Empirical Models

Mathematical, empirical models developed for draught force, Fx, and vertical force, Fy (Eq. 2) were based on analysing the influence of key independent variables and their interactions. These models extended previous approaches, often only considering basic operating parameters such as working depth, d, tool width, w, and movement speed, v. The developed models were more complex, as they additionally considered the effects of tine stiffness, k, and soil moisture content, MC.
Entering stiffness k as a variable was essential to research on modelling soil-tool interactions. As shown earlier, tool stiffness can significantly affect draught forces, which is confirmed in the literature [38]. Stiffness affects the susceptibility of the tool to adapt to soil conditions, especially when the soil is more compact or when there is significant working resistance resulting from the operation of the tools at specific technical parameters. Including this parameter in the mathematical model enabled a more accurate prediction of the values of the forces acting on the tool.
The empirical models developed included both linear and non-linear effects of variables and interactions between variables. These interactions were crucial for correctly mapping the impact of several variables simultaneously, which is particularly important in studying soil-tool interactions. The literature notes that considering variable interactions, especially double and triple interactions, improves the precision of predictive models, which was also reflected in the present study [40].
A general regression equation included all relevant factors affecting these forces in the models developed for draught force Fx (Eq. 3) and vertical force Fy (Eq. 4). These equations were more complex than traditional models, reflecting the complexity of the soil-tool interaction process. These models considered the linear relationships between variables and their squares and interactions between variables, allowing for more precise prediction results.
F x = 486 36.0 k 502 d w 368 v 42.2 M C 542 d w 2 + 17.8 v 2 + 95.3 k d w + + 48.2 k v + 4.18 k M C + 1073 d w v + 104 d w M C + 24.9 v M C 150 k d w v 10.1 k d w M C 3.63 k v M C 85.6 d w v M C + 13.0 k d w v M C
F y = 267 + 1705 d w 176 v 776 d w 2 90.6 k d w + 29.2 k v + 0.847 k M C 56.3 d w M C + 18.7 v M C + 5.65 k d w M C 2.89 k v M C 7.64 d w v M C + 1.48 k d w v M C
One of the critical elements of the models was the inclusion of the constant, β₀, which served as an equalisation of the prediction level. The lack of a constant in the model would artificially inflate the multiple correlation coefficient, R, values, which could lead to erroneous conclusions about the model's validity; including a constant allowed the model to fit the data more realistically, which is especially important for non-linear relationships between variables [42]. The values of constants in both models were statistically significant, confirmed by the results of the Student's t-tests, and were of great importance in improving the prediction quality (Table 3). Analysis of variance and evaluation of model fit confirms their statistical significance, p < 0.0001 (Table 4).
The values of multiple correlation coefficients, R, for the developed models were 0.4996 for Fx and 0.6227 for Fy, indicating a moderate fit of the models to the experimental data. This may be due to random variability of the compacted soil, too low implement movement speed, instability of the working depth related to tine stiffness, and the associated change of the duckfoot rake angle. Still, they were statistically significant and showed a satisfactory reflection of the real-world phenomena occurring in the soil-tool interaction. These results are consistent with previous studies that indicated that nonlinear models, especially in cultivator tool studies, have moderate R-values associated with high variability in soil conditions [41].
The developed models can predict draught and vertical forces in various soil and operational conditions. In particular, these models can help design and optimise agricultural tools, as they allow the analysis of the impact of different technical and environmental variables on the resistance of tools. These models can also be used to assess the impact of new materials and technologies on tool efficiency, which is essential for the sustainable development of agriculture.
The developed mathematical, empirical models considering stiffness and soil moisture significantly extend existing approaches to modelling soil-tool interactions. These models were characterised by a statistically significant fit to experimental data and can be used in agricultural practice and research on optimising agrarian tools.

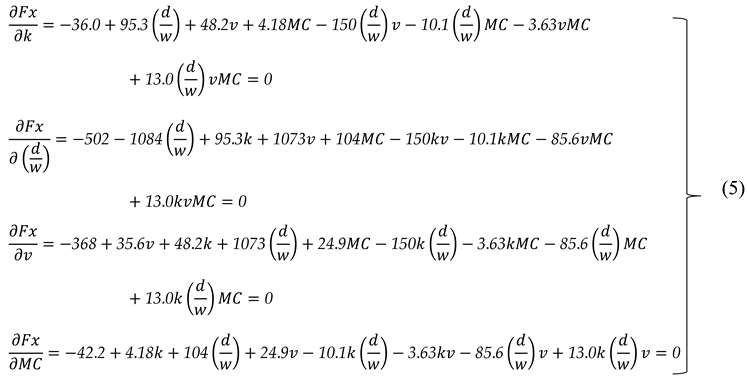
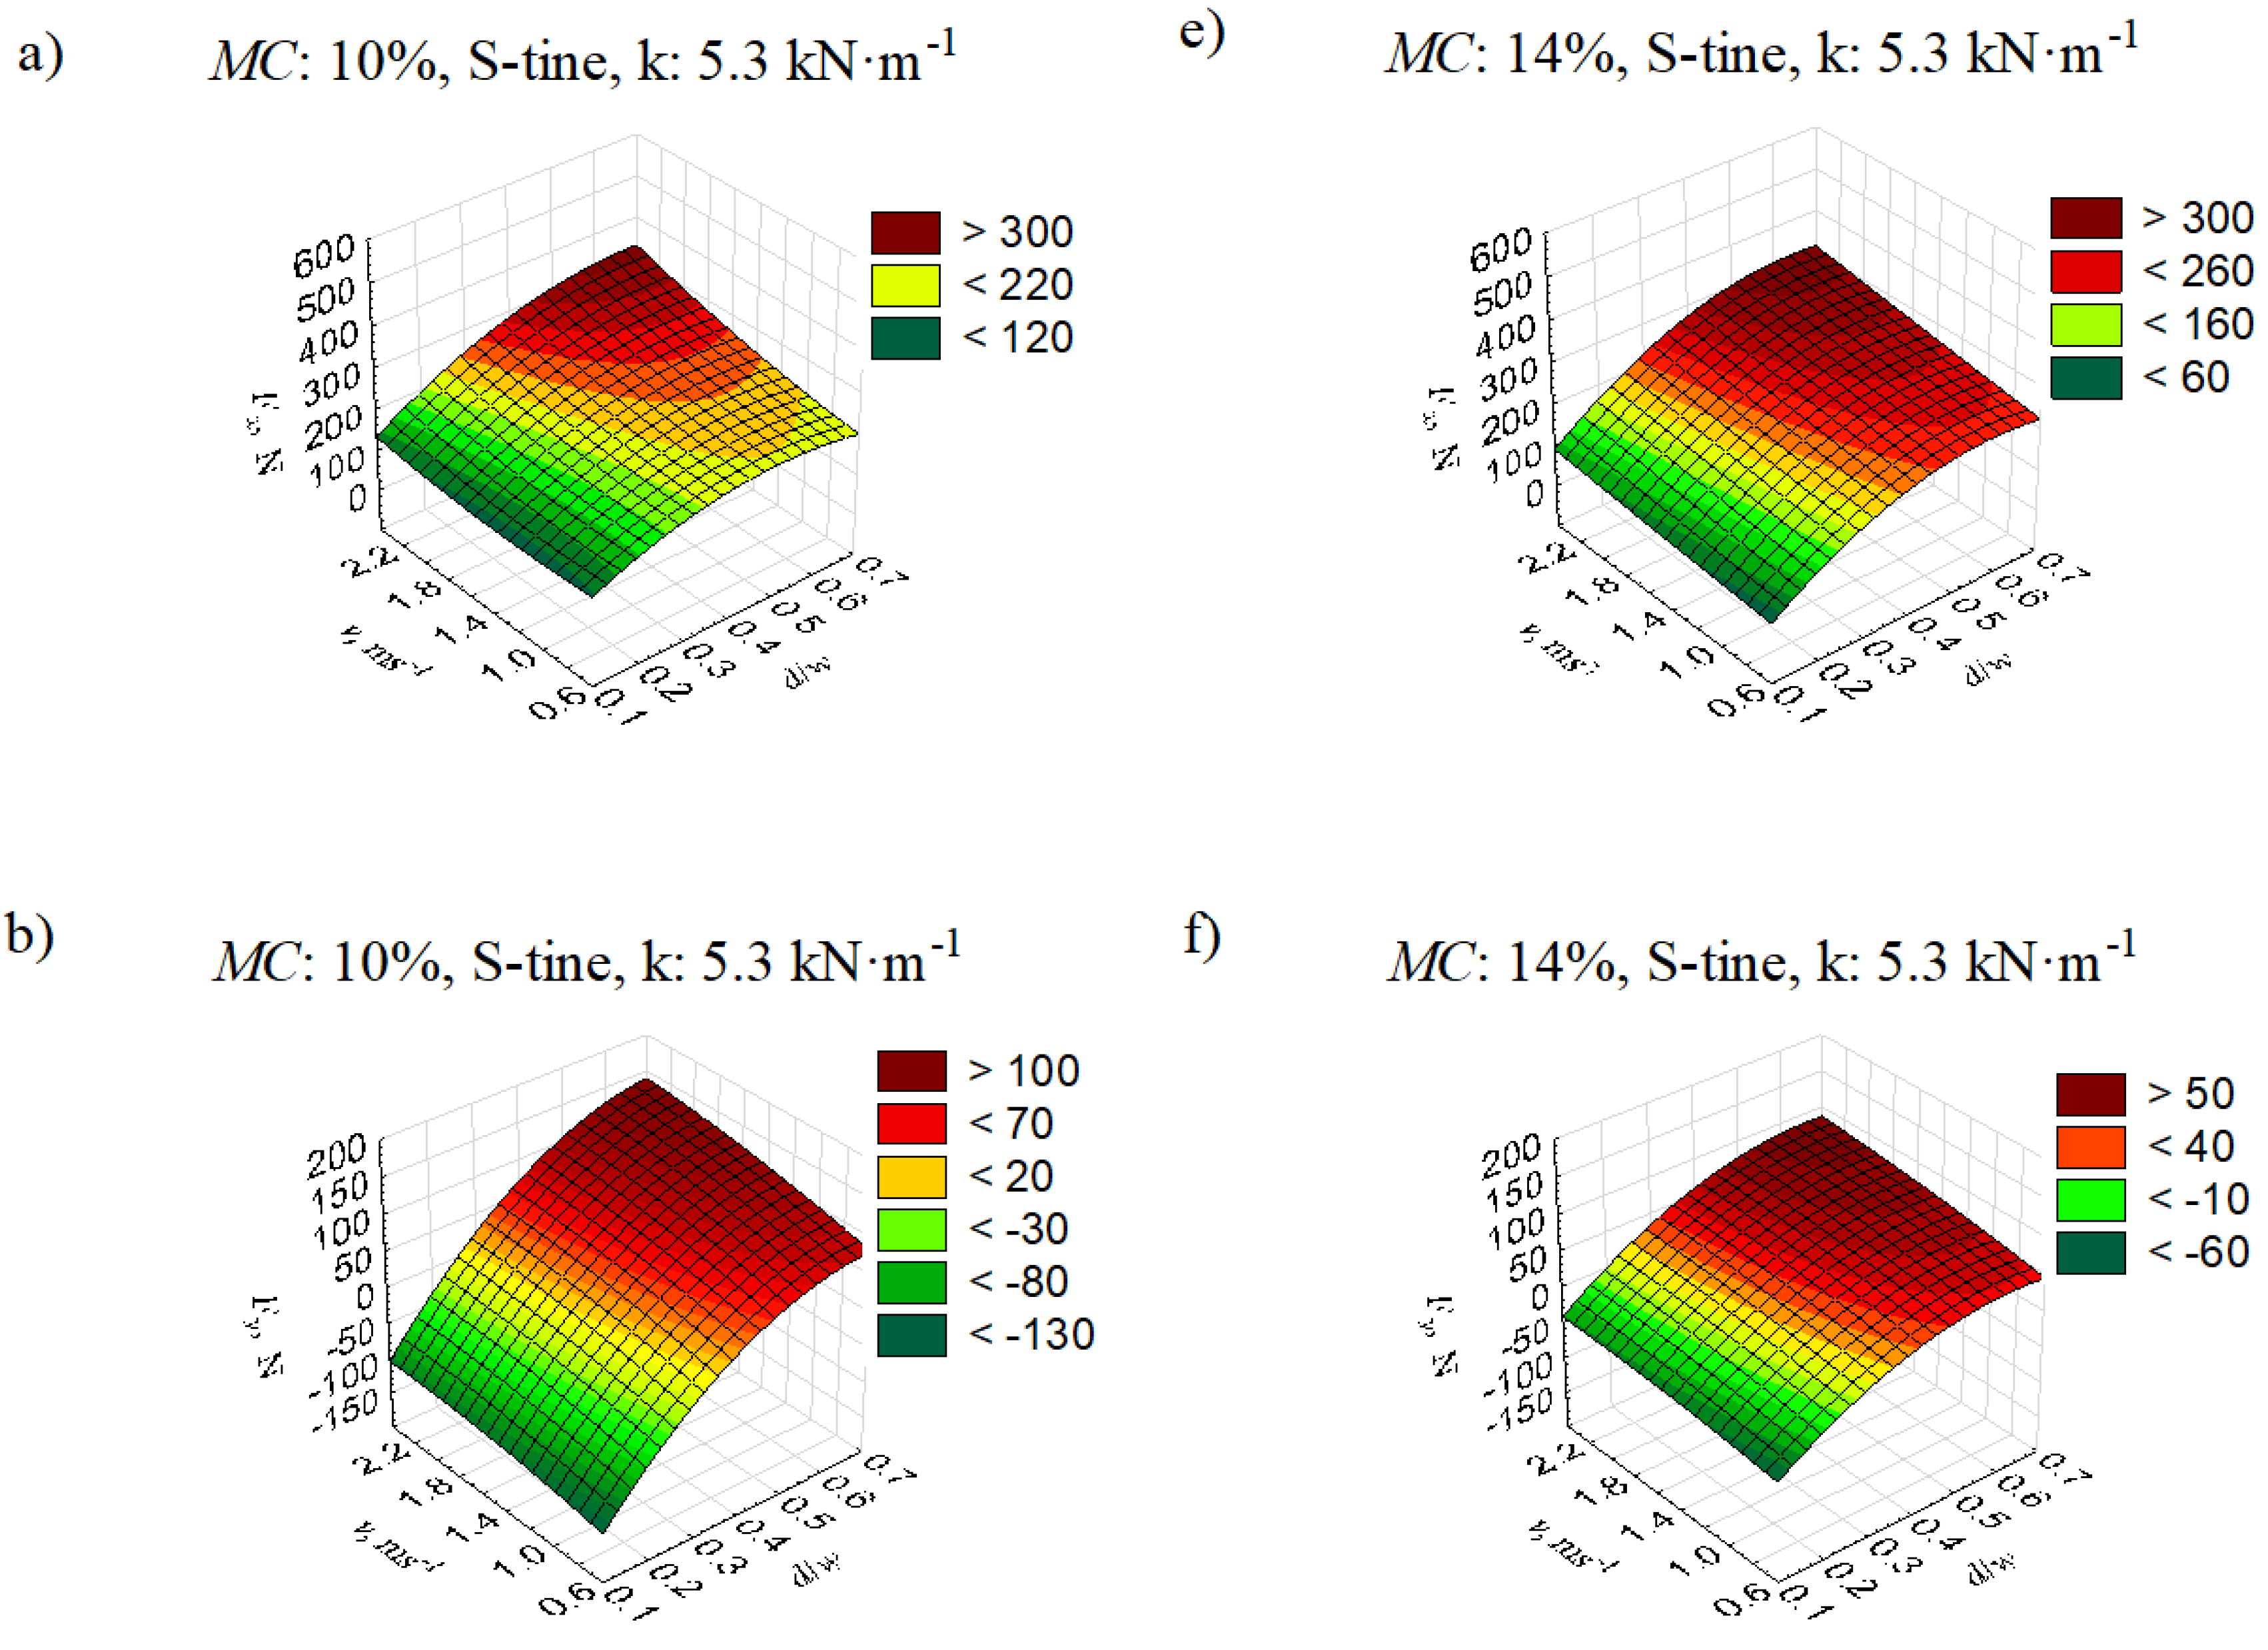
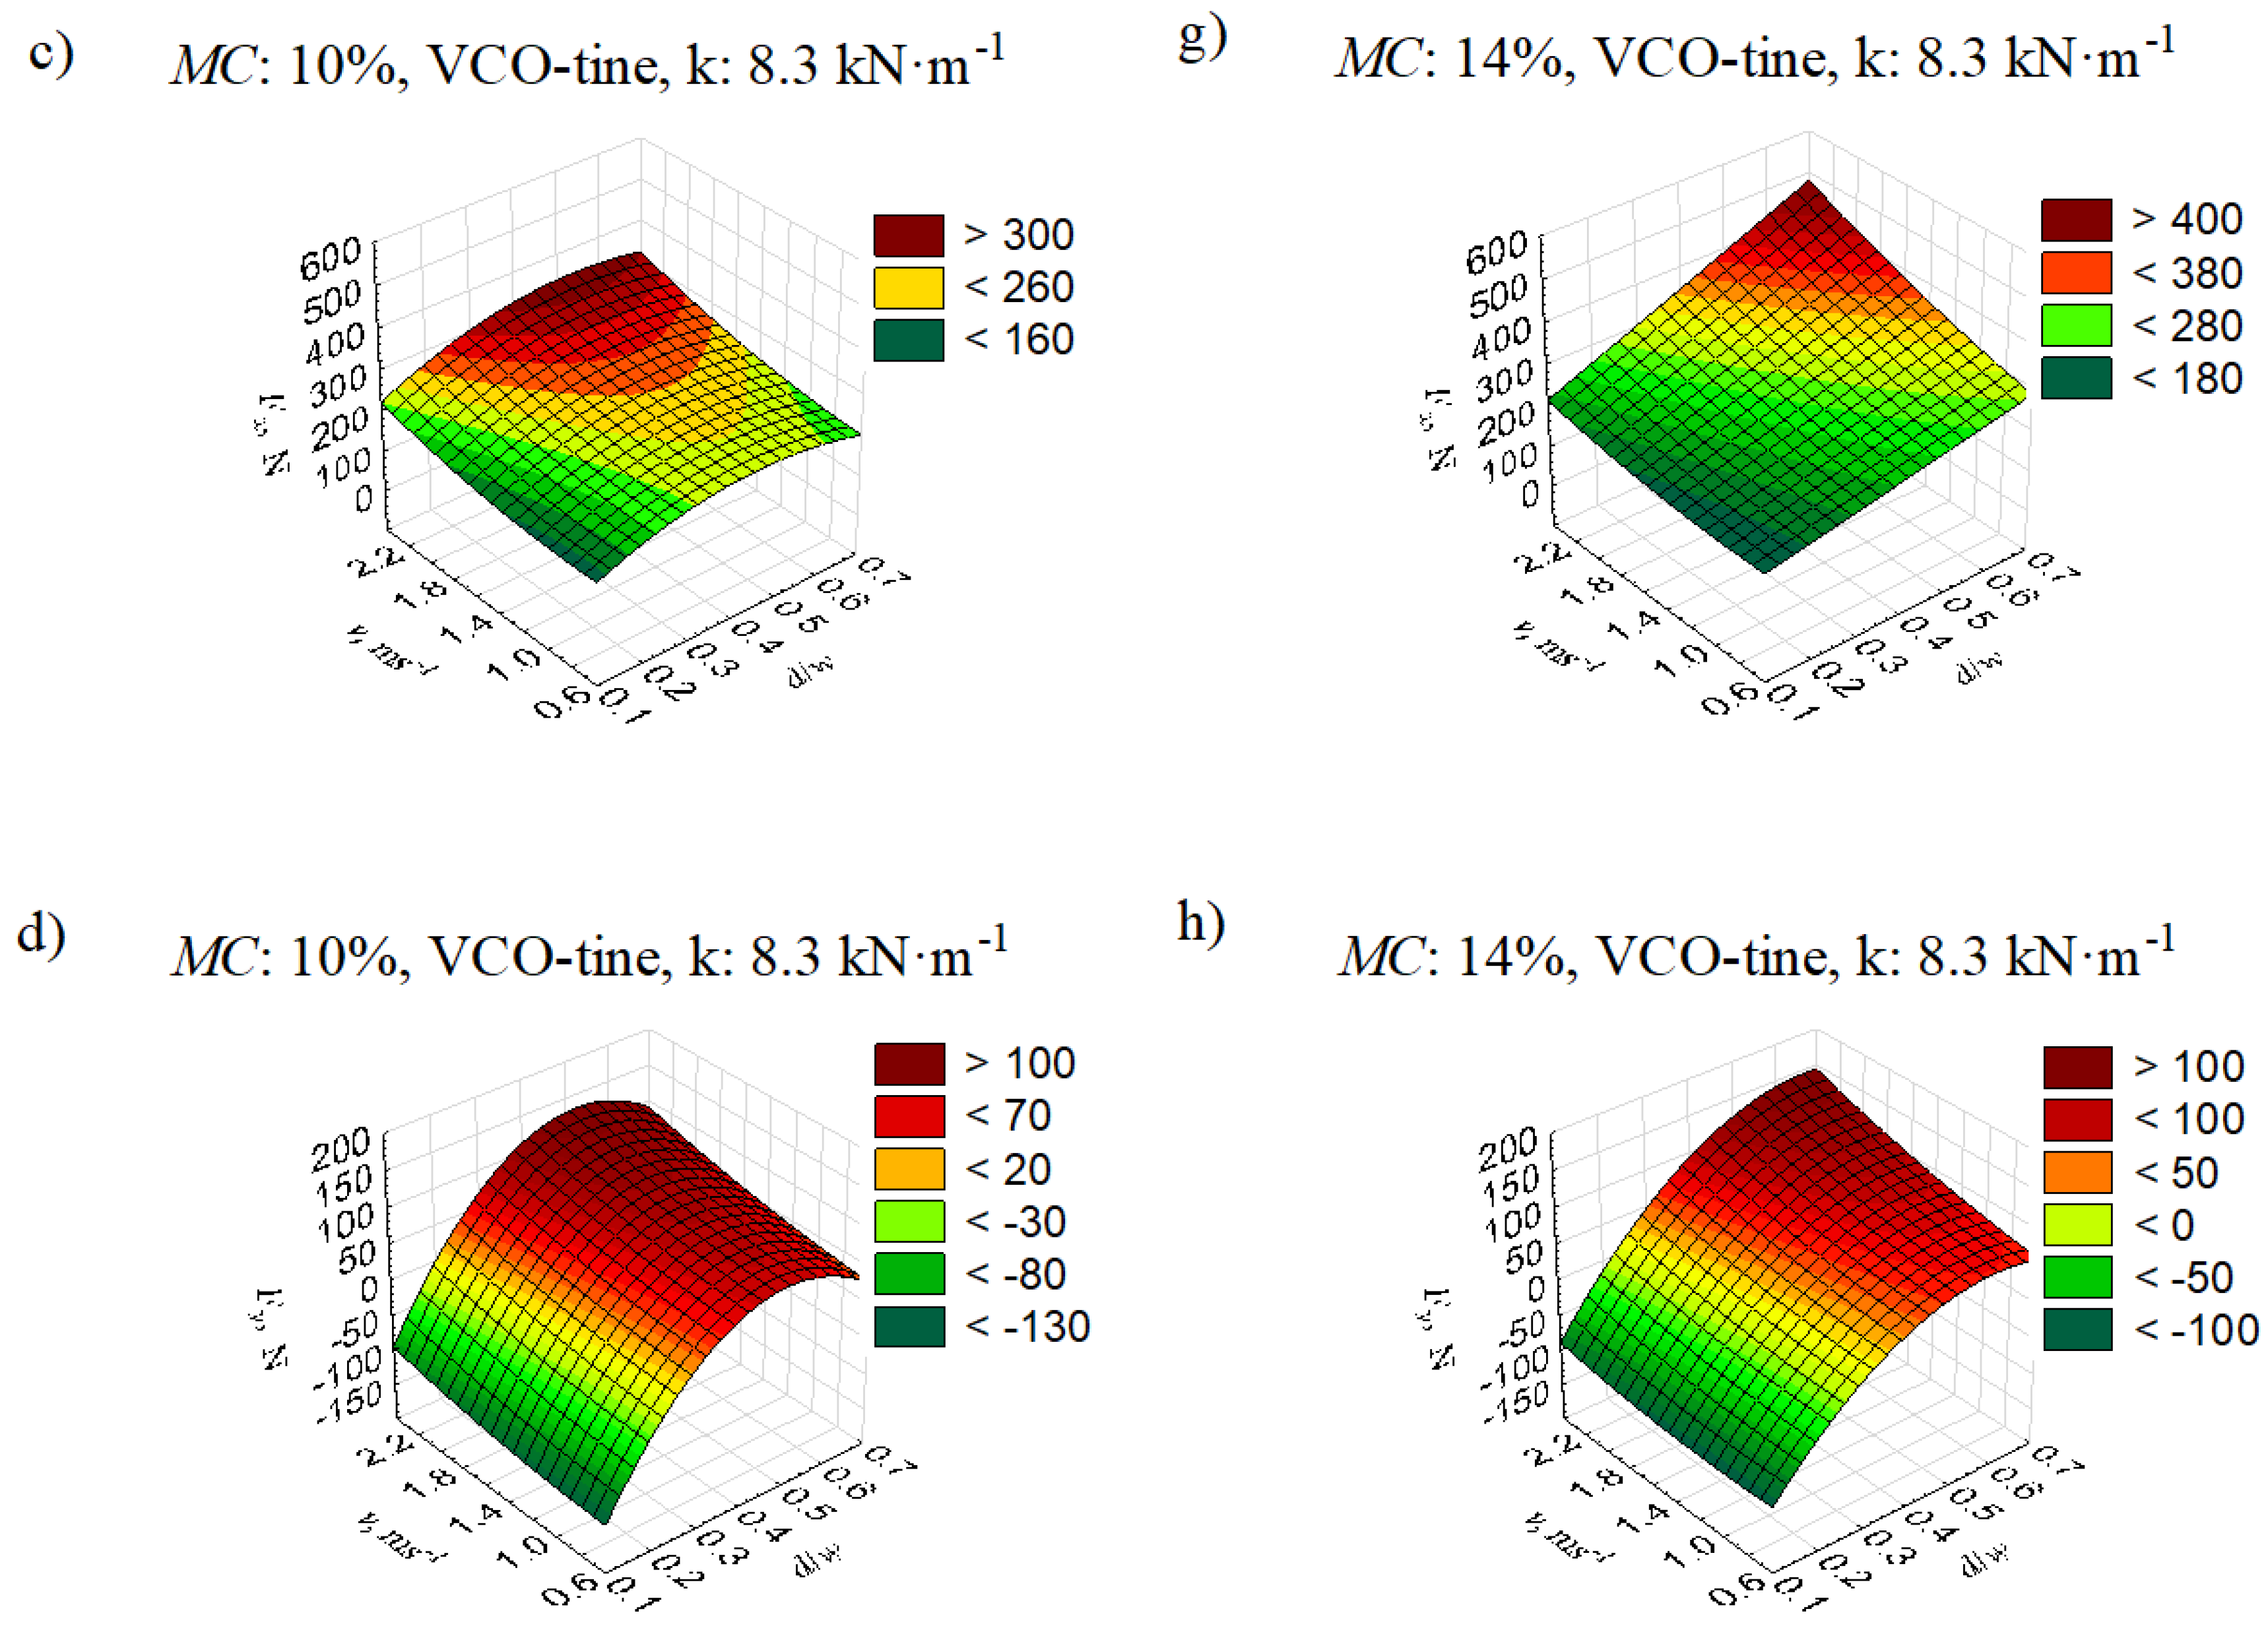
3.2.1. Detailed Model Description for Draught Force, Fx

The empirical model developed for draught force, Fx, considered the influence of several independent variables, such as stiffness, k, tool depth-to-width ratio, d/w, tool movement speed, v, and soil moisture, MC. The model also included interactions between these variables, including double, triple, and single quadrupole interactions. These were crucial for correctly mapping the effect of different combinations of factors on the value of draught force. A vital element of this model was to consider non-linear relationships, which allowed for more accurate prediction of draught forces under varying soil conditions.
The regression analysis results show that the speed of tool movement, v, and its square, v², are among the regression coefficients. The regression coefficient for the square of speed was 17.8, and the value of the Student's t-test for this variable reached 7.81, indicating the importance of this variable in the model. The speed of the implement's movement was one of the main factors determining the draught force, which is confirmed by previous studies indicating that an increase in speed leads to an increase in draught forces, especially in soils with higher cohesion and higher moisture content [37]. The soil flowing through the surface of the sweep was cracked, thus creating a loose soil effect. This result differs from narrow tools with a larger tooth angle [43] and a wide tool with a dimension of 200 mm [24]. At higher speeds, there was a more significant increase in tractive force with increasing height (thickness) of the tool's cutting edge, but this had little effect on vertical force [44]. In the study of three types of tines (S, Vibroflex, and with a double coil of a coiled spring) concerning the working speed on the draught force of the tines working on different soils, good correlations between the values of forces and velocities were found [45]. These results are consistent with soil deformation mechanics, which suggest that increasing the speed of the implement leads to an increase in dynamic forces, which in turn increases the pulling resistance.
Another essential element of the model was the depth ratio to the tool's width, d/w. The regression coefficient for this linear variable was -502, and the t-test value was -2.04, indicating a robust and negative effect of the ratio d/w on the value of the draught force. This confirms previous observations that a greater working depth concerning a smaller tool width increases pulling resistance [30]. In this context, increasing the ratio of d/w can increase resistance, which is especially important for tools of different widths. The negative regression coefficient may suggest that under certain conditions, an increase in the tool depth-to-width ratio leads to a decrease in tractive effort, confirming previous studies [30]. The negative regression coefficient given d/w should be considered in the context of interaction with other model variables, such as implement speed and soil moisture. The combined interaction of these parameters can modulate the effect of the variable d/w pulling power; therefore, increasing the ratio of d/w does not always lead directly to a reduction in resistance, and this effect can vary depending on the width of the tool and other operating conditions.
Interactions between variables played a vital role in the Fx model. Among the dual interactions, the product of the d/w ratio and the movement speed v (d/w × v) significantly affected the value of the draught force, with a regression coefficient of 1073 and a t-test value of 6.65. These results suggest that the combination of higher movement speed and the d/w ratio of the implement increased soil resistance, which is in line with expectations for the behaviour of agricultural implements in the soil. The conjunction of stiffness and speed k × v, the ratio of depth to width and soil moisture (d/w × MC), the movement speed and soil moisture (v × MC), the stiffness and soil moisture (k × MC), and the stiffness and the ratio of depth to width had a significant influence on the draught force (k × d/w). In addition, the quadruple interaction of all independent variables (k × d/w × v × MC) was significant. This indicates the complexity of the soil-tool interaction process, in which many factors act simultaneously and affect the final values of draught forces. Previous research shows that the draught force was greater for rigid tools than for flexible tools, and increasing the speed of the flexible tool increased the draught force. The d/w ratio also affects the effectiveness of soil loosening, directly affecting soil compaction and crop yields (Shkurenko 1960).
The analysis also showed that certain variables had a negative effect on the pulling power, indicating their mitigating effect on the tool's operating resistance. The most significant negative regression coefficient (-542) was assigned to the square of the tool depth-to-width ratio (d/w)². Such quadratic relationships are often observed in research on agricultural tools, where an increase in technical parameters above a specific value ceases to bring benefits in the form of increased tool efficiency [43]. The value of the draught force was negatively affected by regression coefficients with linear forms of all four independent variables k, d/w, v, and MC. Similarly, all triple conjunctions of the analysed parameters had a negative effect on the draught force: (k × d/w × v), (k × d/w × MC), (k × v × MC), and (d/w × v × MC). However, this negative effect of the variables should be considered in combination with other variables. Still, these negative values of regression coefficients with the variables highlighted may suggest that, under certain conditions, an increase in these variables did not necessarily lead to an increase in draught force. For example, increasing the moisture content of specific soil types may have led to a decrease in pulling resistance, which is consistent with the literature, which indicates that moist soil with one particular granulometric structure has less adhesion to implements, which reduces resistance to tool movement [39].
The models include the square of the speed, and the analyses above of empirical models show that the draught force is also affected by linear speed. Therefore, it can be concluded that further modification of the models should consider both forms of speed: quadratic and linear. It was indicated that the Söhne, McKyes, and Perumpral models should be modified for comprehensive tools, as the models have a more significant agreement between the predictive and experimental values for a narrow tool [46].
Overall, the model for the draught force, Fx, was highly complex, considering both linear and nonlinear relationships between independent variables, as well as interactions between these variables. The regression analysis showed that the tool movement speed and depth-to-width ratio significantly impacted the draught force. In contrast, stiffness and soil moisture had a more minor but significant effect. This model is essential to developing predictive methods for agricultural implements, enabling more accurate prediction of draught forces under varying operating conditions.

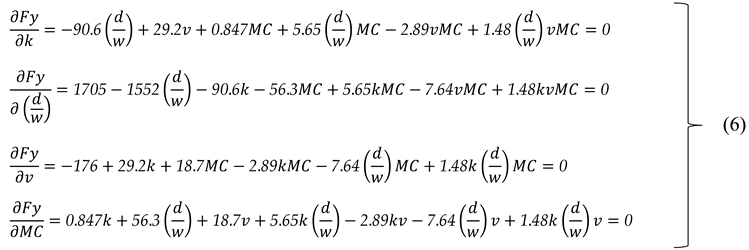
3.2.2. Model Description for Vertical Force, Fy

The empirical model for vertical force, Fy, considered vital independent variables, as did the model for draught force, Fx, i.e., stiffness, k, tool depth-to-width ratio, d/w, movement speed, v, and soil moisture. MC. However, due to other physical phenomena related to the vertical impact of the implement on the soil, not all variables and interactions had the same significant impact on the vertical force as in the case of the draught force.
As a result of the regression analysis, the ratio of the depth to the width of the tool, d/w. The regression coefficient for this variable was 1705, and the value of the Student's t-test reached 33.34, indicating a significant role of this variable in the model (Table 3). A high regression factor value meant that the greater the ratio of the depth to the width of the tool, the greater the vertical force acting on the tool. This variable, therefore, had a dominant influence on the Fy, which is in line with previous studies that highlight that the working depth of the tool concerning its width plays a crucial role in generating vertical forces when working in soil [30].
As with the Fx, tool movement speed, v, also significantly affected the value of the vertical force Fy, but its effect was negative. The regression coefficient for this variable was −176, and the t-test was −13.36. This result suggests that an increase in the tool movement speed resulted in a decrease in vertical force. This aligns with previous studies showing that soil can be ejected more efficiently at higher working speeds, reducing the vertical forces exerted on the implement [47]. In this context, the higher speed could have been conducive to more efficient lifting of the soil from the implement, which reduced vertical force.
The interactions between the variables were less meaningful in the model for vertical force Fy than in the model Fx, but a few were statistically significant. One crucial interaction was the combination of the depth-to-width ratio of the tool, d/w, and soil moisture, MC, which had a regression coefficient of −56.3 and a t-test value of −13.56. This interaction indicates that at higher soil moisture values, the effect of the d/w was weakened to vertical force. This result is consistent with the results of studies on soil-tool interactions, which suggest that under higher moisture conditions, soil tends to reduce the vertical resistance of the tool, which may be due to the lower soil cohesion associated with moisture [39].
In the Fy, as in the Fx, the squares of the variables were included, but not all of them were statistically significant. For example, the square of the movement speed, v², was rejected from the model because its effect on the vertical force was statistically insignificant. On the other hand, the square of the depth-to-width ratio (d/w)² had a significant negative impact on the vertical force, with a regression coefficient value of -776. This result suggests that at very high ratios d/w, the vertical force began to decrease, which may be because wide implements no longer move the soil upwards efficiently, and most of the forces are directed horizontally [30].
The linear influence of the stiffness k and its square k2 were rejected from the model as statistically insignificant. This result may be because the stiffness primarily affects the horizontal draught forces, not the vertical forces, which depend more on the implement geometry and soil conditions [38]. The most critical factors in the Fy were the tool's geometrical parameters, d/w, and movement speed, v.
In conclusion, the empirical model for vertical force, Fy, showed that the most significant factor influencing vertical force was the depth-to-tool width ratio, d/w, which had a dominant influence on the vertical forces generated. The tool movement speed, v, had a negative effect on the value of the vertical force, suggesting that higher working speeds led to a reduction in vertical resistance. Variable interactions, particularly those related to soil moisture, also significantly impacted the vertical force value, indicating the complexity of the soil-tool interaction process. This model allows for more accurate prediction of vertical forces, which is essential from the point of view of optimising the operation of agricultural tools and minimising their negative impact on the soil.

3.3. Optimisation of Parameters and Values of Objective Functions Fx and Fy

Partial derivatives concerning decision variables are presented as a system of four equations, separately for the model Fx, Eq. 5 and Fy, Eq. 6.
Preprints 148367 i001
Preprints 148367 i002
The maximum value of the draught force of 438.55 N (Table 5) was achieved with higher values of the variables k, d/w, and v. This confirms that tools with higher rigidity working at greater depths at higher speeds require more pulling power. Graphical interpretation of the objective function Fx and Fy are presented in graphs (Figure 2). In literature [30], the tool's higher stiffness and speed significantly increase the pulling resistance, especially in soils with higher moisture.
On the other hand, minimising the draught force of 98.98 N required working at lower depths at lower speeds, significantly reducing soil resistance. This aligns with research [43], which shows shallow tools generate less draught force, promoting energy savings in agricultural processes.
Vertical force optimisation, Fy, showed that, as in the case of pulling power, the maximum and minimum values were reached at the ends of the ranges of the technical variables. A maximum vertical force of 135.25 N was achieved at higher values k, d/w, and v, which means that higher tool stiffness, a larger depth-to-width ratio, and higher working speed led to a higher vertical force. These values align with the research [38], suggesting that tools working at greater depths and higher speeds generate higher vertical forces due to the more significant amount of soil being moved upwards.
Minimisation of vertical force (-84.55 N) was achieved at lower values k, d/w, and v, suggesting that reducing the tool's working depth, speed, and stiffness leads to lower vertical forces. Minimum values are consistent with the results [30], which indicate that tools that work shallowly and slower generate less vertical forces because less soil is moved upwards. A critical rake angle has already been calculated, related to the angle of friction of the soil with the metal, which is 22.5°, relative to which the vertical force changes the sign from positive to negative [48].
When working duckfoot at the lowest depth, the gravitational force of the soil resting on the tool and the vertical component of soil resistance was smaller than the vertical component of the soil breakout force by the tool's cutting edge [46]. Therefore, the vertical force value was negative at the lowest working depth. The negative vertical force can be assigned to natural sandy soil [38]. Thus, for very small angles of attack, the proportion of vertical force from the weight of the soil wedge was less than from the adhesion force.
The optimal values of the variables were at the ends of the considered ranges, suggesting that in the analysed conditions, the best results are achieved at the extremes of the technical variables. This is visible in all eight surface plots (Figure 2). The runs of these charts allow us to assume that a combination of values can be expected d/w and v for optimal forces Fx and Fy with maximum values. It is, therefore, advisable to carry out tests at higher velocities where a more significant influence of the square of the speed (v2) can be expected and with a higher depth-to-width ratio, d/w, e.g., by increasing the working depth. This would only be appropriate for cognitive purposes because expanding the depth of loosening excessively, e.g., in agricultural practice, would not be advisable. Due to the risk of covering plants with soil. In addition, a more significant relationship d/w would go beyond a wide tool's scope and apply to narrow tools. Particular attention should be paid to the same value of soil moisture MC = 14%, which was optimal for both maximum and minimum draught and vertical force values. This result indicates that soil with this moisture content offers optimal resistance to the tool, and changes in moisture outside this range can destabilise the tool's work process. This shows that with this moisture, the soil offers stable resistance to the implementation, which reduces variability in results. Soil moisture affects soil adhesion and friction, crucial for soil displacement during tool operation [39].
The developed mathematical, empirical models are characterised by minor relative errors, which for optimal values range from -1.72% to – 4.81% (negative values indicate an overestimation of the model concerning actual values).
Optimisation of the draught Fx and vertical Fy forces using partial derivatives and the SLSQP method provided detailed information on the influence of technical and environmental variables on the value of these forces. Introducing the variable k (stiffness) into the empirical model's Fx and Fy has enabled a more precise representation of the actual operating conditions of agricultural implements, which is essential for optimising machine operation and energy savings. The SLSQP optimisation method provided tools to accurately determine the values of variables that minimise or maximise draught and vertical forces, which is of great importance for agricultural practice.

5. Conclusions

The main research problem was the development of mathematical, empirical models for the prediction of draught force Fx and the vertical force component Fy, which take into account critical parameters of duckfoots, such as tine stiffness, k, tool depth-to-width ratio, d/w, tool movement speed, v, and soil moisture, MC, which has not been thoroughly analysed in the literature so far.
The developed empirical models aimed to accurately represent the values of the forces acting on the tool, considering the non-linear relationships between the independent variables and their interactions. These models allowed for a more comprehensive understanding of implement-soil interactions, which was crucial for optimising the operation of agricultural implements under different operating conditions. Previous studies, although focused on selected parameters such as working depth or movement speed, rarely considered the stiffness of the duckfoot fixing tine and soil moisture.
The results of statistical analyses and correlations showed that the values of forces Fx and Fy were most affected by the ratio d/w and the tool movement speed v. The d/w variable had the most significant effect on both forces (Fx and Fy), which was confirmed by the relatively high values of the Pearson correlation coefficients. The values of the multiple correlation coefficient for the models were not very large and were 0.4996 for Fx and 0.6227 for Fy. Still, all regression coefficients were statistically significant, so the type of study can be considered acceptable.
The operating parameters were optimised using partial derivatives concerning k, d/w, v, and MC. Then, the equation system was solved using the SLSQP method. The optimisation showed that the maximum values of the forces Fx and Fy were achieved at the extremes of the considered intervals of the technical variables. The maximum draught force was 438.55 N, achieved with higher variable values such as stiffness, the ratio of depth to width of the tool, and the speed of the tool movement. The minimum value of the draught force (98.98 N) was reached at lower values of the same variables.
Similarly, optimising the vertical force Fy indicated that the maximum value (135.25 N) was associated with higher values of the same parameters. In comparison, the minimum value of the vertical force (-84.55 N) was achieved with lower values of the variables. The optimal values were at the ends of the ranges, suggesting the possibility of further research into the complex soil-duckfoot relationships. The optimisation should also be extended to soil loosening efficiency, which is directly related to the state of soil compaction.
The analysis of the results indicates that relatively small relative errors for the optimal values were obtained for the developed mathematical empirical models, which confirms the model's agreement with the experimental results. The relative errors ranged from -1.72% to -4.81%, which is evidence of good prediction accuracy, and the negative values of the errors indicate a slight overestimation of the models compared to the actual values.
Based on the justifications carried out, there were no grounds to reject the hypothesis that the ratio of the depth to the width of the tool d/w, the movement speed v, the tine stiffness k, and the soil moisture MC have a significant effect on the draught Fx and the vertical Fy forces, as the experimental results showed agreement with the predictive values of empirical models.
The developed empirical models have limitations resulting from the range of analysed values and do not consider random factors that occur in actual conditions. Further research could be directed towards developing theoretical, more universal models that could evaluate a broader range of variables and more complex interactions, allowing for even more accurate predictions of the forces acting on agricultural implements under different environmental conditions.

Author Contributions

Conceptualization, A.L. and D.L.; methodology, D.L. and T.N.; software, A.L.; validation, A.L., J.K., J.C. and M.S.; formal analysis, D.L. and A.L.; investigation, A.L., D.L., T.N., J.K., A.Ś., M.S., J.C., J.K., K.K., M.D. and A.S.; resources, D.L.; data curation, D.L.; writing—original draft preparation, A.L. and D.L.; writing—review and editing, A.L., J.K., M.S. and J.C.; visualization, A.L.; supervision, A.L. and T.N.; project administration, A.L. All authors have read and agreed to the published version of the manuscript.

Funding

This research received no external funding.

Institutional Review Board Statement

Not applicable.

Informed Consent Statement

Not applicable.

Data Availability Statement

Data availability on request.

Acknowledgments

This work was funded by the National Centre for Research and Development and Kongskilde Poland Ltd., which is gratefully acknowledged.

Conflicts of Interest

The authors declare no conflicts of interest.

Abbreviations

The following abbreviations are used in this manuscript:
d Working depth of the tool, duckfoot, mm
df Furrow depth, mm
Fx Draught force, the horizontal component of the duckfoot pressure force on the soil in the XYZ system, N
Fy vertical component of the duckfoot pressure force on the soil in the XYZ system, N
k Spring constant, stiffness, kN·m–1
MC Soil moisture content, %
r Pearson's partial correlation coefficient, –
R Multiple correlation coefficient, –
v Speed of tool movement, m·s–1
w Width of the working element, tools, mm

References

  1. Shaheb, M.R.; Venkatesh, R.; Shearer, S.A. A Review on the Effect of Soil Compaction and its Management for Sustainable Crop Production. J. Biosyst. Eng. 2021, 46, 417–439. [Google Scholar] [CrossRef]
  2. Hamza, M.A.; Anderson, W.K. Soil compaction in cropping systems: A review of the nature, causes and possible solutions. Soil Tillage Res. 2005, 82, 121–145. [Google Scholar] [CrossRef]
  3. Shah, A.N.; Tanveer, M.; Shahzad, B.; Yang, G.; Fahad, S.; Ali, S.; Bukhari, M.A.; Tung, S.A.; Hafeez, A.; Souliyanonh, B. Soil compaction effects on soil health and crop productivity: an overview. Env. Sci Pollut Res 2017, 24, 10056–10067. [Google Scholar] [CrossRef] [PubMed]
  4. Keller, T.; Sandin, M.; Colombi, T.; Horn, R.; Or, D. Historical increase in agricultural machinery weights enhanced soil stress levels and adversely affected soil functioning. Soil Tillage Res. 2019, 194, 104293. [Google Scholar] [CrossRef]
  5. Hu, W.; Drewry, J.; Beare, M.; Eger, A.; Müller, K. Compaction induced soil structural degradation affects productivity and environmental outcomes: A review and New Zealand case study. Geoderma 2021, 395, 115035. [Google Scholar] [CrossRef]
  6. Tavanti, R.F.R.; Freddi, O. da S.; Marchioro, V.; Tavanti, T.R.; Galindo, F.; Wruck, F.J.; Shiratsuchi, L.; Breda, C.C. Least limiting water as a soil indicator in an integrated crop-livestock systems of the Cerrado, Brazil. Geoderma Reg. 2019, 19, e00232. [Google Scholar] [CrossRef]
  7. Iacomi, C.; Popescu, O. an Innovative Tool for in-Row Cultivation. Agrolife Sci. J. 2015, 4, 23–26. [Google Scholar]
  8. Chetty, J.; Mansuy, A.; Christina, M. Micro-Mechanization to Manage Weed in Sugar Cane. Sugar Tech 2024, 0–8. [Google Scholar] [CrossRef]
  9. Mt Pleasant, J.; Burt, R.F.; Frisch, J.C. Integrating mechanical and chemical weed management in corn (Zea mays). Weed Technol. 1994, 8, 217–223. [Google Scholar] [CrossRef]
  10. Brown, B.; Gallandt, E.R. Evidence of synergy with ‘stacked’ intrarow cultivation tools. Weed Res. 2018, 58, 284–291. [Google Scholar] [CrossRef]
  11. Badgujar, C.; Das, S.; Figueroa, D.M.; Flippo, D. Application of Computational Intelligence Methods in Agricultural Soil–Machine Interaction: A Review. Agric. 2023, 13, 1–39. [Google Scholar] [CrossRef]
  12. Makange, N.R.; Ji, C.; Torotwa, I. Prediction of cutting forces and soil behavior with discrete element simulation. Comput. Electron. Agric. 2020, 179, 105848. [Google Scholar] [CrossRef]
  13. Sishodia, R.P.; Ray, R.L.; Singh, S.K. Applications of remote sensing in precision agriculture: A review. Remote Sens. 2020, 12, 1–31. [Google Scholar] [CrossRef]
  14. Nkakini, S.O.; Vurasi, N.M. Effects of Moisture Content, Bulk Density and Tractor Forward Speeds on Energy Requirement of Disc Plough. Technology 2015, 6, 69–79. [Google Scholar]
  15. Obour, P.B.; Lamandé, M.; Edwards, G.; Sørensen, C.G.; Munkholm, L.J. Predicting soil workability and fragmentation in tillage: a review. Soil Use Manag. 2017, 33, 288–298. [Google Scholar] [CrossRef]
  16. Tim Chamen, W.C.; Moxey, A.P.; Towers, W.; Balana, B.; Hallett, P.D. Mitigating arable soil compaction: A review and analysis of available cost and benefit data. Soil Tillage Res. 2015, 146, 10–25. [Google Scholar] [CrossRef]
  17. AL-Halfi, K.M.M. Evaluation of deep tillage in cohesive soils of Queensland, Australia. 2021.
  18. Hoseinian, S.H.; Hemmat, A.; Esehaghbeygi, A.; Shahgoli, G.; Baghbanan, A. Development of a dual sideway-share subsurface tillage implement: Part 2. Effect of tool geometry on tillage forces and soil disturbance characteristics. Soil Tillage Res. 2022, 215, 105200. [Google Scholar] [CrossRef]
  19. Rahmanian-Koushkaki, H.; Mahmoodi-Eshkaftaki, M.; Azimi-Nejadian, H. Simulation of Draught Force During Chisel Ploughing Using Discrete Element Method. J. Biosyst. Eng. 2022, 47, 152–166. [Google Scholar] [CrossRef]
  20. Gursoy, S.; Ozaslan, C. Evaluating the performance of rotary and tine inter-row cultivators at different working speeds. J. Agric. Sci. Technol. 2021, 23, 1255–1267. [Google Scholar]
  21. Vangessel, M.J.; Schweizer, E.E.; Wilson, R.G.; Wiles, L.J.; Westra, P. Impact of timing and frequency of in-row cultivation for weed control in dry bean (Phaseolus vulgaris). Weed Technol. 1998, 12, 548–553. [Google Scholar] [CrossRef]
  22. Abbaspour-Gilandeh, Y.; Fazel-Niari, Z.; Shahgoli, G.; Bavafa, M. Design and construction of a high speed inter-row cultivator. Appl. Mech. Mater. 2012, 110–116, 4914–4918. [Google Scholar] [CrossRef]
  23. Keppler, I.; Hudoba, Z.; Oldal, I.; Csatár, A.; Fenyvesi, L. Discrete element modeling of vibrating tillage tools. Eng. Comput. (Swansea, Wales) 2015, 32, 308–328. [Google Scholar] [CrossRef]
  24. Manuwa, S.I. Performance evaluation of tillage tines operating under different depths in a sandy clay loam soil. Soil Tillage Res. 2009, 103, 399–405. [Google Scholar] [CrossRef]
  25. Kolb, E.; Legué, V.; Kolb, E.; Legué, V.; Phys-, M.B.P.R.I. Physical Root-Soil Interactions To cite this version : HAL Id : hal-01609984 Physical Root-Soil Interactions. 2017, 14.
  26. Aikins, K.A.; Barr, J.B.; Ucgul, M.; Jensen, T.A.; Antille, D.L.; Desbiolles, J.M.A. No-tillage furrow opener performance: A review of tool geometry, settings and interactions with soil and crop residue. Soil Res. 2020, 58, 603–621. [Google Scholar] [CrossRef]
  27. Mwiti, F.M.; Gitau, A.N.; Mbuge, D.O. Effects of soil-tool interaction and mechanical pulverization of arable soils in tillage-a comprehensive review. Agric. Eng. Int. CIGR J. 2023, 25, 75–94. [Google Scholar] [CrossRef]
  28. Walunj, A.; Chen, Y.; Tian, Y.; Zeng, Z. Modeling Soil–Plant–Machine Dynamics Using Discrete Element Method: A Review. Agronomy 2023, 13, 1–23. [Google Scholar] [CrossRef]
  29. Li, B.; Chen, Y.; Chen, J. Modeling of soil-claw interaction using the discrete element method (DEM). Soil Tillage Res. 2016, 158, 177–185. [Google Scholar] [CrossRef]
  30. Godwin, R.J. A review of the effect of implement geometry on soil failure and implement forces. Soil Tillage Res. 2007, 97, 331–340. [Google Scholar] [CrossRef]
  31. Damanauskas, V.; Janulevičius, A. Effect of tillage implement (spring tine cultivator, disc harrow), soil texture, forward speed, and tillage depth on fuel consumption and tillage quality. J. Agric. Eng. 2022, 53. [Google Scholar] [CrossRef]
  32. Lisowski, A.; Klonowski, J.; Green, O.; Świetochowski, A.; Sypuła, M.; Struzyk, A.; Nowakowski, T.; Chlebowski, J.; Kamiński, J.; Kostyra, K.; et al. Duckfoot tools connected with flexible and stiff tines: Three components of resistances and soil disturbance. Soil Tillage Res. 2016, 158, 76–90. [Google Scholar] [CrossRef]
  33. Eurocode 1 Part 4: Basis of design and actions on structures. Actions in silos and tanks; European Committee for Standardization, Amsterdam, 2006.
  34. Hegge, B.J.; Masselink, G. Spectral analysis of geomorphic time series: Auto-spectrum. Earth Surf. Process. Landforms 1996, 21, 1021–1040. [Google Scholar] [CrossRef]
  35. Hopkins, W.G. A New View of Statistics. Sportscience 2000, 1–7. [Google Scholar]
  36. Moré, J.J.; Sorensen, D.C. Computing a Trust-Region Step. SIAM J. Sci. Stat. Comput. 1983, 4, 553–572. [Google Scholar] [CrossRef]
  37. Luth, H.; Wismer, R. Performance of plane soil cutting blades in sand. Trans. Am. Soc. Agric. Eng. 1971, 14, 255–260. [Google Scholar] [CrossRef]
  38. Lejman, K.; Owsiak, Z.; Pieczarka, K.; Sekutowski, T. Vertical Forces Acting on Cultivator Tines in the Aspect of Shearing Speed and Flexibility of Tines. Agric. Eng. 2018, 22, 39–48. [Google Scholar] [CrossRef]
  39. Sahu, R.K.; Raheman, H. Draught Prediction of Agricultural Implements using Reference Tillage Tools in Sandy Clay Loam Soil. Biosyst. Eng. 2006, 94, 275–284. [Google Scholar] [CrossRef]
  40. Kushwaha, R.L.; Zhang, Z.X. Evaluation of factors and current approaches related to computerized design of tillage tools: A review. J. Terramechanics 1998, 35, 69–86. [Google Scholar] [CrossRef]
  41. Shmulevich, I.; Asaf, Z.; Rubinstein, D. Interaction between soil and a wide cutting blade using the discrete element method. Soil Tillage Res. 2007, 97, 37–50. [Google Scholar] [CrossRef]
  42. Garson, G.D. Fundamentals of Hierarchical Linear and Multilevel Modeling. Hierarchical Linear Model. Guid. Appl. 2014, 3–26. [Google Scholar] [CrossRef]
  43. McKyes, E.; Desir, F.L. Prediction and field measurements of tillage tool draft forces and efficiency in cohesive soils. Soil Tillage Res. 1984, 4, 459–470. [Google Scholar] [CrossRef]
  44. Fielke, J.M. Interactions of the cutting edge of tillage implements with soil. J. Agric. Eng. Res. 1996, 63, 61–71. [Google Scholar] [CrossRef]
  45. Bogrekci, I.; Godwin, R.J. Development of a mechanical transducer for real-time soil tilth sensing. Biosyst. Eng. 2007, 98, 127–137. [Google Scholar] [CrossRef]
  46. Onwualu, A.P.; Watts, K.C. Draught and vertical forces obtained from dynamic soil cutting by plane tillage tools. Soil Tillage Res. 1998, 48, 239–253. [Google Scholar] [CrossRef]
  47. Stafford, J. V. The performance of a rigid tine in relation to soil properties and speed. J. Agric. Eng. Res. 1979, 24, 41–56. [Google Scholar] [CrossRef]
  48. Spoor, G.; Godwin, R.J. An experimental investigation into the deep loosening of soil by rigid tines. J. Agric. Eng. Res. 1978, 23, 243–258. [Google Scholar] [CrossRef]
Figure 1. Duckfoots (a) and tool with flexible tine (1) and CS3D force sensor (2) and LDS 100-500P-S laser distance meter (3) mounted to the tool trolley (4) in the soil bin (b).
Preprints 148367 g001
Figure 2. Draught force Fx (a), (e), (c), (g) and vertical force Fy (b), (f), (d), (h) for the movement speed v and depth-width ratio d/w for soil moisture MC 10% (a), (b), (c), (d) and 14% (e), (f), (g), (h) and tines with a stiffness k of 5.3 kN·m–1 (a), (b), (e), (f) and 8.3 kN·m–1 (c), (d), (g), (h).
Preprints 148367 g002aPreprints 148367 g002b
Table 1. Results of the analysis of variance for draught forces Fx and vertical Fy concerning tool stiffness k, soil moisture MC, depth-to-width ratio d/w, and movement speed v and their interactions.
Force Fx Fy
Effect DF* SS MS F p-value SS MS F p-value
k 1 1.49E+07 1.49E+07 5288.0 <0.0001 876803 876803 399.2 <0.0001
MC 1 9.03E+05 9.03E+05 321.5 <0.0001 31339 31339 14.3 0.0002
d/w 8 1.80E+08 2.25E+07 8007.0 <0.0001 80128455 10016057 4559.3 <0.0001
v 2 2.26E+07 1.13E+07 4019.7 <0.0001 5281953 2640976 1202.2 <0.0001
k × MC 1 1.12E+06 1.12E+06 397.7 <0.0001 108663 108663 49.5 <0.0001
k × d/w 8 2.49E+06 3.12E+05 110.9 <0.0001 10755764 1344471 612.0 <0.0001
MC × d/w 8 4.97E+06 6.21E+05 221.3 <0.0001 2644064 330508 150.5 <0.0001
k × v 2 1.34E+06 6.72E+05 239.1 <0.0001 248686 124343 56.6 <0.0001
MC × v 2 3.49E+05 1.74E+05 62.1 <0.0001 20131 10066 4.6 0.0102
d/w × v 16 4.78E+06 2.99E+05 106.5 <0.0001 1144510 71532 32.7 <0.0001
k × MC × d/w 8 3.88E+06 4.84E+05 172.5 <0.0001 4609706 576213 262.3 <0.0001
k × MC × v 2 1.93E+05 9.64E+04 34.3 <0.0001 22809 11404 5.2 0.0056
k × d/w × v 16 5.39E+05 3.37E+04 12.0 <0.0001 302541 18909 8.6 <0.0001
MC × d/w × v 16 4.05E+05 2.53E+04 9.0 <0.0001 142454 8903 4.1 <0.0001
k × MC × d/w × v 16 7.39E+05 4.62E+04 16.4 <0.0001 109099 6819 3.1 <0.0001
Error 30222 8.49E+07 2.81E+03 66392971 2197
* DF, degrees of freedom; SS, sums of squares; MS, mean squares.
Table 2. Matrix of the values of the correlation coefficients of the independent variables (k, MC, d/w, and v) with the draught forces Fx and vertical Fy.
Parameter k MC d/w v Fx Fy
k 1.000
MC -0.123a 1.000
d/w -0.057a -0.010 1.000
v -0.033a -0.009 0.008 1.000
Fx 0.165a -0.019a 0.326a 0.257a 1.000
Fy 0.031a -0.032a 0.547a 0.168a 0.566a 1.000
k, the stiffness of the tool; MC, soil moisture content; d/w, the ratio of depth to width; v, movement speed. a: statistical significance at p-value = 0.05.
Table 3. Nonlinear models of draught Fx and vertical Fy forces with evaluation of regression coefficients βi and multiple correlation coefficient for R regression.
Force Fx Fy
Sign of βi βi SE* t-test p βi SE t-test p
β0 486 99.57 4.88 <0.0001 -267 7.14 -37.35 <0.0001
β1 -36.0 14.19 -2.54 0.0112
β2 -502 245.97 -2.04 0.0412 1705 51.15 33.34 <0.0001
β3 -368 65.94 -5.58 <0.0001 -176 13.17 -13.36 <0.0001
β4 -42.2 8.31 -5.08 <0.0001
β5
β6 -542 22.57 -24.01 <0.0001 -776 15.79 -49.14 <0.0001
β7 17.8 2.27 7.81 <0.0001
β8
β9 95.3 35.34 2.70 0.0070 -90.6 7.03 -12.87 <0.0001
β10 48.2 9.43 5.11 <0.0001 29.2 1.88 15.56 <0.0001
β11 4.18 1.20 3.49 0.0005 0.847 0.08 9.97 <0.0001
β12 1073 161.44 6.65 <0.0001
β13 104 20.53 5.05 <0.0001 -56.3 4.15 -13.56 <0.0001
β14 24.9 5.51 4.52 <0.0001 18.7 1.12 16.73 <0.0001
β15 -150 23.45 -6.41 <0.0001
β16 -10.1 2.99 -3.40 0.0007 5.65 0.63 8.97 <0.0001
β17 -3.63 0.80 -4.53 <0.0001 -2.89 0.17 -16.97 <0.0001
β18 -85.6 13.65 -6.28 <0.0001 -7.64 1.11 -6.89 <0.0001
β19 13.0 1.99 6.53 <0.0001 1.48 0.17 8.93 <0.0001
R 0.4996 0.6227
* SE, standard error; p, p-value.
Table 4. Analysis of variance and fit evaluation of mathematical models of draught Fx and vertical Fy forces.
Force Fx Fy
Effect SS* DF MS F-test p SS DF MS F-test p
Regression 1.68E+09 18 93089696 11216 <0.0001 110665024 13 8512694 2093 <0.0001
Residual 2.52E+08 30312 8300 123326543 30317 4068
Total 1.93E+09 30330 233991567 30330
Grand total 3.35E+08 30329 201439848 30329
Adjusted regression 1.68E+09 18 93089696 8421 <0.0001 110665024 13 8512694 1282 <0.0001
* SS, sums of squares; DF, degrees of freedom; MS, mean squares; F, Fisher-Snedecor value test.
Table 5. Values of optimal parameters and target functions for Fx and Fy models.
Variables Fxmin Fxmax Fymin Fymax
Tine stiffness k, kN·m⁻¹ 5.3 8.3 5.3 8.3
Tool depth to width ratio d/w, – 0.15 0.67 0.15 0.62
Tool speed v, m·s⁻¹ 0.84 2.31 0.84 2.31
Soil moisture, MC, 14 14 10 14
Optimum force value, N 98.98 438.55 -84.55 135.25
Value of measured force, N 102.88 431.15 -80.67 132.74
Model Error, % 3.79 -1.72 -4.81 -1.89
Disclaimer/Publisher’s Note: The statements, opinions and data contained in all publications are solely those of the individual author(s) and contributor(s) and not of MDPI and/or the editor(s). MDPI and/or the editor(s) disclaim responsibility for any injury to people or property resulting from any ideas, methods, instructions or products referred to in the content.
Copyright: This open access article is published under a Creative Commons CC BY 4.0 license, which permit the free download, distribution, and reuse, provided that the author and preprint are cited in any reuse.
Prerpints.org logo

Preprints.org is a free preprint server supported by MDPI in Basel, Switzerland.

Subscribe

Disclaimer

Terms of Use

Privacy Policy

Privacy Settings

© 2025 MDPI (Basel, Switzerland) unless otherwise stated