
Submitted:
09 July 2025
Posted:
10 July 2025
You are already at the latest version
Abstract
The tractive performance of Unmanned Amphibious Tracked Vehicles (UATV) is critical for executing towing operations in coastal environments. This study focuses on optimizing track and grouser structural parameters to enhance UATV drawbar pull, particularly under soft soil conditions. A numerical soil thrust model for single-track shoes was developed based on track-soil interaction mechanics, revealing distinct mechanistic roles: track structural parameters (length/width) govern pressure-sinkage relationships at the track base, while grouser structural parameters (height, spacing, V-shaped angle) dominate shear stress-displacement dynamics on grouser shear planes. A novel DEM-MBD coupling simulation framework was established through soil parameter calibration and multi-body dynamics modeling, demonstrating that soil thrust increases with grouser height and V-shaped angle, but decreases with spacing with grouser height exhibiting the highest sensitivity. Soil bin test validated the numerical model’s accuracy and the coupling method’s efficacy. Parametric optimization via the Whale Optimization Algorithm (WOA) achieved a 55.86% increase in drawbar pull, 4.04% reduction in ground contact pressure and 57.33% improvement in maximum gradability. These advancements significantly enhance UATV tractive performance in beach areas. The proposed methodology provides a systematic framework for amphibious vehicle design, integrating numerical modeling, high-fidelity simulation, and experimental validation.
Keywords:
numerical modle
; DEM-MBD coupling simulation
; soil bin test
; optimization design
; tractive performance
1. Introduction
Large-scale equipment operating on islands requires substantial fuel supply, which is transported through pipelines. The UATV can directly tow pipelines from offshore supply vessels to designated terrestrial locations. The UATV sequentially traverses marine zones, water-sediment mixed terrains, and beach areas, achieving fully automated operation with enhanced safety and efficiency. The vehicle’s configuration is illustrated in Figure 1. The vehicle is equipped with four segmented tracks, each independently driven by an electric motor. The tractive performance on beach is a critical metric for evaluating the UATV’s capabilities. This performance is determined not only by the engine’s output power and transmission efficiency but also by the soil thrust generated through soil-track interaction. In track design, structural parameters such as track length, width, grouser height, spacing, and V-shaped angle significantly influence soil thrust, making rational structural design of the track system essential. Current research predominantly focuses on stress analysis, wear failure mechanisms, and material optimization of track components, while studies on optimizing track and grouser structural parameters remain limited. However, such optimization holds substantial theoretical and practical value for improving the tractive performance of tracked vehicles on soft soil.
The tractive performance of tracked vehicles is predominantly influenced by the driving force, where increased driving force enhances acceleration and obstacle negotiation capability on complex terrains. However, the effective utilization of the driving force not only depends on the soil-track interaction mechanism, but is also closely linked to the grouser-track structural parameters [1,2]. In 1913, R. Bernstein of Germany proposed the foundational expression relating track sinkage depth to ground contact pressure [3]. This theory was subsequently refined by scholars including E.W.E. Micklethwait [4], M.G. Bekker [5], and Z. Janosi [6,7], culminating in the establishment of the traction characteristics theoretical model for tracked vehicles by A.R. Reece and J.Y. Wong [8,9,10], which remains widely adopted in terramechanics research. These scholars also conducted seminal investigations into the grouser effect. Reece established an additional traction force model based on static equilibrium during soil failure [11]. Bekker developed a complementary model utilizing Boussinesq's stress distribution theory to quantify grouser-induced traction enhancement [12]. J.Y. Wong further advanced this field by deriving horizontal forces acting on grousers through passive earth pressure theory [13]. As evidenced by these models, grouser height exhibits significant influence on drawbar pull. Furthermore, structural parameters including grouser shape, herringbone angle, and spacing collectively modulate the bulldozing effect and shear stress distribution [14]. In 2004, Liu Zhensheng investigated the performance of grousers in desert soil conditions based on soil mechanics theory, systematically analyzing the tractive performance of tracks in dry sand environments [15]. In 2008, South Korean researchers W.Y. Park et al. employed mathematical models to elucidate the relationship between tracked vehicle design parameters and soil properties, demonstrating that ground contact pressure exhibits a curvilinear distribution and predicting tractive performance variations on soft soil [16]. In 2010, Wu Hongyun conducted a comprehensive study on the adhesion behavior of track shoes and grousers in soft cohesive substrates for deep-sea mining vehicles. He developed a mathematical model for adhesion forces and evaluated structural influences on adhesion performance [17].
In early-stage research, empirical formulas, numerical calculations, and scale model tests were primarily employed to investigate soil-track interaction mechanism. With advancements in computational technology, simulation-based methodologies have become increasingly prevalent. The Finite Element Method (FEM) enables analysis of stress distribution and plastic deformation in deformable soils under track loading, providing theoretical foundations for optimizing track shoe structural parameters and characterizing soil-track traction mechanisms. Researchers J.P. Hambleton and A. Drescher at the University of Minnesota conducted pioneering studies using 2D/3D FEM simulations to quantify the effects of soil parameters, dilation angle, and wheel geometry on the pressure-sinkage relationship of rigid cylindrical wheels [18,19]. Yang Congbin further developed a soil FEM model integrating elastic theory and the Mohr-Coulomb Criterion, validating an adhesion force model between track shoes and terrain through Abaqus simulations [20]. However, FEM exhibits inherent limitations in simulating dynamic processes such as soil particle collisions, sliding, and frictional interactions. Its applicability diminishes when modeling large soil deformations under mechanical loading or scenarios where soil cannot be treated as a continuum [21]. These constraints are effectively addressed by the Discrete Element Method (DEM), a numerical approach that discretizes the domain into independently moving particles governed by inter-particle contact mechanics. DEM excels in simulating grouser-soil interaction dynamics, particularly in capturing granular flow patterns and localized shear failure mechanisms. In 2021, Shaikh et al. experimentally and via DEM simulations demonstrated that grouser height significantly influences tractive performance, with its efficacy varying across soil moisture conditions [22,23]. Concurrently, Li Yong et al. investigated the impact of track shoe structural parameters on the tractive performance of underwater tracked bulldozers, explicitly accounting for hydrodynamic effects in submerged environments [24]. In 2023, South Korean researchers J.T. Kim et al. employed DEM to analyze grouser shape ratios in coastal beach terrains, identifying optimal geometric proportions for maximizing traction [25]. In 2024, Xie Dongbo established a dynamics model of tracked locomotion systems interacting with straw-mixed soils using DEM-MBD (Multi-Body Dynamics) coupling simulations, validating the interaction mechanisms between tracks and fibrous soil matrices [26]. The DEM-MBD coupling model integrates the advantages of discrete granular analysis and multi-body dynamics, serving as a robust numerical tool for simulating complex system interactions and dynamic behaviors. This methodology provides an efficient simulation framework for investigating how grouser structural parameters modulates drawbar pull, while substantially reducing the prohibitive costs associated with full-scale field testing.
A critical synthesis of prior research reveals three primary limitations: First, existing studies predominantly focus on soil-track interaction mechanisms under varying conditions and soil types, while systematic investigations into the influence of track and grouser structural parameters on tractive performance, along with their parametric optimization, remain notably scarce. Second, early-stage research heavily relied on experimental validation. Although this approach ensures high precision, its applicability is constrained to single-track configurations per experimental iteration, resulting in prolonged experimental cycles and substantial human/material resource expenditures, thereby compromising research efficiency. Third, regarding simulation methodologies, early research primarily relied on the FEM; however, this approach fails to accurately simulate granular-scale interactions between soil particles or dynamic soil-track interface behaviors. Recent advancements have seen a paradigm shift, with an increasing number of scholars adopting the DEM, thereby offering a novel methodological framework for this study.
To address the aforementioned three research gaps, this study focuses on optimizing the structural parameters of tracks and grousers for UATV. A numerical soil thrust model for track shoes is established based on terramechanics theory. DEM-MBD coupling simulations are employed to investigate the effects of track and grouser structural parameters on soil thrust, while concurrently validating the numerical model. The accuracy of the numerical model and the efficacy of the coupling simulation methodology are further verified through soil bin test on track shoes, yielding a validated mathematical optimization framework. Finally, single-track drawbar pull is selected as the optimization objective to iteratively refine structural parameters. The research methodology is systematically outlined in Figure 2.
2. Numerical Model and Analysis
The track length and width are directly related to the ground contact pressure. Grousers generate shear forces through soil-track interaction, propelling the vehicle forward, with their height, shape, and spacing being critical factors influencing tractive performance. Therefore, establishing a numerical model for the interaction between tracks\grousers and soil based on terramechanics theory holds significant importance for structural parameter analysis and optimization.
2.1. Single Grouser Soil Thrust Numerical Model
Grouser geometries are primarily categorized into three types: straight-line, V-shaped, and W-shaped. The straight-line grouser fails to form enclosed spaces during operation, resulting in limited efficacy in enhancing soil compaction and drawbar pull, alongside inferior lateral slip resistance. In contrast, V-shaped and W-shaped grousers generate enclosed spatial configurations through their geometric profiles, thereby amplifying soil compaction and drawbar pull via compressive and shear interactions. In this study, the vehicle employs a narrow-track configuration. Given dimensional constraints that preclude the application of W-shaped grousers, the V-shaped design is selected. As illustrated in Figure 3, the left panel depicts the actual grouser morphology, while the right panel shows its theoretical simplified model, where denotes the oblique rib width and represents the V-shaped angle.
The V-shaped track can be conceptualized as two straight-line tracks joined symmetrically. We first conduct a mechanical analysis of the straight-line configuration. As illustrated in Figure 4, the sandy soil thrust generated by a single grouser comprises five distinct components: shear force at the track shoe base、shear force at the grouser base、shear forces on track shoe sides、shear forces on grouser sides and Soil reaction force induced by grouser bulldozing action.
The calculation can be performed using the normal stress-sinkage relationship proposed by Bekker for static soil deformation conditions:
where is the cohesive modulus of the soil, is the frictional modulus of the soil, is the track width, is the soil subsidence index, and represents the sinkage.
The shear stress in soil is calculated as:
where is the soil cohesion, is the soil’s internal friction, is the shear modulus of the soil, and is the normal pressure on the shear surface, is the shear deformation of the soil.
The slip ratio is calculated as:
where is the actual UATV speed, is the track linear speed, is the rotational speed of the track’s active wheel, and is the track’s active wheel radius.
At each point along the length of the track grounding surface, the shear deformation of the soil can be expressed as follows:
Let denote the distance from a given point on the track contact patch to the leading edge of the contact patch, then:
and can be determined via stress integration:
During tracked vehicle motion, grousers and track shoes induce relative displacement with surrounding soils. The forces exerted by the track on the soil can be modeled as strip loads acting on a semi-infinite elastic medium. By treating the soil as an elastic continuum, the internal stress distribution can be calculated using Boussinesq's stress theory. The stress distribution diagram is illustrated in Figure 5.
According to elasticity theory, the stress components at any point within a semi-infinite elastic medium are expressed as:
where is angles between an arbitrary point at depth and the load application plate under strip load influence.
When , the stress at any point within the semi-infinite elastic medium is expressed as:
From , and can be expressed as follows:
where is ground contact pressure, is load borne by single track shoe.
Taking the straight-line grouser configuration as an example, as the track shoe advances forward, the sandy soil undergoes displacement due to grouser-induced compression. Based on Rankine's earth pressure theory, the soil in this region is assumed to be in a Rankine passive earth pressure state. The soil is subjected to a uniformly distributed load from the track shoe base. The vertical stress acting on a soil element at depth is calculated by directly superimposing onto the vertical principal stress of the soil element, as illustrated in Figure 6.
The passive earth pressure intensity at depth is given by:
where is passive earth pressure, is passive earth pressure coefficient, , is internal friction angle of soil, is the soil bulk density, is depth of soil.
From the preceding equation, the earth pressure acting on the grouser exhibits a trapezoidal distribution along depth . Consequently, the horizontal thrust exerted on a straight-line grouser is calculated as:
For oblique grouser segments, the horizontal thrust component is:
Total horizontal thrust acting on the grouser is:
The soil thrust force for a single grouser can be calculated as:
2.2. Single Track Soil Thrust Numerical Model
The model is simplified for analytical tractability. Key assumptions include: The track-wheel assembly's center position remains stationary during motion, with no lateral slippage; Only center-of-gravity position and motion resistance are considered in determining the contact forces between track shoes and terrain.
Building upon Bekker's theory, the ground contact pressure formula is derived as:
where is vertical load on the track, is track shoe length, is track shoe width.
For UATV, the grouser thickness is negligible. Thus, the shear forces at the grouser base are equivalently lumped to the track shoe base.
The total soil thrust along the entire track base is calculated as:
Each additional grouser contributes 4.93% of the soil thrust generated by the first grouser [27]. The soil thrust acting on the grouser shear plane of the track shoe is modified as:
Based on the single track shoe formula derived earlier, the soil shear forces acting on flanks of the entire track can be derived as:
Total soil thrust for a single track is then expressed as:
2.3. Numerical Analysis
Analysis of the derived soil thrust formula for single track reveals that the soil thrust at the grouser base and track shoe base (F1) is primarily influenced by track length (L) and width (b), with negligible contributions from grouser structural parameters. In contrast, the soil thrust on grouser shear planes (F2) depends on track structural parameters (L, b) and grouser structural parameters (h, l, α), while thrust at track and grouser flanks (F3) is dominated by grouser height (h) and track width (b). Track structural parameters (L, b) govern the magnitudes of F1, F2, and F3, whereas grouser structural parameters (h, l, α) exclusively affect F2 and F3.
By substituting sandy soil and track structural parameters into the soil thrust formula, the influence of track structural parameters (L, b) on F1, F2, F3, and H is analyzed in Figure 7. As can be seen from Figure 7(a), F1 and H increase with track length (L), while F2 decreases, and F3 remains unaffected. As can be seen from Figure 7(b), F1, F2, and H increase with track width (b), whereas F3 decreases. Track structural parameters (L, b) exhibit a more pronounced impact on F1. The effects of grouser structural parameters (h, l, α) on F2 and F3 are shown in Figure 8. As can be seen from Figure 8(a), Both F2 and F3 increase with grouser height (h), with F2 showing significant enhancement. As can be seen from Figure 8(b), F2 decreases with grouser spacing (l), while F3 remains unaffected. As can be seen from Figure 8(c), F2 increases with V-shaped angle (α), whereas F3 shows no dependency.
In summary, track structural parameters predominantly govern soil thrust at grouser bases and track shoe bases through their deterministic influence on pressure-sinkage relationships, while grouser parameters dictate shear plane thrust via modulation of shear stress-displacement behavior, with grouser height demonstrating the most pronounced effect. Rational design of track structural parameters and grouser structural parameters can effectively enhance soil thrust, thereby improving vehicle tractive performance.
3. Coupling Simulation Model and Analysis
3.1. Soil Parameter Calibraion
The simulation methodology demonstrates advantages in computational efficiency and explicit parameter relationships. However, the accuracy of soil physical parameters and tracked vehicle operational parameters is directly dependent on soil parameter calibration. Particularly when employing the DEM for sand soil bin simulation modeling, it is imperative to strictly adhere to the physical-mechanical properties of authentic sandy soil.
This study calibrated the contact parameters between sand soil particles and those between the sand soil and the track through a series of simulation experiments. A sand soil bin simulation environment closely approximating the mechanical properties of actual road surfaces was established, thereby enhancing the fidelity of the simulation methodology.
Firstly, the contact parameters were constrained within a narrow range through angle of repose tests and corresponding simulations. Subsequently, triaxial compression tests with confining pressures set at 100 kPa, 200 kPa, and 300 kPa were conducted alongside corresponding simulations. The parameters derived from the angle of repose tests were implemented in the simulations, and the resulting stress-strain curves were systematically compared with experimental triaxial compression data. As shown in Figure 9. This methodology enabled the acquisition of high-precision sand soil contact parameters. Furthermore, sliding plate tests and corresponding simulations were performed to obtain accurate contact parameters between the sand soil and track, with the finalized parameters summarized in Table 1.
3.2. Track Shoe Coupling Simulation Model
Based on the calibrated sand soil parameters, a sand soil bin was established in the discrete element software EDEM. The sand soil was modeled using spherical particles, with interparticle interactions governed by the Hertz-Mindlin (no slip) contact model, which explicitly excludes cohesive forces between particles. The soil bin simulation model was constructed through particle packing, featuring dimensions of 2.5 m in length, 1 m in width, and 0.2 m in height, as illustrated in Figure 10 (a).
Within the multi-body dynamics software Recurdyn, track shoe models with varying structural parameters were developed, with motion constraints and actuation mechanisms implemented. Intermediate files were subsequently generated and imported into software EDEM. Upon activating the coupling interface to execute the simulation, real-time data exchange and synchronized computation between the two software platforms were achieved. The coupling simulation model is illustrated in Figure 10 (b).
Figure 11 (a) presents the velocity contour map of sand soil particles during 1 s of tracked vehicle operation. During the track shoe movement, substantial particle motion is induced by grouser compaction and track shear effects. Particles ahead of the grouser exhibit significantly higher velocities compared to other regions, with velocity magnitudes decaying as the distance from the grouser increases. Beneath the track shoe, particle velocities progressively diminish with increasing soil depth, reaching zero at the bottom layer of the soil bin. This observation conclusively demonstrates that the soil bin depth satisfies the experimental requirements for boundary condition simulation. Figure11 (b) displays the force contour map of sand soil particles under identical operational conditions. Particles ahead of the grouser experience significantly greater forces compared to those along the track flanks, with force magnitudes intensifying to proximity to the grouser. This phenomenon originates from the soil thrust generated by the grouser exceeding that produced along the track flanks, which aligns conclusively with numerical analysis predictions. In summary, the kinematic behavior of sand soil under simulated conditions demonstrates strong congruence with empirical observations, thereby validating the reliability of the DEM-MBD coupling simulation methodology.
3.3. Simulation Analysis
To investigate the influence patterns of track shoe soil thrust with respect to vertical load, grouser height, grouser spacing, and V-shaped angle configuration, four sets of simulation experiments were established. The soil shearing rate of the track shoe was maintained at 0.2 m/s across all simulations. Experimental parameters were configured as follows: vertical loads of 5000 N, 7500 N, and 10000 N; grouser height variations of ±5 mm relative to the 15 mm baseline; grouser spacing variations of ±25 mm relative to the 75 mm baseline; and V-shaped angle variations of ±15° relative to the 45° baseline. The complete experimental parameter matrix is detailed in Table 2.
Comparative analyses between simulation and numerical results were conducted for each experimental group, as graphically presented in Figure 12, Figure 13, Figure 14 and Figure 15. Subplots (a) in Figure 12, Figure 13, Figure 14 and Figure 15 present the simulated temporal evolution of track shoe soil thrust. During the 0 s to 0.6 s phase, a transient force equilibrium between the track shoe and sand soil occurs under self-weight and inertial effects, during which no forward velocity is applied to the track shoe. The 0.6 s to 0.7 s interval exhibits velocity acceleration from 0 m/s to 0.2 m/s. From 0.7 s to 1.4 s, kinematic interaction between the track shoe and sand soil induces dynamic fluctuations in soil thrust. Beyond 1.4 s, the soil thrust demonstrates progressive convergence toward steady-state values. Subplots (b) in Figure 12, Figure 13, Figure 14 and Figure 15 display the numerical results of track shoe soil thrust (solid lines) alongside simulation outputs (diamond markers) under varying conditions. As shown in Figure 12, soil thrust exhibits a positive correlation with vertical load magnitude. The simulation results demonstrate strong agreement with the numerical model, thereby validating the efficacy of DEM. Figure 13 reveals that grouser height exerts a pronounced influence on soil thrust, with thrust values increasing to grouser height. Conversely, Figure 14 indicates a marginal inverse relationship between grouser spacing and soil thrust. Figure 15 illustrates that soil thrust moderately escalates with increasing V-shaped angles. The observed deviations between simulation and numerical results remain within 4.73%, confirming a high degree of model fidelity.
In summary, the accuracy and efficacy of the numerical methodology were validated through DEM-MBD coupling simulations. The analysis revealed that soil thrust exhibits a positive correlation with grouser height, demonstrates an inverse relationship with grouser spacing, and moderately escalates with increasing V-shaped angles. Furthermore, grouser height emerges as the dominant influencing factor.
4. Experimental Validation
The soil bin test method demonstrates superior control over environmental conditions, offering advantages including reduced temporal and economic costs, shortened testing cycles, and high measurement accuracy. As illustrated in Figure 16, the testing apparatus comprises a horizontal rail, vertical rail, counterweight system, tension meter, data acquisition unit, and the soil bin. The test on track shoe is mounted at the base of the vertical rail, where the counterweight mechanism applies vertical loads. Horizontal tensile forces are continuously monitored and recorded via the tension meter's real-time measurement capabilities.
Track shoes with varying specifications were installed at the base of the vertical rail, with six repeated trials conducted for each configuration. The averaged tensile forces were recorded, and the corresponding experimental parameters and results are detailed in Table 3.
Comparative analyses among experimental measurements(circular markers), simulation outputs (diamond markers), and numerical results (solid lines) are graphically presented in Figure 17. Subplots (a)-(c) respectively depict the effects of grouser height, spacing, and V-shaped angle on soil thrust. As evidenced by the figures, soil thrust demonstrates a pronounced positive correlation with increasing grouser height, its influence is significant. Conversely, an inverse relationship is observed between soil thrust and grouser spacing, though its impact is marginal. Similarly, while soil thrust exhibits a moderate escalation with larger V-shaped angles, the impact of this parameter is also marginal. The observed deviations between experimental measurements and numerical results remain within 5.16%. This conclusively validates both the predictive accuracy of the numerical computational model and the efficacy of the coupling simulation methodology.
Figure 18 displays the track imprint patterns generated by the tracked vehicle's movement on sandy soil. Observations indicate that regular sediment accumulation forms ahead of the grousers due to shear interaction between the grousers and sand soil. Shallower sand soil accumulation along the track flanks demonstrates that soil thrust on the grouser shear plane exceeds that on both the grouser sides and track edges, consistent with numerical model analysis. The consistency between coupling simulation results (velocity and force contour maps) and soil bin test observations validates the effectiveness of the coupling simulation methodology.
5. Structural Parameter Optimization Design
Using single-track drawbar pull as the objective function and incorporating constraints including vehicle power consumption and operational parameters, the Whale Optimization Algorithm (WOA) was employed to optimize structural parameters encompassing track length, width, grouser height, spacing, and V-shaped angle.
Enhancing the tractive performance of a single track cannot be solely pursued through maximizing soil thrust, as variations in thrust inherently alter track resistance dynamics. Therefore, drawbar pull optimization must account for four primary resistance components: bulldozing resistance, compaction resistance, rolling resistance, and grade resistance.
The leading edge of the track shoe generates bulldozing resistance by pushing sand soil to form an elevated frontal wave, which is mathematically expressed as:
where and is bearing capacity factors under local shear failure, ,,.
The compaction resistance generated by track-induced soil densification is formulated as:
The drawbar pull of a single track, serving as the objective function, is defined by:
where is the rolling resistance coefficient and has a value of 0.15.
The power consumption during track operation must not exceed the maximum power output of a single track, while the soil thrust on the grouser shear plane is derived from the Rankine passive earth pressure theory. The optimization constraints are:
As the UAV retracts its track system during aquatic locomotion to minimize hydrodynamic resistance, the structural parameters of the track are constrained by the vehicle's overall architecture. The design variables encompass track length, width, grouser height, spacing, and V-shaped angle, with initial values and parametric bounds specified in Table 4.
The WOA, a novel swarm intelligence algorithm inspired by humpback whales' foraging strategies, achieves optimal solutions through theoretical models encompassing search, encirclement, and bubble-net hunting behaviors. Through iterative computation of this algorithm combined with unmanned tracked vehicle design qualification standards, an optimal track parameter configuration was derived to maximize single-track drawbar pull. The optimization outcomes are detailed in Table 5. Taking into account the optimization results and the vehicle structure, a portion of the front face of the original front wheelhouse was removed. The optimized vehicle structure is shown in Figure 19.
The driving performance comparison between original and optimized tracks under straight-line motion is shown in Table 6. Key metrics include: a reduction of 4.04% in ground contact pressure, a 55.86% increase in drawbar pull, an 18.76% drawbar pull improvement from grouser optimization, and a 57.33% enhancement in maximum gradability. The optimized track configuration ensures sufficient tractive performance and climbing capability, while reduced ground pressure mitigates sinkage risks, enabling adaptability to complex terrains.
6. Conclusions
This study systematically investigated the influence of track and grouser structural parameters on the tractive performance of UATVs through numerical modeling, DEM-MBD coupling simulations, and soil bin test. A mathematical model for optimization design was established and subsequently applied to refine the structural parameters of the track system and grousers. The conclusions drawn from this study are given as follows:
Firstly, this study established a numerical soil thrust model for single-track shoes based on terramechanics theory, conducting a detailed analysis of the influence mechanisms of structural parameters on soil thrust at three critical zones: the grouser base and track base, the grouser shear plane, and the track/grouser flanks. The results revealed that track structural parameters (length, width) primarily govern soil thrust on grouser base and track base by modulating pressure-sinkage relationships, while grouser structural parameters (height, spacing, V-shaped angle) predominantly affect grouser shear planes through their impact on shear stress-displacement interactions, demonstrating distinct mechanical coupling effects across these domains.
Secondly, through soil parameter calibration and dynamics software modeling, this study proposes a DEM-MBD coupling simulation method to investigate the interaction mechanisms between grouser structural parameters and soil thrust, while validating the numerical model's accuracy. Specifically, soil thrust increases with grouser height and V-shaped angle but decreases with grouser spacing. Among these structural parameters, grouser height exhibits the most pronounced influence on soil thrust.
Subsequently, soil bin test further validated the accuracy of the numerical model and efficacy of the coupling simulation methodology, providing novel insights for investigating grouser-terrain interaction mechanisms.
Finally, the structural parameters of the track and grousers were refined through optimization design. The optimized track configuration demonstrates a 4.04% reduction in ground contact pressure, a 55.86% increase in drawbar pull, and a 57.33% improvement in maximum gradability. These improvements substantially elevate the UATV's tractive performance in beach areas, particularly under soft soil conditions.
In summary, this study not only provides novel experimental and simulation methodologies for investigating the tractive performance of tracked vehicles, but also holds significant engineering applicability for optimizing track and grouser structural parameters to enhance vehicular tractive performance.
Author Contributions
Yaoyao Chen wrote the manuscript and developed the dynamic model and the DEM model; Xiaojun Xu assisted with the structural parameter optimization design; Wenhao Wang was in charge of the numerical calculations; Xue Gao assisted with the simulation in Recurdyn; Congnan Yang assisted with the soil bin test. All authors have read and agreed to the published version of the manuscript.
Funding
This study was supported in part by the National Natural Science Foundation of China under grants 52205485,52202485 and 52201387.
Data Availability Statement
The data are contained within the article.
Acknowledgments
We thank Yuanjiang Tang for assisting with the simulations in EDEM.
Conflicts of Interest
The authors declare no conflicts of interest.
References
- Ling Wang, Xuguang Chen, Lizhen Wang, et al. Mechanical properties and soil failure process of interface between grouser of tracked mining vehicle and deep-sea sediment. Ocean Engineering,2023, 285(1), 115336. [CrossRef]
- Junzheng Li, Songlin Sun, Chaoran Sun, et al. Analysis of Effect of Grouser Height on Tractive Performance of Tracked Vehicle under Different Moisture Contents in Paddy Soil. Agriculture,2022, 12(1581), 1581. [CrossRef]
- Bernstein R. Problems of the Experimental Mechanics of Motor Ploughs. Der Motorwagen, 16, 1913.
- Micklethwait E W E. Soil Mechanics in Relation to Fighting Vehicles. Military College of Science, Chertsey, Chertsey, England, 1994.
- Bekker M G. Theory of Land Locomotion. The University of Michigan Press, Ann Arbor, Michigan, 1956.
- Z. Janosi and B. Hanamoto. Analytical determination of drawbar pull as a function of slip for tracked vehicles in deformable soils. In Proceedings of the 1st International Conference on terrain-vehicle system, Turin, Italy, 1961.
- Z Janosi; Hanamoto B. Analysis and Presentation of Soil-vehicle Mechanics Data. Terramechanics, 1965, 2(3),69-79.
- Reece AR. Principles of Soil-vehicle mechanics. Terramechanics, 1965, 180(2),45-67. [CrossRef]
- Wong JY, Reece AR. Prediction of Rigid Wheel Performance Based on the Analysis of Soil-wheel Stresses: Part I: Performance of Driven Rigid Wheels. Terramechanics, 1967, 4(1),81-98. [CrossRef]
- Wong JY, Reece AR. Prediction of Rigid Wheel Performance Based on the Analysis of Soil-wheel Stresses: Part II. Performance of Towed Rigid Wheels. Terramechanics, 1967, 4(2),7-25. [CrossRef]
- Zhang Kejian. Vehicle-Terrain Mechanics. Beijing: National Defense Industry Press, 2002: 323.
- Bekker Mieczyslaw Gregory, Introduction to terrain-vehicle system. University of Michigan Press, 1969.
- Wong J. Y, Theory of Ground Vehicles. Canada: John Wiley&Sons, INC. 2001.
- Wang Jiangang. Effect of grouser shape on tangential traction force of crawler tractors. Laiyang Agricultural College, 1990,4, 314-318.
- Liu Zhensheng, Kong Jiangsheng, Li Jumei. Analysis of track adhesion capability in dry sandy soil areas. Agricultural Mechanization Research, 2004,3, 250-252.
- W.Y. Park, Y.C. Chang, S.S. Lee, J.H. Hong, J.G. Park, K.S. Lee. Prediction of the tractive performance of a flexible tracked vehicle. Terramechanics, 2008,45,13-23. [CrossRef]
- Wu Hongyun, Chen Xinming, Liu Shaojun, et al. Effect of adhesive substrate between track shoes and grousers on adhesion performance of mining collectors. Transactions of the Chinese Society of Agricultural Engineering, 2010,10,140-145.
- J.P. Hambleton, A. Drescher. Modeling wheel-induced rutting in soils: Indentation. Terramechanics, 2008,45,201–211. [CrossRef]
- J.P. Hambleton, A. Drescher. Modeling wheel-induced rutting in soils: Rolling. Terramechanics, 2009,46,35–47. [CrossRef]
- Congbin Yang. Research on the Adhesion Property of High-speed Track on Soft Ground and Optimization of Track Shoe. Beijing Institute of Technology 2015. (in Chinese).
- Yang P, Zang M, Zeng H .DEM–FEM simulation of tire–sand interaction based on improved contact model. Computational Particle Mechanics, 2019,1-15.
- Shaikh S A, Li Y, Ma Z, et al. Discrete element method (DEM) simulation of single grouser shoe-soil interaction at varied moisture contents. Computers and Electronics in Agriculture. 2021,191:106538-. [CrossRef]
- Shaikh S A, Li Y, Zheng M, et al. Effect of Grouser Height on the Tractive Performance of Single Grouser Shoe under Different Soil Moisture Contents in Clay Loam Terrain. Sustainability.2021, 13. [CrossRef]
- He D, Si Q, Meng X, et al. Effect of track shoes structural parameters on traction performance of unmanned underwater tracked bulldozer. Ocean engineering. 2021, (237-Oct.1). [CrossRef]
- Kim J T, Choi H J, Oh Y J. Optimization of grouser shape ratio for coastal terrain driving device using discrete element method. Terramechanics. 2023, 110(Dec.) ,27-37. [CrossRef]
- Xie D, He J, Liu T, et al. Establishment and validation the DEM-MBD coupling model of flexible straw-Shajiang black soil-walking mechanism interactions. Computers and electronics in agriculture, 2024, 224(000), 16. [CrossRef]
- Lei Xueyuan. Optimal Design of the Track Shoe for Tracked Vehicle. Beijing Institute of Technology.2016. (in Chinese).
Figure 1.
Model of UATV.
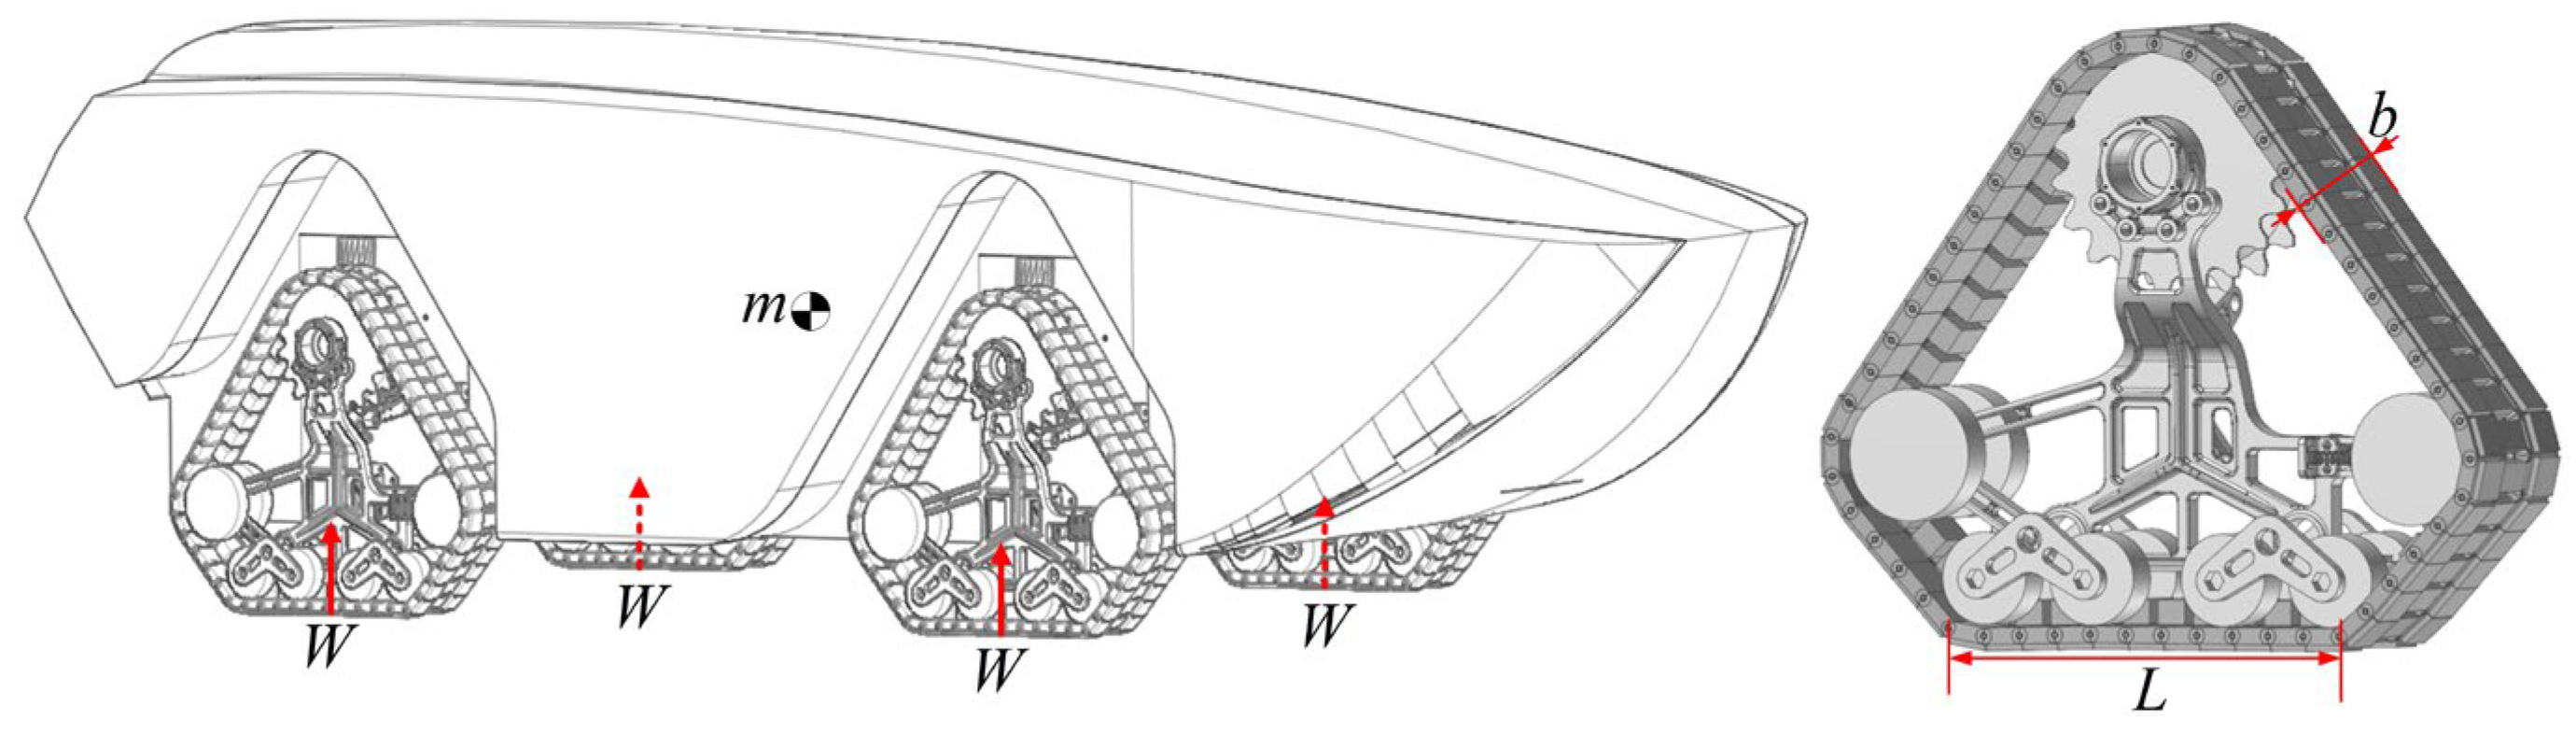
Figure 2.
Research methodology.
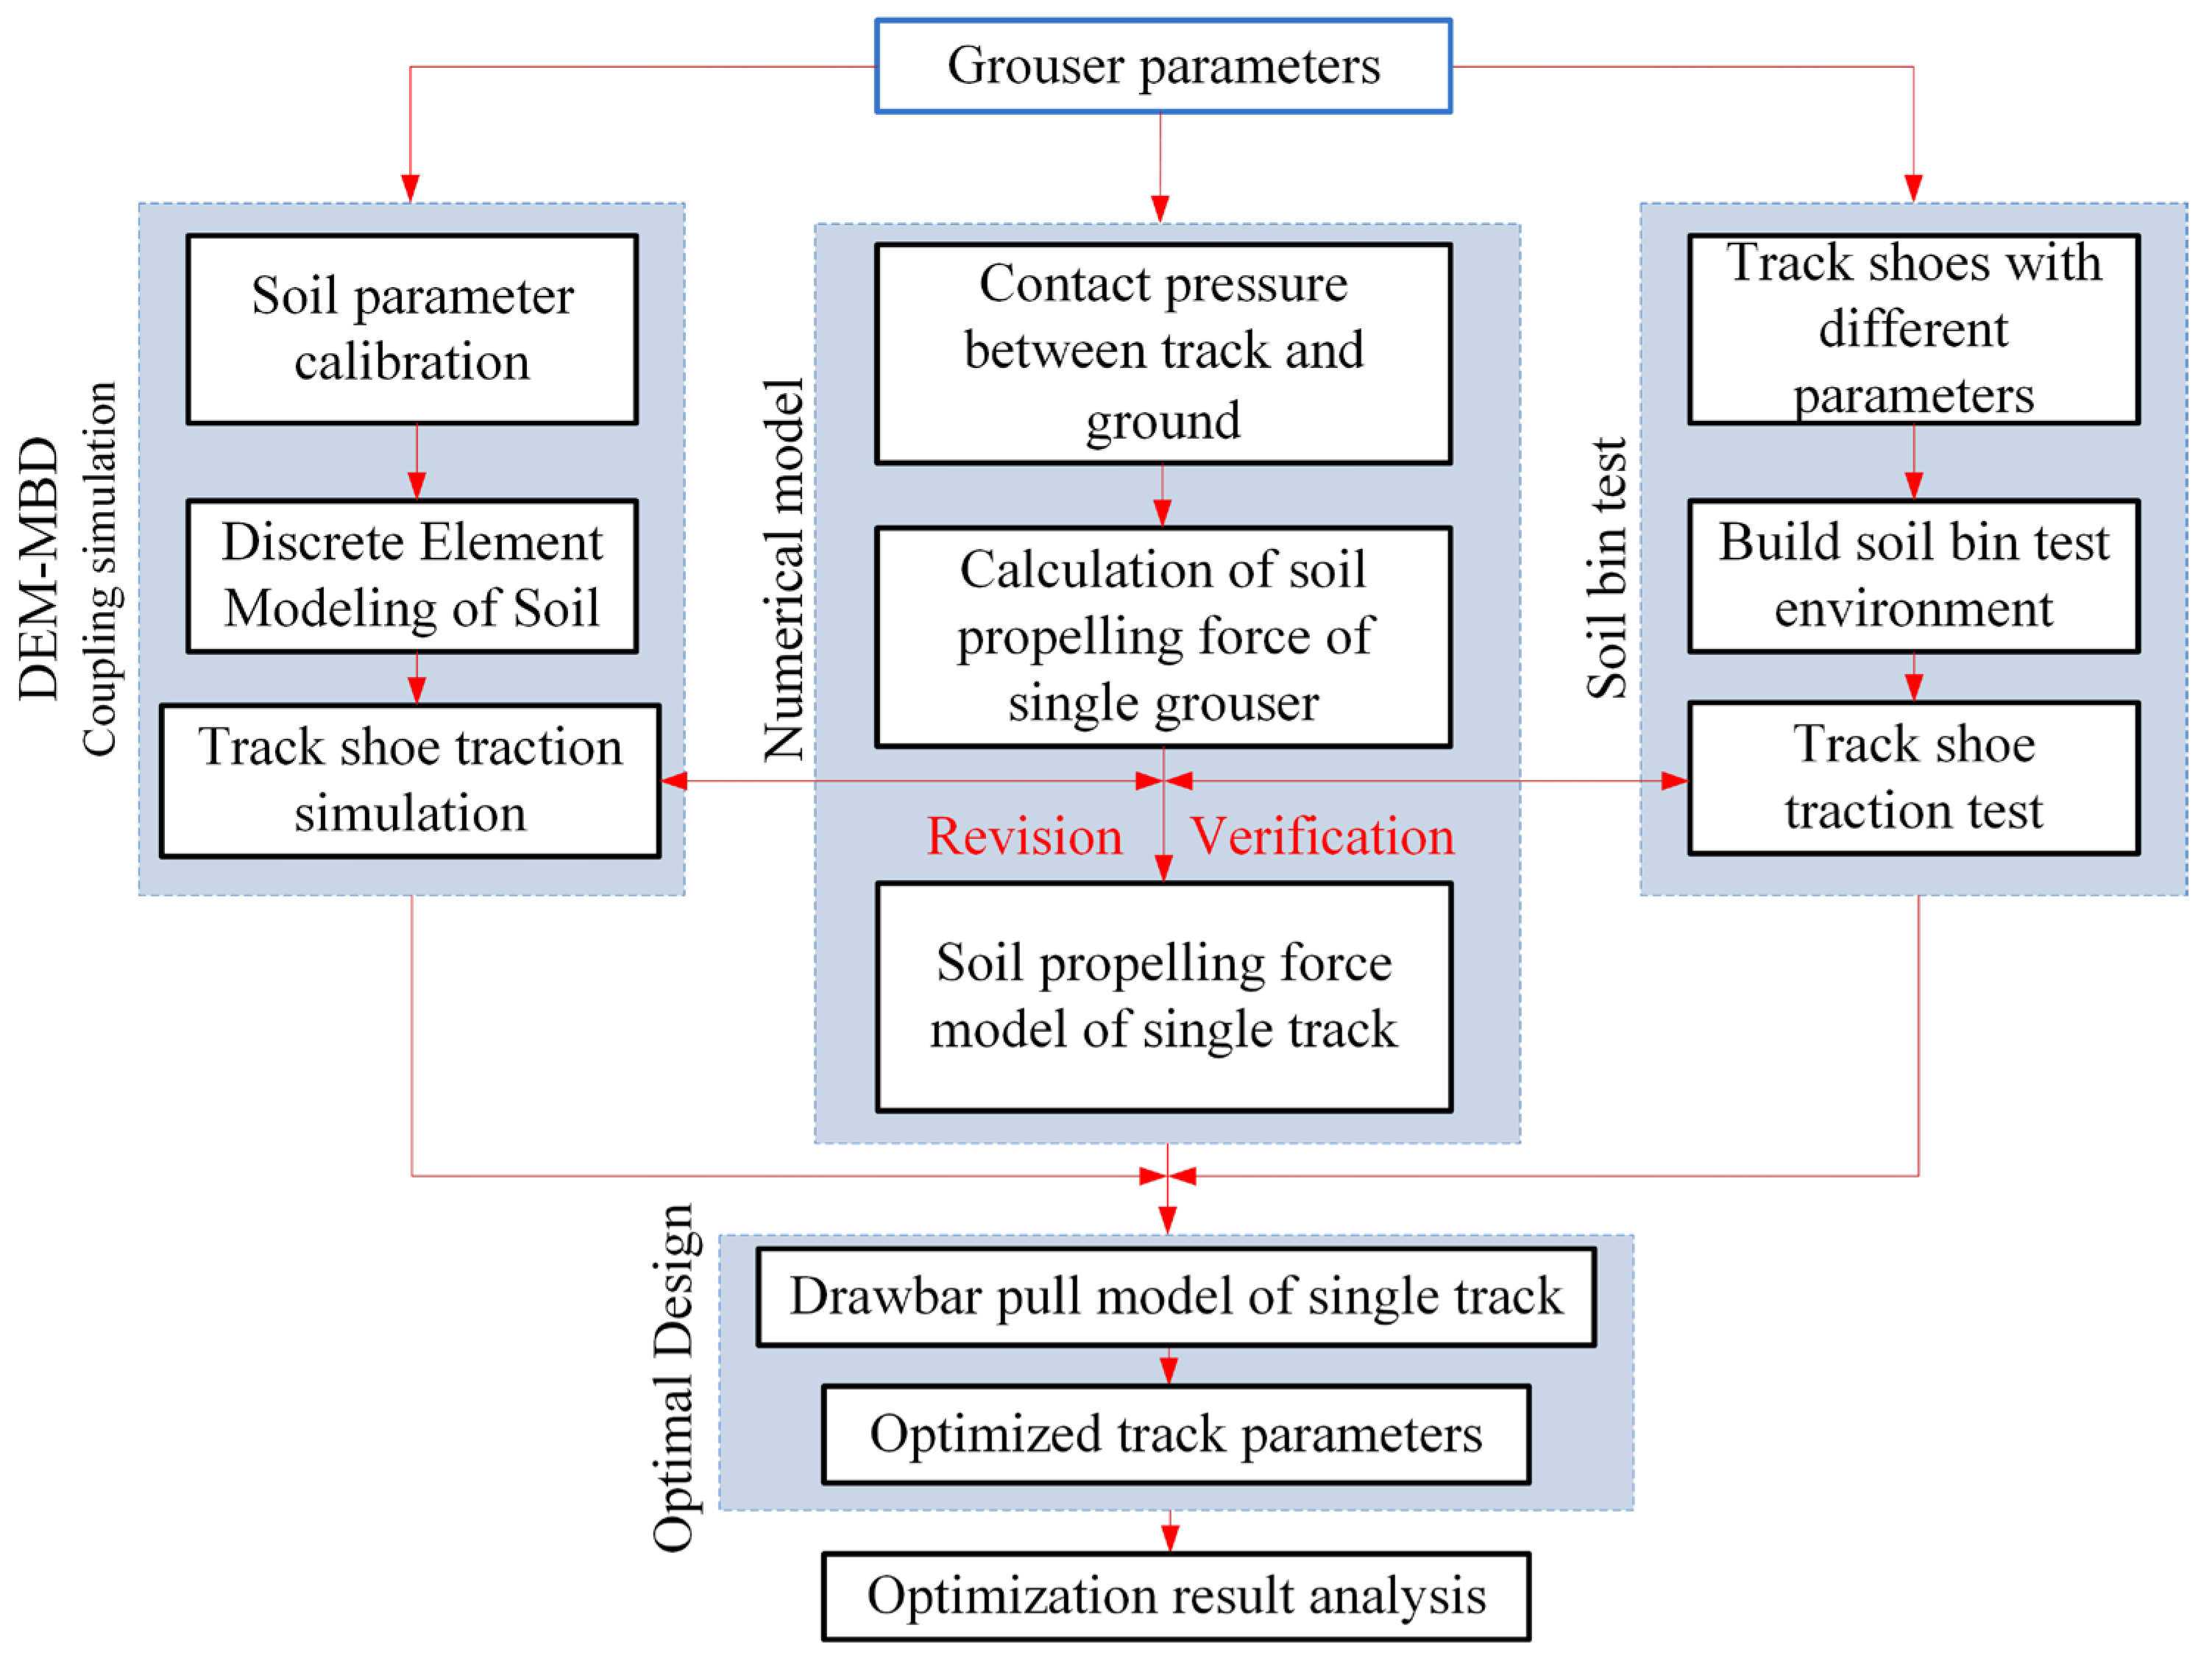
Figure 3.
Grouser diagram.
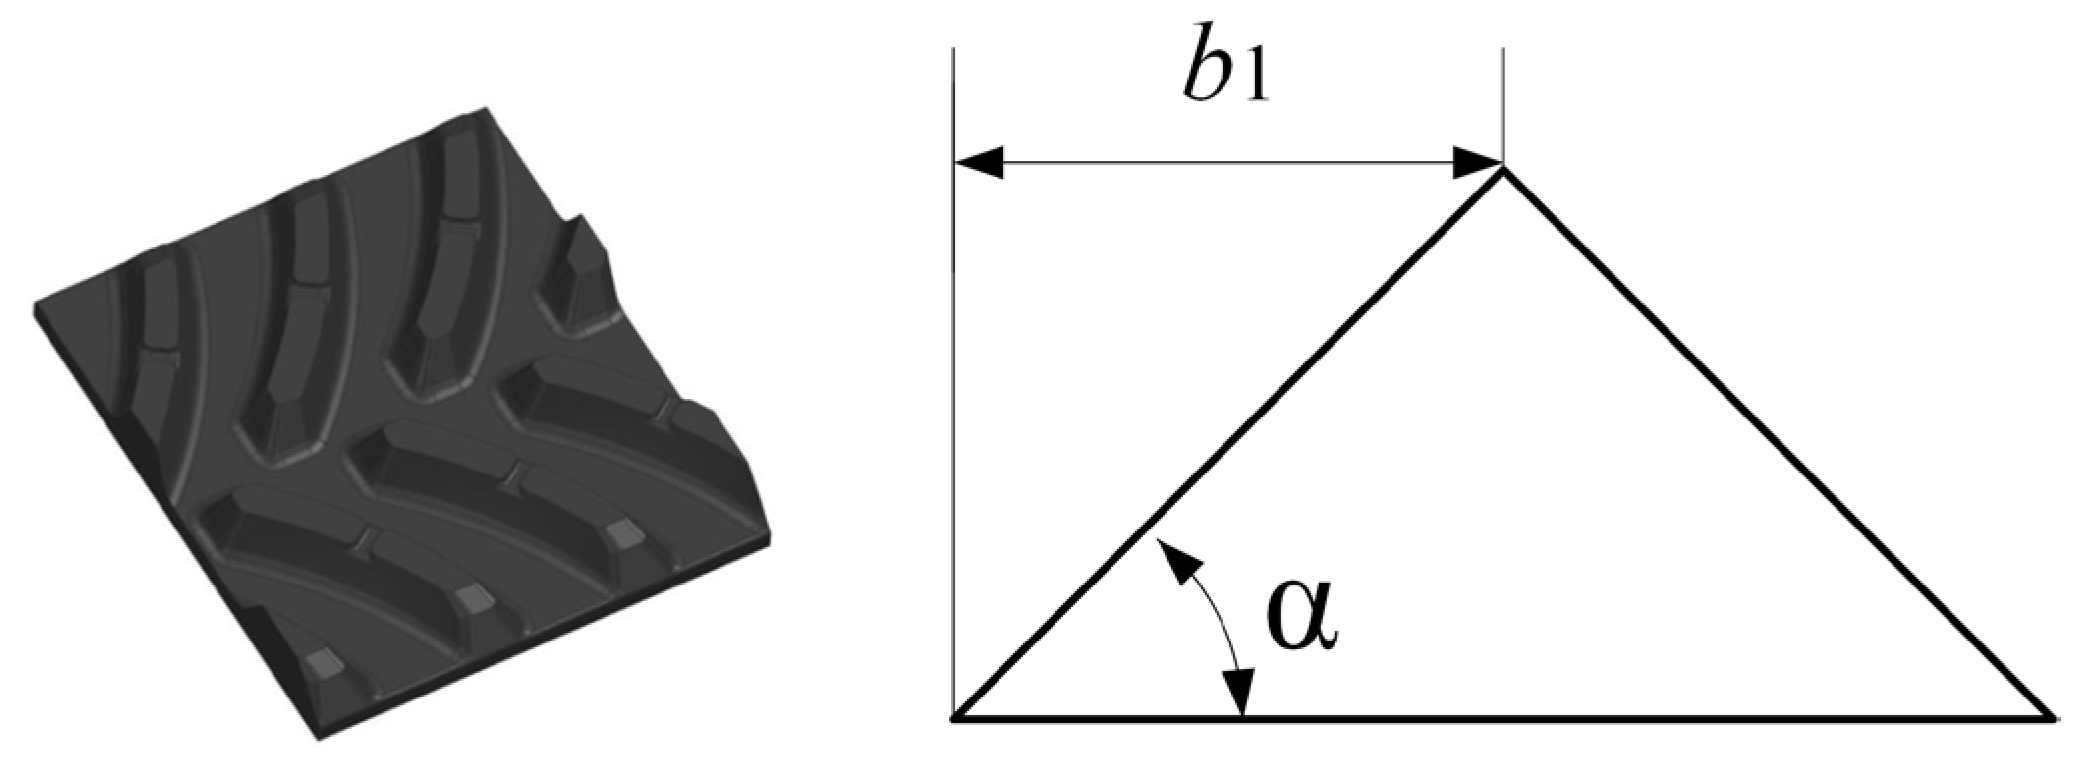
Figure 4.
Diagram of grouser-soil interaction forces.
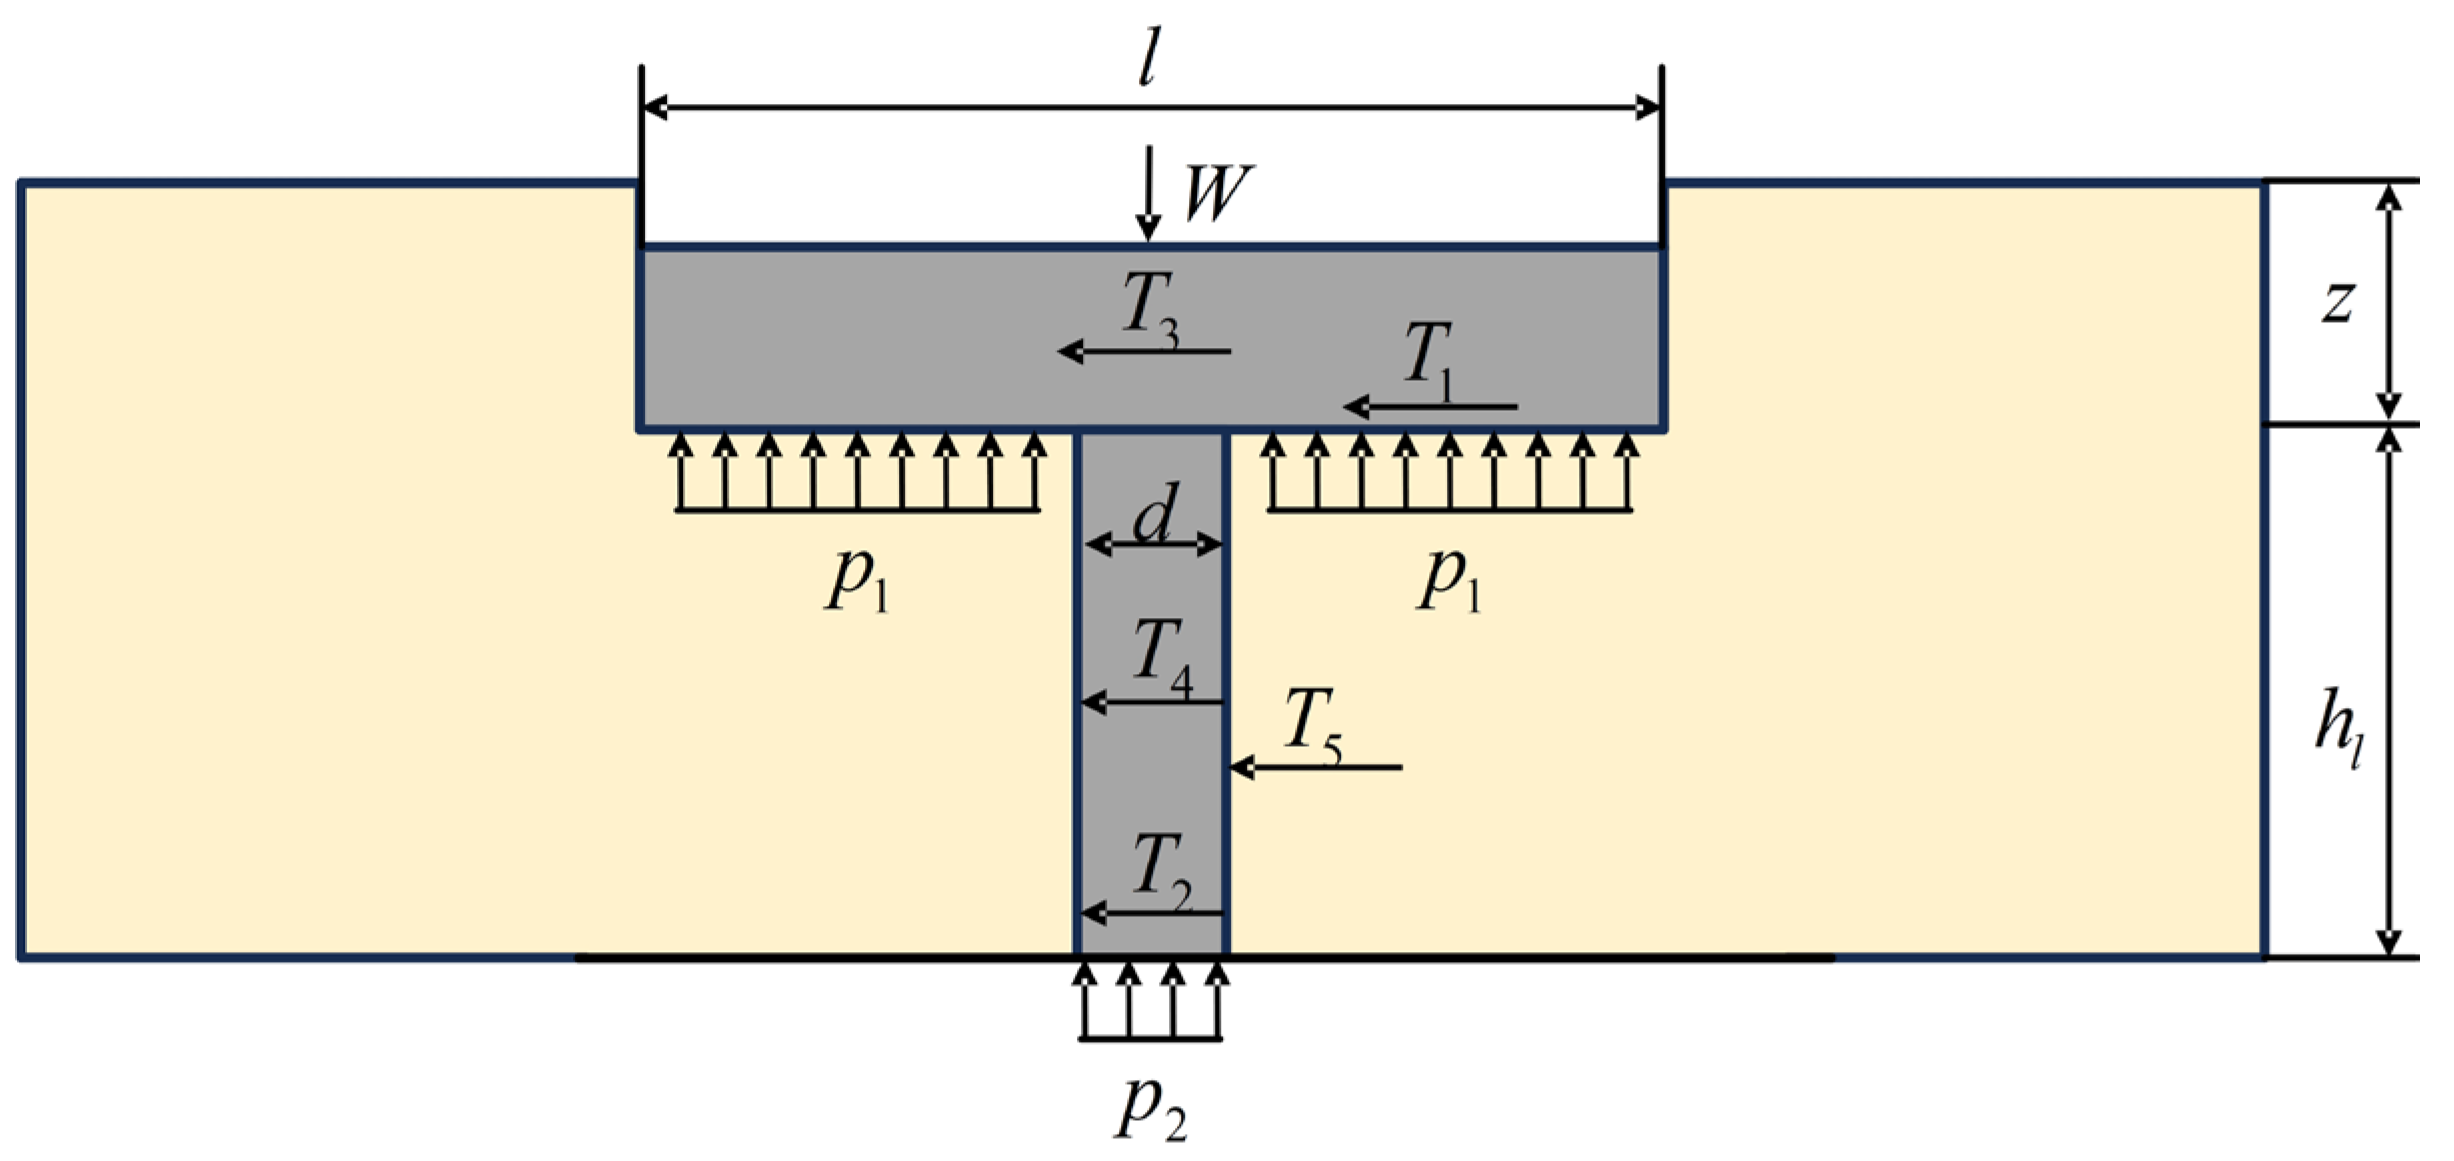
Figure 5.
Stress distribution under strip loads.
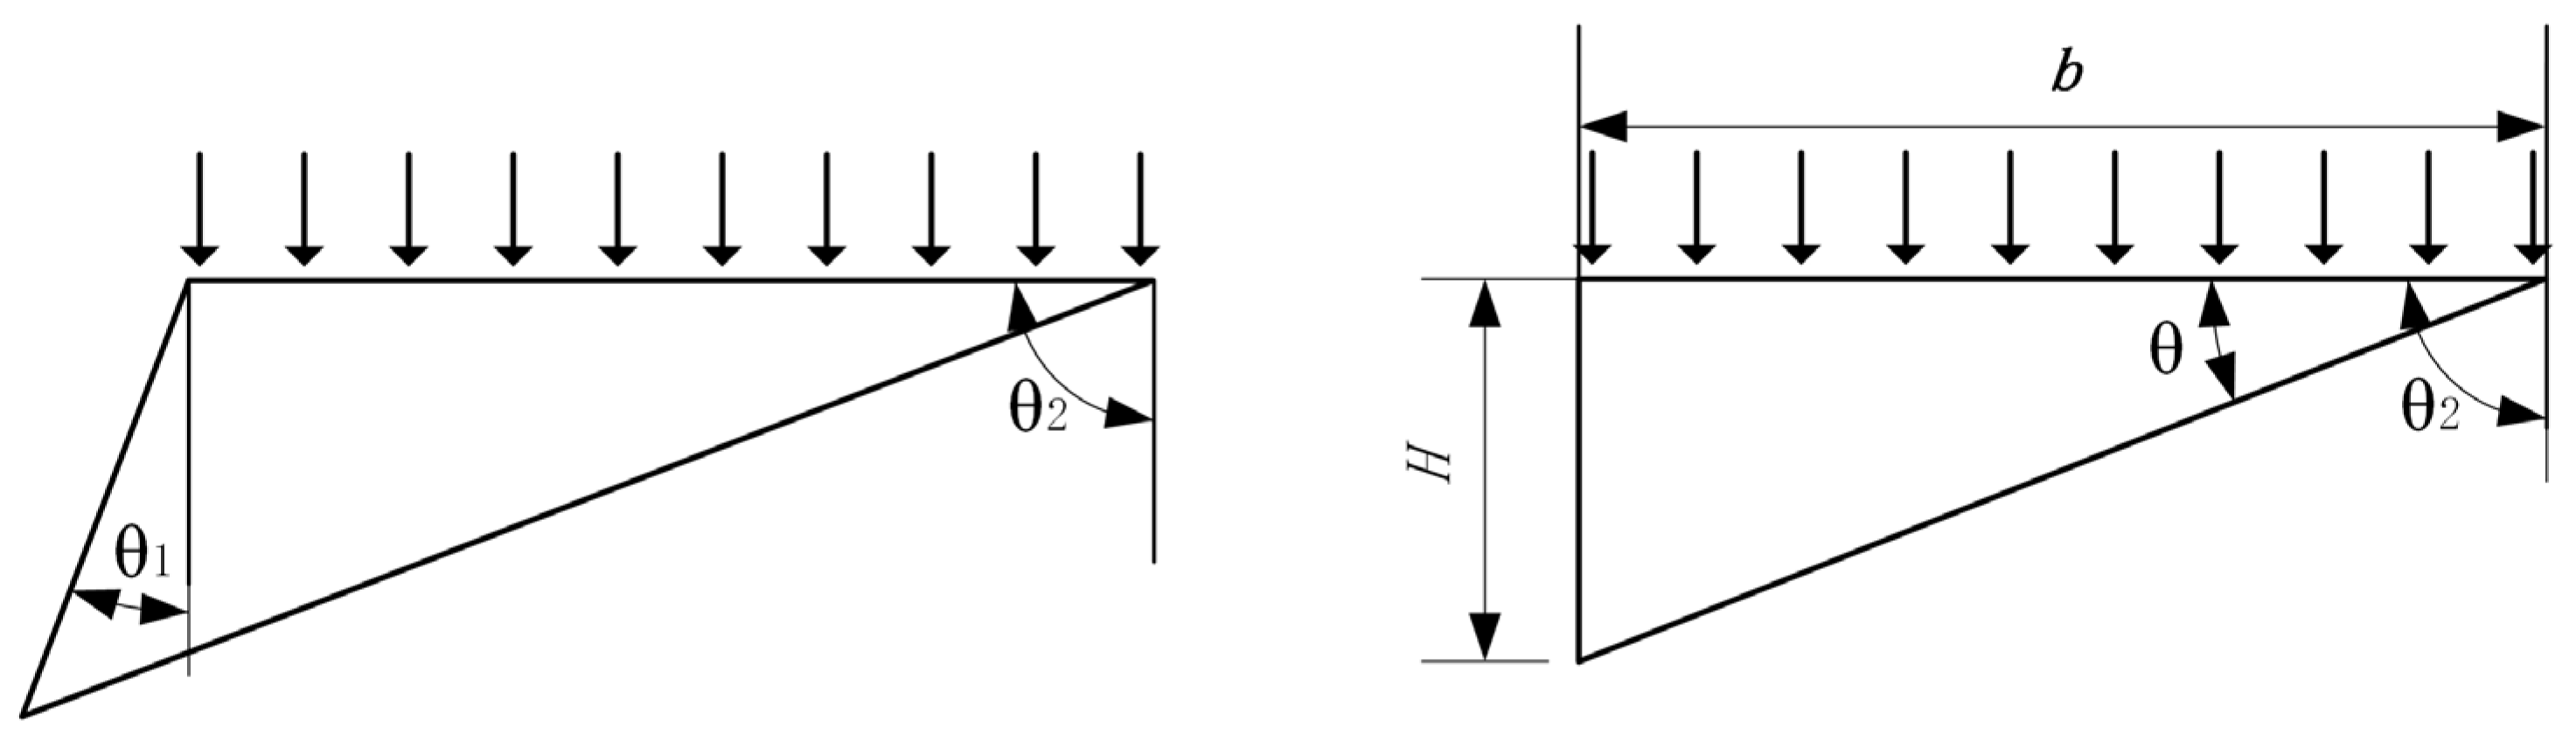
Figure 6.
Rankine passive earth pressure model.
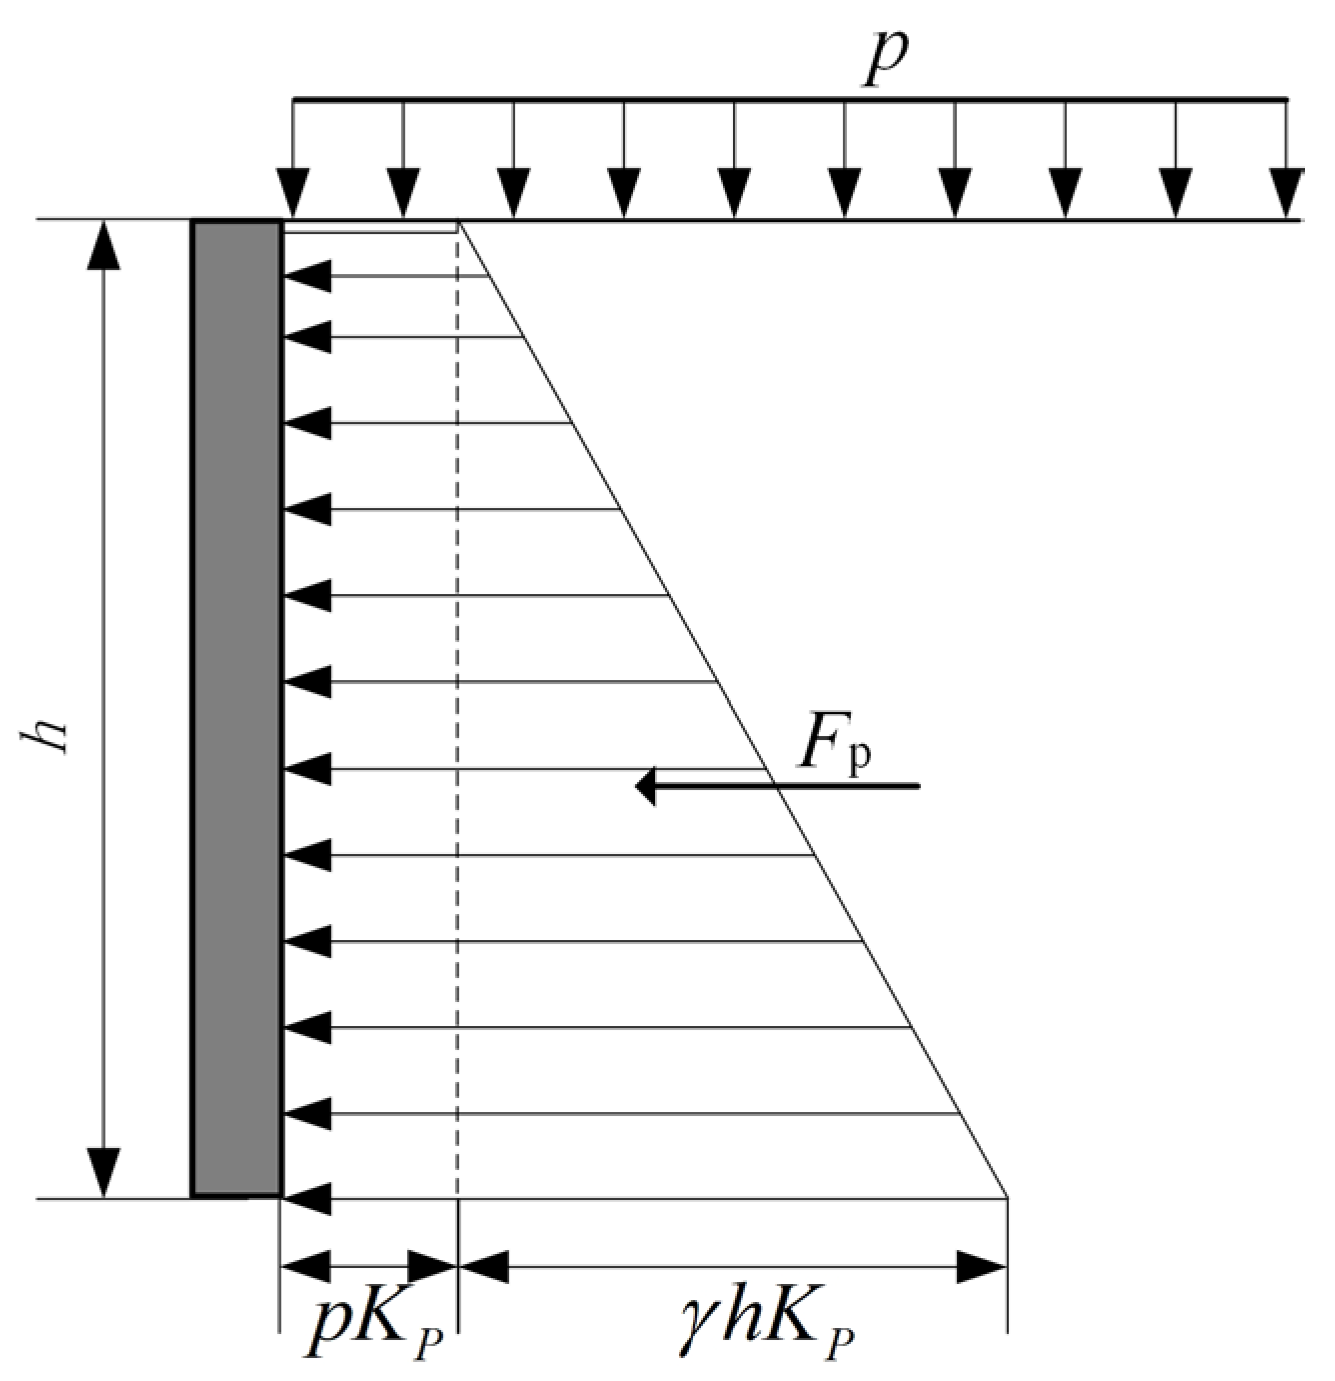
Figure 7.
Impact of track structural parameters on soil thrust: (a) Soil thrust vs length; (b) Soil thrust vs width.
Figure 7.
Impact of track structural parameters on soil thrust: (a) Soil thrust vs length; (b) Soil thrust vs width.
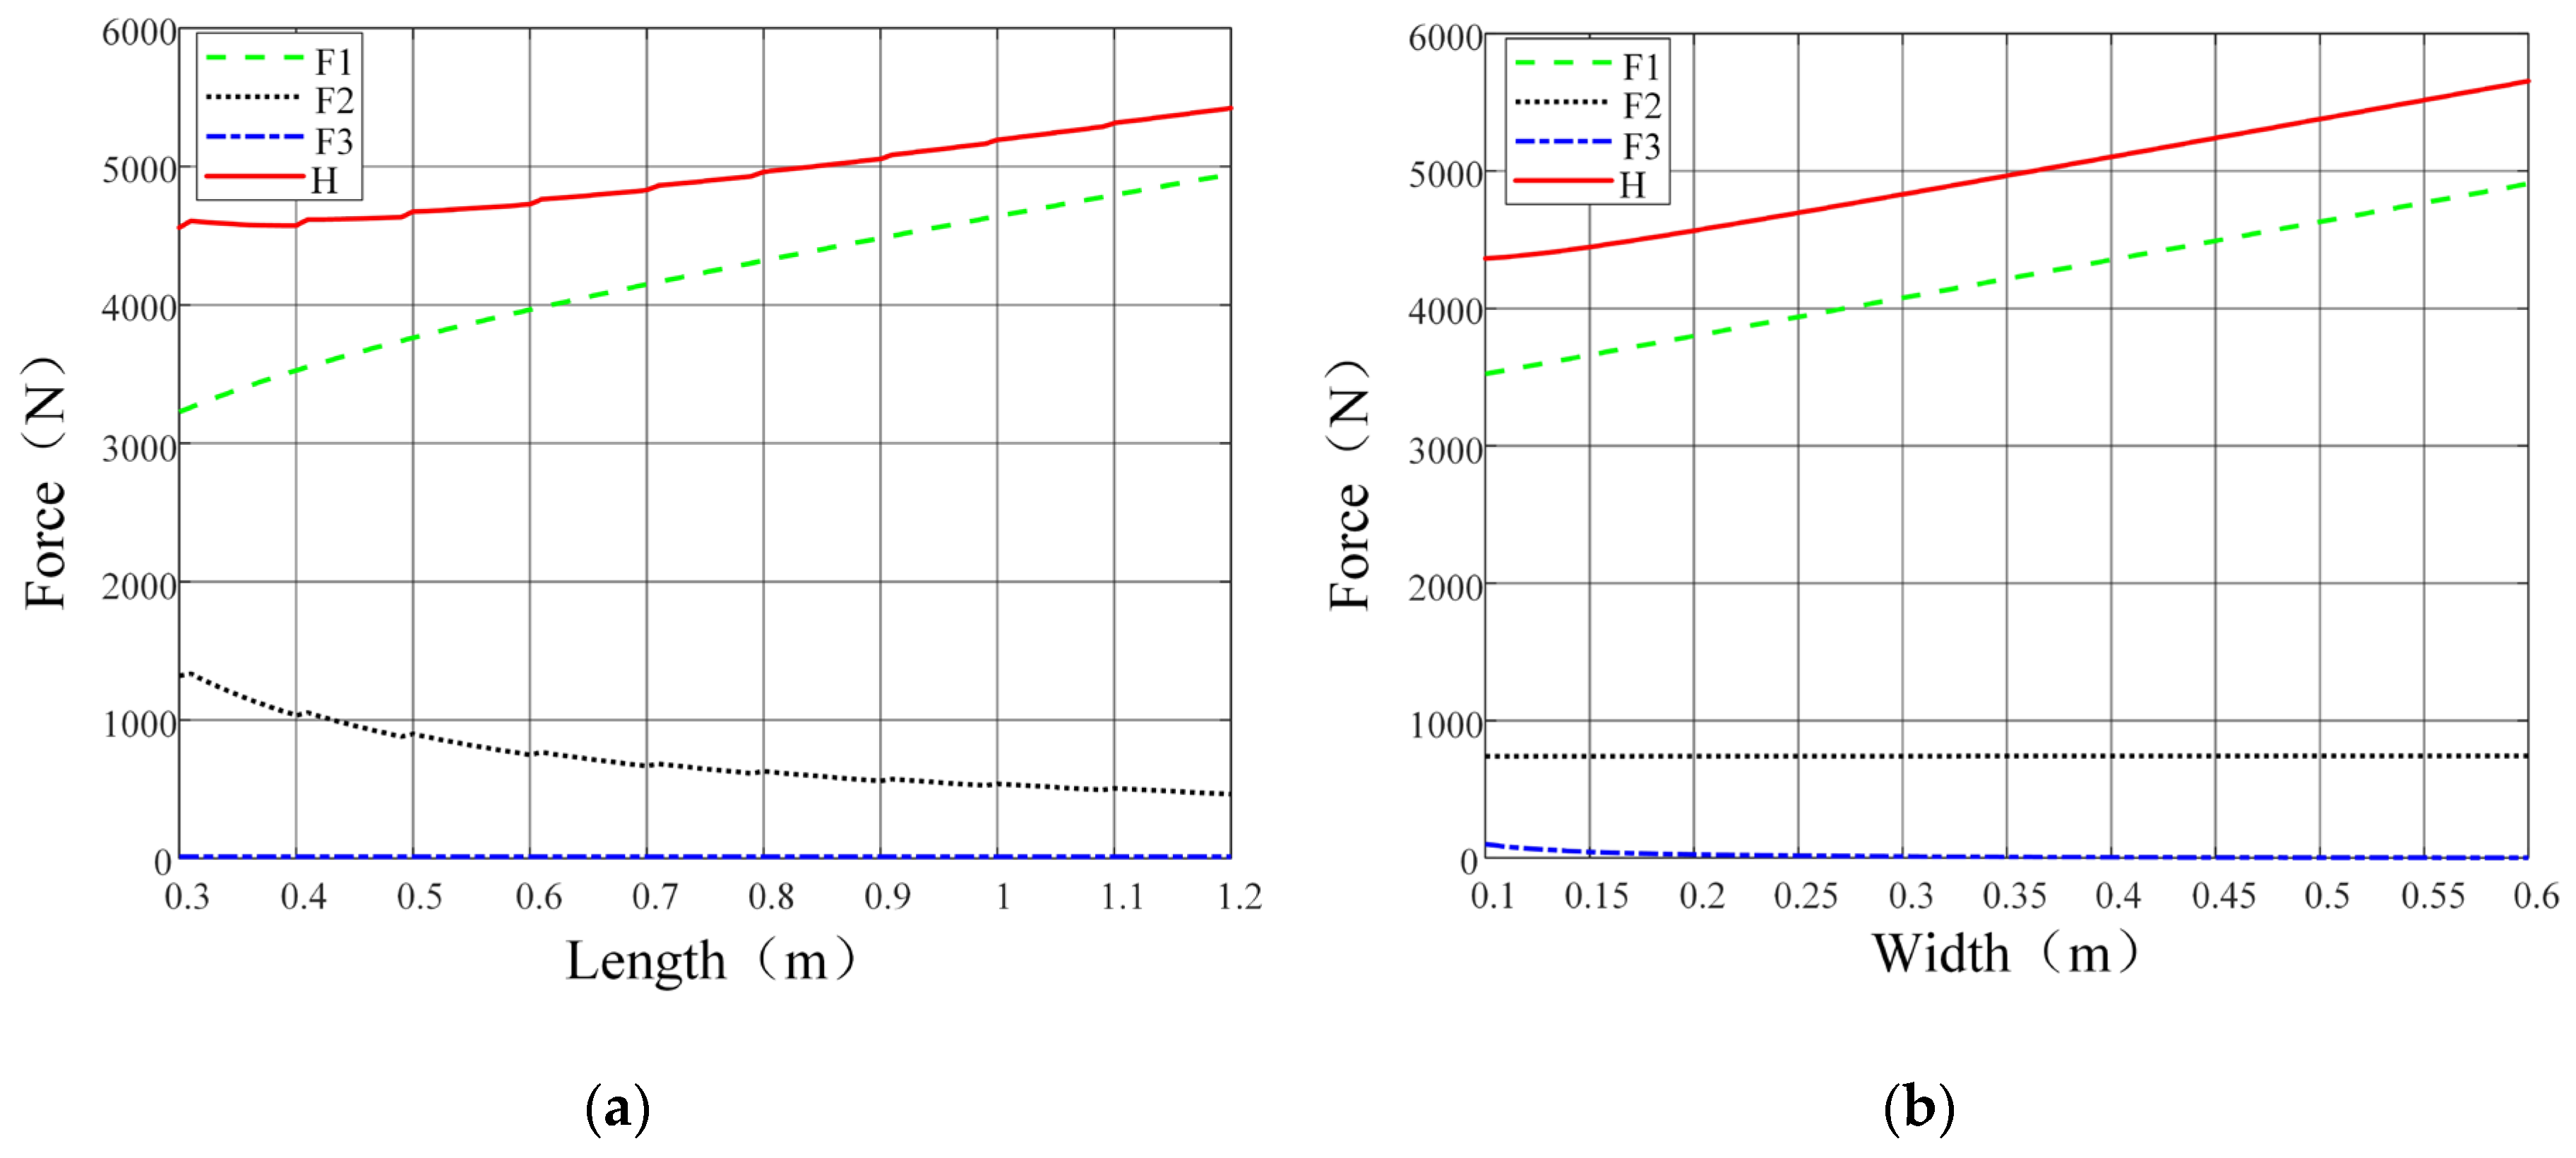
Figure 8.
Impact of grouser structural parameters on soil thrust: (a) Soil thrust vs height; (b) Soil thrust vs spacing; (c) Soil thrust vs angle.
Figure 8.
Impact of grouser structural parameters on soil thrust: (a) Soil thrust vs height; (b) Soil thrust vs spacing; (c) Soil thrust vs angle.
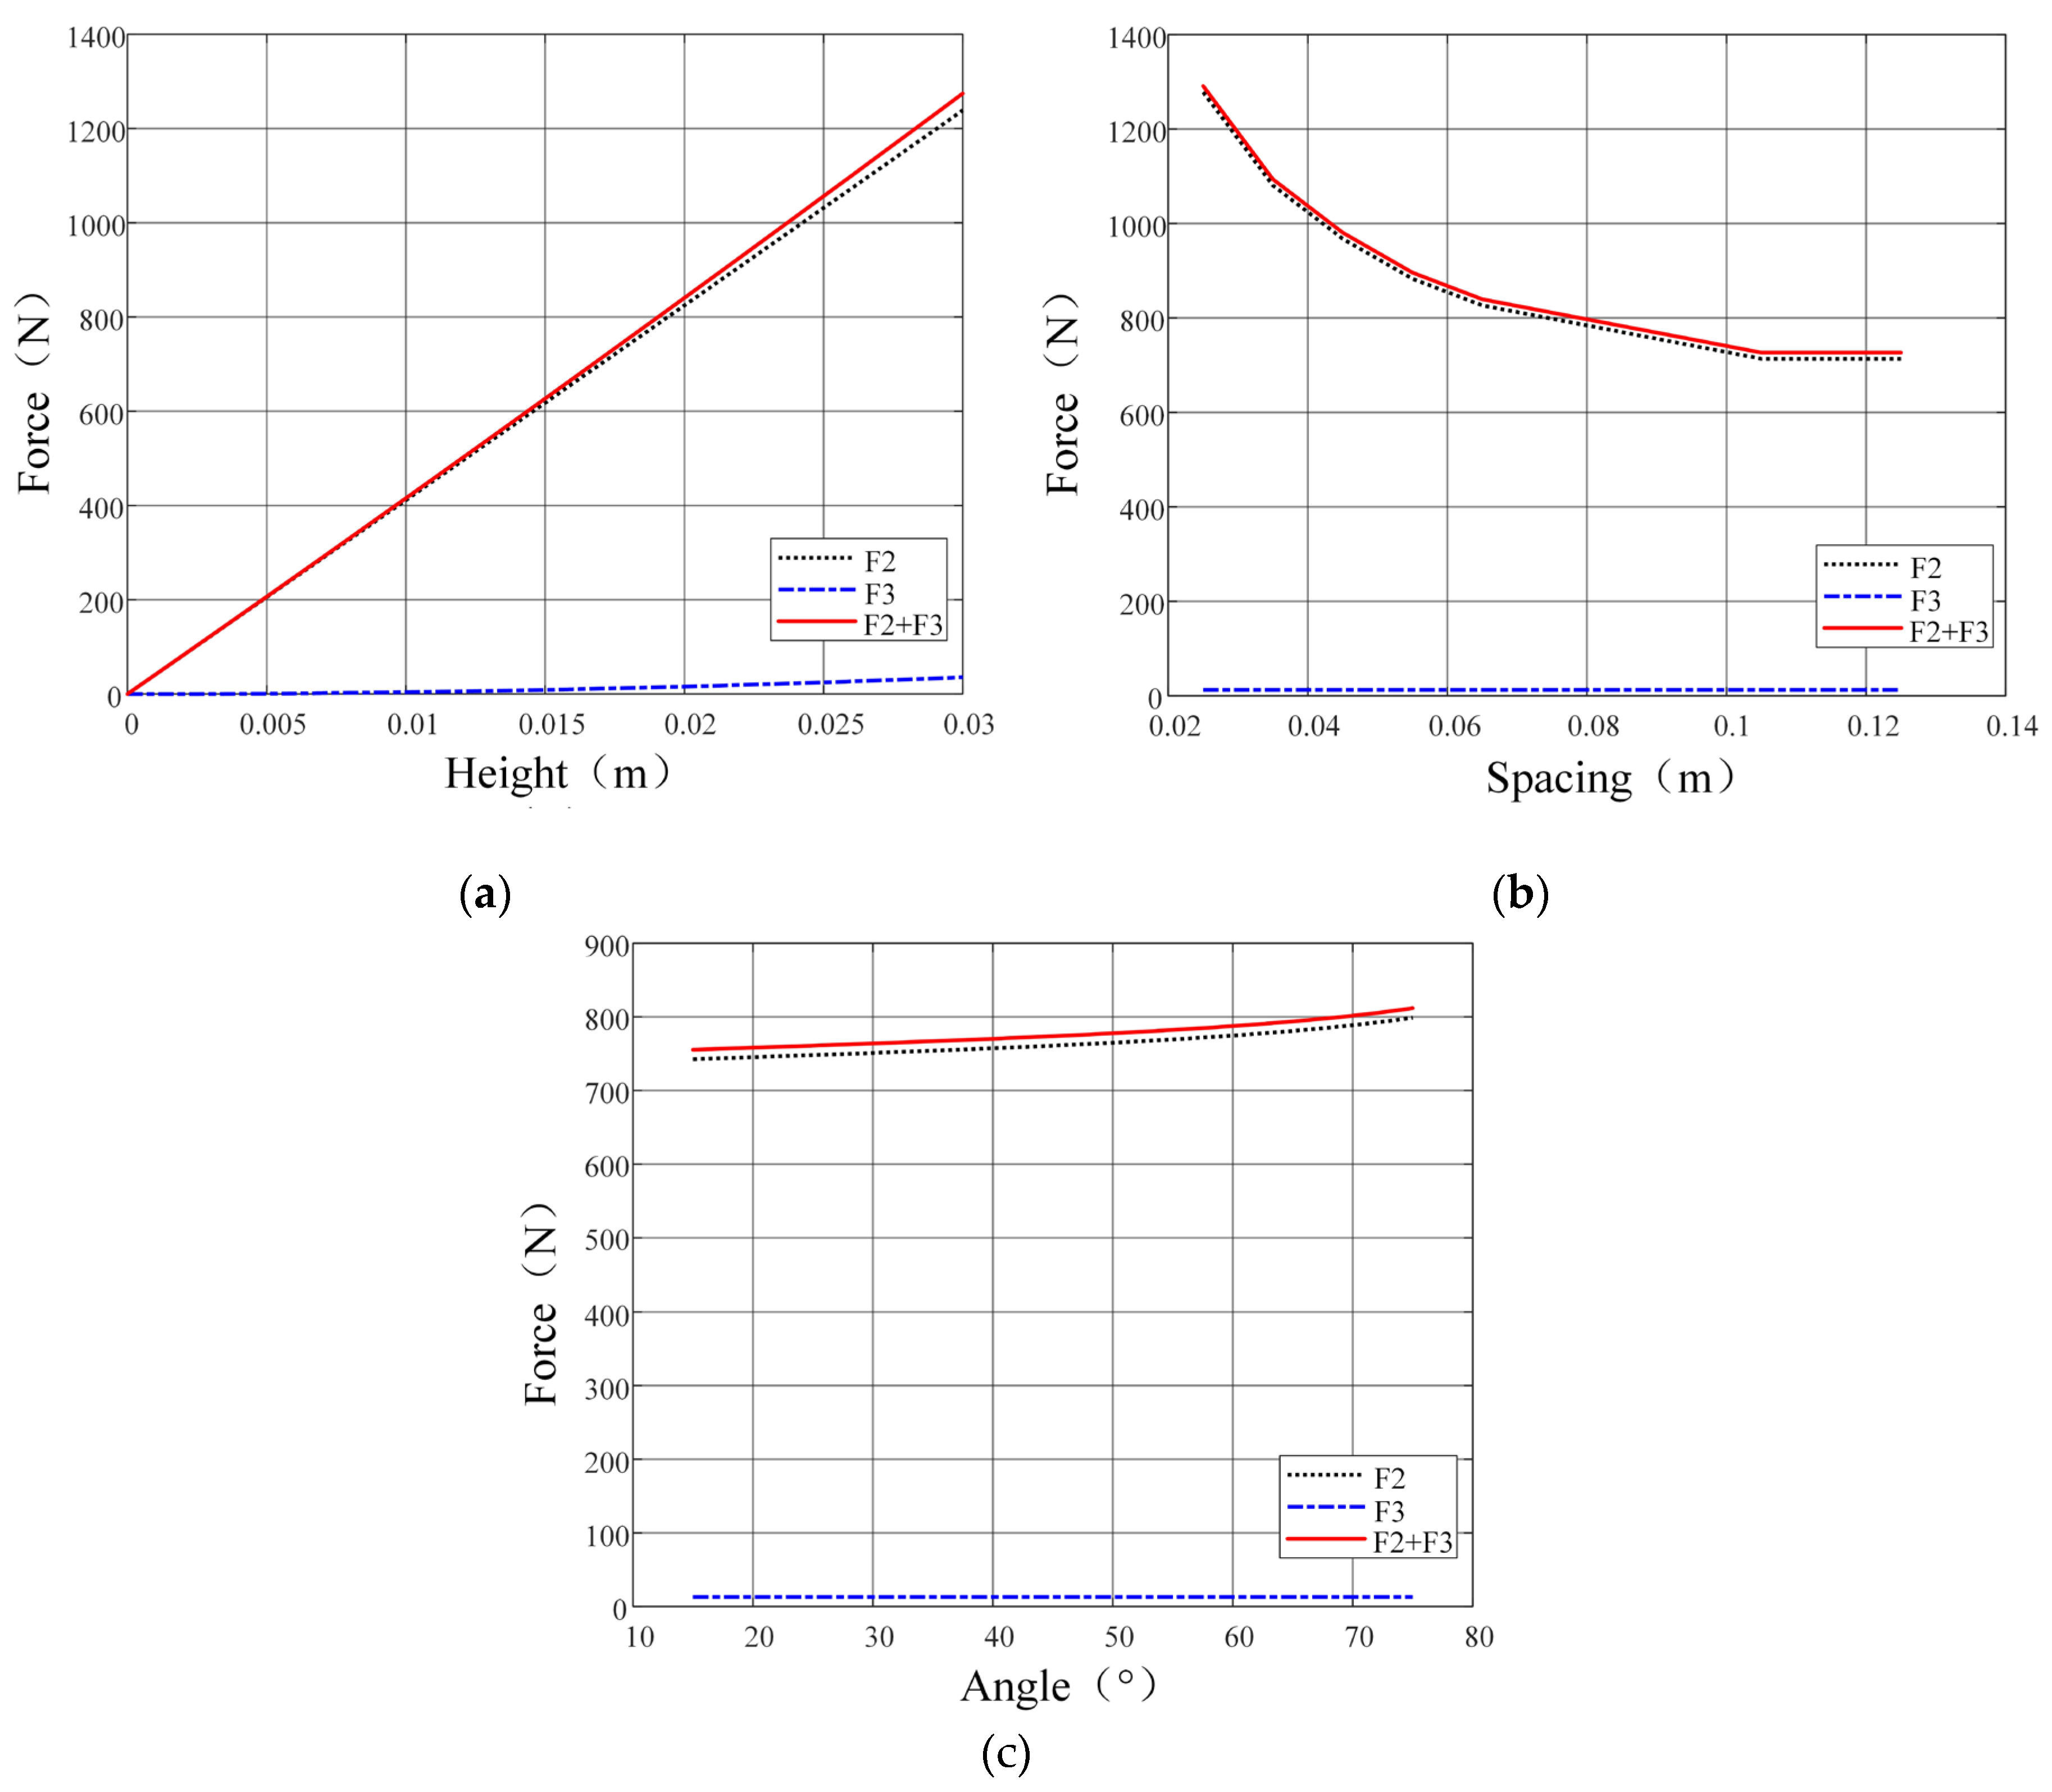
Figure 9.
Triaxial compression calibration stress-strain curve.
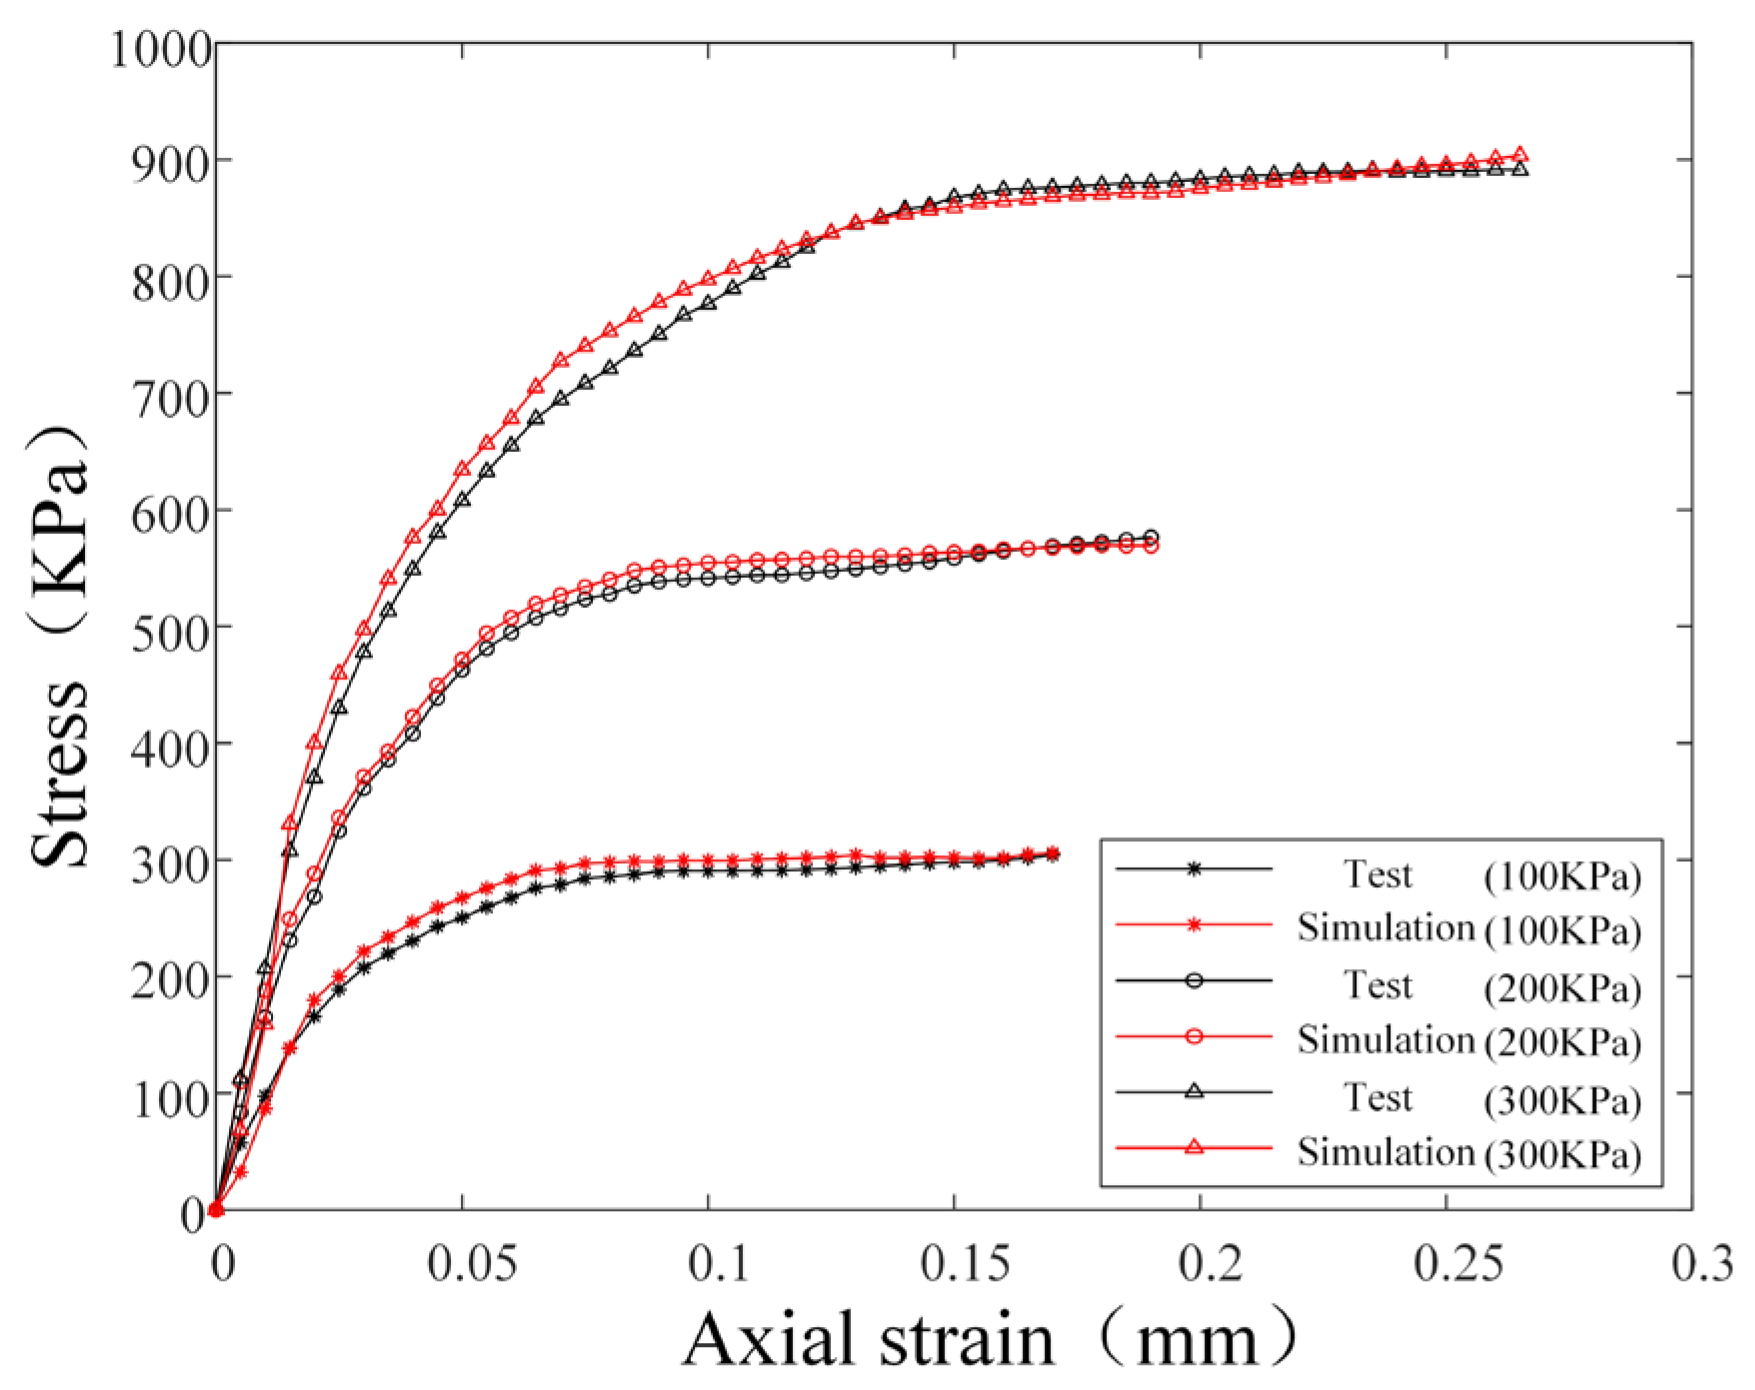
Figure 10.
Track shoe coupling simulation model: (a) Discrete meta-model of sandy soil; (b) DEM-MBD coupling simulation model.
Figure 10.
Track shoe coupling simulation model: (a) Discrete meta-model of sandy soil; (b) DEM-MBD coupling simulation model.
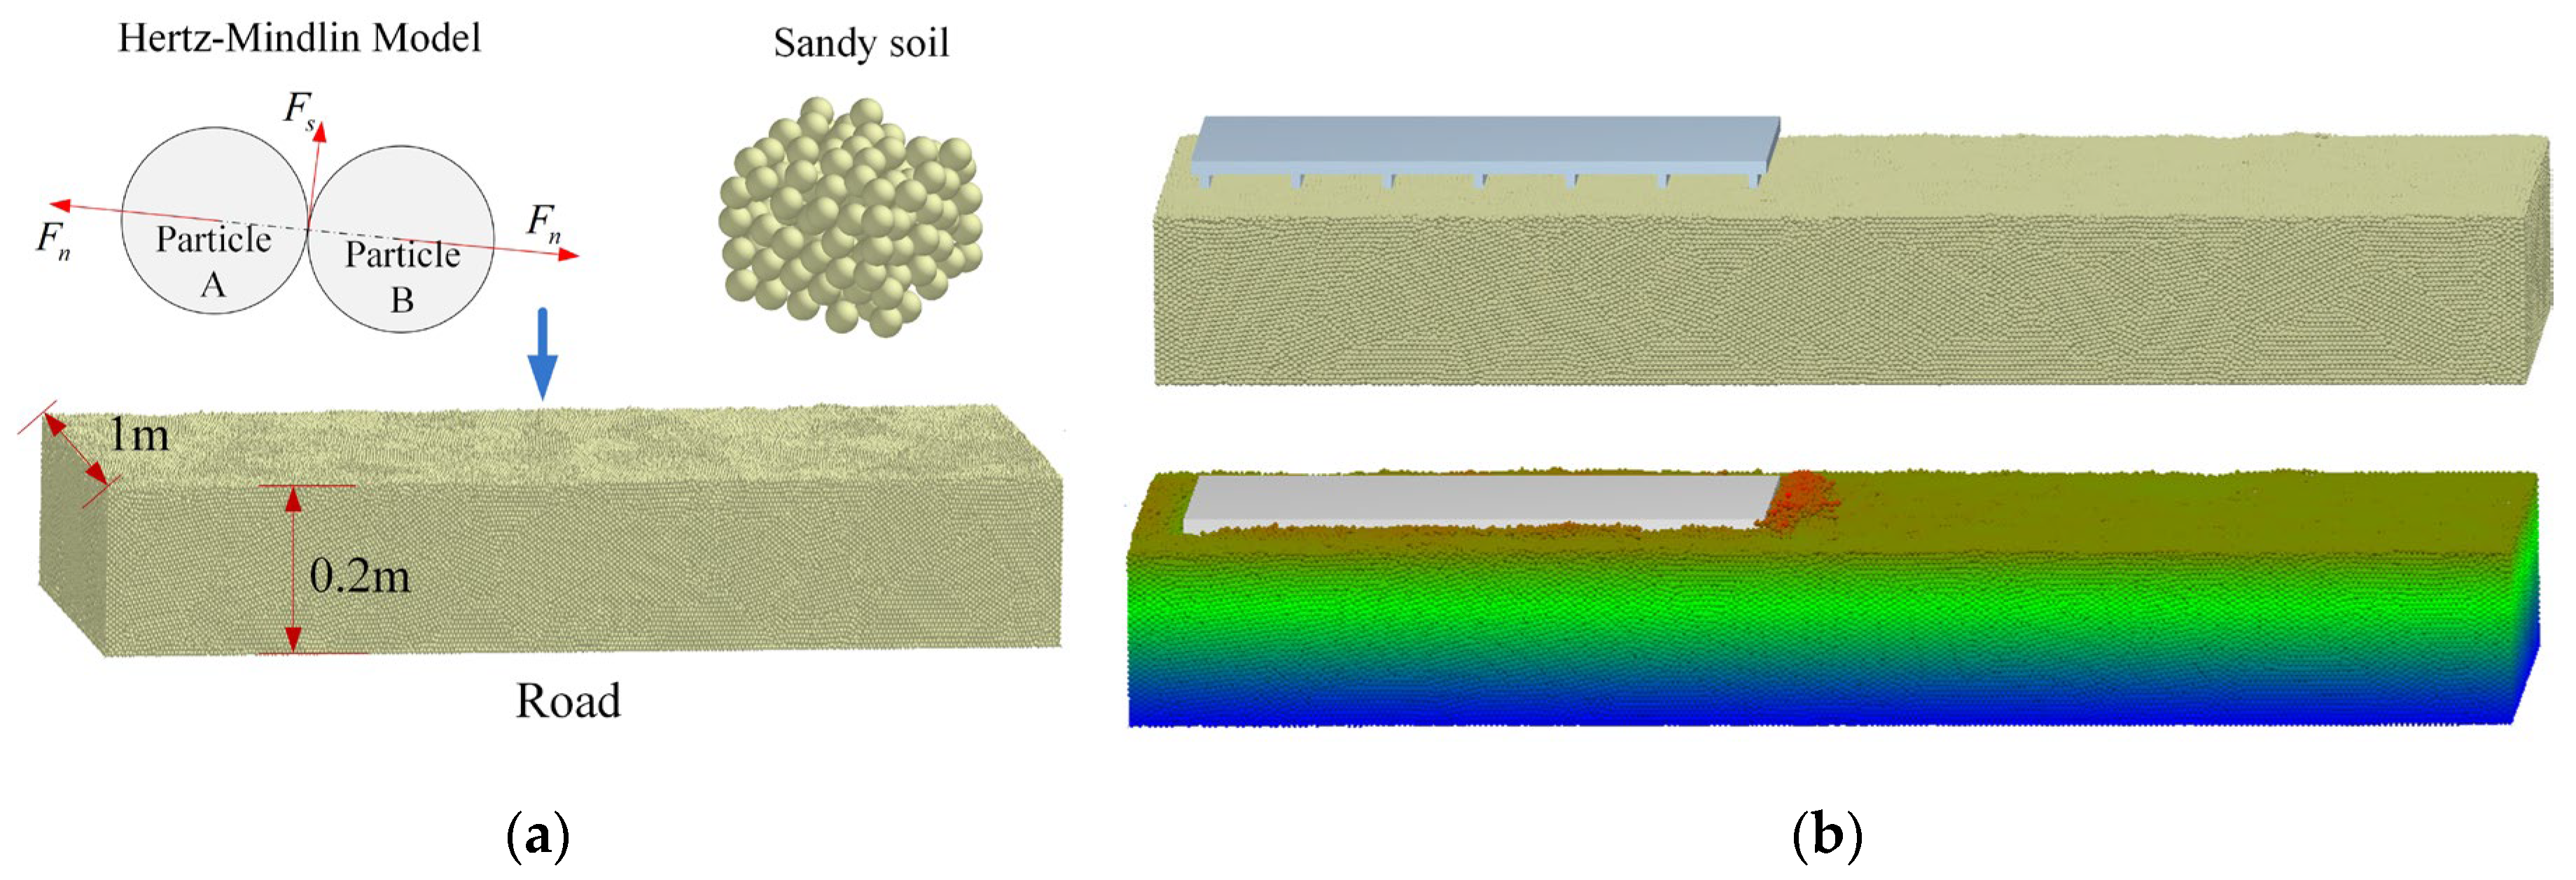
Figure 11.
Sand soil particle contour map: (a) Sand soil particle velocity contour map; (b) Sand soil particle force contour map.
Figure 11.
Sand soil particle contour map: (a) Sand soil particle velocity contour map; (b) Sand soil particle force contour map.
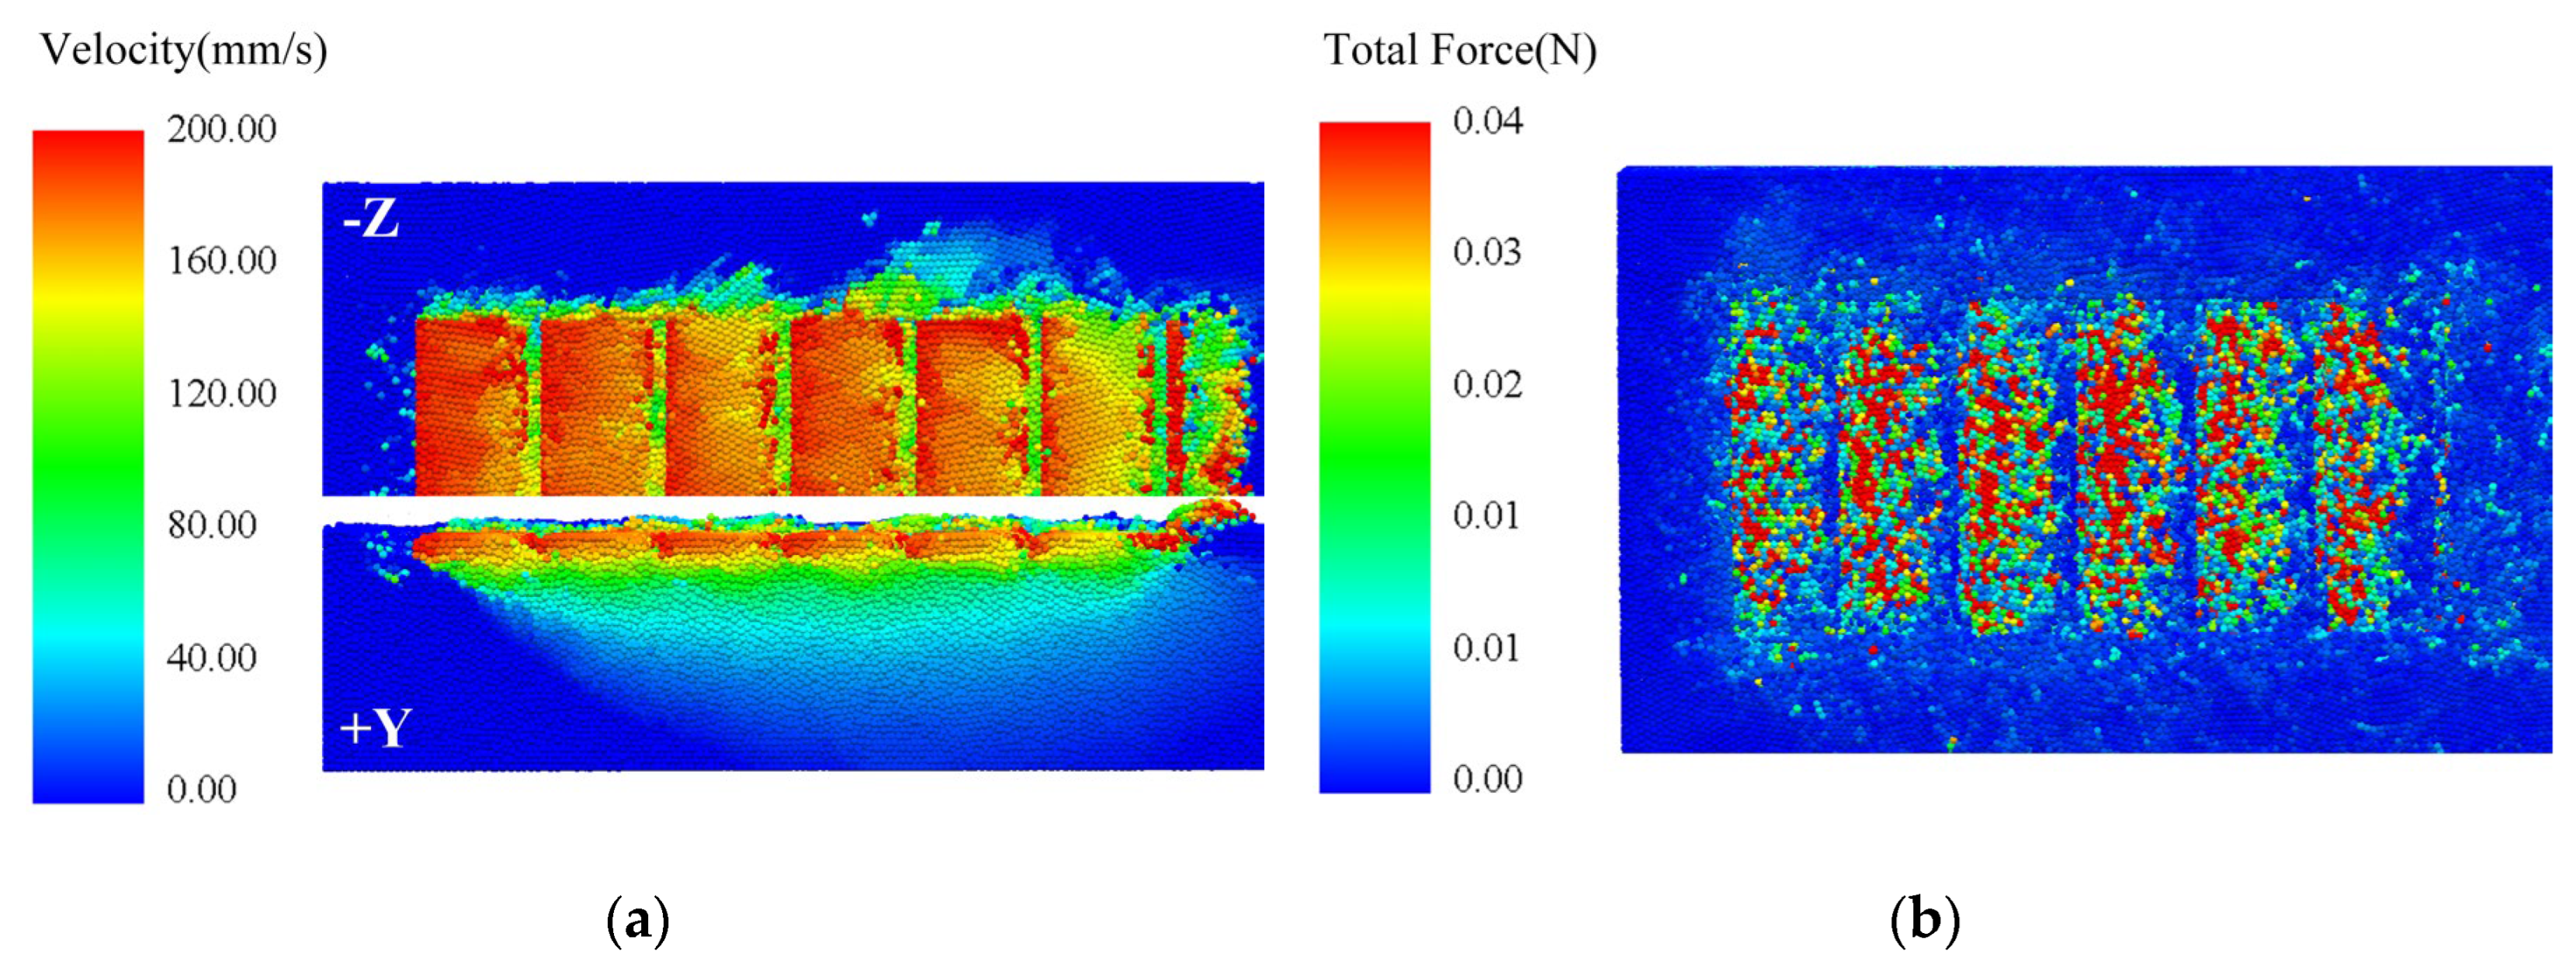
Figure 12.
Relationship between soil thrust and vertical load: (a) Soil thrust vs time; (b) Soil thrust vs load.
Figure 12.
Relationship between soil thrust and vertical load: (a) Soil thrust vs time; (b) Soil thrust vs load.
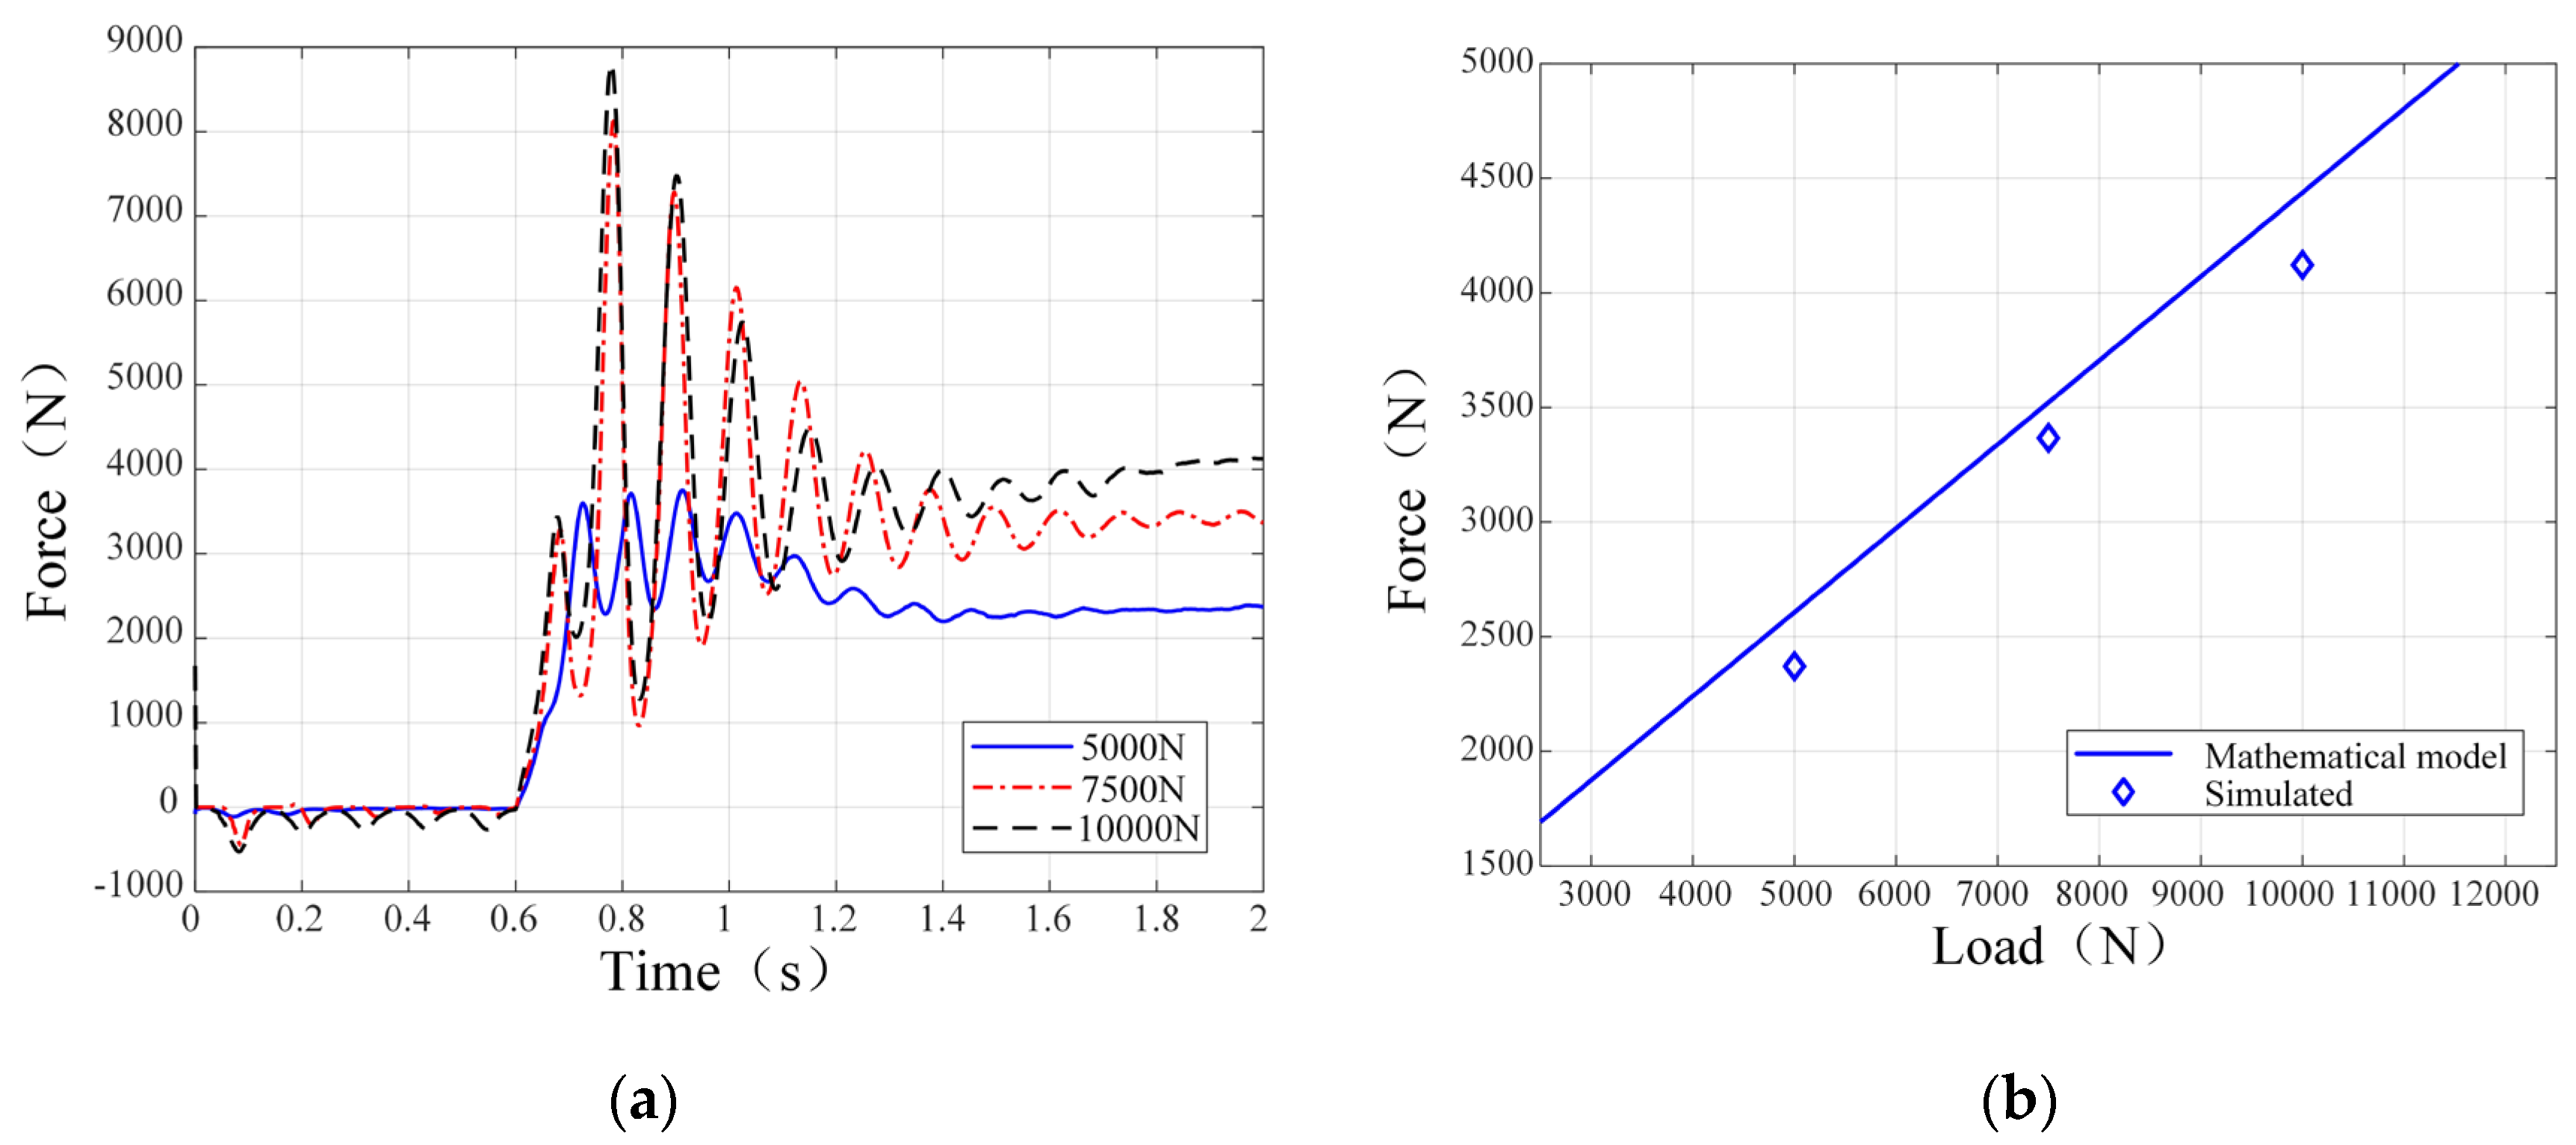
Figure 13.
Relationship between soil thrust and grouser height: (a) Soil thrust vs time; (b) Soil thrust vs height.
Figure 13.
Relationship between soil thrust and grouser height: (a) Soil thrust vs time; (b) Soil thrust vs height.
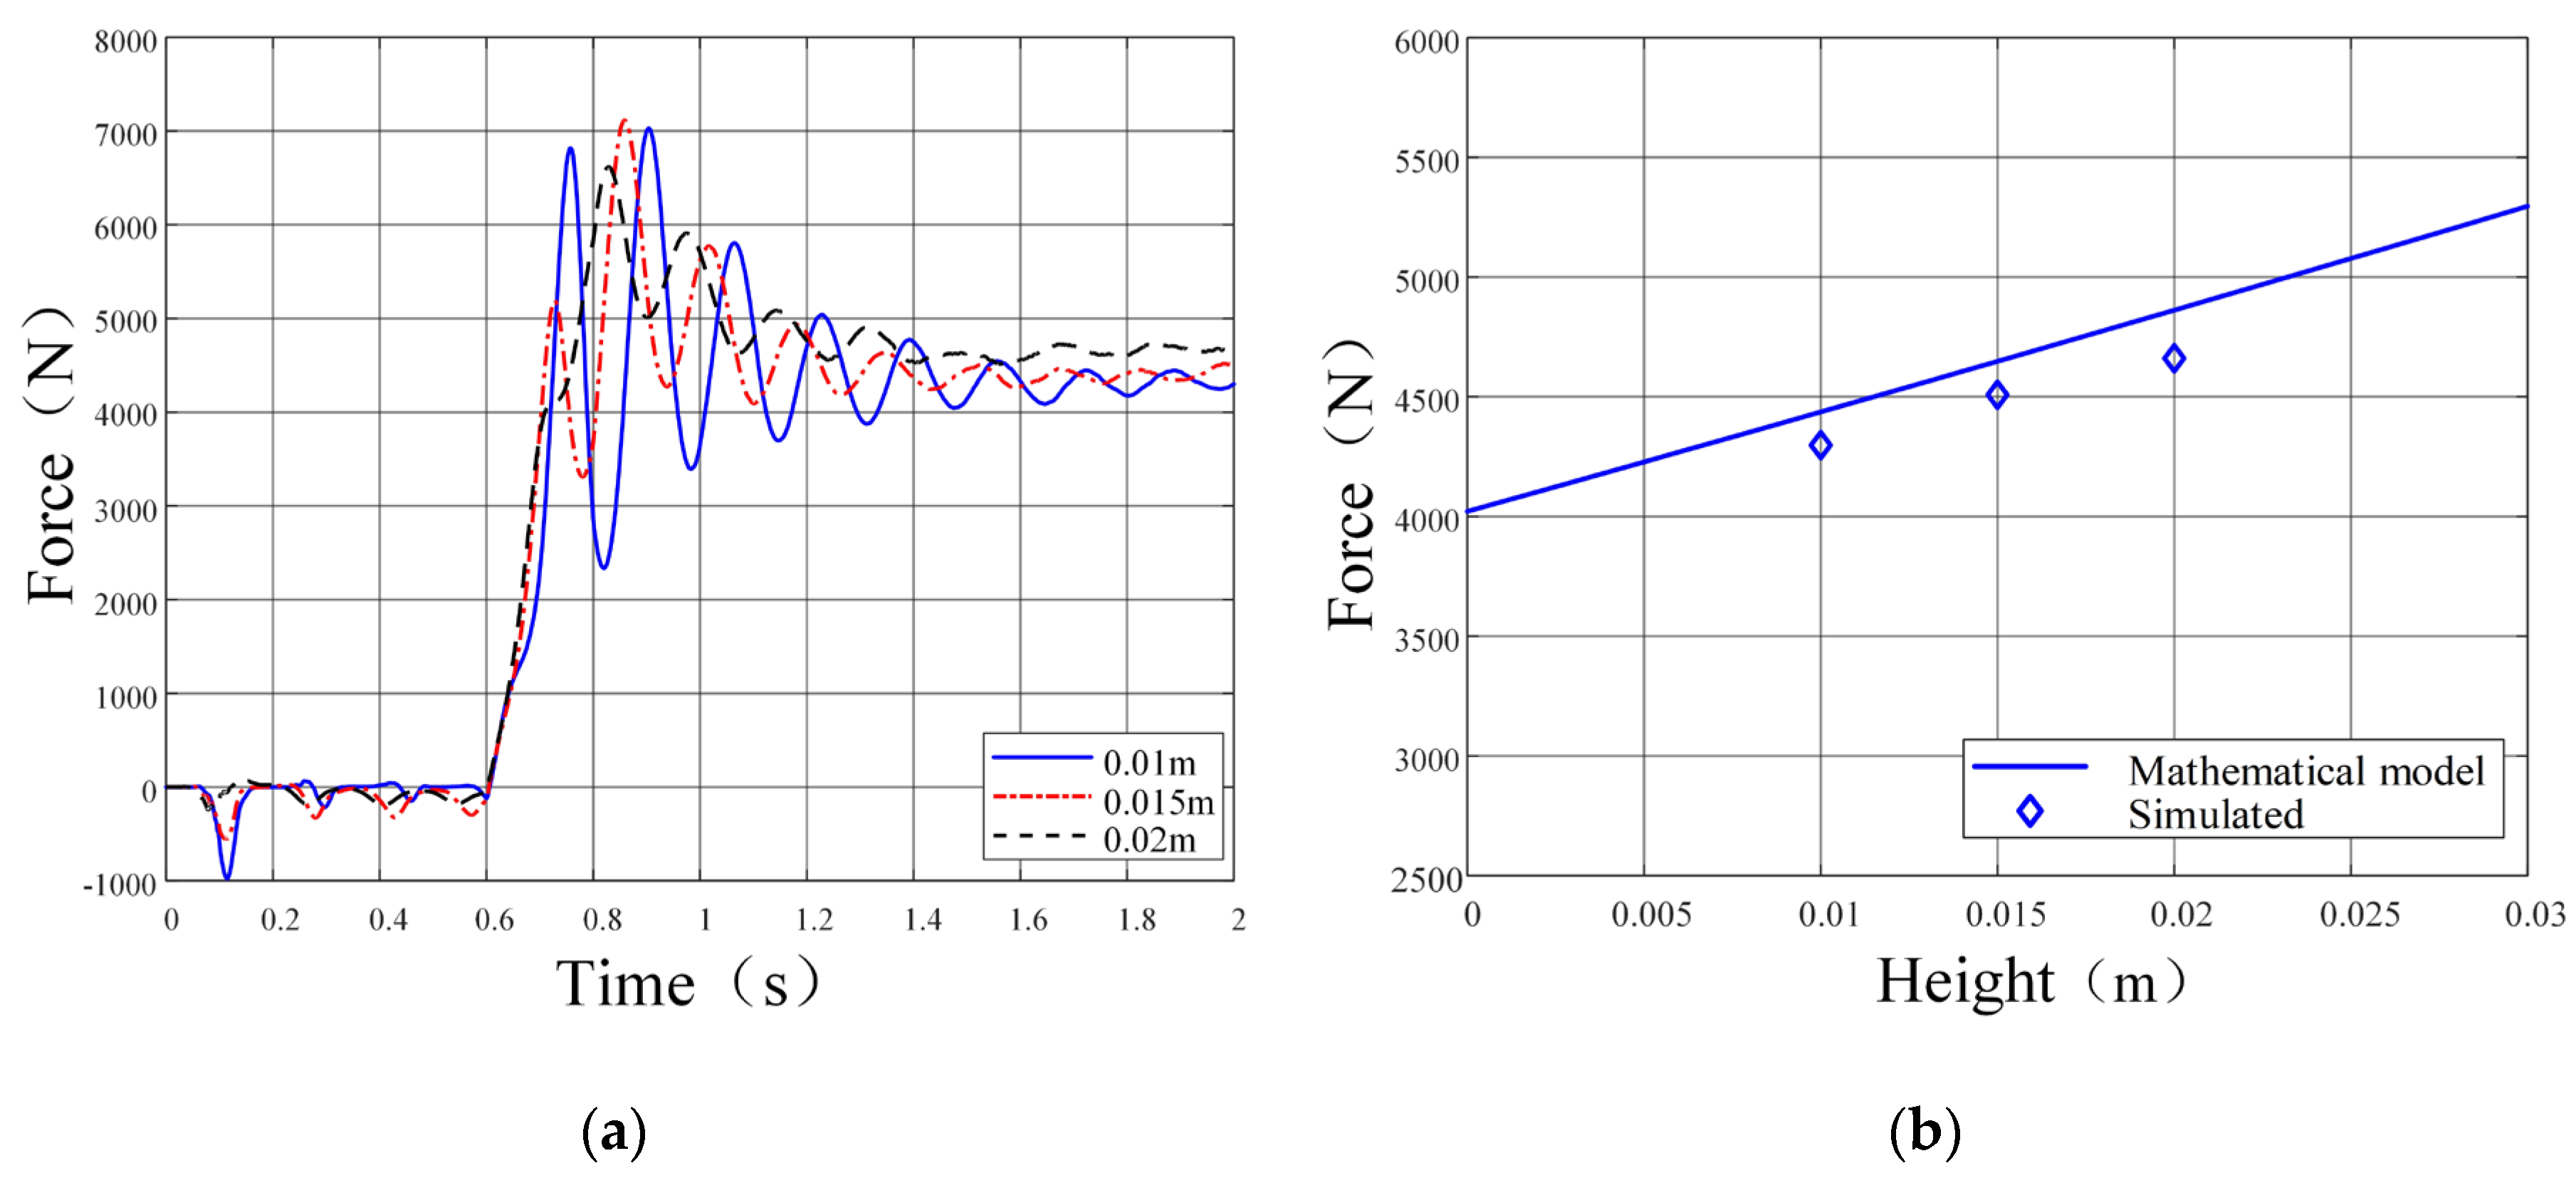
Figure 14.
Relationship between soil thrust and grouser spacing: (a) Soil thrust vs time; (b) Soil thrust vs spacing.
Figure 14.
Relationship between soil thrust and grouser spacing: (a) Soil thrust vs time; (b) Soil thrust vs spacing.
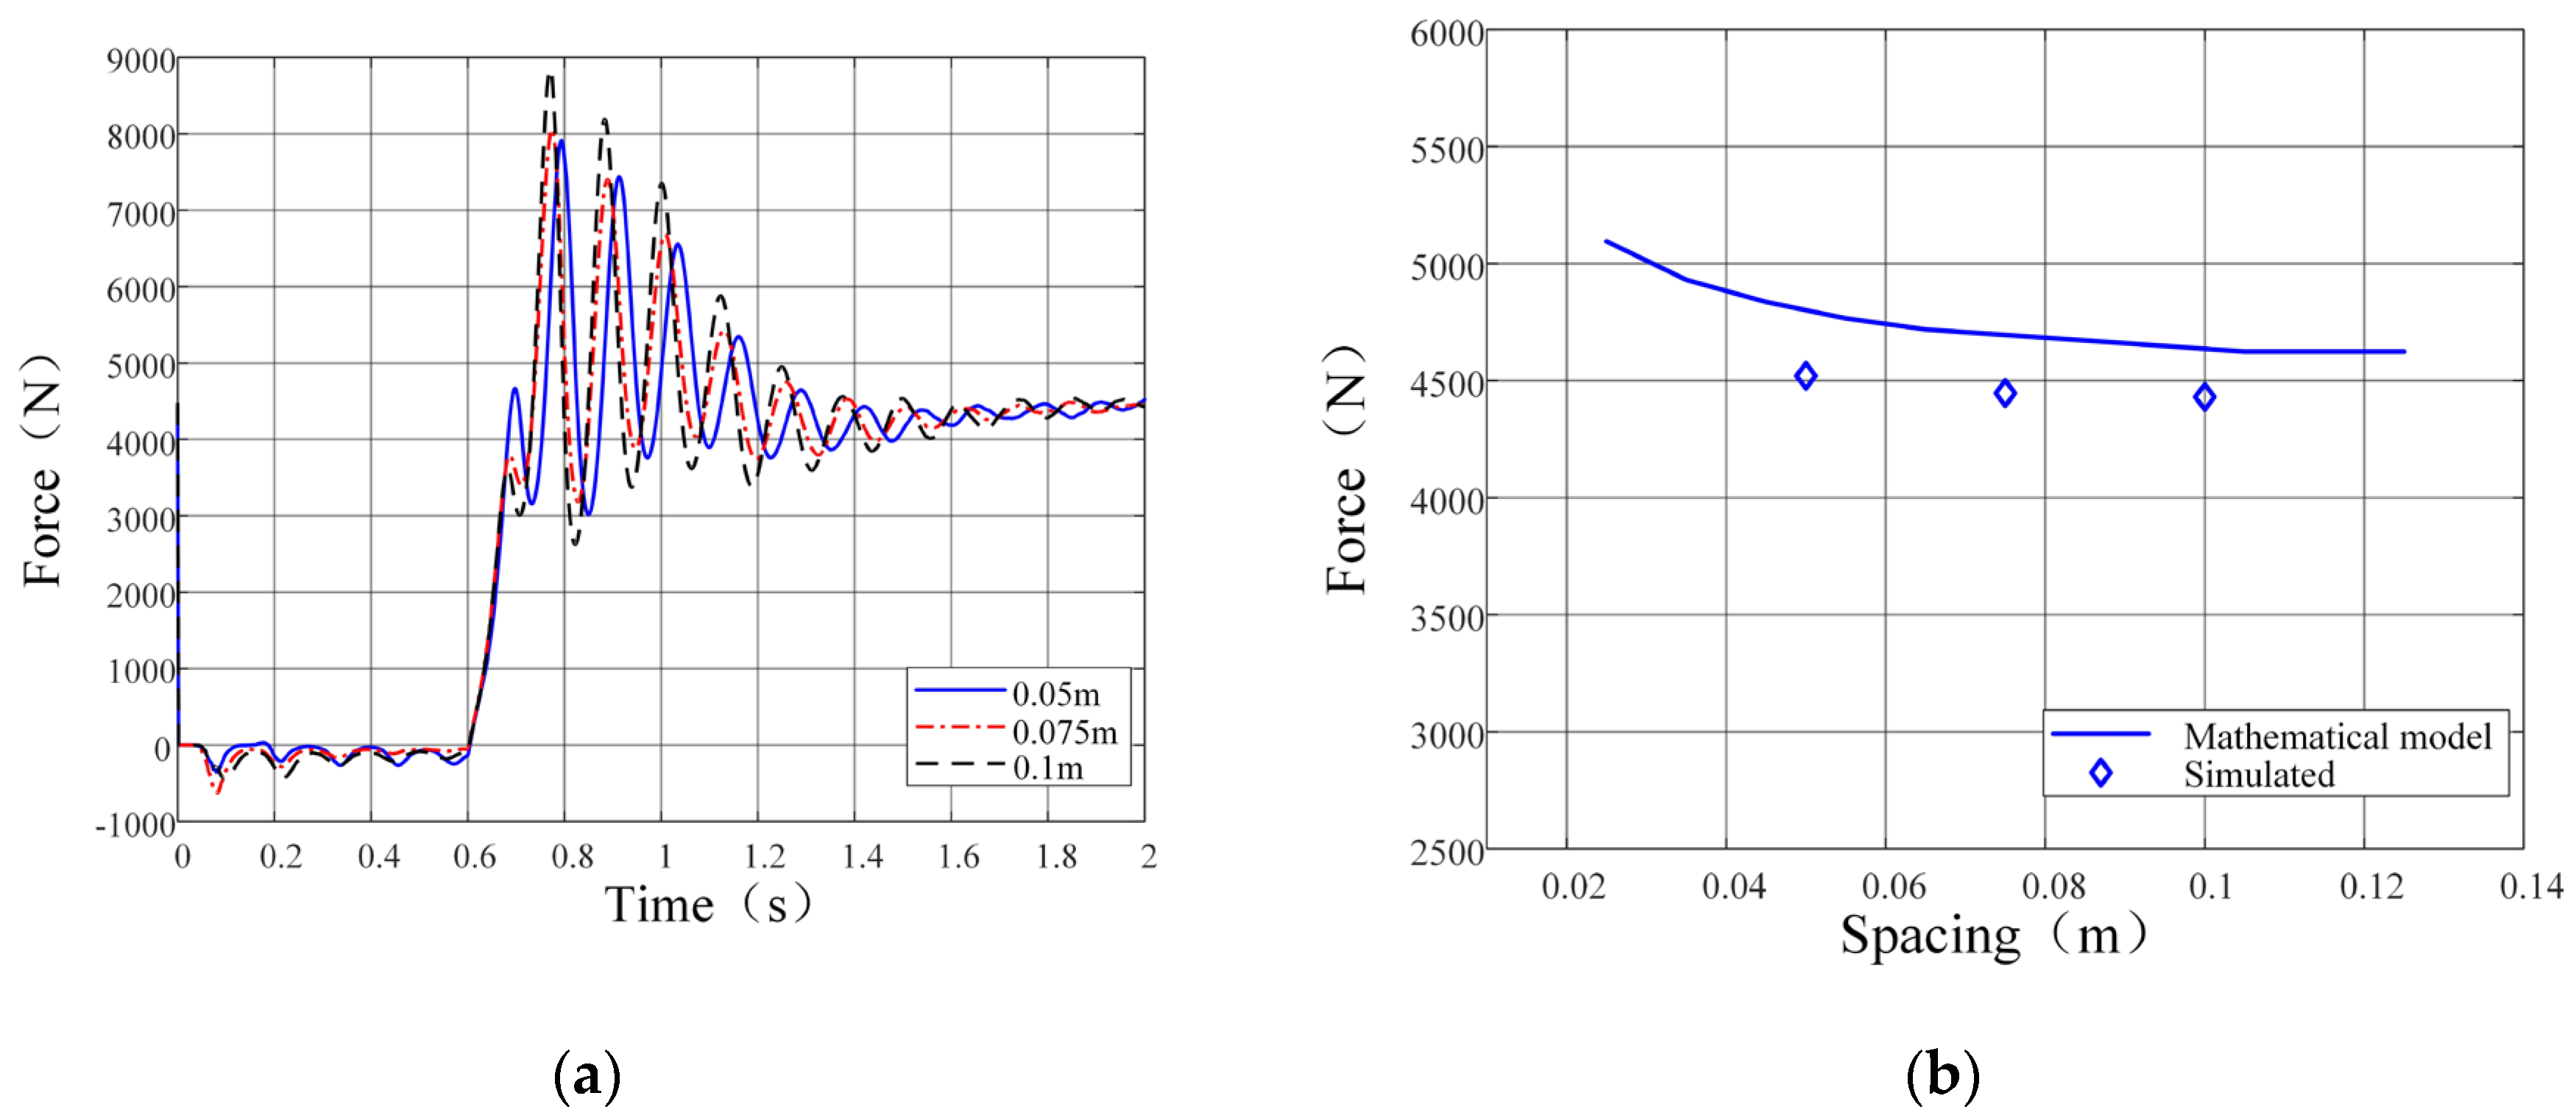
Figure 15.
Relationship between soil thrust and V-shaped angle: (a) Soil thrust vs time; (b) Soil thrust vs angle.
Figure 15.
Relationship between soil thrust and V-shaped angle: (a) Soil thrust vs time; (b) Soil thrust vs angle.
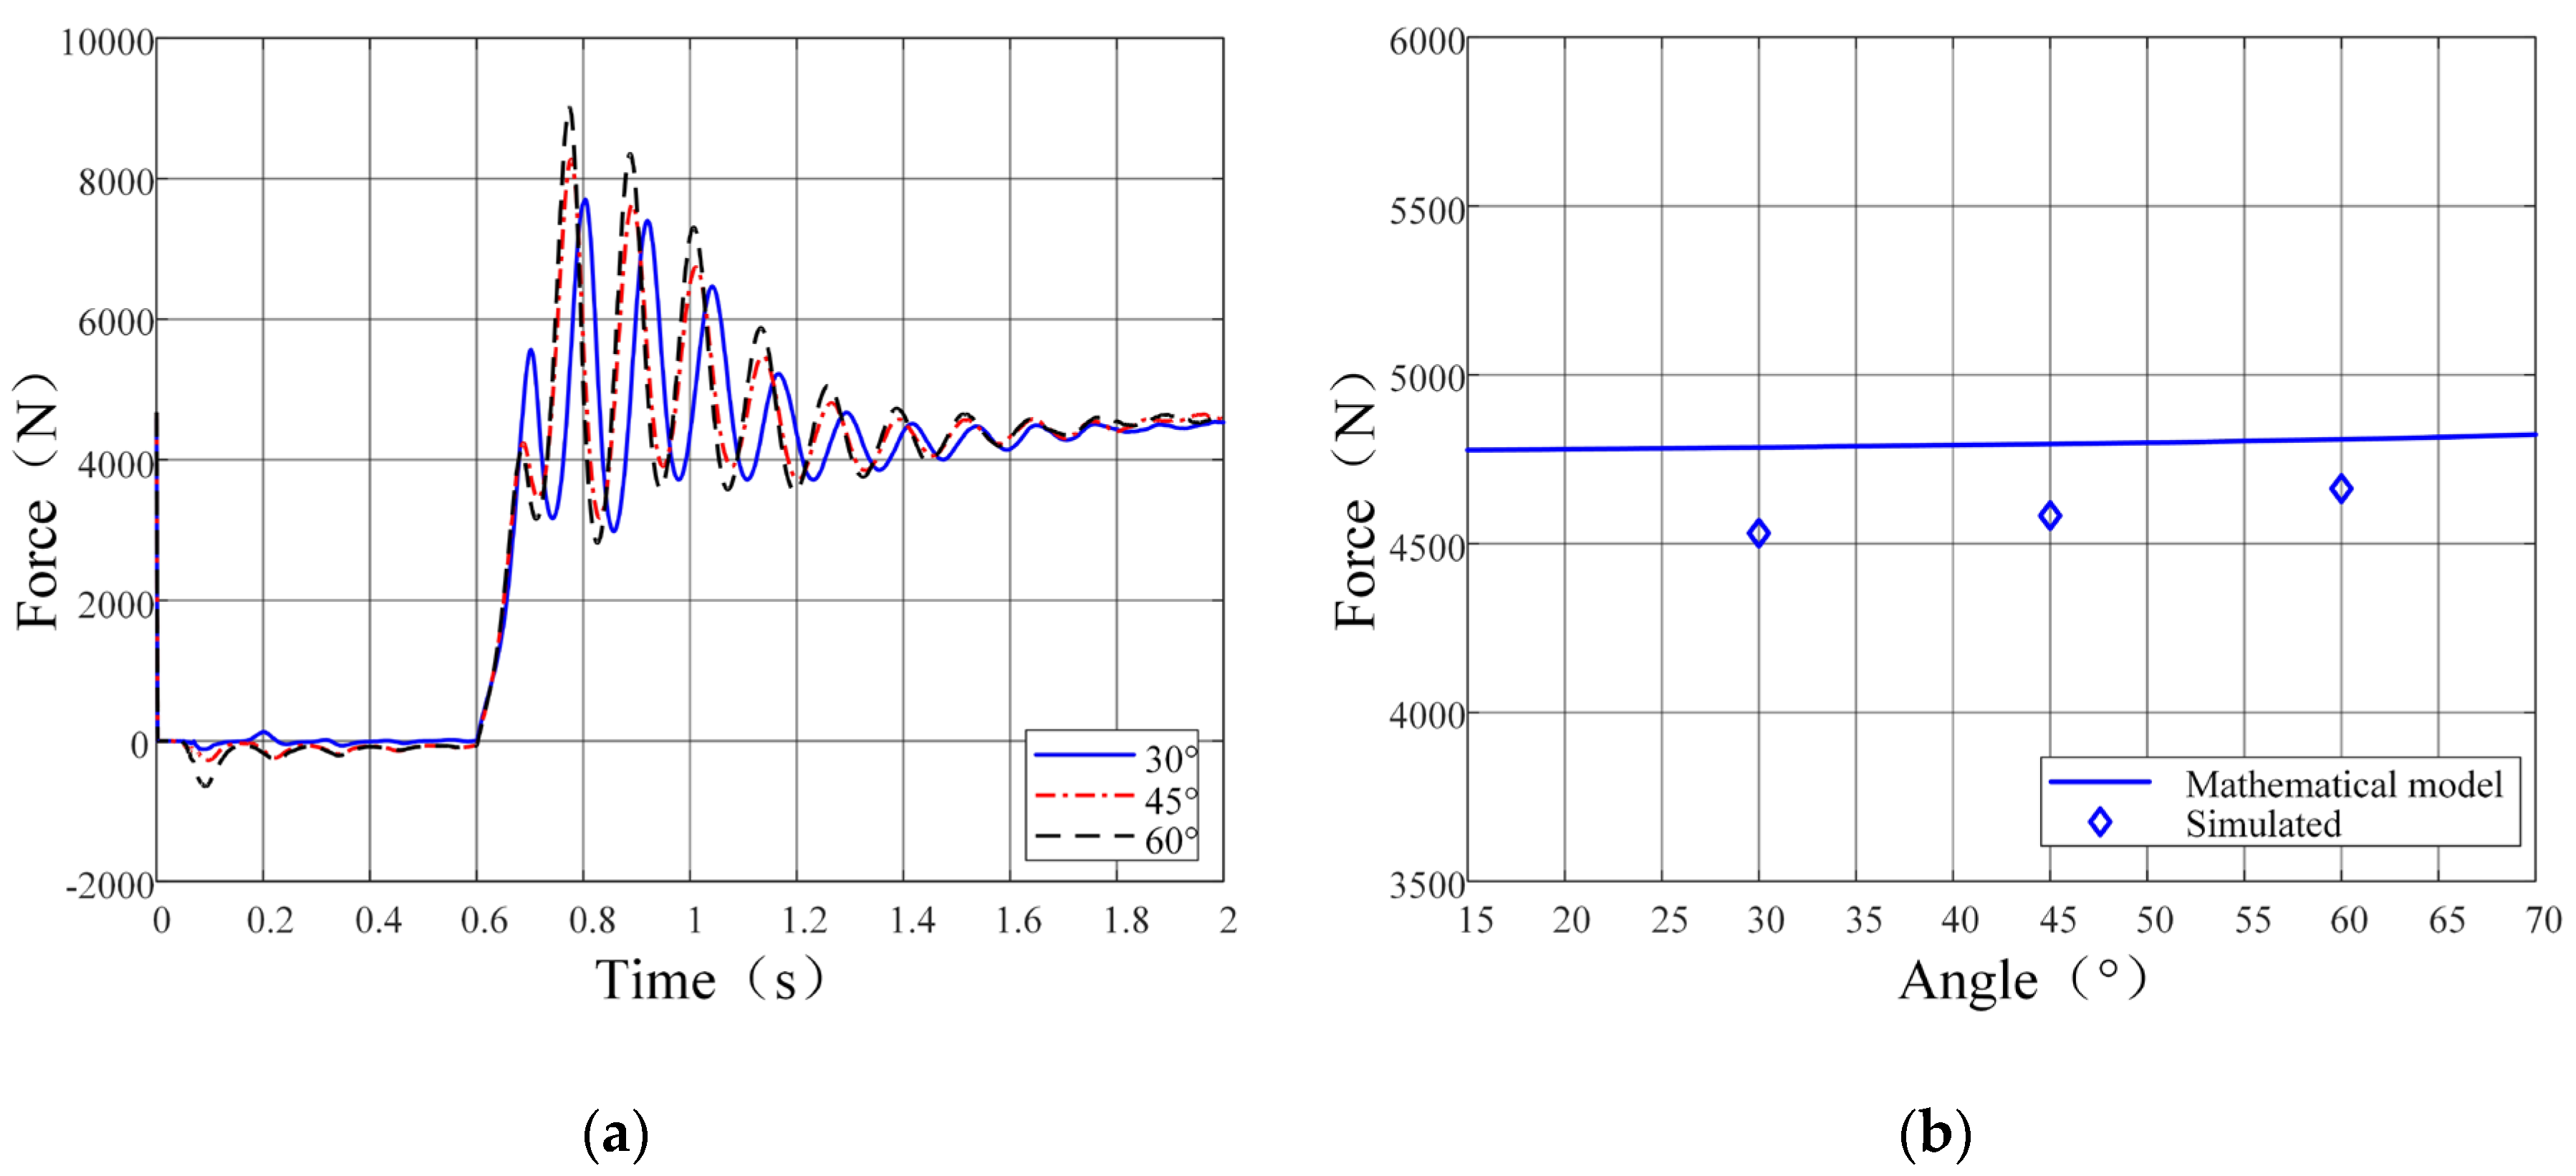
Figure 16.
Soil bin test configuration.
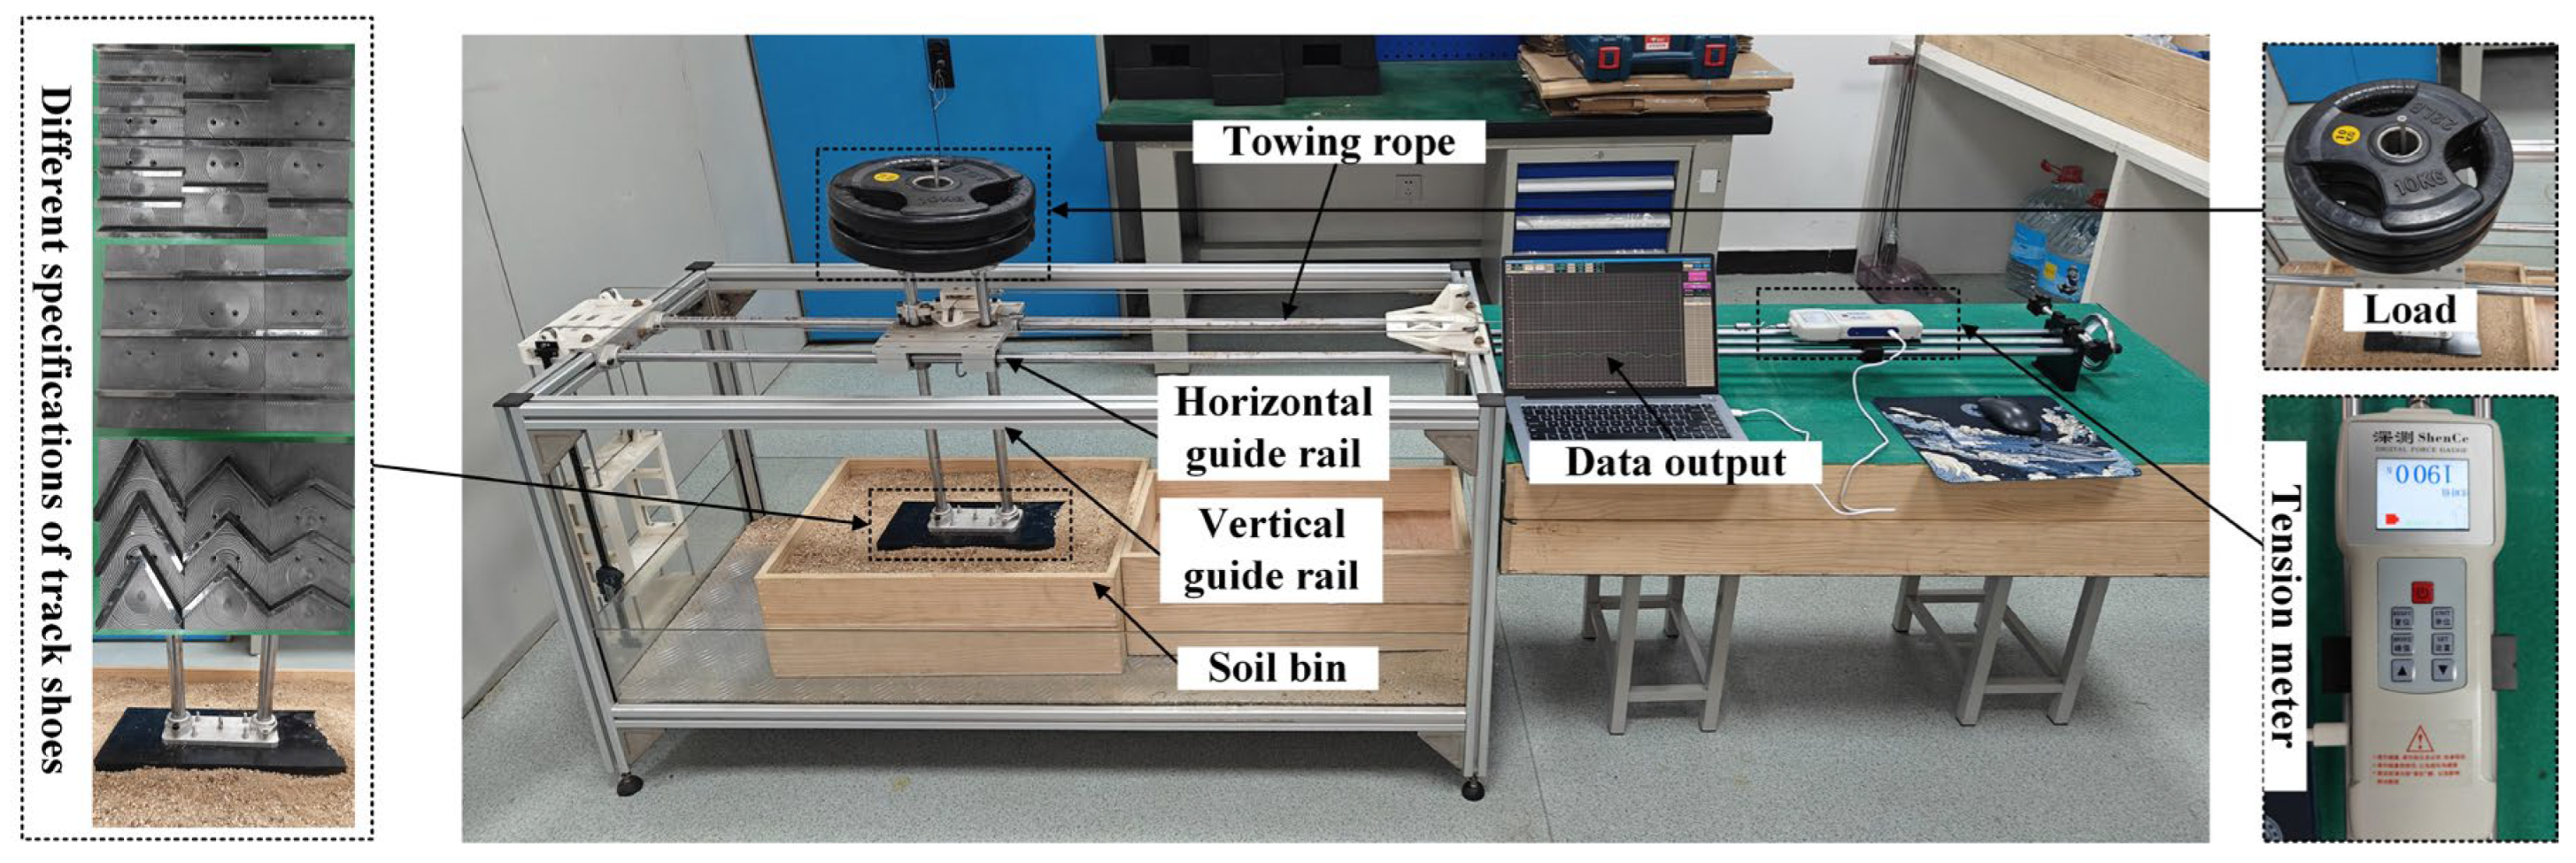
Figure 17.
Soil bin test results: (a) Soil thrust vs height; (b) Soil thrust vs spacing; (c) Soil thrust vs angle.
Figure 17.
Soil bin test results: (a) Soil thrust vs height; (b) Soil thrust vs spacing; (c) Soil thrust vs angle.
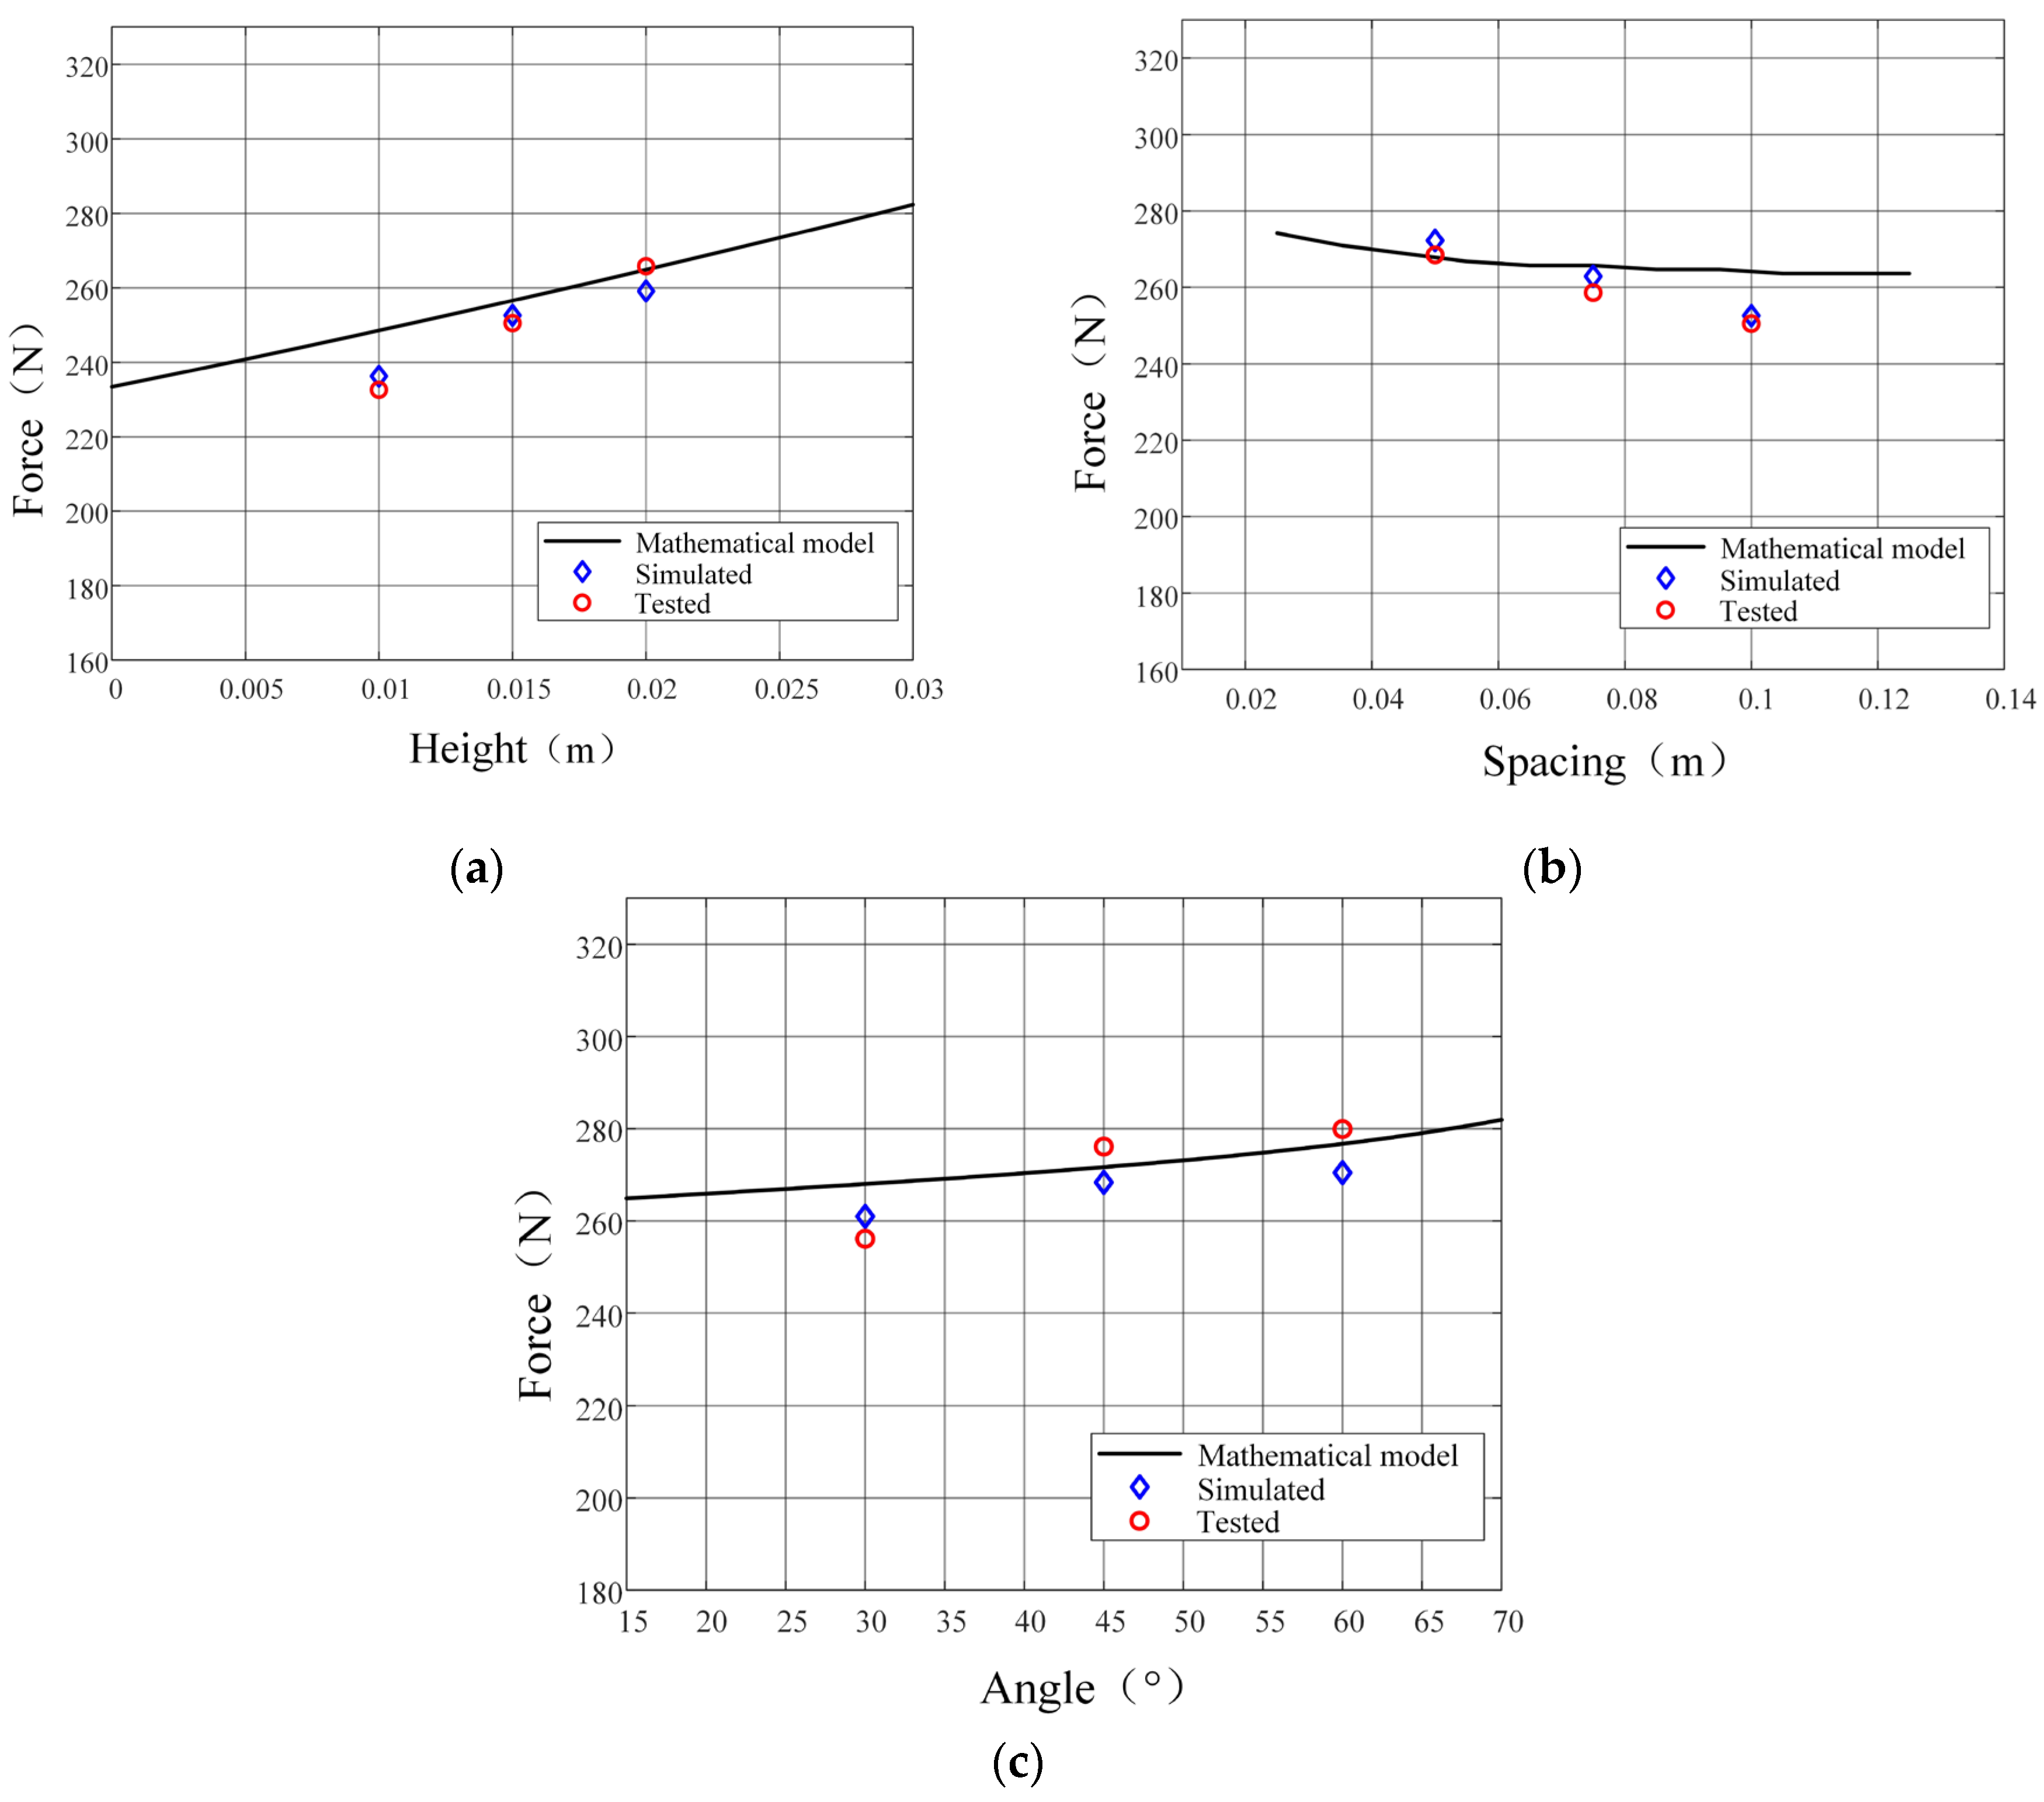
Figure 18.
Track shoe travel trace on soil bin.
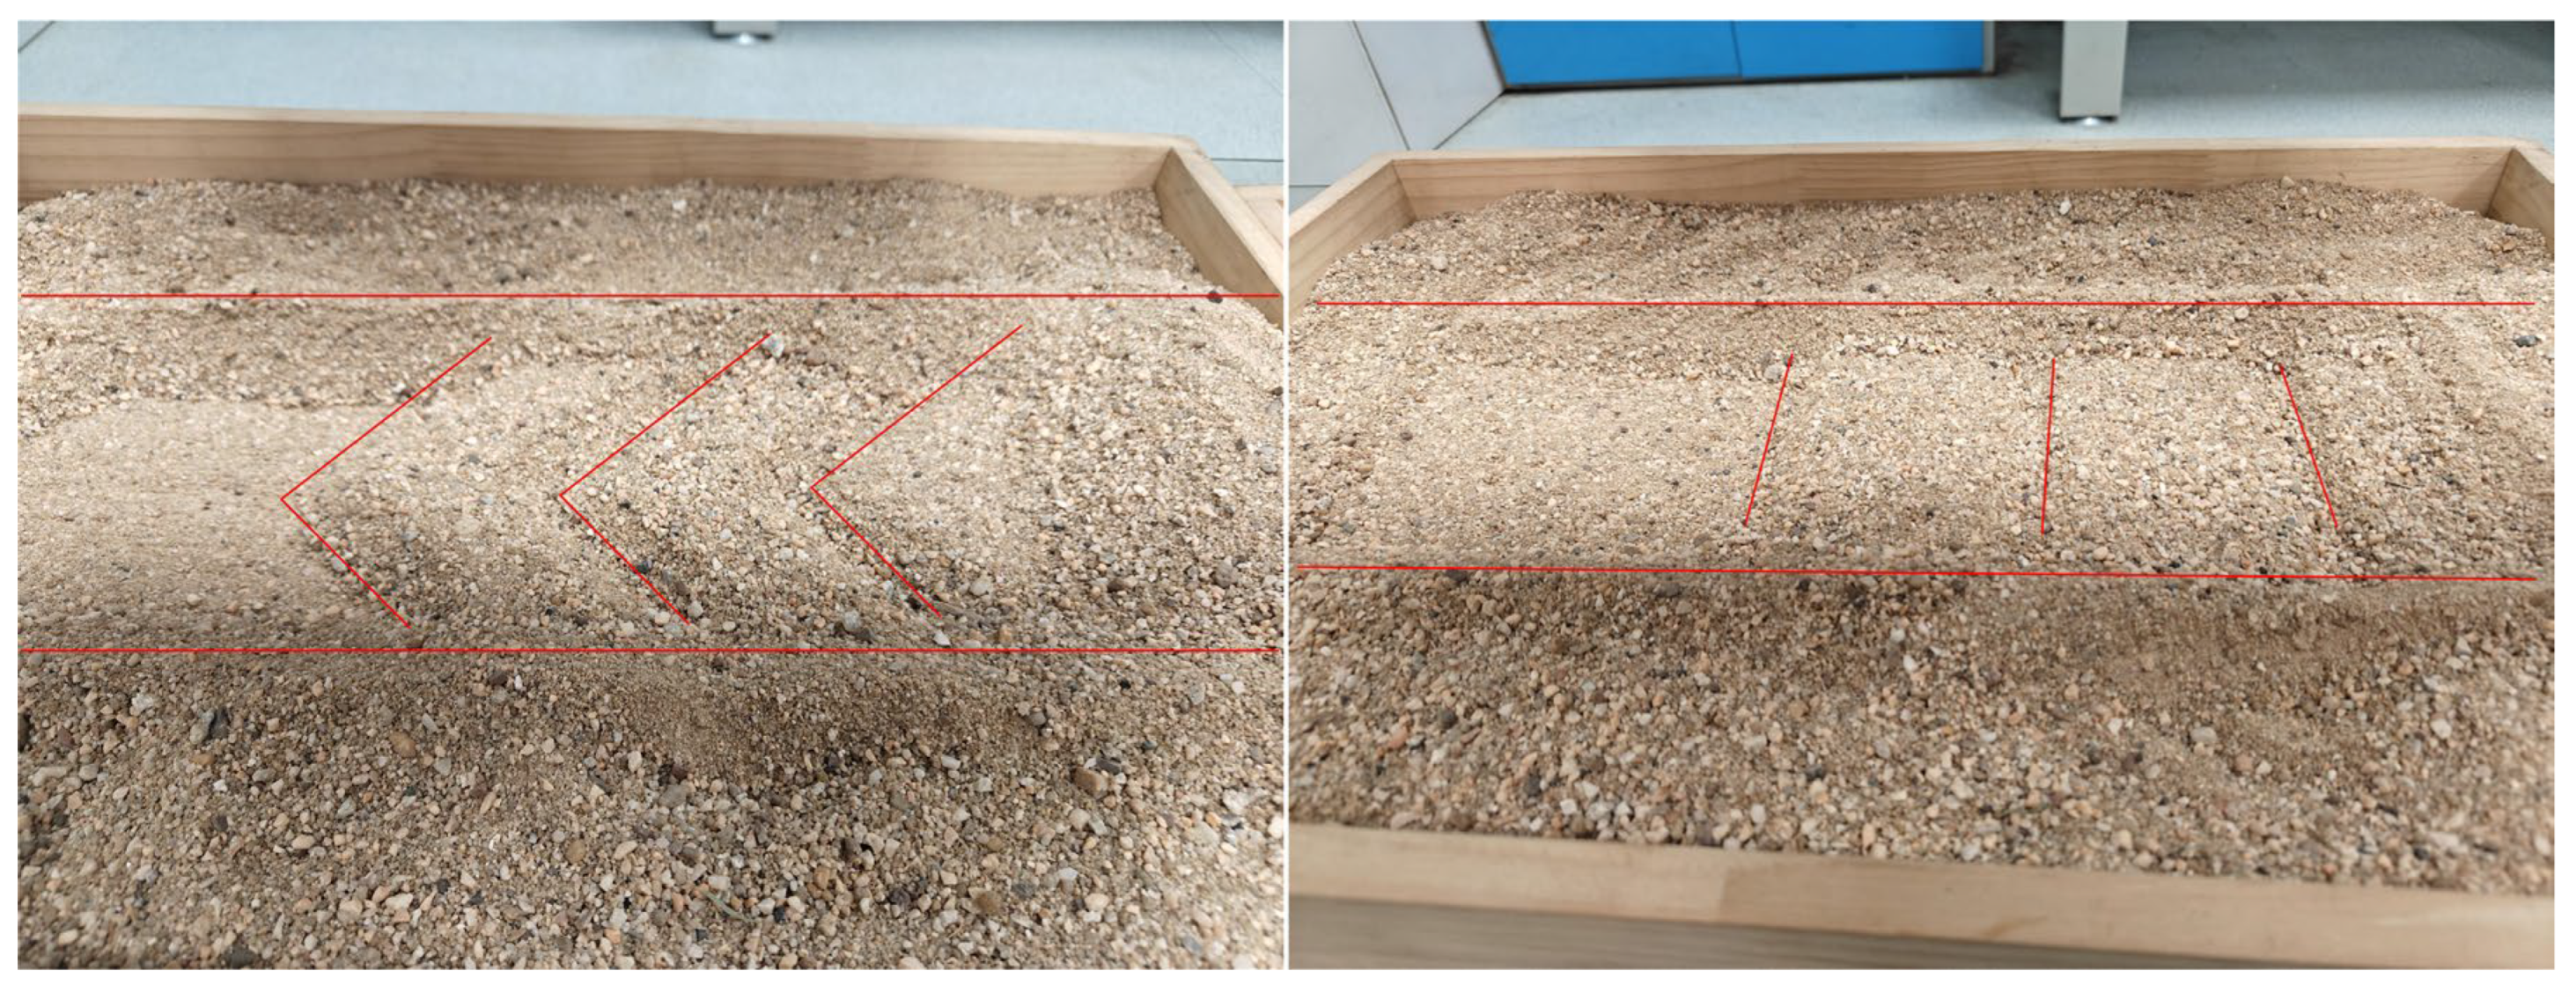
Figure 19.
Chassis structure comparison: Pre- vs Post-optimization.
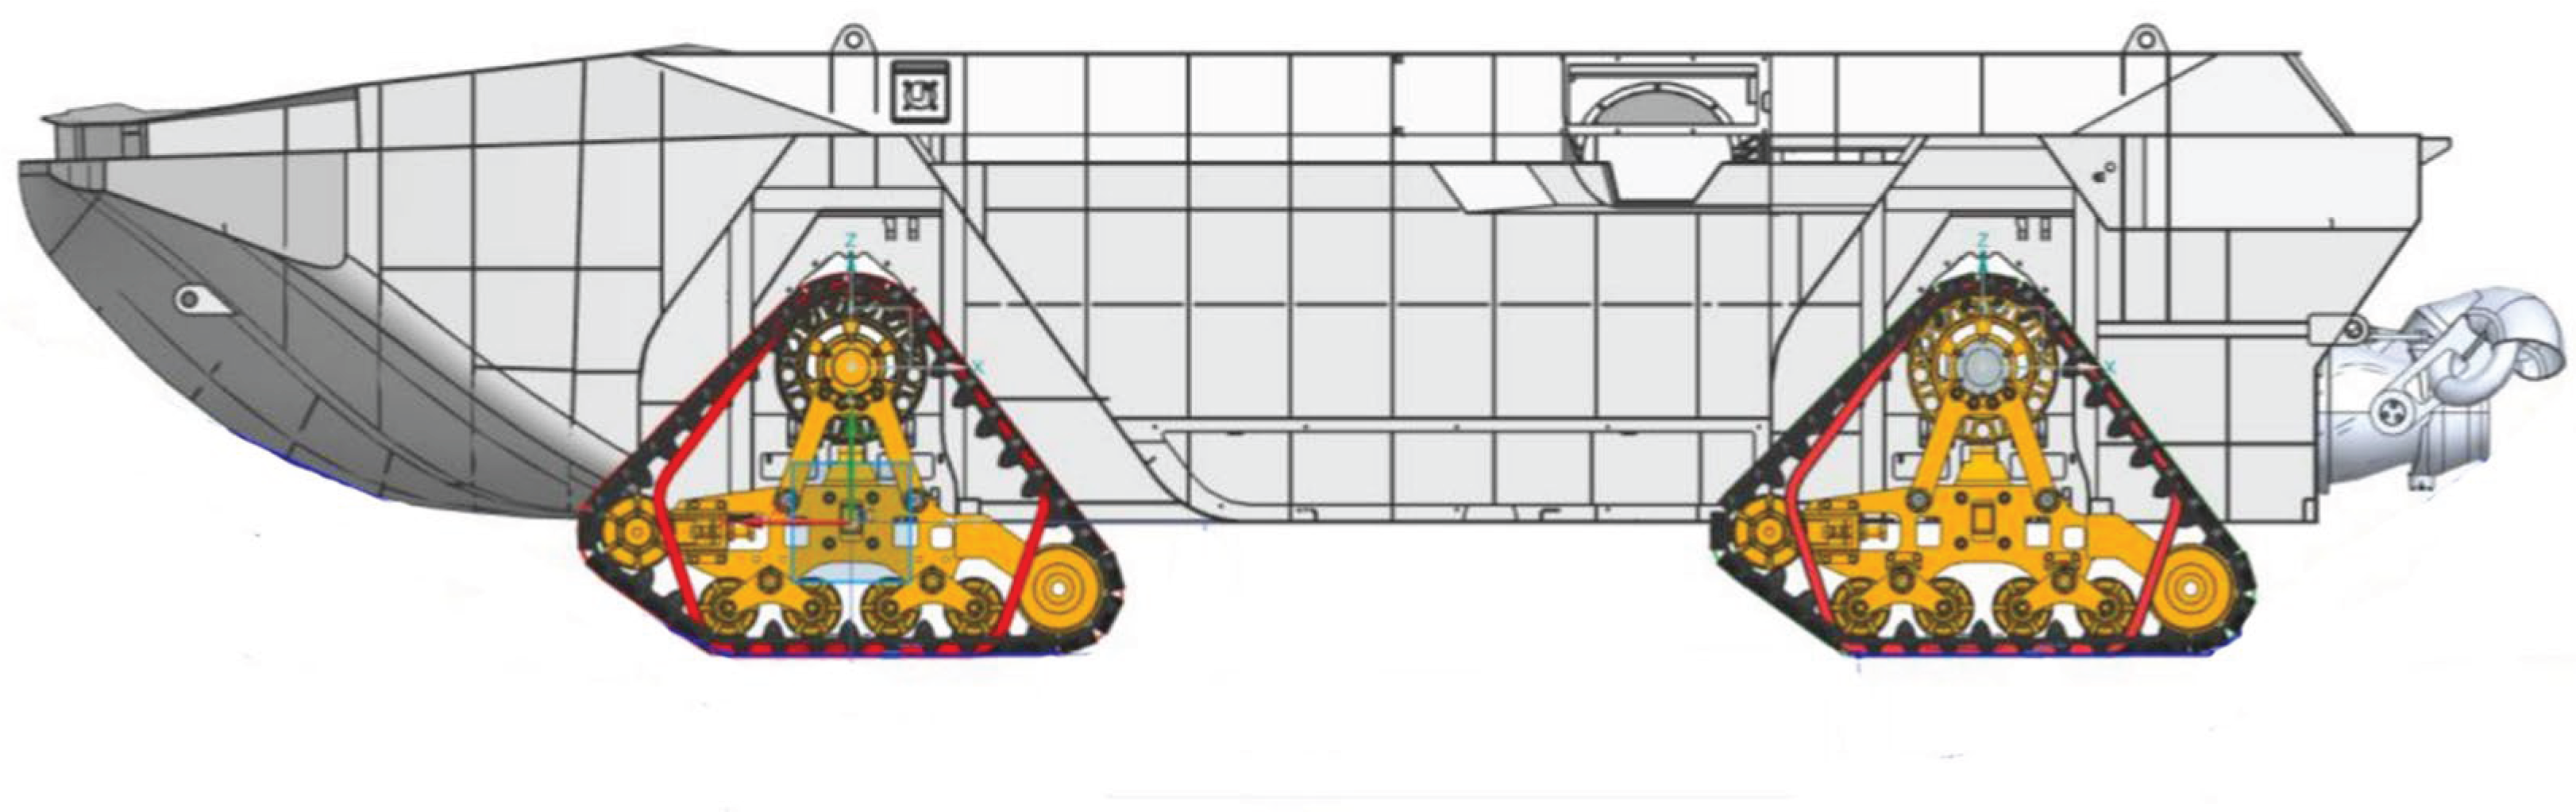

Table 1.
Sand soil calibration parameters.
|
Particle Intrinsic Parameters |
Particle Radius | 3mm |
| Coefficient of Restitution | 0.15 | |
| Particle Solid Density | 2670kg/m3 | |
| Soil Bulk Density | 1638kg/m3 | |
| Poisson's Ratio | 0.3 | |
| Shear Modulus | 1.15×10⁷Pa | |
|
Particle-Particle Contact Parameters |
Coefficient of Restitution | 0.43 |
| Coefficient of static friction | 0.75 | |
| Coefficient of rolling friction | 0.27 | |
|
Particle-Rubber Contact Parameters |
Coefficient of Restitution | 0.47 |
| Coefficient of static friction | 0.52 | |
| Coefficient of rolling friction | 0.24 |
Table 2.
Simulation experimental parameters.
| Parameters | Grouser Height /mm | V-shaped Angle /mm | Grouser Spacing /mm | Vertical Load/N | |
|---|---|---|---|---|---|
| Simulation Group | |||||
| Vertical Load Set | 15 | 0 | 100 | 500 | |
| 15 | 0 | 100 | 750 | ||
| 15 | 0 | 100 | 1000 | ||
| Grouser Height Set | 10 | 0 | 100 | 1000 | |
| 15 | 0 | 100 | 1000 | ||
| 20 | 0 | 100 | 1000 | ||
| Grouser Spacing Set | 15 | 0 | 50 | 1000 | |
| 15 | 0 | 75 | 1000 | ||
| 15 | 0 | 100 | 1000 | ||
| V-shaped Angle Set | 15 | 30 | 90 | 1000 | |
| 15 | 45 | 90 | 1000 | ||
| 15 | 60 | 90 | 1000 | ||
Table 3.
Experimental parameters and results.
| Parameters | Grouser Height /mm | V-shaped Angle /mm | Grouser Spacing /mm | Vertical Load/KPa | Number of Tests | Average Tensile Force /N | |
|---|---|---|---|---|---|---|---|
| Test Group | |||||||
| Grouser Height Set | 10 | 0 | 100 | 5 | 6 | 232.6 | |
| 15 | 0 | 100 | 5 | 6 | 250.5 | ||
| 20 | 0 | 100 | 5 | 6 | 265.8 | ||
| Grouser Spacing Set | 15 | 0 | 50 | 5 | 6 | 268.5 | |
| 15 | 0 | 75 | 5 | 6 | 258.6 | ||
| 15 | 0 | 100 | 5 | 6 | 250.5 | ||
| V-shaped Angle Set | 15 | 30 | 90 | 5 | 6 | 256.1 | |
| 15 | 45 | 90 | 5 | 6 | 276.1 | ||
| 15 | 60 | 90 | 5 | 6 | 279.9 | ||
Table 4.
Initial values and ranges of design variables.
| Design Variable | Initial Values | Parametric Bounds |
|---|---|---|
| Track Width | 280mm | 0~340mm |
| Track Length | 630mm | 0~870mm |
| Grouser Height | 15mm | 0~75mm |
| Grouser Spacing | 75mm | 50~150mm |
| V-shaped angle | 45° | 0~90° |
Table 5.
Optimization results.
| Design Variable | Optimization Results | Rounded Values |
|---|---|---|
| Track Width | 340.00mm | 340mm |
| Track Length | 870.00mm | 870mm |
| Grouser Height | 3.864mm | 4mm |
| Grouser Spacing | 113.611mm | 113mm |
| V-shaped angle | 16.52° | 17° |
Table 6.
Driving performance metrics comparison.
| Metric | Pre-Optimization | Post-Optimization | Variation |
|---|---|---|---|
| Ground Contact Pressure | 56689Pa | 33807Pa | -4.04% |
| Drawbar Pull | 2526N | 3937N | 55.86% |
| Drawbar Pull Variation from Grouser Optimization | 3315N | 3937N | 18.76% |
| Maximum Gradability | 15° | 23.6° | 57.33% |
Disclaimer/Publisher’s Note: The statements, opinions and data contained in all publications are solely those of the individual author(s) and contributor(s) and not of MDPI and/or the editor(s). MDPI and/or the editor(s) disclaim responsibility for any injury to people or property resulting from any ideas, methods, instructions or products referred to in the content. |
© 2025 by the authors. Licensee MDPI, Basel, Switzerland. This article is an open access article distributed under the terms and conditions of the Creative Commons Attribution (CC BY) license (http://creativecommons.org/licenses/by/4.0/).
Copyright: This open access article is published under a Creative Commons CC BY 4.0 license, which permit the free download, distribution, and reuse, provided that the author and preprint are cited in any reuse.


