
Submitted:
04 February 2025
Posted:
05 February 2025
You are already at the latest version
Abstract
Background: Some authors advocate that ECGs with conventional computer algorithm (CCA) interpretations of “normal” need not be immediately reviewed. However, such ECGs may actually manifest findings of acute coronary occlusion myocardial infarction (OMI). We sought to determine if such cases can be detected by artificial intelligence (AI).
Methods: Retrospective series (2014 - 2024) of cases with ≥ 1 pre-angiography ECGs with proven OMI outcome with a CCA ECG interpretation of “normal.” OMI outcome was defined as 1) diagnosis of acute type I MI, 2) angiographic culprit with intervention, 3) one of the following: a) TIMI 0-2 flow, or b) TIMI-3 or unknown flow, with high peak troponin or new wall abnormality. Each ECG was retrospectively interpreted by the PMcardio OMI AI ECG model. The primary analysis was the diagnostic performance of AI for the interpretation of CCA “normal” ECGs for OMI.
Results: 42 patients with OMI met inclusion criteria. The first ECG was interpreted as “normal” by the CCA in 88% of cases; AI interpreted 81% as OMI and 86% as abnormal. Of 78 total ECGs interpreted by the CCA, 73% were diagnosed as “normal.” Of this 73%, AI identified 81% as abnormal and 72% as OMI.
Conclusion: The CCA may interpret an ECG manifesting OMI as “normal.” AI not only recognized these as abnormal, but, in 81% of patients, correctly recognized OMI on the first ECG, and recognized 72% of all CCA “normal” ECGs as OMI. It was rare for AI to diagnose a normal ECG in any OMI patient.
Keywords:
Triage
; EKG
; ECG
; Electocardiogram
; Artificial Intelligence
; Myocardial Infarction
; Occlusion Myocardial Infarction
; Acute Coronary Occlusion
1. Introduction:
The 12-lead electrocardiogram (ECG) is the primary means of rapidly diagnosing acute coronary occlusion myocardial infarction (ACOMI, shortened to OMI) in patients who have a clinical presentation consistent with acute coronary syndrome (ACS). The importance of diagnosing OMI beyond STEMI criteria is now very well established in the literature [1,2,3,4,5]. Rapid recognition of OMI is essential for rapid intervention in order to save myocardium [6]. For chest pain patients, guidelines thus recommend that an ECG be recorded and interpreted in the Emergency Department within 10 minutes. Thus, emergency physicians are frequently interrupted in order to read triage ECGs. However, only a small fraction of patients with chest pain have acute OMI, and so the EP must be interrupted very frequently in order to find that proverbial “needle in a haystack.” It is standard to integrate ECG interpretation algorithms into ECG machines; these conventional algorithms are programmed, instructional, “if-then” algorithms, in contrast to deep neural network artificial intelligence (AI) algorithms. Four recent publications have purported to show that, if the conventional computer algorithm (CCA) interpretation of the ECG is “normal,” in contrast to even minor abnormalities such as “nonspecific ST-T abnormality,” the physician need not review the triage ECG because, they contend, there will be no emergency revealed on that ECG [7,8,9,10]. At least one other study contended that physician review of triage ECGs is not cost-effective [11]. Editorials and letters to editors have disputed this idea [12,13]. These 3 studies had slightly varying definitions of normal: 1) “Normal sinus rhythm or Normal ECG” or “Normal sinus rhythm with sinus arrhythmia [7]; 2) “Normal ECG” [8,10] 3) “Normal” or “Otherwise normal” ECG [9].
Recent research has shown that there are many subtle ECG findings beyond ST Elevation that are specific for OMI [4,14,15,16]. Furthermore, it has been shown that the CCA interprets some OMI ECGs as completely normal [17]. Over a 10-year period, many ECGs manifesting subtle signs of OMI and proven to be OMI by the patients’ actual clinical outcomes, but interpreted as completely normal by the conventional algorithm, were collected as part of an online blog (Dr. Smith’s ECG Blog) [18]. Artificial intelligence (AI) has been shown to be accurate in detecting OMI that is not STEMI [19,20,21,22]. To our knowledge, only one such deep convolutional neural network model is available for interpretation of ECG images and has published performance results for diagnosis of OMI (“Queen of Hearts” PMcardio OMI AI ECG model) [21]. We sought to assess the performance of the “Queen of Hearts” on these CCA “normal” ECGs.
2. Methods
2.1. Study Design
This study was a retrospective case series examining the diagnostic performance of an AI algorithm known as the Queen of Hearts (details below) for the diagnosis of OMI from ECGs misinterpreted as normal by conventional algorithms. All proven OMI cases that had at least one ECG that Dr. Smith recognized as OMI but which was interpreted as normal by the CCA and were posted on Dr. Smith’s ECG blog [18] were searched on the blog and included. Eleven additional cases which met inclusion criteria outlined below were provided by co-author HH from cases for which he recorded ECGs as a technician in the Minneapolis Heart Institute (MHI) Emergency Department, and were collected within the same timeframe and were also recognized as OMI by Dr. Smith. There were numerous other contributors from hospitals across the US over a 10-year period from December 2014 through October 2024, but the vast majority of cases come from either Hennepin County Medical Center or from MHI or hospitals that refer to MHI. Any ECGs which were utilized to train the algorithm were excluded. Inclusion criteria included the following: 1) OMI was recognized by Dr. Smith on at least one pre-PCI ECG that was labeled as “normal” by the CCA, and 2) meets the outcome definition of OMI, defined in accordance with previous studies [16,23,24,25,26].
This outcome definition is:
- 1)
- Diagnosis of acute type 1 MI with rise and/or fall of troponin, and
- 2)
- Angiographic culprit with intervention, and
- 3)
-
One of the following:
- A)
- TIMI 0-2 flow, or
- B)
-
TIMI-3 flow or unknown flow with large acute infarct size, as determined by one of the following:
- i)
-
Very elevated troponin defined as
- a)
- peak high sensitivity troponin-I level > 5000 ng/L
- b)
- peak 4th generation troponin I > 10 ng/mL,
- c)
- peak high sensitivity troponin T > 1000 ng/L, or
- d)
- peak 4th generation troponin T > 1.0 ng/mL.
- ii)
- New regional wall motion abnormality (WMA) on echocardiography if peak troponin levels were not available or were below the very high threshold.
An ECG manifested OMI if the outcome was OMI and Dr. Smith interpreted it as OMI. This study was conducted using publicly available data and de-identified case descriptions; thus IRBs determined that it was exempt from IRB approval.
2.2. Data Elements
Blog posts list sex, age, or nearest decade of life, a brief case summary, and a chronological description of events along with high-resolution images of ECGs obtained at various stages of the patient’s care. All ECGs recorded prior to angiogram were included for analysis. The CCA interpretation as well as the CCA manufacturer were recorded for each ECG, when available. A CCA interpretation was considered normal if the interpretation listed 1) “Normal ECG,” or 2) “sinus bradycardia/tachycardia, otherwise normal” or 3) “Early repolarization, otherwise normal.” In order to accurately compare the performances of the CCA with the AI system, when there was no CCA interpretation provided on the blog post but the ECG manifested ST Elevation millimeter criteria, we assigned an assumed CCA interpretation of “STEMI.” If an ECG without a CCA interpretation provided by the blog post did not meet millimeter criteria for STEMI, we assigned an interpretation of “unknown.” An interpretation of “normal” was never assumed for any CCA interpretation.
All ECGs were then reviewed by independent members of the study team for previously described key elements suggestive of OMI, including: hyperacute T-waves, subtle STE especially when associated with pathological Q-waves or any amount of reciprocal ST depression or reciprocal T-waves, terminal QRS distortion, horizontal ST-segment flattening or down-up T-waves), or any amount of ST depression in V1-V4. Included ECGs were also reviewed by blinded study team members for STEMI millimeter criteria in accordance with the 4th Universal Definition of MI [27].
2.3. Artificial Intelligence Algorithm
The AI algorithm employed herein was version 1 of the Queen of Hearts (QoH) software powered through the PMcardio OMI AI ECG model, version 2.8 (Powerful Medical; Bratislava, Slovakia). This algorithm first converts any ECG image to digital data, then employs a deep convolutional neural network (DCNN) model trained to detect OMI from single 12-lead ECG data, blinded to all other clinical data. In the validation study, the algorithm had double the sensitivity of the STEMI criteria for OMI (66% vs. 33%) at a fixed specificity of 97.7% [21]. The current version does not allow for analysis of serial ECGs, so even subsequent ECGs from a single patient are interpreted separately without comparison or relation to one another. QoH reports either “OMI” or “Not OMI” followed by a “high”, “mid”, or “low” confidence rating. Included ECGs were digitally copied from blog posts and directly uploaded to the software through the Telegram interface (no longer in use) for AI interpretation. An interpretation was considered positive for OMI if the AI software reported OMI at any confidence level. An interpretation was only considered normal if the AI reported “Not OMI with high confidence;” all other interpretations were considered abnormal. The PMCardio application diagnoses 38 ECG abnormalities in addition to OMI; however, the Telegram interface only diagnoses “OMI” or “Not OMI.” Therefore, any abnormality other than OMI which might have been missed by the CCA is not compared with AI in this study.
2.4. Primary Outcome
The primary analysis was the diagnostic performance of the AI algorithm for diagnosis of OMI from 12-lead ECGs misinterpreted as normal by the CCA. The performance was evaluated through several data comparisons: 1) the percentage of first recorded ECGs that were diagnosed as normal by the CCA but diagnosed as OMI by AI. 2) the percentage of all ECGs misread as normal by the CCA but correctly interpreted as OMI by AI; 3) the percentage of ECGs misread as normal by the CCA but interpreted by AI as abnormal (defined as OMI with any confidence or Not OMI with low or mid confidence).
A secondary aim of this study is to describe the common features of ECGs indicative of OMI but missed by the CCA.
2.5. Statistical Analysis
Simple statistics only were used, with proportions. CCA and AI were compared with Chi-square.
3. Results
3.1. Participants
Sixty-five cases were reviewed for inclusion. Six cases had ECGs manifesting OMI which were read as normal by CCAs but were ultimately excluded because they did not meet the inclusion criteria; 5 of the 6 had culprits with PCI, but had TIMI-3 flow without a very high peak troponin. Thus, 59 cases met inclusion criteria with at least one 12-lead ECG recognized as OMI but which was interpreted as “normal” or “otherwise normal” by the CCA, and the patient was ultimately diagnosed with OMI by the outcome definition. Seventeen cases had been among the thousands of ECGs used to train the AI model; after excluding these cases, there were 42 left for analysis. Blog posts reported the patient’s age in 31 (74%) cases and sex in 28 (67%) of cases. The average age was 53 years old and 50% of patients were male.
Of the 42 cases, angiography showed TIMI-0 flow in 26, TIMI-1 flow in 0, TIMI-2 flow in 4. Six had TIMI-3 or unspecified TIMI flow with a very high peak troponin; 6 had TIMI-3 flow or unspecified TIMI flow, with a new wall motion abnormality, and elevated troponin diagnostic of acute MI, but either peak troponin unknown or below the very high threshold.
3.2. CCA Interpretations of the Initial ECG
Of these 42 cases, the initial ECG was interpreted by the CCA as normal in 37 (88%); the exact diagnoses were: 1) “Normal ECG” in 32 (86%) cases and 2) “Otherwise normal” in 5 (14%), with an additional qualifier of “sinus bradycardia” (n=4, 11%) or “Marked sinus arrhythmia” (n = 1, 3%). Five patients (12%) had abnormal initial ECGs by the CCA. The CCA interpretations among these five were STEMI (n=2, 5%), nonspecific ST-T wave abnormality (n=2, 5%), and right bundle branch block (n=1, 2%). These five patients went on to have subsequent ECGs obtained in the ED prior to angiogram that were interpreted by the CCA as normal or otherwise normal in spite of manifesting OMI.
3.3. AI Interpretations of the Initial ECG
The AI software interpreted 34 (81%) of the 42 initial ECGs of each case as diagnostic of OMI. Of these interpretations, 32 (76%), 2 (5%), and 0 (0%) were made with high, medium, and low confidence ratings, respectively. Only 6 (14%) of the initial ECGs were interpreted by AI as normal (i.e., “Not OMI with high confidence”); the remaining 36 (86%) were interpreted as abnormal.
Of the 37 initial ECGs interpreted by the CCA as “normal” or “otherwise normal”, the AI interpreted 29 (78%) as OMI, 31 (84%) as abnormal, and 6 (16%) as normal. Among these cases, 27/29 (73%) were diagnosed as OMI with high confidence, 2 (5%) as OMI with mid confidence, 0 (0%) as OMI with low confidence, 1 (3%) as Not OMI with low confidence, 1 (3%) as Not OMI with mid confidence, and 6 (16%) as Not OMI with high confidence.
3.4. Per-ECG Diagnostic Performance
A total of 96 ECGs were obtained prior to reperfusion therapy from the 42 patients included in the study; there were CCA interpretations available for 78 of these ECGs. CCA interpreted 57 (73%) as normal or otherwise normal and 21 (27%) as abnormal. Specifically, 46 (59%) ECGs were read as normal, 7 (9%) as “sinus bradycardia but otherwise normal,” 1 (1%) as “early repolarization but otherwise normal,” 1 (1%) as “sinus tachycardia but otherwise normal,” 1 (1%) as “marked sinus arrhythmia, otherwise normal,” and 1 (1%) as “sinus rhythm with PVCs, otherwise normal.” Abnormal CCA interpretations included 8 (10%) “STEMI”, 2 (3%) “moderate ST depression”, 7 (9%) “nonspecific ST-T wave abnormality,” 1 (1%) “Anterior MI of indeterminate age,” 3 (4%) “Consider subendocardial injury,” 1 (1%) “possible left atrial enlargement,” 1 (1%) “prolonged QT,” 2 (3%) “Right bundle branch block,” and 1 (1%) “possible acute pericarditis”. The CCA interpretation was unknown for 18 (19%) of ECGs, but STEMI criteria were satisfied for 5 of these 18, so their CCA interpretations are assumed to be “STEMI”.
The AI algorithm interpreted 72 of 96 (75%) ECGs as OMI, with 62 (65%), 6 (6%), and 4 (4%) as high, medium, and low confidence respectively. AI interpreted 13 (14%) as normal (i.e., “Not OMI with high confidence”) and 83 (86%) as abnormal. This information is summarized in Figure 1 and Table 1.
Figure 1. Two graphs showing CCA interpretations for all 96 ECGs (left) and AI model interpretations for all 96 ECGs (right). The red bars represent normal ECG reads in both the AI and the CCA graphs. The yellow bars represent abnormal reads other than acute MI. The green bars represent ECGs with an interpretation of acute MI. The gray bar represents the unknown CCA reads.
4.5. AI Performance with CCA “Normal” ECGs
A total of 57 ECGs were read by the CCA as either “normal” or “otherwise normal.” Of these, the AI correctly interpreted 46 (81%) as abnormal and 41 (72%) as OMI. Abnormal reads by the AI included 37 (65%) OMI with high confidence, 3 (5%) OMI with mid confidence, 1 (2%) OMI with low confidence, 1 (2%) Not OMI with low confidence, and 4 (7%) OMI with mid confidence. The AI called 11 (19%) ECGs Not OMI with high confidence.
3.6. CCA vs AI, Case by Case
To evaluate the diagnostic performance of the AI against the CCA case by case, the 42 cases are split into four separate categories:
- Cases in which both the CCA and the AI system diagnosed acute MI.
- Cases in which the CCA did not diagnose acute MI but the AI system did.
- Cases in which neither the CCA nor the AI system diagnosed acute MI.
- Cases in which the CCA diagnosed MI but the AI system did not.
There were 8 cases in which both the CCA and the AI system diagnosed acute MI. These cases are summarized in Table 2. In these cases, the AI identified acute MI a mean of 68.6 minutes faster than the CCA. The AI identified acute MI after a mean of 1.25 ECGs, whereas the CCA identified acute MI after a mean of 2.25 ECGs.
Table 2. If available in the blog post, the specific CCA is named in the “Interpretation Software” column. For each case, once the software identifies acute MI, that is, once the CCA calls STEMI or the AI calls OMI with any confidence level, ECGs in the corresponding row are no longer enumerated. Time differences between ECGs are displayed in minutes. Cases 11 and 30 are included because later ECGs which manifested OMI were interpreted as Normal by the CCA.
There were 30 cases for which the CCA did not, but the AI did, diagnose acute MI on any ECG. These cases include all CCA reads of abnormal except for “STEMI.” A mean of 2.3 ECGs were recorded in these cases. An AI diagnosis of OMI with any confidence level was made after a mean of 1.13 ECGs. These are summarized in Figure 2.
Figure 2. Display showing the number of ECGs recorded in cases where the CCA did not identify acute MI (blue bar) and the number of ECGs recorded in each case until the AI system recognized OMI with any confidence level (red bar).
There were 4 cases in which neither the CCA nor the AI diagnosed acute MI. Only in cases 6 and 16 did the AI call every ECG “normal”, that is, Not OMI with high confidence, and in these cases, the CCA also called every ECG “normal” or “otherwise normal”. These cases and their ECG reads are shown in Table 3.
In none of the 42 cases did an ECG with a CCA interpretation of acute MI or abnormal ECG receive an AI diagnosis of “Not OMI with high confidence”.
4. Common ECG Features
Of all 96 ECGs included in this study, the most common ischemic feature present was reciprocal change including reciprocal ST depression, reciprocal T-wave inversion, reciprocal horizontal ST flattening, or reciprocal down-up T-waves in 73 (76%) ECGs. The next most common ischemic features were hyperacute T waves and subtle ST elevation not meeting criteria for STEMI, each present in 70 (73%) of tracings. Among the 42 first ECGs obtained in each case, reciprocal changes were most common, seen in 36 (86%) ECGs, followed by hyperacute T waves in 36 (83%) and subtle ST elevation in 31 (74%). Among the 57 ECGs labeled “Normal” or “Otherwise normal” by CCA, the most common ischemic findings were reciprocal changes and subtle ST elevation, each seen in 46 (81%) ECGs, followed by hyperacute T waves, seen in 41 (72%) ECGs. Curiously, there were 4 ECGs recorded which met STEMI criteria but received a diagnosis of “normal” by CCAs. Additional ischemic features and their frequencies are listed in Figure 3. See Figure 4 and Figure 5 for examples of “normal” ECGs which manifest OMI and were recognized by AI as OMI.
Figure 3: The Y axis shows the number of ECGs for each graph. The graph labeled “All ECGs” accounts for all 96 ECGs from the data set. The graph labeled “Initial ECGs” accounts for the initial ECG of each of the 42 cases. The graph labeled “CCA ‘Normal’ ECGs” accounts for all 57 ECGs in the data set called “normal” or “otherwise normal” by CCAs. The X axis enumerates 8 ischemic features for which each ECG was evaluated. The corresponding features are:
- STEMI criteria
- Hyperacute T waves
- Pathologic Q waves with ST elevation
- Terminal QRS Distortion
- Reciprocal changes, including ST depression, T wave inversion, horizontal ST segment flattening, or down-up T waves
- Subtle ST elevation
- Any amount of ST depression in V1-V4
- Any inferior ST elevation with any reciprocal change
ECGs meeting criteria for STEMI were not counted as displaying subtle ST elevation. The ECG in case 7 could not be evaluated for STEMI criteria, as lead V2 had 2 mm of ST elevation and lead V3 only had 1.5 mm of ST elevation, and no patient demographics were given for the case. As such, 95 ECGs were evaluated for STEMI criteria in the graph labeled “All ECGs”, 41 for the graph labeled “Initial ECGs”, and 56 for the graph labeled “CCA ‘Normal’ ECGs”.
Figure 4.
This ECG from case 5 was called normal by the Marquette 12 SL algorithm, however, there are hyperacute T waves in the anterior and lateral precordial leads and pathological Q waves with ST elevation and hyperacute T waves in the inferior leads. The patient was found to have a 100% occlusion of the proximal LAD. The Queen of Hearts software calls this ECG “OMI with high confidence”. The digitized version shows the AI explainability in which the parts of the ECG most concerning for OMI to the AI are highlighted in blue.
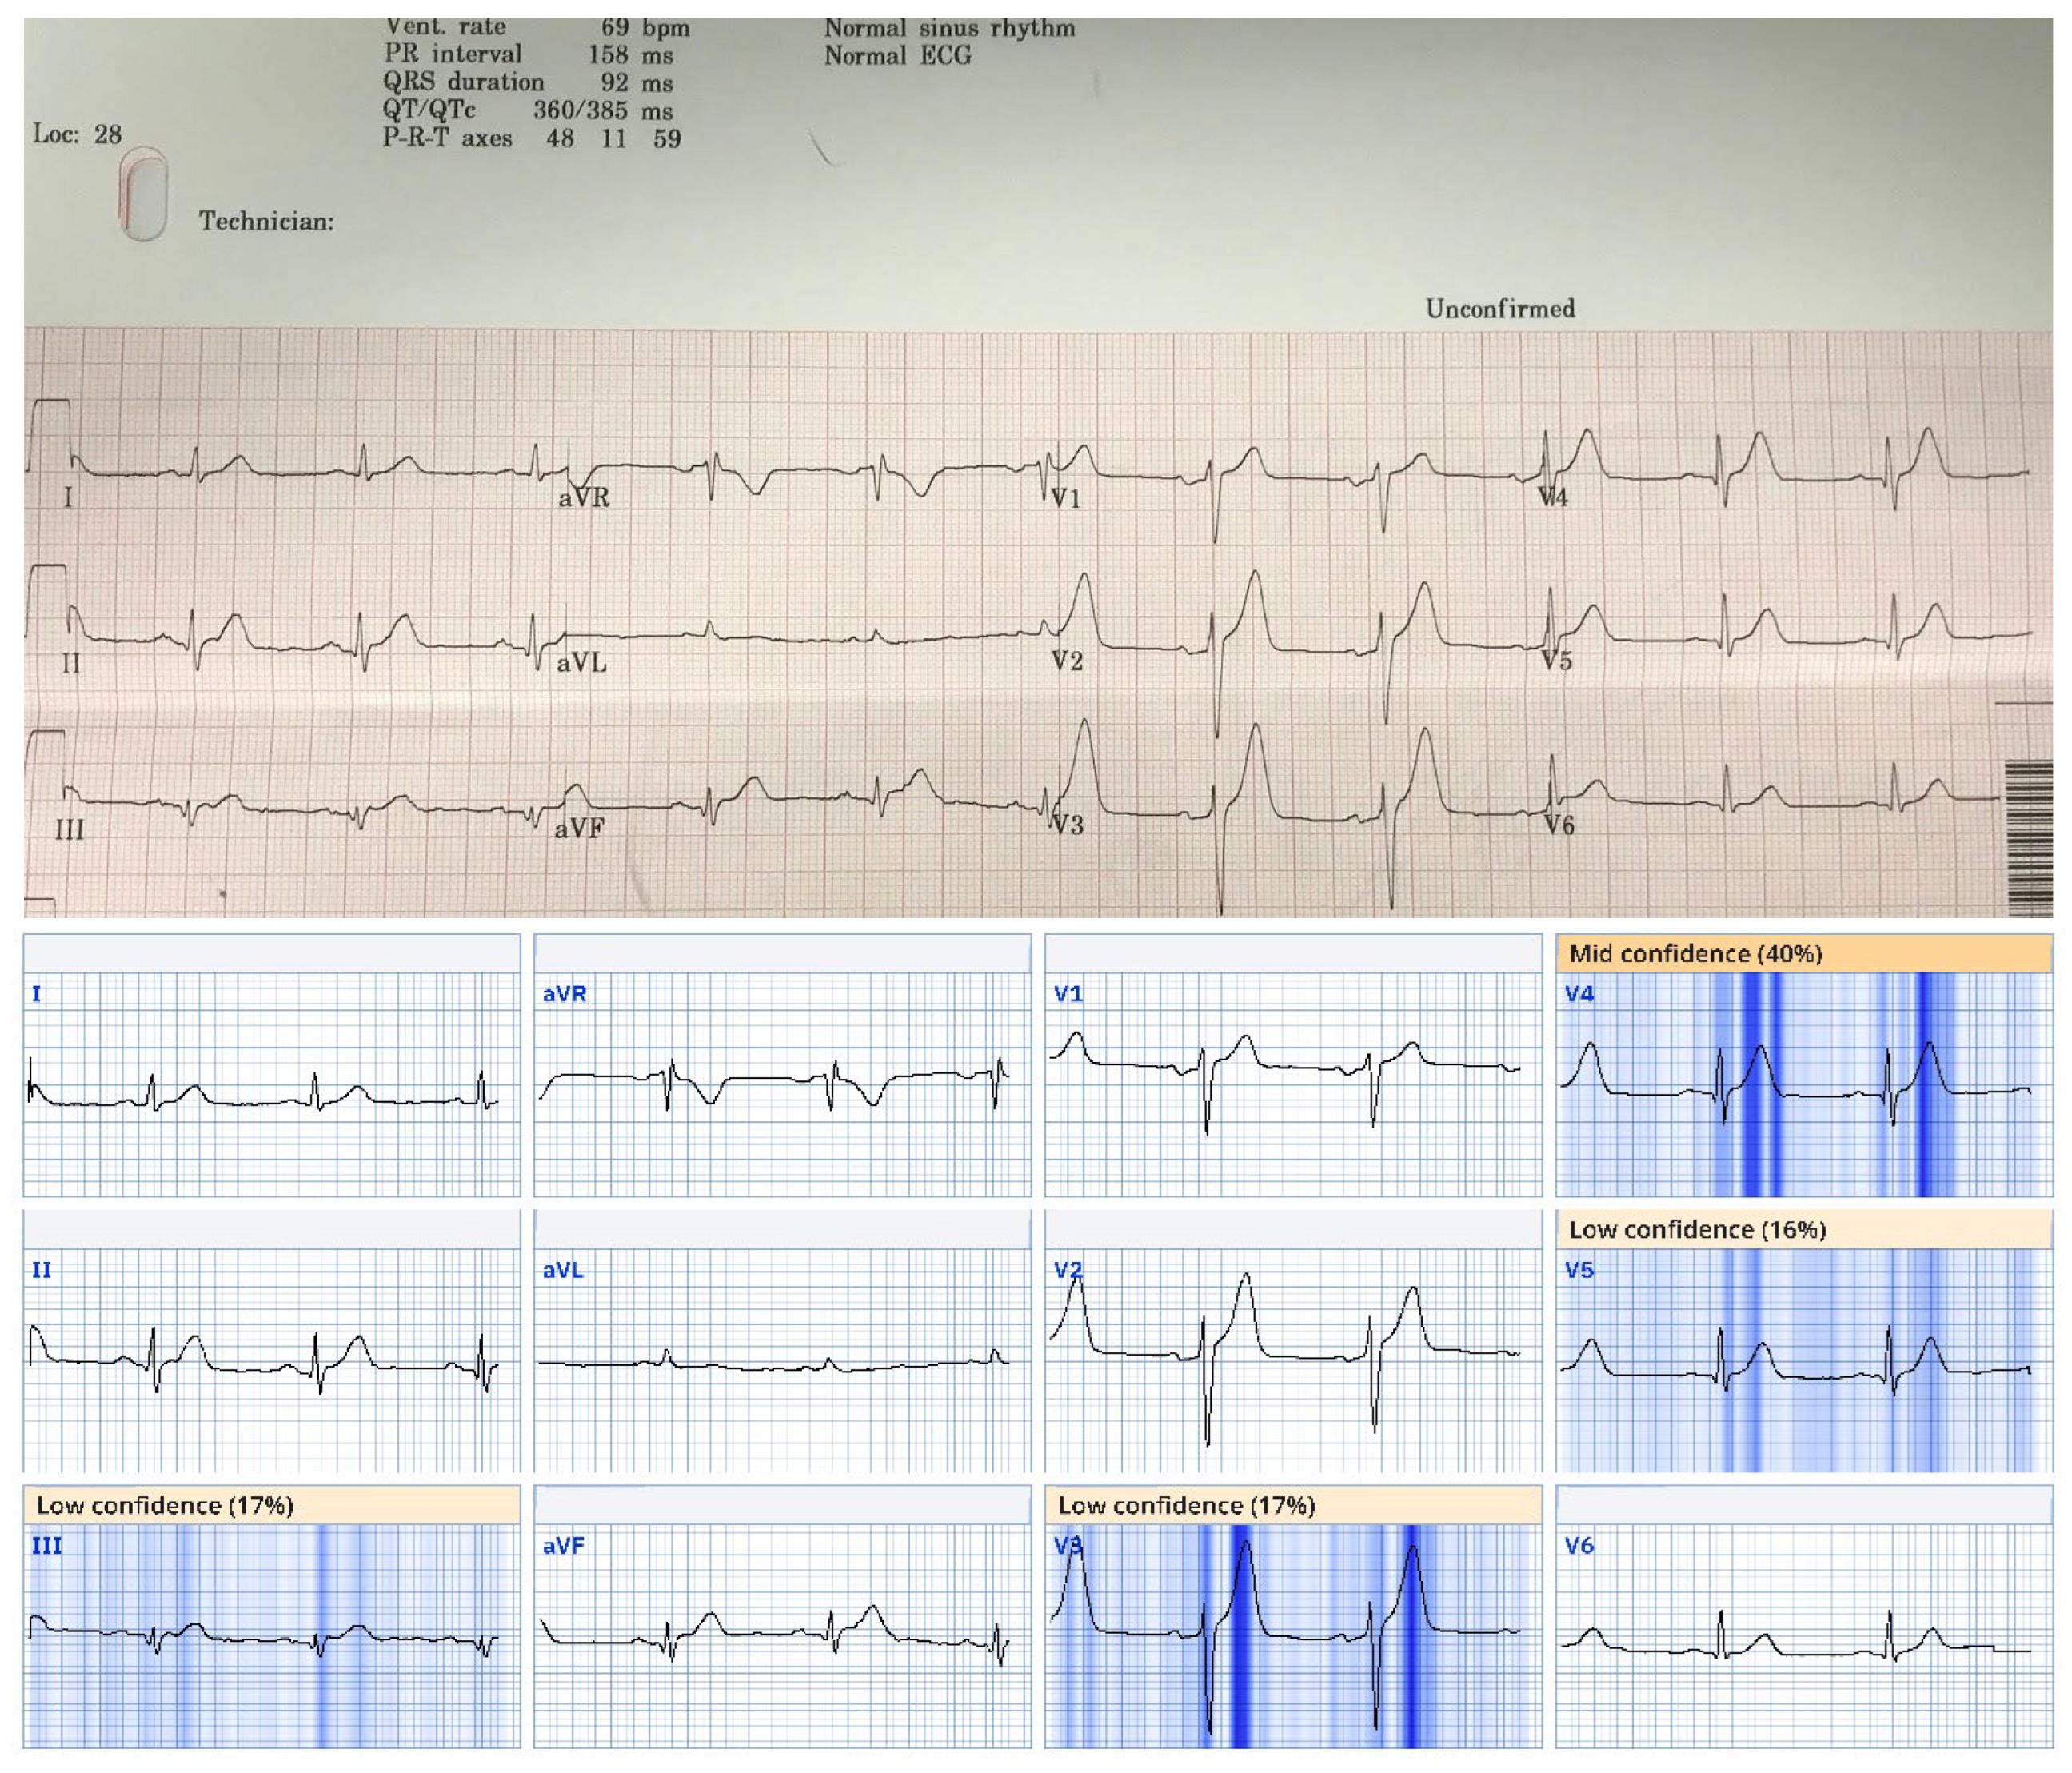
Figure 5.
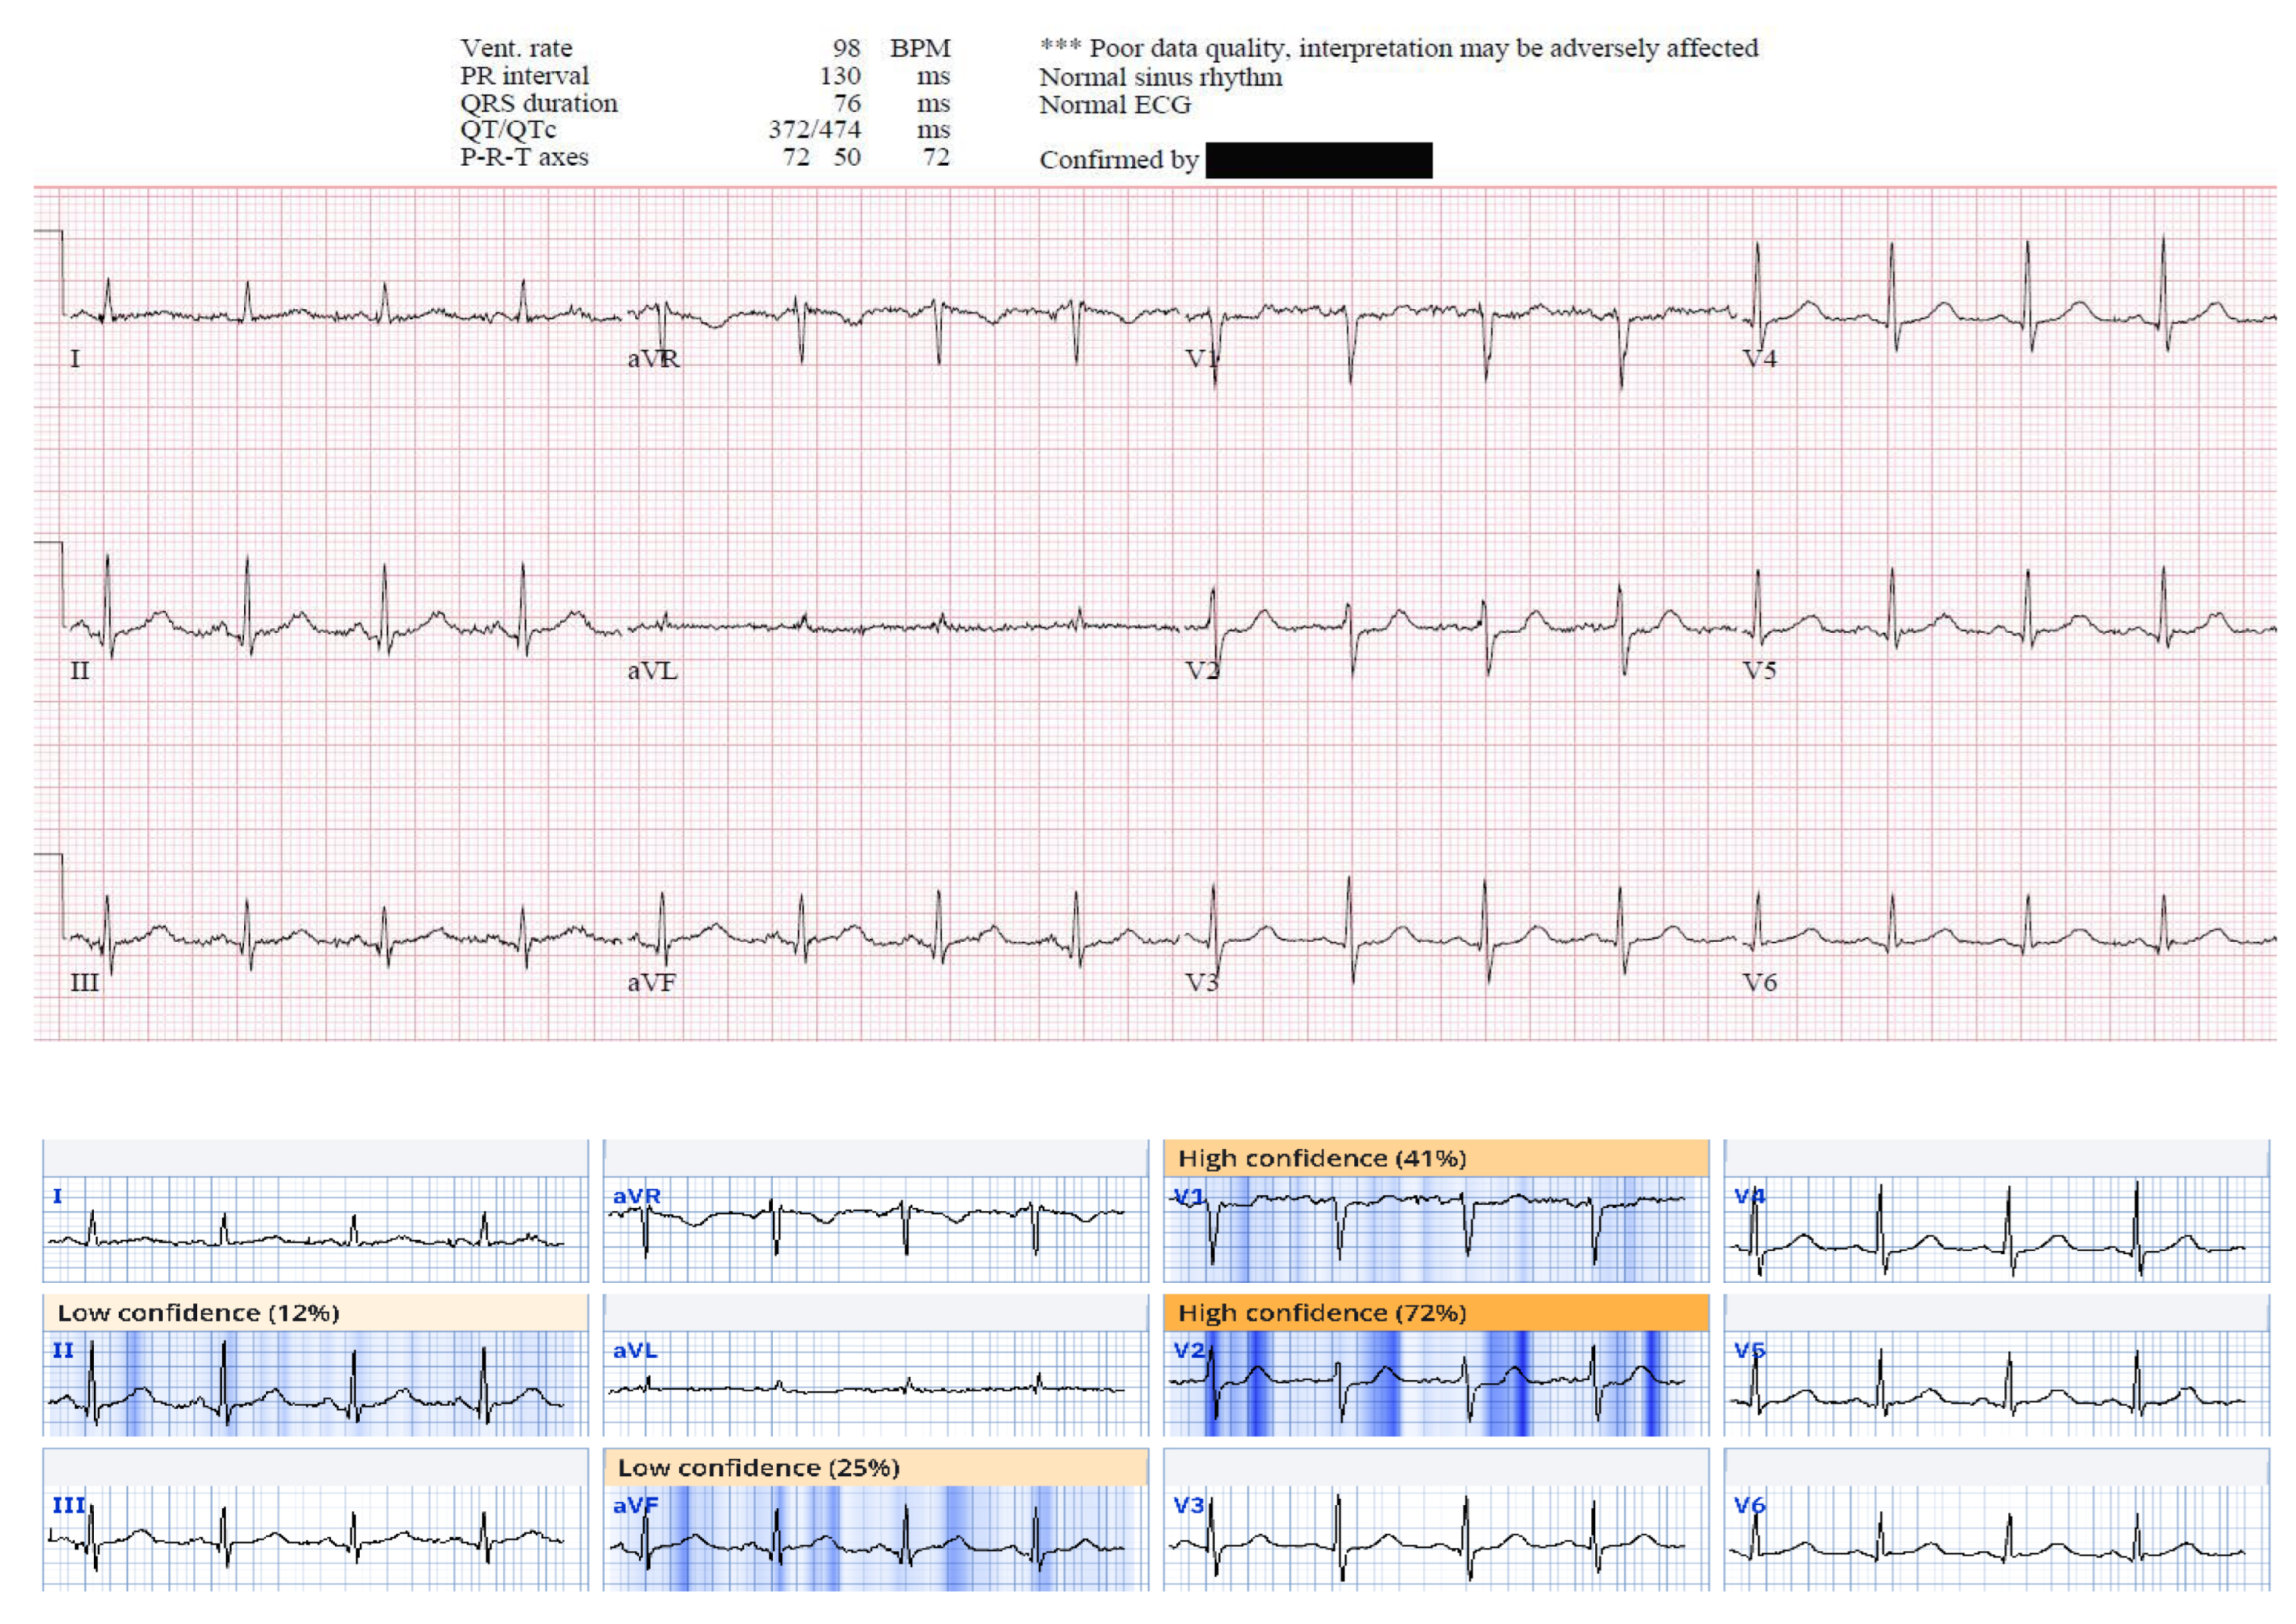
This ECG from case 19 was called normal by the Marquette 12 SL algorithm, however, there is ST depression in V1 and V2 suggestive of acute posterior OMI, and there are small Q waves associated with subtle ST elevation in the inferior leads, reciprocated by subtle T wave inversion in aVL. This patient was found to have a 95% mid RCA culprit that was stented, a peak troponin I of 1300 ng/L, and a new basal inferior wall motion abnormality. The Queen of Hearts calls this ECG “OMI with high confidence”. The AI explainability map is shown below the original tracing.
Figure 5.
This ECG from case 19 was called normal by the Marquette 12 SL algorithm, however, there is ST depression in V1 and V2 suggestive of acute posterior OMI, and there are small Q waves associated with subtle ST elevation in the inferior leads, reciprocated by subtle T wave inversion in aVL. This patient was found to have a 95% mid RCA culprit that was stented, a peak troponin I of 1300 ng/L, and a new basal inferior wall motion abnormality. The Queen of Hearts calls this ECG “OMI with high confidence”. The AI explainability map is shown below the original tracing.
5. Culprit Artery Analysis
See Table 4. The Left Anterior Descending (LAD) Artery was involved in 18/42 (43%) cases; all 18 were diagnosed as OMI by AI. The left circumflex or its obtuse marginal branches were involved in 9/42 (22%).

Table 4.
This table represents the frequency of each culprit artery for cases included in the study. The left anterior descending artery was the most common culprit, followed by the right coronary artery. The total is 46, rather than 42, because Cases 12, 26, 34, and 39 involved two culprit arteries, both of which are accounted for in this table.
| Culprit Artery | Number of Cases |
|---|---|
| LAD | 18 |
| Diagonal | 4 |
| Circumflex | 2 |
| Obtuse Marginal | 7 |
| RCA | 12 |
| PDA | 2 |
| Ramus | 1 |
6. Discussion
In the US, there are an estimated 10 million Emergency Department (ED) visits for chest pain per year [28]. All chest pain patients undergo ECG recording primarily to rapidly diagnose acute coronary occlusion. Additionally, there are countless patients who present with less specific symptoms of ischemia such as dyspnea, for whom ECGs are recorded for the same reason. All of these patients undergo one or more ECG recordings, amounting to at least 20 million ECGs. Acute coronary occlusion is typically diagnosed by means of ST Elevation (STEMI), and CCAs are programmed for this purpose [29]. However, guideline recommended STE is present in less than 50% of acute OMI [30]. Findings beyond STE are more than twice as sensitive for OMI, but are difficult for providers to learn [16,21].
There are approximately 800,000 myocardial infarctions (MI) diagnosed per year in USA EDs [31]. Of these MI, 300,000 are ST Elevation MI (STEMI), and true positive STEMI are well-known to represent acute coronary occlusion MI (ACOMI, or OMI for short); 500,000 are Non-STEMI, which are purported to represent the absence of acute total occlusion. However, because STE lacks sensitivity for OMI, 34% of Non-STEMI have an occluded artery with TIMI 0/1 flow at next day angiogram [32]. Thus, there are at least 170,000 OMI which do not meet STEMI criteria and can be classified as “subtle.” In other words, among 10 million initial ECGs recorded, approximately 1.5% are recorded in patients with subtle OMI, meaning that emergency physicians must view scores of ECGs before seeing one with a subtle OMI, and, furthermore, most emergency providers are not equipped to make an accurate diagnosis on many of these often extremely subtle ECGs. Thus, providers rely on computer algorithms to detect whether the ECG is normal, abnormal but non-diagnostic, or diagnostic of ischemia/infarction.
Most Non-STEMI ECGs that do not reveal overt ischemia receive a CCA diagnosis of “non-specific” or “non-diagnostic” ST-T abnormalities rather than normal [33]. In a very large study published before the discovery of many subtle signs of OMI, 7.9% of all acute MI (including both those with and without occlusion) had a “normal” ECG and 35% a “nonspecific” ECG [33]. The incidence of normal ECG in patients with active persistent OMI is unknown and doubtless much lower. In fact, a blinded expert interpreter was able to recognize OMI on the ECG in 91% of cases, with high specificity, as was the PMCardio Queen of Hearts AI model [16,21]. On the other hand, CCAs are only 62–69% sensitive for acute MI with culprit [29].
In spite of the lack of sensitivity for OMI of a CCA “normal” ECG, several publications over the years have concluded that if the CCA states that the ECG is “normal,” the triage emergency physician need not review the it [7,8,9,10], or that physician review of triage ECGs is not cost-effective [11]. However, it has previously been shown that the CCA interprets some OMI as completely normal [17], and this data supports that.
In this retrospective case series, we examined the performance of an AI algorithm to detect OMI from ECGs previously interpreted as completely normal (in contrast to “nonspecific abnormalities”) by CCA. These ECGs belonged to patients later determined to be suffering an acute coronary occlusion and were recognized by an expert as representing OMI; they were obtained both prehospital and in the ED, prior to any reperfusion therapies. We found that AI interpreted 86% of the ECGs as abnormal and identified OMI in 75%. This finding was in contrast to CCAs which interpreted only 27% of all ECGs as abnormal and identified an acute MI in only 10%. A similar pattern was observed with regard to the first ECG obtained in each case, with AI interpreting 86% as abnormal and 81% as indicative of OMI. CCAs interpreted 12% of these initial ECGs as abnormal and just 5% as indicative of acute infarction. These data suggest the immense potential of AI for reducing false negative ECGs, both prehospital and in the ED. Additionally, these findings have implications for the triaging of chest pain or potential ACS patients.
The PMCardio “Queen of Hearts” AI model employs a relatively new deep convolutional neural network technology which has been expert trained and validated and is constructed on the OMI paradigm; it is the first algorithm of its kind, with double the sensitivity (for OMI) of STEMI criteria at equal specificity [21]. It has also shown improved specificity over a conventional algorithm [34]. However, this is the first data published specifically focusing on this AI software’s ability to detect OMI that is so subtle that the conventional algorithm failed to find any abnormality.
The American College of Cardiology now specifies in the 2022 Chest pain guidelines several ECG “STEMI Equivalents” beyond STEMI criteria, warranting emergent angiography and intervention: posterior OMI, Sgarbossa and Smith-modified Sgarbossa criteria for LBBB or ventricular paced rhythms, hyperacute T-waves, and DeWinter’s Sign [1]. This growing emphasis on “STEMI equivalents” is a shift away from the traditional STEMI-NSTEMI paradigm and toward the OMI-NOMI paradigm [2,35].
It is widely recognized that treating STEMI rapidly improves outcomes, but there is also support for rapid treatment for STEMI-equivalents; in one study, for patients with either STEMI or equivalent, mortality was 1.8–4.3% if treated within guideline timing, and 4.7–14.2% when treatment time was longer [6]. Rapid treatment requires rapid detection, and this requires accurate ECG interpretation. It is axiomatic that if, in the case of OMI, the ECG is read by the computer as “normal” and that interpretation is trusted, that there will be diagnostic and treatment delay.
These results suggest that treatment times could be significantly shortened by use of this software at triage. The AI model was consistently able to identify OMI ECG patterns on multiple ECGs and several hours before CCAs in some cases. In 88% of cases of OMI, the initial ECG was interpreted by the CCA as normal when it, in fact, manifested OMI; trusting such an interpretation would lead to delay in workup while infarction is ongoing. On the other hand, the AI interpretation would have properly identified 81% of such cases as OMI and alerted the triage staff that the ECG was abnormal in 86% of cases. Thus, there is clear potential of this AI software to reduce cases of missed OMI in the triaging of ACS patients.
It is often stated that the artery most often involved in OMI that is not evident on the ECG is the circumflex. Here we find that it was left anterior descending artery OMI which had the most CCA “normal” ECGs.
Finally, in these CCA “normal” ECGs which manifested OMI, we identified common important features that providers can look for, especially in patients with a high index of suspicion for acute MI. The three most common features were subtle STE, reciprocal changes (including ST depression, T-wave inversion, horizontal ST flattening or down-up T-waves), and hyperacute T-waves.
7. Limitations
First, this is a study of a very select group of patients who were recognized to have OMI on the ECG and found to have an outcome of OMI, but who had one or more pre-angiography ECGs that manifest OMI but were diagnosed as “normal” by the CCA. Second, with this study design, no conclusions can be drawn regarding the rate of false positives when employing AI interpretations. However, it is known that the AI model does not overdiagnose OMI. Previous studies have demonstrated a false positive rate of 10-36% for diagnosis of STEMI in the ED [36,37,38,39]. In a large retrospective study of STEMI activations in the Midwest STEMI Consortium, the AI model accurately identified many false positives, decreasing the false positive rate from 25% to 16% [40]. In a retrospective prehospital study, the AI model would decrease OMI false positives from 59% to 29% [34]. However, the present study addresses a different specificity question, and that is whether the AI model will overcall “abnormal” (i.e., “Not OMI with High Confidence”); future studies are required in order to ascertain this. Finally, if one were to object that an AI interpretation of “Not OMI with mid confidence” should also be classified as “normal” then, of the 37 initial ECGs interpreted by the CCA as normal, the AI would have diagnosed 9, rather than 6, as normal; among the 29 OMI that were diagnosed as normal by the CCA, the AI would have diagnosed 7, rather than 6, as abnormal.
8. Conclusion
CCA may interpret ECGs that are diagnostic of OMI as “normal.” The PMCardio “Queen of Hearts” AI OMI ECG model identified the vast majority as OMI and even more as abnormal.
Author Contributions
SWS & HPM conceived of the study and undertook cohort generation. SRK, GAK & HH performed data extraction and entry. SWS provided access to Queen of Hearts (QoH) Software. SRK, HH & GAK collected QoH ECG interpretation. HH & POB performed STE measurements and ECG analysis. POB, SRK, RH, and HH oversaw data analysis and led in drafting the manuscript with all authors providing critical revisions. HH provided 11 additional cases. All authors contributed to figures and data presentation. SWS takes responsibility for this manuscript in its entirety.
Funding
This research received no external funding.
Conflicts of Interest Disclosures
Stephen W. Smith, H. Pendell Meyers, and Robert Herman: Shareholders, Powerful Medical. All other contributing authors report no COI.
References
- Writing Committee, Kontos MC, de Lemos JA, et al. 2022 ACC expert consensus decision pathway on the evaluation and disposition of acute chest pain in the emergency department: A report of the American college of cardiology solution set oversight committee. J Am Coll Cardiol [Internet] 2022;80(20):1925–60. Available from: https://www.jacc.org/doi/abs/10.1016/j.jacc.2022.08.
- McLaren J, de Alencar JN, Aslanger EK, Pendell Meyers H, Smith SW. From ST-Segment Elevation MI to Occlusion MI: The New Paradigm Shift in Acute Myocardial Infarction. 2024;3(11):101314. Available from: https://scholar.google.com/citations?view_op=view_citation&hl=en&citation_for_view=ZBKuiKwAAAAJ:QjNCP7ux8QYC.
- Aslanger EK, Meyers PH, Smith SW. STEMI: A transitional fossil in MI classification? J Electrocardiol [Internet] 2021;65:163–9. [CrossRef]
- Ricci F, Martini C, Scordo DM, et al. ECG Patterns of Occlusion Myocardial Infarction: A Narrative Review. 2025;Available from: https://scholar.google.com/citations?view_op=view_citation&hl=en&citation_for_view=ZBKuiKwAAAAJ:-1WLWRmjvKAC.
- Smith SW, Meyers HP. ST Elevation is a poor surrogate for acute coronary occlusion. Let’s Replace STEMI with Occlusion MI (OMI)!! Int J Cardiol [Internet] 2024;131980. [CrossRef]
- Jollis JG, Granger CB, Zègre-Hemsey JK, et al. Treatment Time and In-Hospital Mortality Among Patients With ST-Segment Elevation Myocardial Infarction, 2018-2021. JAMA [Internet] 2022;328(20):2033–40. [CrossRef]
- Tabner A, Jones M, Fakis A, Johnson G. Can an ECG performed during emergency department triage and interpreted as normal by computer analysis safely wait for clinician review until the time of patient assessment? A pilot study. J Electrocardiol [Internet] 2021;68:145–9. Available from: https://www.sciencedirect.com/science/article/pii/S0022073621001710.
- Hughes KE, Lewis SM, Katz L, Jones J. Safety of computer interpretation of normal triage electrocardiograms. Acad Emerg Med [Internet] 2017;24(1):120–4. Available from: https://pubmed.ncbi.nlm.nih.gov/27519772/.
- Deutsch A, Poroksy K, Westafer L, Visintainer P, Mader T. Validity of computer-interpreted “normal” and “otherwise normal” ECG in emergency department triage patients. West J Emerg Med [Internet] 2024 [cited 2024 Aug 26];25(1):3–8. Available from: https://www.ncbi.nlm.nih.gov/pmc/articles/PMC10777178/.
- Langlois-Carbonneau V, Dufresne F, Labbé È, Hamelin K, Berbiche D, Gosselin S. Safety and accuracy of the computer interpretation of normal ECGs at triage. CJEM [Internet] 2024;26(12):857–64. Available from: https://link.springer.com/article/10.1007/s43678-024-00790-5.
- Noll S, Alvey H, Jayaprakash N, et al. The utility of the triage electrocardiogram for the detection of ST-segment elevation myocardial infarction. Am J Emerg Med [Internet] 2018;36(10):1771–4. Available from: https://www.sciencedirect.com/science/article/pii/S0735675718300974.
- Litell JM, Meyers HP, Smith SW. Emergency physicians should be shown all triage ECGs, even those with a computer interpretation of “Normal.” J Electrocardiol [Internet] 2019;54:79–81. [CrossRef]
- Bracey A, Meyers HP, Smith SW. Emergency physicians should interpret every triage ECG, including those with a computer interpretation of “normal.” Am J Emerg Med [Internet] 2022;55:180–2. Available from: https://europepmc.org/article/med/35361516.
- Miranda DF, Lobo AS, Walsh B, Sandoval Y, Smith SW. New Insights Into the Use of the 12-Lead Electrocardiogram for Diagnosing Acute Myocardial Infarction in the Emergency Department. Can J Cardiol [Internet] 2018;34(2):132–45. [CrossRef]
- Aslanger EK, Meyers HP, Smith SW. Recognizing electrocardiographically subtle occlusion myocardial infarction and differentiating it from mimics: Ten steps to or away from cath lab. Archives of the Turkish Society of Cardiology 2021;49(6):488–500.
- Pendell Meyers H, Bracey A, Lee D, et al. Accuracy of OMI ECG findings versus STEMI criteria for diagnosis of acute coronary occlusion myocardial infarction. Int J Cardiol Heart Vasc [Internet] 2021;33:100767. [CrossRef]
- McLaren JTT, Meyers HP, Smith SW, Chartier LB. Emergency department Code STEMI patients with initial electrocardiogram labeled “normal” by computer interpretation: A 7-year retrospective review. Acad Emerg Med [Internet] 2023;Available from: https://onlinelibrary.wiley.com/doi/10.1111/acem.14795.
- Smith SW. Dr. Smith’s ECG Blog. http://hqmeded-ecg.blogspot.com/ [Internet] 2008-2025;Available from: https://hqmeded-ecg.blogspot.com/.
- Al-Zaiti SS, Martin-Gill C, Zègre-Hemsey JK, et al. Machine learning for ECG diagnosis and risk stratification of occlusion myocardial infarction. Nat Med [Internet] 2023;29(7):1804–13. [CrossRef]
- Al-Zaiti S, Macleod R, Van Dam P, Smith SW, Birnbaum Y. Emerging ECG methods for acute coronary syndrome detection: Recommendations & future opportunities. J Electrocardiol [Internet] 2022;74:65–72. [CrossRef]
- Herman R, Meyers HP, Smith SW, et al. International evaluation of an artificial intelligence-powered ecg model detecting acute coronary occlusion myocardial infarction. Eur Heart J Digit Health [Internet] 2023 [cited 2023 Dec 3];ztad074. Available from: https://academic.oup.com/ehjdh/advance-article/doi/10.1093/ehjdh/ztad074/7453297.
- Gupta S, Kashou AH, Herman R, et al. Computer-Interpreted Electrocardiograms: Impact on Cardiology Practice. Computer-Interpreted Electrocardiograms: Impact on Cardiology Practice [Internet] 2024 [cited 2024 Jun 28];37:-. Available from: https://ijcscardiol.org/pt-br/article/computer-interpreted-electrocardiograms-impact-on-cardiology-practice/.
- Dodd KW, Zvosec DL, Hart MA, et al. Electrocardiographic Diagnosis of Acute Coronary Occlusion Myocardial Infarction in Ventricular Paced Rhythm Using the Modified Sgarbossa Criteria. Ann Emerg Med [Internet] 2021;Available from. [CrossRef]
- Meyers HP, Limkakeng AT Jr, Jaffa EJ, et al. Validation of the modified Sgarbossa criteria for acute coronary occlusion in the setting of left bundle branch block: A retrospective case-control study. Am Heart J [Internet] 2015;170(6):1255–64. [CrossRef]
- Smith SW, Dodd KW, Henry TD, Dvorak DM, Pearce LA. Diagnosis of ST-elevation myocardial infarction in the presence of left bundle branch block with the ST-elevation to S-wave ratio in a modified Sgarbossa rule. Ann Emerg Med [Internet] 2012;60(6):766–76. [CrossRef]
- Aslanger EK, Yıldırımtürk Ö, Şimşek B, et al. DIagnostic accuracy oF electrocardiogram for acute coronary OCClUsion resuLTing in myocardial infarction (DIFOCCULT Study). Int J Cardiol Heart Vasc [Internet] 2020;30:100603. [CrossRef]
- Kristian Thygesen, Joseph S Alpert, Allan S Jaffe, Bernard R Chaitman, Jeroen J Bax, David A Morrow, Harvey D White, Executive Group on behalf of the Joint European Society of Cardiology (ESC)/American College of Cardiology (ACC)/American Heart Association (AHA)/World Heart Federation (WHF) Task Force for the Universal Definition of Myocardial Infarction. Fourth universal definition of myocardial infarction (2018). Rev Esp Cardiol [Internet] 2019;72(1):72. Available from. [CrossRef]
- Brown MD, Wolf SJ, Byyny R, et al. Clinical Policy: Critical Issues in the Evaluation and Management of Emergency Department Patients With Suspected Non–ST-Elevation Acute Coronary Syndromes. Ann Emerg Med [Internet] 2018;72(5):e65–106. Available from. [CrossRef]
- Garvey JL, Zegre-Hemsey J, Gregg RE, Studnek JR. Electrocardiographic diagnosis of ST segment elevation myocardial infarction: An evaluation of three automated interpretation algorithms. J Electrocardiol 2016;49(5):728–32.
- de Alencar Neto JN, Scheffer MK, Correia BP, Franchini KG, Felicioni SP, De Marchi MFN. Systematic review and meta-analysis of diagnostic test accuracy of ST-segment elevation for acute coronary occlusion. Int J Cardiol [Internet] 2024;131889. Available from: https://www.sciencedirect.com/science/article/pii/S0167527324003358.
- Martin SS, Aday AW, Almarzooq ZI, et al. 2024 Heart Disease and stroke statistics: A report of US and global data from the American Heart Association. Circulation [Internet] 2024;149(8):e347–913. Available from: https://www.heart.org/-/media/PHD-Files-2/Science-News/2/2024-Heart-and-Stroke-Stat-Update/2024-Statistics-At-A-Glance-final_2024.pdf.
- Hung C-S, Chen Y-H, Huang C-C, et al. Prevalence and outcome of patients with non-ST segment elevation myocardial infarction with occluded “culprit” artery–a systemic review and meta-analysis. Crit Care [Internet] 2018;22(1):34. Available from: https://link.springer.com/article/10.1186/s13054-018-1944-x.
- Welch RD, Zalenski RJ, Frederick PD, et al. Prognostic value of a normal or nonspecific initial electrocardiogram in acute myocardial infarction. JAMA [Internet] 2001;286(16):1977–84. Available from: http://www.ncbi.nlm.nih.gov/entrez/query.fcgi?cmd=Retrieve&db=PubMed&dopt=Citation&list_uids=11667934.
- Welch RD, Zalenski RJ, Frederick PD, et al. Prognostic value of a normal or nonspecific initial electrocardiogram in acute myocardial infarction. JAMA [Internet] 2001;286(16):1977–84. Available from: http://www.ncbi.nlm.nih.gov/entrez/query.fcgi?cmd=Retrieve&db=PubMed&dopt=Citation&list_uids=11667934.
- Martini C, Scordo DM, Rossi D, Gallina S, Fedorowski A, Sciarra L, Chahal AA, Meyers P, Herman R, Ricci F, Smith SW. ECG Patterns of Occlusion Myocardial Infarction: Ready for Prime Time? Annals of Emergency Medicine In Press.
- Kontos MC, Kurz MC, Roberts CS, et al. An Evaluation of the Accuracy of Emergency Physician Activation of the Cardiac Catheterization Laboratory for Patients With Suspected ST-Segment Elevation Myocardial Infarction. Ann Emerg Med [Internet] 2010;55(5):423–30. Available from: https://www.sciencedirect.com/science/article/pii/S0196064409014371.
- Larson DM, Menssen KM, Sharkey SW, et al. “False-Positive” Cardiac Catheterization Laboratory Activation Among Patients with Suspected ST-Segment Elevation Myocardial Infarction. JAMA 2007;298(23):2754–60.
- McCabe JM, Armstrong EJ, Kulkarni A, et al. Prevalence and Factors Associated With False-Positive ST-Segment Elevation Myocardial Infarction Diagnoses at Primary Percutaneous Coronary Intervention-Capable Centers: A Report From the Activate-SF Registry. Arch Intern Med [Internet] 2012;Available from: http://www.ncbi.nlm.nih.gov/entrez/query.fcgi?cmd=Retrieve&db=PubMed&dopt=Citation&list_uids=22566489.
- Garvey JL, Monk L, Granger CB, et al. Rates of Cardiac Catheterization Cancelation for ST-Segment Elevation Myocardial Infarction After Activation by Emergency Medical Services or Emergency Physicians. Circulation [Internet] 2012;125(2):308–13. [CrossRef]
- Sharkey S, Herman R, Larson D, Henry TD, Aguirre F, Murthy A, Rohm H, Smith SW, Yildiz M, Belzer W, Chambers J, Bergstedt S, Kerola G, Farmer D, Willett A, Bartunek J, Meyers HP, Barbato E, Harris J, Witt D. Performance of Artificial Intelligence Powered ECG Analysis in Suspected ST-Segment Elevation Myocardial Infarction.
Figure 1.
CCA and AI interpretations.
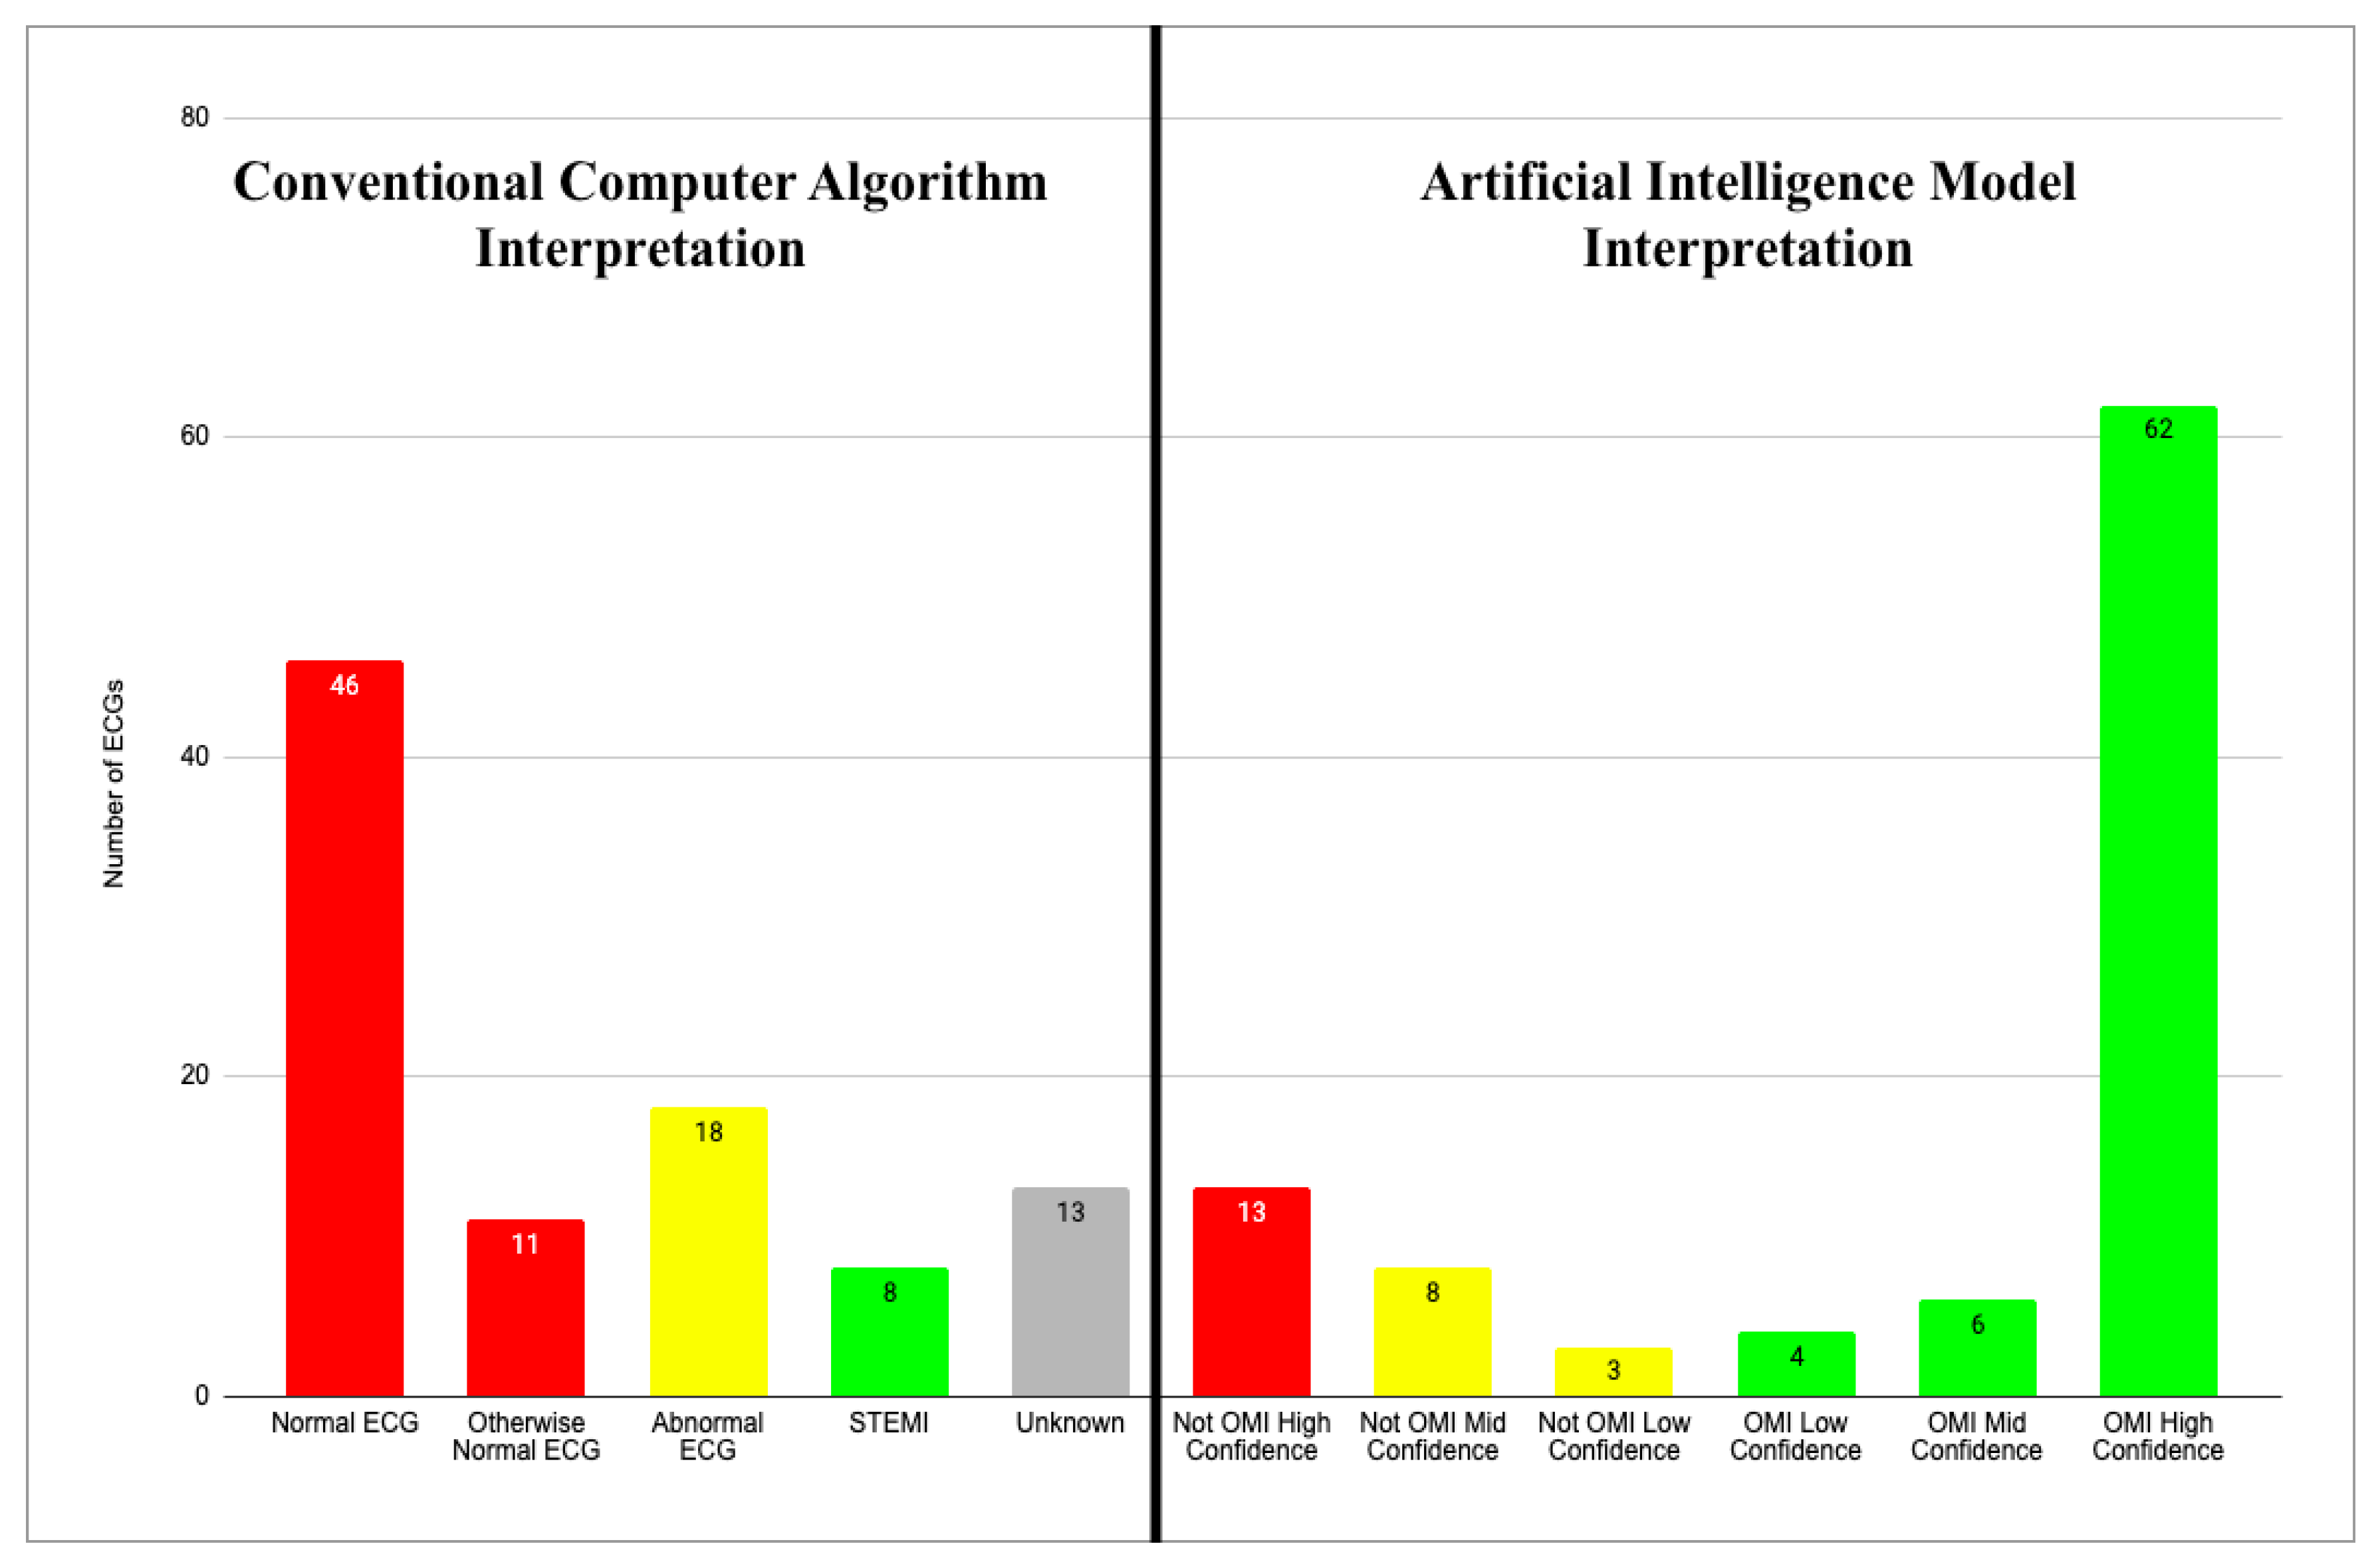
Figure 2.
Total EVGs Recorded with AI Performance.
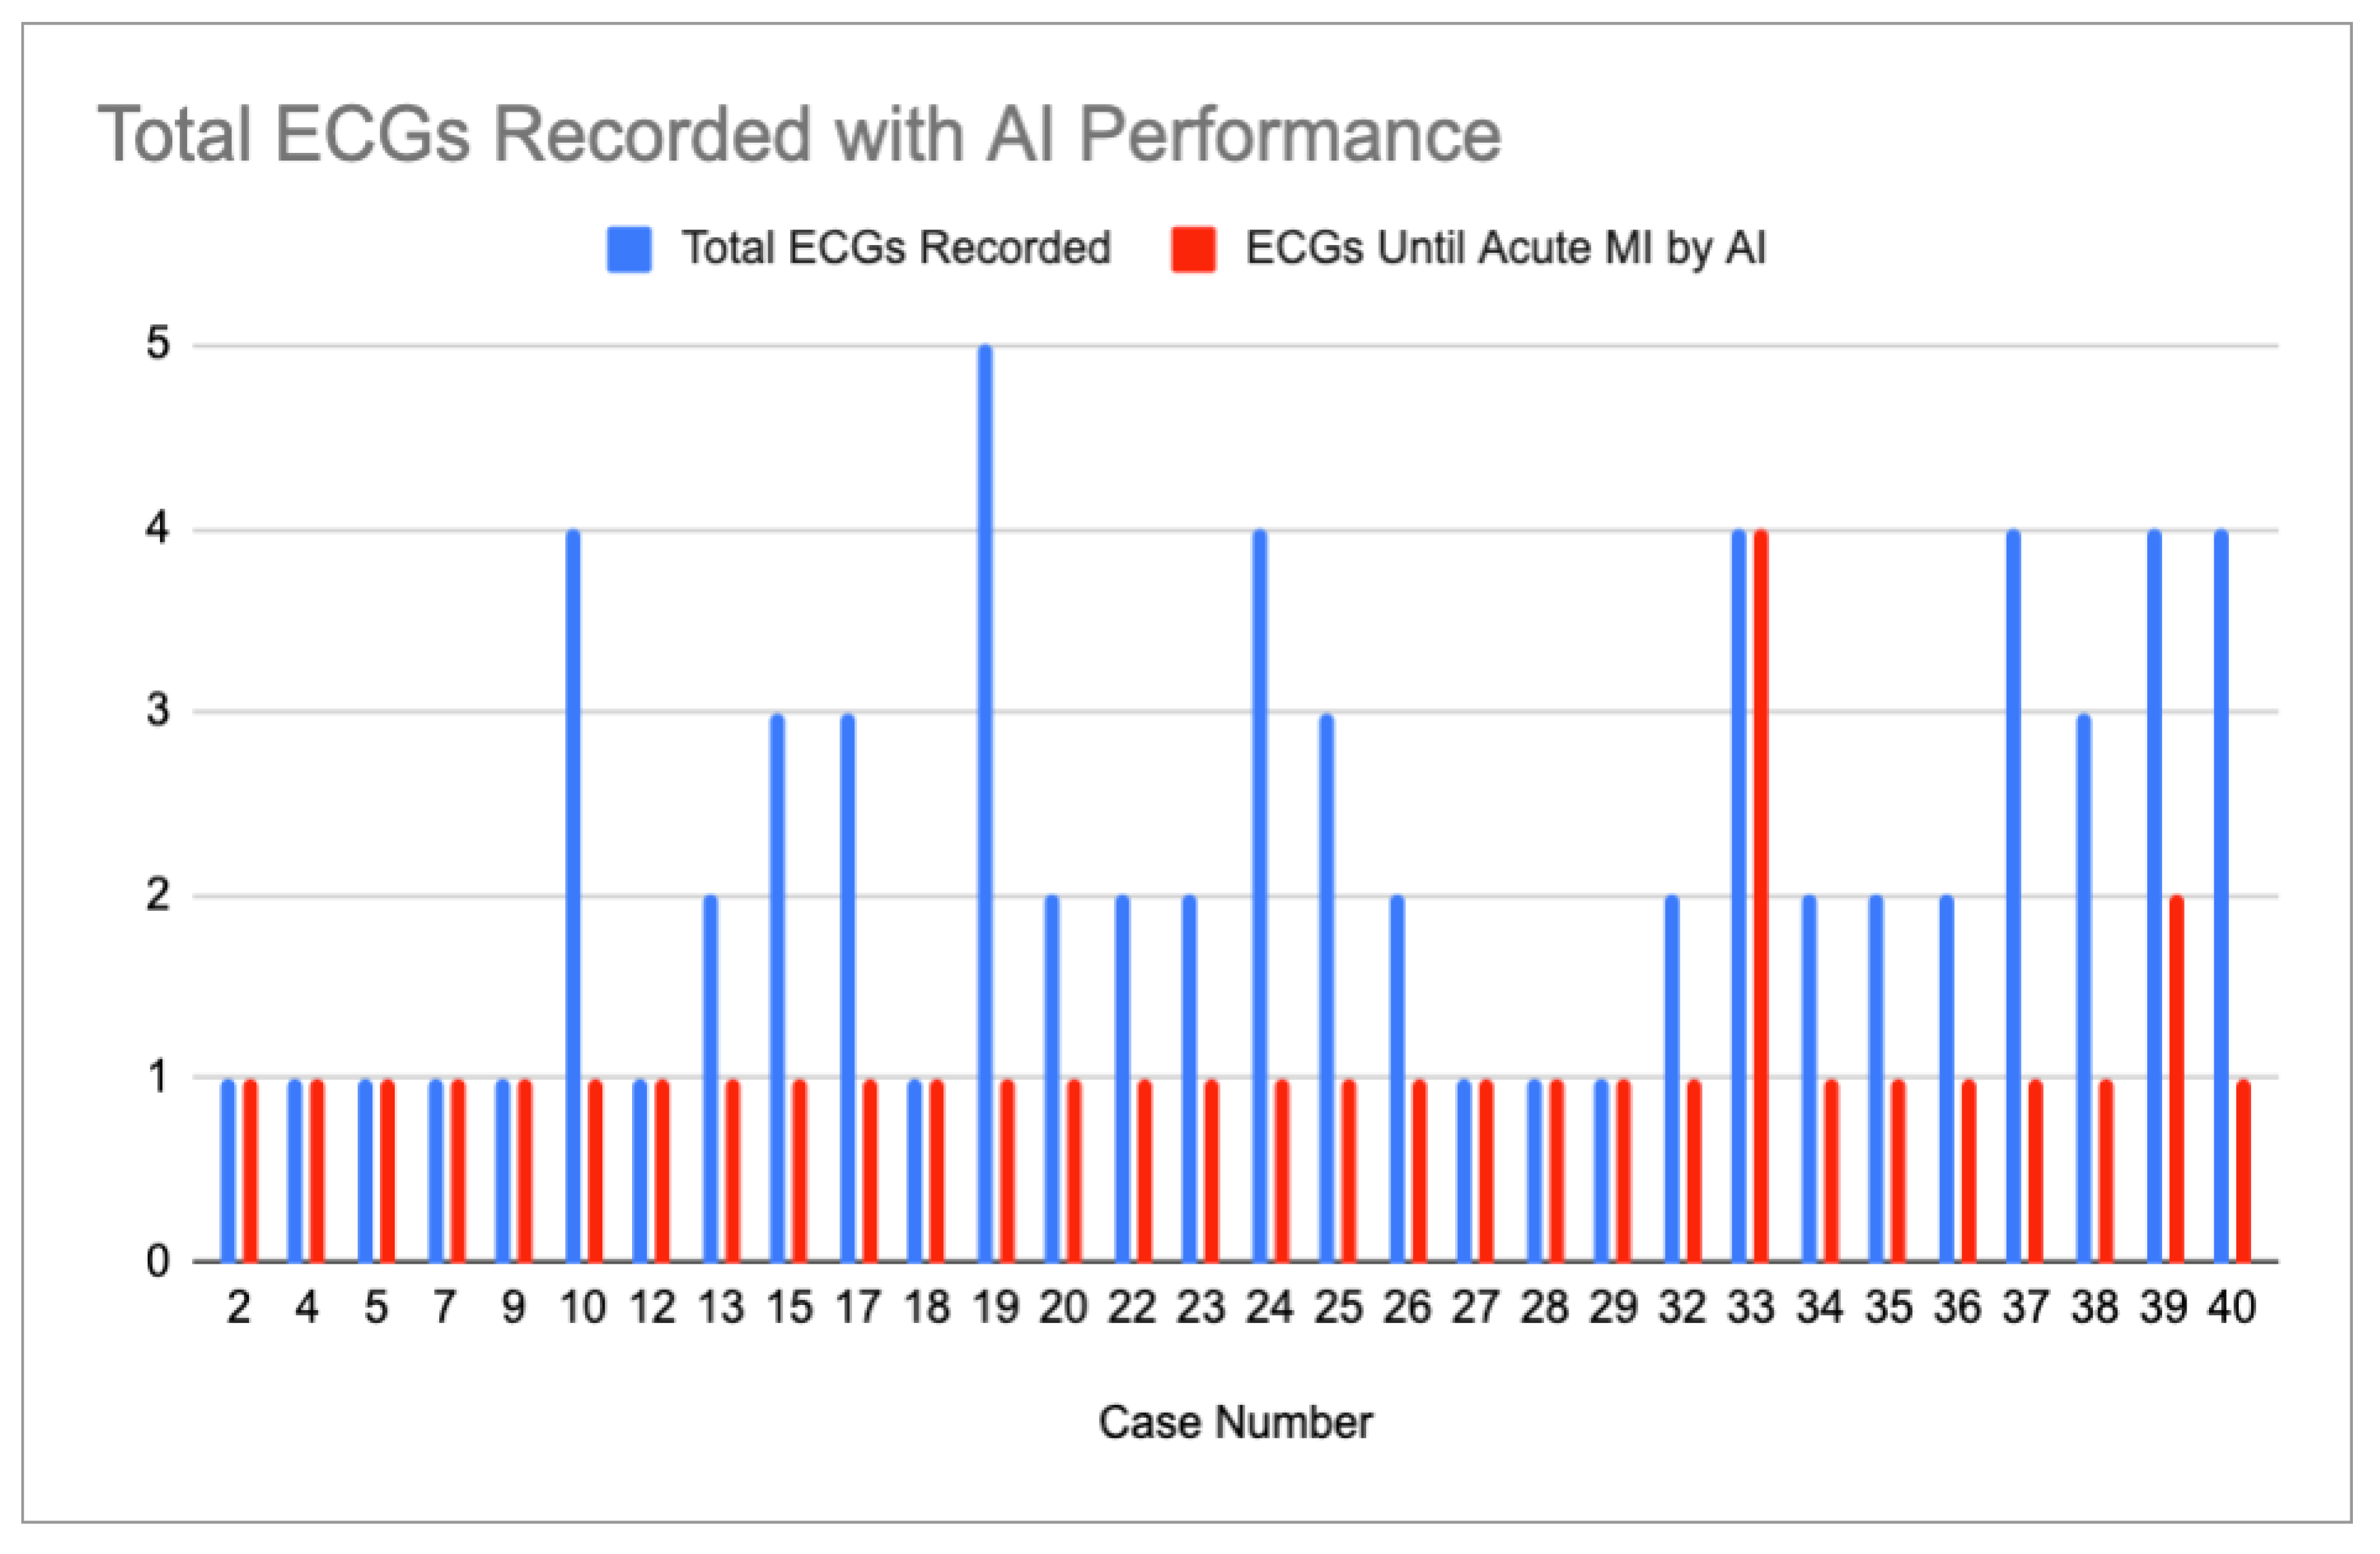
Figure 3.
Three graphs showing the frequencies of the ischemic features described below for all ECGs (left), the initial ECG of each case (center) and all ECGs called “normal” or “otherwise normal” by CCAs (right).
Figure 3.
Three graphs showing the frequencies of the ischemic features described below for all ECGs (left), the initial ECG of each case (center) and all ECGs called “normal” or “otherwise normal” by CCAs (right).
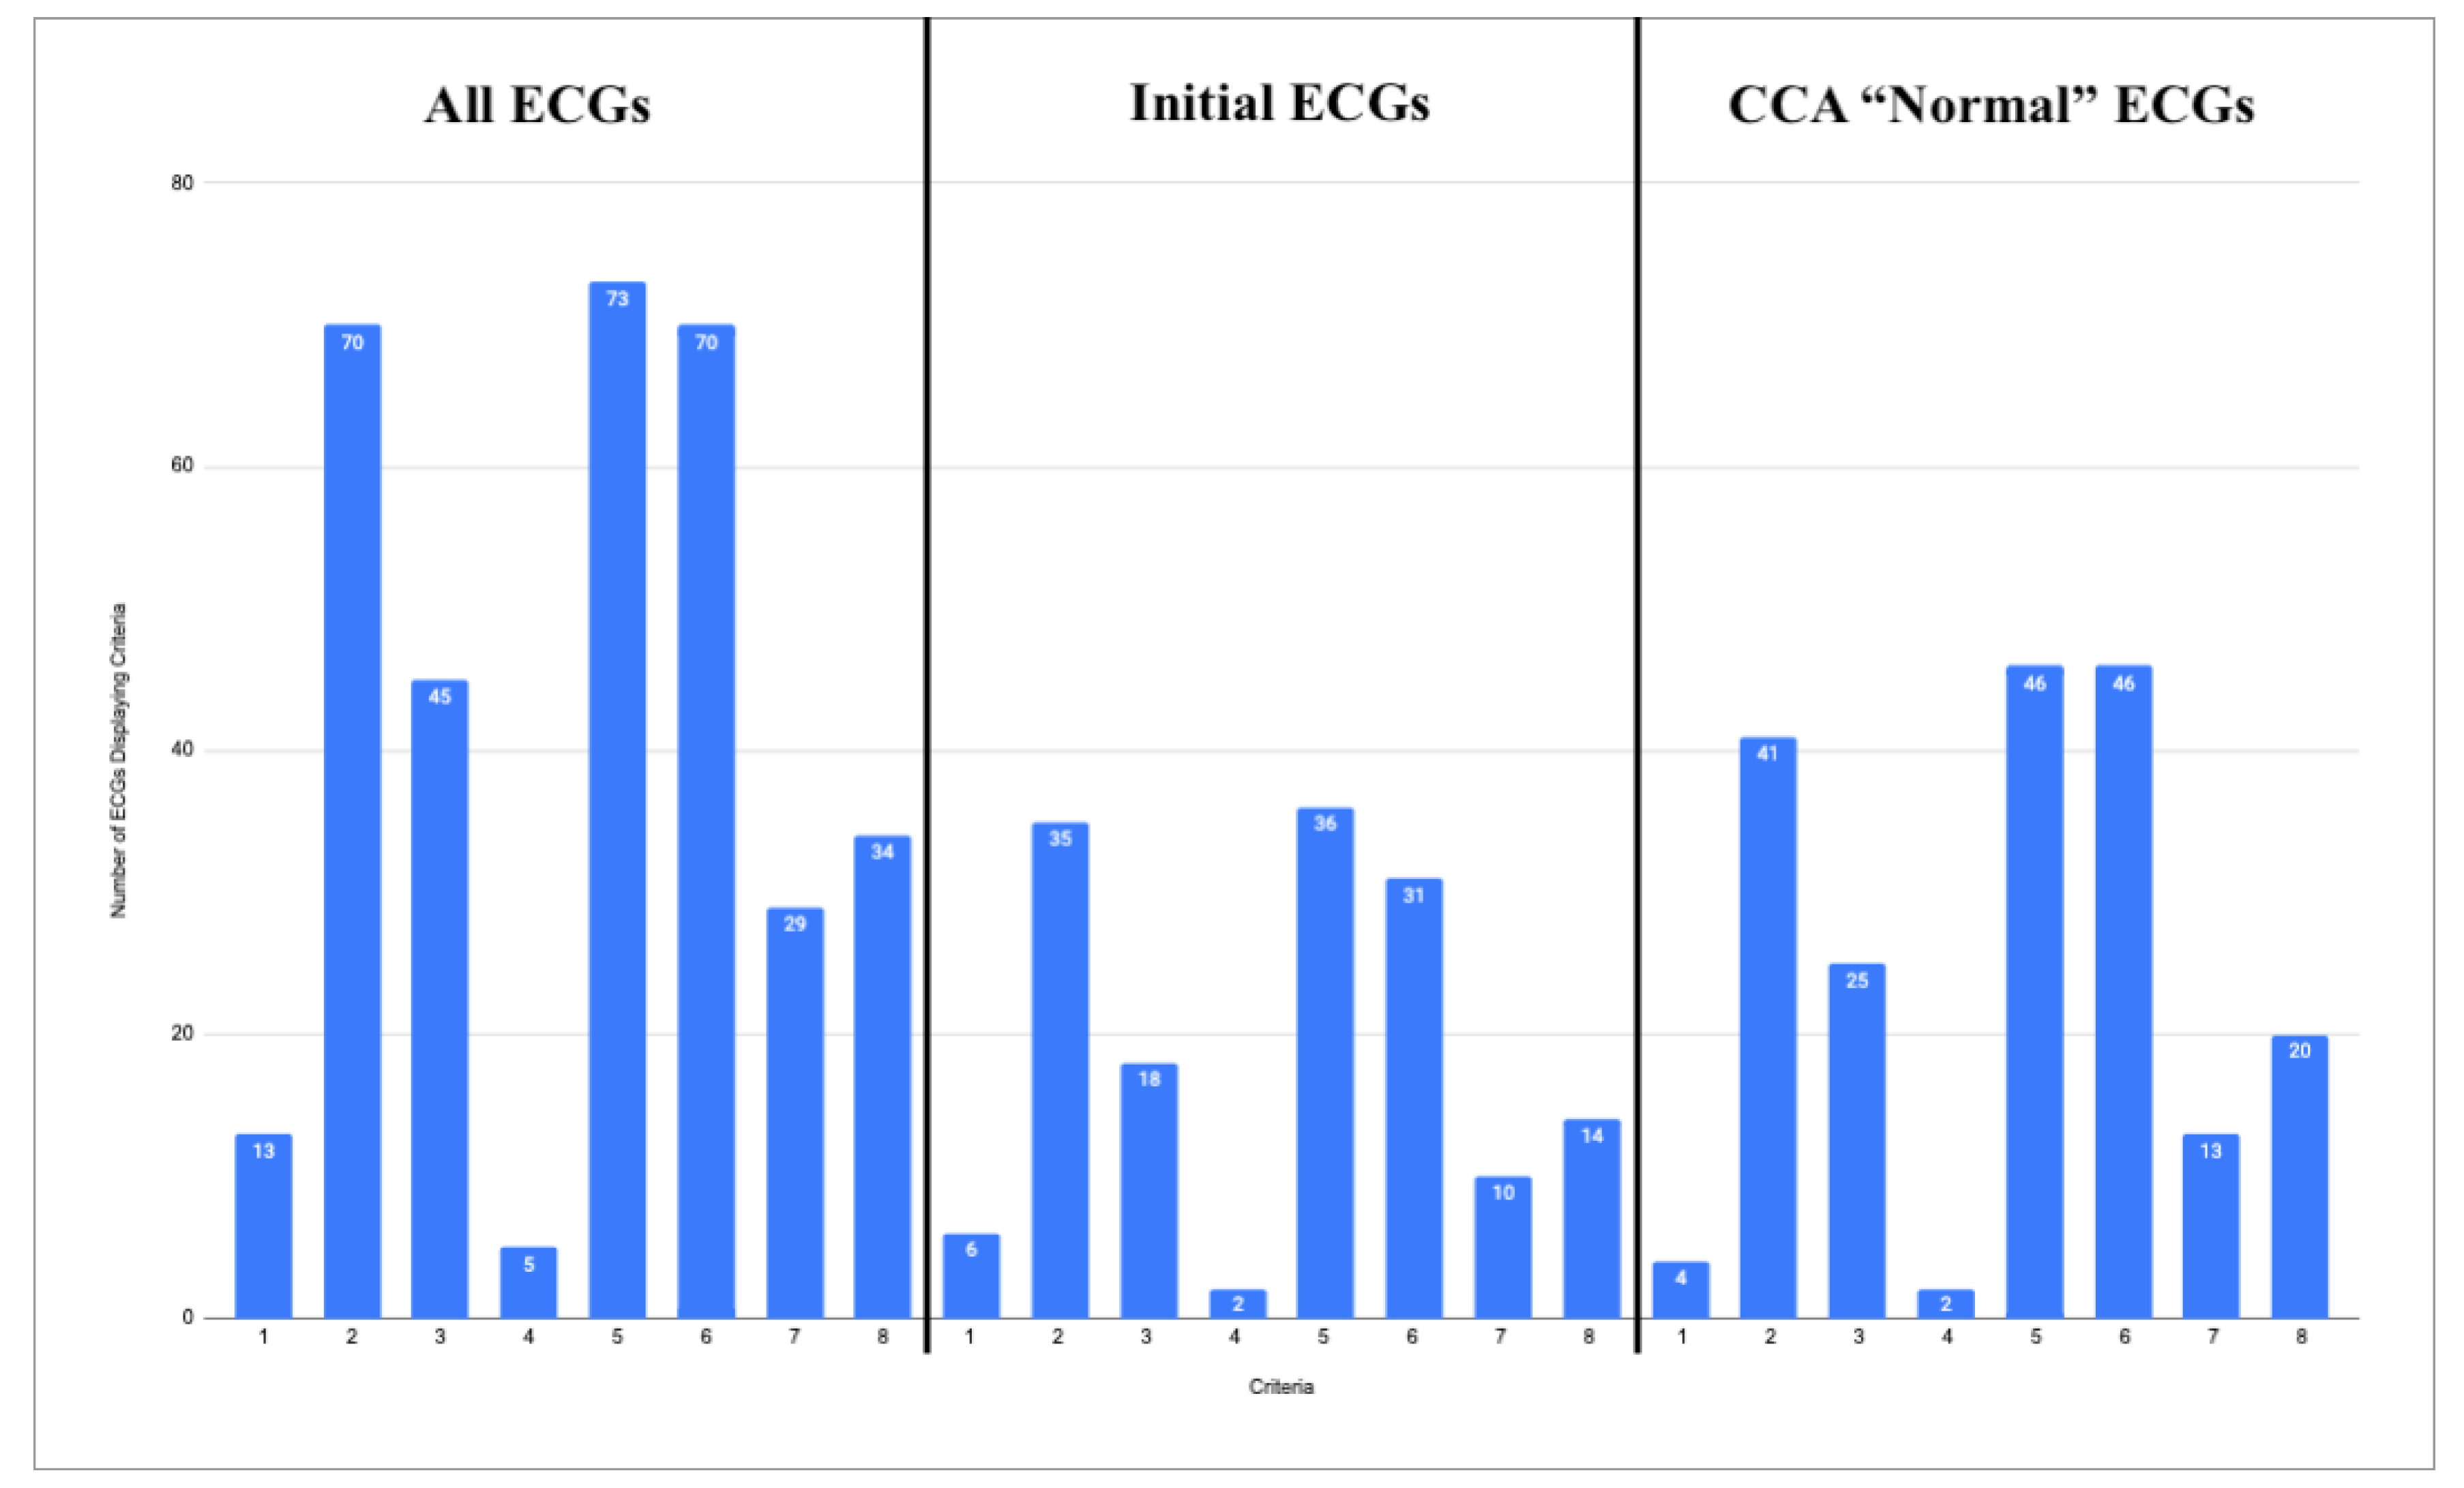
Table 1.
CCA interpretations of “otherwise normal” or “abnormal,” with the associated specific interpretations.
Table 1.
CCA interpretations of “otherwise normal” or “abnormal,” with the associated specific interpretations.
| Otherwise Normal ECG Reads | Total | Abnormal ECG Reads | Total |
|---|---|---|---|
| Sinus Bradycardia | 7 | Nonspecific ST-T Wave Abnormality | 7 |
| Sinus Tachycardia | 1 | Consider Subendocardial Injury | 3 |
| Marked Sinus Arrhythmia | 1 | Moderate ST Depression | 2 |
| Frequent PVCs | 1 | Right Bundle Branch Block | 2 |
| Early Repolarization | 1 | Anterior MI of Indeterminate Age | 1 |
| - | - | Possible Acute Pericarditis | 1 |
| - | - | Possible Left Atrial Enlargement | 1 |
| - | - | Prolonged QT | 1 |
| Total “Otherwise Normal” | 11 | Total “Abnormal” | 18 |
Table 2.
Comparison of ECG interpretations for cases in which both the CCA and AI system recognized acute MI.
Table 2.
Comparison of ECG interpretations for cases in which both the CCA and AI system recognized acute MI.
| Case Number | Interpretation Software | ECG 1 | ECG 2 | ECG 3 | ECG 4 |
|---|---|---|---|---|---|
| 1 | Unknown CCA | Normal | Unknown | STEMI (Assumed) | |
| QoH | OMI Mid | (+ 150 Min) | |||
| 3 | Unknown CCA | Normal | Unknown | STEMI (Assumed) | |
| QoH | Not OMI High | OMI High | (+ 40 Min) | ||
| 11 | Zoll Algorithm | STEMI (Assumed) | |||
| QoH | OMI High | ||||
| 14 | Marquette 12 SL | Normal | Normal | Abnormal | STEMI |
| QoH | Not OMI High | OMI High | (+ 120 Min) | ||
| 21 | Unknown CCA | Normal | STEMI (Assumed) | ||
| QoH | OMI High | (Unknown time) | |||
| 30 | Marquette 12 SL | STEMI | |||
| QoH | OMI High | ||||
| 41 | Marquette 12 SL | Normal | STEMI | ||
| QoH | OMI High | (+ 125 Min) | |||
| 42 | Marquette 12 SL | Normal | STEMI (Assumed) | ||
| QoH | OMI High | (+ 45 Min) |
Table 3.
Comparison of ECG reads for cases in which neither the CCA nor the AI system identified acute MI. If available in the blog post, the specific CCA is named in the “Interpretation Software” column.
Table 3.
Comparison of ECG reads for cases in which neither the CCA nor the AI system identified acute MI. If available in the blog post, the specific CCA is named in the “Interpretation Software” column.
| Case Number | Interpretation Software | ECG 1 | ECG 2 | ECG 3 |
|---|---|---|---|---|
| 6 | Unknown CCA | Normal | ||
| QoH | Not OMI Mid | |||
| 8 | Marquette 12 SL | Otherwise Normal | ||
| QoH | Not OMI Mid | |||
| 16 | Marquette 12 SL | Normal | Otherwise Normal | Normal |
| QoH | Not OMI High | Not OMI High | Not OMI High | |
| 31 | Unknown CCA | Normal | ||
| QoH | Nor OMI Low |
Disclaimer/Publisher’s Note: The statements, opinions and data contained in all publications are solely those of the individual author(s) and contributor(s) and not of MDPI and/or the editor(s). MDPI and/or the editor(s) disclaim responsibility for any injury to people or property resulting from any ideas, methods, instructions or products referred to in the content. |
© 2025 by the authors. Licensee MDPI, Basel, Switzerland. This article is an open access article distributed under the terms and conditions of the Creative Commons Attribution (CC BY) license (http://creativecommons.org/licenses/by/4.0/).
Copyright: This open access article is published under a Creative Commons CC BY 4.0 license, which permit the free download, distribution, and reuse, provided that the author and preprint are cited in any reuse.


