
Submitted:
04 February 2025
Posted:
04 February 2025
You are already at the latest version
Abstract
Recently, the maritime logistics industry has been transitioning to smart logistics by leveraging such technologies as AI and IoT. In particular, maritime big data plays a significant role in providing various services, including ship operation monitoring and greenhouse gas emissions assessment, and is considered essential for delivering maritime logistics services. Marine big data comprises real-world data collected during ship operations, but it is susceptible to loss due to temporal and environmental constraints. Together with identifying and addressing the root causes of data loss, it is mandatory to supplement the loss by analyzing and utilizing the collected data. This study proposes an emulator that repetitively generates new data such as location data, data count, and average distance using maritime transport data cumulated up to now. The location data is generated using the cumulative distance and trigonometric ratios based on the location information of standard routes. The data count and average distance are calculated based on user-input parameters such as voyage time and data interval. The generated data is inserted into a database and monitored on a map in real time. To evaluate the emulator's performance, experiments were conducted using the maritime transport route data, and the results demonstrated its effectiveness.
Keywords:
big data
; emulator
; data generation
; smart container
; smart logistics
1. Introduction
Technologies of the 4th Industrial Revolution, such as AI (Artificial Intelligence), IoT (Internet of Things), Big Data, Blockchain, AR (Augmented Reality), and VR (Virtual Reality), are driving innovation across various industries, including maritime logistics, where they are facilitating the transition to smart logistics through process innovation. The conversion of smart logistics is accelerating the collection of logistics data and the advancement of marine big data technologies. Particularly, there is growing interest in the creation of new services based on marine big data, which serves as a vital foundation for expanding new marine industries such as renewable energy, autonomous ships, and smart maritime ports. Governments and companies are collecting and analyzing data from ships, integrating it with legacy systems to improve operational efficiency and market analysis. In South Korea, the Ministry of Oceans and Fisheries leverages marine data to provide customized services across various fields, including marine fisheries, aquaculture, and port operations. In South Korea, the Ministry of Maritime Affairs and Fisheries utilize marine data to provide customized services across various fields, including marine fisheries, aquaculture, and port operations. The Marine Fisheries Big Data Platform offers diverse services such as average import seafood prices, marine accident forecasts, and ship operation monitoring and analysis. Companies are also developing tailored services. For example, AllSeaData has developed a maritime shipping big data system that objectively evaluates greenhouse gas emissions from ships by utilizing global ship movement information and maritime environmental data. Similarly, Swinnus has created a device called „ConTracer,” which attaches to containers to collect location, temperature, and humidity data, enabling monitoring through a dedicated platform.
As demonstrated in the aforementioned examples, various maritime services are currently in operation, and the collection of extensive maritime transport data is essential for providing such services. However, challenges can arise during maritime transport, such as erroneous values caused by IoT equipment malfunctions or permanent data loss due to environmental factors like adverse weather conditions, which may lead to the loss of containers equipped with IoT devices. To address these issues, it is possible to generate new data by utilizing collected data while considering the inherent characteristics of maritime data, which is typically consistent and exhibits minimal abrupt changes. Expanding of information using actual data enables the provision of more flexible services to end-users, ensuring adaptability and reliability in maritime service offerings.
In this study, we propose an emulator algorithm that generates virtual location data by utilizing the location information of collected maritime transport data. Previous studies employed a method that randomly matched collected data to sequentially generate location data, collection times, and speed values. However, this study improves upon the previous approach by allowing users to input specific parameters such as „voyage time” and „data collection interval.” Based on these inputs, the system automatically calculates collection times, the number of collected data points, the average speed between data points, and the distances between generated location data. The newly generated data is inserted into a database in real-time and monitored through a map interface, providing a streamlined and automated method for maritime data generation and visualization.
2. Development of a Maritime Transport Emulator
The structure of the algorithm proposed in this study is illustrated in Figure 1. This study utilizes maritime transport data collected in real-time from smart containers equipped with IoT devices during their shipment on vessels. Among the collected data, the location data of the standard route is used, and the operational flow of the emulator described in Figure 1 is detailed in Figure 2. First, the distances and angles between the location data points of the standard route are calculated and grouped accordingly. From the group of distances, the standard deviation is then derived. Subsequently, when the user inputs the voyage duration and data collection interval, the number of data points to be collected, the average speed between the data points, and the distances between the generated location data are calculated and outputted. Finally, based on the generated data, the coordinates of the newly created location data are calculated using trigonometric ratios. The computed location data is inserted into a database and monitored on a map interface.
2.1. Calculation of Distance and Angles Between Location Data
The process of calculating distances and angles between location data points is a preliminary step for generating new location data. In this stage, the distances and angles between points along the collected standard routes are calculated and grouped into separate categories, forming the basis for subsequent data generation.
2.1.1. Distances Between Standard Routes (Distgroup)
First, using the distance group from the standard routes collected in Section 2.1, a group of standard deviations is generated. The standard deviation values are derived based on a Poisson distribution, from which the 40 most probable values are selected to form a group. The number of selected values can be adjusted as needed. The standard deviations in the group are then randomly sampled and sequentially summed, as illustrated in Figure 3. This process serves as the foundation for generating new data points with realistic variability.
Between the Standard Routes
The dashed curve represents the standard route, with coordinates A, B, and C assumed as the location coordinates of the standard route. The values α, β, and γ represent randomly sampled standard deviations, and Total denotes the cumulative sum of the extracted standard deviations. This process of randomly extracting and summing standard deviations is repeated, ensuring that the total sum does not exceed the total distance of the standard route.
2.1.2. Angles Between Standard Routes
The angles between standard routes were grouped, as illustrated in Figure 4. The dashed curve represents the standard route, with coordinates A, B, and C assumed as the location coordinates of the standard route. The angles α and β correspond to the angles between these location coordinates. The distance and angle data obtained from the standard routes in Section 2.1 serve as essential inputs for generating new location data in Section 2.3. These data provide the foundation for accurately replicating realistic positional patterns in the newly generated data.
2.2. Users Input Information
In the user information input process, the user provides the „voyage duration” and „data collection interval” as inputs. Based on these inputs, the system approximately calculates and extracts the following parameters:
- ○
- Number of Data Points represents total number of data collection points during the voyage.
- ○
- Average Speed Between Data Points represents estimated average speed for each segment of the voyage.
- ○
- Distances Between Locations represents approximate intervals between consecutive location data points.
This process ensures that the generated data aligns with the user’s specified conditions, providing a realistic foundation for further data generation and analysis.
2.2.1. Number of Collected Data
The number of collected data points refers to the total count of new data generated along a single route based on the user-defined interval. The calculation is defined by Equation (1) below:
In Equation (1):
- ○
- Total time represents the voyage duration input by the user.
- ○
- Data collection interval denotes the time interval between consecutive data collections.
The integer quotient of the result is used to approximate the number of collected data points, ensuring alignment with the user-defined parameters.
2.2.2. Average Speed Between Data
The average speed between data points is calculated using the group of distances between standard routes and the data collection interval. The calculation is expressed as follows in Equation (2):
In Equation (2):
- ○
- Distgroup represents the group of distances between standard route points.
- ○
- i is the index within the Distgroup.
- ○
- Data collection interval denotes the time interval for data collection.
This formula provides a realistic estimation of the average speed between data points based on the spatial and temporal parameters of the standard route.
2.2.3. Distance Between Generated Location Data (DGL)
The generated location data must be created at regular intervals to prevent clustering in specific areas. The calculation is defined by Equation (3) below:
In Equation (3):
- ○
- Distgroup represents the total length of the standard route.
- ○
- Number of Collected Data refers to the total number of collected data points.
This formula ensures that the generated location data points are evenly distributed along the route, maintaining spatial consistency and avoiding excessive clustering.
In Figure 5, the red circular markers (●) represent the location data collected from the standard route during transportation, while the blue square markers (■) indicate the generated location data. The values for Speed and Distance between location are derived from Equations (2) and (3), providing random speeds and distances between the newly generated location data points. The number of these data points (i) is dynamically determined based on the calculated distances between the standard route points and the extracted number of collected data points. This approach ensures flexibility in the data generation process, aligning it with the characteristics of the standard route and the user-defined parameters.
Table 1 provides an example of the user information input described earlier. The distance corresponds to the route used in this study, which is approximately 993,000 meters. Total time and Collection cycle are user-input values, while Number of collected data, Average speed, and Distance between location are automatically calculated based on the user-provided inputs. This table demonstrates the system’s ability to process input parameters and generate corresponding output values dynamically.
2.3. Generation of New Location Data
2.3.1. Extraction of Location Coordinates (Latitude and Longitude)
New location data is generated using distance, angle, and trigonometric ratios, following the methodology described below. The newly generated location data must avoid being concentrated in specific areas and should maintain appropriate distances between points. To achieve this, the distances between the generated location data were extracted and applied, as expressed in Equation (4):
In Equation (4):
- ○
- STD represents the randomly selected standard deviation.
- ○
- DGL denotes the distance between the generated location data points.
- ○
- Number of Collected Data refers to the total number of collected data points.
- ○
- i represents the index of the data point.
To generate the coordinate values of the new location data, both distance and angle values are required. The newly generated location data identifies the angle value closest to its current position and uses this angle to calculate its coordinates. Notably, the angle values used in this process are derived from the angle set of the standard route, ensuring that the new location data aligns with the directional patterns of the original route. This approach maintains the spatial consistency and realistic distribution of the generated data.
Figure 6 and Table 2 illustrate the process of generating location coordinate values based on the methods described earlier. In Figure 6, the red circles (●) represent the location data collected from the standard route, while the blue squares (■) indicate the generated location data. This representation shows how the generated location data retrieves angle values according to specific criteria and methods.
Through this process, the newly generated location data is assigned both distance and angle values, which are used to calculate its coordinates. To calculate the location coordinate values, trigonometric ratio equations are used, as shown in Equations (5) and (6):
In Equations (5) and (6):
- ○
- Distance represents the distance of the generated location data.
- ○
- Angle refers to the angle closely associated with the distance.
- ○
- x and y correspond to the generated latitude and longitude values, respectively.
The latitude and longitude values extracted using these equations are unique and non-overlapping, ensuring that each generated location data point maintains its distinct spatial position. This approach ensures accurate and consistent coordinate generation while preventing duplication.
2.3.2. Normalization
As previously explained, the new location data is generated based on the total distance of the standard route. The start point is set at (0,0), and the end point corresponds to the endpoint of the total distance of the standard route. However, since the fixed start and end points are often unclear, generating coordinates within the bounds of the standard route becomes challenging. To address this issue, the latitude and longitude values of the generated location data are normalized within the range of the standard route’s latitude and longitude values. This normalization process is represented by Equation (7):
In Equation (7):
- ○
- x represents the newly generated location data.
- ○
- x(min) and x(max) are the minimum and maximum values of the generated location data.
- ○
- [a,b] is the specified range for normalization.
3. Integration with Google Map Service
In this study, the Google Maps service was utilized to verify the routes of the generated location data. Table 3 presents the results calculated based on a total distance of 993,000 meters. The location data generated and stored in the database, as shown in Table 3, was used to reflect the routes in Figure 7. The visualized route, based on the inserted location data, is displayed in Figure 8. This integration demonstrates how the generated location data can be effectively mapped and monitored using Google Maps, providing a clear and accurate representation of the maritime transport paths.
In this study, a method for generating new location data was proposed using an emulator, and a system was developed to enable seamless monitoring of the generated data at a glance. This approach ensures efficient visualization and management of the newly created data. a system was developed to enable seamless monitoring of the generated data at a glance. This approach ensures efficient visualization and management of the newly created data.
4. Experiment
To validate the effectiveness of the emulator proposed in this study, empirical data from smart containers were utilized. This empirical data was collected by smart containers during actual operations along the route from Sydney to Brisbane ports. Figure 9 illustrates the service network for the route, sourced from the HMM website, to aid in understanding the route used in this study. The detailed range of location data and the total distance of the route can be found in Table 4. This validation demonstrates the emulator’s applicability in real-world maritime transport scenarios.
In this study, experiments were conducted using the standard route shown in Figure 9, dividing the scenarios into three cases as outlined in Table 5. The results of these experiments are presented in Figure 10, Figure 11 and Figure 12. Among these, Figure 10 illustrates the same conditions as Figure 8, but it demonstrates that the generated location data points have different coordinates. Figure 11 and Figure 12 show results where a greater number of location data points were generated, highlighting the emulator’s capability to produce more detailed datasets under varying conditions. This demonstrates the flexibility and scalability of the proposed approach.
Through the experiments described above, the proposed emulator algorithm demonstrated its ability to generate new location data using collected data points. By comparing Figure 8 and Figure 10, it was observed that even under identical conditions, the algorithm produces different location data, resulting in varied route generation. Additionally, as the number of generated data points increases, the resulting routes become more detailed and clearly defined. This indicates that the algorithm is highly effective not only for the experimental route but also for generating diverse routes when approximate location data of a standard route is available. The proposed emulator is designed to generate new location data based on the specific requirements of users, and its effectiveness has been validated through the experiments conducted in this study.
5. Conclusions
During maritime transport, data collection via IoT devices is prone to disruption due to various factors such as equipment malfunctions and adverse weather conditions. This often results in data loss, which cannot be recovered, thereby hindering service delivery. To address these challenges, this study developed an emulator that generates new location data using empirical tests with smart containers. Unlike previous research, this study focuses on improving user convenience. By allowing users to input required parameters such as „voyage duration” and „data collection interval,” the emulator automatically calculates the necessary data and generates new location data. The newly generated location data is then transmitted to a database and reflected on Google Maps for monitoring purposes. The emulator’s effectiveness was validated by comparing the generated location data with empirical test data, confirming consistent data generation. Furthermore, studies focusing on generating new data from maritime transport data are rare, and this study represents the first domestic research leveraging actual maritime data to create new location data. This establishes the originality of the developed emulator. This innovative approach demonstrates significant potential to address the limitations of data loss during maritime transport, contributing to advancements in maritime logistics and data management.
Future plans involve progressively improving the emulator to generate location data more efficiently from the user’s perspective, contributing to addressing the challenges of data loss. Additionally, research will focus on enabling real-time monitoring to provide information such as ETA (Estimated Time of Arrival). Continuous improvements to the emulator aim to enhance safety and operational efficiency, ensuring its practical application in maritime logistics and its capability to support robust data generation and monitoring solutions.
Author Contributions
Conceptualization, C-R.P and D-M.P.; methodology, D-M.P.; software, C-R.P and D-M.P.; validation, B-K.P and T-H.K; investigation, C-R.P.; writing—original draft preparation, C-R.P.; writing—review and editing, B-K.P, B-O.K and D-M.P and T-H.K.; visualization, C.-R.P.; supervision, B-K.P, B-O.K and D-M.P. All authors have read and agreed to the published version of the manuscript.
Funding
This work was supported by the Dong-A University research fund.
Data Availability Statement
All experimental data are available on request.
Conflicts of Interest
The authors declare no conflicts of interest.
References
- Salah, K.; Alfalasi, A.; Alfalasi, M.; Alharmoudi, M.; Alzaabi, M.; Alzyeodi, A.; Ahmad, R.W. “IoT-Enabled Shipping Container with Environmental Monitoring and Location Tracking,” in Proceedings of the 2020 IEEE 17th Annual Consumer Communications & Networking Conference (CCNC), Las Vegas: USA, pp. 1-6, 2020. (Thesis).
- Mahmood, S.; Hasan, R.; Ullah, A.; Sarker, K.U. “SMART Security Alert System for Monitoring and Controlling Container Transportation,” in Proceedings of the 2019 4th MEC International Conference on Big Data and Smart City (ICBDSC), Muscat: Oman, pp. 1-5, 2019. (Thesis).
- Strengthen marine data collection, sharing, and analysis system. Available online: https://www.hankyung.com/article/2023082336081.
- KIMST of Oceans and Fisheries Marine and Fisheries Big Data Platform. Available online: https://www.vadahub.go.kr/user/main/index.
- DSME Information Systems-Allsea Data ’Shipbuilding and Maritime Big Data System Development. (A website). Available online: www.cnbnews.com/news/article.html?no=435511.
- Moon, Y.S.; Choi, H.R.; Kim, J.J.; Lee, J.K.; Lee, E.K.; Choi, S.P.; Kim, T.H.; Lee, B.H. “A Study on the Container Security Device(ConTracer) base on IoT,” in Proceeding of the Korea Institute of Communication Sciences, pp. 587-588, 2014. (Thesis).
- Moon, Y.S.; Choi, H.R.; Lee, E.K.; Jo, S.J.; Choi, S.P. “Develop of Container Security Device(Contracer) using M2M technology,” In Proceeding of the Korea Institute of Communication Sciences, pp. 520-521, 2010. (Thesis).
- BigdataSea, Data Utilization Case Studies. (A website). Available online: https://www.bigdatasea.kr/dataanalysis/datacoa/datacoaList.
- Hwang, D.J. A Discussion on Container Loss Accidents and Response During Ship Voyage. Journal of Navigation and Port Research 2022, 46, 331–337. [Google Scholar]
- Containers Lost at Sea – 2023 Update. static1.squarespace.com/static/5ff6c5336c885a268148bdcc/t/646cf5b50ba5a260052b1b66/1684862389529/Containers_Lost_at_Sea_2023_FINAL.pdf (A website).
- Kim, T.H.; Jung, J.W.; Park, D.M.; Kim, D.W.; Park, B.K. Development of Smart Container for Real-time Monitoring of Global Maritime Logistics. Journal of the Korea Institute of Information and Communication Engineering 2023, 1449–1457. [Google Scholar] [CrossRef]
- Robusto, C. Thecosine-haversine formula. The American Mathematical Monthly 1957, 64, 38–40. [Google Scholar] [CrossRef]
- HMM. Available online: https://www.hmm21.com/.
- Park, C.R.; Kim, T.H.; Lee, E.K. Development of IoT Sensor Data Generation Emulator for Smart Marine Logistics. Journal of the Transactions of the Korea Information Processing Society 13, 551–558.
- Jeon, H.M.; Kim, H.N. ‘Analysis on Potential Benefits of Smart Containers,’ In Ocean Policy Reasearch, pp. 109-127.
- Kim, H.W.; Choi, H.R.; Kim, C.S.; Kim, J.J.; Park, D.M.; Jeon, M.J. ‘A Study on The Operation Strategy for Smart Container and Smart Port Linkage’, In KiCS Fall Conference 2021, pp. 751-752.
- Moon, Y.S.; Choi, S.P.; Lee, E.K.; Kim, J.J.; Choi, H.R. Performance Evaluation of Advanced Container Security Device(ACSD) system based on IoT(Internet of Things). Journal of the Korea Institute of Information and Communication Engineering 2013, 17, 2183–2190. [Google Scholar] [CrossRef]
- Kim, T.H.; Choi, S.P.; Moon, Y.S.; Lee, B.H.; Jung, J.W.; Park, B.K.; Kim, J.J.; Cho, H.R. A Study on Container Monitoring Loaded into the Hold in Maritime Logistics. The Journal of Korean Institute of Communications and Information Sciences 2016, 41, 1446–1455, (Thesis). [Google Scholar] [CrossRef]
- ORBCOMM Smart Dry Container Telematics, Dry Shipping container telematics for cargo visibility, security and integrity. Available online: https://www.orbcomm.
- NEXXIOT, Intelligence for every cargo journey. (A website). Available online: https://nexxiot.com/edge/.
- TRAXENS. 2019.5.27. A.P. Moller - Maersk will join Traxens. (A website). Available online: https://www.traxens.com/press/a-p-moller-maersk-will-join-traxens.
- THELOADSTAR. 2018.10.15. MSC opts for Traxens technology to create 50,000 ‘smart’ containers. https://theloadstar. (A website). Available online: https://theloadstar.com/msc-opts-traxens-technology-create-50000-smart-containers/.
- Jing, W.; Zhao, X.; Deng, Y.; Xu, S.; Li, J. Research on key technologies and standard framework of secure and smart container. In 2016 IEEE Trustcom/BigDataSE/ISPA, pp. 2063-2067 (Thesis).
- UNECE. 2019. 「Trade Facilitation White Paper on Smart Containers」 (Book).
- Global Infrastructure Hub,「Smart Container」. (A website). Available online: https://www.gihub.org/infrastructure-technology-use-cases/case-studies/smart-shipping-containers-to-enhance-port-productivity/.
Figure 1.
Proposed Emulator Algorithms.
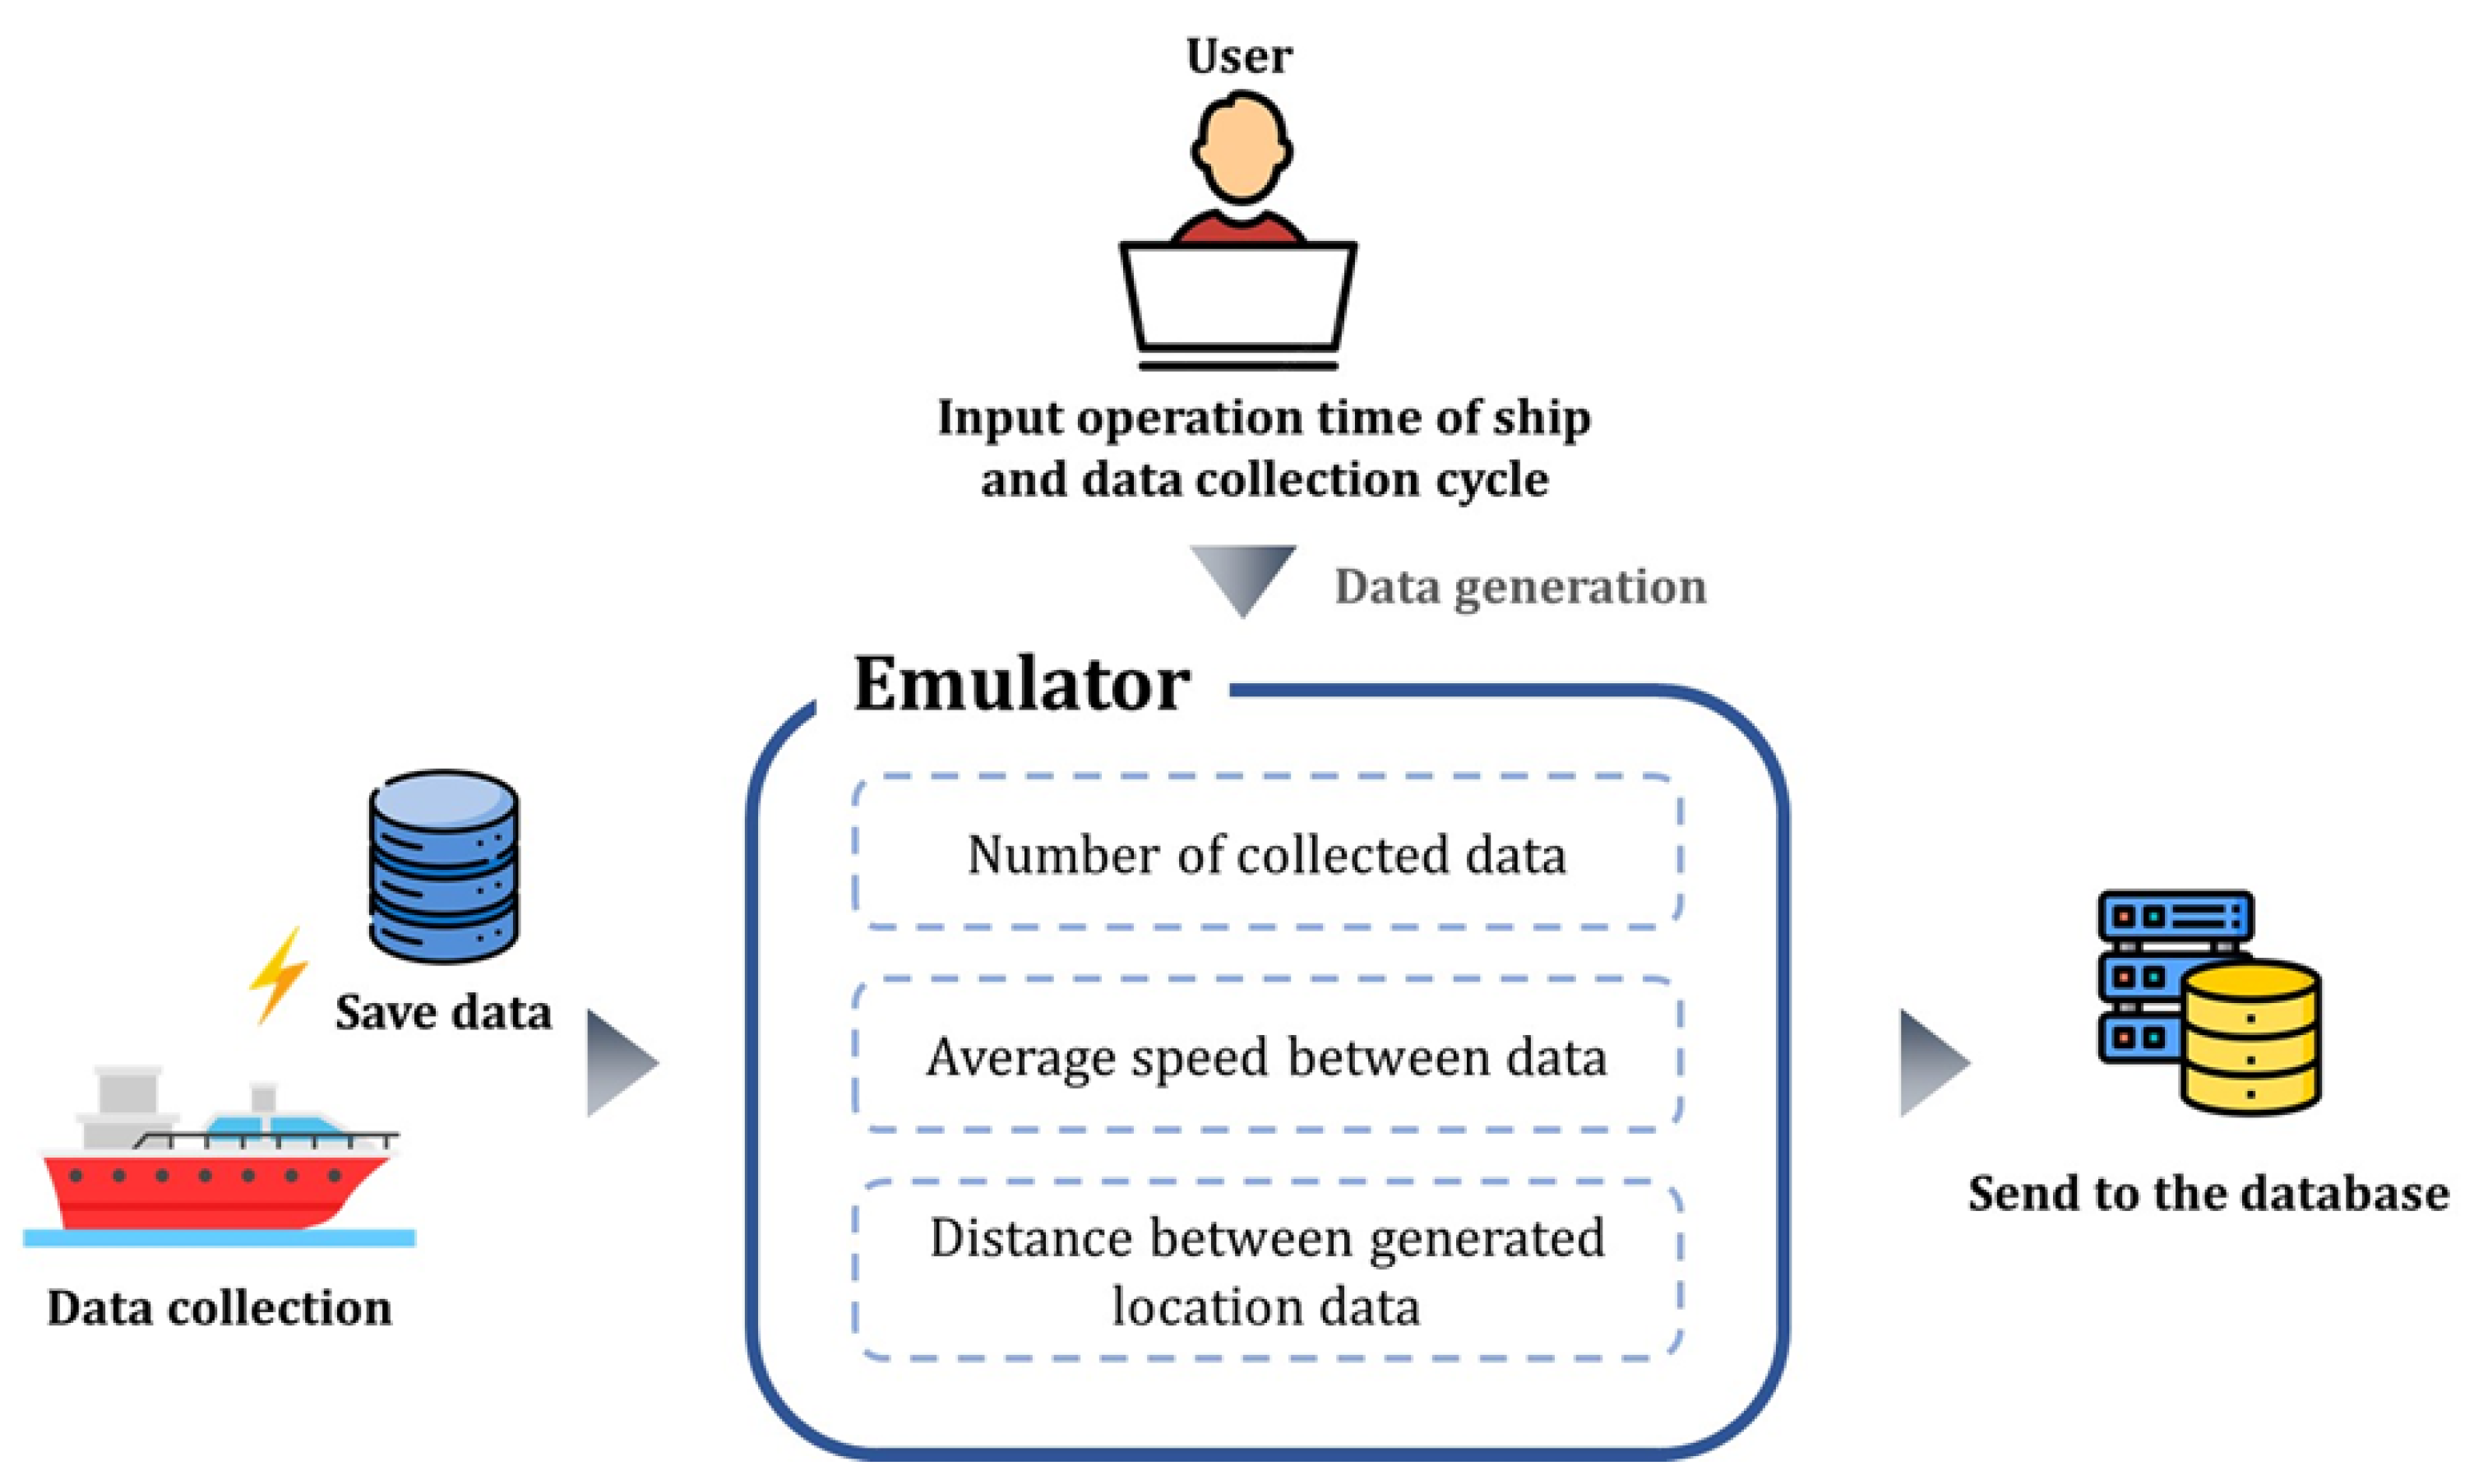
Figure 2.
Development of a Maritime Transport Emulator.
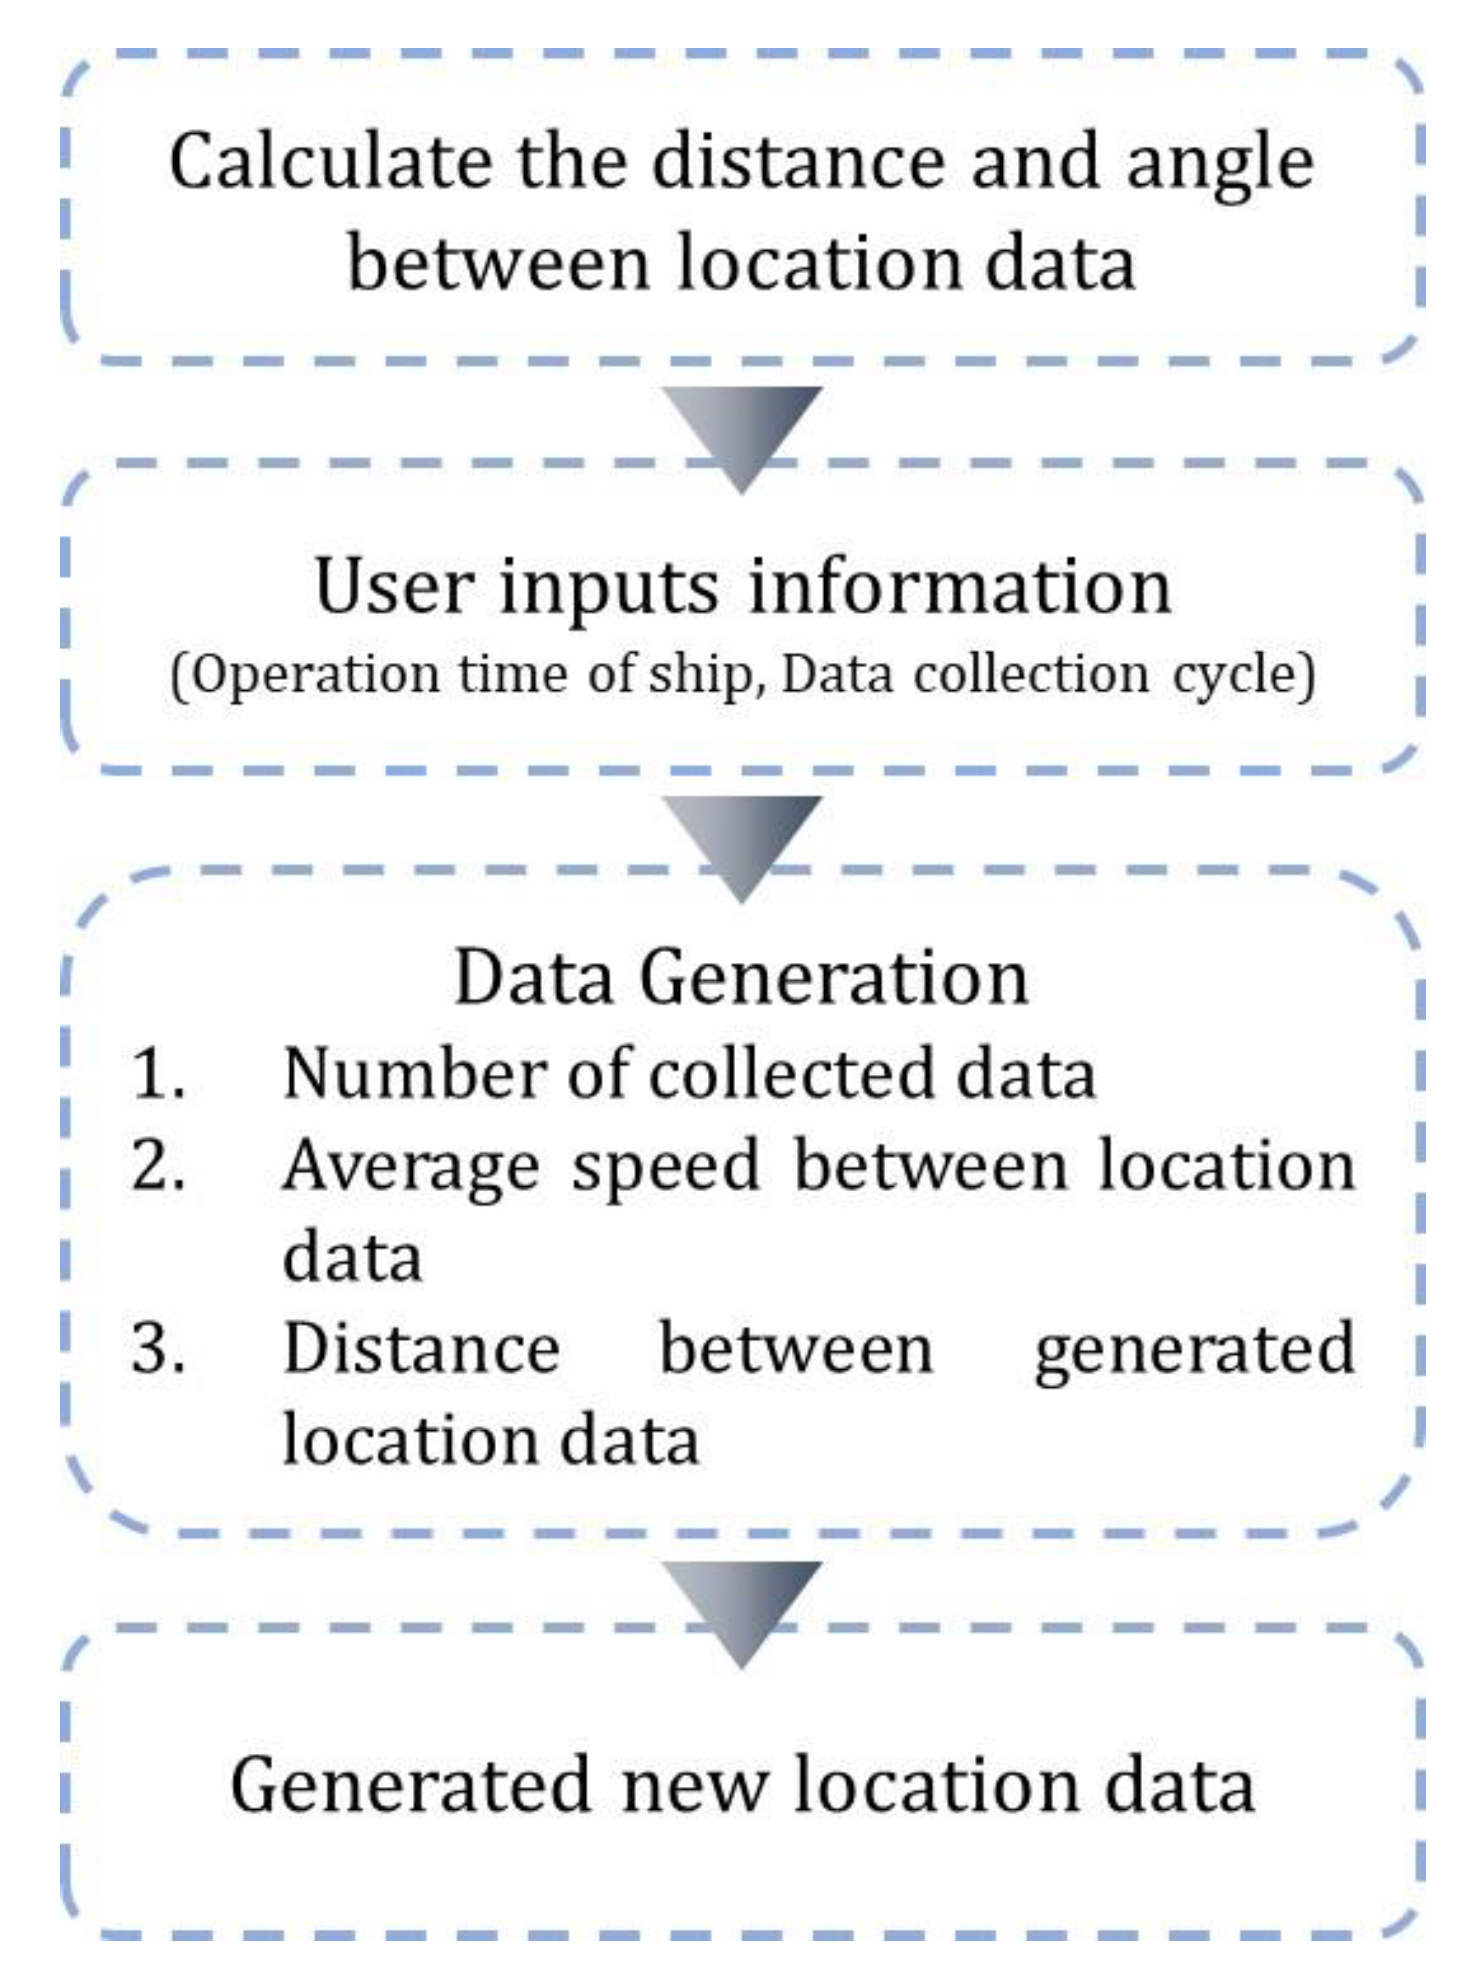
Figure 3.
Add the Standard Deviation of the Distance.
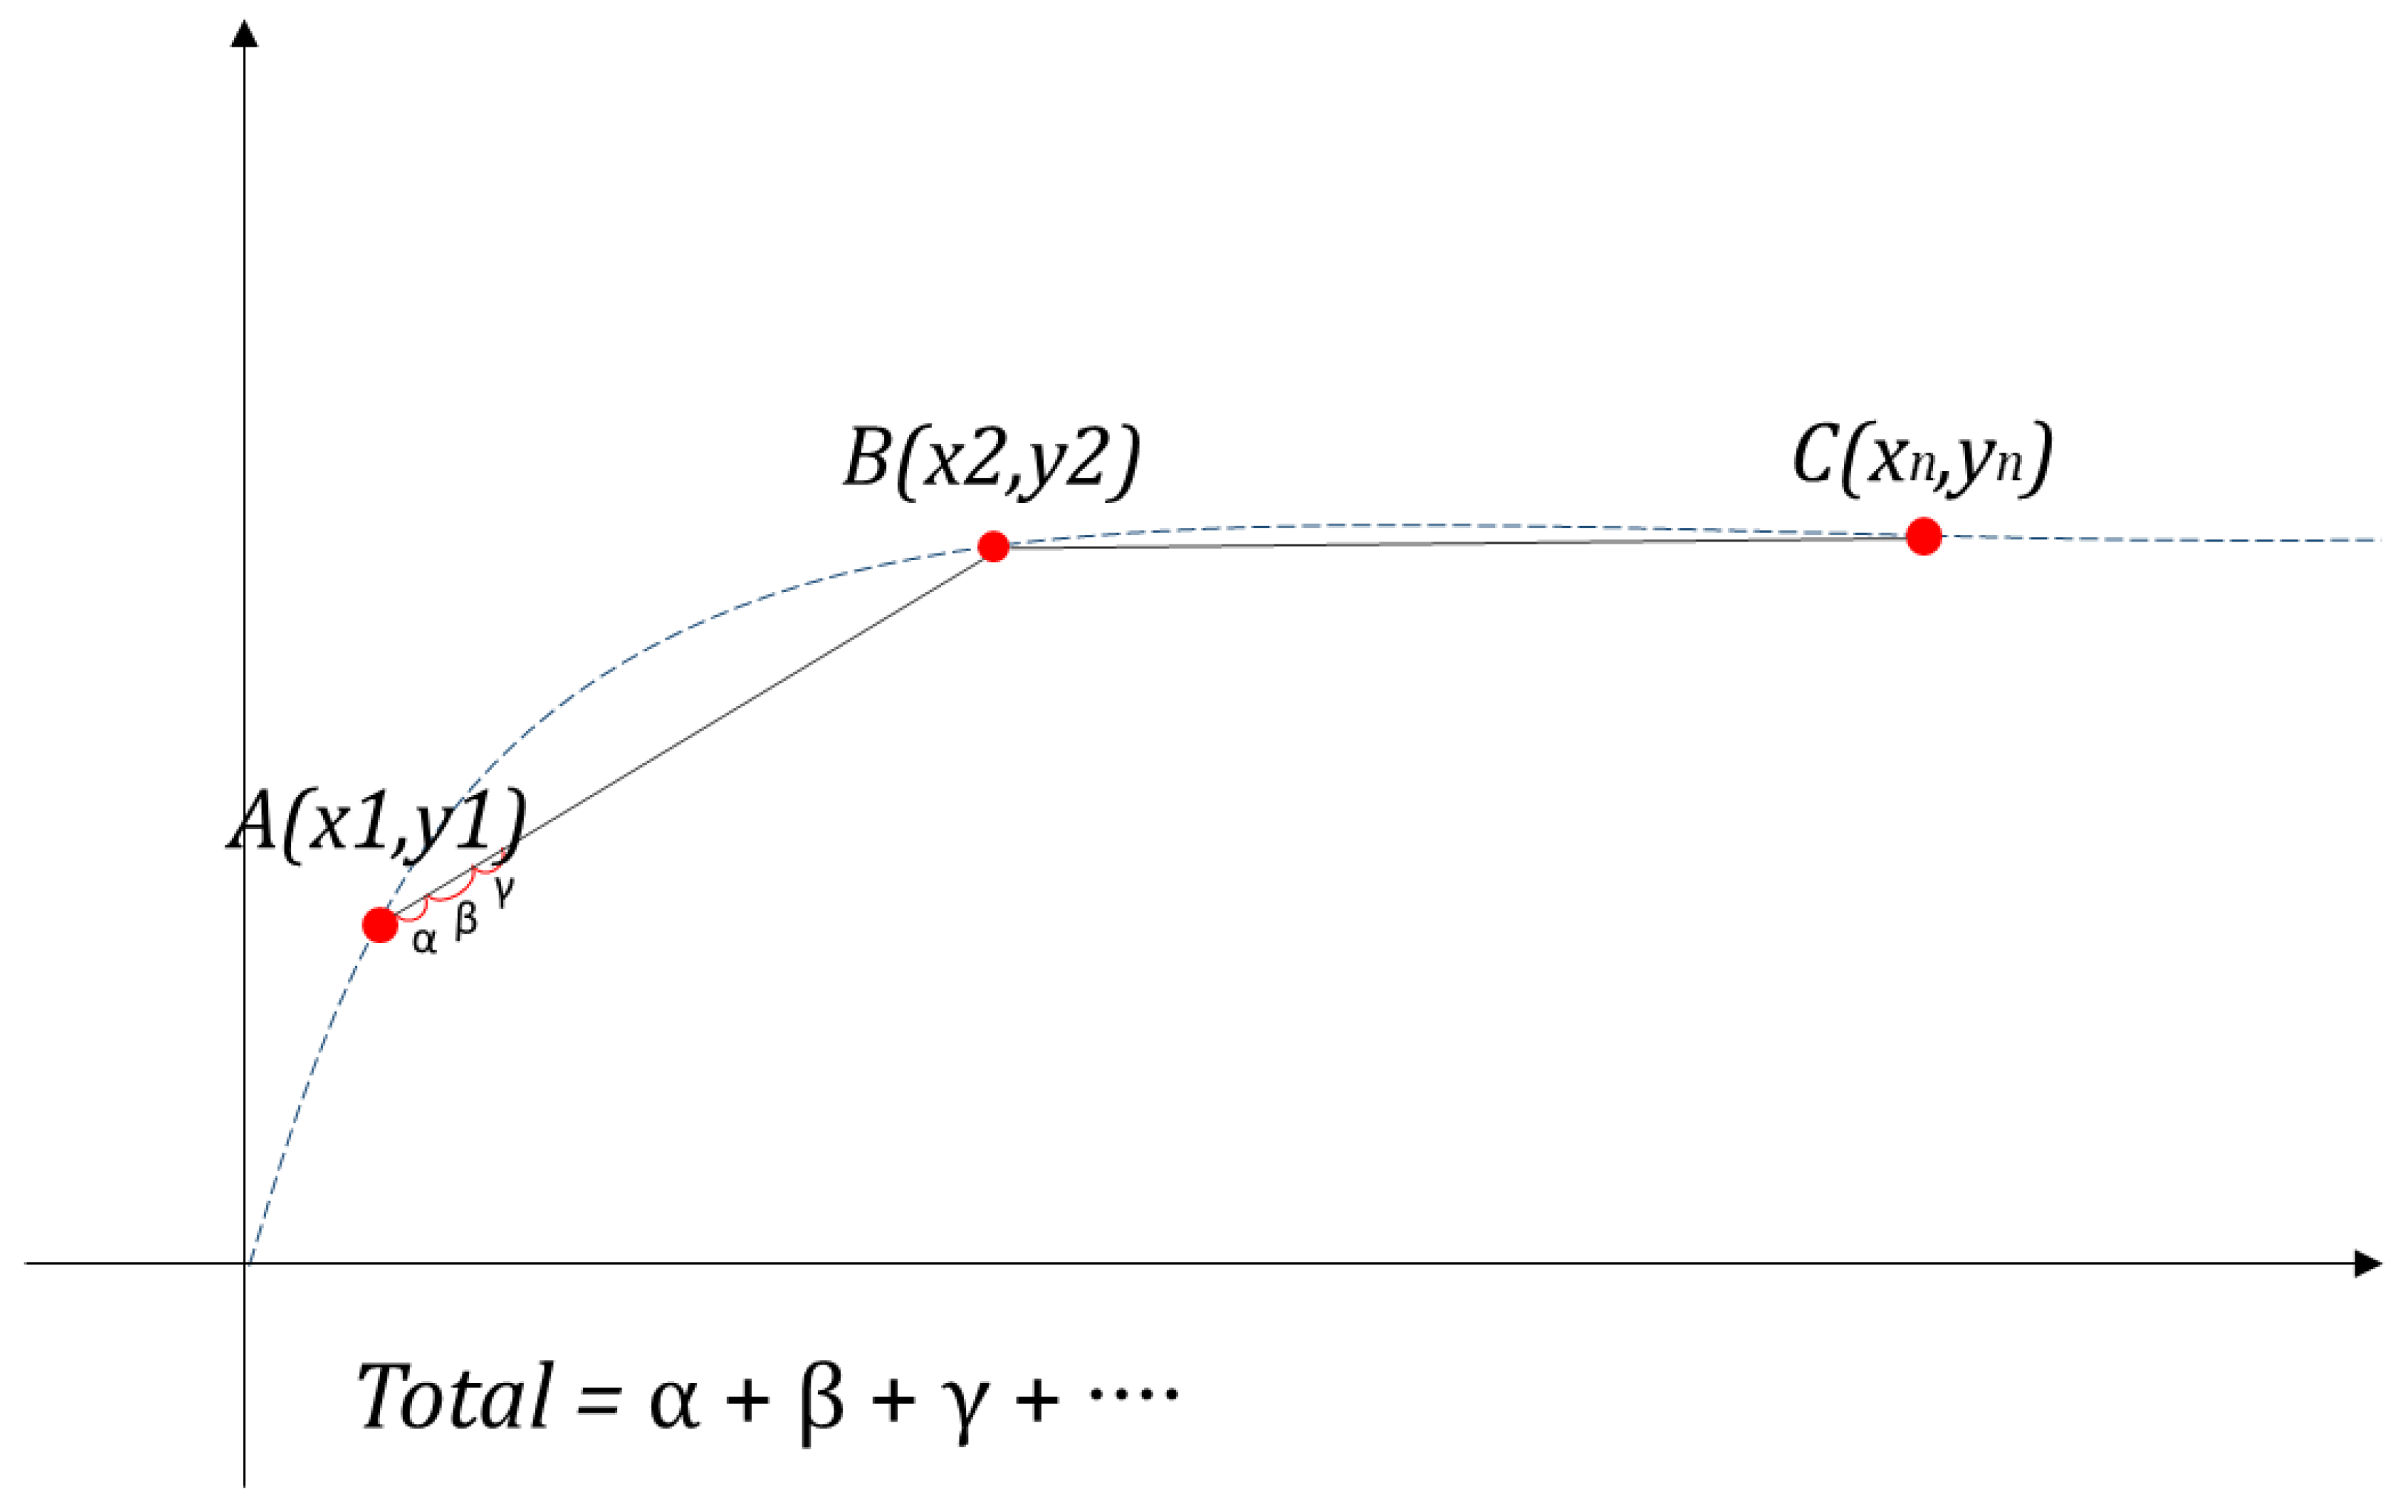
Figure 4.
Angle of Distance Between Standard Routes.
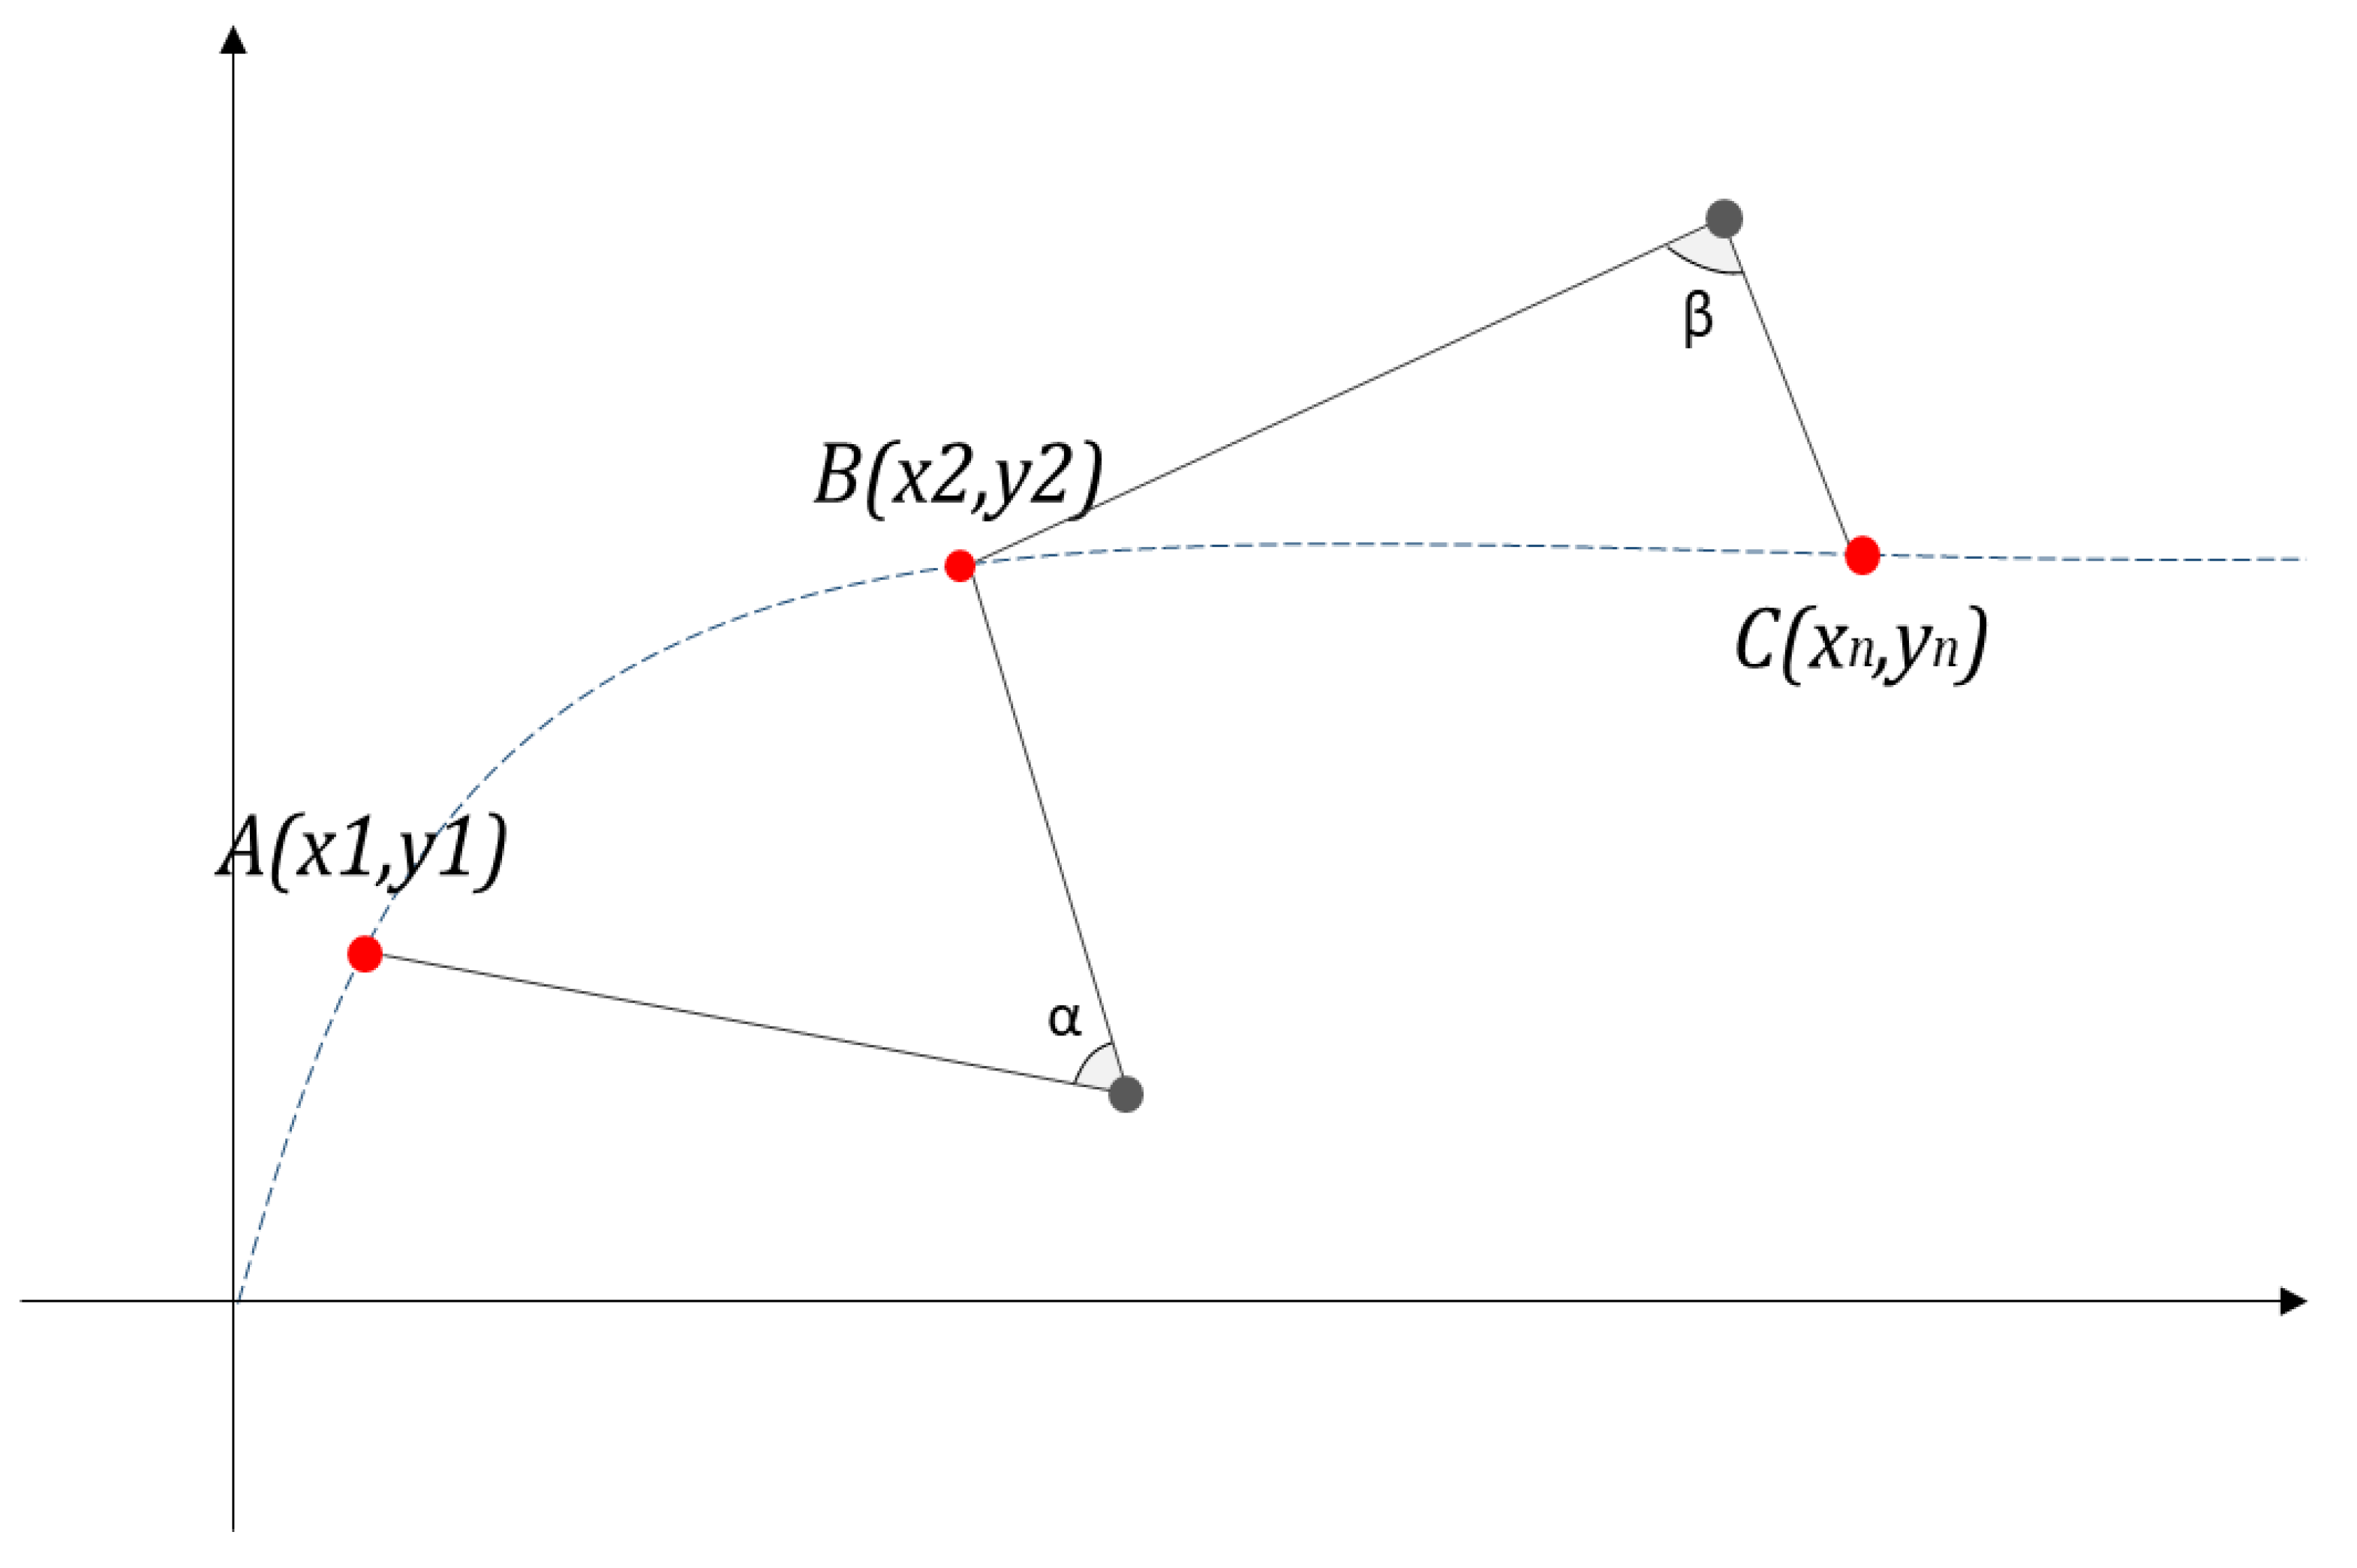
Figure 5.
Distance and Speed Between Generated Location data.
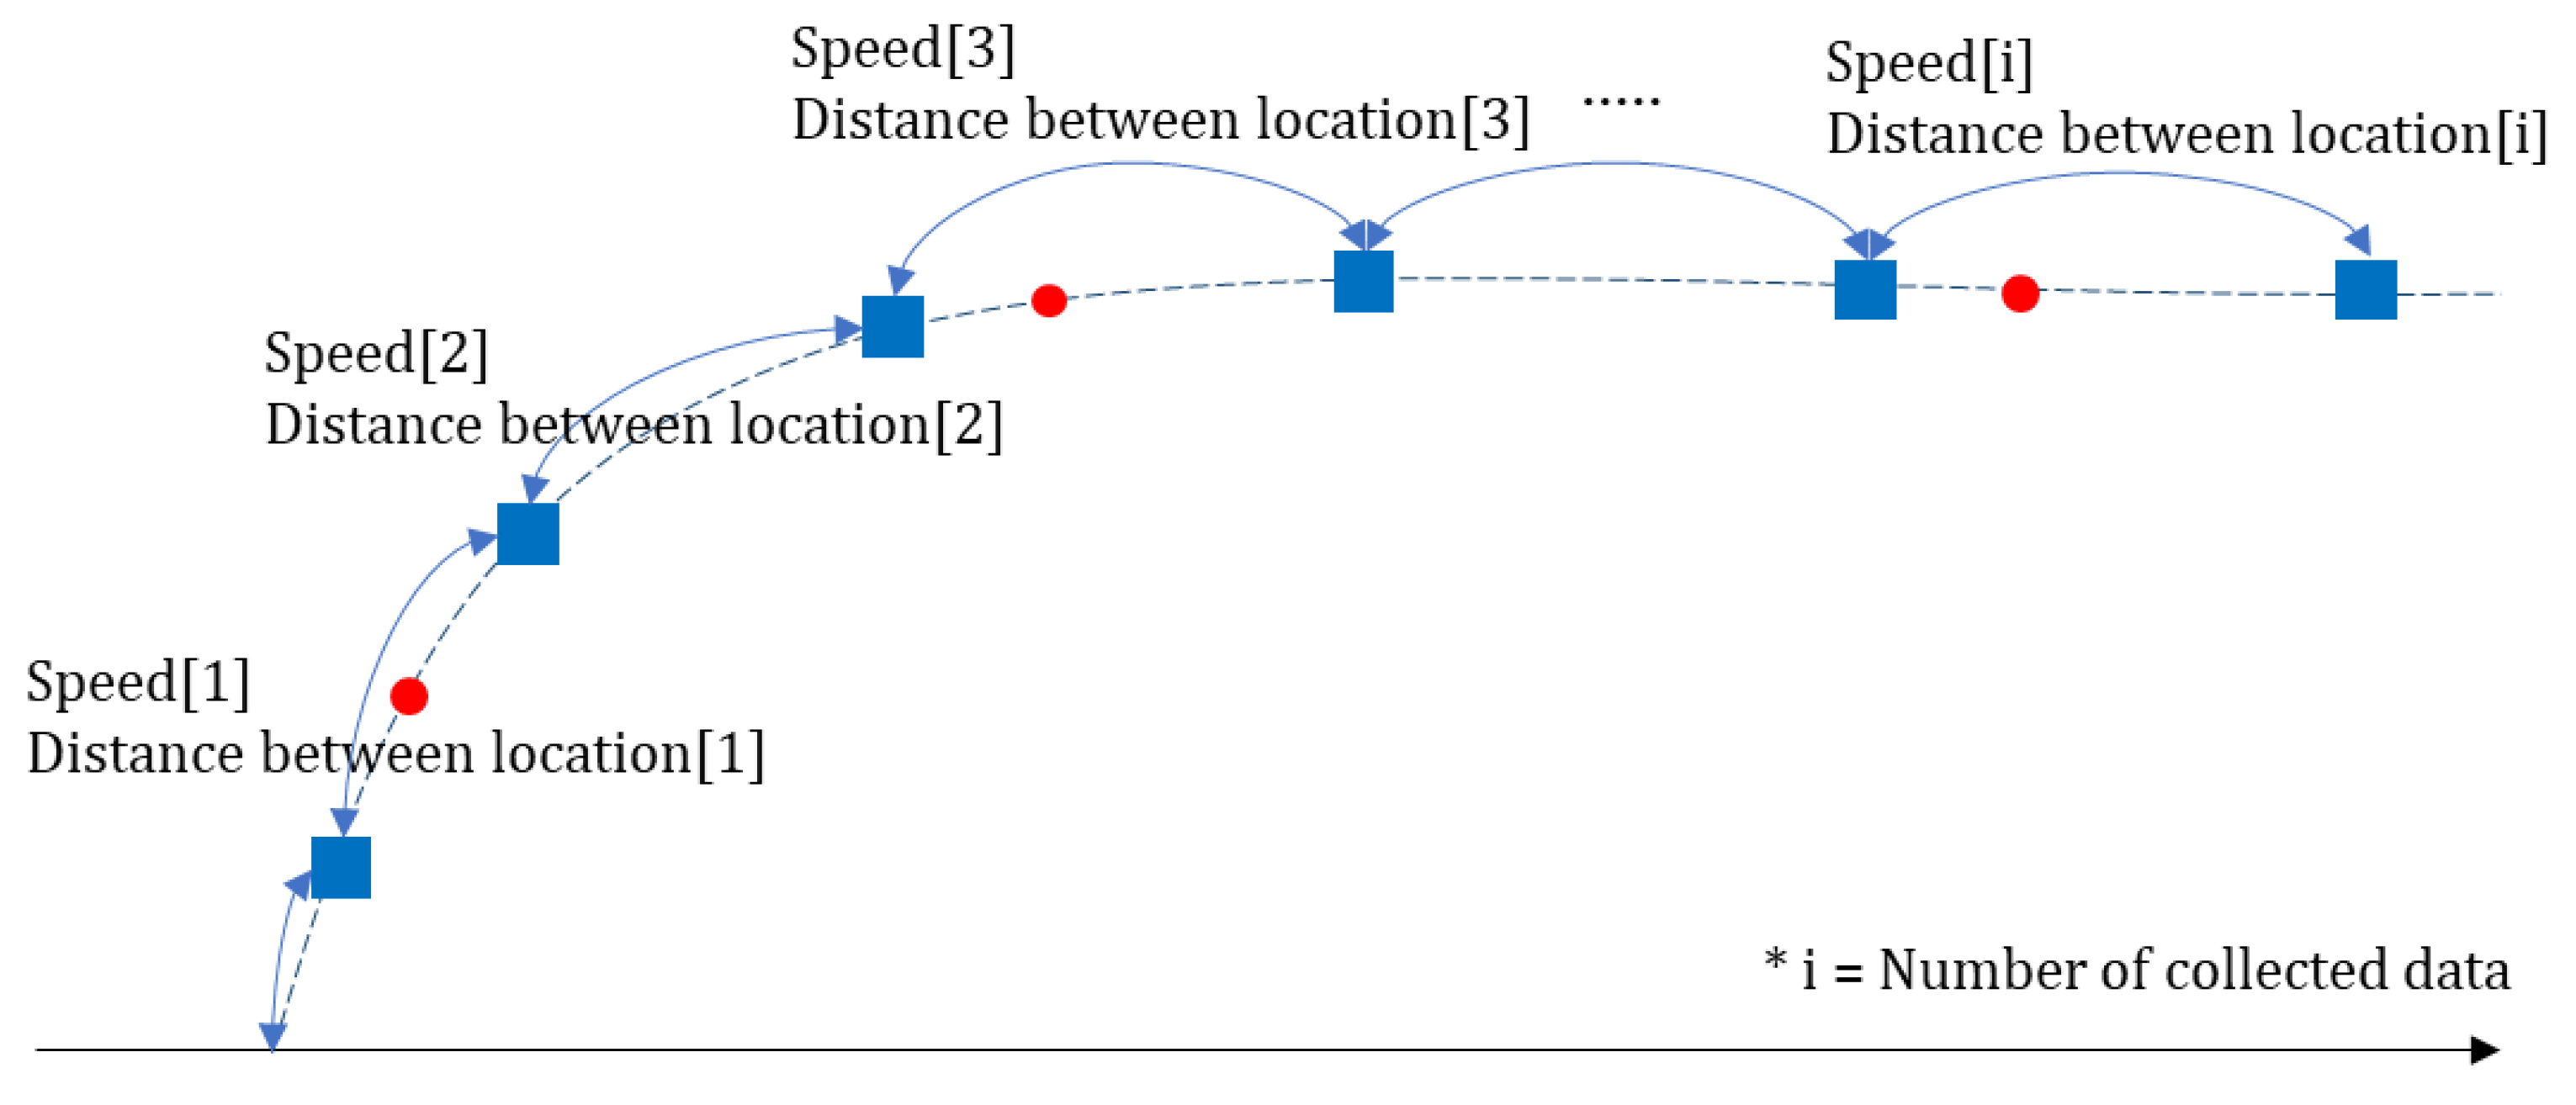
Figure 6.
To Read the Angle Value.
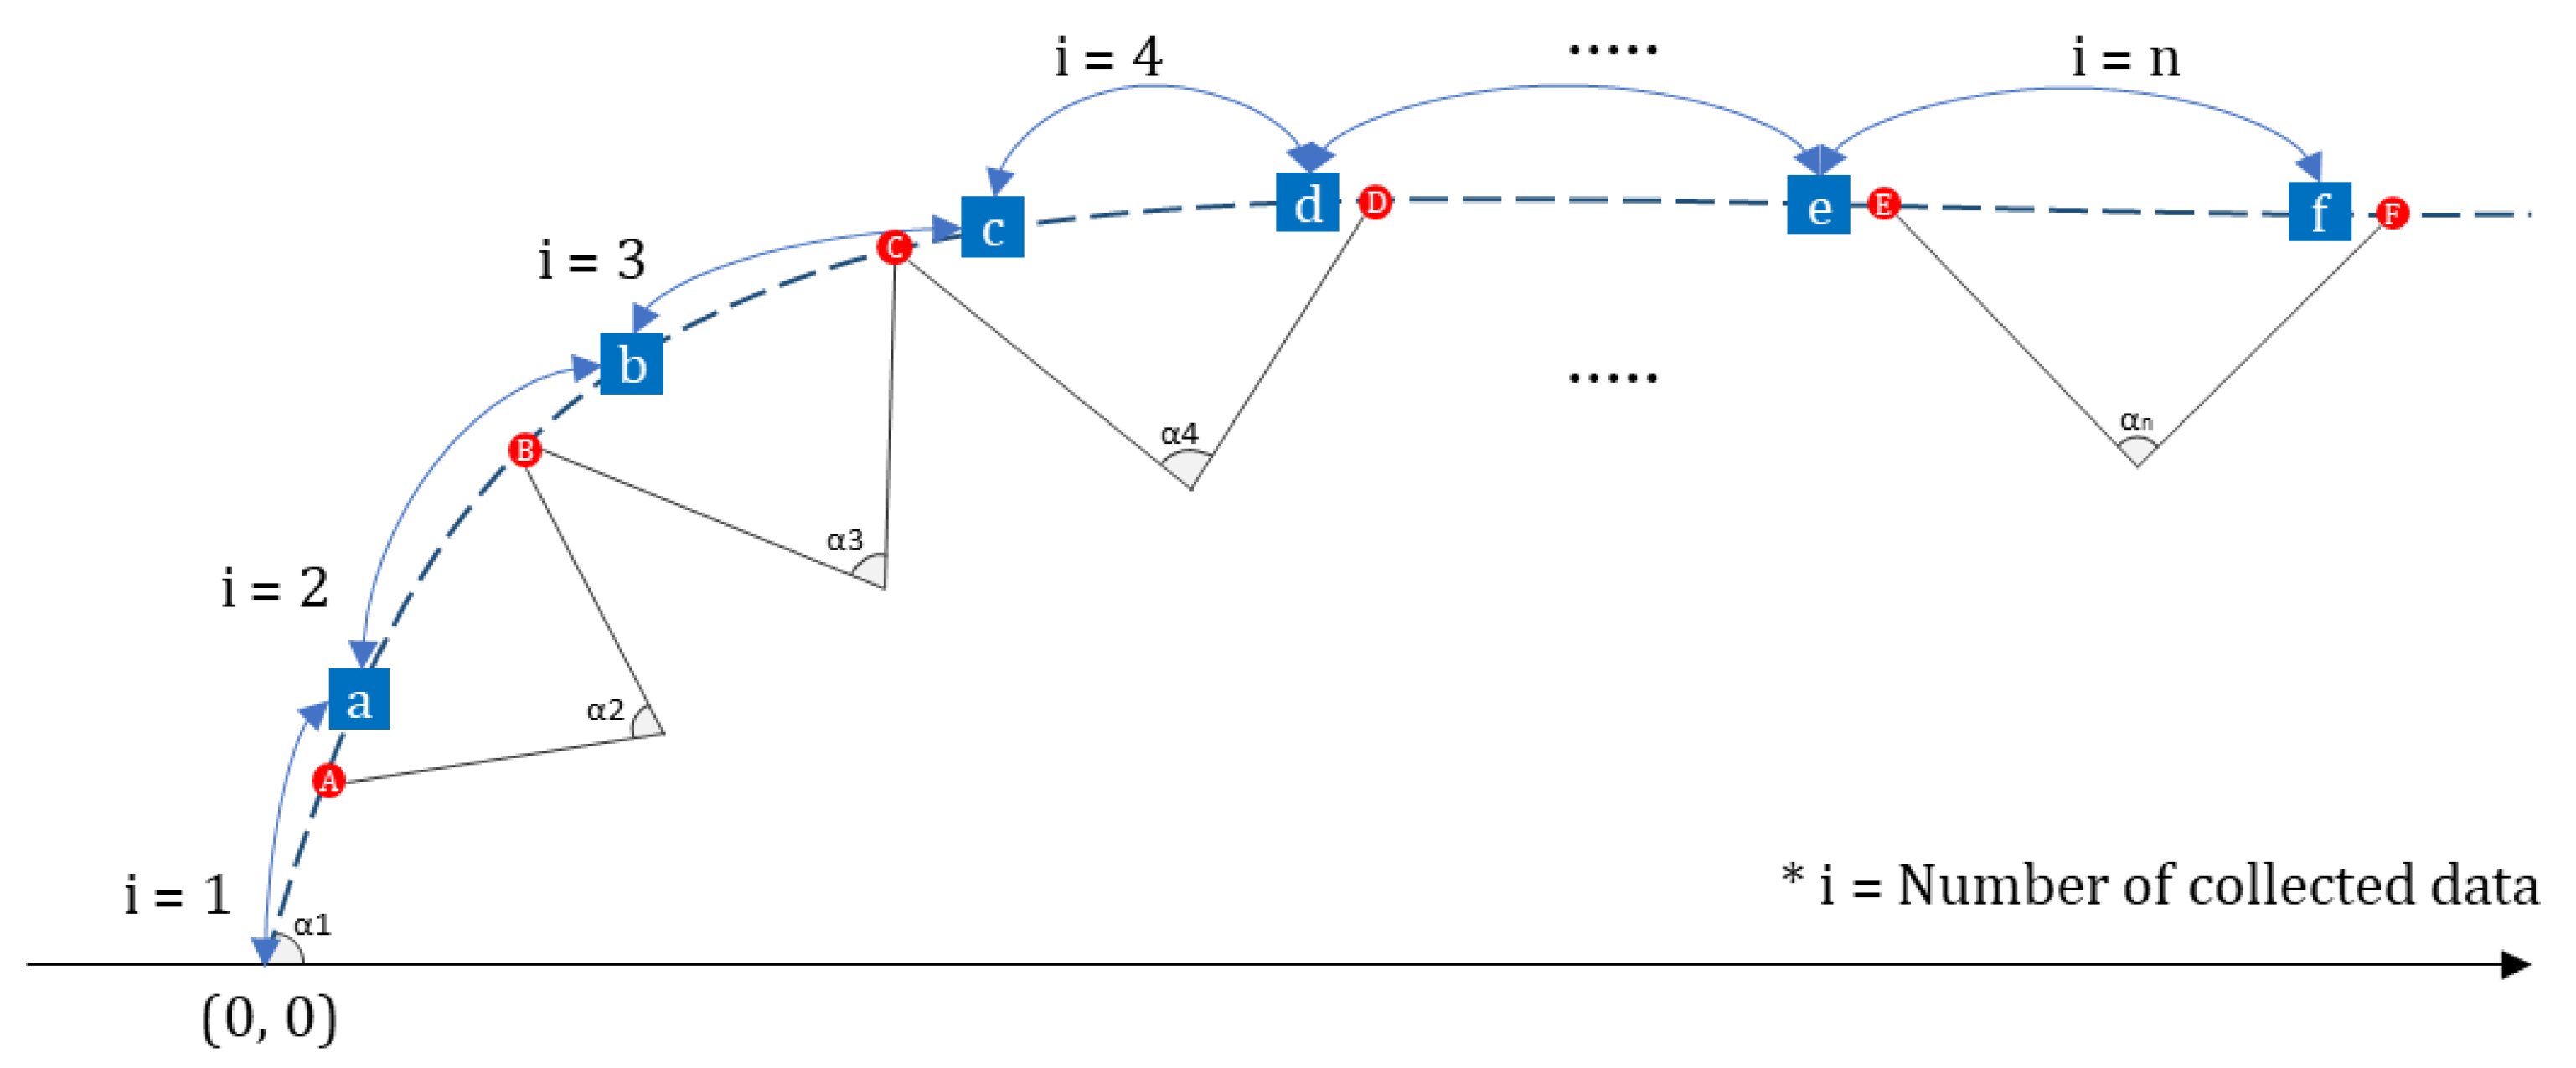
Figure 7.
Example of Database New Location Data.
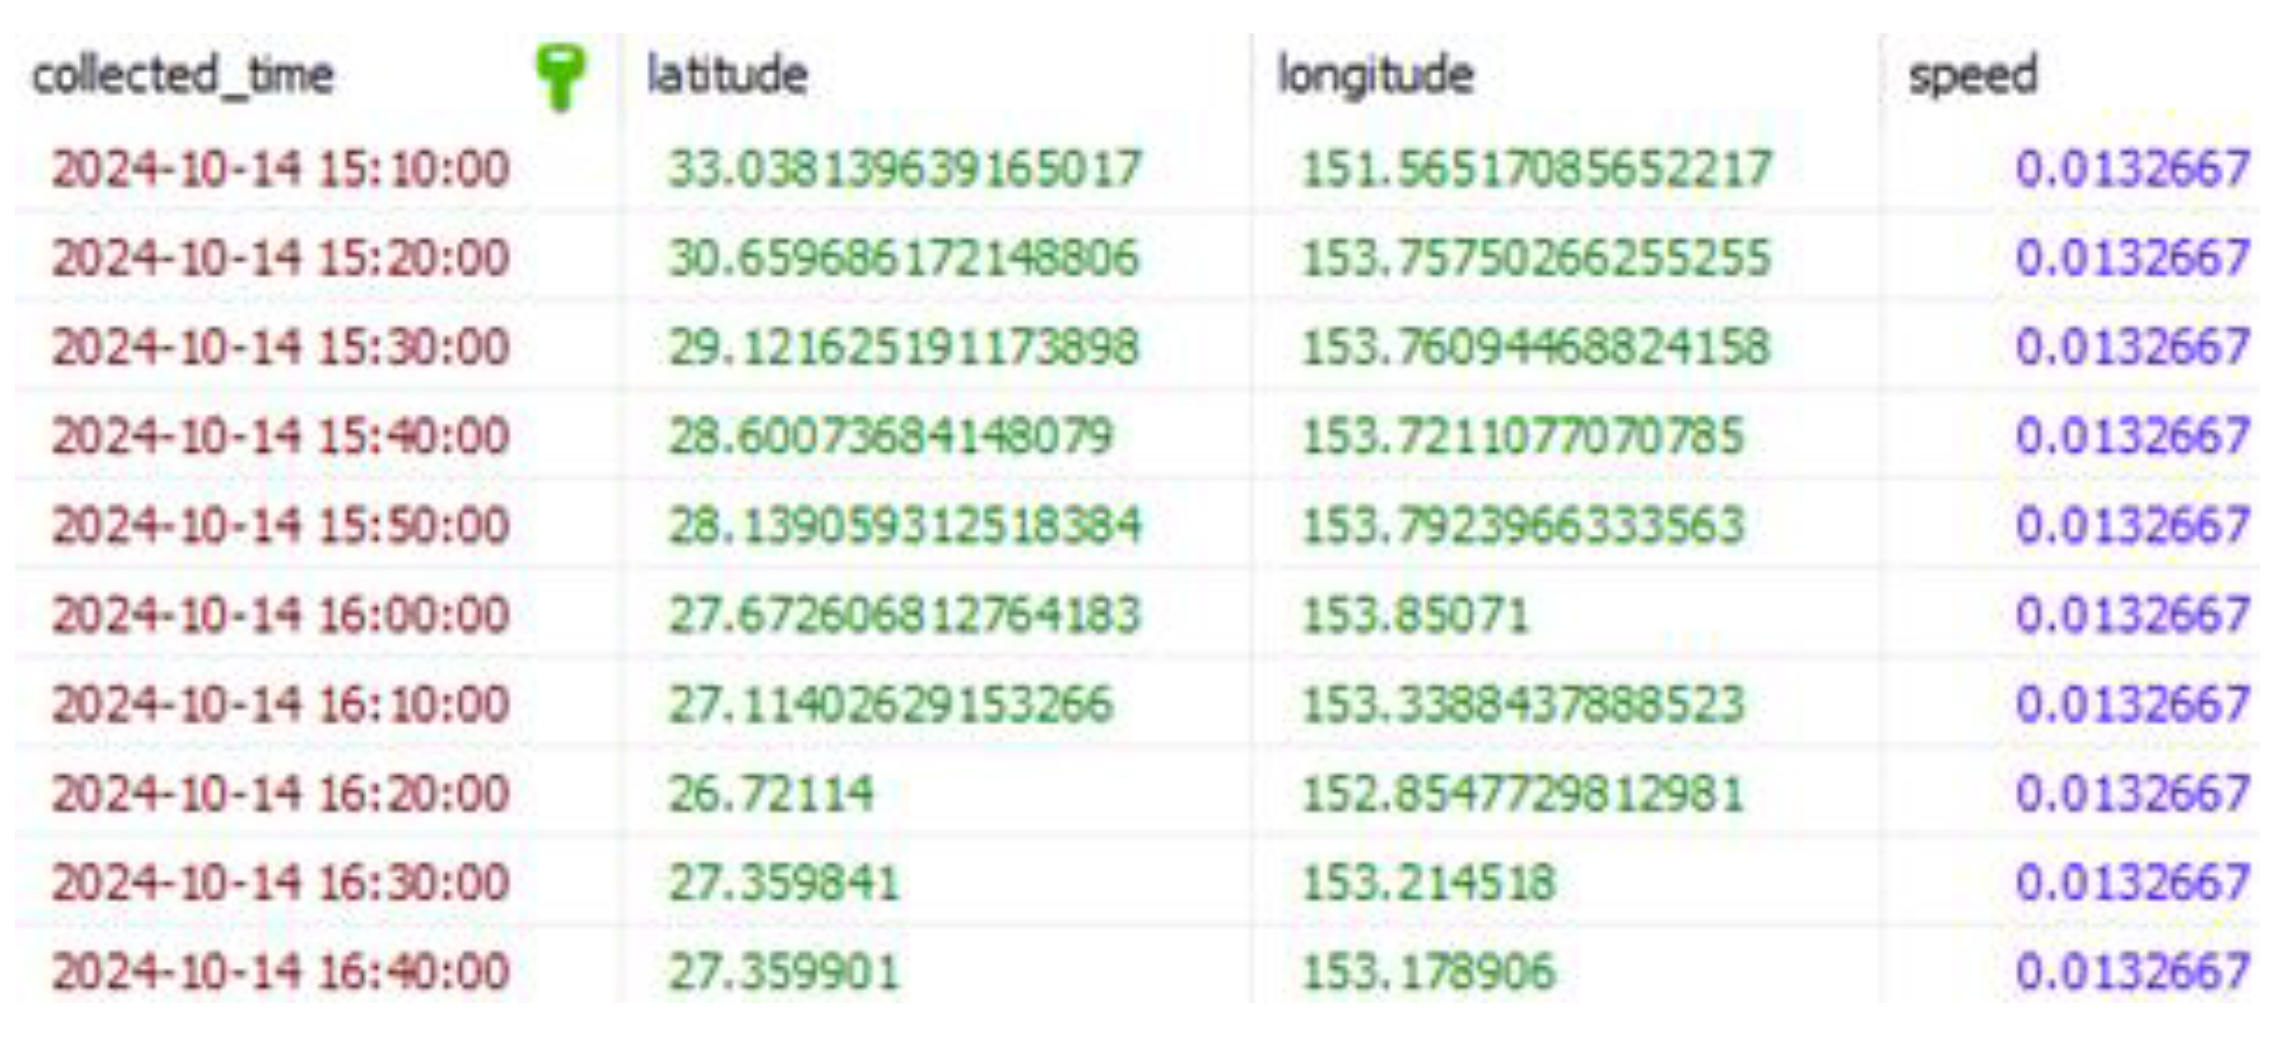
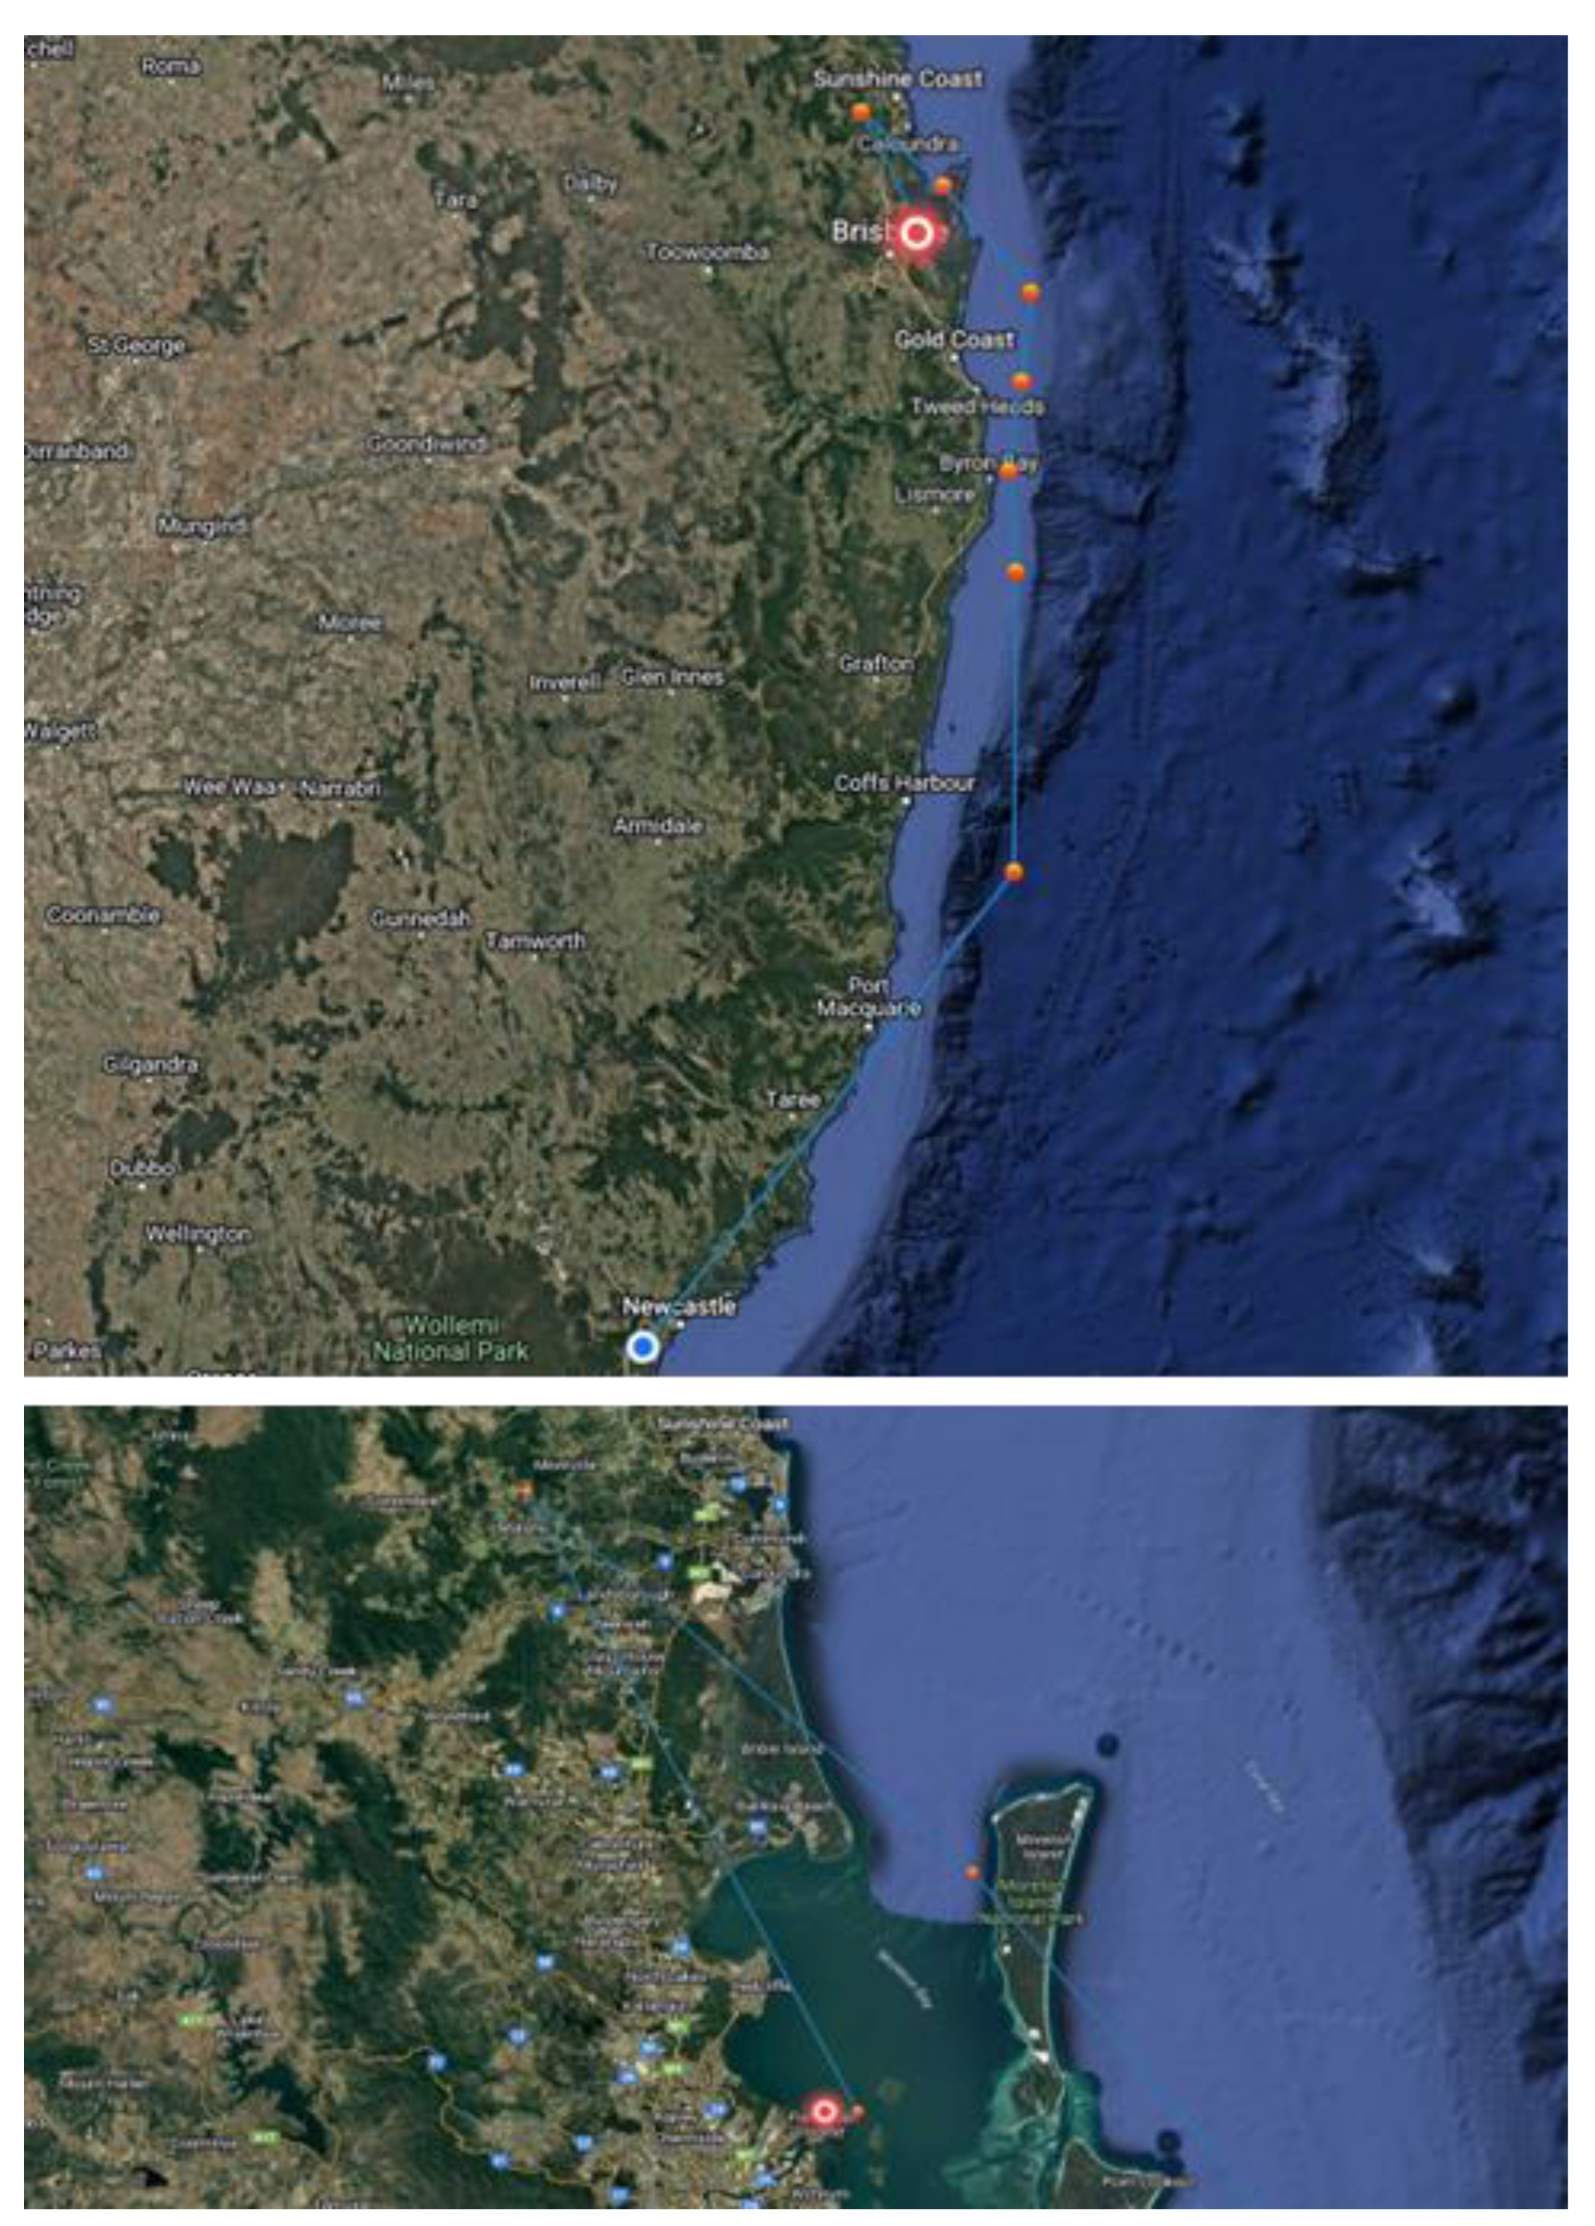
Figure 9.
Searoute in HMM.
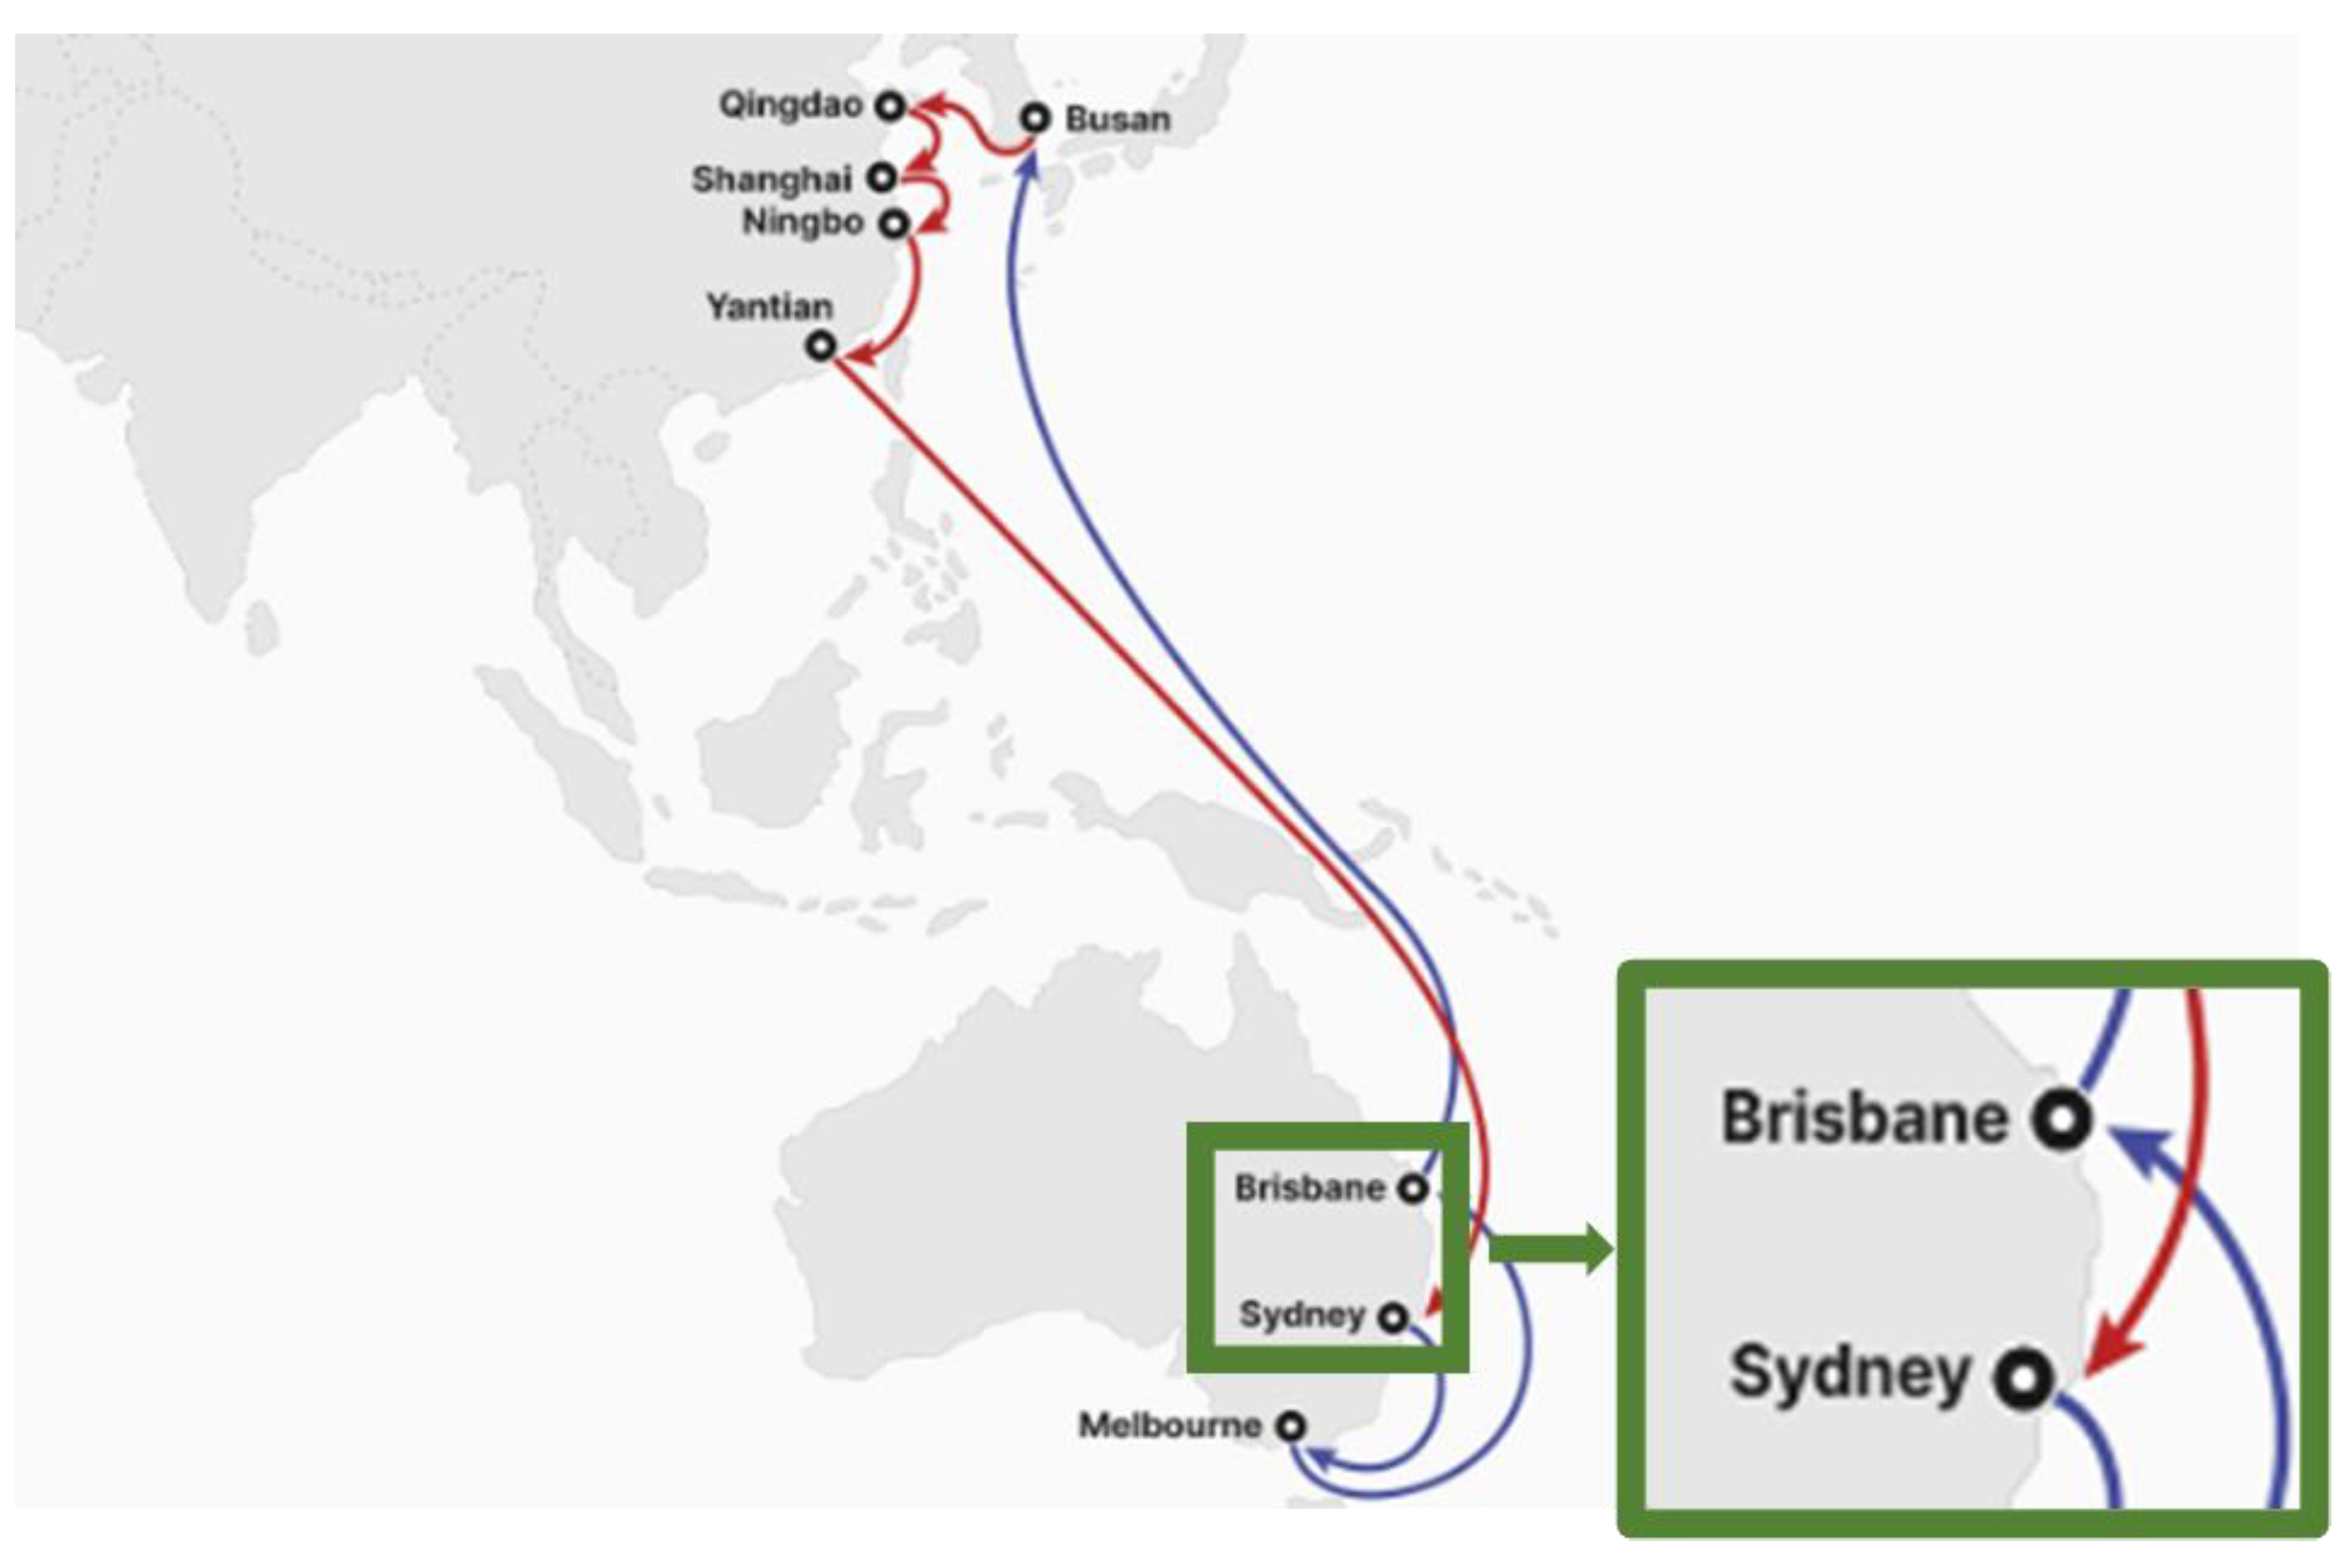
Figure 10.
First Experiment (Number of Collected Data = 10).
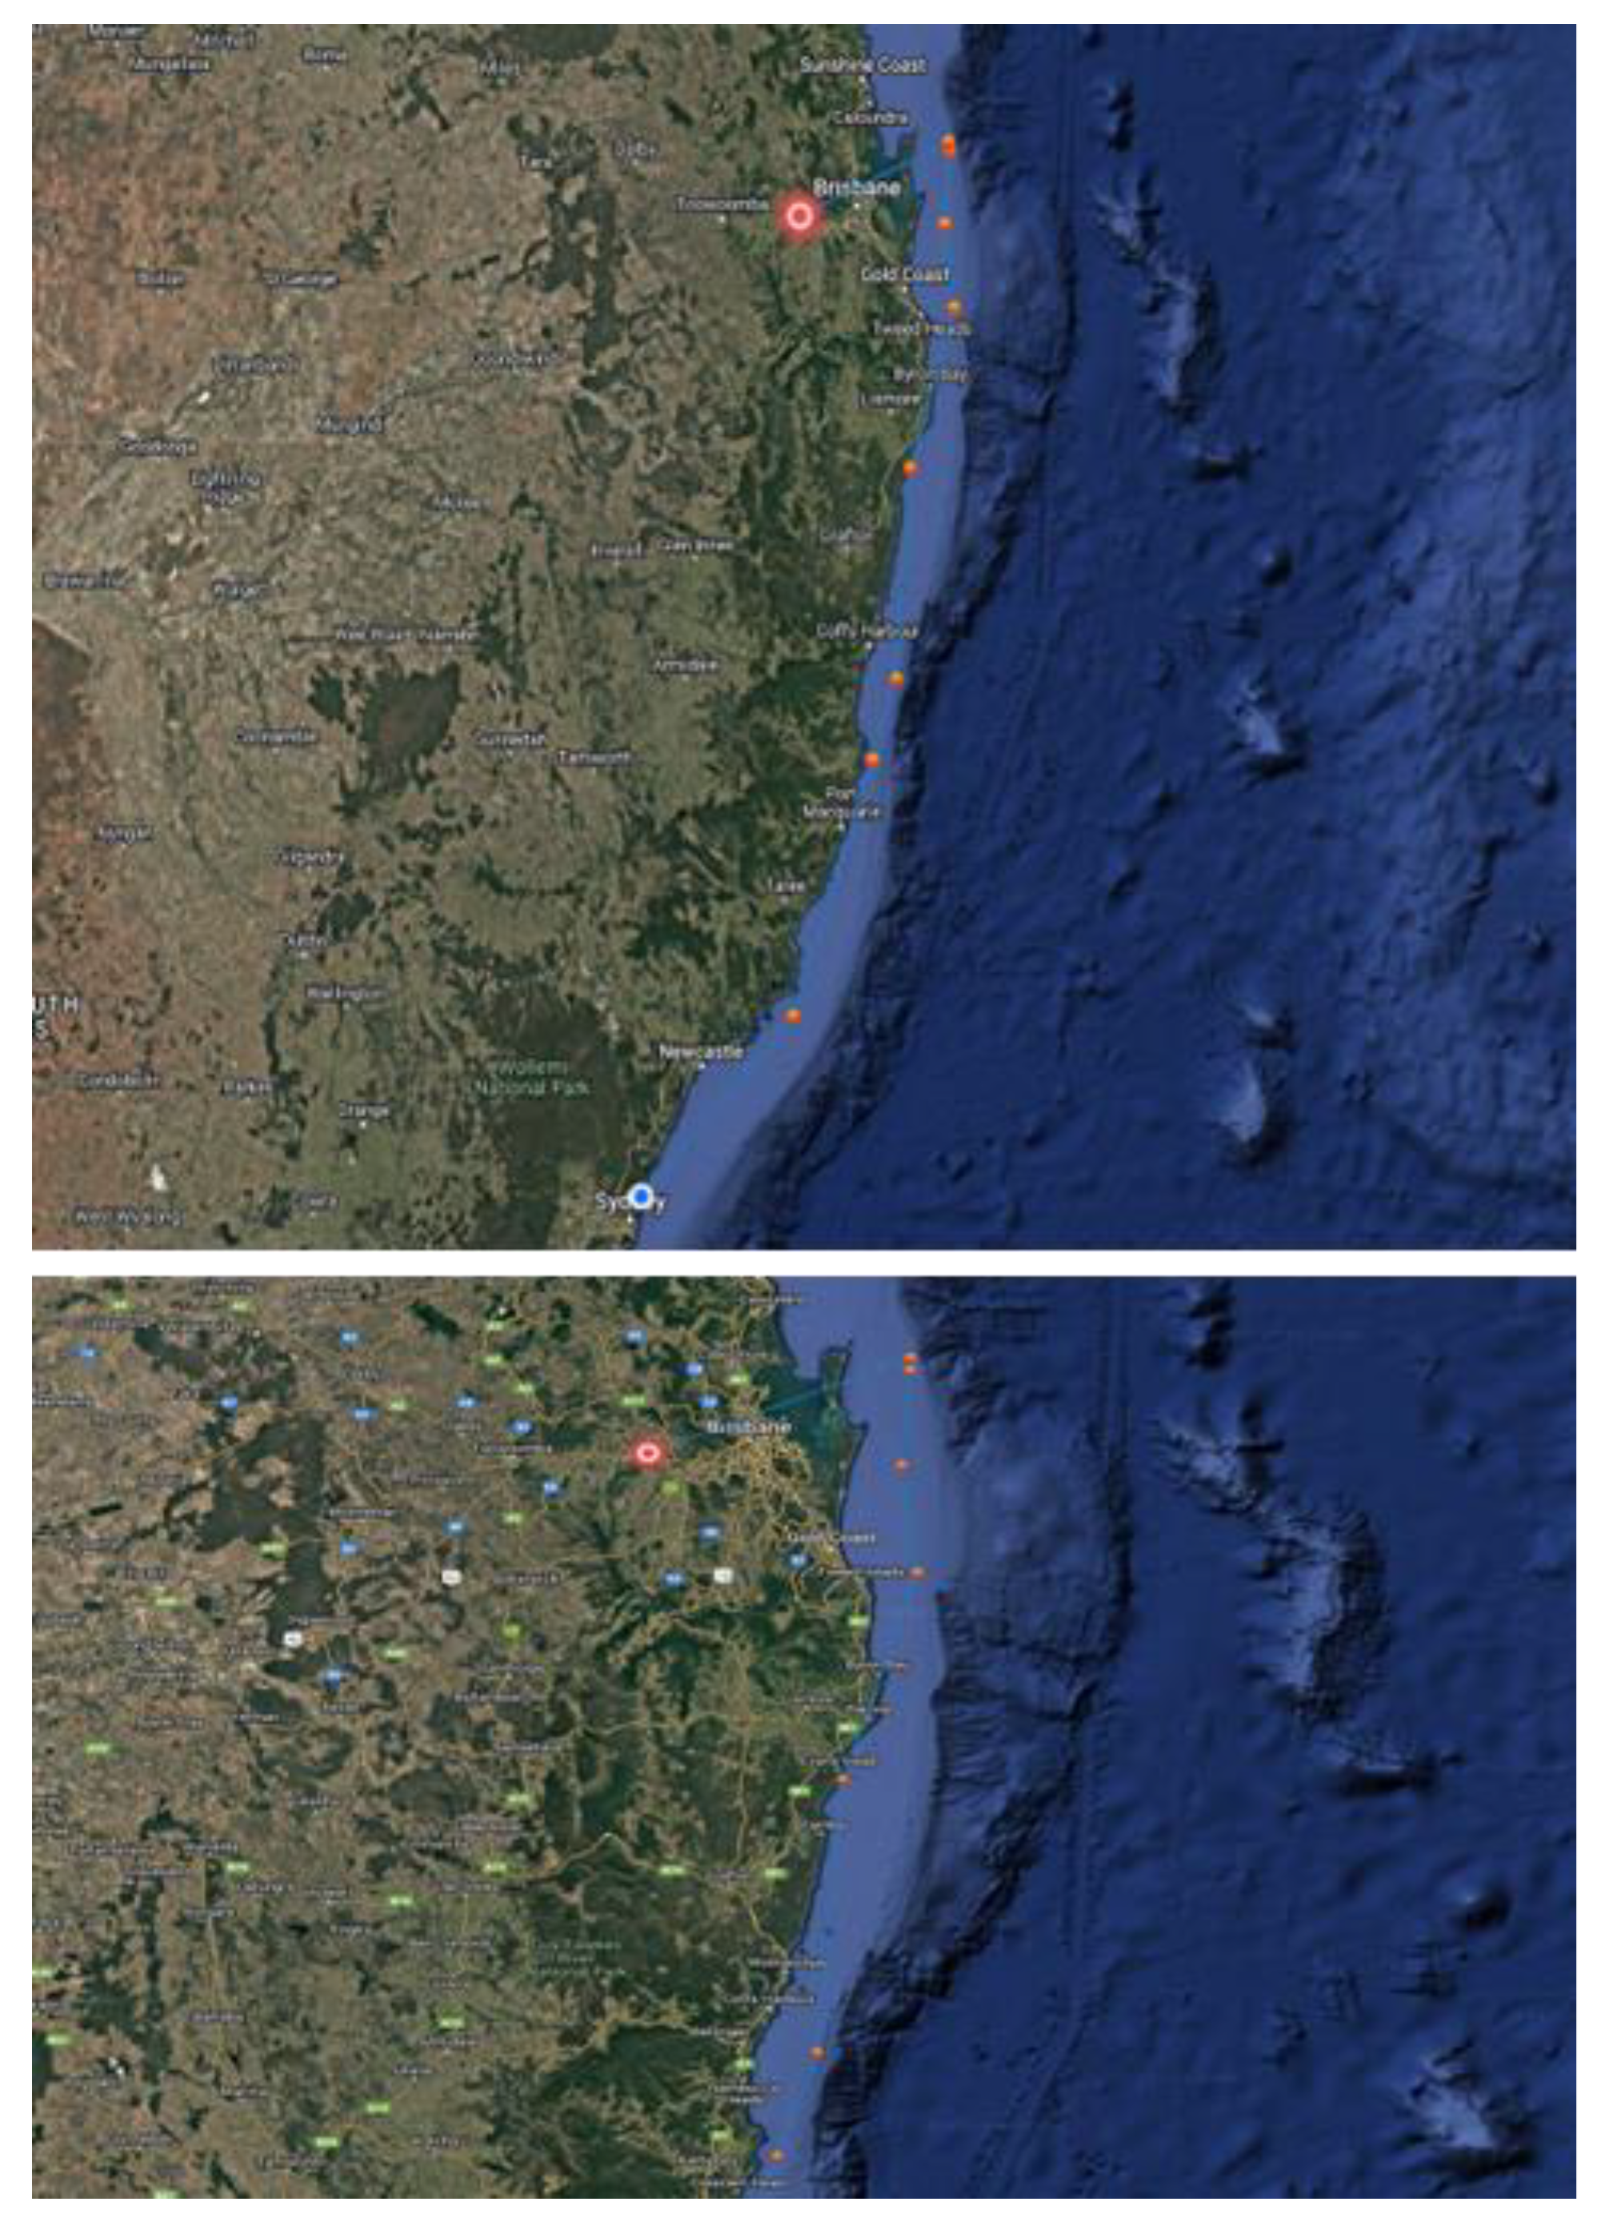
Figure 11.
Second Experiment (Number of Collected Data = 20).
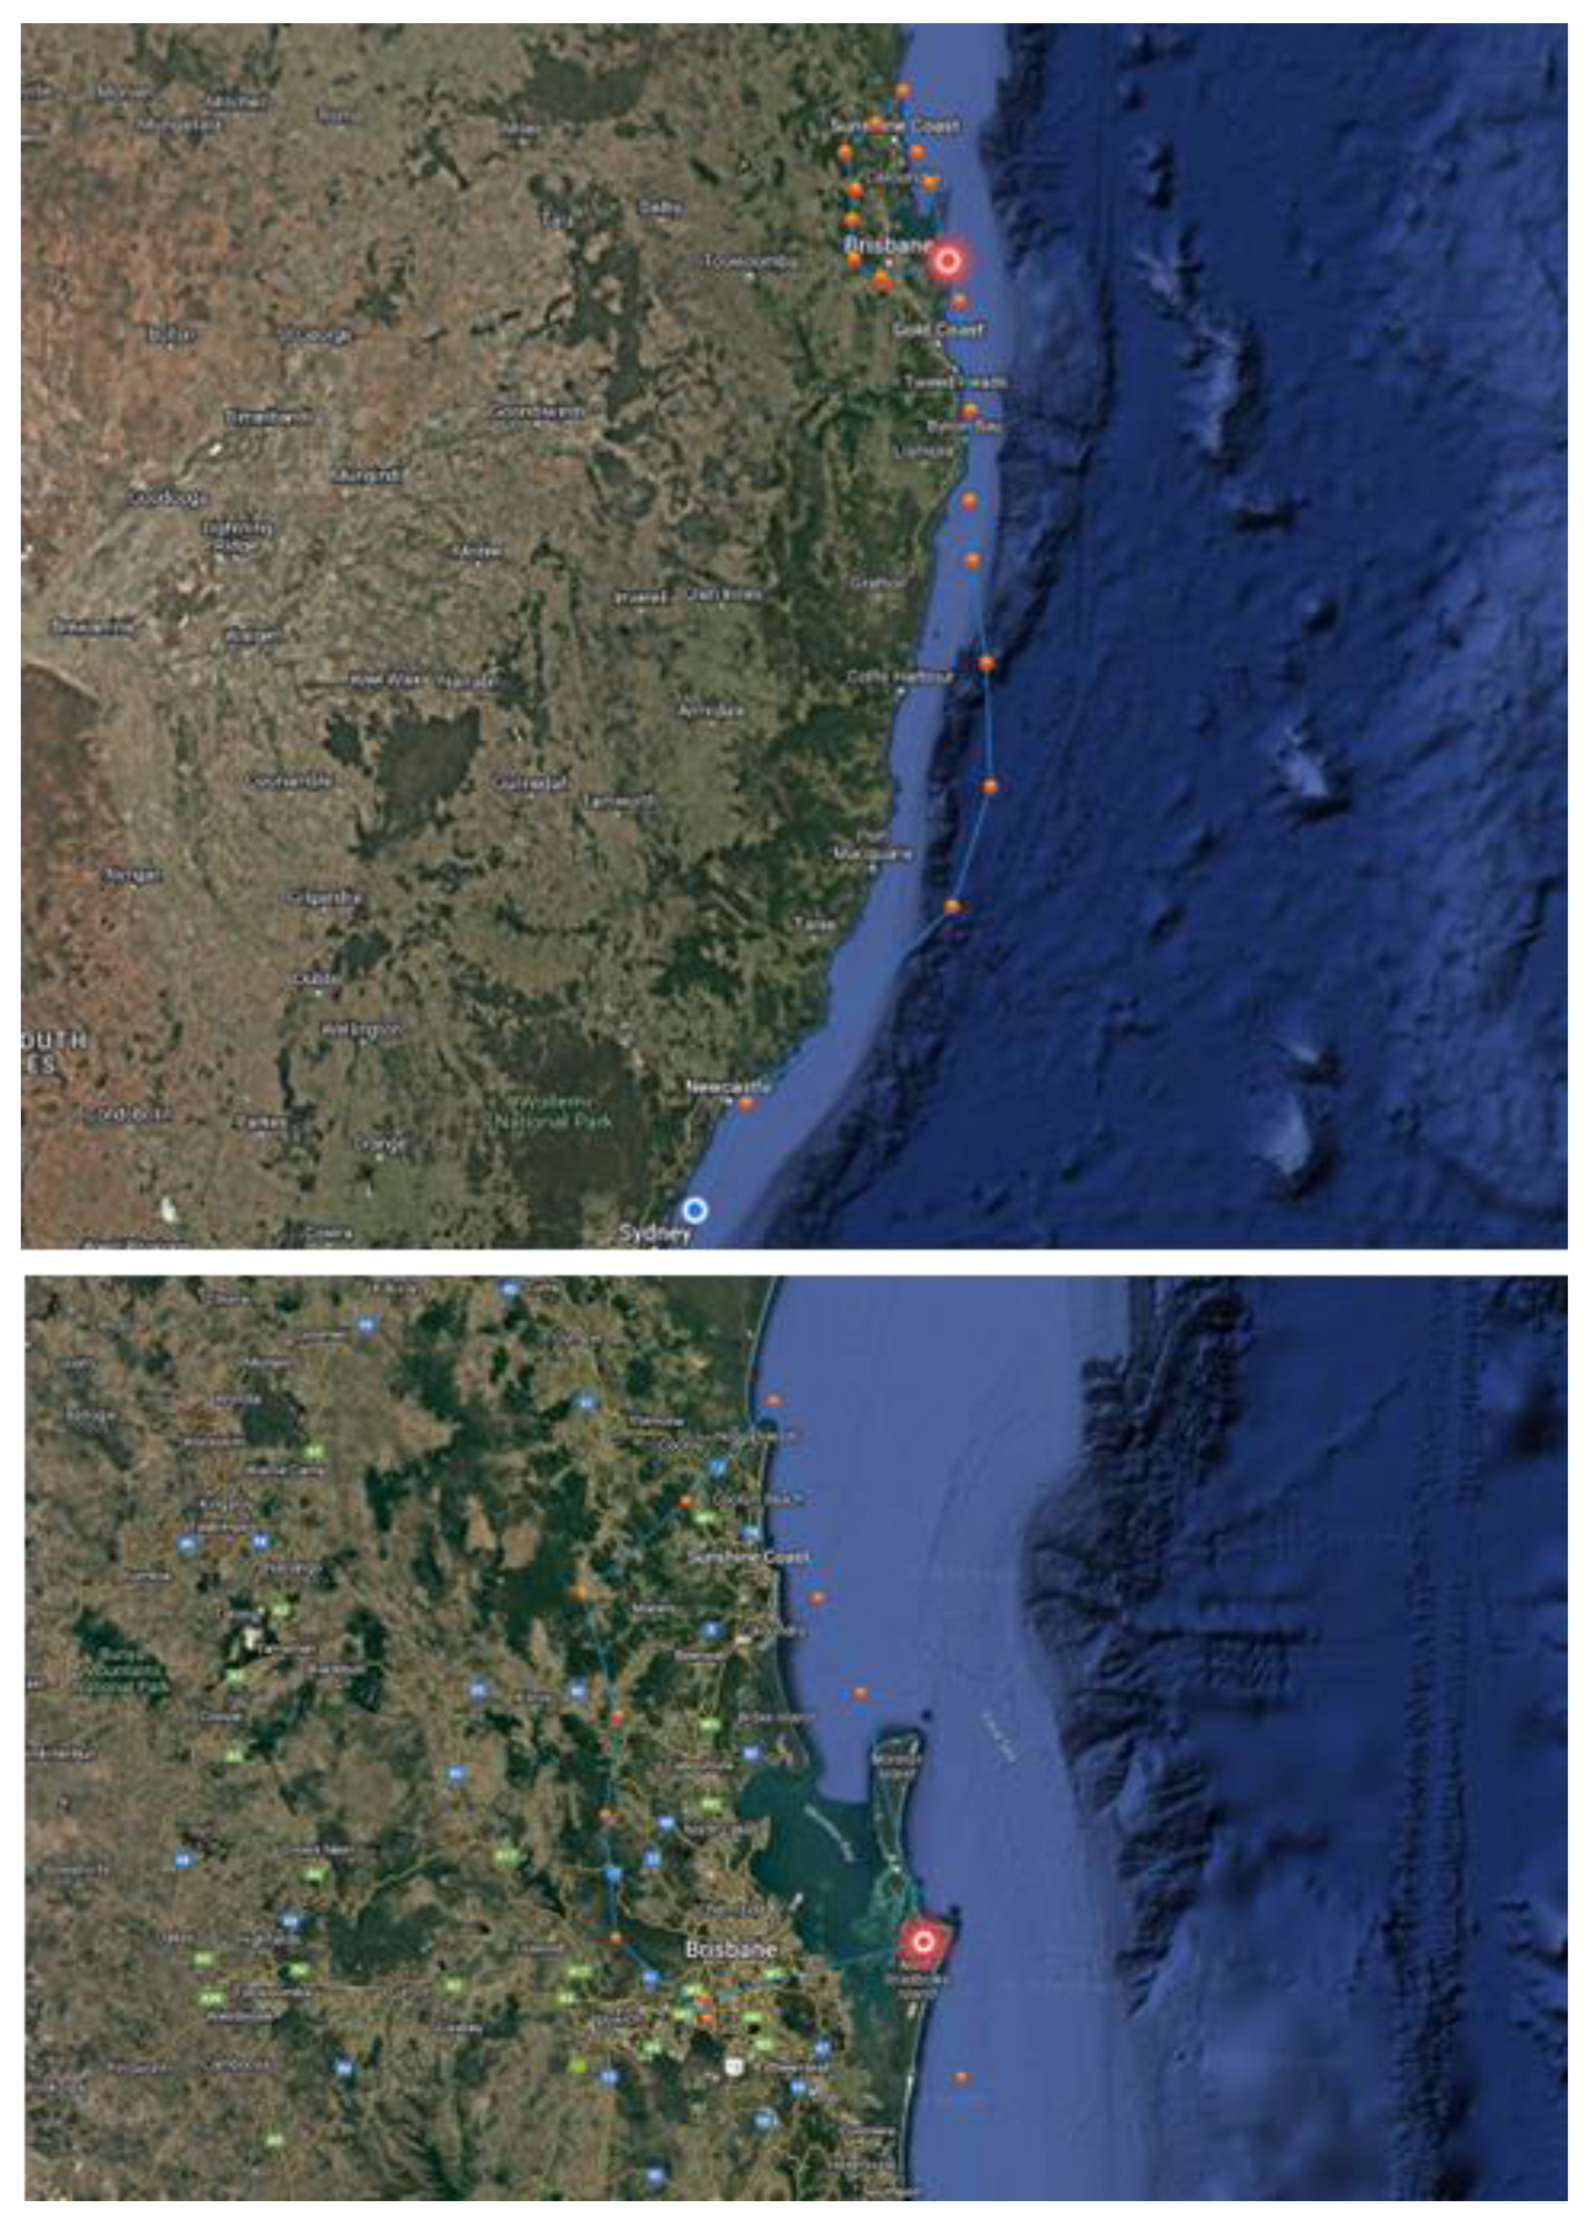
Figure 12.
Third Experiment (Number of Collected Data = 30).
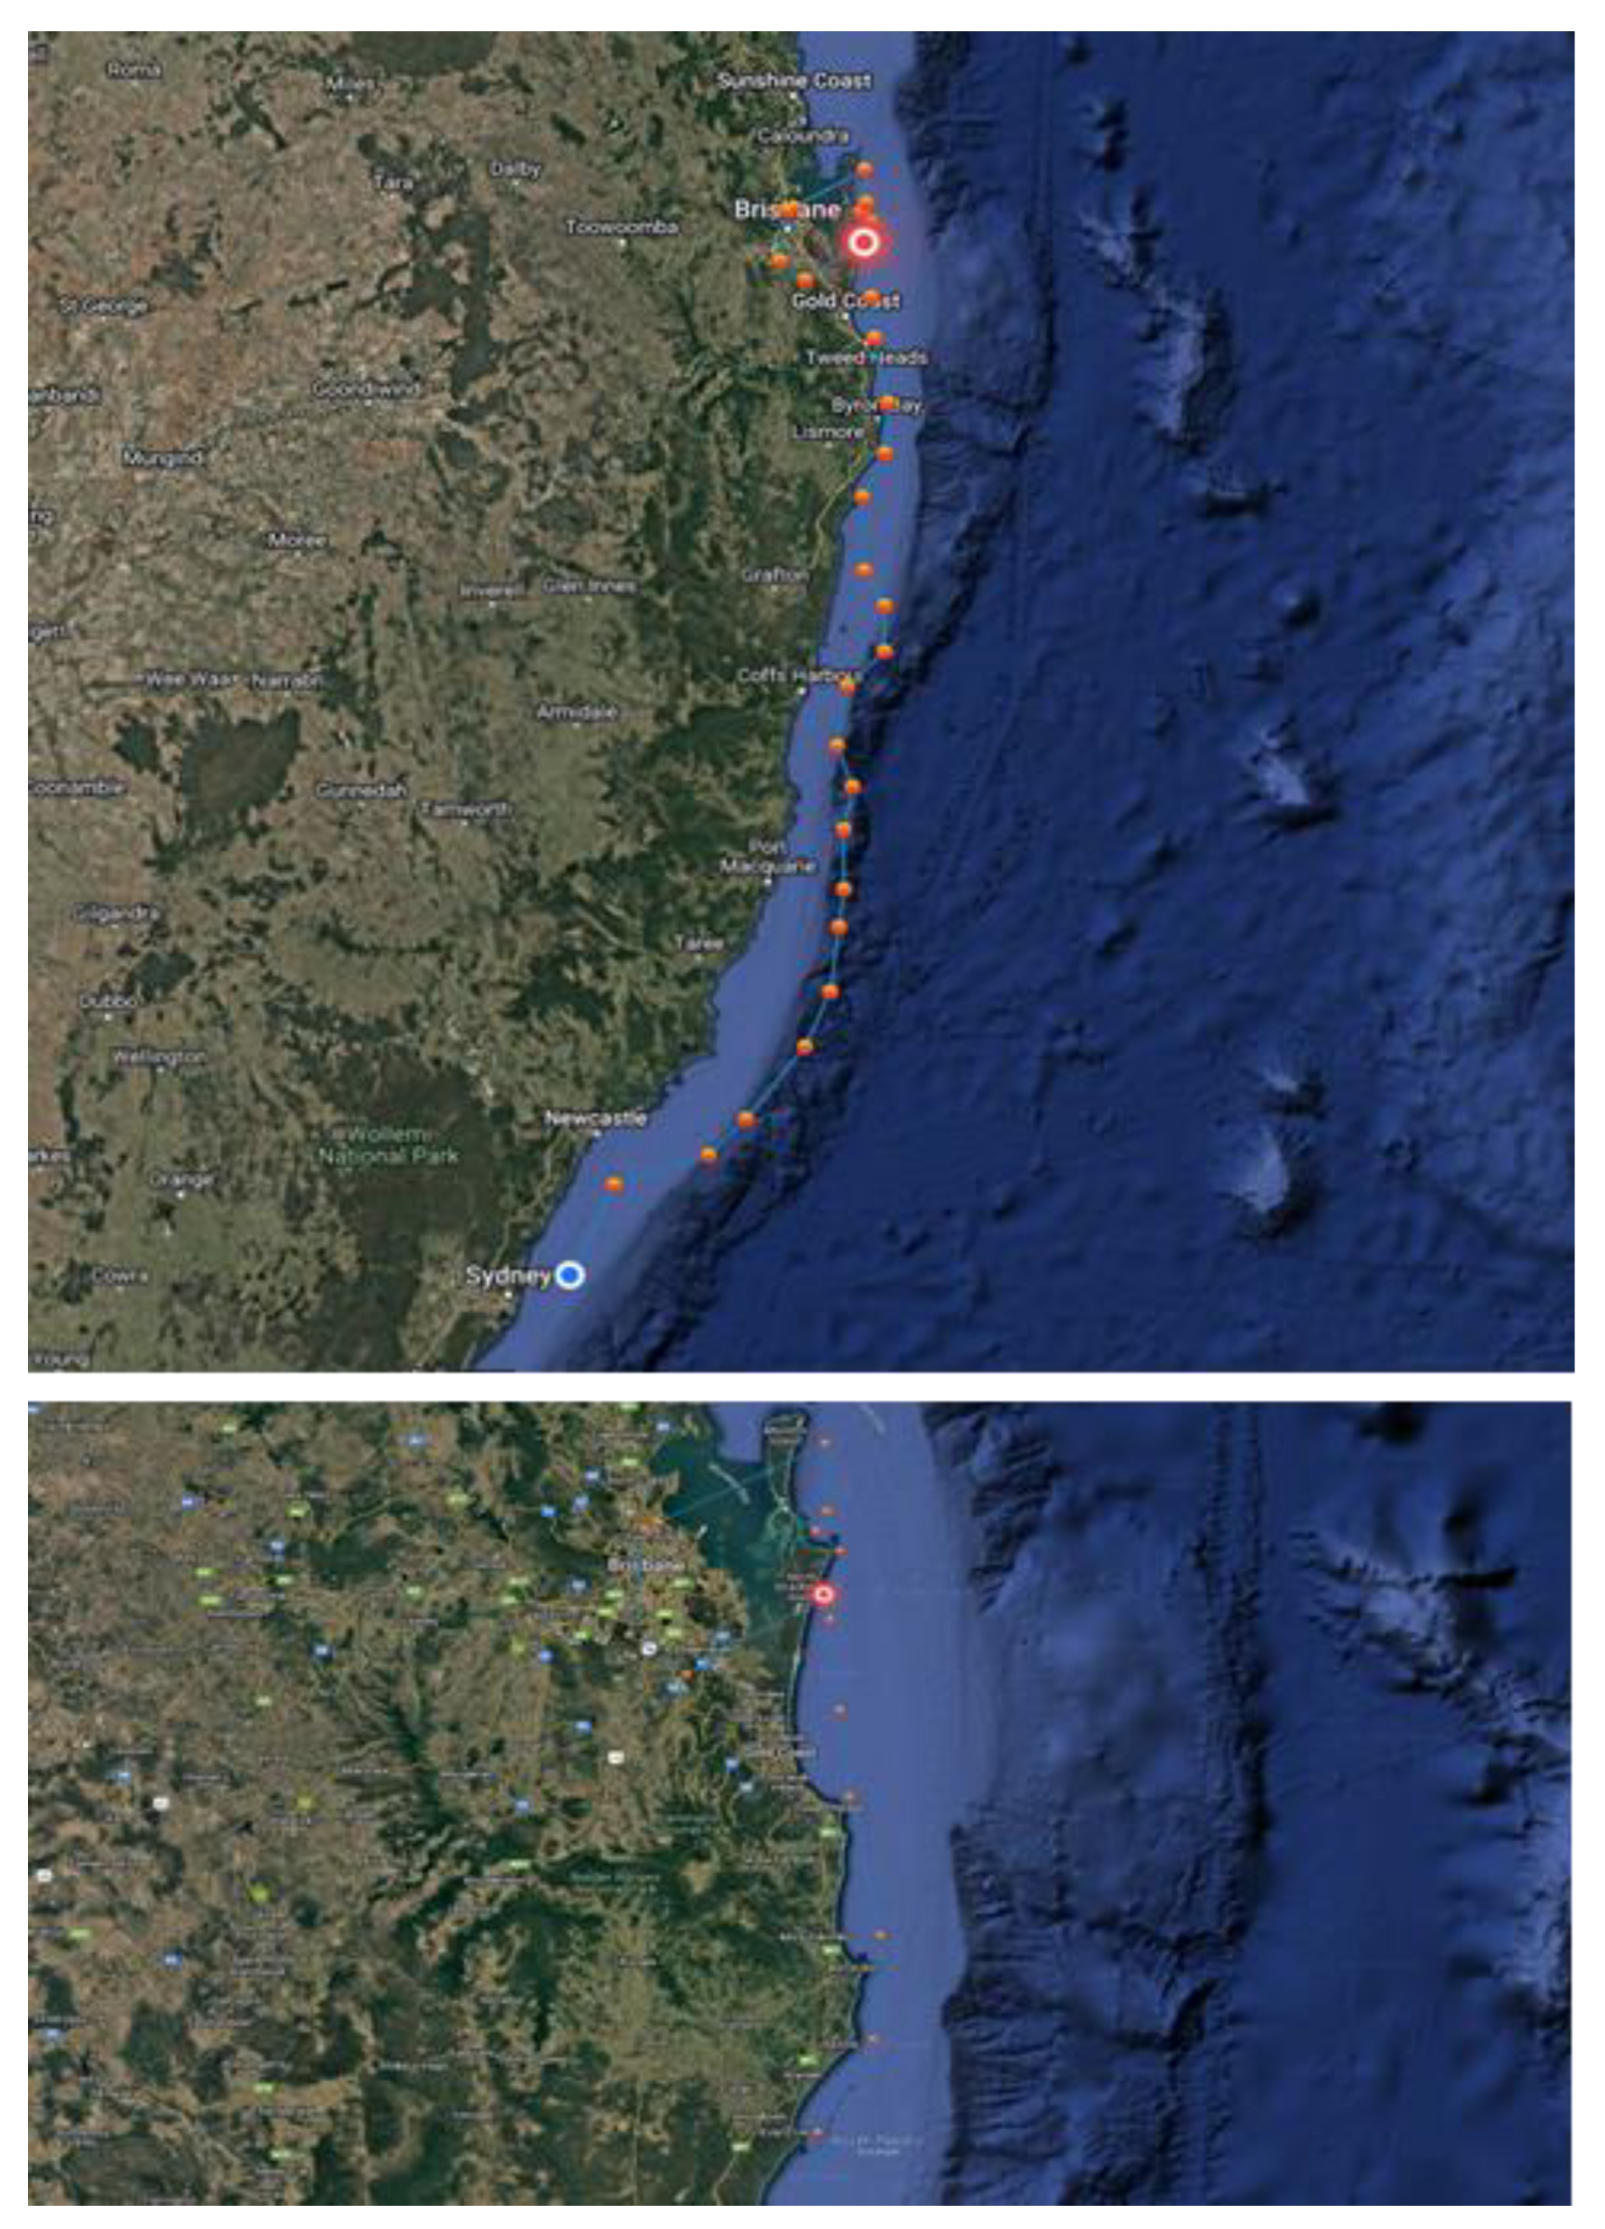

Table 1.
User Input Items and Auto-Calculated Data Items.
| Total Route Distance (m) |
Total time (m) |
Collection Cycle |
Number of Collected Data |
Average Speed |
Distance Between Location (km) |
|---|---|---|---|---|---|
| 993,000 | 150 | 10 | 15 | 0.0199 | 66 |
| 250 | 12 | 20 | 0.0166 | 49 | |
| 400 | 27 | 14 | 0.0074 | 70 |
Table 2.
Example of Reading Angle Value.
| Generated Location | Near-Location of Standard Routes |
Near-Angle Value |
|---|---|---|
| a | A | α2 |
| b | B | α3 |
| c | C | α4 |
| d | D | α5 |
| e | E | αn-1 |
| f | F | αn |
Table 3.
Data for Generating Location Data.
| Total Route Distance (m) |
Total Time (m) |
Collection Cycle |
Number of Collected Data |
Average Speed |
Distance Between Location (km) |
|---|---|---|---|---|---|
| 993,000 | 150 | 15 | 10 | 0.0137 | 99 |
Table 4.
Location Data Information for a Standard Route.
| Latitude | Longitude | Distance of a Standard Route |
|---|---|---|
| 26.7211~34.0274 | 26.7211~34.0274 | 993,000m |
Table 5.
Experimental Data from Emulator.
| Total time (m) |
Collection Cycle |
Number of Collected Data |
Average Speed |
Distance Between Location (km) |
|---|---|---|---|---|
| 150 | 15 | 10 | 0.01327 | 99 |
| 500 | 25 | 20 | 0.00796 | 49 |
| 900 | 30 | 30 | 0.00663 | 33 |
Disclaimer/Publisher’s Note: The statements, opinions and data contained in all publications are solely those of the individual author(s) and contributor(s) and not of MDPI and/or the editor(s). MDPI and/or the editor(s) disclaim responsibility for any injury to people or property resulting from any ideas, methods, instructions or products referred to in the content. |
© 2025 by the authors. Licensee MDPI, Basel, Switzerland. This article is an open access article distributed under the terms and conditions of the Creative Commons Attribution (CC BY) license (https://creativecommons.org/licenses/by/4.0/).
Copyright: This open access article is published under a Creative Commons CC BY 4.0 license, which permit the free download, distribution, and reuse, provided that the author and preprint are cited in any reuse.


