
Submitted:
03 February 2025
Posted:
04 February 2025
You are already at the latest version
Abstract
For developing a type of healthy and functional drink with high fiber and antioxidant properties, three types of dietary fiber (bamboo fiber, citrus fiber, and polydextrose) and two types of carotenoids (lycopene and lutein) were used in the peach nectar-based formulations. Based on the D-optimal mixture design, the ratio of fibers in a constant amount of fiber mixture (6 g) and the ratio of carotenoids in a constant amount of carotenoid mixture (6 mg) were selected as independent variables. 24 formulations were presented by Design Expert software and based on anti-oxidant and physical stability tests, the highest desirability was achieved by the formulation with 100% polydextrose and 100% lycopene (F8 sample) with a desirability of 0.997. This formulation showed 88% stability and 85% DPPH antioxidant activity. In addition to the F8 sample, five other samples were selected for further experiments. In the second stage, different tests including total phenol, total flavonoid, vitamin C, total fiber, minerals and trace elements, antioxidant properties (with three different methods), stability of lycopene and lutein, degradation kinetics of lycopene and lutein, rheology, and sensory evaluation were done on the selected fortified peach nectars. Experiments showed that the type of fiber in the mixture was highly effective on all measured parameters and lycopene had a greater effect on antioxidant properties than lutein.
Keywords:
peach nectar
; antioxidant properties
; lycopene
; lutein
; dieatry fiber
1. Introduction
Functional foods refer to food products that are rich in nutraceuticals and healthy beneficial bioactive compounds that have special effects in preventing diseases or increasing health, in addition to their basic nutritional properties (Sahraee et al., 2022). Fruit and vegetable juice are known as one of the prominent sources of nutraceuticals and dietary phytochemicals and on the other hand, some processing operations reduce the content of dietary fibers and antioxidant capacity of fruit juices. Morales-de la Peña et al., (2016) declared the reduction of bioavailability and amount of some nutrients after pasteurization and sterilization. Therefore, enriching fruit juices with antioxidant bioactive compounds and dietary fibers and producing health-oriented drinks can be a very attractive idea for producers and consumers. Peach nectar is one of the most popular fruit drinks, which has a good ability to become a healthy/functional drink due to its attractive taste, pulpy and cloudy appearance, and reasonable price (Cedeño-Sares et al., 2023). Peaches are rich sources of phytochemicals, such as phenolic compounds, dietary fiber, and carotenoids. To produce peach-based beverages, peaches are initially converted as peach puree or pulp and then diluted to achieve peach juice or nectar (Sinha et al., 2012). The total dietary fiber content of peach fruit juice and nectar, per 100 g, has been reported by USDA, as follows: 15 g in fresh fruit, 0.1 g in juice, and 0.6 g in nectar. Based on the work of Shahidi, (2006), the content of protein, fat, carbohydrate, and total sugars are 0.27, 0.02, 13.92, and 13.32 g and the content of calcium, iron, magnesium, and zinc are 5, 0.19, 4 and 0.08 mg per 100 g of peach nectar. Phenolic acids (e.g. chlorogenic acid), flavonoids (e.g. catechins and epicatechins), carotenoids (e.g. β carotene, βcryptoxanthin, α carotene, lutein, and zeaxanthin), anthocyanins, vitamin C and E are major bioactive and antioxidant components in peach juice (Sattar et al., 2020; O'Shea et al., 2012). Degradation of bioactive compounds due to oxidation can occur during peach processing and fruit juice production. Lavelli et al. (2009) reported a 66% decrease in total carotenoid after pasteurization of peach. Evrendilek et al., (2016), evaluated the effect of pulse electric field treatment on peach nectar’s aroma compounds, which mostly led to significantly enhanced sensory properties.
Lutein is a type of carotenoid known as a xanthophyll, which is a naturally occurring pigment found in some fruits such as peach and green leafy vegetables such as spinach and kale (Bulda et al., 2008). It's an antioxidant that has several beneficial effects on the human body, particularly for eye health. The daily recommended intake for lutein has not been officially established, but various studies suggest that consuming between 6 to 20 mg of lutein per day can be beneficial for health, particularly for eye health (Jalali et al., 2018). For example, a dietary intake of 10 mg of lutein daily is often recommended for eye health, and this amount has been associated with a decreased risk of age-related macular degeneration and cataracts (Buscemi et al., 2018).
Lycopene is a linear, unsaturated hydrocarbon and a type of carotenoid and is responsible for the red color of some fruits like tomatoes, watermelons, apricots, red oranges, rosehip, guava, papaya, and sweet red peppers (Khamis et al., 2017). It has high antioxidant activity and scavenges reactive oxygen species (ROS) /singlet oxygen which helps protect the body against oxidative stress and retard aging and degenerative diseases (Braniša, 2021; Arballo et al., 2021). The other beneficial properties of lycopene include helping to maintain heart health with lower the risk of heart disease by reducing free-radical damage and "bad" LDL cholesterol levels while increasing "good" HDL cholesterol, preventing prostate cancer, helping to maintain bone health, and sun protection of skin (Buscemi et al., 2018; Imran et al., 2020). While there is no formally recommended daily intake for lycopene, studies suggest that intakes between 8–21 mg per day are beneficial some experts recommend getting at least 10 mg of lycopene per day as part of a healthy diet (Camara et al., 2013).
Dietary fibers are classified into two groups soluble (high fermentable in colon) and insoluble (low fermentable in colon) fibers based on solubility in water. Both types of fiber are important for overall health, and most plant-based foods contain a mix of both. It's recommended to get a balance of soluble and insoluble fiber from a variety of food sources. Cellulose, hemicellulose, and lignin (a non-polysaccharide compound) that are present in barley, bamboo, and wheat fiber are classified as non-soluble fibers. While pectin, polydextrose, gums, and poly-fructose (inulin) are in the soluble category. Insoluble fibers increase stool bulk and reduce the transit time of food residues through the intestinal tract which in turn reduces constipation, the risk of diverticular disease, colon cancer, and some other digestive disorders (Menis-Henrique et al, 2020). On the other hand, soluble fibers play a major role in reducing cholesterol, controlling blood sugar levels, maintaining fullness and weight management, gut health (due to their prebiotic effects), and preventing some cardiovascular diseases. Recommended daily amounts of fiber for men are 30-38 grams and for women, 21-25 grams (Mustafa and Baurhoo, 2016). Dietary fibers have a low glycemic index and reduce the glycemic index of foods and therefore can be used in diets limited in sugar.
The objective of the current research was to develop and optimize the formulation of a high-fiber and high-antioxidant fruity functional drink with suitable sensory properties based on a mixture design. Because the addition of dietary fibers increases the turbidity, peach nectar, which is considered a naturally turbid fruity drink, was found suitable for this aim. Lycopene and lutein as carotenoid pigments with high antioxidant properties and three types of dietary fibers including bamboo fiber, orange fiber, and polydextros were used in the fortification of peach nectar.
2. Materials & Methods
2.1. Chemicals
Peach nectar was purchased from Takdaneh Co., Tabriz, Iran. Bamboo and citrus fibers were purchased from Ingredion, USA, and Fiberstar, USA respectively. Polydextrose was purchased from Sigma-Aldrich, Oakville, ON, Canada. Lycopene was purchased from Proquimac, Spain. Lutein was purchased from CHR HANSEN, Denmark. All chemicals applied in this study were analytical grade and were provided by Sigma-Aldrich, Oakville, ON, Canada.
2.2. Preparation of Fortified Peach Nectar
According to the literature review, the amount of total fibers (Bamboo and citrus fibers and polydextrose) carotenoids (lycopene and lutein) were selected as 6 g and 6 mg per 250 cc peach nectar, respectively (Sahraee et al., 2022). Design expert software was used to obtain 24 formulations (Table 1). For better solubility of constitutes, they were sonicated at 40 Khz for 20 min. After that, all formulations were pasteurized 93±3 for 3 min. They were cooled and stored at 4. Formulations were assessed for stability, nutritional quality, and sensory acceptability.
2.3. Physicochemical Characterization
2.3.1. Physical Stability
The physical (colloidal) stability of peach nectar samples was calculated according to (Mirhosseini et al., 2008) with some modifications. For this aim, fortified peach nectar samples were kept gentle for half an hour after preparation to assay the solubility of fibers. The physical stability of each sample was evaluated according to Eq (1):
Where ht and hp are the heights of a total and precipitated section of peach nectar in a test tube, respectively.
2.3.2. Mineral Content Determination
The metals/minerals contents of each formulation were analyzed. Cu, Zn, As, Cd Hg, and Pb were analyzed by inductively coupled plasma mass spectrometry (ICP-MS) while Ca, Fe, Na, and K were analyzed by atomic absorption spectroscopy (AAS) (Cassani et al., 2018). In this study, the wet digestion method was used. Approximately 5 ml of well-mixed formulated juice was transferred to a 100 ml beaker. 5 ml of Nitric acid (65%) was added and covered with a watch glass. The mixture was heated to 95 ºC on a hot plate. Digestion continued till no brown fumes evolved and the solution became clear and colorless. The digested sample is diluted to the known volume and analyzed in ICP-MS/AAS.
2.3.3. Physicochemical Properties (p H, Total Soluble Solids, and Total Acidity)
The pH of functional peach nectar samples was analyzed using a pH meter (Fan Azma Gostar, Iran). A refractometer (handheld type) was used for evaluating the total soluble solids (g/ 100 g) of formulations. The titration method was used to measure the total acidity of the samples (CassaniTomadoni et al., 2018). 5 ml of samples were transferred to a 250 ml beaker and 50 ml of boiled distilled water was mixed with the sample. This solution was titrated by NaOH (0.1 N) up to the pH of 8.2 ± 0.1. Total acidity was calculated according to citric acid (g/ 100 g) using Eq. (2):
Where V (ml) is the volume of NaOH, and S (ml) is the volume of samples.
2.3.4. Formalin Index
Formalin index measurement was conducted according to Ranganna, (1986). This assay is used to determine amino acids in fruit juice. First of all, 35% formaldehyde solution was neutralized, using the titration method with 0.1 N NaOH. 25 ml of each sample, was titrated with 0.1 N NaOH solution until reaching the p H=8.1. 10 ml of neutralized 35% formaldehyde solution was added to it and mixed for one minute. Then, the whole solution was titrated with 0.1 N NaOH. Formalin index was calculated by Eq. (3):
Where, V, is the volume of consumed NaOH (ml), N, is the normality of NaOH, and, V0, is the volume of sample (ml).
2.3.5. Total Phenolic Content (TP)
Total phenolic content was determined according to the method of Cassani et al., (2018). Using the Folin-Ciocalteu reagent (FCR). The calibration curve was prepared using gallic acid (0-100 µg/ ml). 1 ml of diluted samples (1/10) was mixed with 5 ml of FCR (10%). A blank sample was obtained using 1 ml of gallic acid with 5 ml of FCR (10%). Then 4 ml of saturated sodium carbonate was added to the solution and kept at room temperature for 2 hours. The absorbance of samples was evaluated at 765 nm using a UV-Vis spectrophotometer (UV-1700, Shimadzu, Japan), and total phenolic content was estimated as mg of gallic acid equivalent (GAE) per 100 ml of sample.
2.3.6. Total Flavonoid Content
Total flavonoid content was evaluated according to (Cassani et al., 2018) with some modifications. 1 ml of diluted samples (1/10) was mixed with 3 ml methanol 95%, 0.2 ml aluminum chloride 10%, and 0.2 ml 1 M acetate potassium. The volume of solution reached 10 ml using methanol 80%. After stirring the mixture, and maintaining it at room temperature for 1 hour, the absorbance was determined at 415 nm using a UV-Vis spectrophotometer. Total flavonoid content was stated as mg of quercetin equivalent/ 100 ml of the formulation according to the standard curve prepared in the range of 0.05-1.2 g/L.
2.3.7. Vitamin C Content
The vitamin C content of peach nectar formulations was measured according to the method reported by Tareen et al. (2015). In this method, 5 ml of samples were mixed with 45 ml distilled water and transferred to a 125 ml Erlenmeyer flask. Then, mixed with 10 drops of indicator (1 % starch solution). Iodine solution (0.005 mol/L) was used to titrate this solution until the blue-black color appeared in solution. The iodine solution preparation was as following method: 2 g of potassium iodide (KI) was dissolved in 100 ml of distilled water. Then, 1.3 g of iodine was added to the solution. Finally, the solution was diluted to 1000 ml with distilled water. Vitamin C concentration was calculated according to Eq. (4):
Where V (ml) is the volume of iodine solution used in the titration.
2.3.8. Fiber Content
The fiber content of optimum samples was conducted according to ISO 5498: 1981. Fortified peach nectar samples, were dried, using a freeze drier (Daneshpazhoohane fajr Co, Iran). 5 g of each dried sample underwent acidic and alkali digestion with sulfuric acid and NaOH solution, respectively. Dried in an oven and then converted to ash. Fiber content was calculated according to Eq. (5):
Where , the weight of the sample (g), , the total weight of the sample and bush after drying (g) and , the total weight of the sample and bush, after converting into ash (g).
2.3.9. Measurement of Lycopene and Lutein Content
Lycopene content measurement was done according to (Khamis et al., 2017) with some modifications. The lycopene standard curve was prepared using a spectrophotometer and the lycopene content of the samples was determined using this curve. Briefly, 0.3 ml of each sample was mixed with 10 ml hexane and 5 ml of 95% ethanol and centrifuged at 2000 rpm for 3 min. The upper phase was measured spectrophotometrically at 472 nm to obtain the concentration of lycopene. Samples were kept at 4 in dark containers and this measurement was conducted for 2 months of storage time.
Lutein content measurement was conducted according to (Jalali Jvan & Abbasi, 2018) with some modifications. The lutein standard curve was prepared using a spectrophotometer and the lutein content of formulations was achieved through this curve. 0.5 ml of each sample was mixed with 10 ml acetone and centrifuged at 2000 rpm for 5 min. The content of lutein was reached by measuring the upper phase at 446 nm using a spectrophotometer. Samples were kept at 4 in dark containers and this assay was conducted for 2 months of storage time.
2.3.10. Lycopene and Lutein Degradation Kinetics
Zero-order reaction, Eq.(6), first-order reaction, Eq.(7), and second-order reaction, Eq.(8) were used to evaluate lycopene and lutein degradation rate during two months of storage time (Liu, Liu, Bi, Cao, Ding, & Peng, (2019)).
Where CA0 is the initial added lycopene amount (μg/100ml), CA is measured lycopene (μg/100ml), K, constant the reaction rate constant, and t is time (week)
2.3.11. Steady Shear Rheology
Steady shear rheology tests were carried out using a Physica MCR301 Rheometer (Anton Paar, Germany) equipped with a couette flow measuring cell (Ref. DG27/T2000/SS). Sample temperature was achieved at 20 ±0.1 °C using a Peltier system and a fluid circulator Viscotherm VT 2 controlled directly from the Physica MCR. After 5 min of thermal stabilization, each sample was analyzed in 15 points, and with 5-second intervals, to achieve shear stress and apparent viscosity at a shear rate of 0 to 50 s-1 (Laux et al., 2013).
2.3.12. Sensory Evaluation
To determine the sensory properties of 6 optimum formulations, 30 ml from each sample were served in transparent plastic cups. Sensory evaluation of the fortified peach samples was done through a 5-point Hedonic scale where 1 equals extremely dislike and 5 equals extremely like (Gunathilake et al., 2013). The panelists consisted of 30 members (semi-trained men and women aged 24 to 34) who evaluated the desirability of taste, color, flavor, mouth feel, concentration, sweetness, and overall acceptability of different formulations.
2.3.13. Turbidity
Optimum formulations were evaluated to determine their turbidity (Bashiri et al., 2020). For this purpose, samples were diluted 1 to 10 with distilled water. Measurement was done using a turbidimeter (portable 2100P, Hach Co., Loveland, CO, USA) with a range of 0–1000 NTU (nephelometric turbidity units). Turbidity standards with a range of 0.5 to 100 NTU were used to calibrate the turbidimeter. Turbidity measurement was done in triplicate and calculated during Eq. (9):
A is NTU calculated in different diluted formulations, B, is the volume of dilution water, mL, and C, is the sample volume taken for dilution, mL.
2.3.14. Color Evaluation
Color measurement of samples was done to determine the effect of each formulation on the final product's color properties. This assay was done using a Hunter lab (CHROMA METER CR-400, Japan). Picture analyzed using Photoshop 8 software. This software provides L, the amount of darkness and lightness (black=0 and white=100), a, the amount of redness, and b, amount of yellowness (Arya, & Shakya, 2021).
2.3.15. Antioxidant Properties
DPPH Radical Scavenging Capacity
The antioxidant activity of formulations was evaluated through 1,1-diphenyl-2-picrylhydrazyl (DPPH) radical scavenging activity applying the method of Viacava & Roura (2015) with some modification. 0.1 ml of samples (1/10 dilution) were mixed with 3.9 ml of DPPH solution (100 µM). It was shaken vigorously and kept in a dark place at room temperature for 30 min. Antioxidant activity of the samples was reported as the DPPH radical's inhibition percentage according to Eq. (10):
Where Ac is the absorbance of the control (methanol and DPPH solution) and As is theabsorbance of the formulation (sample and DPPH solution)
ABTS Assay/ TEAC (Trolox Equivalent Antioxidant Capacity)
ABTS (2,2'-azino-bis (3-ethylbenzothiazolline-6-sulfonic acid) radical cation scavenging activity) assay was done on optimum formulations according to Kwaw et al., (2018) with some modifications. Briefly, a 7 m M ABTS solution was mixed with a 2.45 m M K2S2O8 (potassium persulfate) in a 1:1 (v:v) ratio and left in the dark for 16 hours to react. Then this mixture was diluted with phosphate-buffered saline until reaching an absorbance of 0.70±0.02 at 734 nm in a spectrophotometer. 20 microliter of each well centrifuged and the samples' upper phase was mixed with diluted ABTS and K2S2O8 solution. After vigorous vortex and spending 6 minutes in the dark place, the absorbance of each sample was read at 734 nm and the ABTS percentage was calculated during Eq.(11) :
Eq. (11): ABTS%= (Acontrol – Asample)/Acontrol × 100
Where, Acontrol, is the absorbance of ABTS and K2S2O8 solution without the addition of sample, and Asample, is the absorbance of ABTS and K2S2O8 solution with added sample.
TEAC value is m M concentration of TOROLOX which equals 1 m M of the sample's antioxidant capacity. This value is based on an antioxidant’s ability to scavenge ABTS+ radical cation (Tyrakowska et al., 1999). TEAC value is the ratio between the slope of the ABTS scavenging activity of the analyzed sample’s curve and the slope of the ABTS scavenging activity of the Torolox (antioxidant standard) curve.
Reducing Power Capacity
To evaluate of antioxidant properties of optimum formulations reducing power capacity (RP-CA) assay was used according to the method described by Kwaw, et al.,(2018) with some modifications. 1 ml of each sample (1:100 diluted), was mixed with 0.05 ml of HCL (0.01 M), 0.4 ml of potassium ferricyanide (K₃Fe(CN)₆ (0.02 M), 0.4 ml of ferric chloride (FeCl3) 0.02 M and 0.7 ml of distilled water. The mixture was incubated at 37 for half an hour. After the reaction, the mixture is centrifuged to remove any precipitates. Absorbance was read at 720 nm in a spectrophotometer. The RP-CA value of optimum formulations was expressed as m M of ascorbic acid.
2.4. Experimental Design and Statistical Analysis
A D-optimal mixture design with two mixture factors (independent variables) was used for the development of the carotenoids/fibers-fortified peach nectars. The first factor was the different ratios of two carotenoids, i.e. lycopene and lutein with a total carotenoid of 6 mg / 250 ml peach nectar. The second factor was the different ratios of three dietary fibers (bamboo fiber, citrus fiber, and polydextrose) with a total fiber of 6 g / 250 ml peach nectar. Design Expert software (Version 11.0.3.0, State-Ease Inc., Minneapolis, USA) was used for the experimental design and statistical analysis. The software presented 20 formulations with 4 replicates based on mixture design (Table 1). DPPH inhibition activity and physical stability (against sedimentation) were selected as responses (dependent variables). The data of responses were analyzed by Design Expert statistical software for obtaining the regression model with the high fitting degree and selecting the optimum formulations. The following equation was fitted to the data:
Where Y is a response variable, k is the number of variables, Xi and Xj are independent variables in coded units, βij, βii, and βi are the measures of the Xi, Xj, , and XiXj of linear, quadratic, and interaction effects, respectively, and β0 is a constant coefficient.
Further experiments were done on the optimum formulations (6 samples). The resulting data were analyzed by analysis of variance (ANOVA) and significant differences (p ≤ 0.05) were determined by Duncan's multiple range tests using SPSS software (Version 22, SPSS Inc., Chicago, IL, USA).
3. Results and Discussion
3.1. D-Optimal Mixture Optimization
A D-optimal mixture design was utilized to obtain the optimum formulation based on two mixture variables (i.e., polydextrose/orange fiber/bamboo fiber and lutein/lycopene). According to this experimental design, the effects of fibers ratio (at a constant concentration of 6 g / 250 ml peach nectar) and carotenoids (at a constant concentration of 6 mg / 250 ml peach nectar) on dependent variables (physical stability and DPPH antioxidant inhibitory) were analyzed (Table 1 and Figure 1). The amounts of statistical parameters, calculated by design-expert software, are presented in Table 2 and Table 3. Due to the significance of suggested models (Fvalue= 2203.4 and 725.32), non-significance of the lack of fit (L.F= 0.499 and 0.3), the adequacy of accuracy (>4), and a high coefficient of determination (R2= 0.941 and 0.911), it could be claimed that the fitted models are valid and accurate to predict physical stability and DPPH inhibitory (the dependent variables.) The physical stability data (%), and DPPH antioxidant inhibitory (%) showed the highest degree of fit in the linear and mean models, respectively (Table 2). According to the table of ANOVA, the interaction and quadratic coefficients for stability and also linear and quadratic coefficients for DPPH antioxidant assay were non-significant and so these factors were deleted. The final fitted equations with the significance coefficients were:
Where Y1 and Y2 are stability and DPPH antioxidant inhibitory, respectively.
Eq. (14): Y1= 87.32X1 + 57.19X2 + 45.71X3
Eq. (15): Y2= 75.44X1X4 + 90.42X1X5 + 53.35 X2X4 + 59.18 X2X5 + 46.06 X3X4 + 46.78 X3X5
The triangle diagram (Figure 1(a)) showed that stability depends on the proportions of polydextrose, orange fiber, and bamboo fibers. A triangle diagram is used in mixture design to represent the relationships between three components of a mixture. This type of diagram is particularly useful for visualizing how different proportions of the components affect the response variable. This type of diagram is essential for optimizing formulations and understanding the interactions between different components in a mixture Increment of polydextrose percentage from 16.66 to 100 %, the stability from 47 to 88%. Different peach nectar samples had stability from 42 to 88%. Adding bamboo fiber resulted in a severe decrement in stability at higher concentrations. Stability results are reasonable due to the high solubility of polydextrose and high insolubility of bamboo fiber in water. According to (Figure 1(a)), the higher ratio of polydextrose to citrus and bamboo fibers increased the physical stability of peach nectar. The proportions of carotenoids were not significantly effective on physical stability.
Fiber and carotenoid content had an interaction effect on the response of the DPPH antioxidant inhibitory test. DPPH antioxidant inhibitory ranged from 42 to 85% and increased with increasing the percentage of polydextrose (Figure 1(b)). It can be understood from the results that the radical scavenging activity of juices was more dependent on polydextrose portion than citrus fiber and bamboo fiber amounts and likewise physical stability, the highest DDPH inhibitory was achieved at a higher ratio of polydextrose to citrus and bamboo fibers. As well as lycopene had a greater effect than lutein on this property (Figure 1(c)). Lines in the counter diagram, connect points of equal response value, making it easier to see the regions of optimal response and the interaction effects between the two components. Considering this contour diagram, at the highest ratio of lycopene to lutein, and polydextrose to citrus fiber, the highest amount of DPPH inhibitory was achieved.
Zong et al., (2021), reported an increment of DDPH antioxidant activity, after polydextrose addition. Antioxidant inhibitory activity depends on different parameters. One of them is the free OH group. Bamboo shoots contain phytosterol, and it could be claimed that bamboo fibers contain phytosterol too. Phytosterols with a free OH group could show antioxidant activity (Chongtham et al., (2011)). Citrus fiber is a rich source of pectin. Pectin has free OH groups and could be considered one of the effective antioxidant parts of the formulation. (Lundberg, et al., (2014)). Carotenoids act as singlet quenchers and provide antioxidant activity. Also act as other antioxidants' stabilizers (Gruenwald, 2009). Cassani et al., (2018), prepared fiber-enriched strawberry juice and evaluated their DPPH antioxidant properties. Lakzadeh et al., (2019), fortified pomegranate juice with inulin. DPPH assay showed that fortified juice samples, especially the one with 5% inulin, could retain their antioxidant properties more than the control sample.
To overall optimization of fortified peach nectar formulation, the goal of higher stability and DPPH antioxidant activity were considered, and evaluation of the results was done according to desirability function, where higher than 0.7 is a sign of optimum conditions. The highest desirability was achieved by the formulation with 100% polydextrose and 100% lycopene (F8) with a desirability of 0.997. This formulation showed 88% of stability and 85% of DPPH antioxidant activity. To evaluate the validity of regression models, a comparison of actual data with the predicted values from the model took place, which was -0.7 for stability and -6.37 for DPPH antioxidant activity. F2, F9, F11, F17, and F18 were selected in addition to F8 for further analysis, due to their high stability and/or DPPH antioxidant activity.
3.2. Mineral and Trace Elements Measurement
The mineral and trace element content of the selected functional peach nectar has been shown in Table 4. F17 sample (containing 1g bamboo fiber, 4 g orange peel fiber, and 1g polydextrose) showed the highest calcium, magnesium (Mg), and copper (Cu) content, and F18 (containing 6 g orange fibers) had the highest sodium (Na) and zinc (Zn). None of the samples contained some trace elements including arsenic (As), cadmium (Cd), chromium (Cr), mercury (Hg), nickel (Ni), lead (Pb), and selenium (Se).
The two types of trace elements in biochemistry are classed as essential or non-essential. Silver (Ag), cadmium (Cd), mercury (Hg), and lead (Pb) are non-essential trace elements. They have no known biological function in mammals, with toxic effects even at low concentrations.
Chongtham et al., (2011), declared that bamboo shoots (source of bamboo fiber) have a high amount of mineral content such as K, P, Na, Mg, Ca, and Fe. According to a report by Czech et al. (2020) citrus fruits contain minerals such as potassium, iron, zinc, and copper.
3.3. Physicochemical Properties of Fortified Peach Nectars
The physicochemical properties including Brix, acidity, pH, and formalin index were analyzed in 6 optimum fortified drinks and control one (without adding fibers and carotenoids) (Table 5). Brix degree shows the total soluble solids of fruit juices including sugars (sucrose, glucose, and fructose) as well as other soluble substances like organic acids. The control sample and F8 showed the lowest (12.20) and highest (14.53) Brix values, respectively which could be attributed to the high solubility of polydextrose and its role in increasing Brix.
The F2 sample showed the highest (0.45 g/100 ml) acidity values and F8 had significantly lower acidity than the F2 and F18 samples. According to Nagpal et al. (2012), dietary fibers can increase the acidity of fortified fruit juice. However, there was no significant difference between the pH values of the samples.
The formalin index, also known as the formol number, is a measure of the free amino nitrogen present in food products like fruit juices and nectars. It's used to assess protein quality by indicating the amount of free amino groups that react with formaldehyde during the formol titration. It is an indirect indicator for measuring the percentage of fruit in the juice. There was no significant difference between the formalin index of samples which could be attributed to no considerable change in amino acid /protein contents of samples. In similar work, Hosseini et al (2016) produced synbiotic industrial apple juice and reported that the addition of inulin to apple juice did not have a significant effect on the formalin index. In a research done by Cassani et al. (2018), they reported no significant difference between non-fortified and fortified strawberry juice with inulin, oligofructose, vanillin, and apple fiber in terms of brix and titratable acidity on the first day of production. In the other work, Renuka et al. (2009) produced a functional drink containing fructooligosaccharide based on a blend of ripe pineapple, mango, and orange juice. They reported no significant changes in Brix, titratable acidity, and pH on production day and during storage time. Salinas et al. (2021) fortified apple juice containing dietary fiber and xanthan gum and reported stable p H amounts for both, heat treated and untreated samples.
3.4. Total Phenolic Content (TPC) Analysis
Polyphenols include different secondary metabolites with aromatic rings that have one or more hydroxyl moieties and are the prominent reason for antioxidant properties in fruit and vegetable juices (Han et al., 2007). There is a significant difference in total phenol content (TPC) between the selected fortified samples (Figure 2(a)). The highest TPC was observed in the F9 sample which had a low portion of bamboo (1g/ 250 CC) dietary fibers and a high portion of lycopene (4.5 mg/ 250 CC) and after it, the sample F17 had the second highest amount of phenol content. These could be attributed to various interactions between some of the dietary fiber components (polysaccharides) and some of the phenols in peach nectar. It seems in current research, bamboo fibers had a more negative effect on the phenolic compound content of peach nectar. The interactions between phenolic compounds and dietary fiber ingredients may decrease their bioavailability, thereby affecting the nutritional and antioxidant functional effects of foods and beverages. However, on the other hand, this can have a beneficial effect due to lack of absorption in the small intestine and so transportation to the large intestine where fermentation of fibrous material occurs which in turn helps to maintain the health of the gut. Carotenoids like lycopene and lutein can influence the total phenolic content in fruit juices because these compounds are known for their antioxidant properties and can affect the stability of phenolic compounds during processing and storage. The results of current research showed that lycopene had a greater effect on total phenolic content than lutein.
Consistent with current research, Quirós-Sauceda et al. (2014) reported that the addition of dietary fibers extracted from tropical fruits (including mango, pineapple, papaya, and guava) caused to 5-25% decrease in total phenol content of the same fruit extracts. Tomas et al. (2022) investigated the effect of pectin fiber addition on the total phenolic content of red raspberry puree. They declared that the total phenolic content of raspberry puree decreased with increment of pectin from 2.5 to 5%. On the other hand, Cassani et al.(2018) studied the total phenolic content of enriched strawberry juice with inulin, oligofructose, vanillin, and apple fiber and they reported that only the formulations with vanillin showed significant differences in the non-fortified sample.
3.5. Total Flavonoid Content
The total flavonoid content of all samples is shown in Figure 2(b). Sample F17 (containing 4 g citrus fiber, 1g bamboo fiber, 1g polydextrose, 4.5 mg lutein, and 1.5 mg lycopene) showed the highest flavonoid content. On the other hand, the F2 and F11 samples had the lowest one and had no significant difference from the control sample. Tomas, (2022), showed that an increment of fiber content (pectin) from 2.5 to 5% in red raspberry puree, resulted in decrement in flavonoids such as quercetin and rutin in it. It seems, the effect of dietary fibers on the flavonoid content of fruit juices is complex and depends on multiple factors, including the type of fiber, the processing method, and the specific flavonoids present. The presence of dietary fibers can influence the extraction and stability of flavonoids during juice processing. Dietary fibers may bind to flavonoids, which can affect their bioavailability and antioxidant capacity in the juice. On the other hand, orange dietary fibers contain flavonoids (such as hesperidin and naringenin) and also vitamin C which potentially can increase flavonoid content and stability in the fortified juice (Maqbool, et al. 2023).
3.6. Vitamin C Content
The vitamin C content of the selected fortified peach nectar samples is presented in Figure 3. As shown, the F18 sample (containing 6g orange dietary fiber and 6 mg lutein) had the highest vitamin C content which could be attributed to the presence of vitamin C in orange dietary fiber. Dietary fibers can affect the vitamin C content of fruit juices, primarily through interactions during processing and storage. The presence of dietary fibers may influence the stability and bioavailability of vitamin C. However, the most significant factors affecting vitamin C content in juices are storage conditions and temperature. For instance, vitamin C losses can occur in juices stored at higher temperatures, and the type of packaging can also impact vitamin C stability, with glass containers generally preserving vitamin C better than plastic ones (Feszterová et al., 2023).
3.7. Fiber Content
The fiber content of selected fortified peach nectar has been presented in Figure 4. The F11 sample (containing 6 mg lutein and 6 g bamboo fiber) and the control sample showed the highest and lowest amount of fiber, respectively. This could be attributed to the lower solubility and higher stability of bamboo fiber against high acidity and pasteurization temperature. The formulations containing a high amount of polydextrose showed lower fiber content from samples containing bamboo and orange fiber which could be attributed to the high solubility of polydextrose. Bamboo fiber is a white powder without taste or smell, which is produced through alkaline hydrolysis of bamboo stalks and after chemical purification. It consists of cellulose (70-74%), hemicellulose (12-14%), (10-12%), and other components such as protein, pectin, and wax (2-3%) (Santos et al., 2019; Hakim et al, 2020). Bamboo fiber has been found to have good water retention and swelling capacity (having the ability to absorb water 5 to 6 times its weight), oil holding capacity, glucose adsorption capacity, and glucose retardation index (Chongtham et al., 2011). Among the agricultural products, the waste from orange processing is a rich source of fiber that can be used as dietary fiber in the food industry. This fiber is obtained from the inner part of the orange peel and includes soluble fiber of pectin type (~40%) and insoluble fiber of cellulose and hemicellulose type (~60%). In addition to the soluble and insoluble fiber, orange fiber has a certain amount of protein in its composition, which allows it to be well emulsified with water and fat in food formulations and bioactive compounds like hesperidin, naringenin and vitamin C (Lundberg, 2005; Dello Staffolo et al., 2017). Polydextrose is a synthetic non-digestible, highly branched polysaccharide with a low molecular weight (average degree of polymerization of 12). It mainly consists of D-glucose units with alpha-type linkage (1 to 6) in some parts of which there are bonds with sorbitol and citric acid. Polydextrose is known as a dietary soluble prebiotic fiber and creates a texture and rheology similar to sucrose in food and beverages but with fewer calories (Beristain et al., 2006). It does not have any unpleasant color and taste, masks the off-flavor of beverages caused by high-intensity sweeteners and nutritional supplements, and increases consistency without creating turbidity. It also has excellent solubility and stability in acidic pH and different temperatures (Roger 2014). Polydextrose is classified as a soluble fiber by the US FDA and Health Canada and is often used to increase the dietary fiber content of various foods and beverages, as well as to replace sugar and reduce calories (Naseem, et al., 2023). It also has prebiotic properties, promoting the growth of beneficial gut bacteria. Bamboo fiber and orange juice fiber often contain both soluble and insoluble fibers, which can contribute to a higher overall fiber content (la Peña, et al.,2020). Several factors can influence the fiber content in fortified fruit juice including (1) the type of fiber used (their solubility and stability), (2) processing methods, (3) storage conditions, (4) pH Levels, (5) interactions with other ingredients, and (6 (fortification techniques (Bordenave, et al., 2020). Different types of dietary fibers, such as soluble and insoluble fibers, have varying stability and solubility in juice. The methods used to process the juice, such as pasteurization, can impact the stability and effectiveness of the added fiber. High temperatures might degrade some fibers, reducing their effectiveness. The conditions under which the juice is stored, including temperature and light exposure, can also affect the stability of the fiber. On the other hand, the acidity of the juice can influence the solubility and stability of the fiber. Some fibers are more stable in acidic environments, while others may degrade (Kore et al., 2023). The presence of other ingredients, such as vitamins and minerals, can also interact with the fiber, affecting its stability and functionality. The method used to incorporate the fiber into the juice, whether through direct addition or encapsulation, can also play a role in maintaining its content and effectiveness (Khanpit et al., 2021).
3.8. Lycopene and Lutein Stabilities
Carotenoids have double bonds in their carbon chain so they are sensitive to oxidation and isomerization during storage or processing. Lycopene content and stability (retention) of selected fortified peach nectar during 8-week storage at 25°C have been showed in Figure 5 (a). The F9 sample (containing 4.5 mg lycopene, 1.5 mg lutein, 4 g polydextrose, 1g bamboo fiber, and 1 g citrus fiber) showed the highest amount of lycopene in the first day and during 2 months of storage. This probably relates to the higher solubility of polydextrose which leads to higher protection during pasteurization and storage. The lycopene content of all samples decreased during 2 months of storage. The stability of carotenoids in fruit juices is dependent on different parameters including external factors (such as the intensity of thermal treatment, temperature of storage, presence or absence of light, packaging type, and layers), and internal factors (such as the chemical compositions of the fruit juice, presence of natural antioxidants, pH, concentration of metals, enzymes, and dissolved oxygen) (Provesi et al., 2011). Therefore, controlling these parameters during processing and storage is crucial for maintaining the quality of lycopene-containing juices (Kaddumukasa et al, 2017). The concentration and type of fiber can influence the stability of lycopene in fruit juices. It's important to note that the impact of fiber on lycopene stability can vary greatly depending on the type of fiber, its concentration, and the processing conditions of the juice. For instance, certain fibers may provide a protective effect against lycopene degradation by binding to it and preventing oxidation, while others might not offer the same level of protection (Srivastava et al.,2023). The interaction between the fiber and lycopene can affect not only the stability but also the bioavailability of lycopene, which is crucial for its health benefits. Therefore, when developing fortified fruit juices or studying the stability of nutrients like lycopene, the choice and concentration of dietary fibers must be carefully considered to ensure the desired nutritional and stability outcomes (Provesi et al., 2011; Perkins-Veazie et al., 2001). Pasupuleti & Kulkarni (2014) prepared the lycopene-enriched guava beverage by incorporating tomato puree into guava pulp, which improved the sensory and nutritional quality of the beverage. They reported that the guava beverage containing 6% tomato puree had acceptable color, flavor, and overall quality.
Lutein content and stability of the selected fortified peach nectar have been measured during 8-week storage at 25°C (Figure 5 (b)). The samples of F11 (containing 6 mg lutein and 6 g bamboo fiber) showed the highest amount of lutein on the first day and during 6 weeks of storage, however, in the 8th week, F2 (containing 4.5 mg lutein, 1.5 mg lycopene, 4 g polydextrose, 1g bamboo fiber, and 1 g citrus fiber) showed the highest one. The results showed the lutein content of all samples decreased during 2 months of storage. Lutein is a sensitive compound that can be affected by various factors, including the composition of the juice and interactions between ingredients such as dietary fibers and natural antioxidants, temperature (especially higher than 50 °C), light (especially blue light in the range of 450–485 nm), oxygen (so, need to high oxygen barrier packaging), and pH (especially in acidic conditions i.e pH below 4) (Bhat et al., 2024). These factors can influence the rate at which lutein degrades, affecting its color, bioavailability, and nutritional value. They are also critical when considering the processing and storage conditions for lutein-enriched products to ensure maximum retention of the nutrient's beneficial properties. Mesnier, et al. (2014) fortified a lemonade-type beverage with the emulsion of algal-extracted mixed carotenoid and evaluated the effect of ascorbic acid and rosemary extract on the preservation of carotenoids against light and heat. They reported that ascorbic acid provides good protection against sunlight, while rosemary extract preserves carotenoids against both sunlight and heat.
3.9. Lycopene and Lutein Degradation Kinetics
Determining the degradation kinetics of carotenoids in foods can be useful for several reasons: (1) preserving their nutritional quality during processing and storage (Kardile et al., 2020); (2) predicting the shelf life of carotenoid-rich foods and optimizing storage conditions (Sun et al., 2020); (3) development of new functional and healthy food products with enhanced stability and quality (Lavelli, and Sereikaite, 2022).; (4) maintaining consistent product quality (quality control), which is essential for consumer satisfaction and regulation (Sun et al., 2020); (5) maintaining the visual appeal (color and appearance) of food products because carotenoids contribute to the color of many fruits and vegetables based food and beverages (Kardile et al., 2020).
For studying of degradation kinetics of lycopene in the selected peach nectar samples during 8 weeks of storage, the data of lycopene retention over time were fitted in zero, first, and second-order models (Figure 6). These models help in predicting the stability and shelf life of lycopene-rich beverages under various conditions. The kinetic parameters including coefficient of determination (R2) and rate constants (k0, k1, and k2) for all models are presented in Table 6. The first-order model had the highest R2 value in all formulations and R2> 0.94 showed a high fitting degree. The k1 values ranged from 0.112 to 0.212 day-1 and the highest degradation rate constant was obtained for the F9 sample. This model is often used for carotenoid degradation and assumes that the rate of degradation is proportional to the concentration of the carotenoid. The first-order reaction has been found to fit well for many deterioration reactions in food and beverages (especially for thermal degradation). In the current research, the zero-order model also showed relatively good fitting accuracy (R2>0.9) and the k0 value ranged from 17.23 to 75.4 mg.100 ml -1.day-1. This model assumes that the rate of degradation is constant and is independent of the concentration of the active compounds. It is often used when the degradation rate is influenced by external factors such as light or oxygen. The second-order model did not show sufficient goodness of fit and R2<0.79.
In the selected peach nectar samples, similar to lycopene, degradation kinetics data of lutein during 8 weeks of storage were fitted in zero, first, and second-order models. Both the first-order and zero-order models showed a high R2 value (R2>0.9) in all formulations (Table 6). In both models, the highest R2 values were obtained in F19 samples (0.99 and 0.97). The k1 values ranged from 0.141 to 0.216 day-1 and the k0 value ranged from 10.91 to 67.69mg.100 ml -1.day-1. The highest k1 and k0 values are obtained for the F18 and F17 samples, respectively. These values showed lutein tends to be more stable compared to lycopene. The second-order model showed a low fitting degree and R2<0.76. High fitting accuracy for both first-order and zero-order models probably would be due to several reasons: (1) complex mechanisms of reaction, as lutein degradation might involve multiple steps or pathways, some of which might follow first-order kinetics while others follow zero-order kinetics. The overall observed degradation could then fit both models reasonably well (Li et al., 2014); (2) fitting with the limited data range as, if the data range is limited, both models might appear to fit well. For example, in the initial stages of degradation, the concentration changes might not be significant enough to distinguish between the two models (Henrya et al., 1998); (3) high measurement accuracy as, high precision in measurements can sometimes lead to high R² values for multiple models. This doesn't necessarily mean both models are equally valid but rather that the data is very consistent (Henrya et al., 1998); (4) experimental conditions as, the specific conditions under which the degradation was studied (e.g., temperature, light exposure, presence of oxygen) can influence the reaction kinetics. Sometimes, under certain conditions, both models can fit the data well (Li et al., 2014). Liu, et al., (2019) studied carotenoid degradation kinetics in carrot juice, during storage time by zero and first-order reaction models. They reported that the first-order reaction model had better fitting than the zero-order one. Xiao et al. (2018), investigated the degradation kinetics of carotenoids in a model system. Zero, first and second-order reaction models were utilized for this evaluation. They reported the first-order model as the best degradation kinetic model.
3.10. Steady Shear Rheological Properties
The steady shear rheological properties of the selected fortified peach nectar were measured at a shear rate of 0 to 50 s-1. All samples showed non-Newtonian, time-independent, and shear thinning (pseudo-plastic) with yield stress rheological behavior (Figure 7(a)).
The F17 sample showed the highest amount of yield stress and apparent viscosity at all shear rate ranges which could be attributed to the presence of a high amount of soluble fiber (Figure 7 (b)). Citrus fibers constitute from pectin hydrocolloid and their chains have a high ability to entangle and form a network within the juice, making it thicker and more gel-like which in turn increases consistency and yield stress of solutions (Salehi 2020). Soluble dietary fibers also can help stabilize fruit juice by preventing the separation of pulp and liquid. This is particularly important for juices with high pulp content. In contrast, the samples containing a high amount of polydextrose (F18 and F8 samples) showed low yield stress and apparent viscosity which could be attributed to the low molecular weight and low polymerization degree of this polysaccharide.
Shear stress - Shear rate data of samples were fitted in the Power law model and model parameters including coefficient of consistency (K), flow index, and coefficient of determination (R2) were calculated (Table 7). F17 and F8 samples showed the highest and lowest K, respectively. Sample F11 (containing 6 g bamboo fiber) had the lowest flow index (0.36), indicating higher shear thinning behavior and F18 showed the highest flow index (0.68), indicating lower shear thinning property. In other research work on some fruit juices and fiber-enriched beverages, shear thinning rheology has been reported. Xiao et al., (2018) used the Hershel-Bulkley model to evaluate the rheological properties of carrot juice. They reported that the flow index value varied from 0.39 to 0.89 (indicating pseudo-plastic behavior of carrot juice) and heat treatment caused to decrease of it during storage time. Yilmaz et al. (2010) reported shear-thinning rheological behavior in the salep beverage fortified with lemon fiber. Zheng et al., (2017) reported shear thinning behavior for the milk pudding enriched with bamboo fiber. They also showed shear stress-shear rate data (at 0 to 300 1/s) were well fitted in the Hershel-Bulkley model and the increase of bamboo fiber concentration in pudding resulted in decrement of flow index and increment of the coefficient of consistency.
3.11. Sensory Evaluation
Acceptable organoleptic properties are one of the most important parameters for developing new functional foods and beverages and marketing processes. In this study, 30 semi-trained panelists evaluated the selected peach nectar samples for their desirability of taste, color, flavor, mouth feel, consistency, sweetness, and overall acceptability based on the five-point hedonic scale (from dislike very much to like very much). The results of the sensory evaluation of the selected optimum peach nectar formulations and control one (unfortified peach nectar) have been shown in Figure 8. The control sample showed a higher color score than the fortified ones and the F8 sample (containing 6g polydextrose and 6 mg lycopene) obtained the highest color score within the optimum fortified peach nectar. However, the F2 sample (containing 4g polydextrose, 1g bamboo fiber, 1g orange fiber, 4.5 mg lutein, and 1.5 mg lycopene) got the highest taste, consistency, sweetness, and overall acceptability scores among all fortified formulations. According to previous research works, adding dietary fiber to fortified fruit juices can significantly impact their sensory properties, including taste, texture, appearance, and overall acceptability (Sun, et al., 2023). Dietary fiber can alter the mouthfeel of fruit juices, often making them thicker and more viscous (Alqahtani, et al., 2014). This can be perceived positively or negatively depending on the type and amount of fiber added. The addition of fiber sometimes also introduces a slight aftertaste or bitterness, which might affect the overall flavor profile of the juice and can be managed by balancing with other ingredients. (Lakzadeh, et al., 2019). Fiber can potentially cause cloudiness or sedimentation in juices, which might affect visual appeal (Chakraborty, et al., 2019). Some consumers might prefer a clearer juice, while others might appreciate the natural look. Alqahtani, et al. (2014) reported that the fortified UHT model beverages, containing 3% oat fiber, had higher acceptability than ones fortified with orange fiber. They declared that particle size decrement resulted in viscosity improvement and consequently affected mouthfeel positively. Lakzadeh, et al. (2019) showed that the inulin-enriched pomegranate juice samples, containing 3% and 5%, inulin showed the most and the least desirability, respectively. Renuka (2009) studied the sensory properties of the fructooligosaccharide-enriched mango, orange, and pineapple juices. They reported no significant sensory changes in comparison with the control sample after 4 months of storage at ambient temperature. Chakraborty, et al. (2019) prepared a model beverage that was fortified with soluble and insoluble oat bran fibers. They reported that the insoluble oat bran fibers were effective on chalkiness, dryness, and particle sedimentation whereas, the soluble oat bran fibers affected smoothness, sliminess, and stickiness, and total fiber content affected mouth coating, and thickness. Overall, the impact of dietary fiber on the sensory properties of fortified fruit juices depends on the type and amount of fiber used, as well as the specific formulation of the juice.
3.12. Turbidity Evaluation
Turbidity is the cloudiness or haziness of a fluid or colloidal solution caused by large numbers of individual particles that are generally invisible to the naked eye (Wang, et al. 2022). This property is determined by measuring the portion of light scattered by dispersed particles in suspension at an angle of 90° from the incident beam by nephelometer or measuring the absorption intensity (or attenuation) of a light passing through the sample by spectrophotometer at a wavelength of 600 nm. Turbidity of selected fortified peach nectar has been shown in Figure 9. The F11 sample (containing 6 mg lutein and 6 g bamboo fiber) showed the highest amount of turbidity (~510 NTU) which could be attributed to the high amount of dissoluble bamboo fiber. The F8 and F18 samples which contained 6 g of polydextrose showed the lowest amount of turbidity which could be related to the high solubility of polydextrose. The turbidity of fruit juices shows the intensity of light scattering by suspended particles in solution and depends on the concentration, nature (shape, color, degree of crystallinity), and size of suspended particles. The higher the turbidity, the more light is scattered by the particles in the juice, resulting in a higher Nephelometric turbidity unit (NTU) or Formazin turbidity unit (FTU) reading (Van Buren, 1989). Nonsoluble or insoluble fibers do not dissolve in water and remain intact as suspended solid particles. These particles can scatter light, which increases the turbidity of the juice. So, the more nonsoluble fiber present, the cloudier the juice can appear. Soluble fibers dissolve in water and can form a gel-like substance, making the juice appear thicker and cloudier however have a lower increasing effect on turbidity. Some natural ingredients of fruit juices such as proteins, starch, pectin, cellulose, pectin, polyphenols, and metals can increase their turbidity. These compounds can be influenced by factors such as the type of fruit, the ripeness at the time of juice extraction, and the processing methods used (Van Buren, 1989). Clarification processes on clear fruit juices such as apple juice, including filtration and enzyme treatments, are often employed to reduce the turbidity caused by these compounds. Changes in turbidity of fruit juices during storage time can indicate the instability of fruit juice. The decrease in turbidity during the storage time can be related to the sedimentation of suspended particles of fruit juice due to the accumulation and enlargement of suspended particles. Also, the increase in turbidity may be due to the polymerization of polyphenols, the formation of masses of non-precipitating protein particles, and the production of metabolic byproducts by the growth of microorganisms, causing the juice to become hazy or cloudy (Wang, et al. 2022). A clear juice with minimal turbidity is often preferred and can be more appealing to consumers. In some cases, turbidity can be a sign of freshness, especially in juices that are not produced from concentrate (NFC). These juices retain more of the natural components of the fruit, which can contribute to a higher turbidity. Paquet et al., (2014), showed that the turbidity of the enriched fruit juice-based beverages increased by adding beta-glucan and a mixture of beta-glucan and xanthan gum in comparison to the control samples. In addition, the turbidity of the sample containing a mixture of beta-glucan and xanthan gum was higher than the sample containing only beta-glucan.
3.13. Color Evaluation
Table 8 presents the amount of L* (lightness value), a* (Redness-Greenness)- and b* (Yellowness-Blueness) Hunter parameters for the selected fortified peach formulations and control sample. L* parameter ranged from 53.2 to 61.9 and the F18 (containing 6g polydextrose, and 6 mg lutein) and F8 samples (containing 6g polydextrose, and 6 g lycopen) showed the highest Lightness (61.9 and 61.2). These results showed that polydextrose could increase the lightness of peach nectar samples and in contrast, bamboo and citrus fiber could decrease this value.
The F8 sample showed the highest a* (14.6) which could be attributed to its high lycopene content. The highest b* (44.4) was observed in the F17 sample (containing 4g citrus fibers, and 4.5 g lutein) which could be related to its high lutein and citrus carotenoids content. The addition of dietary fibers can decrease the lightness of the juice or nectar, making it appear darker. Dietary fibers might cause a shift in the a* and b* values, depending on the type of fiber and its interaction with the juice's natural pigments and components potentially leading to enhancing or diminishing the a* and b* values. Overall, the impact of dietary fibers on these color parameters can vary based on the type of fiber, its concentration, and the specific juice or nectar being analyzed (Sandi et al., 2004). Hussein et al., (2015) investigated the chemical composition, antioxidant activity, and color parameters of jams containing different fiber sources including carrot peels, apple pomace, banana peels, and mandarin peels. The results showed that the addition of dietary fibers from these by-products affected the Hunter color parameters. For instance, the jam made from mandarin peels had the highest lightness (L* = 39.8), while the jam from banana peels was the darkest (L* = 15.19). The study concluded that dietary fibers from different sources can significantly alter the color and sensory properties of fruit-based products.
3.14. Antioxidant Stability
3.14.1. DPPH Antioxidant Assay
Carotenoids are known for their potent antioxidant activities, which help neutralize free radicals and reduce oxidative stress. So, fortifying fruit juices with carotenoids like lycopene and lutein can indeed enhance their antioxidant properties, potentially offering greater health benefits to consumers (Artés-Hernández, et al., 2021; Shi, et al., 2024).
DPPH antioxidant activities of the selected peach nectar formulations are presented in Figure 10. The F8 sample (containing 6 g polydextrose and 6 mg lycopene) showed the highest DPPH antioxidant inhibitory during 8 weeks of storage which could be attributed to higher antioxidant properties of lycopene in comparison to lutein and also better antioxidant properties of polydextrose than bamboo and orange fibers. On the other side, the F2 sample (containing 1g bamboo fiber, 1 g orange fiber, 4 g polydextrose, 4.5 mg lutein, and 1.5 mg lycopene) had the lowest DPPH inhibitory. DPPH inhibitory of all samples decreased after 8 weeks' storage time. The number and arrangement of conjugated double bonds in carotenoids play a crucial role in their antioxidant activity and this explains the difference in antioxidant effect between lutein and lycopene. More conjugated double bonds generally enhance the ability to quench free radicals (Lucas, et al., 2021; Merhan, 2017; González-Peña, et al., 2023). The main constituents of dietary fibers are polysaccharides which have relatively antioxidant properties. Their antioxidant properties are related to their free hydroxyl (OH) groups that can donate hydrogen atoms to neutralize free radicals. (Lundberg, 2014; Pedro et al., 2023). The quantity and position of these hydroxyl groups, along with other structural features like molecular weight and monosaccharide composition, play a significant role in determining the antioxidant activity of polysaccharides (Bai, et al., 2022). Some studies have shown that lower molecular weight polysaccharides can exhibit high antioxidant activities, particularly in terms of scavenging specific types of free radicals which can explain higher antioxidant properties of polydextrose than bamboo and orange fiber (Mohan and Thirupathi, 2021; Zong, et al., 2021). Dietary fibers can also bind to bioactive compounds such as carotenoids, polyphenols, and phytosterols, which are known for their antioxidant properties activity (Chongtham, et al., 2011). This binding can help stabilize these compounds and enhance their effectiveness. So, the combination of carotenoids and dietary fibers may have a synergistic effect, meaning their combined antioxidant activity is greater than the sum of their individual activities (González-Peña, et al., 2023; Rodríguez-Roque, et al., 2016). Gerbinob et al., (2018) declared that the fiber-enriched strawberry juice showed higher antioxidant properties compared to unfortified ones, in the DPPH inhibitory assay, during storage time. In another research work, Lakzadeh, et al. (2019) reported fortified pomegranate juices with inulin, especially the one with 5% inulin, could retain their antioxidant properties (evaluated by DPPH assay) more than the control sample.
3.14.2. ABTS Scavenging Activity Assay/ TEAC Assay
The DPPH assay method is generally more suitable for evaluating the samples with higher lipophilic antioxidant content. However, it may not be as effective for samples with high water content, such as fruit juices (Gaber, et al., 2023). On the other hand, the ABTS inhibition assay is one of the most popular methods to evaluate both hydrophilic and lipophilic antioxidants in various samples, including plant extracts and juices (Olszowy & Dawidowicz, 2018). This method involves the generation of the blue-green color ABTS radical cation (ABTS•+), which is typically produced by reacting ABTS (2,2'-azino-bis (3-ethylbenzothiazoline-6-sulfonic acid)) with an oxidizing agent, such as potassium persulfate. When an antioxidant is present, it donates electrons to the ABTS•+ radical, reducing it to a colorless form. This reduction causes a decrease in absorbance, which can be measured at 734 nm spectrophotometrically (Cano, et al., 2023). The extent of the reduction in absorbance is proportional to the antioxidant capacity of the sample (Wołosiak, et al., 2022). ABTS assay were done to evaluate antioxidant capacity of the selected optimum formulations and results have been shown in Table 9. ABTS inhibition of samples varied from 51.22 to 83.47 % and F11 (containing 6g bamboo fiber, 6 mg lutein) and F8 (containing 6 g polydextrose and 6 mg lycopene) showed the lowest and highest ABTS values, respectively. These results were very similar
to DPPH assay results. The Trolox Equivalent Antioxidant Capacity (TEAC) assay measures the antioxidant capacity of a substance by comparing it to Trolox, a vitamin E analog. This method is popular due to its simplicity, reproducibility, and ability to compare antioxidant capacities across different studies and substances, providing a standardized way to express antioxidant capacity (Gaber, et al., 2023). TEAC value is m M concentration of Trolox which equals the sample's antioxidant capacity. According to Table 9, TEAC values were between 1.33 and 2.25 mM, and F11 and F8 had the lowest and highest values, respectively. Different dietary fibers can have different effects on ABTS and TEAC assay results. They might have their own antioxidant properties or interact with other components in the juice, which can enhance the overall antioxidant capacity (Cano, et al., 2023). However, some dietary fibers can bind to antioxidants, reducing their availability to react with the ABTS radical cation, leading to an underestimation of antioxidant capacity (Gaber, et al., 2023). Indeed, some fibers can create a physical barrier that prevents antioxidants from interacting with the ABTS reagent. So, in current research, the peach nectars containing different fibers showed different antioxidant capacities in the ABTS and TEAC assay. Polydextrose has low molecular weight so it creates a less physical barrier for antioxidant compounds to interact with ABTS radicals.
The antioxidant activity of carotenoids in the ABTS assay is influenced by their molecular structure. Carotenoids with more conjugated double bonds tend to show higher antioxidant activity. Lycopene has a higher number of conjugated double bonds compared to lutein which could explain the higher antioxidant properties of the samples containing lycopene than those containing lutein (Bin-Jumah et al., 2022). On the other hand, the polar functional groups and solubility of carotenoids in the juice matrix can affect their availability to react with the ABTS reagent. Carotenoids that are more soluble in the juice will contribute more significantly to the antioxidant capacity. Lutein has higher solubility in water compared to lycopene (Zhang, et al., 2015) however, in current research, it did not show a higher antioxidant capacity in fortified peach nectar.
3.14.3. Reducing Power Capacity Assay (RP-CA)
The reducing power capacity assay (RP-CA) is a valuable method for evaluating the antioxidant properties of fruit juice and extracts due to its high simplicity, speed, reproducibility, sensitivity to a wide range of antioxidants, and versatility (applicable to various types of samples), and cost-effectiveness (required reagents are generally inexpensive). In this method, potassium ferricyanide (Fe+3) is reduced to potassium ferrocyanide (Fe+2) by the antioxidants of a sample. The reduced form then reacts with ferric chloride to form a Prussian blue complex, which is measured spectrophotometrically at 730 nm. More absorbance indicates higher reducing power and thus higher antioxidant activity. The results are expressed in terms of the equivalent of a standard antioxidant such as ascorbic acid, to quantify and compare the antioxidant activity of the samples. The results of the RP-CA antioxidant assay of the optimum pech nectar formulations are presented in Table 9. RP-CA values of these samples varied from 2.4 to 4.6 mM ascorbic acid equivalents (AAE) and F11 (containing 6g bamboo fiber, 6 mg lutein) and F8 (containing 6 g polydextrose and 6 mg lycopene) showed the lowest and highest RP-CA values, respectively. These results were consistent with the results of previous methods (DPPH and ABTS assays). RP-CA assay has been used in several research works on fruit juices. Raji et al., (2022) declared that RP-CA values of 2.43 to 4.34 mM AAE for the mix of pineapple and orange juices. Kwawet et al., (2018) reported 33.69 to 38.39 mM AAE for lactic acid fermented mulberry juices. RP-C assay showed addition of citrus fiber in blackberry juice enhanced antioxidant activity (Buljeta et al., 2021). Purkiewicz et al., (2020) assessed the antioxidant activity of carrot juices from different varieties (black, orange, and yellow) by the RP-CA method and showed that orange carrot juices had higher carotenoid content and antioxidant activity compared to yellow and black carrot juices. The incorporation of carotenoids, such as β-carotene, into carrot juice has been found to significantly increase its antioxidant capacity. Carotenoids are effective in scavenging free radicals, thereby enhancing the reducing power capacity of the juice (Sharma, et al., 2012).
4. Conclusions
In the current research, by using D-optimal mixture design a type of healthy-functional fruit juice based on peach nectar was formulated. The effects of three types of dietary fibers (Bamboo fiber, citrus fiber, polydextrose), and two types of carotenoids (lycopene, and lutein ) at constant total amounts were evaluated on several important quality parameters (such as physical stability, total phenol, and flavonoids, vitamin C, antioxidant properties, turbidity, color, rheological and sensory properties). The results showed that the fibers and carotenoid proportions had significant effects on these properties. For example, the higher ratio of polydextrose to citrus and bamboo fibers increased the physical stability and antioxidant properties of peach nectar. Carotenoids had no effect on physical stability and lycopene had a greater effect on antioxidant properties than lutein. The interactions between phenolic compounds and dietary fiber ingredients may decrease their bioavailability and bamboo fibers had a more negative effect on the phenolic compound content of peach nectar. Lycopen increased total phenol content more than lutein which attributed to more stability of phenolic compounds during processing. Citrus dietary fiber also increased vitamin C content and viscosity. These show in the development of fortified-healthy drinks and beverages, several nutritional, physicochemical, and sensory properties are affected by proportions of added ingredients which should be greatly considered.
References
- Alqahtani, N. K., Ashton, J., Katopo, L., Haque, E., Jones, O. A., & Kasapis, S. (2014). Consistency of UHT beverages enriched with insoluble fibre during storage. Bioactive carbohydrates and dietary fibre, 4(1), 84-92.
- Alvarez-Parrilla, E., de la Rosa, L. A., González-Aguilar, G. A., & Ayala-Zavala, J. F. (2013). Phytochemical composition and health aspects of peach products. Dried Fruits, 309-324.
- Arballo, J., Amengual, J., Erdman, J.W. (2021). Lycopene: A Critical Review of Digestion, Absorption, Metabolism, and Excretion. Antioxidants, 10, 342. https://doi.org/10.1016/B978-0-444-5. [CrossRef]
- Artés-Hernández, F.; Castillejo, N.; Martínez-Zamora, L.; Martínez-Hernández, G.B. (2021). Phytochemical Fortification in Fruit and Vegetable Beverages with Green Technologies. Foods, 10, 2534. Arya, S. S., & Shakya, N. K. (2021). High fiber, low glycaemic index (GI) prebiotic multigrain functional beverage from barnyard, foxtail and kodo millet. LWT, 135, 109991. [CrossRef]
- Bai, L.; Xu, D.; Zhou, Y.-M.; Zhang, Y.-B.; Zhang, H.; Chen, Y.-B.; Cui, Y.-L. (2022).Antioxidant Activities of Natural Polysaccharides and Their Derivatives for Biomedical and Medicinal Applications. Antioxidants, 11, 2491. [CrossRef]
- Bashiri, S., Ghanbarzadeh, B., Ayaseh, A., Dehghannya, J., Ehsani, A., & Ozyurt, H. (2020). Essential oil-loaded nanostructured lipid carriers: The effects of liquid lipid type on the physicochemical properties in beverage models. Food Bioscience, 35, 100526.
- Beristain, C. I., Cruz-Sosa, F., Lobato-Calleros, C., Pedroza-Islas, R., Rodríguez-Huezo, M. E., & Verde-Calvo, J. R. (2006). Applications of soluble dietary fibers in beverages. Revista Mexicana de Ingenieria Quimica, 5(1), 81-95.
- Bhat, I., Jose, N.M. & Mamatha, B.S. Oxidative stability of lutein on exposure to varied extrinsic factors. J Food Sci Technol 60, 987–995 (2023). [CrossRef]
- Bin-Jumah, M.N.; Nadeem, M.S.; Gilani, S.J.; Mubeen, B.; Ullah, I.; Alzarea, S.I.; Ghoneim, M.M.; Alshehri, S.; Al-Abbasi, F.A.; Kazmi, I. (2022). Lycopene: A Natural Arsenal in the War against Oxidative Stress and Cardiovascular Diseases. Antioxidants, 11, 232. [CrossRef]
- Bordenave, N., Lamothe, L.M., Kale, M.S. (2020). Dietary Fibers in Foods – Formulating and Processing for Nutritional Benefits. In: Welti-Chanes, J., Serna-Saldívar, S., Campanella, O., Tejada-Ortigoza, V. (eds) Science and Technology of Fibers in Food Systems. Food Engineering Series. Springer, Cham. [CrossRef]
- Braniša, J., Jenisová, Z., Porubská, M., Jomová, K., & Valko, M. (2021). Spectrophotometric determination of chlorophylls and carotenoids. An effect of sonication and sample processing. Journal of Microbiology, Biotechnology and Food Sciences, 2021, 61-64.
- Bulda, O. V., Rassadina, V. V., Alekseichuk, H. N., & Laman, N. A. (2008). Spectrophotometric measurement of carotenes, xanthophylls, and chlorophylls in extracts from plant seeds. Russian Journal of Plant Physiology, 55(4), 544-551.
- Buljeta, I.; Pichler, A.; Šimunović, J.; Kopjar, M. Polyphenols and Antioxidant Activity of Citrus Fiber/Blackberry Juice Complexes. Molecules 2021, 26, 4400. [CrossRef]
- Buscemi, Silvio, Davide Corleo, Francesco Di Pace, Maria Letizia Petroni, Angela Satriano, and Giulio Marchesini. (2018). "The effect of lutein on eye and extra-eye health." Nutrients 10, no. 9:1321.
- Cano, A.; Maestre, A.B.; Hernández-Ruiz, J.; Arnao, M.B. (2023). ABTS/TAC Methodology: Main Milestones and Recent Applications. Processes, 11, 185. [CrossRef]
- Cámara, M., Sánchez-Mata, M., Fernández-Ruiz, V., Cámara, R. M. Manzoor, S., Caceres, J. (2013). Lycopene: A Review of Chemical and Biological Activity Related to Beneficial Health Effects, Editor(s): Atta-ur-Rahman, Studies in Natural Products Chemistry, Elsevier, 40, 383-426.
- Cassani, L., Gerbino, E., del Rosario Moreira, M., & Gómez-Zavaglia, A. (2018). Influence of non-thermal processing and storage conditions on the release of health-related compounds after in vitro gastrointestinal digestion of fiber-enriched strawberry juices. Journal of Functional Foods, 40, 128-136.
- Cedeño-Sares, L., Díaz-Torres, R., Núñez-Quezada, T., Armijos-Cabrera, G., & Cruz-Viera, L. (2023). Degradation kinetics of ascorbic acid in peach nectar during thermal processing.
- Chadare, F. J., Madode, Y. E., Tandji, F. B. I., Egue, F. O. M., Koffi, M., D’Almeida, M. L.,... & Hounhouigan, D. J. (2017). Physico-chemical, microbiological characteristics and storability of baobab milk nectar, a drink developed from the bottom of the pyramid in urban Benin. Bulletin de la Recherche Agronomique du Bénin (BRAB), Numéro spécial Technologie Alimentaire & Sécurité Alimentaire (TA&SA).
- Chakraborty, P., Witt, T., Harris, D., Ashton, J., Stokes, J. R., & Smyth, H. E. (2019). Texture and mouthfeel perceptions of a model beverage system containing soluble and insoluble oat bran fibres. Food Research International, 120, 62-72.
- Chongtham, N., Bisht, M. S., & Haorongbam, S. (2011). Nutritional properties of bamboo shoots: potential and prospects for utilization as a health food. Comprehensive Reviews in Food Science and Food Safety, 10(3), 153-168.
- Czech, A., Zarycka, E., Yanovych, D. et al. (2020). Mineral Content of the Pulp and Peel of Various Citrus Fruit Cultivars. Biol Trace Elem Res 193, 555–563. [CrossRef]
- Costa, G. A., & Mercadante, A. Z. (2018). In vitro bioaccessibility of free and esterified carotenoids in cajá frozen pulp-based beverages. Journal of Food Composition and Analysis, 68, 53-59.
- Dello Staffolo, M., Sato, A. C., & Cunha, R. L. (2017). Utilization of plant dietary fibers to reinforce low-calorie dairy dessert structure. Food and Bioprocess Technology, 10(5), 914-925.
- European Fruit Juice Association (AIJN), 2010 Market Report, Brussels, Belgium, 2010.
- Evrendilek, G. A., Avsar, Y. K., & Evrendilek, F. (2016). Modelling stochastic variability and uncertainty in aroma active compounds of PEF-treated peach nectar as a function of physical and sensory properties, and treatment time. Food Chemistry, 190, 634-642.
- Feszterová, M., Mišiaková, M., Kowalska, M. (2023). Bioactive vitamin C content from natural selected fruit Juices. Appl. Sci, 13, 3624. [CrossRef]
- Gaber, N.B., El-Dahy, S.I. & Shalaby, E.A. (2023). Comparison of ABTS, DPPH, permanganate, and methylene blue assays for determining antioxidant potential of successive extracts from pomegranate and guava residues. Biomass Conv. Bioref. 13, 4011–4020. [CrossRef]
- Giordano, E., & Quadro, L. (2018). Lutein, zeaxanthin and mammalian development: Metabolism, functions and implications for health. Archives of biochemistry and biophysics, 647, 33-40.
- González-Peña, M.A.; Ortega-Regules, A.E.; Anaya de Parrodi, C.; Lozada-Ramírez, J.D. (2023).Chemistry, Occurrence, Properties, Applications, and Encapsulation of Carotenoids—A Review. Plants, 12, 313. [CrossRef]
- Gruenwald, J. (2009). Fortification of beverages with products other than vitamins and minerals. In Functional and speciality beverage technology (pp. 92-106). Woodhead Publishing.
- Gunathilake, K. D. P. P., Rupasinghe, H. V., & Pitts, N. L. (2013). Formulation and characterization of a bioactive-enriched fruit beverage designed for cardio-protection. Food research international, 52(2), 535-541.
- Hakim, R. (2020). PREDICTED OVERALL STABILITY OF EMBANKMENT ON VERY SOFT SOIL REINFORCED BY BAMBOO PILES BASED ON FULLSCALE TEST DATA. GEOMATE Journal, 18(65), 102-109.
- Han, X., Shen, T., & Lou, H. (2007). Dietary polyphenols and their biological significance. International Journal of Molecular Science, (8), 950-988.
- Henrya, L.K., Catignania, G.L., and Schwartz, S.J., (1998). Oxidative degradation kinetics of lycopene, lutein and 9-cis and all-trans β-carotene. JAOCS, 75 (7), 823-830.
- Hussein, J. A. M. S., Kamil,M. M., Hegazy, N., Khaled F., Ibrahim, M.MA. (2015). Utilization of Some Fruits and Vegetables By-Products to Produce High Dietary Fiber Food Science and Quality Management, 37, 39-45. https://go.drugbank.com/drugs/DB11231.
- Imran, M., Ghorat, F., Ul-Haq, I., Ur-Rehman, H., Aslam, F., Heydari, M., Shariati, MA., Okuskhanova, E., Yessimbekov, Z., Thiruvengadam, M., Hashempur, MH., Rebezov, M. (2020). Lycopene as a natural antioxidant used to prevent human health disorders. Antioxidants (Basel),9(8),706. [CrossRef]
- ISO 5498: 1981 Agricultural food products – Determination of crude fibre contents – General method.
- Jalali Jivan, M., & Abbasi, S. (2018). Lutein extraction using nanotechnology (microemulsion): effect of surfactant, co-surfactant and ultrasound pretreatment. JFST No. 80, Vol. 15.
- Kaddumukasa PP, Imathiu SM, Mathara JM, Nakavuma JL. (2017). Influence of physicochemical parameters on storage stability: Microbiological quality of fresh unpasteurized fruit juices. Food Sci Nutr, 5(6),1098-1105. [CrossRef]
- Kardile, N.B., Nanda, V. & Thakre, S. Thermal degradation kinetics of total carotenoid and colour of mixed juice. Agric Res 9, 400–409 (2020). [CrossRef]
- Khamis, H., Lusweti, K., Mwevura, H., Nyanzi, S., & Kiremire, B. T. (2017). Quantification of Lycopene from Tomatoes and Watermelons by Using Beer-Lambert Principle. American Academic Scientific Research Journal for Engineering, Technology, and Sciences, 38(2), 119-133.
- Khanpit, V.V., Tajane, S.P. & Mandavgane, S.A. (2021). Dietary fibers from fruit and vegetable waste: methods of extraction and processes of value addition. Biomass Conv. Bioref. [CrossRef]
- Khodadai, M., Salami, M., & Dabirian, Sh. (2019). Production of Functional Orange Juice Based on Yogurt Whey Powder. JFST No. 88, Vol. 16.
- Kore, A., Karad, M., Choudhary, G., Waghmare, K., Jain, A. (2023).Comparative study of fresh fruit juices And marketed fruit juices. International Journal of Novel Research and Development, 8, 634-654.
- Kwaw, E., Ma, Y., Tchabo, W., Apaliya, M. T., Wu, M., Sackey, A. S.,... & Tahir, H. E. (2018). Effect of lactobacillus strains on phenolic profile, color attributes and antioxidant activities of lactic-acid-fermented mulberry juice. Food chemistry, 250, 148-154.
- Lakzadeh,L., Sabzevari, A., & Amouheidari, M., (2019). Fortification of pomegranate juice with inulin extracted from Jerusalem artichoke for high shelf life prebiotic juice production. JFST, No. 84, Vol. 15.
- la Peña, M.Md., Odriozola-Serrano, I., Oms-Oliu, G., Martín-Belloso, O. (2020). Dietary Fiber in Fruits and Vegetables. In: Welti-Chanes, J., Serna-Saldívar, S., Campanella, O., Tejada-Ortigoza, V. (eds) Science and Technology of Fibers in Food Systems. Food Engineering Series. Springer, Cham. [CrossRef]
- Laux, D., Valente, M., Ferrandis, J. Y., Talha, N., Gibert, O., & Prades, A. (2013). Shear viscosity investigation on mango juice with high frequency longitudinal ultrasonic waves and rotational viscosimetry. Food Biophysics, 8(4), 233-239.
- Lavelli, V., Pompei, C., & Casadei, M. A. (2008). Optimization of color and antioxidant activity of peach and nectarine puree: Scale-up study from pilot to industrial plant. Journal of agricultural and food chemistry, 56(16), 7091-7099.
- Lavelli, V., Pompei, C., and Casedei, M.A. (2009). Quality of nectarine and peach nectars as affected by lyepeeling and storage. Food Chem., 115, 1291–1298.
- Lavelli, V., Sereikaite, J. (2022). Kinetic study of encapsulated β-Carotene degradation in aqueous environments: A Review. Foods, 11, 317. [CrossRef]
- Li, N., Choi, I., Vuia-Riser, J., Carter, B., Drake, M., & Zhong, Q. (2022). Physical and sensory properties of lemon-flavored acidic beverages formulated with nonfat dry milk during storage. Journal of Dairy Science, 105(5), 3926-3938.
- Li,D.J., Song, J.F. and Liu, C. Q. (2014). Stability of Lutein in freeze-dried sweet corn powder stored under different conditions. Food Science and Technology Research, 20 (1), 65-70. [CrossRef]
- Liu, X., Liu, J., Bi, J., Cao, F., Ding, Y., & Peng, J. (2019). Effects of high pressure homogenization on physical stability and carotenoid degradation kinetics of carrot beverage during storage. Journal of food engineering, 263, 63-69.
- Lundberg, B., Pan, X., White, A., Chau, H., & Hotchkiss, A. (2014). Rheology and composition of citrus fiber. Journal of Food Engineering, 125, 97-104..
- Lucas, M., Freitas, M., Carvalho, F., Fernandes, E., Ribeiro, D. (2021). Antioxidant and Pro-oxidant Activities of Carotenoids. In: Ekiert, H.M., Ramawat, K.G., Arora, J. (eds) Plant Antioxidants and Health. Reference Series in Phytochemistry. Springer, Cham. [CrossRef]
- Martins, C. P., Cavalcanti, R. N., Cardozo, T. S., Couto, S. M., Guimarães, J. T., Balthazar, C. F.,... & Cruz, A. G. (2021). Effects of microwave heating on the chemical composition and bioactivity of orange juice-milk beverages. Food Chemistry, 345, 128746.
- Mesnier, X., Gregory, C., Fança-Berthon, P., Boukobza, F., & Bily, A. (2014). Heat and light colour stability of beverages coloured with a natural carotene emulsion: Effect of synthetic versus natural water soluble antioxidants. Food Research International, 65, 149-155.
- Merhan, O. (2017). The Biochemistry and Antioxidant Properties of Carotenoids. Carotenoids. InTech. Available at:. [CrossRef]
- Mohan, S.C., Thirupathi, A. (2021). Antioxidant and Antibacterial Activities of Polysaccharides. In: Oliveira, J., Radhouani, H., Reis, R.L. (eds) Polysaccharides of Microbial Origin. Springer, Cham. [CrossRef]
- Morales-de la Peña, M., Welti-Chanes, J., & Martín-Belloso, O. (2016). Application of novel processing methods for greater retention of functional compounds in fruit-based beverages. Beverages, 2(2), 14.
- Mustafa, A. F., & Baurhoo, B. (2016). Effects of feeding dried broccoli floret residues on performance, ileal and total digestive tract nutrient digestibility, and selected microbial populations in broiler chickens. Journal of Applied Poultry Research, 25(4), 561-570.
- Nagpal, R., Kumar, A. & Kumar, M. (2012). Fortification and fermentation of fruit juices with probiotic lactobacilli. Ann Microbiol, 62, 1573–1578. [CrossRef]
- Naseem Z, Mir SA, Wani SM, Rouf MA, Bashir I, Zehra A. Probiotic-fortified fruit juices: Health benefits, challenges, and future perspective. Nutrition. 2023 Nov;115:112154. Epub 2023 Jul 7. PMID: 37536023. [CrossRef]
- O'Shea, N., Arendt, E. K., & Gallagher, E. (2012). Dietary fibre and phytochemical characteristics of fruit and vegetable by-products and their recent applications as novel ingredients in food products. Innovative Food Science & Emerging Technologies, 16, 1-10.
- Ogundele, O. M., Awolu, O. O., Badejo, A. A., Nwachukwu, I. D., & Fagbemi, T. N. (2016). Development of functional beverages from blends of Hibiscus sabdariffa extract and selected fruit juices for optimal antioxidant properties. Food science & nutrition, 4(5), 679-685.
- Olszowy, M., Dawidowicz, A.L. (2018). Is it possible to use the DPPH and ABTS methods for reliable estimation of antioxidant power of colored compounds? Chem. Pap. 72, 393–400. [CrossRef]
- Paquet, É., Bédard, A., Lemieux, S., & Turgeon, S. L. (2014). Effects of apple juice-based beverages enriched with dietary fibres and xanthan gum on the glycemic response and appetite sensations in healthy men. Bioactive Carbohydrates and Dietary Fibre, 4(1), 39-47.
- Pasupuleti V, Kulkarni SG. Lycopene fortification on the quality characteristics of beverage formulations developed from pink flesh guava (Psidium guajava L.). Journal of Food Science and Technology. 2014 Dec;51(12):4126-4131. PMID: 25477692; PMCID: PMC4252445. [CrossRef]
- Pedro, A.R., Fernandes, Manuel A. (2023). Coimbra The antioxidant activity of polysaccharides: A structure-function relationship overview, Carbohydrate Polymers, 314,120965. [CrossRef]
- Perkins-Veazie, P., Collins, J. K., Pair, S. D., & Roberts, W. (2001). Lycopene content differs among red-fleshed watermelon cultivars. Journal of the Science of Food and Agriculture, 81(10), 983-987.
- Provesi, J. G., Dias, C. O., & Amante, E. R. (2011). Changes in carotenoids during processing and storage of pumpkin puree. Food Chemistry, 128(1), 195-202.
- Purkiewicz, A.; Ciborska, J.; Tańska, M.; Narwojsz, A.; Starowicz, M.; Przybyłowicz, K.E.; Sawicki, T. The Impact of the Method Extraction and Different Carrot Variety on the Carotenoid Profile, Total Phenolic Content and Antioxidant Properties of Juices. Plants 2020, 9, 1759. [CrossRef]
- Quirós-Sauceda1, A.E. Ayala-Zavala1, J.F. Sáyago-Ayerdi, S.G. Vélez-de la Rocha1, R. Sañudo-Barajas1, J.A. González-Aguilar1. G.A. (2014). Added dietary fiber affects antioxidant capacity and phenolic compounds content extracted from tropical fruit. Journal of Applied Botany and Food Quality, 87, 227 – 233. [CrossRef]
- Ranganna, S. (1986). Handbook of analysis and quality control for fruit and vegetable products. Tata McGraw-Hill Education.
- Renuka, B., Kulkarni, S. G., Vijayanand, P., & Prapulla, S. G. (2009). Fructooligosaccharide fortification of selected fruit juice beverages: Effect on the quality characteristics. LWT-Food Science and Technology, 42(5), 1031-1033.
- Rodríguez-Roque, M.J., de Ancos, B., Sánchez-Vega, R., et al. (2016). Food matrix and processing influence on carotenoid bioaccessibility and lipophilic antioxidant activity of fruit juice-based beverages. Food & Function, 7(1),380-389. [CrossRef]
- Sahraee, S., Ghanbarzadeh, B., & Falcone, P. M. (2022). Application of mixture design methodology for development of high antioxidant fruity functional beverage. Food Science & Nutrition.
- Salehi, F. (2020).Physicochemical characteristics and rheological behaviour of some fruit juices and their concentrates. Food Measure 14, 2472–2488. [CrossRef]
- Salinas, D. E., Garvin, A., Ibarz, R., & Ibarz, A. (2021). Viscoelastic properties and compensation study of apple juice enriched with apple fiber. LWT, 151, 111971.
- Sandi, D., Chaves, J.B.P., Sousa, A.C.G.d., Parreiras, J., F.M., Silva, M. T. C. d., Constant, P., B.,L. (2004). Hunter color dimensions, sugar content and volatile compounds in pasteurized yellow passion fruit juice (Passiflora edulis var.flavicarpa) during storage. Brazilian Archives of Biology and Technology, 47 (2), 233-245.
- Santosh, O., Bajwa, H. K., Bisht, M. S., & Nirmala, C. (2019). Functional biscuits from bamboo shoots: Enrichment of nutrients, bioactive compounds and minerals in bamboo shoot paste fortified biscuits. Int J Food Sci Nutr, 4(1), 89-94.
- Sattar, S., Imran, M., Mushtaq, Z. et al. (2020). Retention and stability of bioactive compounds in functional peach beverage using pasteurization, microwave and ultrasound technologies. Food Sci Biotechnol, 29, 1381–1388. [CrossRef]
- Shahidi, F. (Ed.). (2006). Nutraceutical and specialty lipids and their co-products. Crc Press.
- Sharma, K.D., Karki, S., Thakur, N.S. et al. (2012).Chemical composition, functional properties and processing of carrot—a review. J Food Sci Technol 49, 22–32. [CrossRef]
- Sinha, N. K., Sidhu, J., Barta, J., Wu, J., & Cano, M. P. (Eds.). (2012). Handbook of fruits and fruit processing. John Wiley & Sons.
- Srivastava, S., Srivastava, A.K. (2015). Lycopene; chemistry, biosynthesis, metabolism and degradation under various abiotic parameters. J Food Sci Technol. 52, 41–53 . [CrossRef]
- Staffolo, M. D., Bertola, N., & Martino, M. (2004). Influence of dietary fiber addition on sensory and rheological properties of yogurt. International Dairy Journal, 14(3), 263-268.
- Stinco, C. M., Pumilia, G., Giuffrida, D., Dugo, G., Meléndez-Martínez, A. J., & Vicario, I. M. (2019). Bioaccessibility of carotenoids, vitamin A and α-tocopherol, from commercial milk-fruit juice beverages: Contribution to the recommended daily intake. Journal of Food Composition and Analysis, 78, 24-32.
- Sun, T., Tadmor, Y., Li, L. (2020). Pathways for Carotenoid Biosynthesis, Degradation, and Storage. In: Rodríguez-Concepción, M., Welsch, R. (eds) Plant and Food Carotenoids. Methods in Molecular Biology, vol 2083. Humana, New York, NY. [CrossRef]
- Sun, X.; Follett, P.A.; Wall, M.M.; Duff, K.S.; Wu, X.; Shu, C.; Plotto, A.; Liang, P.; Stockton, D.G. (2023), Physical, Chemical, and Sensory Properties of a Turmeric-Fortified Pineapple Juice Beverage. Foods 12, 2323. [CrossRef]
- Tamer, C. E., Yekeler, F. Z., Çopur, Ö. U., Incedayi, B., & Suna, S. (2016). A study of fortification of lemonade with herbal extracts. Food Science and Technology, 37, 45-51.
- Tareen, H., Mengal, F., Masood, Z., Mengal, R., Ahmed, S., Bibi, S.,... & Nawaz, Z. (2015, July). Determination of Vitamin C content in Citrus Fruits and in Non-Citrus Fruits by Titrimetric method, with special reference to their nutritional importance in Human diet. In Biological Forum (Vol. 7, No. 2, p. 367). Research Trend.
- Tola, Y. B., & Ramaswamy, H. S. (2015). Temperature and high pressure stability of lycopene and vitamiC of watermelon Juice. African Journal of Food Science, 9(5), 351-358.
- Tomas, M. (2022). Effect of dietary fiber addition on the content and in vitro bioaccessibility of antioxidants in red raspberry puree. Food Chemistry, 375, 131897.
- Van Buren, J.P. (1989). Causes and Prevention of Turbidity in Apple Juice. In: Downing, D.L. (eds) Processed Apple Products. Springer, New York, NY. [CrossRef]
- Viacava, G. E., Roura, S. I., & Agüero, M. V. (2015). Optimization of critical parameters during antioxidants extraction from butterhead lettuce to simultaneously enhance polyphenols and antioxidant activity. Chemometrics and intelligent laboratory systems, 146, 47-54.
- Vignesh, D., Muthal, T., Chidanand, D. V., & Sunil, C. K. (2019). Study of Sensory and Storage Quality of the RTS Juice Enriched with Papaya Leaf Flavonoid. Ind. J. Pure App. Biosci, 7(4), 422-430.
- Wang, H.; Yuan, J.; Chen, L.;Ban, Z.; Zheng, Y.; Jiang, Y.; Jiang, Y.; Li, X. (2022).Effects of Fruit Storage Temperature and Time on Cloud Stability of Not from Concentrated Apple Juice. Foods 2022, 11, 2568. [CrossRef]
- Wołosiak, R.; Drużyńska, B.; Derewiaka, D.; Piecyk, M.; Majewska, E.; Ciecierska, M.; Worobiej, E.; Pakosz, P. (2022).Verification of the Conditions for Determination of Antioxidant Activity by ABTS and DPPH Assays—A Practical Approach. Molecules, 27, 50. [CrossRef]
- Wu, Y., Li, S., Tao, Y., Li, D., Han, Y., Show, P. L.,... & Zhou, J. (2021). Fermentation of blueberry and blackberry juices using Lactobacillus plantarum, Streptococcus thermophilus and Bifidobacterium bifidum: Growth of probiotics, metabolism of phenolics, antioxidant capacity in vitro and sensory evaluation. Food chemistry, 348, 129083.
- Yilmaz, M. T., SERT, D., Karakaya, M., & TISKE, S. S. (2010). Optimization of the effect of sweetener and dietary fiber on rhelogical and sensory properties of salep beverage. Journal of texture studies, 41(6), 804-824.
- Xiao, Y. D., Huang, W. Y., Li, D. J., Song, J. F., Liu, C. Q., Wei, Q. Y.,... & Yang, Q. M. (2018). Thermal degradation kinetics of all-trans and cis-carotenoids in a light-induced model system. Food chemistry, 239, 360-368.
- Youssef, B. M., Asker, A. A., El-Samahy, S. K., & Swailam, H. M. (2002). Combined effect of steaming and gamma irradiation on the quality of mango pulp stored at refrigerated temperature. Food Research International, 35(1), 1-13.
- Zheng, J., Wu, J., Dai, Y., Kan, J., & Zhang, F. (2017). Influence of bamboo shoot dietary fiber on the rheological and textural properties of milk pudding. LWT, 84, 364-369.
- Zong, X., Zhang, X., Bi, K., Zhou, Y., Zhang, M., Qi, J.,... & Fu, M. (2021). Novel emulsion film based on gelatin/polydextrose/camellia oil incorporated with Lactobacillus pentosus: Physical, structural, and antibacterial properties. Food Hydrocolloids, 121, 107063.
Figure 1.
Perturbation plots showing the effect of Independent factors on the responses. Effect of fibers portion on (a) Stability and (b) DPPH inhibitory and (c) carotenoid portion on DPPH.
Figure 1.
Perturbation plots showing the effect of Independent factors on the responses. Effect of fibers portion on (a) Stability and (b) DPPH inhibitory and (c) carotenoid portion on DPPH.
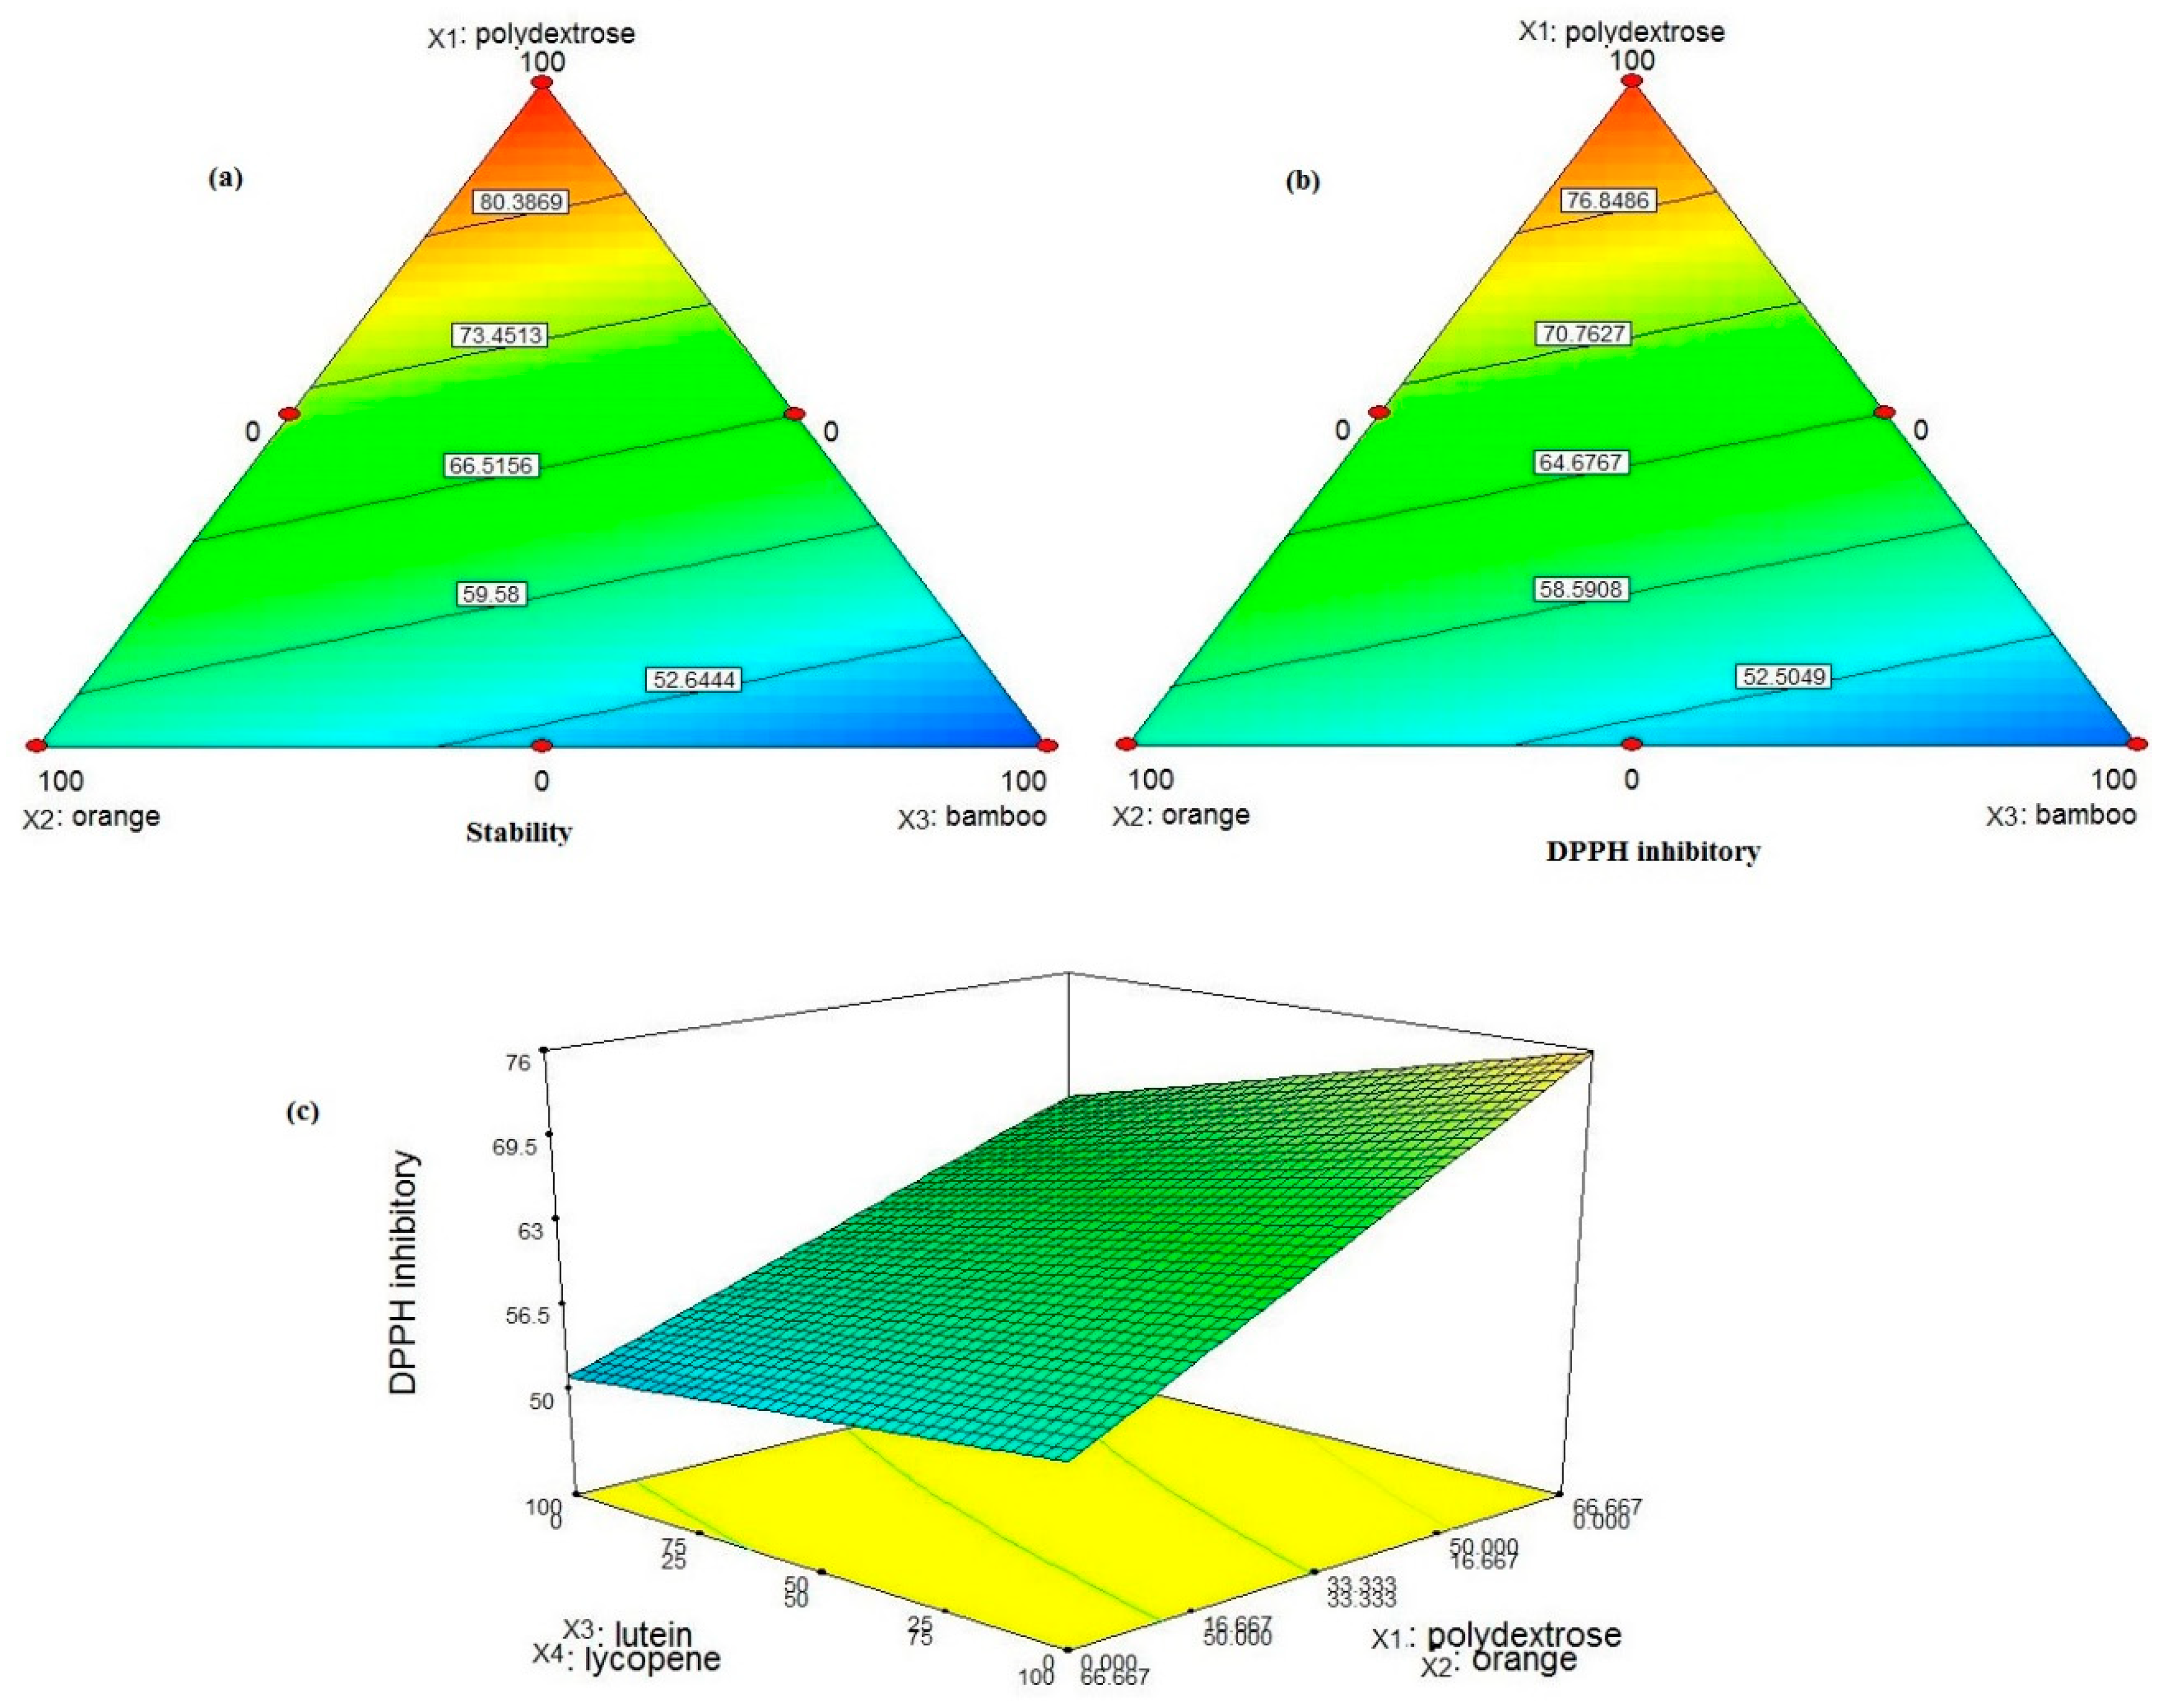
Figure 2.
(a) Total phenolic and (b) total flavonoid contents of selected peach nectar formulations and control sample. Different letters show significant differences between samples.
Figure 2.
(a) Total phenolic and (b) total flavonoid contents of selected peach nectar formulations and control sample. Different letters show significant differences between samples.
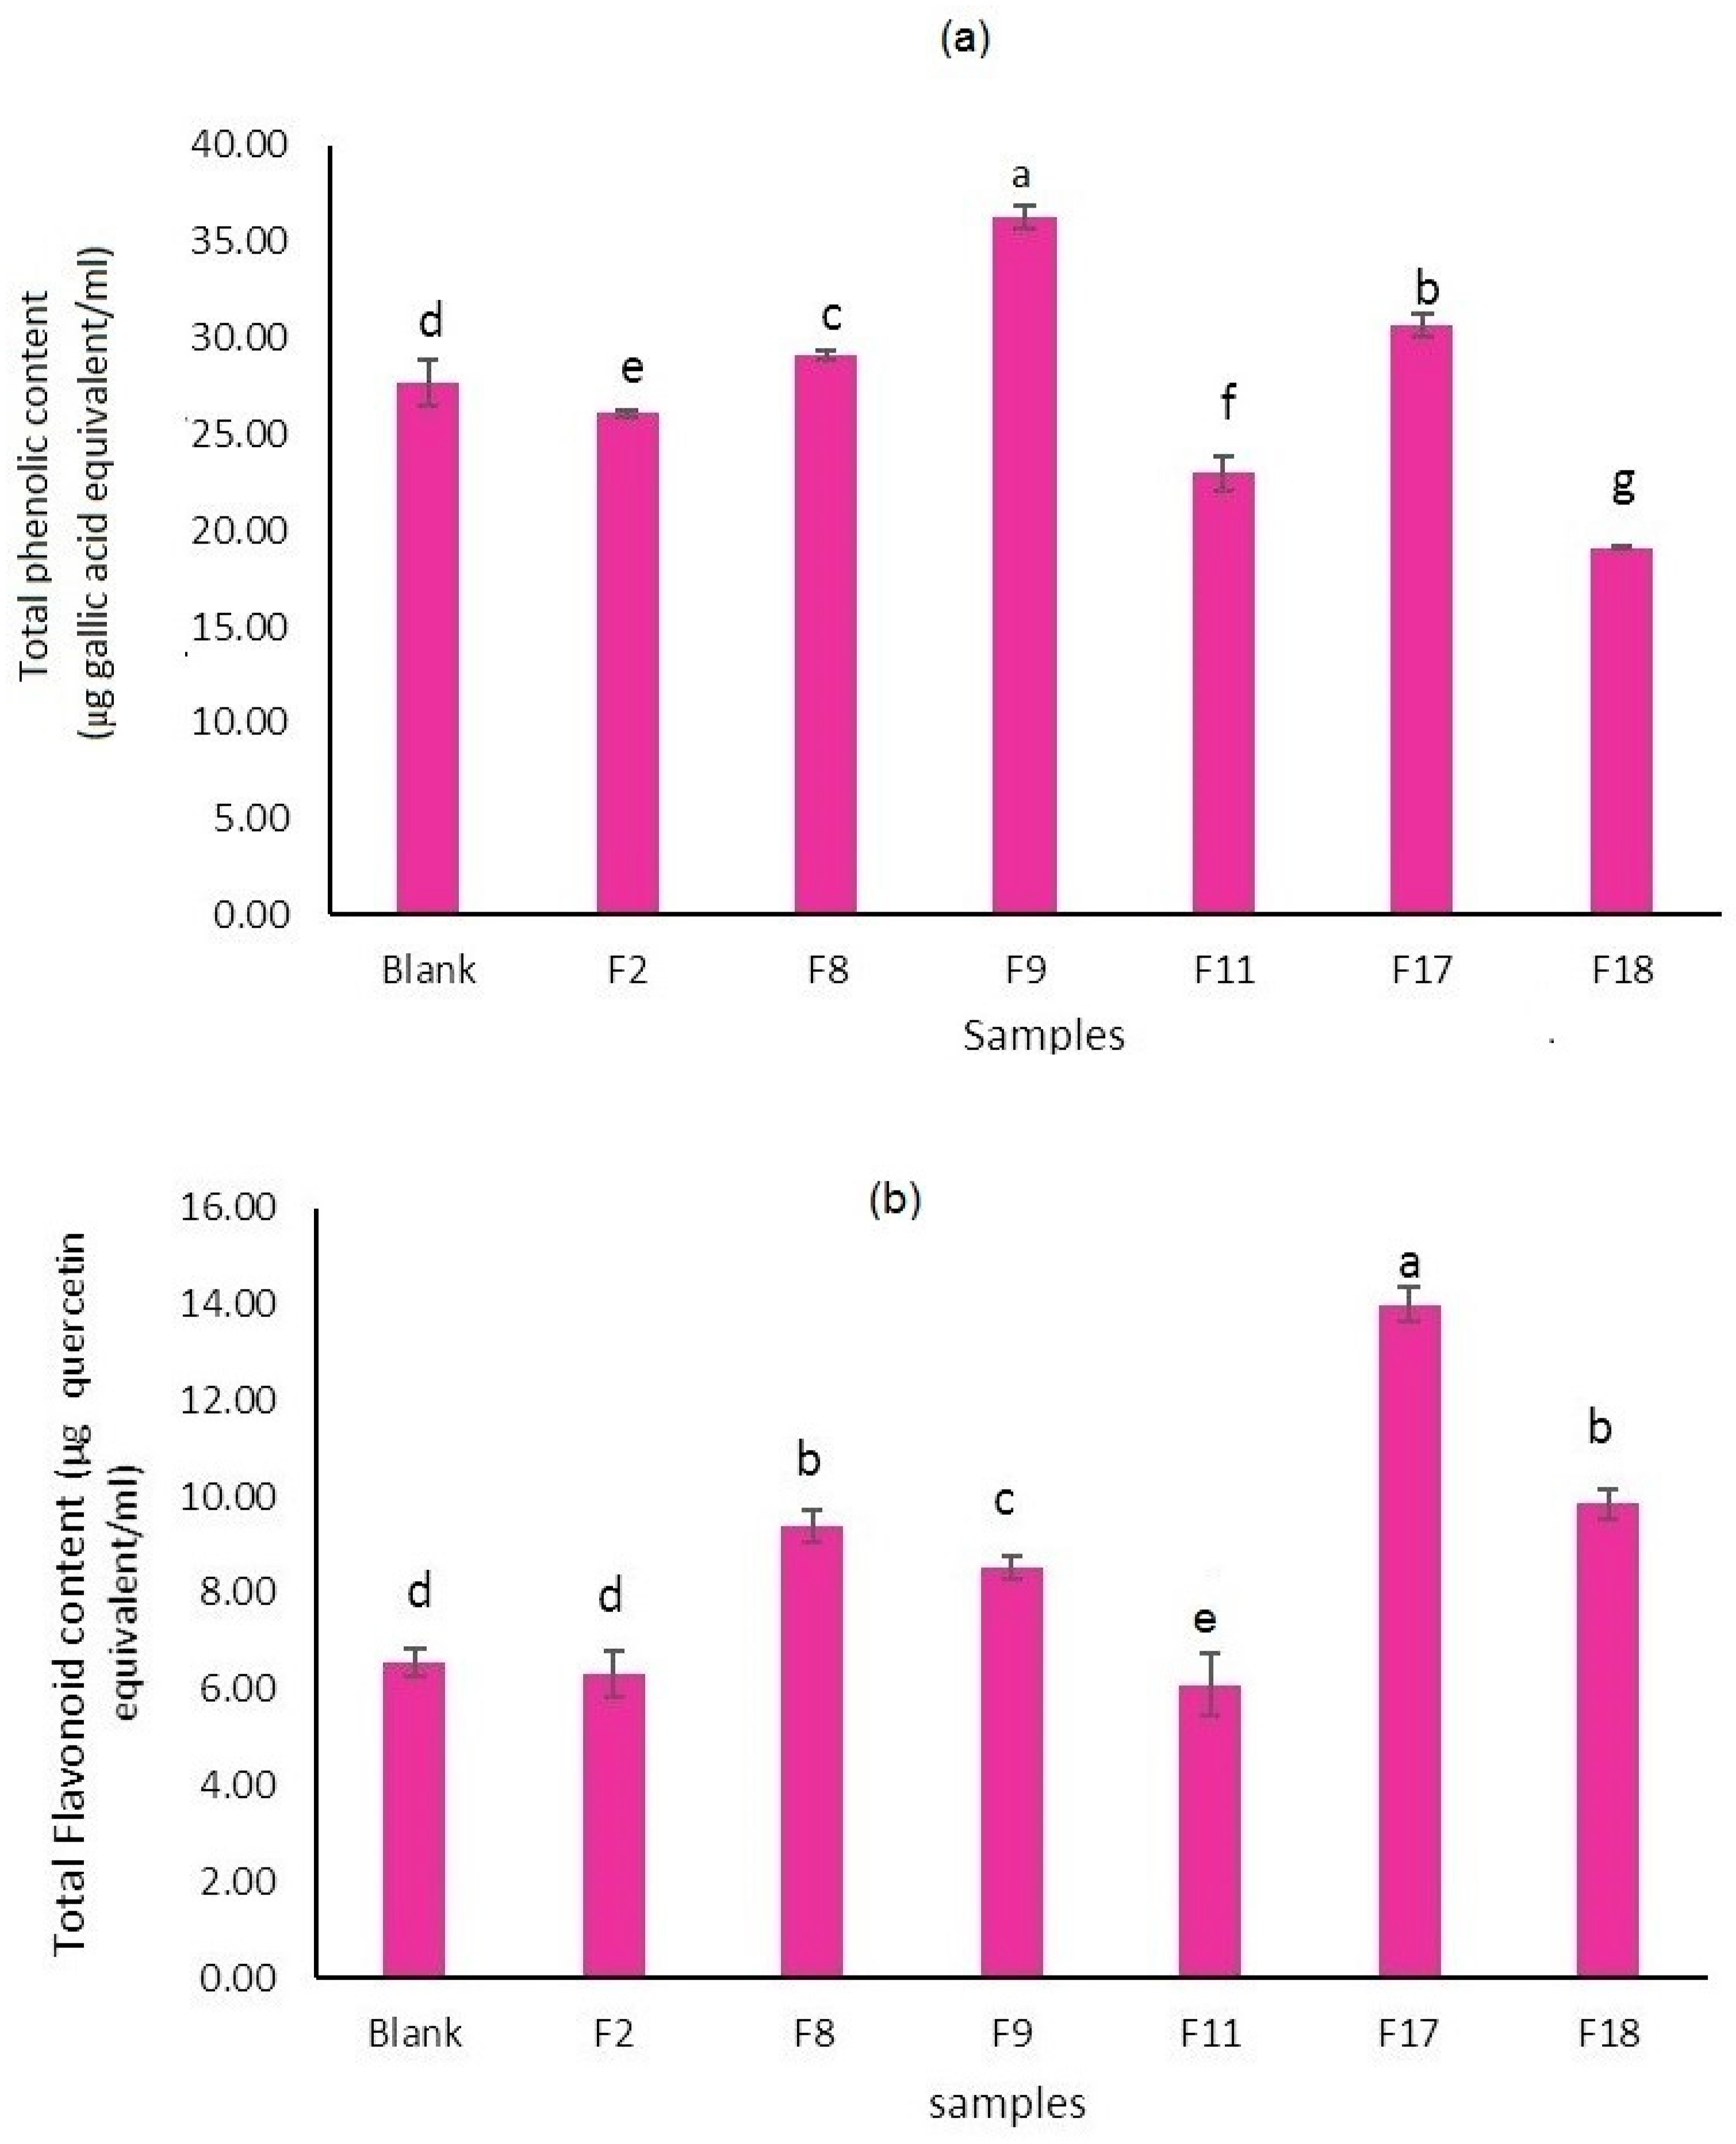
Figure 3.
The vitamin C content of the selected peach nectar formulations and control sample. Different letters show significant differences between samples.
Figure 3.
The vitamin C content of the selected peach nectar formulations and control sample. Different letters show significant differences between samples.
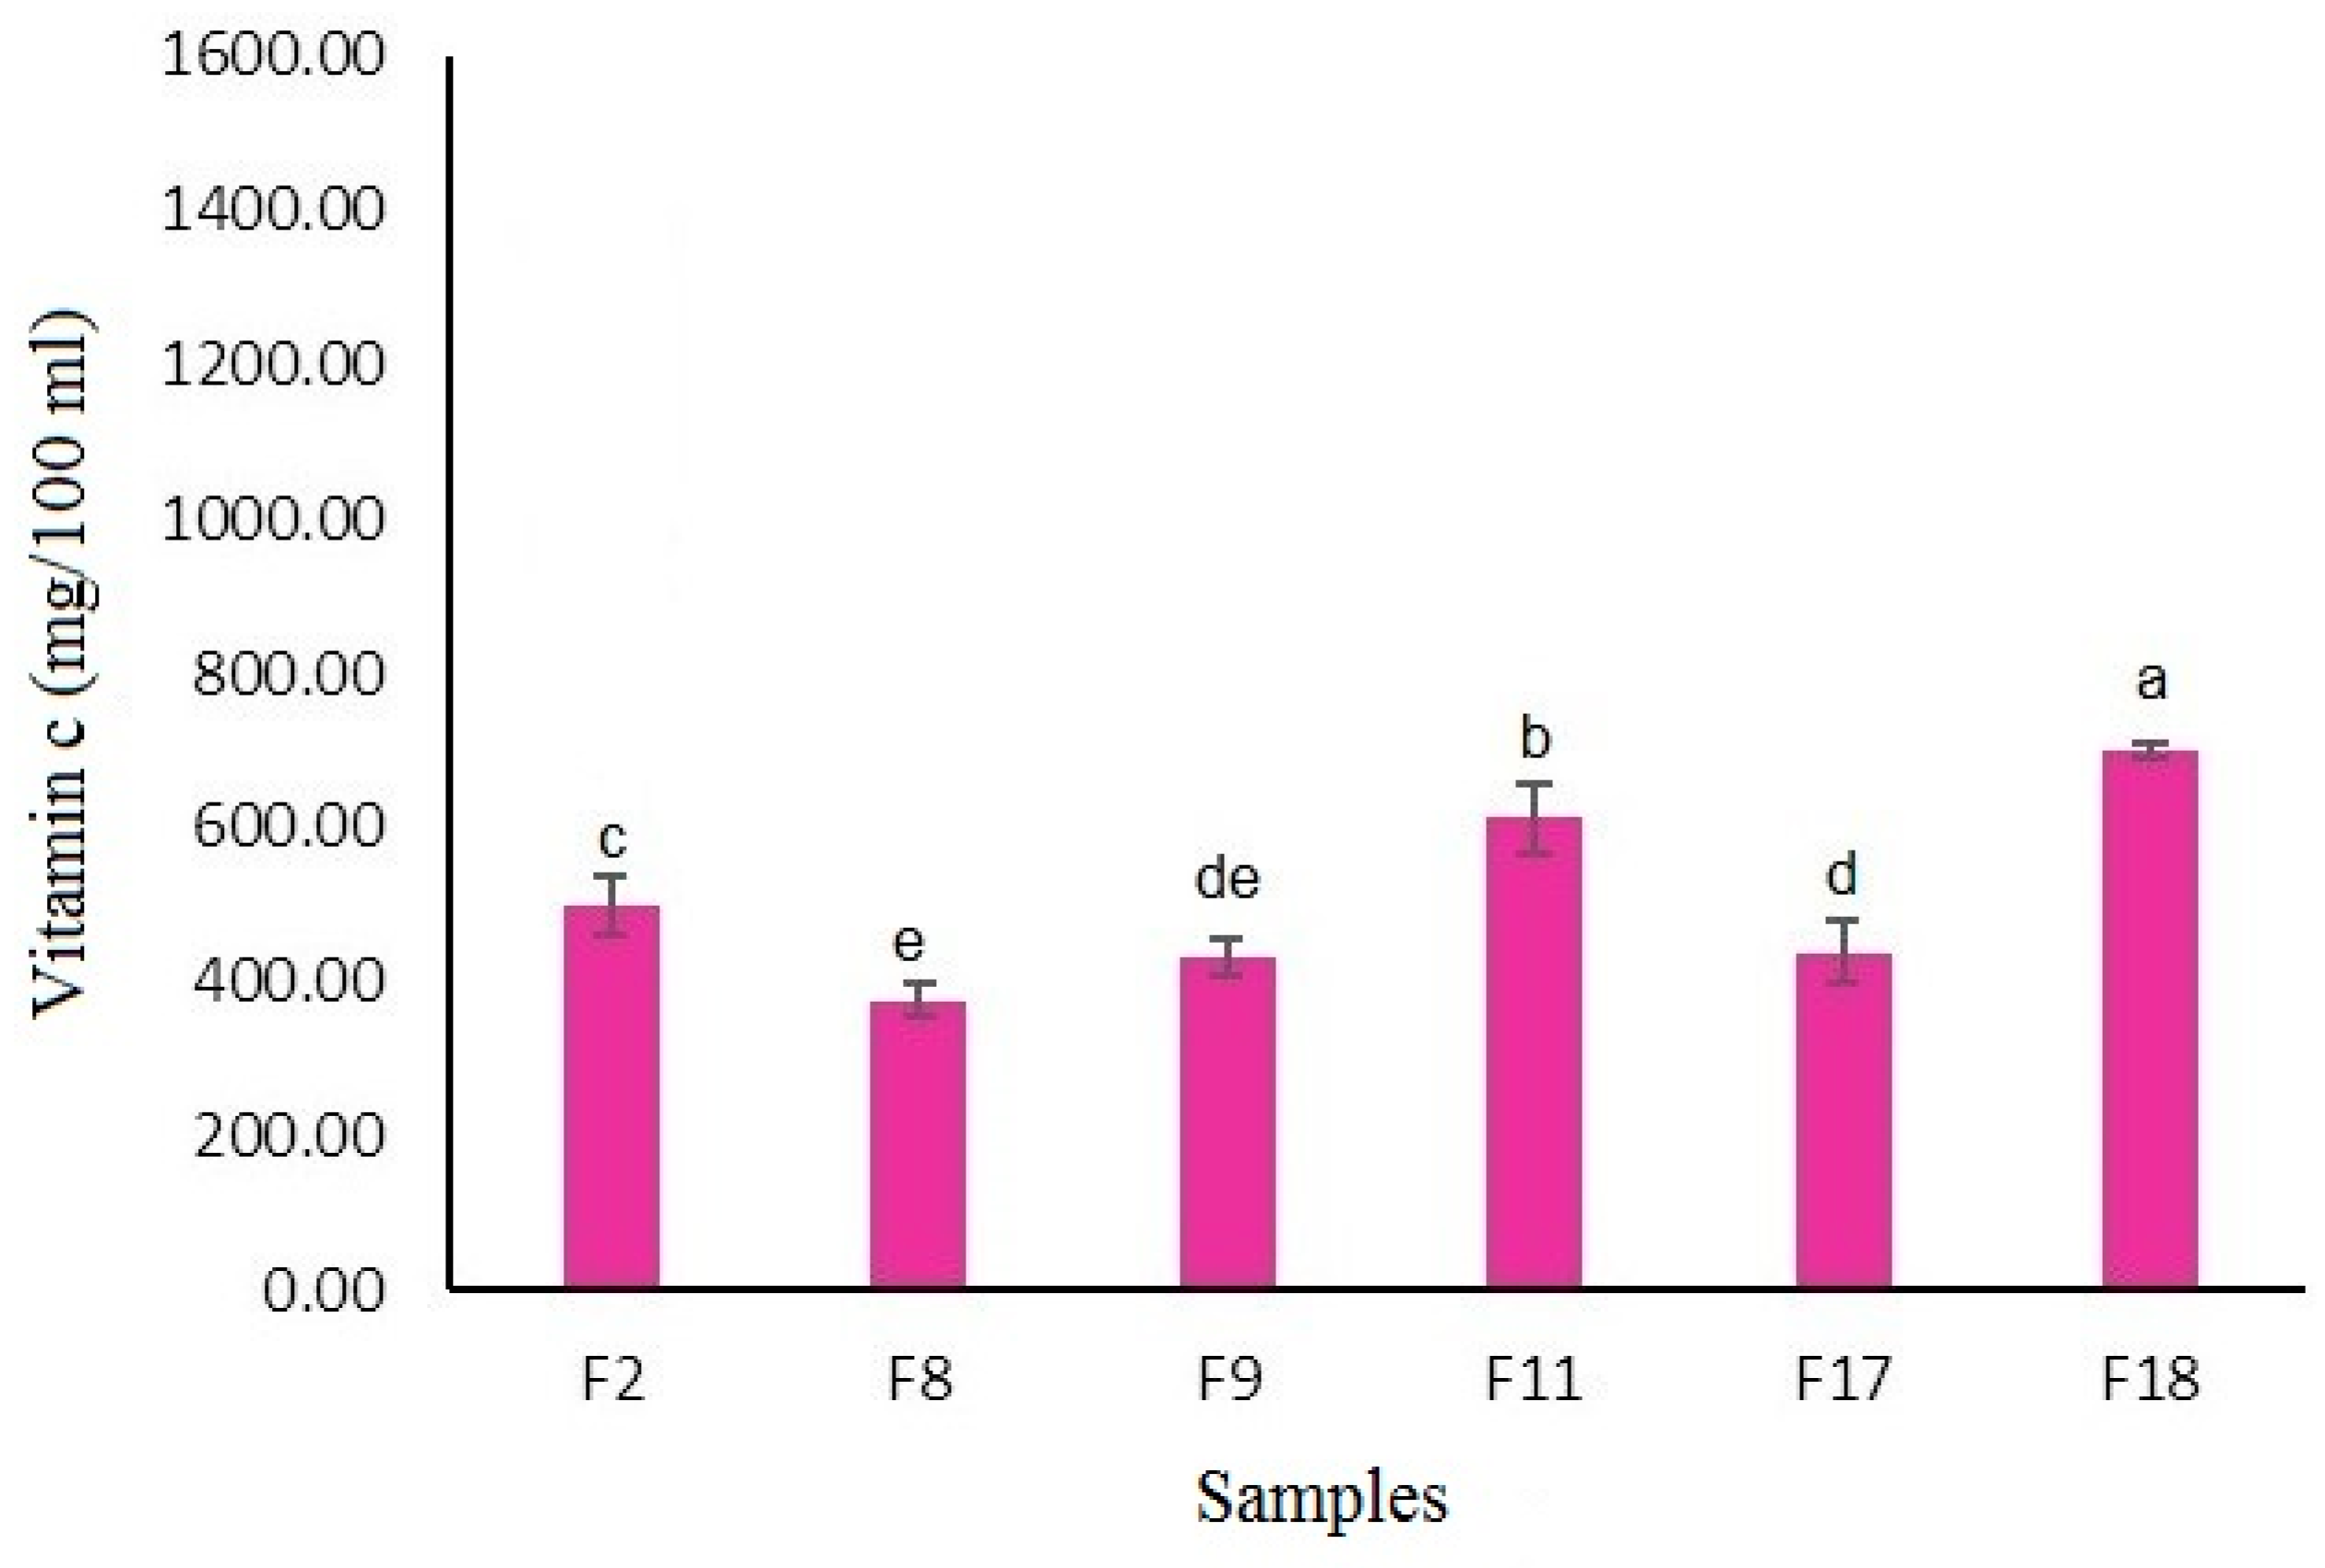
Figure 4.
The fiber content of the selected peach nectar samples. Different letters show significant differences between samples.
Figure 4.
The fiber content of the selected peach nectar samples. Different letters show significant differences between samples.
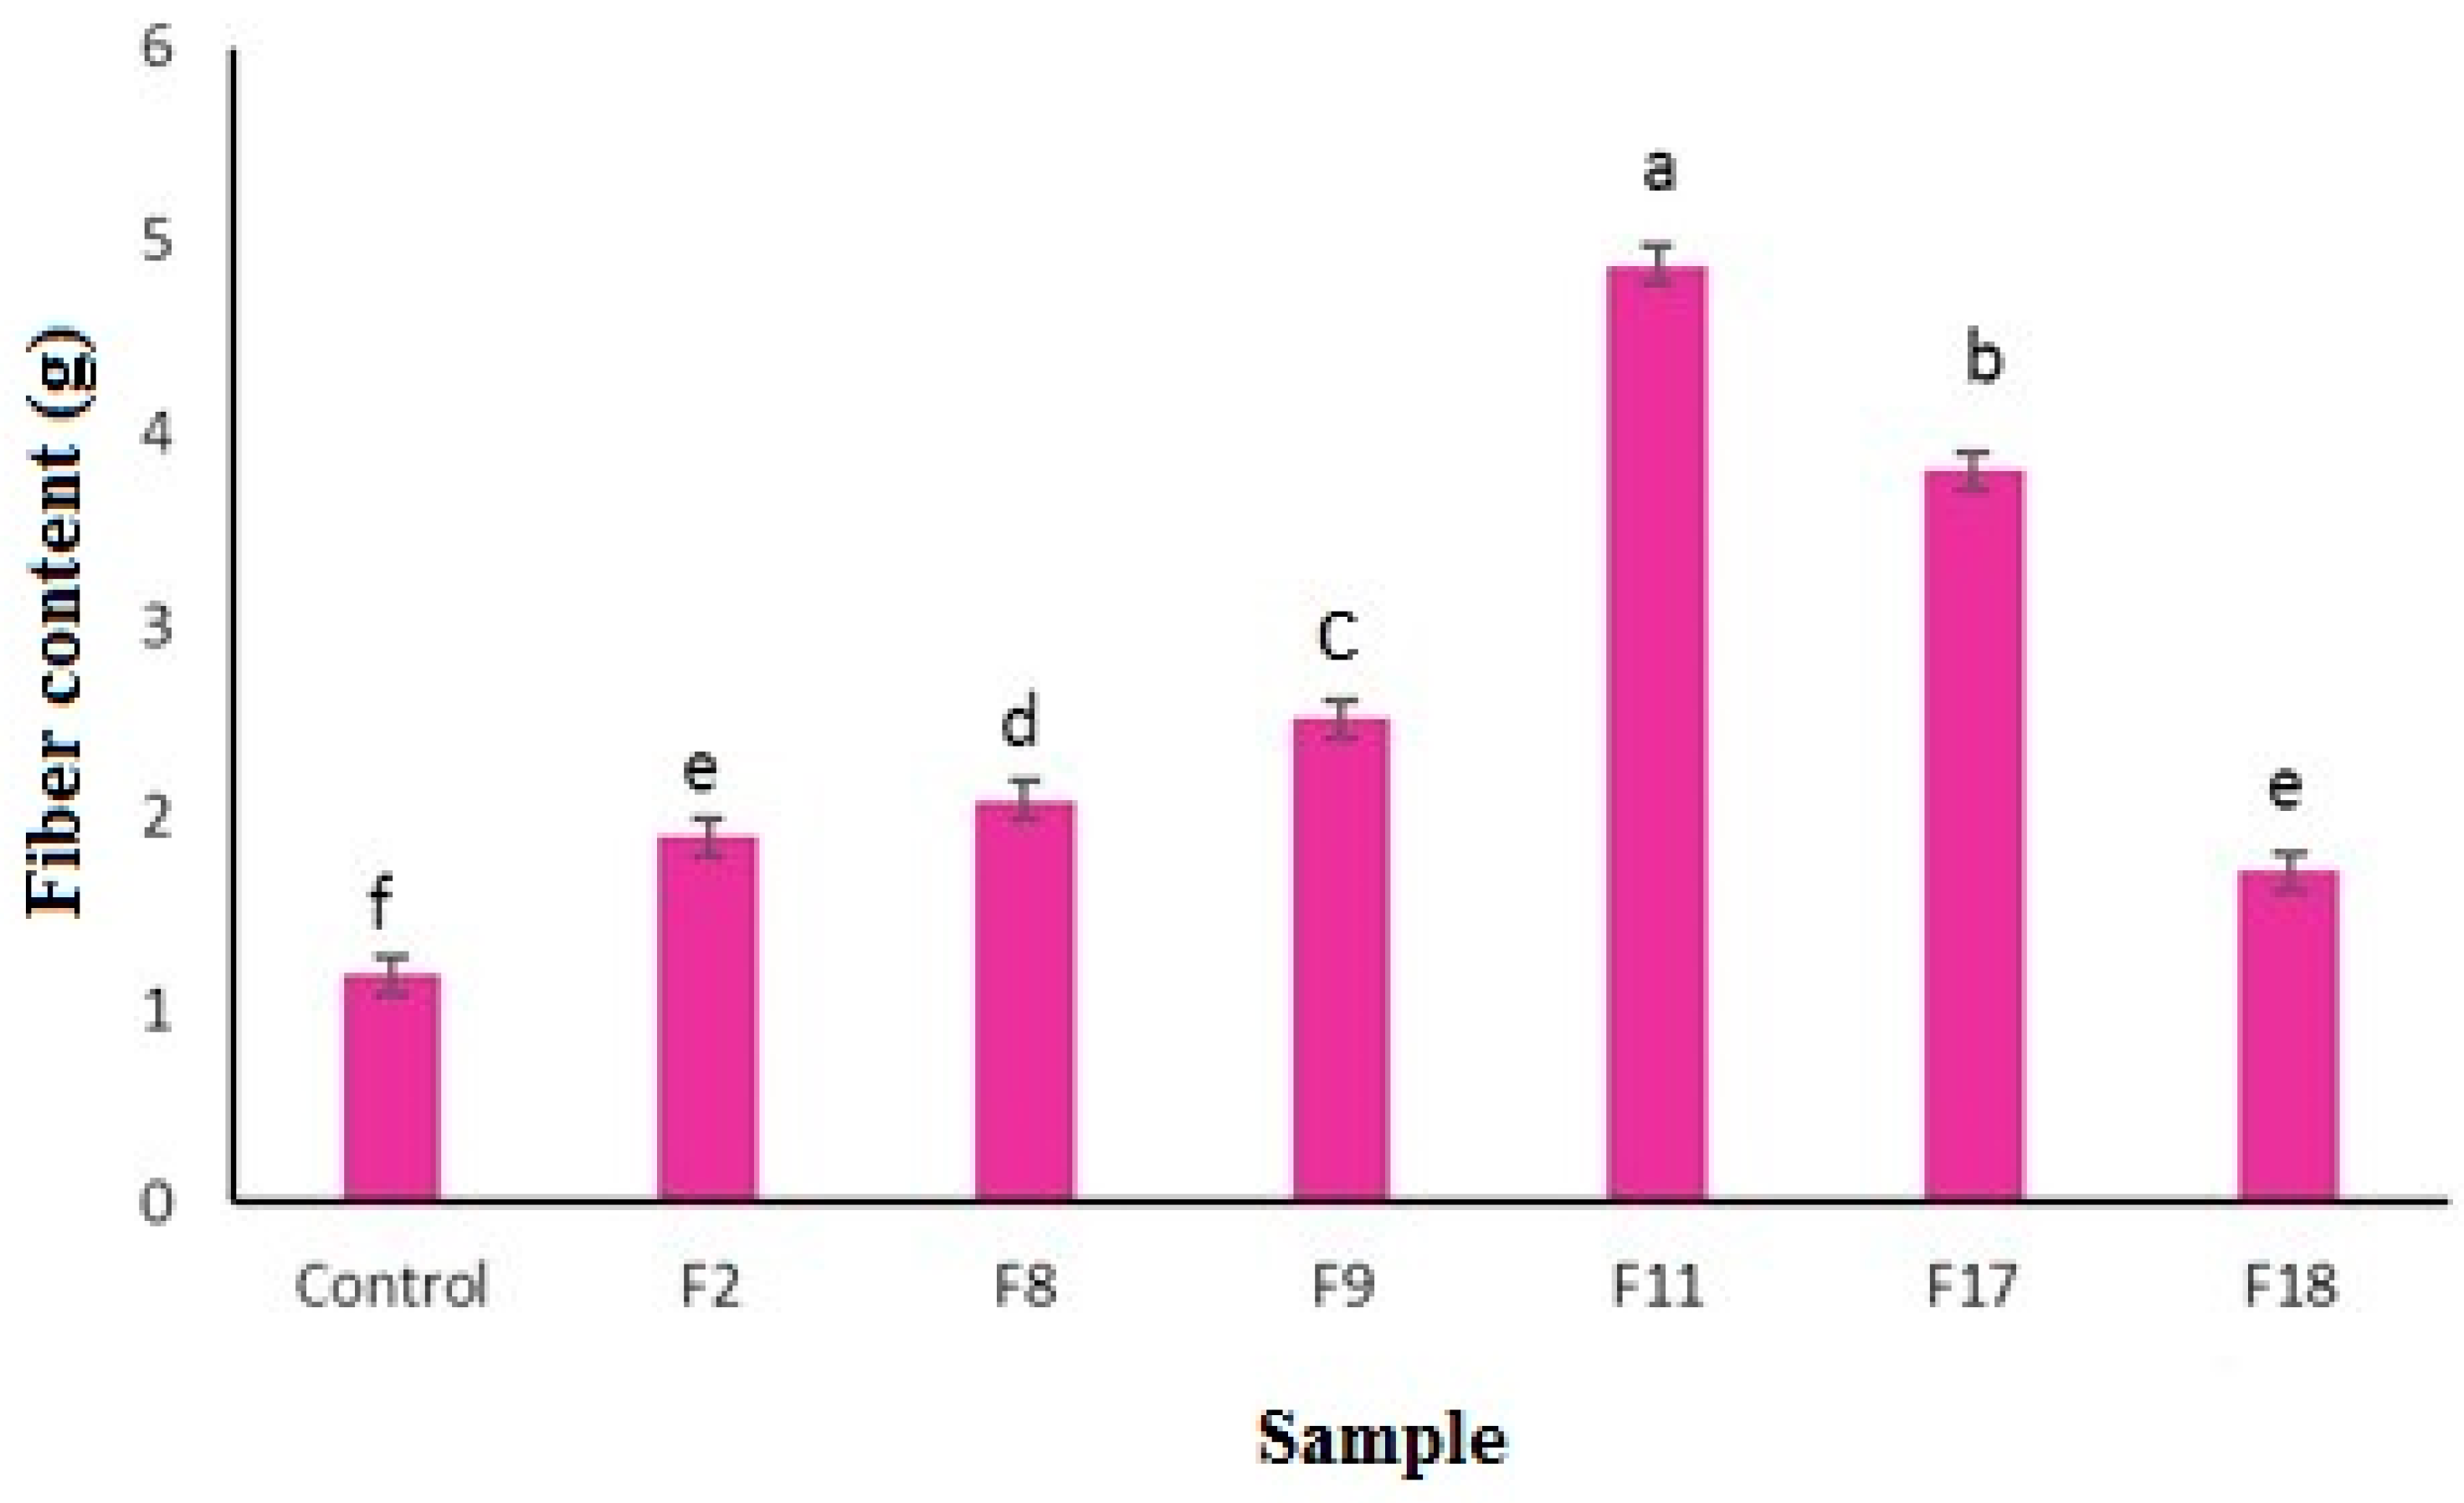
Figure 5.
Lycopene (a) and lutein (b) stabilities in the selected peach nectar formulations during 8 weeks of storage. Different letters show significant differences between samples.
Figure 5.
Lycopene (a) and lutein (b) stabilities in the selected peach nectar formulations during 8 weeks of storage. Different letters show significant differences between samples.
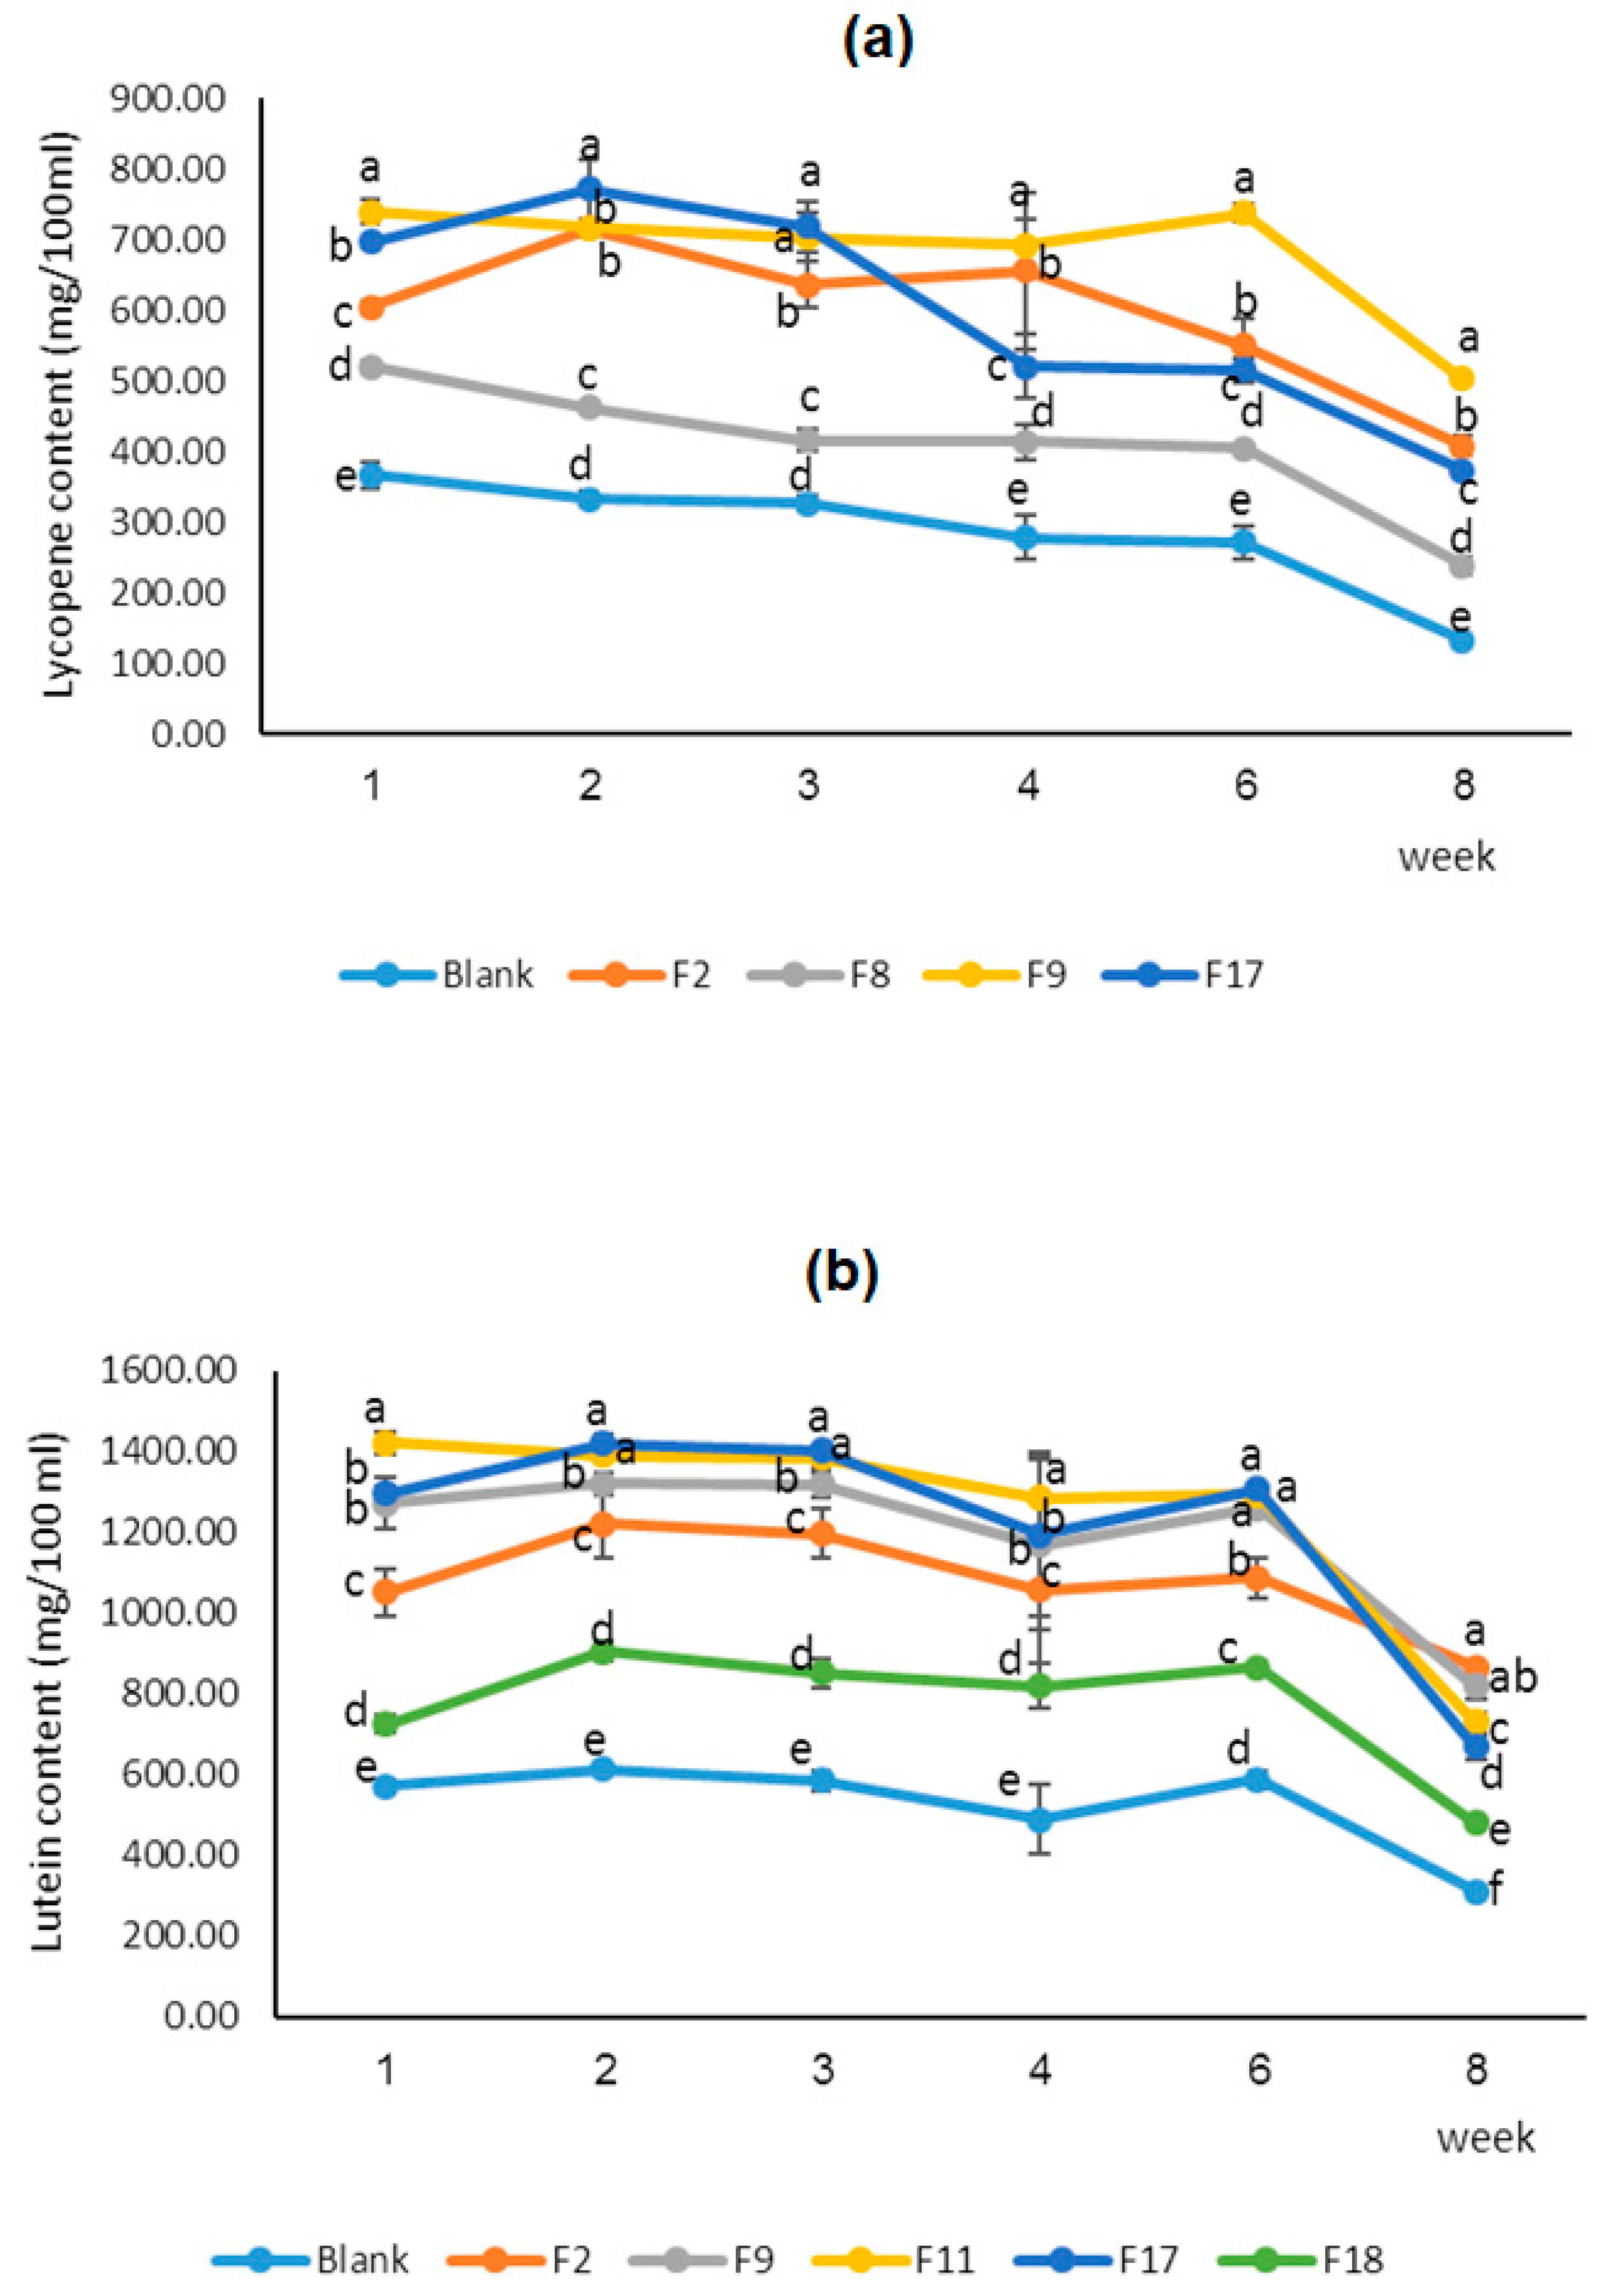
Figure 6.
(a) Lycopene degradation kinetics based on zero-order reaction model, (b) Lycopene degradation kinetics based on first-order reaction model, and (c) Lycopene degradation kinetics based on second-order reaction model. (d) Lutein degradation kinetics based on zero-order reaction model. (e) Lutein degradation kinetics based on first-order reaction model and (f) Lutein degradation kinetics based on second-order reaction model.
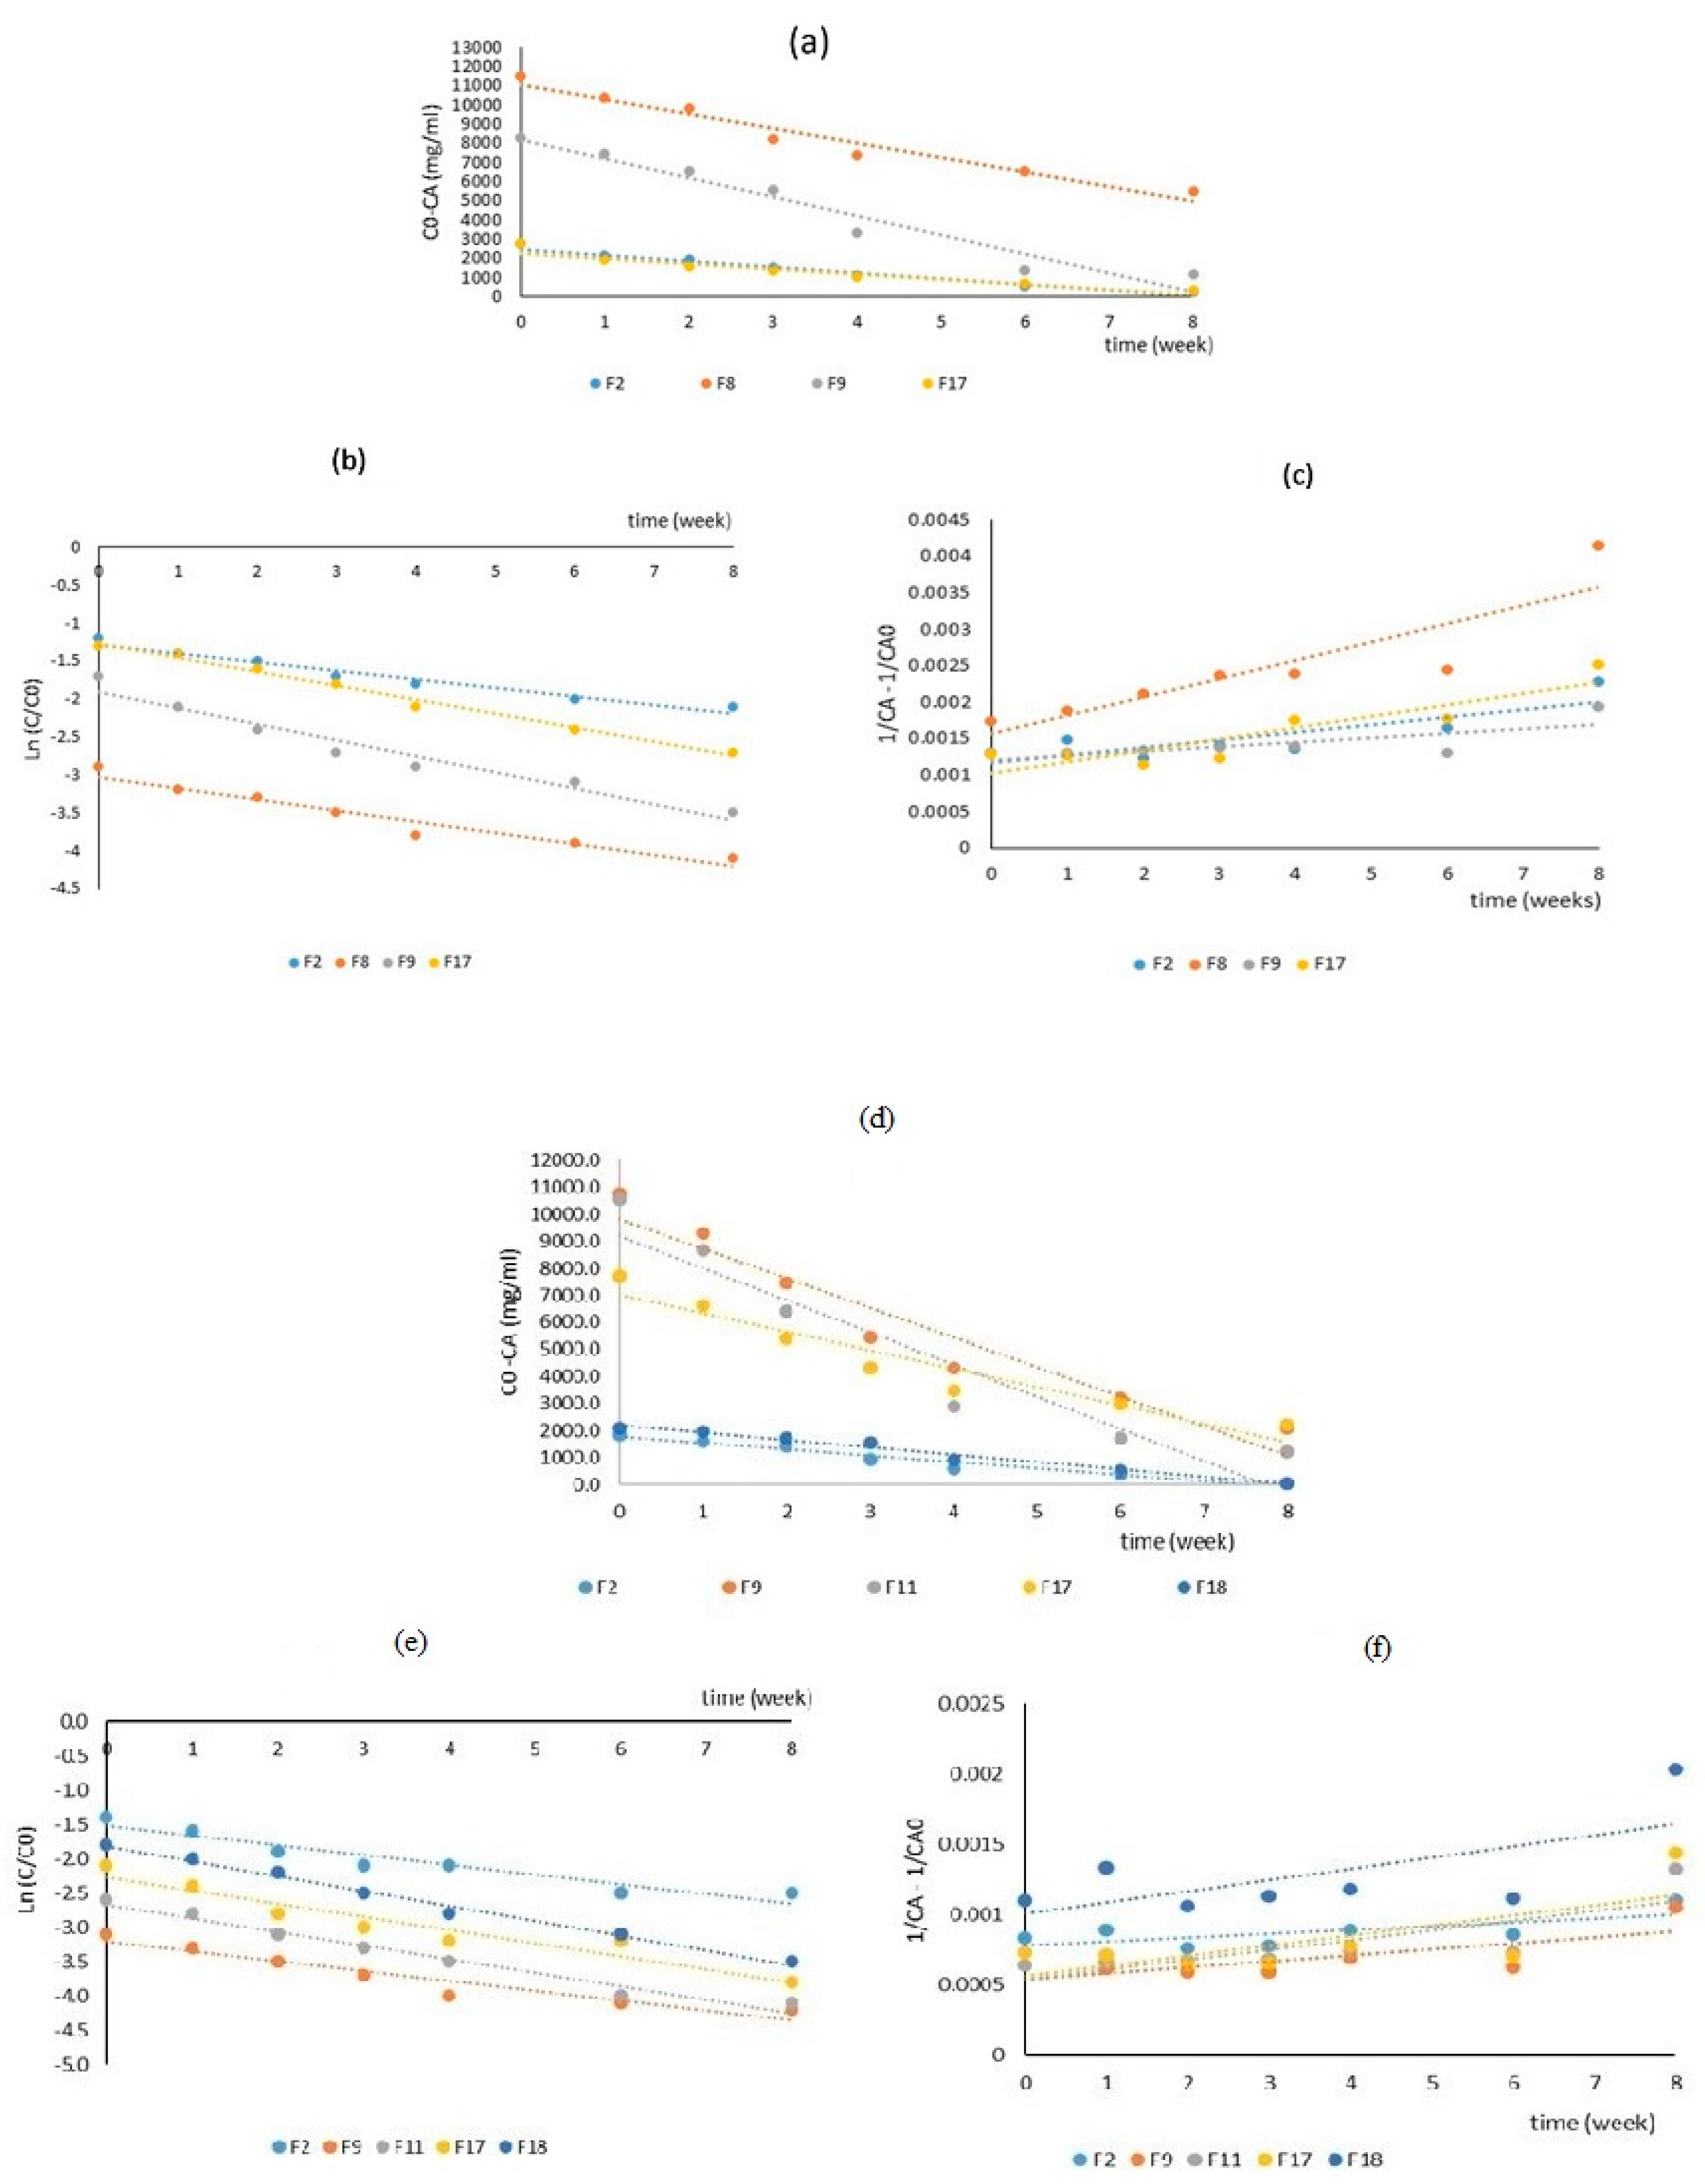
Figure 7.
The rheogams of the selected peach nectar formulations; (a) shear stress- shear rate curves and (b) apparent viscosity – shear rate.
Figure 7.
The rheogams of the selected peach nectar formulations; (a) shear stress- shear rate curves and (b) apparent viscosity – shear rate.
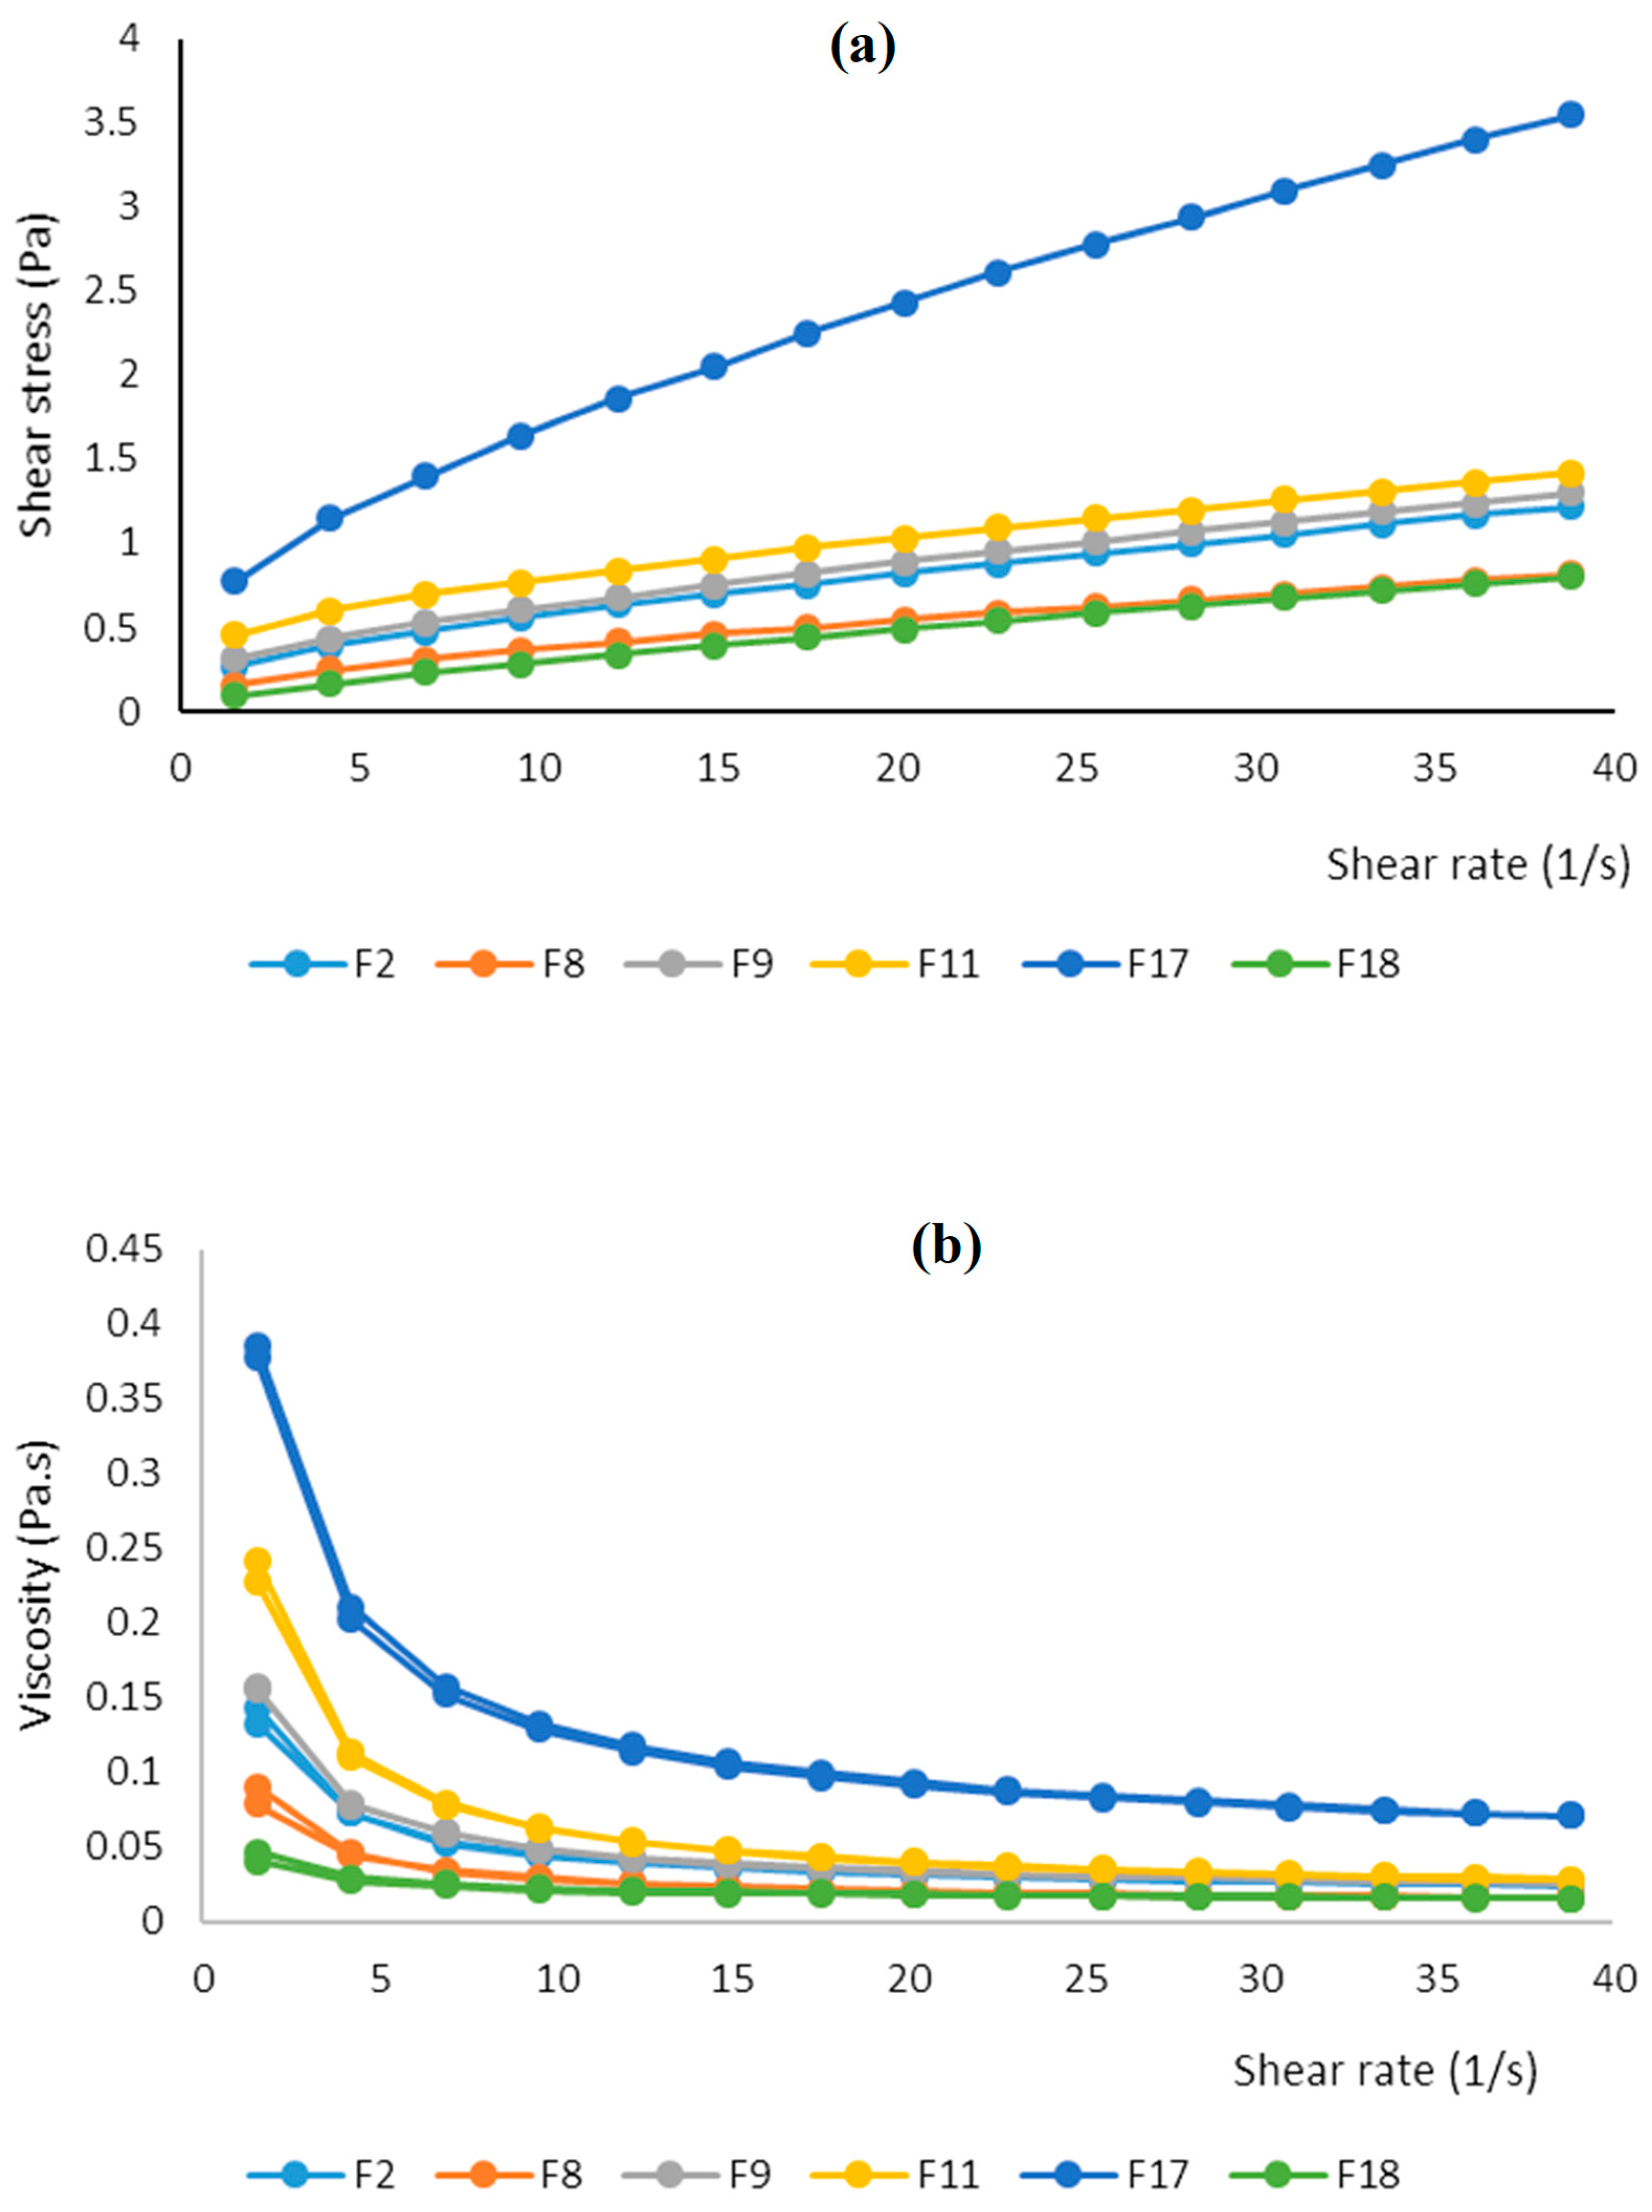
Figure 8.
Sensory evaluation of the selected peach nectar formulations and control sample.
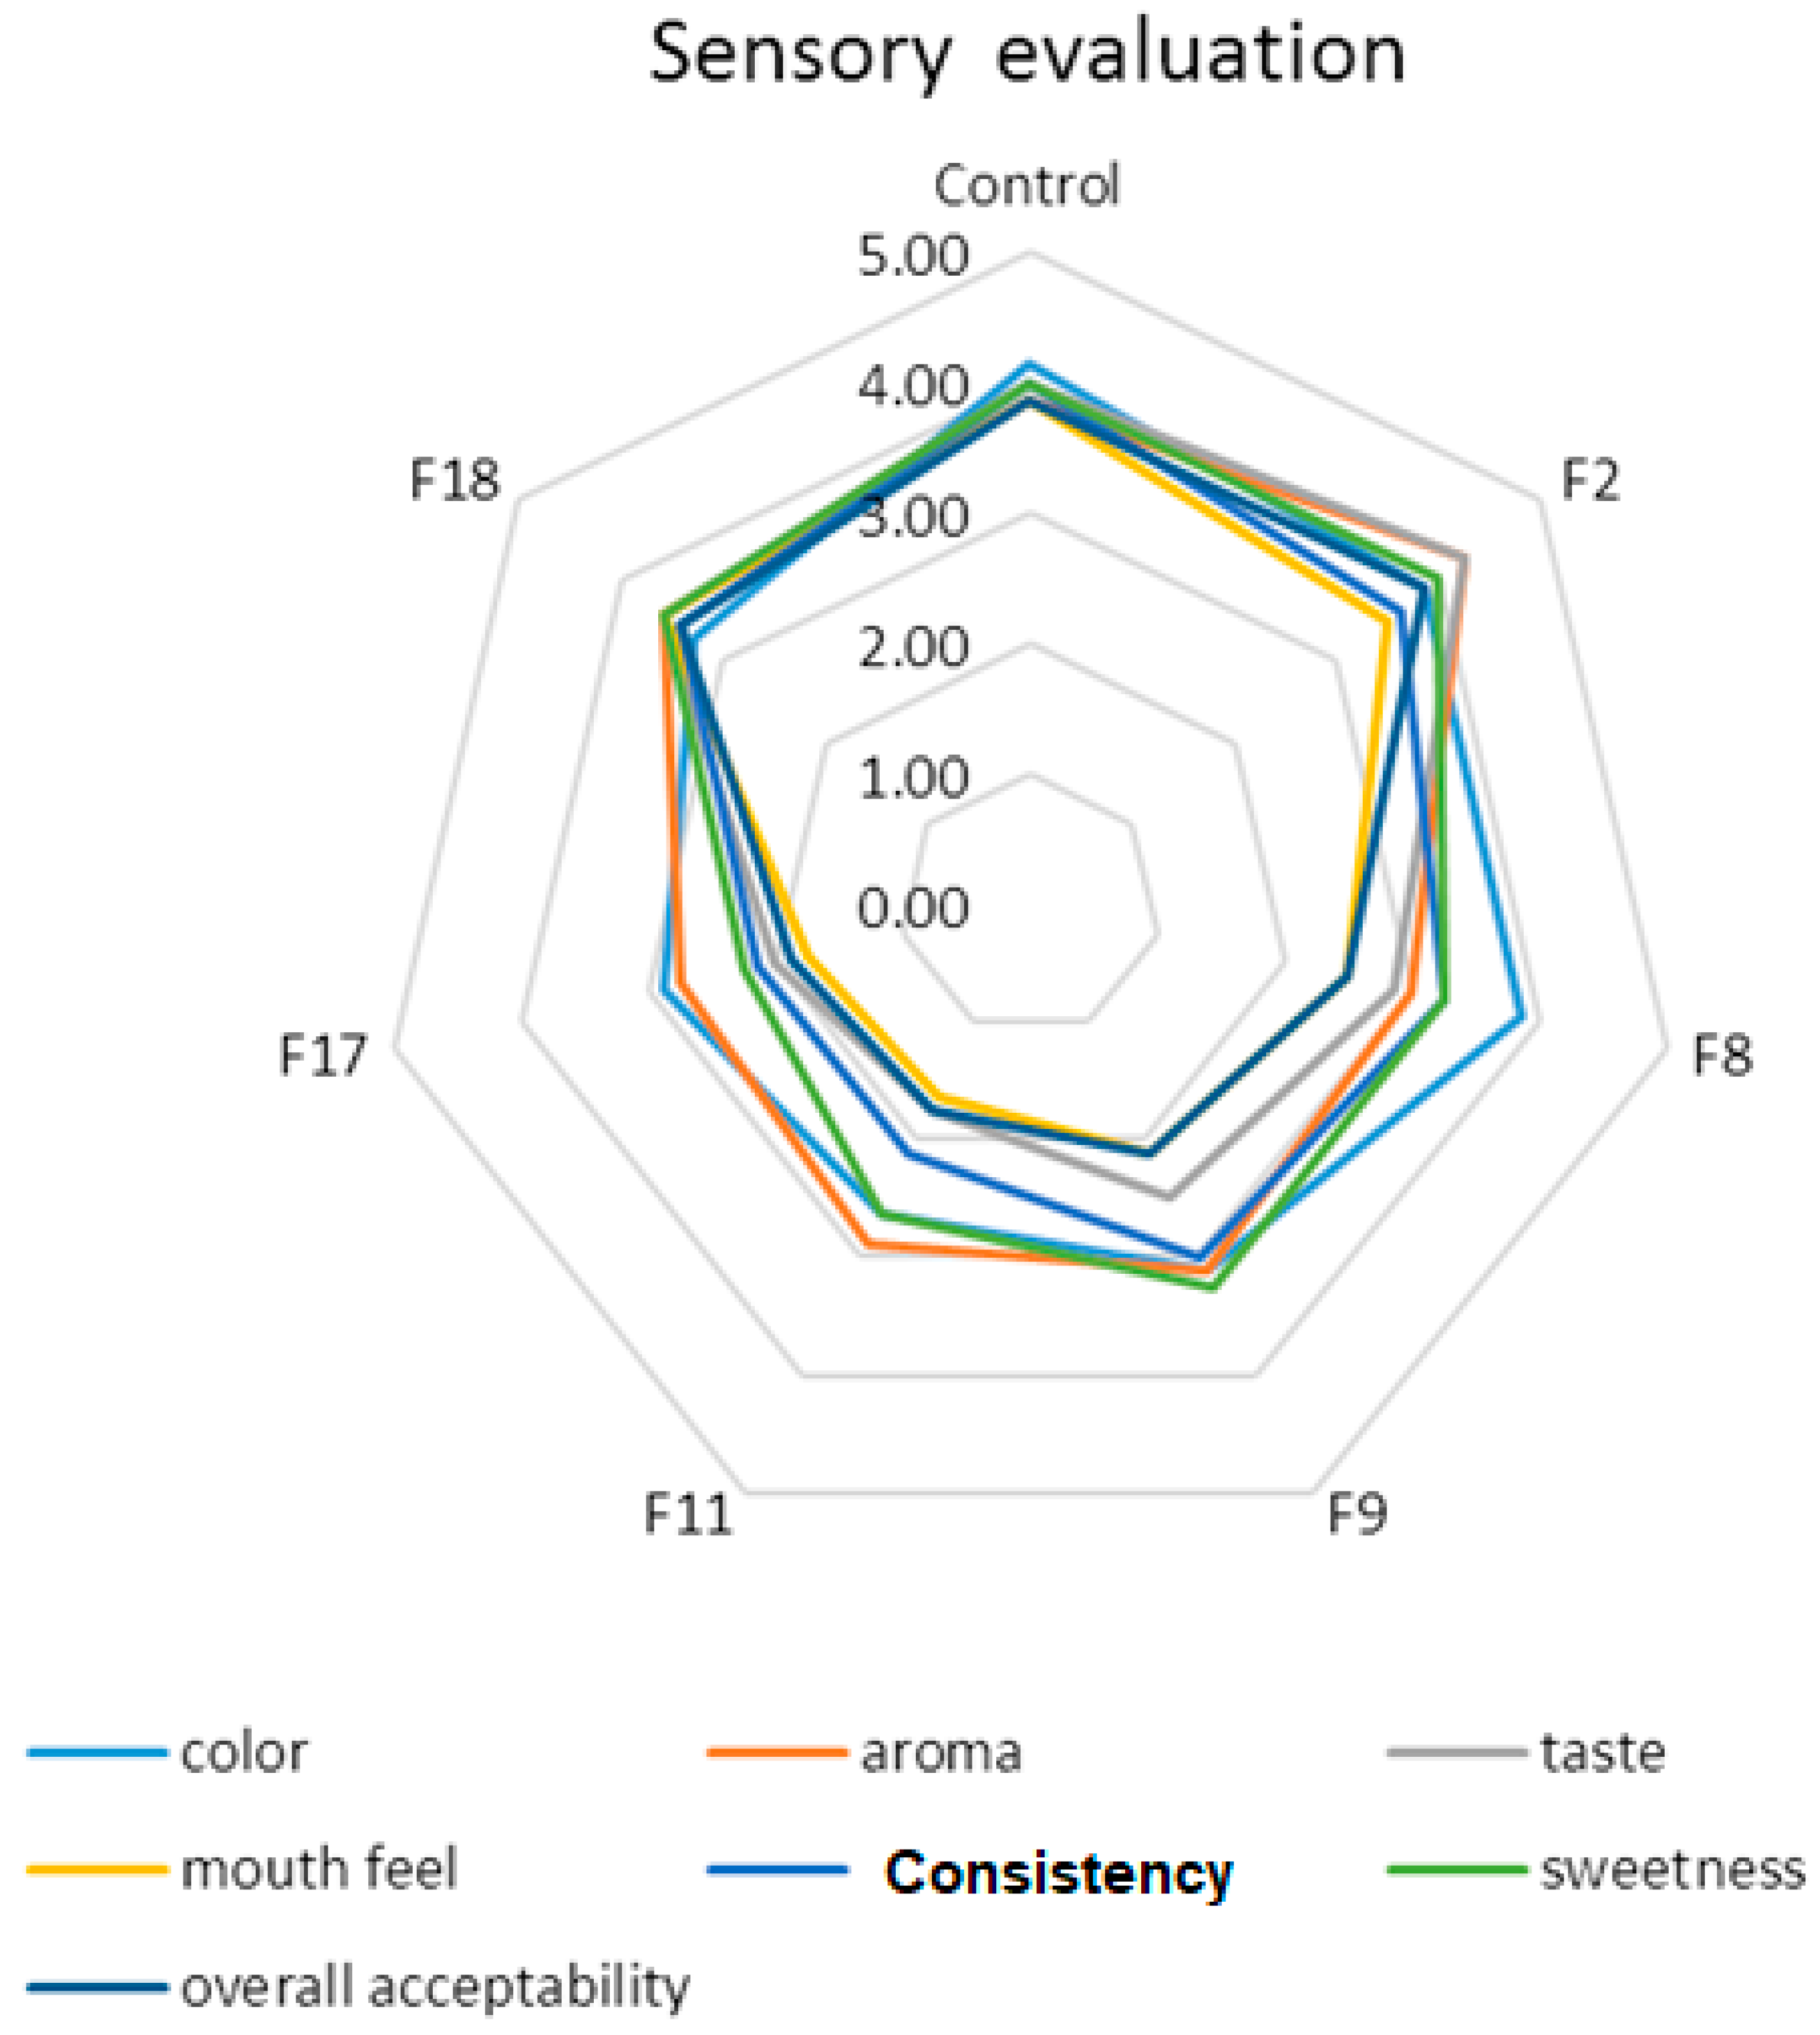
Figure 9.
The turbidity of the selected peach nectar formulations. Different letters show significant differences between samples.
Figure 9.
The turbidity of the selected peach nectar formulations. Different letters show significant differences between samples.
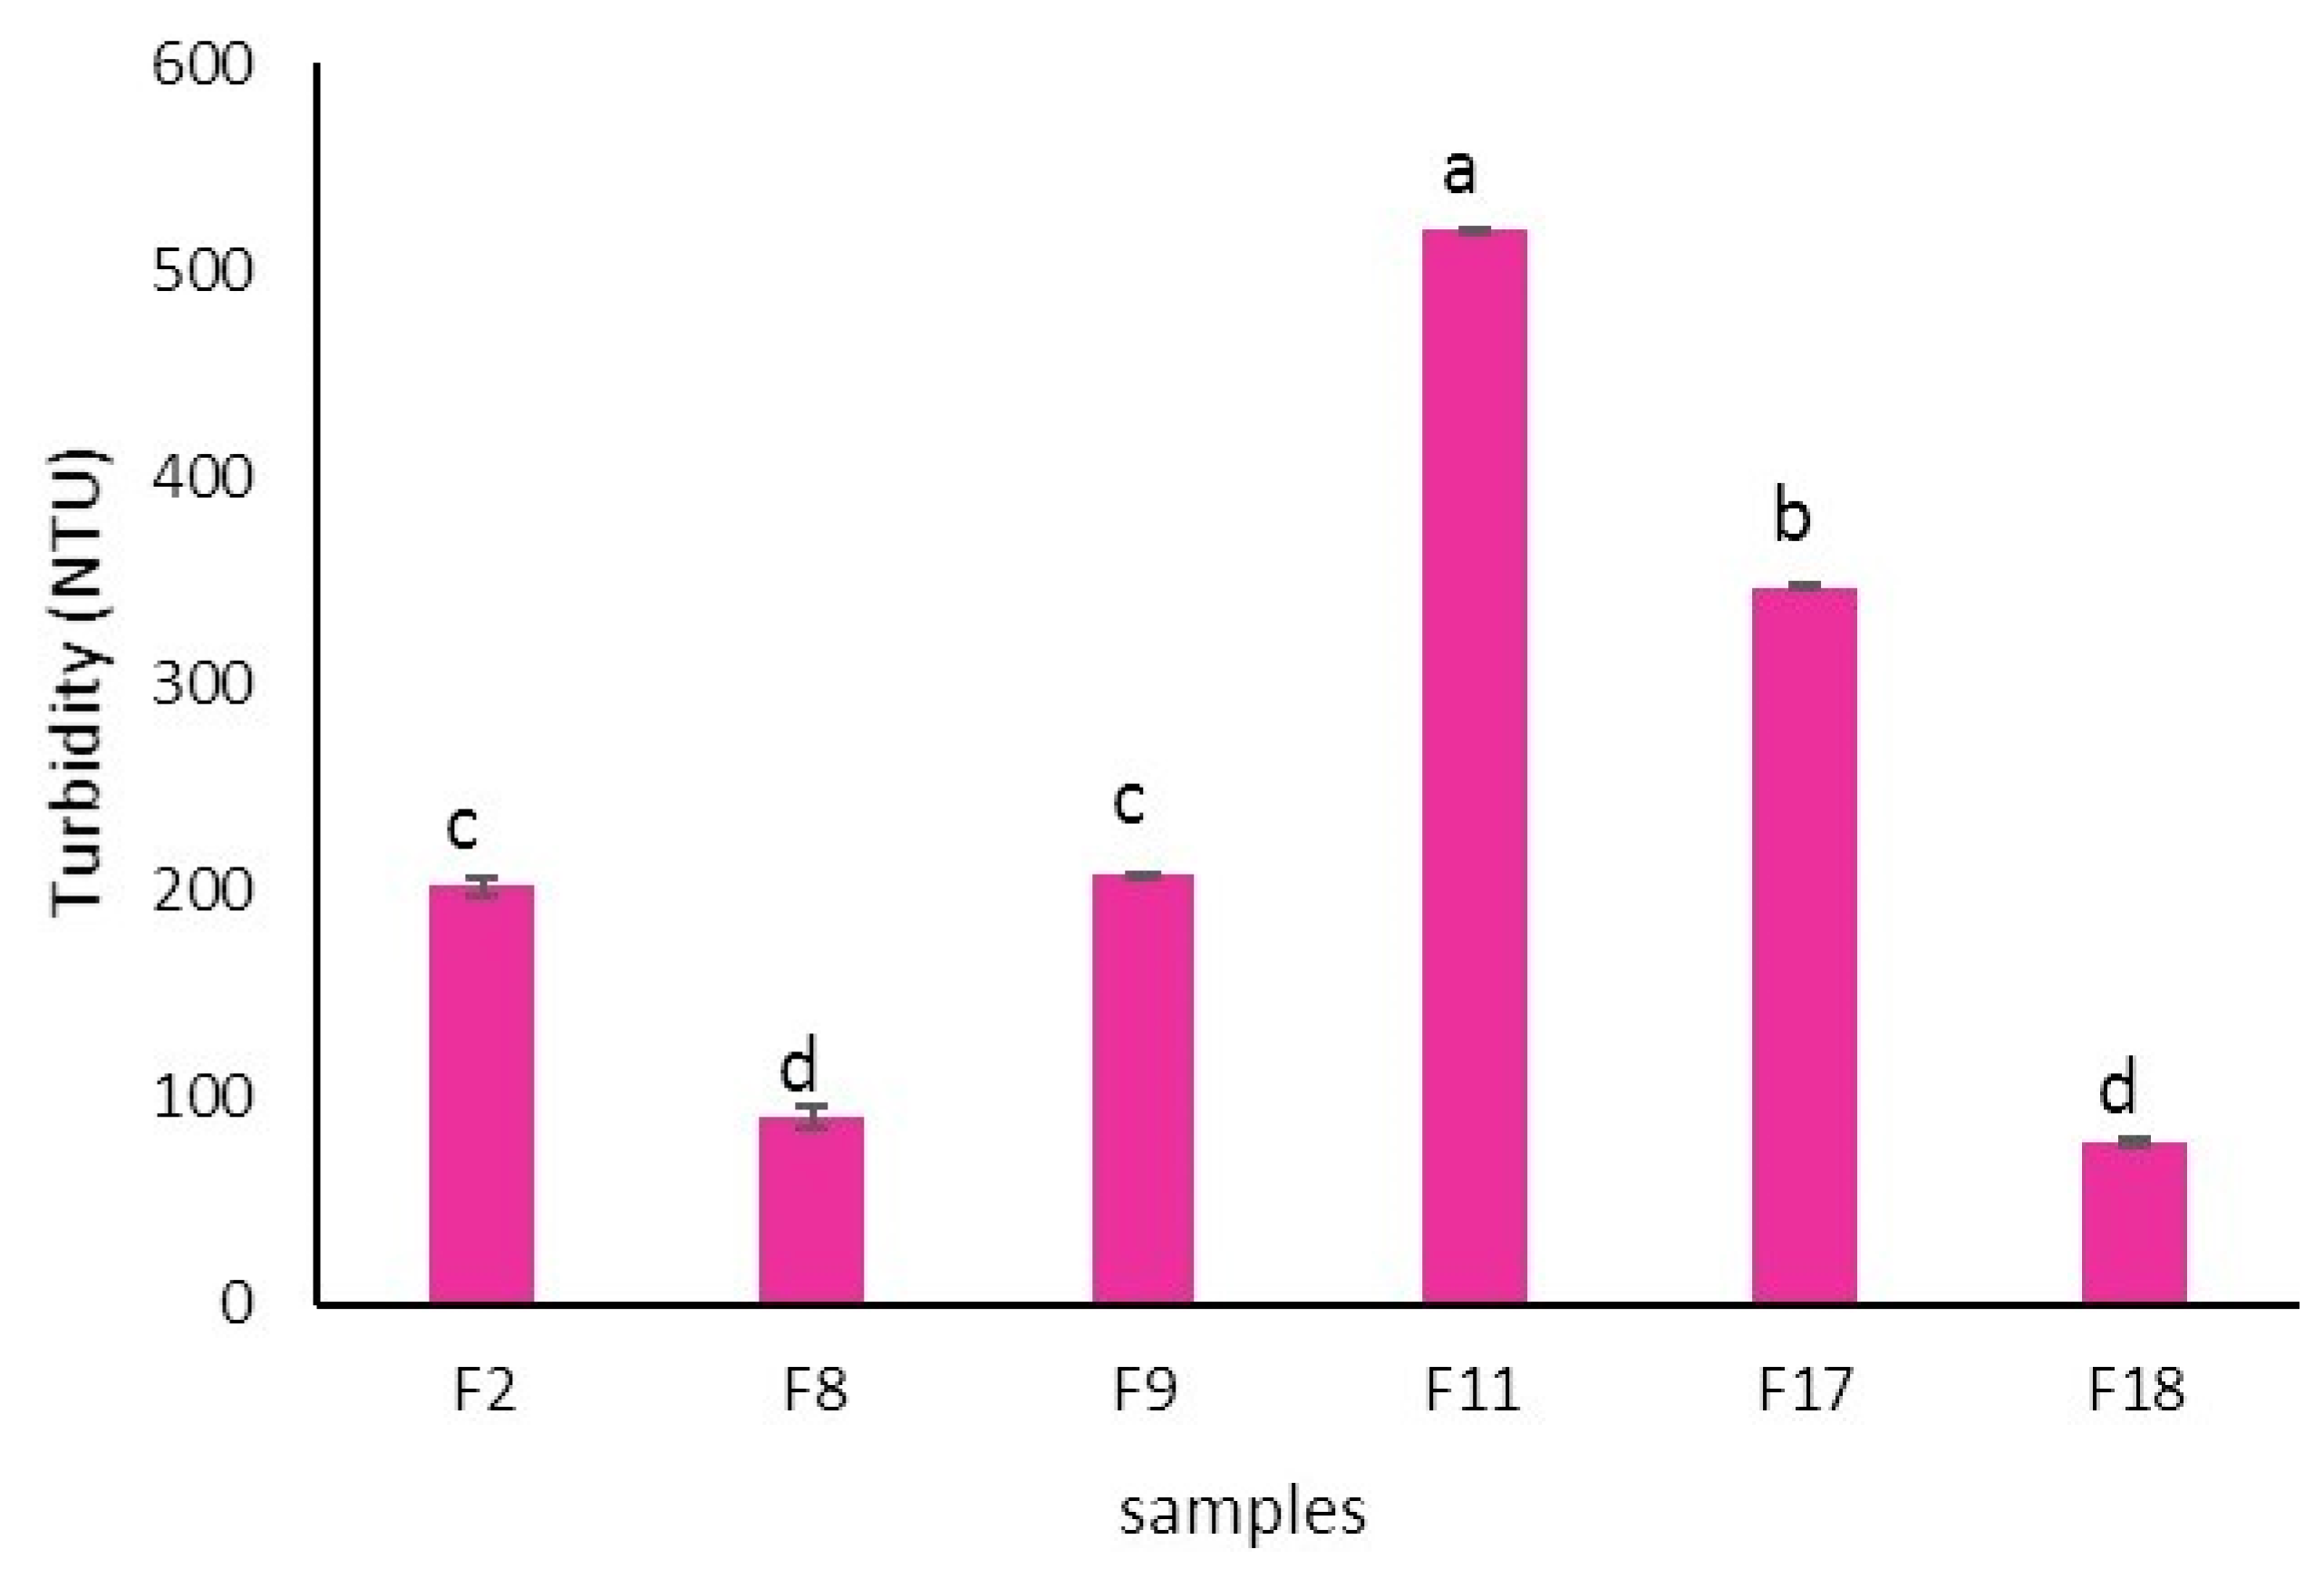
Figure 10.
DPPH antioxidant inhibitory properties of the selected peach nectar formulations during 8 weeks of storage. Different letters show significant differences between samples.
Figure 10.
DPPH antioxidant inhibitory properties of the selected peach nectar formulations during 8 weeks of storage. Different letters show significant differences between samples.
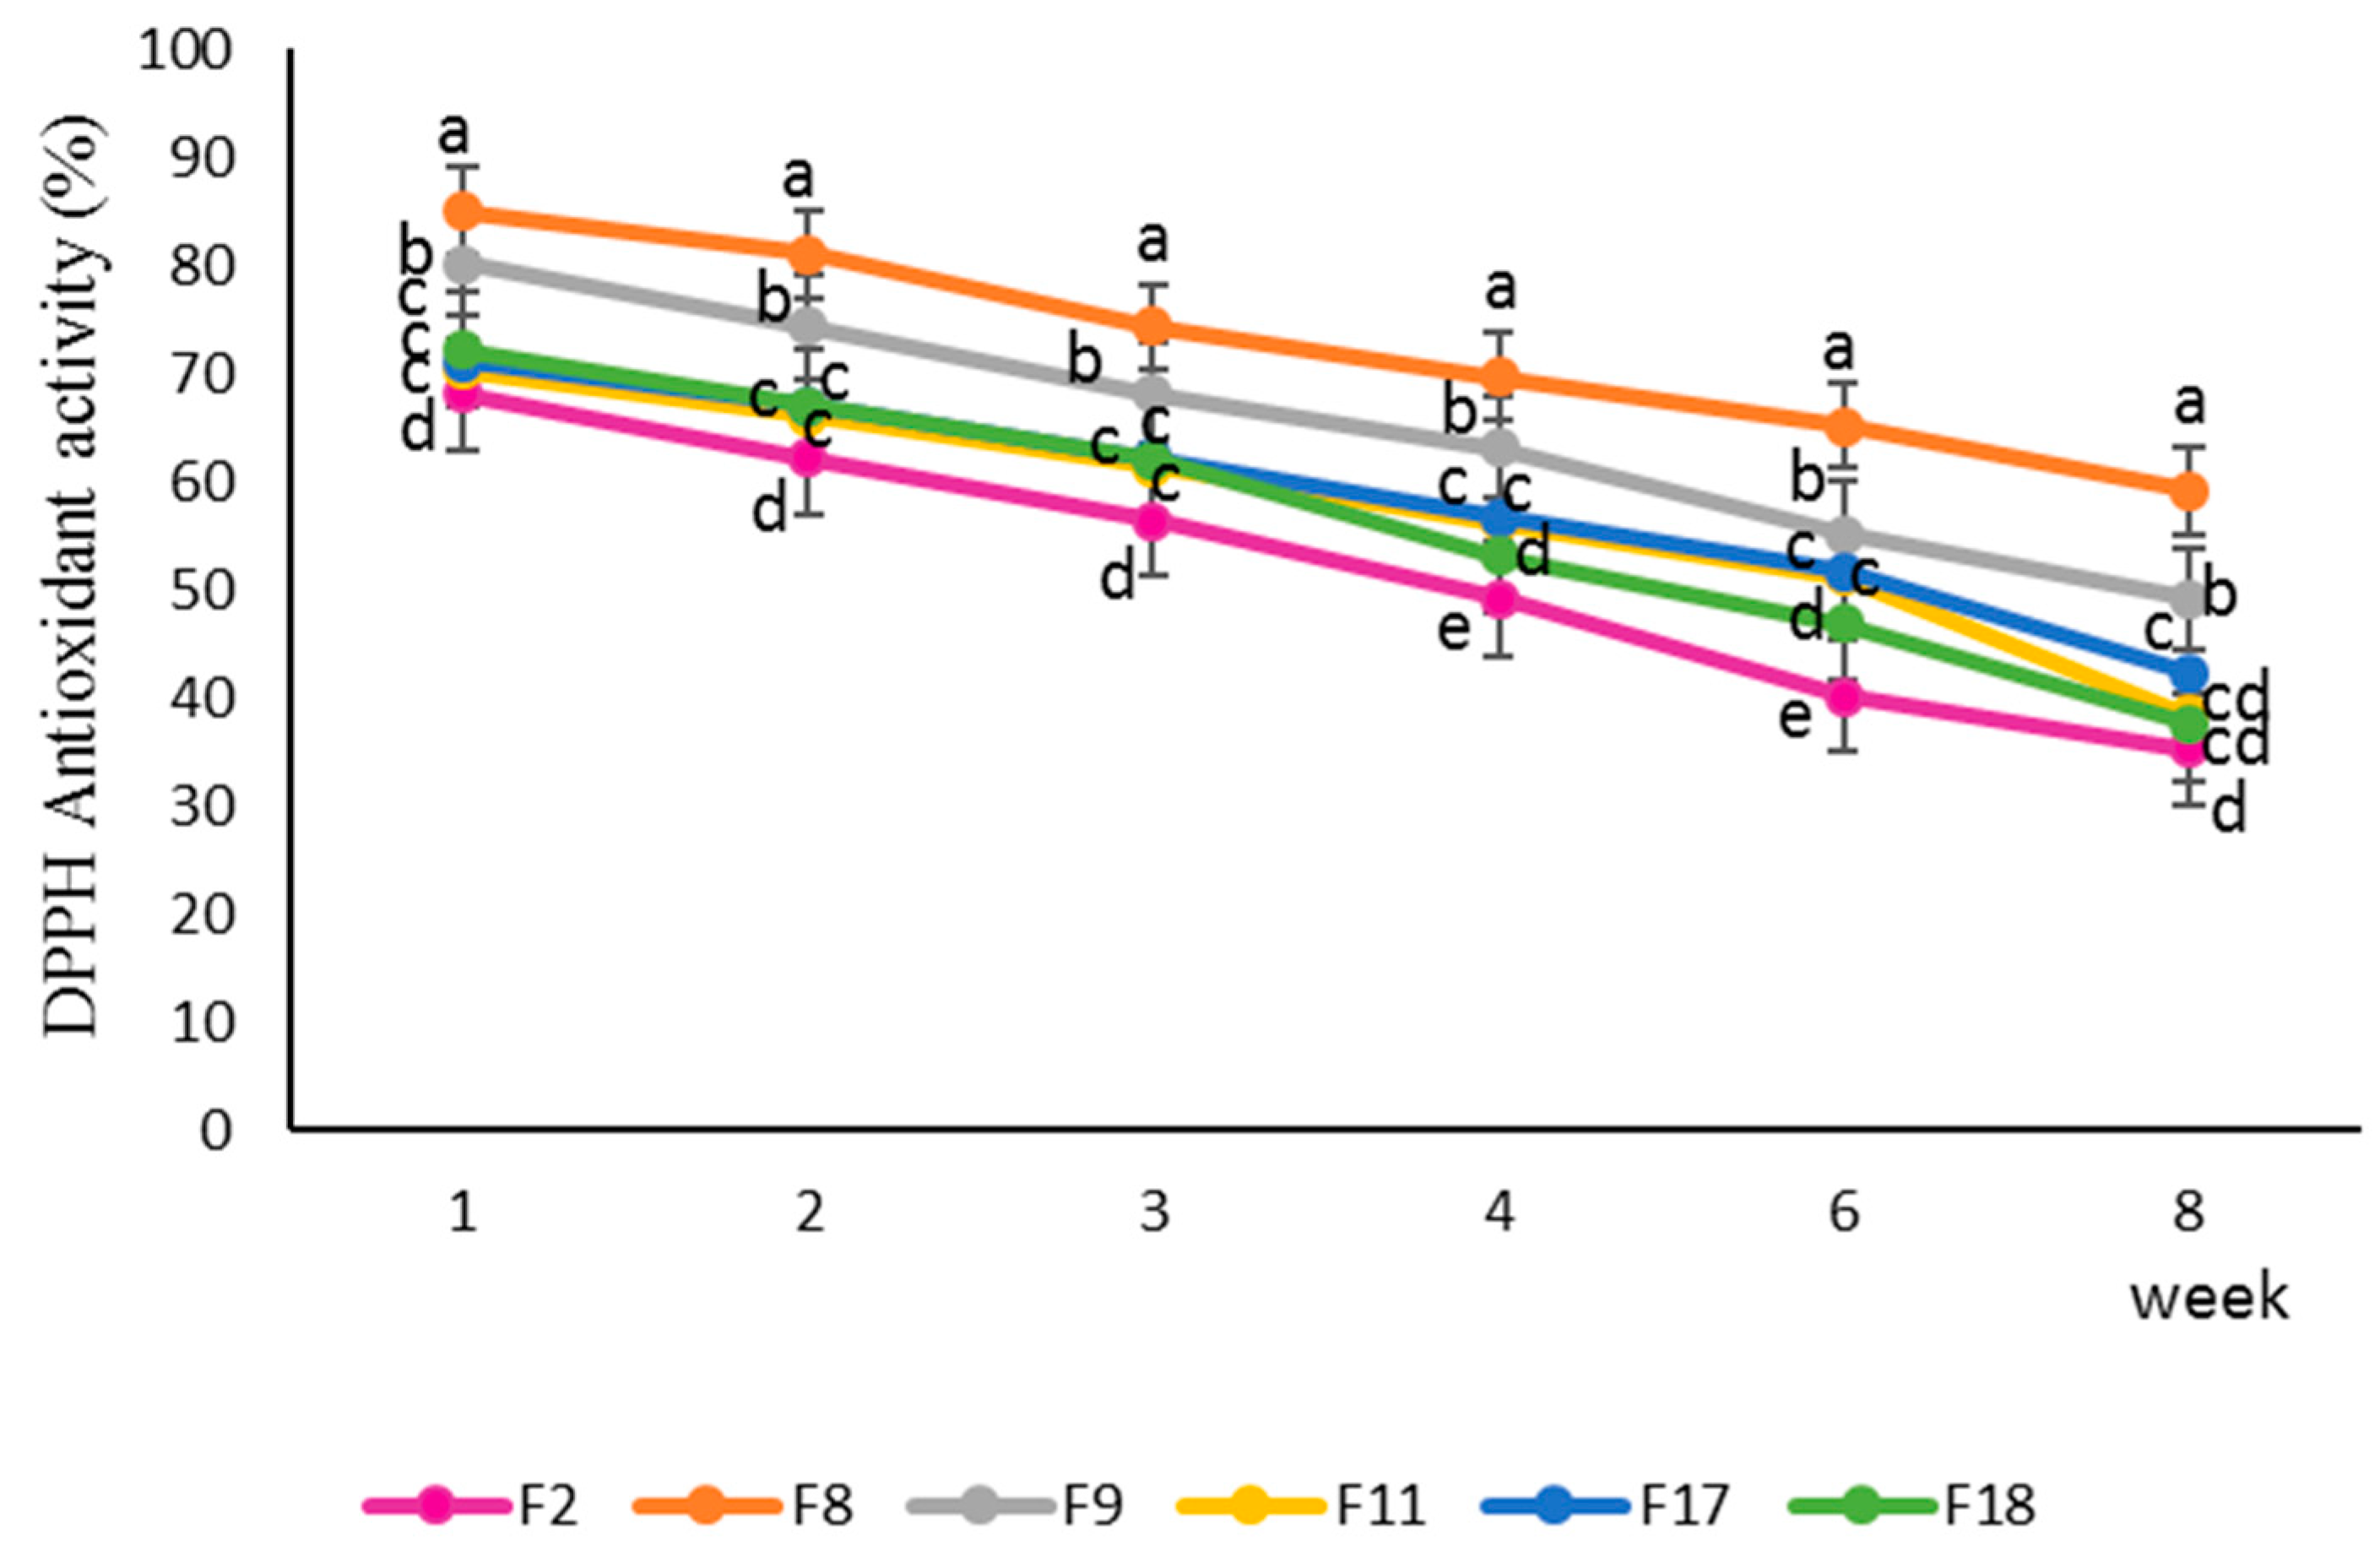

Table 1.
Mixture D-optimal design for independent, and dependent factors and their output data.
|
Run no. |
Polydextrose (w/w %) (X1) |
Orange fiber (w/w %) (X2) |
Bamboo fiber (w/w %) (X3) |
Lutein (w/w %) (X4) |
Lycopene (w/w %) (X5) |
Stability (%) |
DPPH antioxidant inhibitory (%) |
| 1 | 50 | 50 | 0 | 0 | 100 | 66 | 61 |
| 2 | 66.66 | 16.67 | 16.67 | 75 | 25 | 82 | 68 |
| 3 | 100 | 0 | 0 | 50 | 50 | 74 | 62 |
| 4 | 0 | 50 | 50 | 0 | 100 | 53 | 58 |
| 5 | 0 | 100 | 0 | 0 | 100 | 55 | 61 |
| 6 | 0 | 0 | 100 | 0 | 100 | 42 | 56 |
| 7 | 0 | 100 | 0 | 100 | 0 | 54 | 52 |
| 8 | 100 | 0 | 0 | 0 | 100 | 88 | 85 |
| 9 | 66.66 | 16.67 | 16.67 | 25 | 75 | 80 | 80 |
| 10 | 50 | 0 | 50 | 100 | 0 | 62 | 58 |
| 11 | 0 | 0 | 100 | 100 | 0 | 45 | 70 |
| 12 | 0 | 0 | 100 | 50 | 50 | 45 | 42 |
| 13 | 0 | 100 | 0 | 50 | 50 | 57 | 59 |
| 14 | 50 | 50 | 0 | 100 | 0 | 62 | 66 |
| 15 | 50 | 0 | 50 | 50 | 50 | 46 | 55 |
| 16 | 16.67 | 16.67 | 66.66 | 50 | 50 | 47 | 53 |
| 17 | 16.67 | 66.66 | 16.67 | 75 | 25 | 58 | 71 |
| 18 | 100 | 0 | 0 | 100 | 0 | 87 | 72 |
| 19 | 50 | 0 | 50 | 0 | 100 | 59 | 64 |
| 20 | 0 | 50 | 50 | 50 | 50 | 43 | 49 |
| 21 | 50 | 50 | 0 | 50 | 50 | 61 | 65 |
| 22 | 0 | 100 | 0 | 25 | 75 | 56 | 67 |
| 23 | 0 | 0 | 100 | 75 | 25 | 41 | 58 |
| 24 | 16.67 | 66.66 | 16.67 | 50 | 50 | 52 | 61 |
Table 2.
The suggested fitted models for different responses and model summary statistics in mixture D optimal design for the peach nectar formulations.
Table 2.
The suggested fitted models for different responses and model summary statistics in mixture D optimal design for the peach nectar formulations.
|
Source |
Suggested Models | Sequential p-value | Partial Sum of Squares s | Lack of Fit (LOF) | Model Summary Statistics (MSS) | Adeq Precision | CV% | |||||
| Mix Order | Process Order | Mix | Process | Sum of Squares | Mean Square | R2 | Adj-R2 | Pred-R2 | ||||
| Stability | Linear | Mean | <0.0001*** | - | 4406.90 | 2203.45 | 0.4993 | 0.9413 | 0.9357 | 0.9268 | 32.52 | 5.79 |
| DPPH inhibitory | Linear | Linear | <0.0001*** | 0.0207* | 3626.59 | 725.32 | 0.3225 | 0.9114 | 0.8867 | 0.8204 | 20.043 | 7.24 |
Table 3.
Regression coefficients for the response variables and analysis of variance of the regression models.
Table 3.
Regression coefficients for the response variables and analysis of variance of the regression models.
| Source | Stability | DPPH inhibitory | ||
| F-value | p-value | F-value | p-value | |
| X1X4X5 | 0.12 | 0.7305 | 1.50 | 0.2395 |
| X2X4X5 | 0.040* | 0.8451 | 0.21 | 0.6560 |
| X3X4X5 | 0.064* | 0.8036 | 1.30 | 0.2713 |
Values are represented as mean ± SD (n = 3), ns, *P indicated significant differences at the 0.05 level.
Table 4.
The Mineral and trace element content (mg/kg) of the selected fortified samples.
| sample | Al | As | Ba | Ca | Cd | Cr | Cu | Fe | Hg | Mg | Mn | Na | Ni | Pb | Se | Zn |
| F2 | 1.81 | N.D | 0.054 | 50.1 | N.D | N.D | 0.132 | 2.38 | N.D | 30.7 | 0.156 | 77.1 | N.D | N.D | N.D | 0.856 |
| F8 | 1.58 | N.D | 0.048 | 40.6 | N.D | N.D | 0.146 | 2.73 | N.D | 31.2 | 0.153 | 92.6 | N.D | N.D | N.D | 2.75 |
| F9 | 1.35 | N.D | 0.044 | 46.6 | N.D | N.D | 0.123 | 3.51 | N.D | 30.4 | 0.152 | 82 | N.D | N.D | N.D | 0.867 |
| F11 | 1.36 | N.D | 0.09 | 38.9 | N.D | N.D | 0.105 | 1.69 | N.D | 26.9 | 0.167 | 64.8 | N.D | N.D | N.D | 0.667 |
| F17 | 2.02 | N.D | 0.074 | 101 | N.D | N.D | 0.164 | 2.51 | N.D | 38.2 | 0.197 | 74.9 | N.D | N.D | N.D | 0.744 |
| F18 | 1.42 | N.D | 0.068 | 54.6 | N.D | N.D | 0.084 | 2.55 | N.D | 37.1 | 0.274 | 248 | N.D | N.D | N.D | 0.525 |
Table 5.
Brix, acidity, p H, and formalin index of the control sample and selected fortified samples.
Table 5.
Brix, acidity, p H, and formalin index of the control sample and selected fortified samples.
| samples | Brix | Acidity (g/100ml) | p H | Formalin index(ml/100ml) |
| control | 12.20±0.01g | 0.40±0.01bc | 3.13±0.02a | 5.00±0.01a |
| F2 | 14.23±0.02b | 0.45±0.01a | 3.13±0.01a | 4.96±0.02a |
| F8 | 14.53±0.02a | 0.39±0.02c | 3.04±0.01a | 4.96±0.01a |
| F9 | 13.80±0.01d | 0.40±0.02bc | 3.11±0.02a | 4.91±0.01a |
| F11 | 12.37±0.01f | 0.40±0.01bc | 3.09±0.02a | 4.92±0.01a |
| F17 | 13.00±0.02e | 0.40±0.01bc | 3.23±0.01a | 4.95±0.02a |
| F18 | 14.00±0.03c | 0.41±0.02b | 3.17±0.02a | 4.91±0.02a |
Different letters show a significant difference between samples at the 5% level of the Duncan test.
Table 6.
The kinetic parameters of zero-order, first-order, and second-order reactions for lycopene and lutein degradation during 8 weeks of storage. K, the reaction rate constant, R2 value.
Table 6.
The kinetic parameters of zero-order, first-order, and second-order reactions for lycopene and lutein degradation during 8 weeks of storage. K, the reaction rate constant, R2 value.
| Degradation Kinetics | Zero-order Reaction | First-order Reaction | Second-order | ||||
| reaction | |||||||
| Sample |
K0( mg.100 ml-1.day-1) |
R2 |
K1( day-1) |
R2 |
K2(100 ml. mg.-1.day-1) |
R2 |
|
| Lycopene | |||||||
| F2 | 20.01 | 0.9 | 0.112 | 0.95 | 0.009 | 0.74 | |
| F8 | 75.41 | 0.95 | 0.147 | 0.94 | 0.0012 | 0.67 | |
| F9 | 17.23 | 0.95 | 0.212 | 0.95 | 0.001 | 0.66 | |
| F17 | 18.64 | 0.91 | 0.188 | 0.98 | 0.008 | 0.79 | |
| Lutein | |||||||
| F2 | 23.37 | 0.94 | 0.141 | 0.91 | 0.0004 | 0.76 | |
| F8 | 10.91 | 0.92 | 0.142 | 0.91 | 0.0008 | 0.65 | |
| F11 | 17.84 | 0.88 | 0.198 | 0.97 | 0.0006 | 0.54 | |
| F17 | 67.69 | 0.91 | 0.191 | 0.91 | 0.0009 | 0.69 | |
| F19 | 27.47 | 0.97 | 0.216 | 0.99 | 0.0009 | 0.55 | |
Table 7.
Power law model parameters of the selected fortified peach nectar.
| Sample | K (Pasn) | n | R2 |
| F2 | 0.175 | 0.481 | 0.98 |
| F8 | 0.102 | 0.517 | 0.96 |
| F9 | 0.204 | 0.457 | 0.94 |
| F11 | 0.326 | 0.360 | 0.91 |
| F17 | 0.493 | 0.492 | 0.95 |
| F18 | 0.053 | 0.685 | 0.99 |
Table 8.
L*, a*, b*, Hunter parameters of the selected fortified peach nectar for color evaluation.
| Sample | L | a | b |
| Control | 59.1 ±0.4b | 12.6±0.1b | 36.2±0.1b |
| F2 | 60.5±0.3a | 6.8±0.3c | 36.0±0.2b |
| F8 | 61.9±0.5a | 14.6±0.0a | 36.4±0.1b |
| F9 | 55.1±0.2c | 12.4±0.6c | 33.8±0.2c |
| F11 | 56.4±0.1c | 4.2±0.2d | 33.17±0.3c |
| F17 | 56.0±0.2c | 7.2±0.6c | 44.4±0.1a |
| F18 | 61.2±0.3d | 2.2±0.3e | 32.8±0.1c |
Different letters show a significant difference between samples at the 5% level of the Duncan test.
Table 9.
ABTS+ scavenging activity, TEAC value, RP-CA value of the selected peach nectar formulations.
Table 9.
ABTS+ scavenging activity, TEAC value, RP-CA value of the selected peach nectar formulations.
| Sample | ABTS(%) | TEAC(m M) | Reducing Power |
| F2 | 60.93 ±0.01c | 1.61±0.01c | 0.46±0.00a |
| F8 | 83.47±0.00a | 2.25±0.00a | 0.34±0.01b |
| F9 | 68.22±0.02b | 1.82±0.02b | 0.29±0.01c |
| F11 | 51.22±0.01d | 1.33±0.01d | 0.28±0.01c |
| F17 | 69.89±0.02b | 1.86±0.01b | 0.24±0.02cd |
| F18 | 60.01±0.03c | 1.58±0.03c | 0.29±0.02c |
Different letters show a significant difference between samples at the 5% level of the Duncan test.
Disclaimer/Publisher’s Note: The statements, opinions and data contained in all publications are solely those of the individual author(s) and contributor(s) and not of MDPI and/or the editor(s). MDPI and/or the editor(s) disclaim responsibility for any injury to people or property resulting from any ideas, methods, instructions or products referred to in the content. |
© 2025 by the authors. Licensee MDPI, Basel, Switzerland. This article is an open access article distributed under the terms and conditions of the Creative Commons Attribution (CC BY) license (http://creativecommons.org/licenses/by/4.0/).
Copyright: This open access article is published under a Creative Commons CC BY 4.0 license, which permit the free download, distribution, and reuse, provided that the author and preprint are cited in any reuse.


