
Submitted:
03 February 2025
Posted:
04 February 2025
You are already at the latest version
Abstract
A serious challenge for humanity is to find an adequate response to stop the accelerating global temperature increase caused by atmospheric carbon dioxide emissions. The question arises regarding how robust international objectives and climate change-fighting decarbonization can be achieved. After a methodological review of the literature, as well as online and in-person modelling for education, work, and conferences, based on the results of studies with a life cycle approach, we searched for the answer to what reasonable solution options are available for decarbonization and energy reduction. During the research, the organizational carbon footprint of a selected office, educational institution and conference, and then the carbon footprint created by one person in 1 hour were examined. The two-day online education significantly reduced the load of the daily commute by 402 tons of CO2 equivalent annually in transportation, but the energy demand of learning at home takes away 136 tons of this, so the real profit is the mentioned 266 tons. Based on work-related research, it can be concluded that remote work can really have a positive effect on the environment. However, it depends on many other factors and the extent of their utilization. In the case of conferences, reducing travel can reduce a carbon footprint. This can be done online when the most significant savings can be achieved.
Keywords:
energy efficiency
; carbon footprint
; life cycle assessment
; in-person modelling
; online modelling
; life cycle costing
; education
; work
; conference
1. Introduction
1.1. Research Background
Nowadays, one of humanity’s most significant challenges is finding a solution to halt the rise in global temperatures due to carbon dioxide emissions. The climate system becomes increasingly unpredictable and dangerous as the temperature increases every tenth of a degree. The global average temperature in 2022 exceeded the pre-industrial (1850–1900) average by about 1.15 (±0.12) 0C, according to the 2023 data set published by the World Meteorological Organization (WMO) [1]. 2022 was Europe’s second-warmest year. Extreme heat waves, droughts and devastating floods affected millions and cost billions of dollars in 2022. The sixth report of the IPCC [2]outlines the risks that may arise due to climate change under different scenarios. According to COP 21 [3], we must limit global warming to 1.5 °C [4] . The European Green Deal [5]defines transformative change.
The "Fit for 55" legislative package [6] enables all sectors of the EU economy to achieve this goal. It sets the EU on the path to achieving its climate goals in a fair, cost-effective and competitive way. All EU member states are committed to making the EU first climate-neutral by 2050 [7]. It creates new opportunities for innovation, investment, and job creation, reducing emissions and external energy dependence [8,9]
Climate change, pollution, and energy dependence support the need for decarbonization research topics. At the same time, decarbonization has been the focus of investigations due to climate policy objectives, digitization has become increasingly important due to COVID-19 and worldwide lockdowns. The latter saves time and reduces travel energy, but ICT also requires energy. A significant question is the size of the carbon footprint of modern digital technology and the potential for reducing carbon emissions through the use of digital technologies in education, work, and conferences.
1.2. Literature Review
Information technology integration in the workplace began in the 1990s, and telecommuting emerged in the early 2000s. However, globalization and information-communication technologies have further increased the trend of telecommuting. The Covid-19 pandemic has led to a significant increase in remote work, catalyzing innovation in work models. Remote work has become prevalent in many sectors and has taken various forms due to the spread of digital technologies [10] .
Digital technology is essential for work and research. It provides access to global information and enables collaboration through file sharing and joint editing. Daily communication through emails and platforms like TEAMS is standard in the modern work environment. Innovative developments in ICT significantly reduce the environmental impact of technology.
The environmental impact of energy consumption from home office work can be characterized based on a life cycle assessment. The energy consumption of IT devices and lighting is assumed to be consistent across geographical areas, but the carbon footprint depends on the energy mix of the specific country or region [11,12]
The ICT Footprint project [13] aimed to help organizations calculate their carbon footprint, providing methodological recommendations and educational materials. ICT accounts for 8-10% of Europe’s electricity consumption and 4% of its carbon dioxide emissions. Many leading IT service providers lack an adequate system for measuring environmental impact [13]. Analyzing the carbon footprint of ICT is crucial due to the increasing use of technologies in businesses, organizations, and daily routines, and is vital for reducing the global carbon footprint.
Some scientific publications [14,15,16] on the environmental impact of virtual work and its life cycle study have been published, but this leads to uncertainty about the comparability of data. Vartiainen published a comprehensive study [17] on the impacts of virtual work, demonstrating its effects through case studies. Lehmann and Hietanen’s study [18] examines work trends and provides a methodological foundation for mapping the environmental impacts of remote work using a life cycle approach.
Alneyadi and his co-authors [19]conducted a comparative analysis of digital and presence work, focusing on the digital environment’s impact on knowledge. The study emphasized the importance of technology integration, including reading skills and creative expression. The study’s small sample size limits the ability to make generalizations based on the findings.
A pivotal study by Geneidy et al. [20] analyzed the carbon footprint of a multinational knowledge organization, revealing that 79% of emissions come from indirect sources, mainly travel-related activities classified as Scope 3 emissions. The authors developed three scenarios for the post-COVID-19 world. In the first two, travel-related emissions remained significant despite reduced business travel and remote work. Only in the third scenario did these emissions decline, with heating becoming the top contributor. The study measures carbon footprints and outlines effective mitigation strategies for knowledge organizations aiming to lower their environmental impact [20].
Existing studies [21,22,23,24,25]on telecommuting primarily focus on CO2 emissions associated with reduced transportation. Other environmental metrics related to telecommuting are not as well-studied, justifying the focus on emissions. The pandemic’s impact on mobility can serve as a starting point for understanding the broader environmental effects of telecommuting [26]
A study by Shi et al. [27] found that the emissions of English teleworkers are significantly higher than those of non-teleworkers. When working from home 3-5 days a week, transport resulted in 3% less emissions, but there was a 17% increase in carbon dioxide emissions compared to traditional work. The emissions were influenced by factors such as the heating area, the heating time of the heating system, and the desired temperature.
The overall effect of telework on the ecological footprint is not apparent. According to Lachapelle et al. [28], telecommuting may increase production and income, resulting in increased consumption habits and higher energy demands, potentially leading to a larger total ecological footprint. The impact of telecommuting on emissions reduction from reduced commuting may be offset by increased consumption and higher energy demands.
Increased use of telecommunications and heating of homes hurt the climate. Companies may not be developing strategies to reduce office space and energy consumption. IT equipment has shown dynamic energy consumption in recent years. Internet use has a carbon footprint related to the energy consumption of data and cloud centers, ranging between 28 and 63 grams of CO2 equivalent per gigabyte by Obringer et al. [29].
Heated areas, the number of heating hours, wall insulation, heating system efficiency and carbon dioxide intensity impact the emissions of buildings accommodating workplaces. Video conferences are identified as the internet service with the most significant energy demand, but technological development is leading to more energy-efficient solutions. Telecommuting can reduce mobility and greenhouse gas emissions, mainly when commuting from home to work. Telework or hybrid work is often cited as reducing carbon dioxide emissions due to lower commuting rates from home to work [30].
There is limited knowledge about research on the carbon footprint of higher education. A study by Li et al. [31] examined the state of research in this field, focusing on key publication sites, central researchers, productivity and citations, common keywords and research directions, and the most active research regions worldwide. The study also analyzed changes in these indicators over the past decade.
Bibliometric studies cover various areas of carbon footprint reduction in higher education institutions. These areas include researcher travel, student carbon footprint reduction efforts, emissions from campus buildings, environmental impact from daily commuting, campus electronic equipment, the carbon footprint of students living in dormitories, and perceived footprint reduction through online education. However, these studies do not address the impact of the carbon footprint of higher education institutions on stakeholders.
Li et al.’s bibliometric analysis [31]revealed various test methods and solutions to reduce carbon footprint. It encouraged sustainable consumption, transitioning to a low-carbon economy, increasing sustainability of project procurement, prioritizing environmentally friendly energy sources, and promoting sustainable lifestyles.
Filho et al. [32] analyzed the decarbonization efforts of universities up to 2050, identifying fossil fuel burning as the primary source of carbon emissions. Decarbonization at the global level requires establishing systems that reduce carbon emissions to environmentally sustainable levels.
Efforts to reduce carbon emissions have economic implications, which are still debated in some studies. Accepted methods to reduce carbon emissions include reducing energy consumption, using renewable energy sources, increasing energy efficiency, and limiting performance. The COVID-19 pandemic led to a shift to digital platforms in higher education, significantly impacting energy consumption and mobility-related loads.
The pandemic also provided an opportunity to examine the impact of distance education on carbon footprint. Many universities (De Montfort University, University of British Columbia) have been assessing their carbon footprint, with studies published in scientific journals. Different methods [33,34], such as consumption-based carbon footprint definition and input-output analysis, have been used to determine the carbon footprints of institutions.
Models that can be used for the decarbonization assessment of conferences usually include computational tools and simulation models that allow the estimation of the carbon footprint and climate impacts of online conferences and the evaluation of the effects of decarbonization measures.
For example, a carbon footprint calculation that considers the climate impacts of the entire life cycle of online conferences, including event preparation, energy use, travel costs, and infrastructure, can be used for sustainability assessment. These models can compare the emission levels of different conferences, identify the areas with the highest emissions, and recommend decarbonization measures. The energy consumption of offline and online conferences is used to compare the carbon footprints [35].
1.3. Research Goal and Hypothesis
During the research, parallel investigations of three areas: education, work, and conferences were conducted. The first step investigated literature and methodological reviews regarding the given topic and modelling for in-person and online versions. In the framework, a life cycle assessment approach was used to identify options for decarbonization.
The energy consumption required for work and its main elements, such as IT devices, heating/cooling energy demand, and lighting, are examined when modelling online versions. Regarding work types, an economic evaluation of the decarbonization based on life cycle cost (LCC) analysis was performed. We applied the LCC to the Scopes (1,2,3) defined by the ISO 14064 standard[36] .
The research aims to model the online/digital transformation of some offline organizational activities in a way that can be used to reduce their CO2 emission impact and natural load. However, the question arises: How can the decarbonizing effect of digitization be modelled and measured?
Our initial hypothesis is that the transition to online versions strongly reduces the carbon footprint of in-person organizations for education, work, and conferences.
Regarding education, we examined what kind of ecological loads we must deal with in the operation of a university campus. The work aimed not to analyze online education’s methodological and social aspects. A prominent topic was how online education, which is spreading more and more in higher education, can affect the environmental impact of education. In the field of education, the research focuses on three main areas:
- To determine the carbon footprint of university education and a university campus and to find possible emission reduction areas.
- To examine the impact of the online education format on the carbon footprint.
In examining in-person and home office work types, we assumed as a hypothesis that using heating, lighting, and IT equipment during home office work, as a rebound effect, neutralizes the impacts of the absence of travel.
The primary goal of the conference research was to compare a two-day in-person conference with an online conference by conducting complete life cycle assessments that evaluate carbon footprints and energy consumption values. After conducting literature research on the carbon footprint of education, workplaces, and conferences and calculating decarbonization solutions, the calculations’ results were compared and discussed, and the conclusions were determined.
2. Materials and Methods
2.1. Research Methodology
Decarbonization can be characterized based on the difference (ΔCF) between the carbon footprint of the presence (CFj) and online, digital (CFD) solutions [37]:
ΔCF = CF j – CF d
When determining the carbon footprint, we follow the methods of counting the emissions that determine the emissions of the areas of influence (SCOPE) according to the standard. We aggregate the carbon footprints determined in this way. The calculation is the same for offline and online solutions. The formula used in the calculation is as follows:
where:
CF M =∑(i=1)^n CF i
- CF M : workplace carbon footprint
- CF i : factors involved in the formation of the carbon footprint,
- CF direct : direct emissions,
Detailed:
where:
CF M = ∑ CFdirect + ∑_ CF indirect + ∑_CFother
- CF direct : direct emissions related to energy use
- CF indirect : indirect emissions linked to energy (electricity)
- CF other : other indirect
Other CF consists of emissions of the following elements:
∑CFother = CF transport + CF foreign travel + CF business partner + CF meals + CF waste + CF water
Using LCA software, in addition to choosing different impact assessment methods, the potential of greenhouse gases can be determined for the entire life cycle (cradle to grave), and the carbon footprint can be given by aggregating them. According to the CML method, IPCC ARC5/ARC6, or ISO 14067 standard, the software is suitable for determination.
2.2. Modelling for Decarbonization Evaluation of the Education
Regarding education, the present state of in-person education, the campus operating continuously, and students and lecturers visiting the university on average four times a week were considered (Scenario 1). At the same time, hybrid education, such as online education, where theory classes are online and students visit the university twice weekly, was analyzed (Scenario 2). First, the carbon footprint load value in tons over 1 year was determined, and then the decarbonization value per person and hour was determined. OpenLCA 2.0.2 software and the Ecoinvent 3.9.1 database were used for two education scenarios. The carbon footprint was calculated based on IPCC 2021 and GWP 100 impact assessment methods. The impact of decarbonization on education can be modelled in several ways. In addition, direct, indirect, and other scopes (Scopes 1-3) were introduced to calculate the carbon footprint. The following parameters were examined based on the scopes:
- Scope 1: natural gas consumption for heating, official university cars, HFC32.
- Scope 2: office lighting, heating/cooling, and power consumption of IT tools.
- Scope 3: travelling of students and workers, computer usage, consumption online, water consumption, and waste management.
The examined university campus consists of the main building, dean’s offices, classrooms, and laboratories. It is more than 100 years old.
- Building B is mainly a laboratory, a few classrooms, and teachers’ rooms. It is an old building, more than 100 years old.
- Building C: faculty rooms and departmental offices. About 50 years old
- Building G: 3 large lecturers, small classrooms, IT labs and teaching rooms. Newly built, approx. 15 years old.
A canteen and a dormitory building are also connected, but these are not part of the analysis. The campus serves the educational needs of most of the Kálmán Kandó Faculty of Electrical Engineering and the Károly Keleti Faculty of Economics. In numbers:
- teachers, employees: 155 people
- full-time students: 2,094, of which 84 are foreigners
- correspondence students: 1,259 people
The proposed possible solutions have been classified into three groups:
- energy supply and energy-saving solutions
- the reduction of emissions that can be achieved through the organization of transport and education
- solutions that support environmental education.
2.3. Methodology and Modelling for Decarbonization Evaluation of the Work
The carbon footprint calculation methodology followed the Greenhouse Gas Protocol and the ISO 14064 standard for organizational carbon footprints, and we performed the calculations accordingly. The scenarios examined were:
- The base case scenario (S-1) is based on accurate, measured values for February 2021. In this case, 100% of the employees come to work; there is no option for home office work (in the following: in-person work).
- The home office scenario (S-2) is based on the fundamental values of February 2022: 90% of employees work at home, and only 10% must be present at the workplace (in the following: home office work).
- Hybrid solution scenario (S-3): Home office work is possible, which affects 20% of employees, so 80% come to work (in the following: hybrid work). The S-3 scenario is based on the actual data of S-1 and S-2. The comparison is done in a complete system, i.e. it considers the elements of working at home that were taken into account when working at the workplace (heating, energy use, etc.).
The LCA-based approach to the carbon footprint and the analysis and comparative evaluation of the S-1, S-2, and S-3 scenarios made it possible to determine hot spots and decarbonization paths.
In addition, direct and indirect scopes (Scopes 1-3) were introduced in calculating the carbon footprint. The following parameters were examined:
- Scope 1: gas consumption, company cars, and HFC32.
- Scope 2: office lighting, power consumption of IT tools, cooling/heating, and power demand of kitchen equipment.
- Scope 3: business trips, employee commuting, employee meals, waste, and wastewater streams.
Life cycle cost analysis was investigated using the following three scenarios:
Scope 1: gas consumption cost, costs of company cars, loss of air conditioners
Scope 2: costs for office lighting, power consumption of IT devices, cooling/heating, and power demand of kitchen equipment
Scope 3: costs for business trips, employee commuting, and employee meals, waste cost and water consumption cost.
2.4. Methodology and Modelling for Decarbonization Evaluation of the Conference
The calculation of conference types is based on data collected from a two-day international science conference held in October 2019 in Hungary. The functional unit used for measurement was kilograms CO2 equivalent per person per hour. The following scenarios were examined:
- In-person conference: This scenario is based on accurate and measured values, including travel to the conference site and registration packages.
- Online conference: This scenario omits travel and registration packages, focusing solely on the virtual attendance.
The following figure summarizes the methodological analysis steps of the in-person conference as an example.
2.5. System Boundaries
All environmental loads were allocated by mass allocation to the tested products and the generated waste. The material and energy flows used are related to the examined product output. The energy requirement was determined as a function of the energy content. Equipment and machinery fell outside the system boundary.
Our examination of education was thorough, considering both direct and indirect emissions as significant scopes. While we did not find transport emissions to be as substantial, we took into account waste management and home heating for in-person education, as well as computer use for online education, all within the system boundary. Due to the unavailability of reliable data, we placed certain factors such as purchased equipment, the embodied CO2 content of the building and procurement, meals, building maintenance, and cleaning outside the system boundary.
When examining work, it’s important to note that the LCA did not include the construction and maintenance of buildings, whether they were workplaces or homes, in its analysis.
During the LCC, we assumed that the system boundary established during the LCA analysis and the functional unit determining the basis for the comparison was the same. Construction and maintenance costs of buildings were not considered when determining the LCC. IT equipment and Internet-related costs were also not the focus of the study since these areas were not considered during the environmental studies. Therefore, operation-related costs were primarily taken into account.
Regarding the conference, our study honed in on catering services. We considered food and beverages within the cradle-to-grave system boundary, with life cycle stages defined based on the weight of the portions served. Transport was completely excluded from our study, as the food ingredients do not originate from the same place. All environmental loads were allocated by mass allocation to the tested products and the generated waste. The material and energy flows used are related to the examined product output. The energy requirement was determined as a function of the energy content. Equipment and machines are outside the system boundary.
2.6. Life Cycle Inventory (LCI) and Life Cycle Impact Assessment (LCIA)
The life cycle inventory is based on data between 2019 and 2022 and follows the technique described in the ISO 14040:2006 and 14044:2006 standards [38,39]. It includes the material and energy supply of all the examined processes.
The university campus’s carbon footprint for 2022 was determined for in-person education. For online education, the reference year was 2021. Regarding work, the calculation for different work types is based on data measured for two actual periods of the workplace environment (February 2020 and February 2021 data). The applied functional unit was kg CO2 equivalent per person per working hour. The data collection was carried out for the office building, which forms the basis of the reference model, and for the input-output currents defined in the model. The data affecting the carbon footprint development were taken into account based on the measured data of the relevant offices (operations, IT, HR), with an allocation that considers the actual area and personnel data.
Regarding conference main dishes, we aimed to create an accurate list of resources for preparing and cooking products. The LCI did not include factors like equipment, extra materials, additives, and energy for heating and cooling, only considering equipment energy consumption. The Hungarian Saint Anna Restaurant (in Berkenye) provided key kitchen data for our analysis of lunch and dinner served during the in-person conference. We received specific information about material and energy use for each main course, including electricity for cooking, gas consumption, and water heating.
We measured ingredients, electricity for storing items and drinking water for cleaning and cooking. The material flows analyzed for the online conference were aligned with those from the in-person event to ensure consistency. During the preparation and cooking phase, the LCI includes wastewater from washing raw materials and dishes and the necessary water input flows. For food waste estimates, we estimated that 15% of the soup, 26% of the main course, and 5% of the dessert would be wasted.
3. Results
3.1. Comparing the Environmental Impact of Education
In terms of education, the current state of in-person instruction was evaluated under Scenario 1, which involves the campus operating continuously with students and lecturers visiting the university an average of four times a week. In contrast, Scenario 2 analyzed a hybrid education model as an online model, where theory classes are conducted online and students come to the university twice a week. Additionally, direct, indirect, and other scopes (Scopes 1-3) were introduced to calculate the carbon footprint based on subchapter 2.2.
Figure 2 compares the carbon footprint of in-person and online education based on the examined scopes. If we only look at the emissions of scope 1, the annual value of attendance education is 1,827 tons of CO2 eq., and the difference is 266 tons.
In the case of in-person education, the total campus’s carbon footprint for the given year (2022) is 2,223 tons of CO2 eq. Likewise, if online education had been introduced twice a week (online case), it could have been 12% less, i.e. 1,957 tons, saving 266 tons per year. Figure 3 shows the comparison of the carbon footprint of in-person and online education according to Scope 3.
Figure 3 shows that 96% of the environmental impacts are caused by student travel during in-person education. The subsequent impact is the travel of teachers and researchers to work. These travel values are reduced in the hybrid solution, but not by as much. Gas consumption hardly changed during the closure, and electricity consumption showed a 10-15% decrease in the spring of 2021. Online consumption means the extra heating and lighting required during online education. Home computer use means the computer and Internet use needed to process online educational materials. One factor that dominates is the students’, which is worth breaking down further. The contribution of official trips of lecturers and university water consumption is negligible, below 0.5%.
3.2. Comparing the Environmental Impact of Work
In terms of education, three scenarios and direct, indirect, and other scopes were introduced to calculate the carbon footprint based on subchapter 2.3.
If we examine scenarios S-1, S-2, and S-3 individually, the pie charts in Figure 4, Figure 5 and Figure 6 illustrate the parameters’ percentage distribution. The impact of HFC32 is negligible and has, therefore, been omitted from the diagrammatic representations. We have plotted gas and water consumption together for all three scenarios, of which water consumption represents 97-98%. We have also plotted the impacts of eating and waste together. While the eating-waste ratio for the S-1 and S-2 scenarios is 91%-9%, for the S-3 hybrid working environment, this ratio is 96%-4%.
Figure 4 shows that employee commuting is the most significant contributor to a company’s carbon footprint, accounting for about 55% of total emissions for in-person office work. This is followed by lighting, which contributes 14%, IT equipment usage, 8%, and heating and cooling, which contributes 7.5%.
Regarding 90% of home office work, as shown in Figure 5, lighting and water consumption cause the most significant load at 34% each. The load caused by commuting is relatively high compared to working from home, which is 31%. The load from the company car is 7%. The load from IT tools and heating-cooling ranges between 11 and 12%. The amount of kitchen loads is almost negligible, as the total load caused by food, waste and kitchen utensils is only 2%. We considered the value of business trips to be zero in this scenario.
Figure 6 shows that employee commuting is the most significant contributor to a company’s carbon footprint, accounting for 54% of total emissions for hybrid work. It is followed by lighting, which contributes 14%, IT equipment usage, 8%, and heating and cooling, which contributes 9%. There are no significant differences between the S-3 and S-1 scenarios.
Figure 7 summaries the carbon footprint values for the three work scenarios in kg CO2 equivalents per month based on the consumption elements.
3.3. Life Cycle Cost (LCC) Analysis for Work Types
The LCC analysis was performed based on the methodology and scopes previously described for different work types. Homework costs include heating, lighting, water consumption, and meals. External costs are determined based on the CO2 quota. (The employer is not currently charged for this cost element.) After the calculations, the life cycle cost based on the various alternatives is summarized in Figure 8.
The life cycle cost of the S-1 alternative is projected for one month at HUF 11,255,109. The cost of the S-2 alternative is projected for one month at HUF 6,504,710. The cost of the S-3 alternative is projected for one month at HUF 10,022,175.
The digital transition - due to working from home - resulted in a 42.2% reduction in life cycle costs. From the employer’s point of view - where the employer does not cover the cost of working from home - there is a further reduction in costs, the value of which is a 79.2% saving. If we project the analysis on the functional unit used in the LCA study (1-hour cost per person), the trend does not change based on the Figure 9.
Workplace costs decrease proportionally, so the costs per person decrease from HUF 428/hour to HUF 229/hour in the second alternative. Since the employer does not assume the costs of the employee—in the case of work done at home—the cost reduction is still noticeable from the employer’s point of view. For the employer, if 90% of the employees work at home, the cost is only HUF 84/person/hour.
An interesting indicator of LCC studies is the specific cost of the carbon footprint, which represents the costs associated with each alternative compared to the value of CO2 emitted.
3.4. Comparing the Environmental Impact of Conference
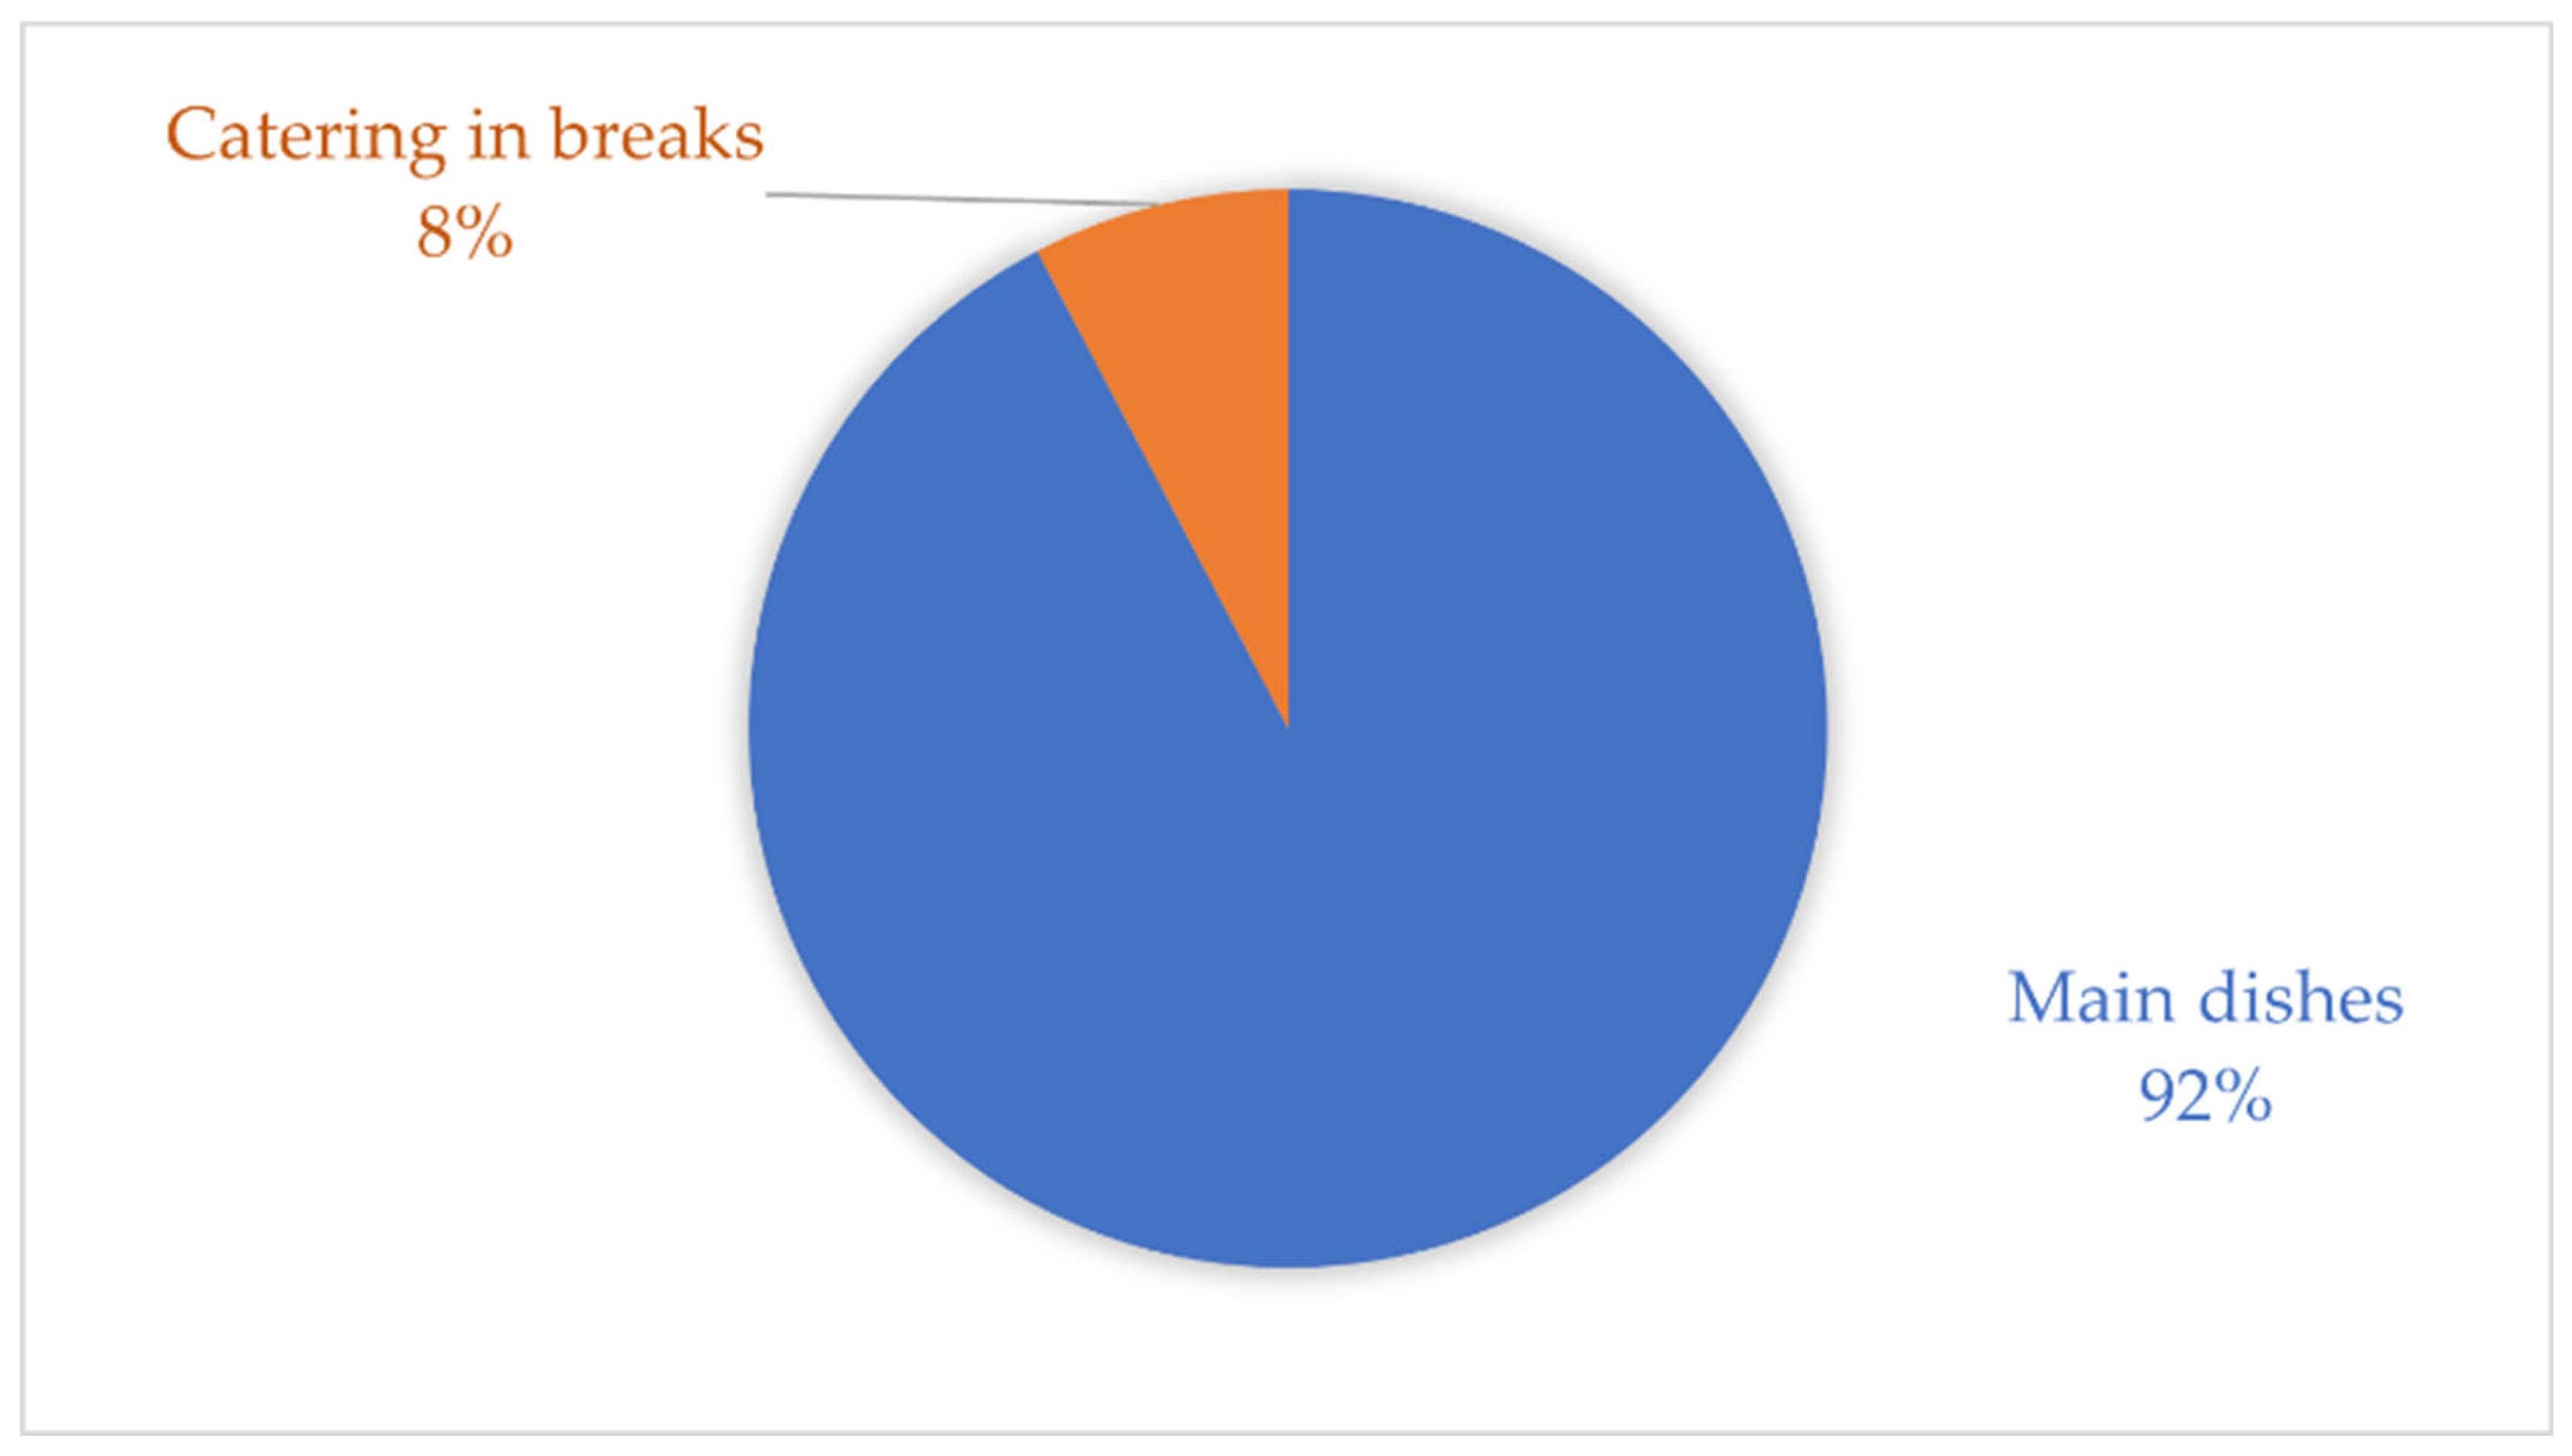
The carbon footprint results of the conference types are calculated for one person and one hour. Figure 10 and Figure 11 present the percentage distribution of decarbonization values for in-person and online conferences. The main meals, which included two lunches and one dinner during the two-day event, were combined in the illustration. The organization and management have a negligible effect compared to the other parameters examined, so they were not depicted for the two cases. Conference trips are examined in the case of an in-person conference, which includes travels by plane, train and car.
In the case of an in-person conference, conference trips account for 57% of the environmental load, and the conference main dishes account for 38% of the impact. In the case of an online conference, the main dishes account for 92% of the environmental impact, and the catering service accounts for 8% of the burden.
The research results indicate that the carbon footprints of in-person and online conferences are comparable. For in-person conferences, travel contributes significantly to the carbon footprint, accounting for 11.912 kg of CO2 equivalent per person per hour, representing 57% of the total environmental impact. Over the entire duration of the conference, this travel impact totals 178.68 kg CO2 equivalent per person. The environmental impact of meals, including lunches, dinners, and catering, is the second largest contributor, totaling 8.413 kg CO2 eq and per person per hour, constituting 41% of the total impact.
When disregarding the environmental impacts of meals and travel, the decarbonization value is 0.3627 kg CO2 eq. Per person per hour. However, this amount includes only the impacts of conference preparation, organization, implementation, and registration packages for in-person conferences.
4. Discussion
Our examined education model allows for two days of online learning while maintaining attendance for the remainder. Research in education highlights that commonly recommended environmental measures—such as thermal insulation, renewable energy, and energy-efficient lighting—are crucial. The solar panels on campus can cover its electricity demand, but their effectiveness during summer, when the institution is closed, needs further evaluation. Transportation is a key area that influences our second objective: analyzing educational organization and online learning.
In 2022, the total carbon footprint for the in-person campus was 2,223 tons. For scope one emissions, in-person education produces 1,827 tons of CO2 equivalent annually. Implementing online education twice a week could have reduced this by 12%, resulting in 1,957 tons. 96% of the environmental impact during in-person education is due to student travel, followed by the travel of teachers and researchers. Many students in Hungary travel between 40 and 250 km to attend universities in Budapest, often returning home every two weeks. The calculated carbon footprint aligns with similar studies, showing that our examined campus has the lowest emissions.
The literature and our analysis show that traffic and commuting significantly contribute to emissions. Our analysis reveals an outlier rate of over 80%, partly due to rural students’ frequent trips home. The average emission of 4.18 kg per capita daily is notably lower than the national average of 18.4 kilograms, suggesting a realistic 4x multiplier. Implementing two days of online education has reduced transport-related CO2 emissions by 402 tons annually.
However, the energy demand of at-home learning accounts for 136 tons, yielding a net saving of 266 tons. Gas consumption did not change much during the closure, while electricity consumption dropped by 10-15% in spring 2021. Online education also increases heating and lighting needs and energy used by home computers and internet access. Most emissions come from students, with negligible contributions from official trips by lecturers and university water consumption, accounting for less than 0.5%.
Significant changes in this habit may require longer blocks of online classes, which come with the challenge of reorganization and should offer clear professional advantages.
While every reduction counts, fundamentally altering educational approaches may not be sufficient. The shift to e-learning, accelerated by the COVID-19 epidemic, presents significant methodological challenges. It requires careful preparation, consideration of students’ socialization needs, and reassessment of instructors’ roles to provide adequate support. Ultimately, the effectiveness of online education varies by content, with technical fields requiring more in-person instruction.
While hybrid models reduce some travel emissions, the impact remains significant.
For energy efficiency, the focus should be on modernizing the two leading educational buildings, A and B, which are over 100 years old and cannot have external insulation. Options include replacing windows and upgrading the HVAC system.
Building AC has the highest heating and cooling demands, while Building G has a more efficient system. Renewable energy sources, particularly solar, should be considered due to the campus’s potential [40]. A small power plant could generate nearly 400 kW with an annual production of approximately 400 MWh, exceeding the campus’s consumption, although the system’s embodied carbon must be assessed [41].
Regarding work, some studies, including ours, show that commuting influences the carbon footprint, with the most amount accounting for about 55% of total emissions in a typical office. It was followed by lighting (14%) and IT equipment usage (8%).
With 90% of home office work, lighting and water consumption are 34% of each, commuting is 31%, and the company car contributes 7%. The impact of kitchen-related activities is minimal at 2%.
In the hybrid work scenario, commuting remains the most significant contributor at 54%.
For homework costs, LCC analysis evaluated heating, lighting, water consumption, and meals. External costs are tied to CO2 quotas, which the employer currently does not cover. Based on the LCC results, the shift to home working resulted in a 42.2% reduction in life cycle costs; from the employer’s perspective, the savings rose to 79.2%.
While working from home does increase energy use for heating, lighting, and IT, it significantly decreases emissions from commuting. Thus, remote work generally leads to considerable environmental gains. The main advantage of telework lies in reduced commuting emissions, though outcomes can vary based on transportation modes, work schedules, and community infrastructure.
If remote work occurs within existing frameworks designed for full-time office work, sustainability improvements may be minimal, and carbon footprints could worsen. Though telecommuting offers clear benefits, the outcomes depend on various factors, such as implementation strategies and the balance between remote and office work.
To enhance homework’s positive impacts, policy measures should address commuting, mobility, energy use, and occupational profiles. While telework can reduce carbon emissions, it may also lead to increased home energy consumption and potential social isolation. Efforts to decarbonize offices include energy audits, improving energy efficiency, and using renewable energy.
Achieving decarbonization and climate targets requires collaboration between employers and employees.
In our previous studies [42,43,44], we developed life cycle models for vegan, vegetarian, and traditional diets and conference types with using SWOT analysis and SAP-LAP model. Our findings show that meal preparation has a higher carbon footprint than cooking due to the production impacts of raw materials.
Conference results show that the carbon footprints of in-person and online conferences are comparable. In-person conferences have a significant environmental impact, with travel accounting for 57%. Travel for in-person events generates about 11.912 kg of CO2 equivalent per person per hour, totaling approximately 178.68 kg for the entire conference. Meals add another 8.413 kg of CO2 equivalent per person per hour, making up 41% of the total impact. For online conferences, meals dominate, representing 92% of the impact, while catering contributes only 8%.
Excluding travel and meals, the decarbonization value is 0.3627 kg of CO2 equivalent per person per hour, reflecting the impacts of conference organization and registration for in-person events.
Reducing travel can significantly lower emissions, and hybrid or online conference formats further aid decarbonization. At the same time, catering also contributes substantially to conference emissions. Choosing sustainable dietary options and serving snacks instead of full meals can help mitigate this issue.
Overall, online connectivity helps decarbonize all three areas (education, work, and conferences) from an environmental perspective. However, neglecting attendance is unrealistic in several respects, especially in education, which lowers standards. Therefore, it is necessary to pay attention to these problems so that the quality of teaching and work is also maintained in addition to improving energy efficiency.
5. Conclusions
This research study aims to develop better scenarios for more sustainable education, work and conferences by calculating the energy consumption and carbon footprint associated with in-person and online versions.
A comparison of the three cases showed that the international conference’s carbon footprint per person per hour was 11.91 kg CO2 eq. At the same time, education accounted for only 10% of the total and working in an office accounted for only 7.5%. The shift to digital space resulted in a 60% reduction in the conference and work areas’ carbon footprint and a 12% reduction in hybrid education.
Digitalization can significantly increase energy efficiency and reduce carbon emissions in buildings, transport and energy networks. It is especially evident when international conferences are moved online, with much more significant savings than education and work. Home office and virtual work also reduce emissions from commuting.
From the viewpoint of digital document management and cloud service, optimizing data centers can reduce paper use and energy demand. Intelligent systems and renewable resources help improve energy efficiency, balancing weather-dependent renewable sources (solar and wind energy). At the same time, it is important to pay attention to the sustainability of data centers and the proper management of electronic waste.
The digital transition – due to working from home – resulted in a 42.2% life cycle cost reduction. From the employer’s perspective - where the employer does not assume the cost of working from home - there is an additional cost reduction, the value of which is a 79.2% saving.
We hypothesized that shifting to online opportunities reduces the decarbonization efforts of such events. Our results confirmed this research hypothesis.
Acknowledgment
The study was created with the support of the National Media and Communications Authority (NMHH) based on research agreement No. NKE/9939/2023 between the National Public Service University and the LCA Centre Association.
Author Contributions
Methodology, review, writing and editing, funding, V.M; conceptualisation, review, writing and editing, ZS. SZ; resources, writing and editing, R.B.S.; data curation, writing and editing, J.L.A.; diagrams, writing and editing, A.T.; funding acquisition, P.S.; diagrams, writing and editing, ZS.I.; investigation, visualisation, review, A.SZ.; writing and editing, investigation, O. SZ. K.; original draft preparation, supervision, funding acquisition, investigation, review, K.T.Sz..All authors have read and agreed to the published version of the manuscript.
Data Availability Statement
Not applicable.
Conflicts of Interest
The authors declare no conflict of interest.
References
- World Meteorological Organization (WMO) State of the Global Climate 2022. 2023, 55.
- IPCC Sixth Assessment Report.
- FCCC/CP/2015/10 Report of the Conference of the Parties on Its Twenty-First Session, Held in Paris from 30 November to 13 December 2015. Part One: Proceedings. 2016.
- Hinojosa-Nogueira, D.; Subiri-Verdugo, A.; Díaz-Perdigones, C.M.; Rodríguez-Muñoz, A.; Vilches-Pérez, A.; Mela, V.; Tinahones, F.J.; Moreno-Indias, I. Precision or Personalized Nutrition: A Bibliometric Analysis. Nutrients 2024, 16, 2922. [Google Scholar] [CrossRef] [PubMed]
- European Green Deal. 2019.
- Fit for 55. 2022.
- CLIMATE CHANGE 2023 Synthesis Report. [CrossRef]
- Włodyka-Bergier, A.; Bergier, T.A.; Stańkowska, E. The Role of Hygiene in a Sustainable Approach to Managing Pool Water Quality. Sustainability 2025, 17, 649. [Google Scholar] [CrossRef]
- Lempart-Rapacewicz, A.; Zakharova, J.; Kudlek, E. Rainwater Quality Analysis for Its Potential Recovery: A Case Study on Its Usage for Swimming Pools in Poland. Sustainability 2023, 15, 15037. [Google Scholar] [CrossRef]
- Afonso, A.P.; Carneiro, J.; Azevedo, A.I. The Impact of COVID-19 on e-Commerce: A Systematic Review of the Literature on the Purchasing Behavior of Online Retail Consumers. Journal of Marketing Research and Case Studies 2024, 1–9. [Google Scholar] [CrossRef]
- Franzò, S.; Nasca, A. The Environmental Impact of Electric Vehicles: A Novel Life Cycle-Based Evaluation Framework and Its Applications to Multi-Country Scenarios. J Clean Prod 2021, 315, 128005. [Google Scholar] [CrossRef]
- Buri, Z.; Sipos, C.; Szűcs, E.; Máté, D. Smart and Sustainable Energy Consumption: A Bibliometric Review and Visualization. Energies (Basel) 2024, 17, 3336. [Google Scholar] [CrossRef]
- European Framework Initiative for Energy and Environmental Efficiency in the ICT Sector 2016.
- Hendrickson, D.; Smith, C.; Eikenberry, N. Fruit and Vegetable Access in Four Low-Income Food Deserts Communities in Minnesota. Agric Human Values 2006, 23, 371–383. [Google Scholar] [CrossRef]
- Peiris, D.; Wright, L.; News, M.; Rogers, K.; Redfern, J.; Chow, C.; Thomas, D. A Smartphone App to Assist Smoking Cessation Among Aboriginal Australians: Findings From a Pilot Randomized Controlled Trial. JMIR Mhealth Uhealth 2019, 7, e12745. [Google Scholar] [CrossRef]
- Tao, M.; Chen, L.; Xiong, X.; Zhang, M.; Ma, P.; Tao, J.; Wang, Z. Formation Process of the Widespread Extreme Haze Pollution over Northern China in January 2013: Implications for Regional Air Quality and Climate. Atmos Environ 2014, 98, 417–425. [Google Scholar] [CrossRef]
- Vartiainen, M. Working in Multi-Locational Office – How Do Collaborative Working Environments Support? In; Springer: Berlin, Heidelberg, 2009; Vol. 5619, pp. 1090–1098. [Google Scholar]
- Lehmann, M.; Hietanen, O. Environmental Work Profiles—A Visionary Life Cycle Analysis of a Week at the Office. Futures 2009, 41, 468–481. [Google Scholar] [CrossRef]
- Alneyadi, S.; Wardat, Y.; Alshannag, Q.; Abu-Al-Aish, A. The Effect of Using Smart E-Learning App on the Academic Achievement of Eighth-Grade Students. Eurasia Journal of Mathematics, Science and Technology Education 2023, 19, em2248. [Google Scholar] [CrossRef] [PubMed]
- El Geneidy, S.; Baumeister, S.; Govigli, V.M.; Orfanidou, T.; Wallius, V. The Carbon Footprint of a Knowledge Organization and Emission Scenarios for a Post-COVID-19 World. Environ Impact Assess Rev 2021, 91, 106645. [Google Scholar] [CrossRef] [PubMed]
- EcoAct. Homeworking Emissions Whitepaper. 2020.
- The Carbon Trust Homeworking: Seasonality Has Great Impact on Carbon Savings. 2021.
- Oscar Vargas Llave; John Hurley, E.P.R.R.C.D.A.L.B.G.E.S. and C.V.S. Eurofound (2022), The Rise in Telework: Impact on Working Conditions and Regulations. 2022. [CrossRef]
- Cerqueira, E.D.V.; Motte-Baumvol, B.; Chevallier, L.B.; Bonin, O. Does Working from Home Reduce CO2 Emissions? An Analysis of Travel Patterns as Dictated by Workplaces. Transp Res D Transp Environ 2020, 83, 102338. [Google Scholar] [CrossRef]
- Marion Bachelet; Matthias Kalkuhl; Nicolas Koch What If Working from Home Will Stick? Distributional and Climate Impacts for Germany. 2021, 1–31.
- Ambroży, T.; Rydzik, Ł.; Obmiński, Z.; Klimek, A.T.; Serafin, N.; Litwiniuk, A.; Czaja, R.; Czarny, W. The Impact of Reduced Training Activity of Elite Kickboxers on Physical Fitness, Body Build, and Performance during Competitions. Int J Environ Res Public Health 2021, 18, 4342. [Google Scholar] [CrossRef]
- Shi, Y.; Sorrell, S.; Foxon, T. The Impact of Teleworking on Domestic Energy Use and Carbon Emissions: An Assessment for England. Energy Build 2023, 287, 112996. [Google Scholar] [CrossRef]
- Lachapelle, U.; Burke, M.; Brotherton, A.; Leung, A. Parcel Locker Systems in a Car Dominant City: Location, Characterisation and Potential Impacts on City Planning and Consumer Travel Access. J Transp Geogr 2018, 71, 1–14. [Google Scholar] [CrossRef]
- Obringer, R.; Rachunok, B.; Maia-Silva, D.; Arbabzadeh, M.; Nateghi, R.; Madani, K. The Overlooked Environmental Footprint of Increasing Internet Use. Resour Conserv Recycl 2021, 167, 105389. [Google Scholar] [CrossRef]
- Aguiléra, A.; Pigalle, E. The Future and Sustainability of Carpooling Practices. An Identification of Research Challenges. Sustainability 2021, 13, 11824. [Google Scholar] [CrossRef]
- Li, Z.; Chen, Z.; Yang, N.; Wei, K.; Ling, Z.; Liu, Q.; Chen, G.; Ye, B.H. Trends in Research on the Carbon Footprint of Higher Education: A Bibliometric Analysis (2010–2019). J Clean Prod 2021, 289, 125642. [Google Scholar] [CrossRef]
- Filho, W.L.; Vidal, D.G.; Dinis, M.A.P.; Lambrechts, W.; Vasconcelos, C.R.P.; Molthan-Hill, P.; Abubakar, I.R.; Dunk, R.M.; Salvia, A.L.; Sharifi, A. Low Carbon Futures: Assessing the Status of Decarbonisation Efforts at Universities within a 2050 Perspective. Energy Sustain Soc 2023, 13, 5. [Google Scholar] [CrossRef]
- Larsen, H.N.; Pettersen, J.; Solli, C.; Hertwich, E.G. Investigating the Carbon Footprint of a University - The Case of NTNU. J Clean Prod 2013, 48, 39–47. [Google Scholar] [CrossRef]
- Wynes, S.; Donner, S.D.; Tannason, S.; Nabors, N. Academic Air Travel Has a Limited Influence on Professional Success. J Clean Prod 2019, 226, 959–967. [Google Scholar] [CrossRef]
- Jäckle, S. Reducing the Carbon Footprint of Academic Conferences by Online Participation: The Case of the 2020 Virtual European Consortium for Political Research General Conference. PS Polit Sci Polit 2021, 54, 456–461. [Google Scholar] [CrossRef]
- ISO ISO 14064-1:2018 - Greenhouse Gases. Part 1: Specification with Guidance at the Organization Level for Quantification and Reporting of Greenhouse Gas Emissions and Removals.; 2018.
- Terjék, A.K.V.S.K.T.S. Ecodesign-Based Modelling of Decarbonisation. In Proceedings of the Linking Futures of Mountain and Ocean: Rescuing the SDGs 2030 for Sustainable Livelihood, The 30th Annual International Conference of ISDRS on Sustainable Development Research; Kathmandu, Nepal, June 10 2024; pp. 1–14.
- ISO ISO 14040:2006; Environmental Management—Life Cycle Assessment—Principles and Framework; Geneva, Switzerland, 2006.
- ISO 14044:2006; Environmental Management—Life Cycle Assessment—Requirements and Guidelines. ISO: Geneva, Swit-Zerland, 2006. Available Online: Https://Www.Iso.Org/Standard/38498.Html (Accessed on 6 June 2019).;
- Máté, D.; Török, L.; Kiss, J.T. THE IMPACTS OF ENERGY SUPPLY AND ENVIRONMENTAL TAXATION ON CARBON INTENSITY. Technological and Economic Development of Economy 2023, 29, 1195–1215. [Google Scholar] [CrossRef]
- Danko, G.; Jobbik, A.; Baracza, M.K.; Varga, G.; Kovacs, I.; Wittig, V. Energy Potential of a Single-Fracture, Robust, Engineered Geothermal System. Geomechanics and Geophysics for Geo-Energy and Geo-Resources 2020, 6, 26. [Google Scholar] [CrossRef]
- Mannheim, V.; Avató, J.L. Examining the Carbon Footprint of Conferences with an Emphasis on Energy Consumption and Catering. Energies (Basel) 2025, 18, 321. [Google Scholar] [CrossRef]
- Avató, J.L.; Mannheim, V. Life Cycle Assessment Model of a Catering Product: Comparing Environmental Impacts for Different End-of-Life Scenarios. Energies (Basel) 2022, 15, 5423. [Google Scholar] [CrossRef]
- Mannheim, V.; Avató, J.L. Life-Cycle Assessments of Meat-Free and Meat-Containing Diets by Integrating Sustainability and Lean: Meat-Free Dishes Are Sustainable. Sustainability 2023, 15, 12014. [Google Scholar] [CrossRef]
Figure 1.
Methodology of examination for in-person conference.
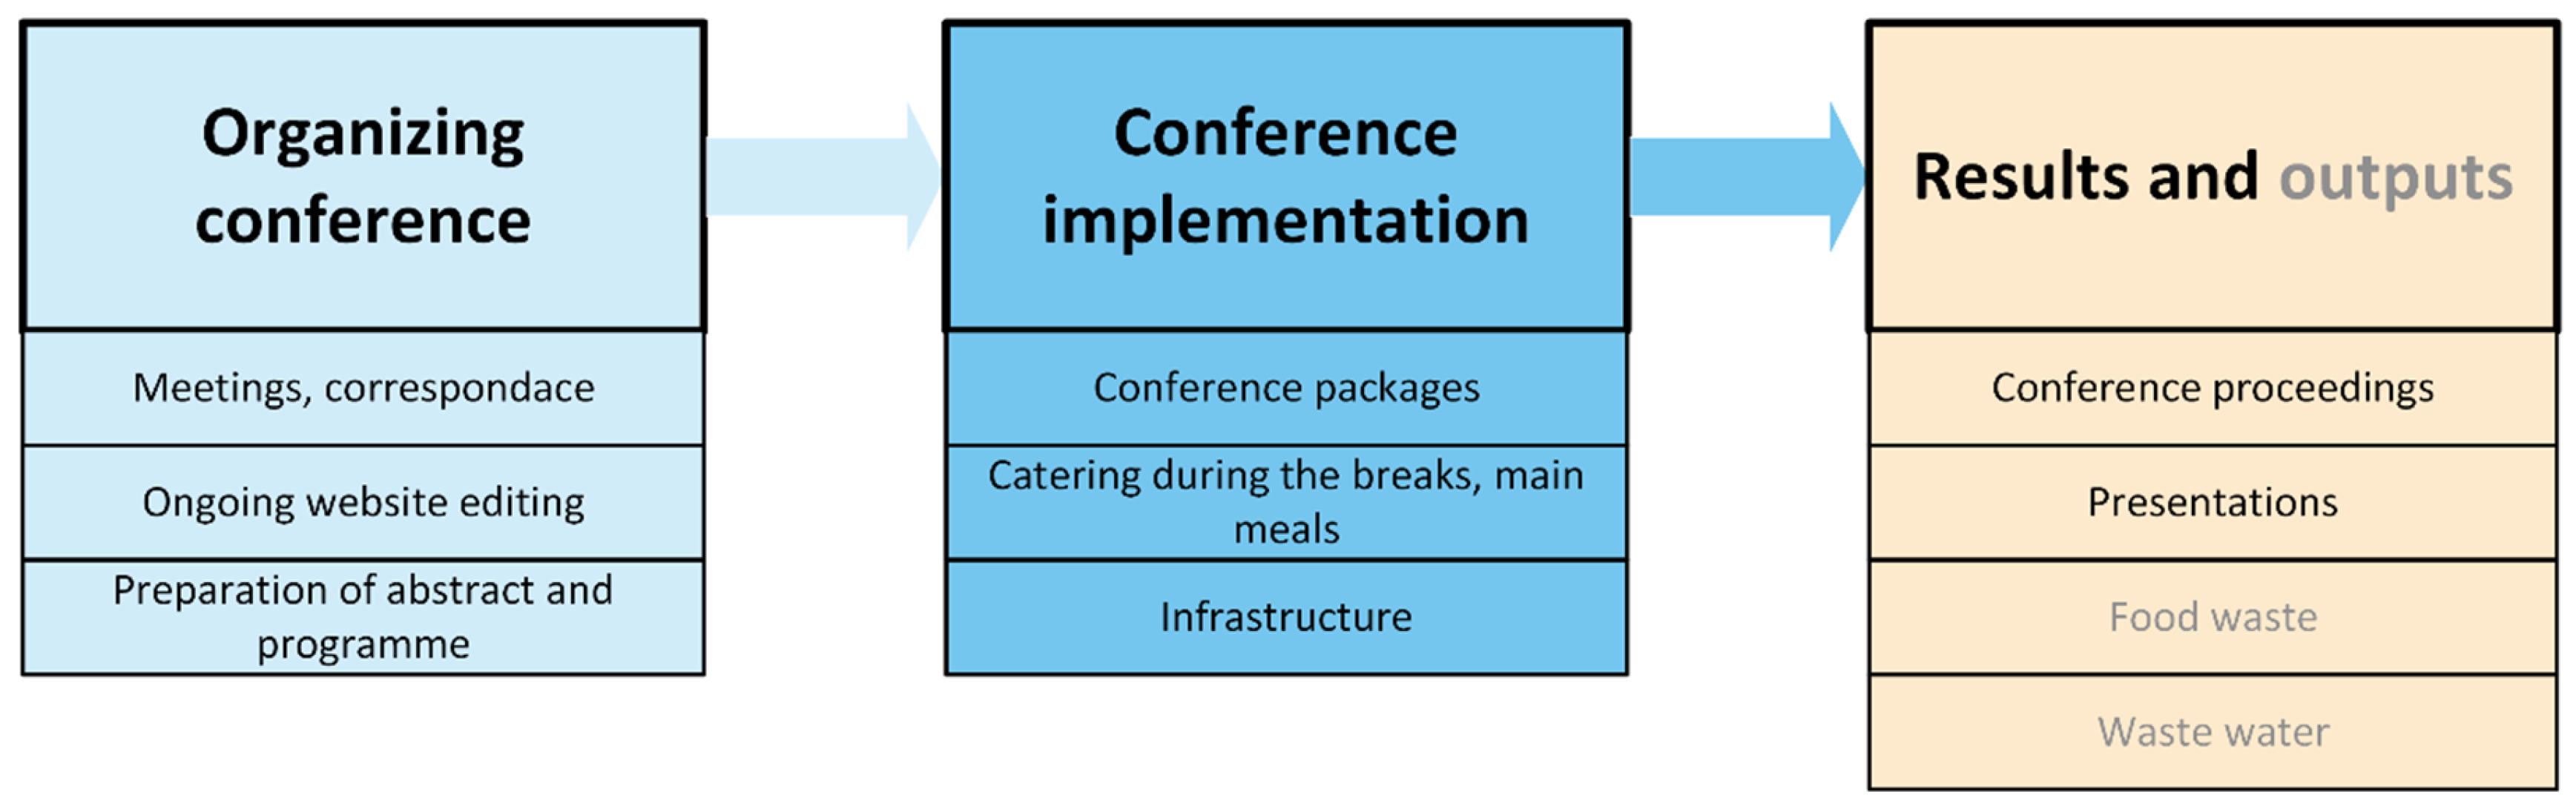
Figure 2.
Comparison of the carbon footprint for in-person and online education.
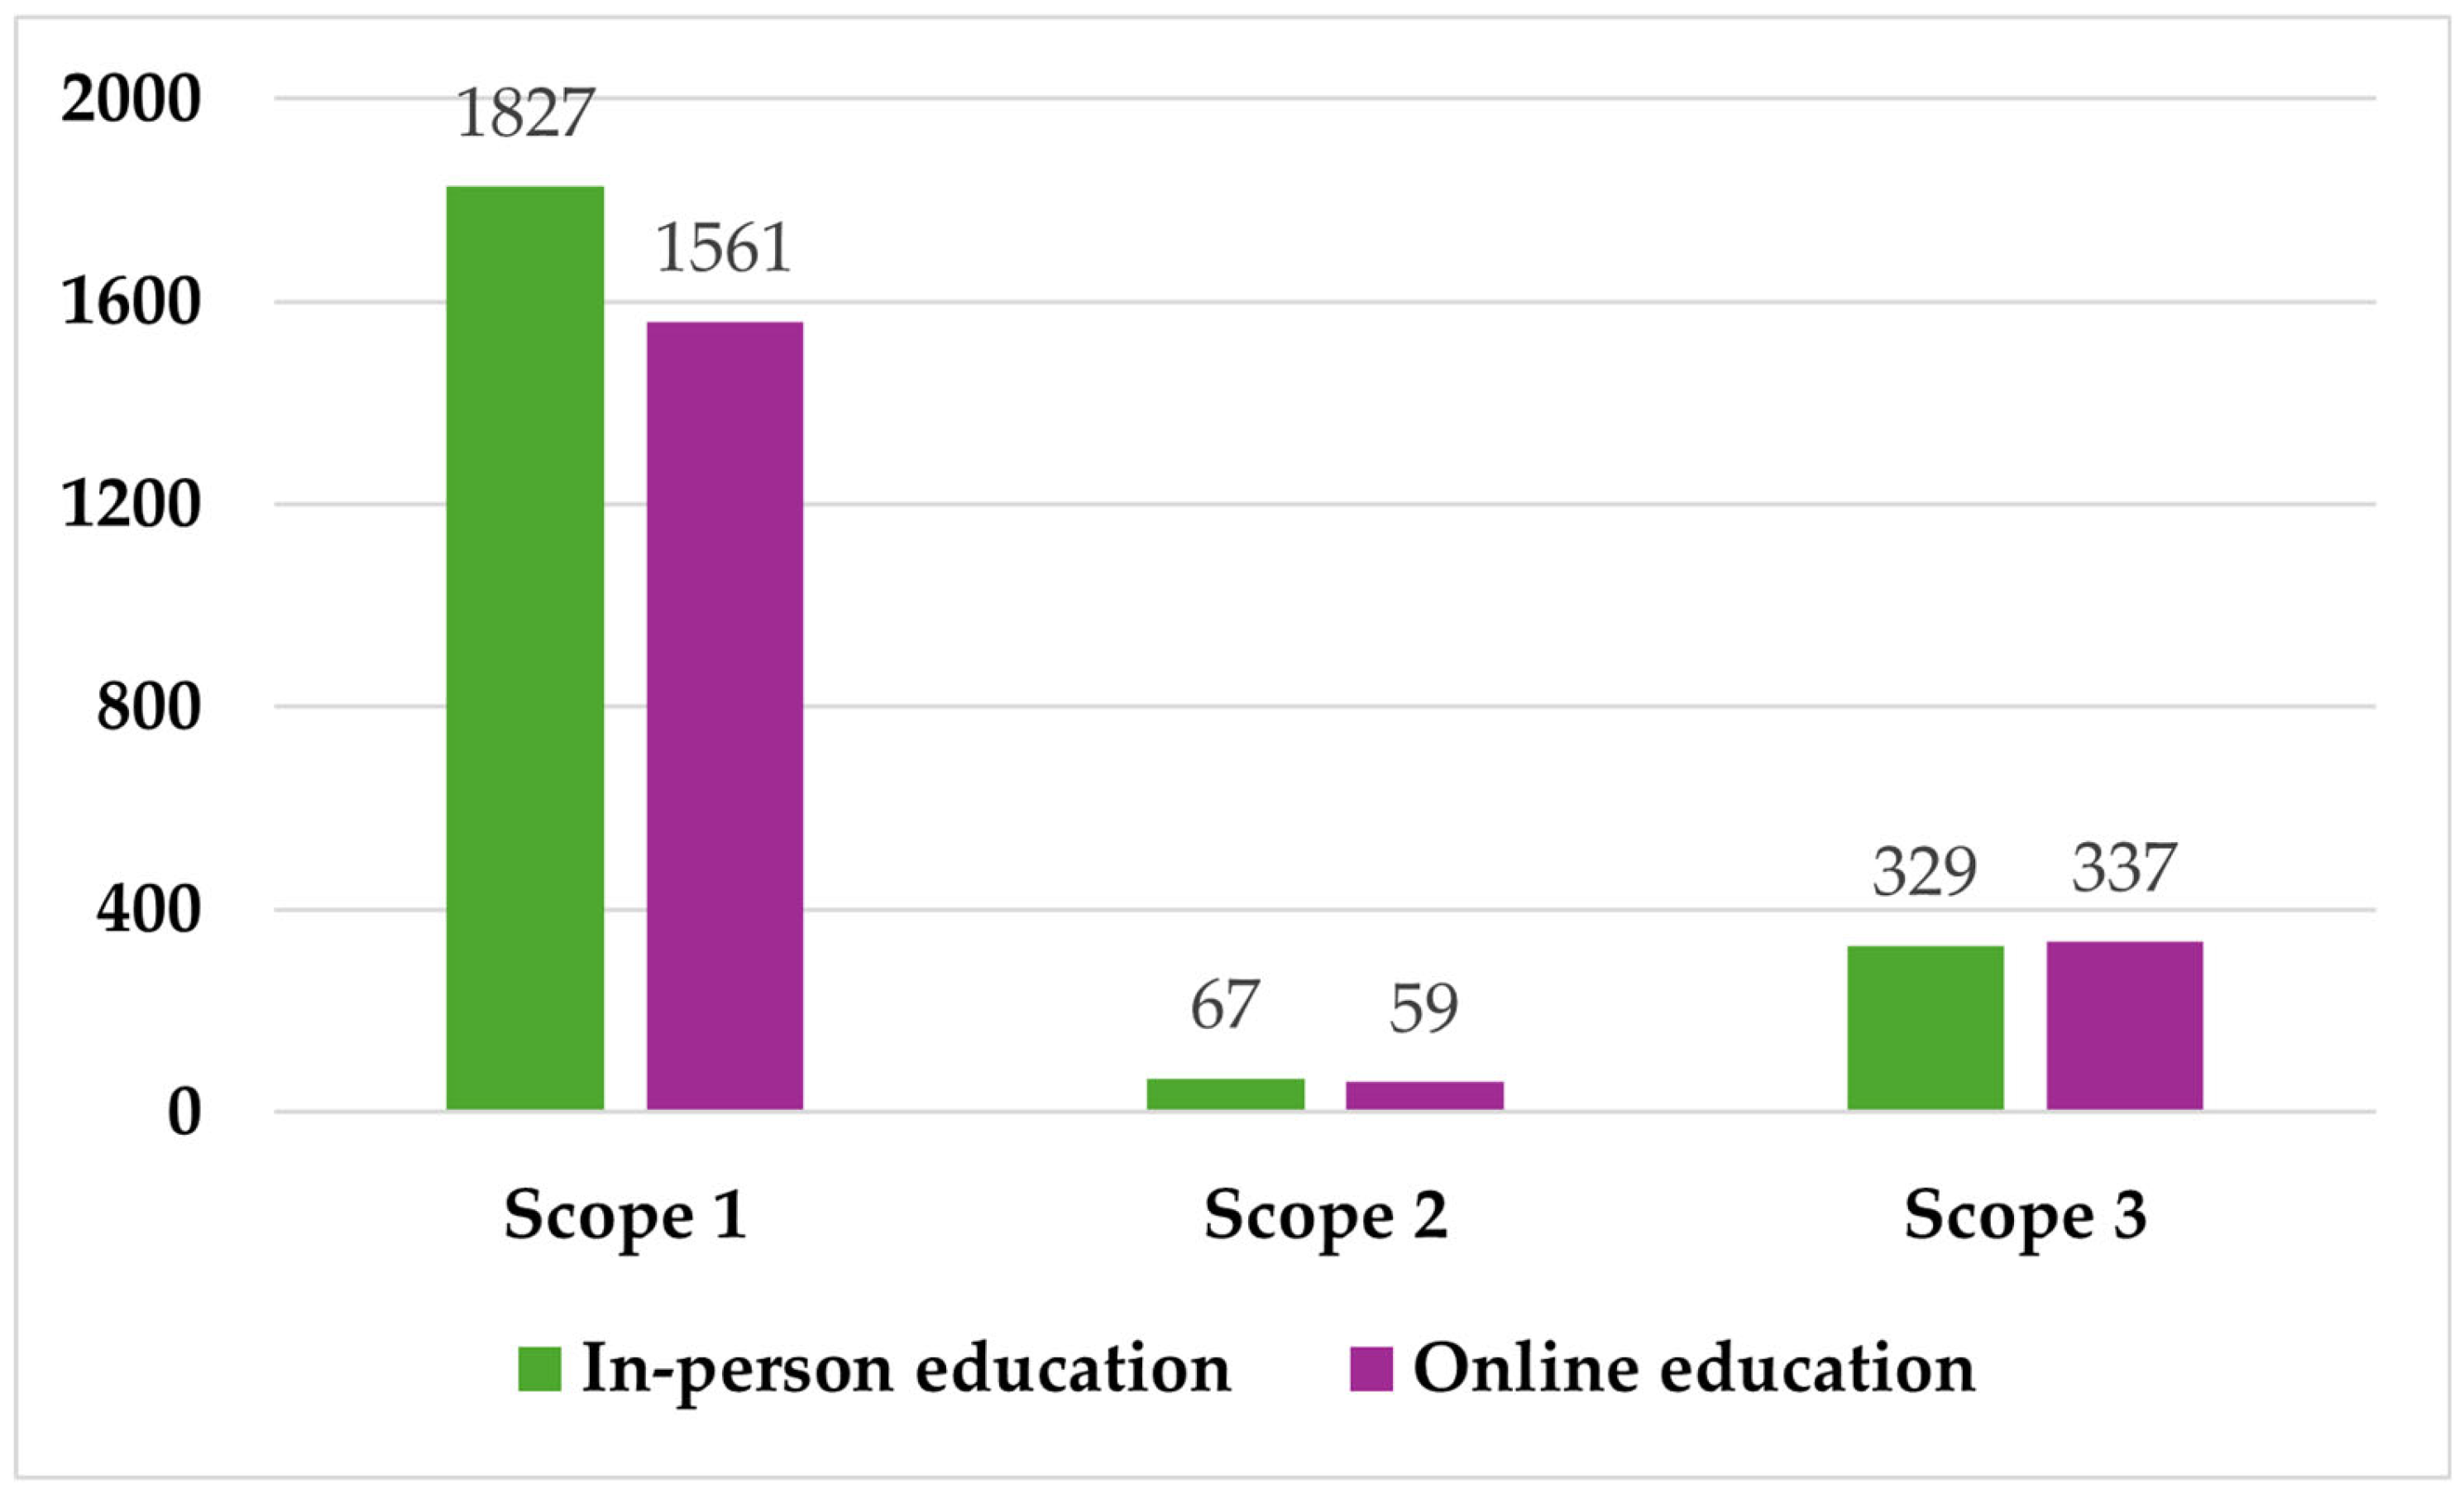
Figure 3.
Comparison of the carbon footprint of in-person and online education according to scope 3 in tons per year.
Figure 3.
Comparison of the carbon footprint of in-person and online education according to scope 3 in tons per year.
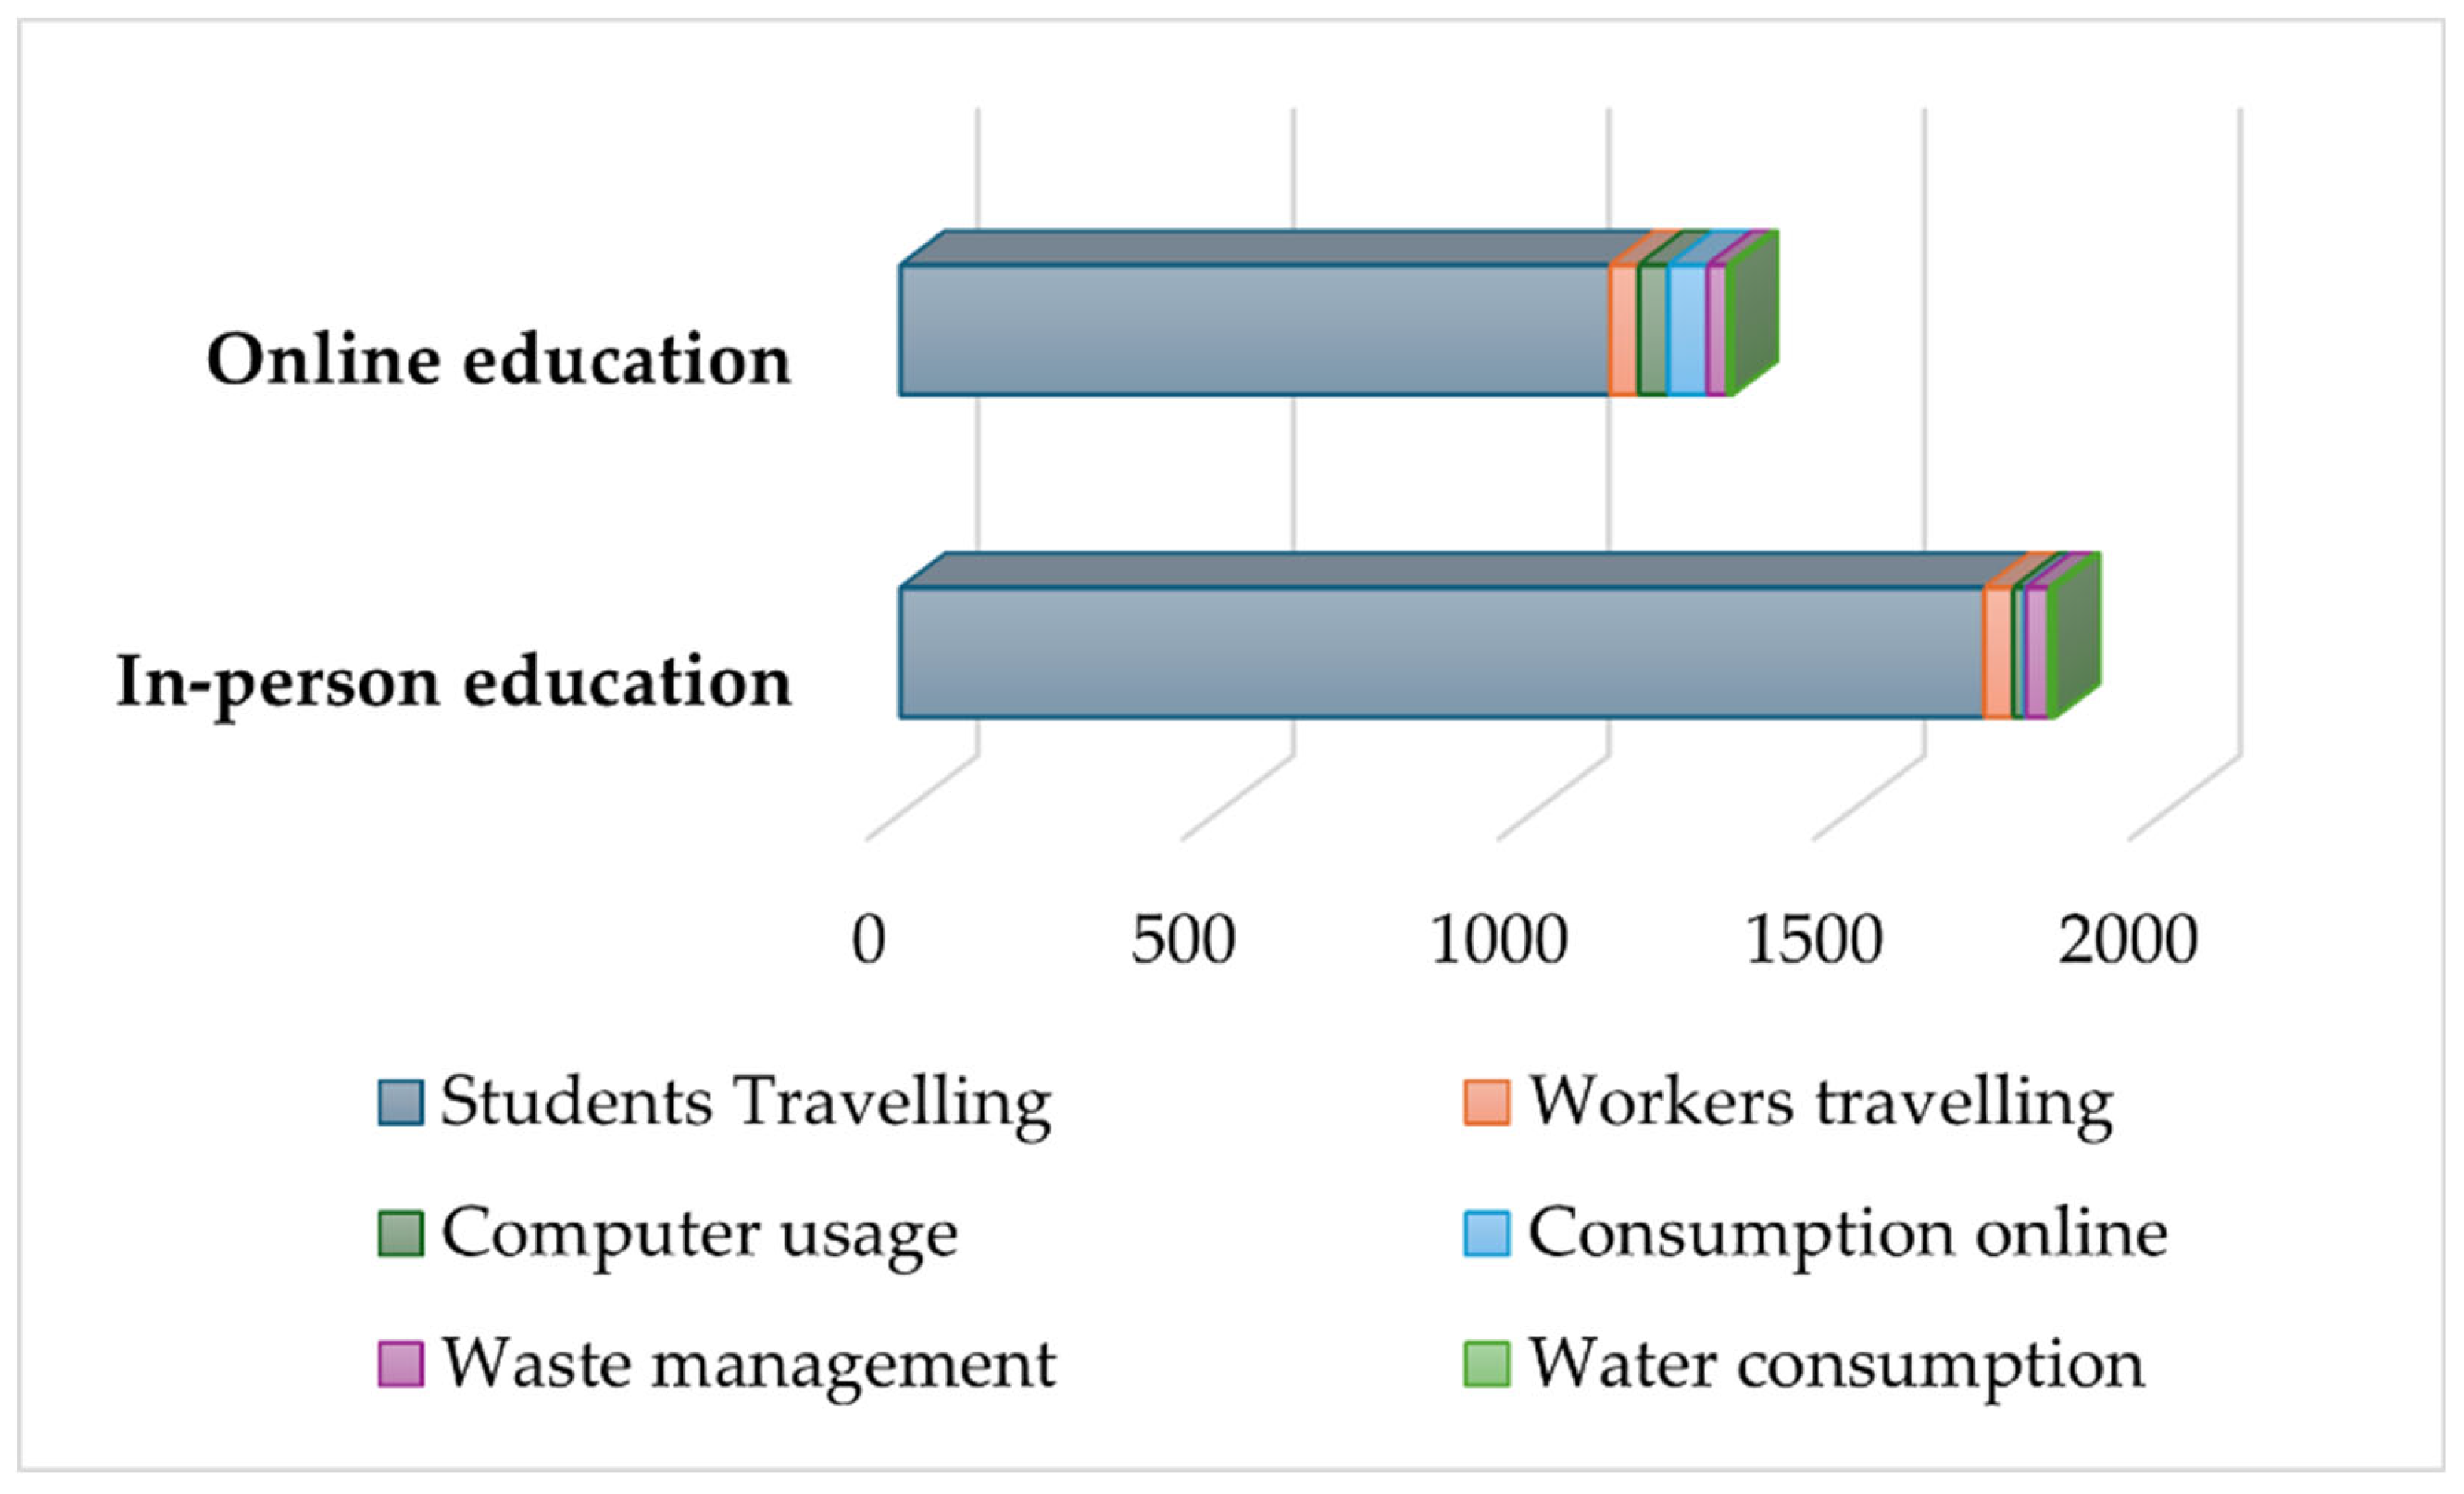
Figure 4.
Percentage distribution in the case of scenario S-1.
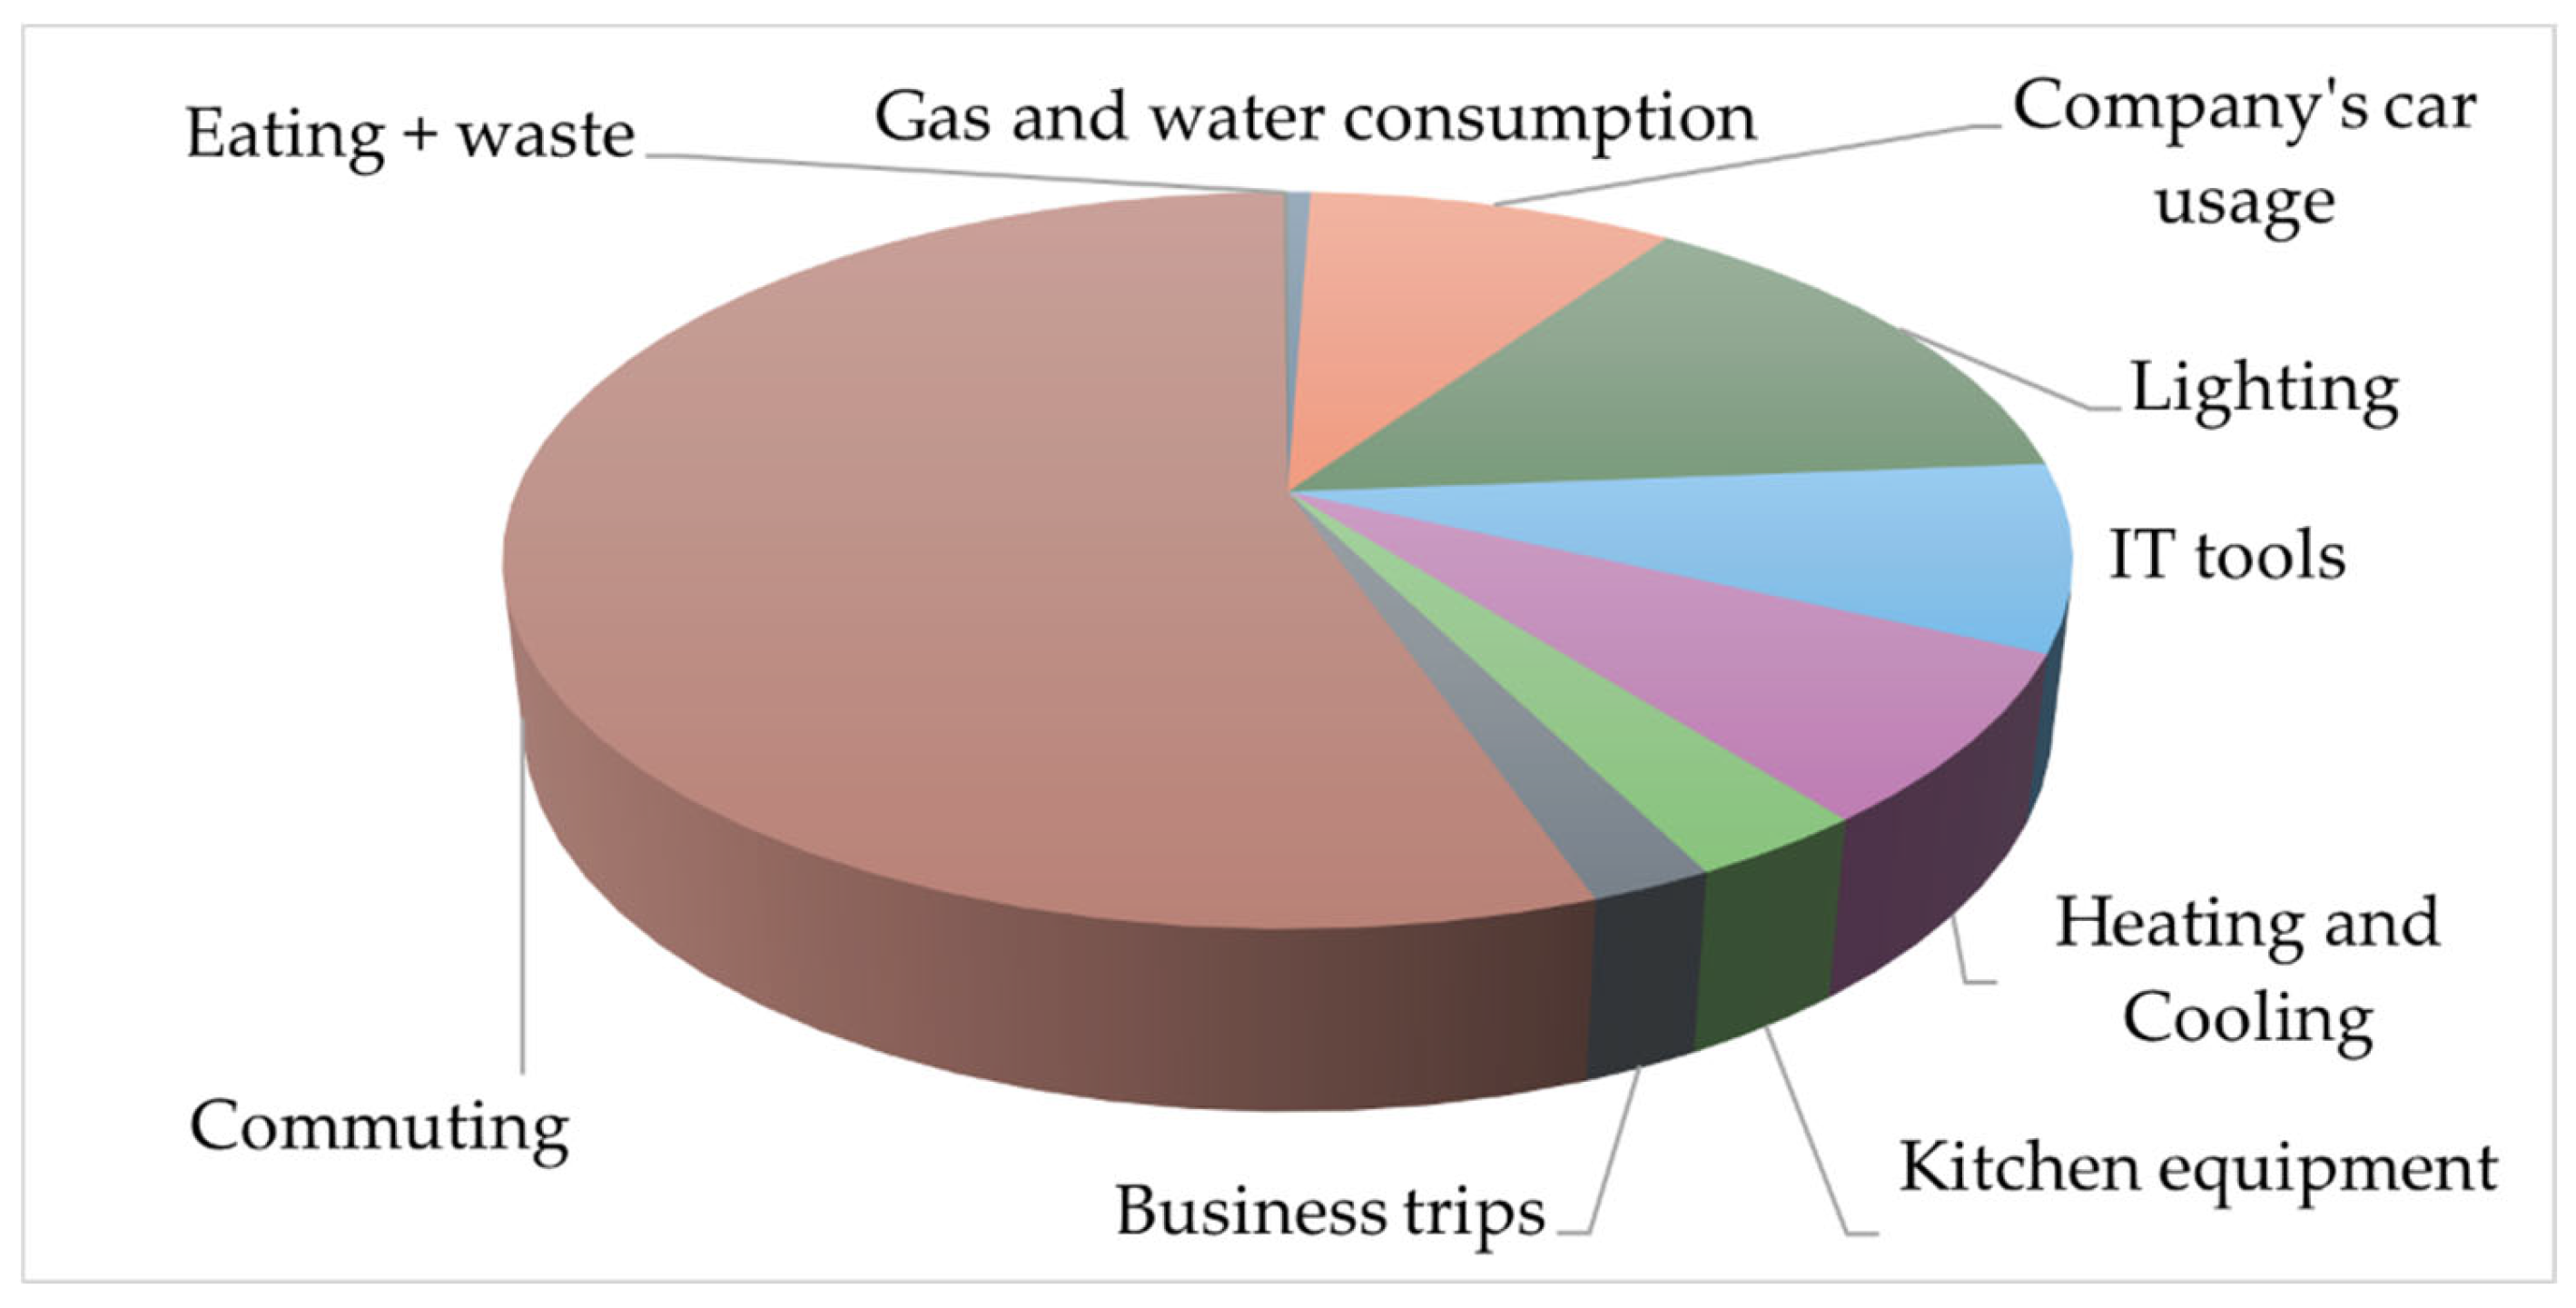
Figure 5.
Percentage distribution in the case of scenario S-2.
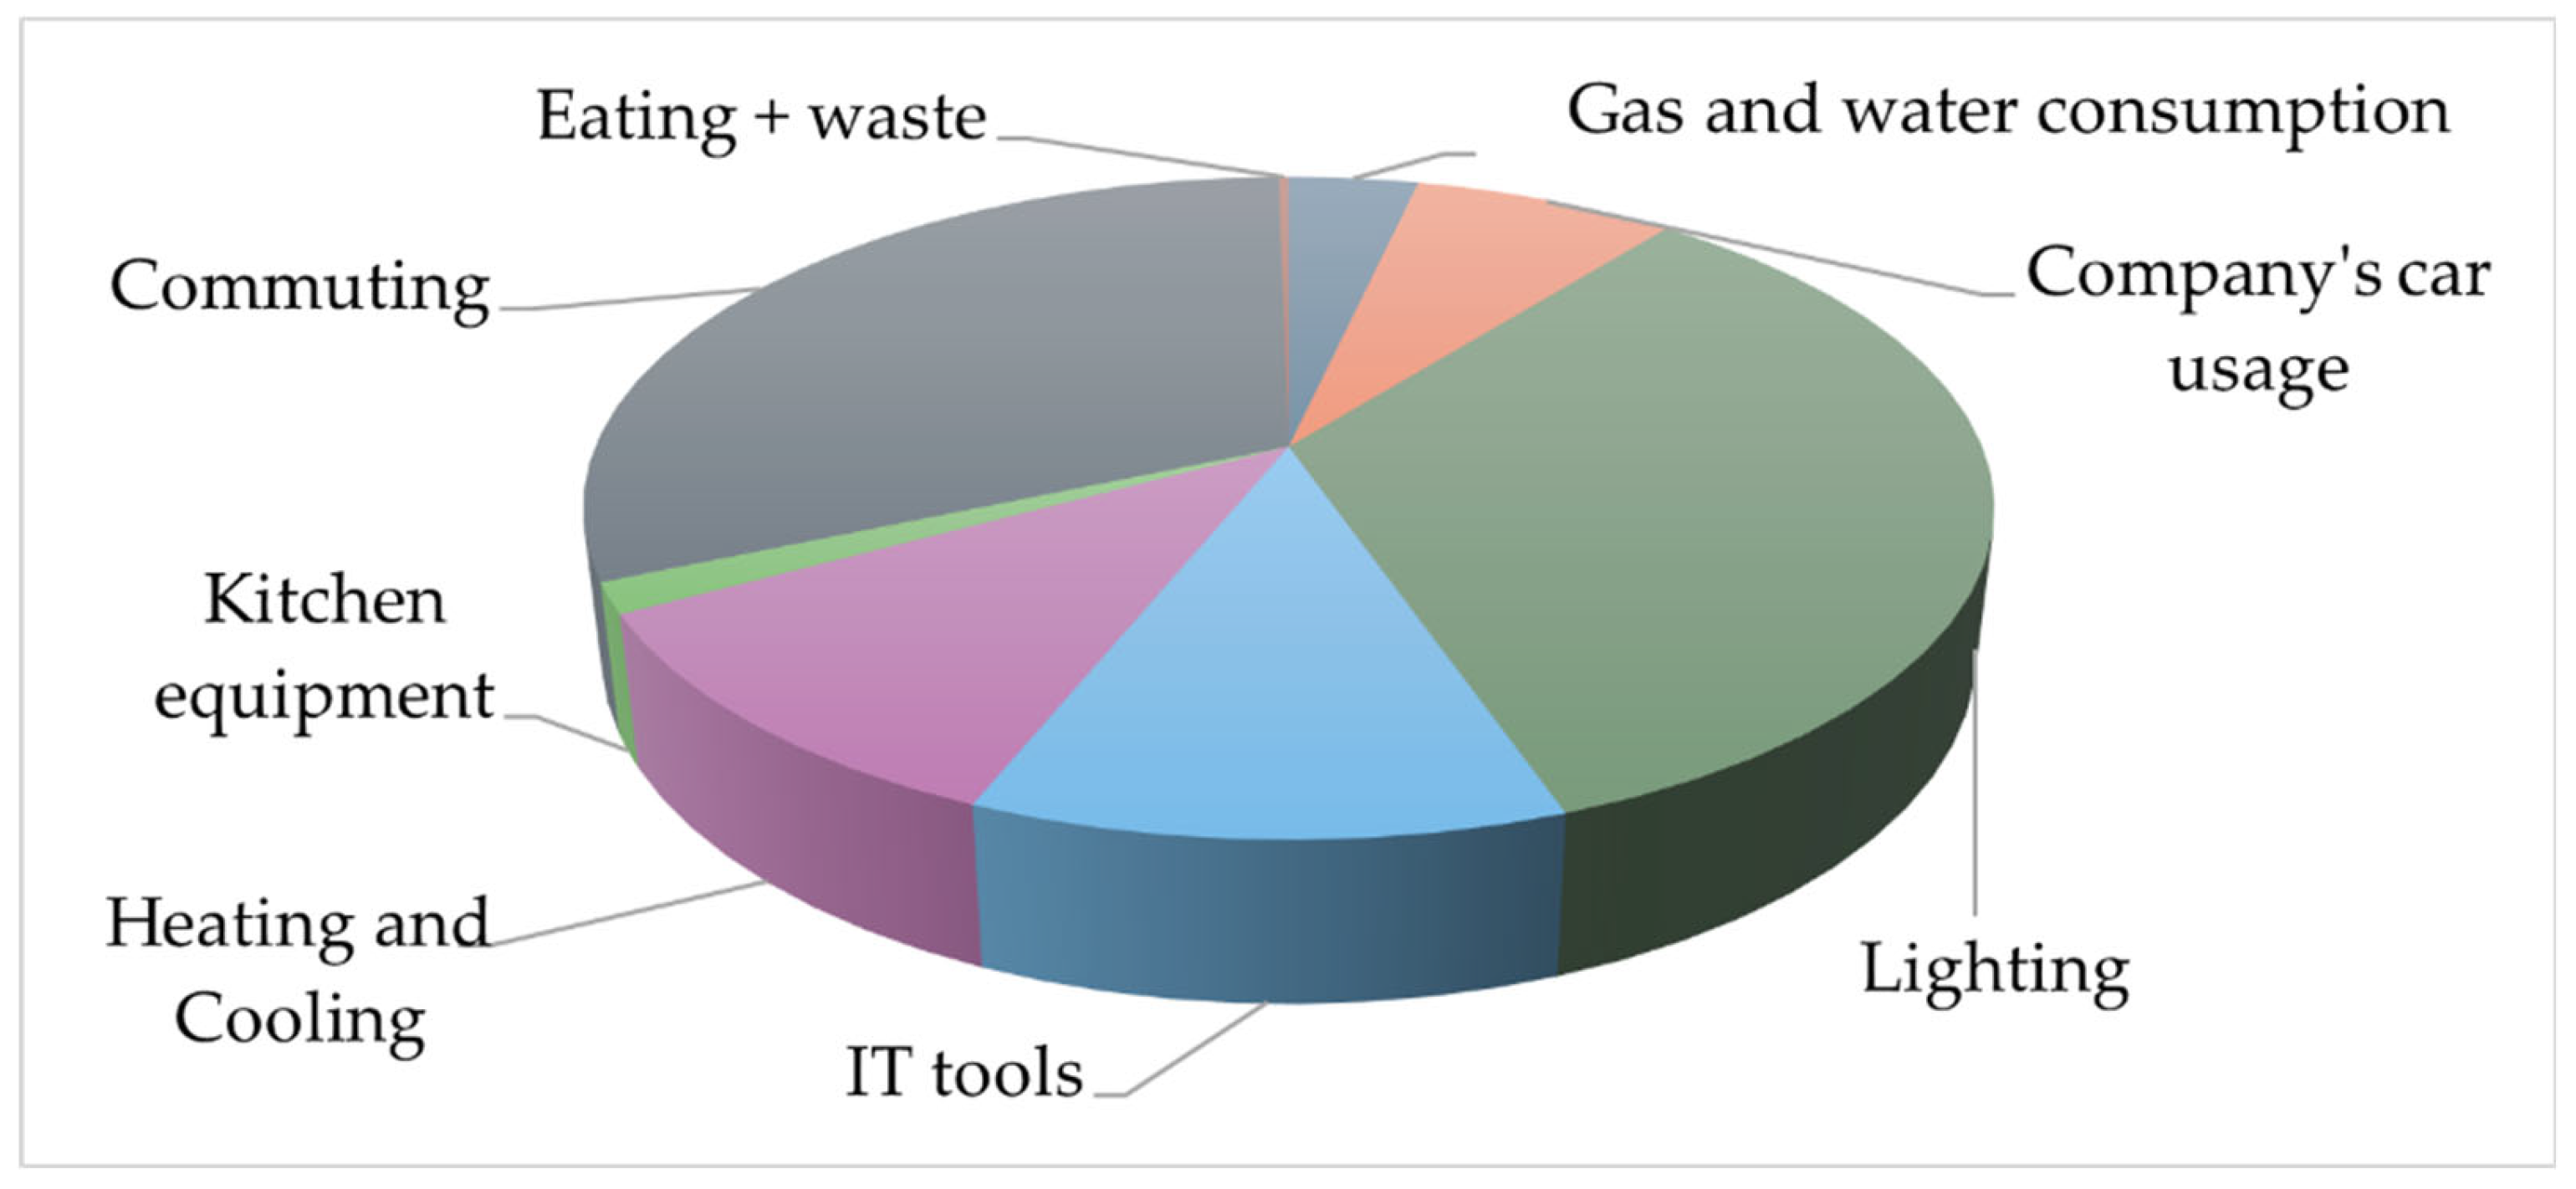
Figure 6.
Percentage distribution in the case of scenario S-3.
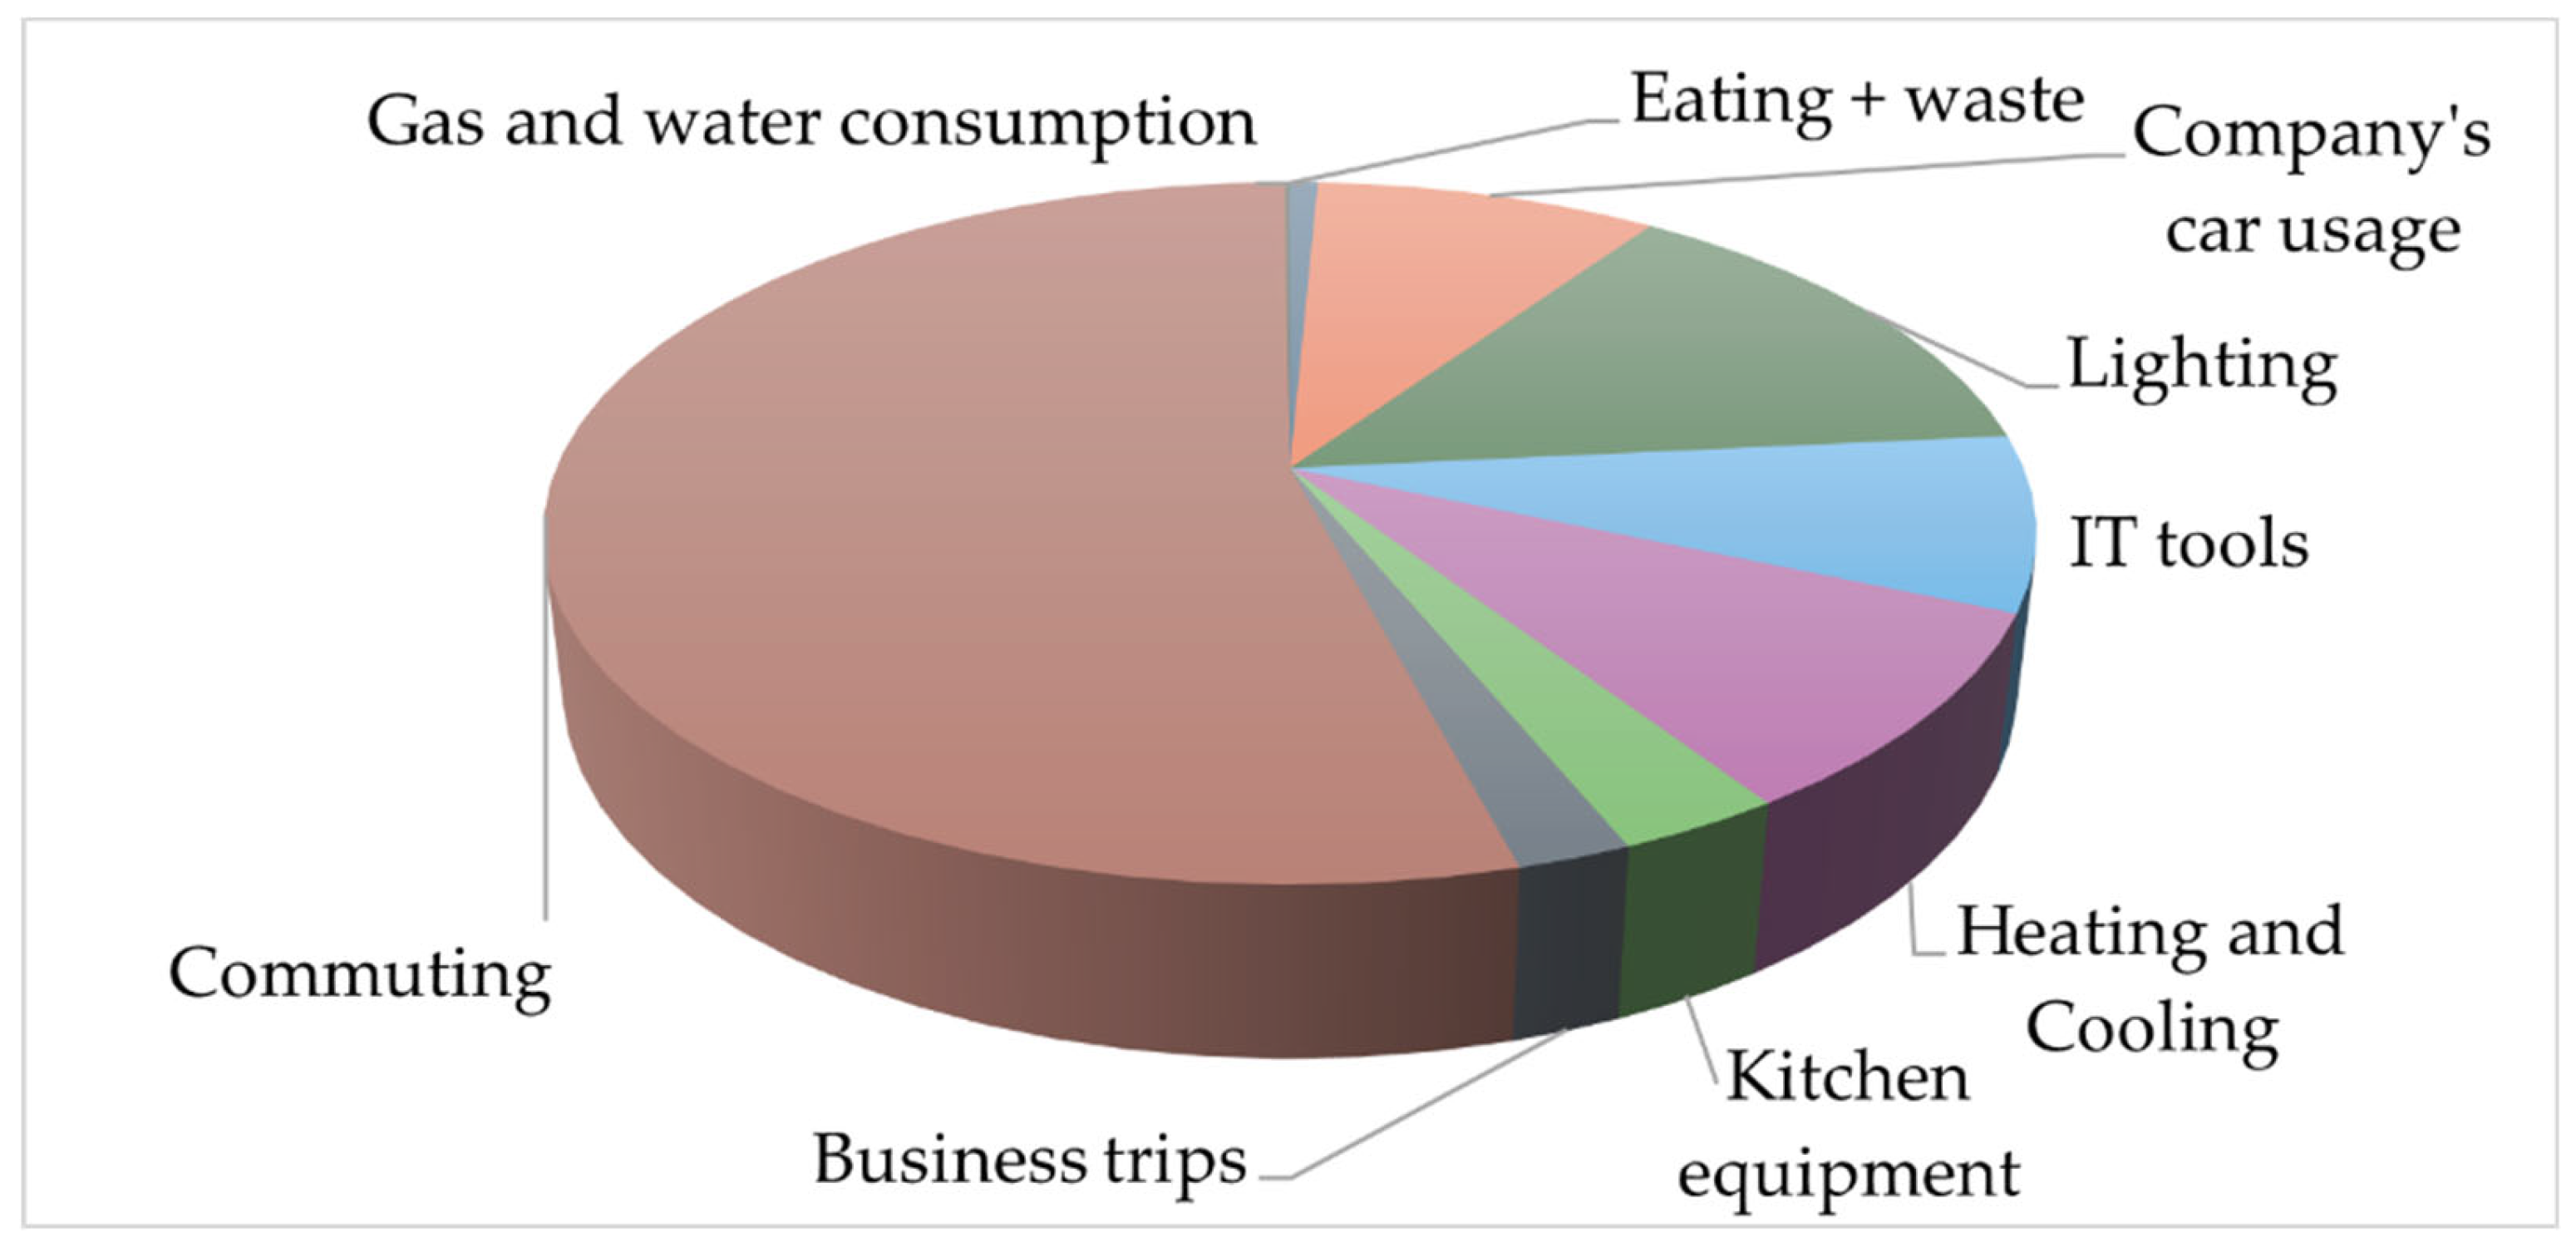
Figure 7.
Carbon footprint values for the three work scenarios in kg CO2 equivalents per month based on the consumption elements.
Figure 7.
Carbon footprint values for the three work scenarios in kg CO2 equivalents per month based on the consumption elements.
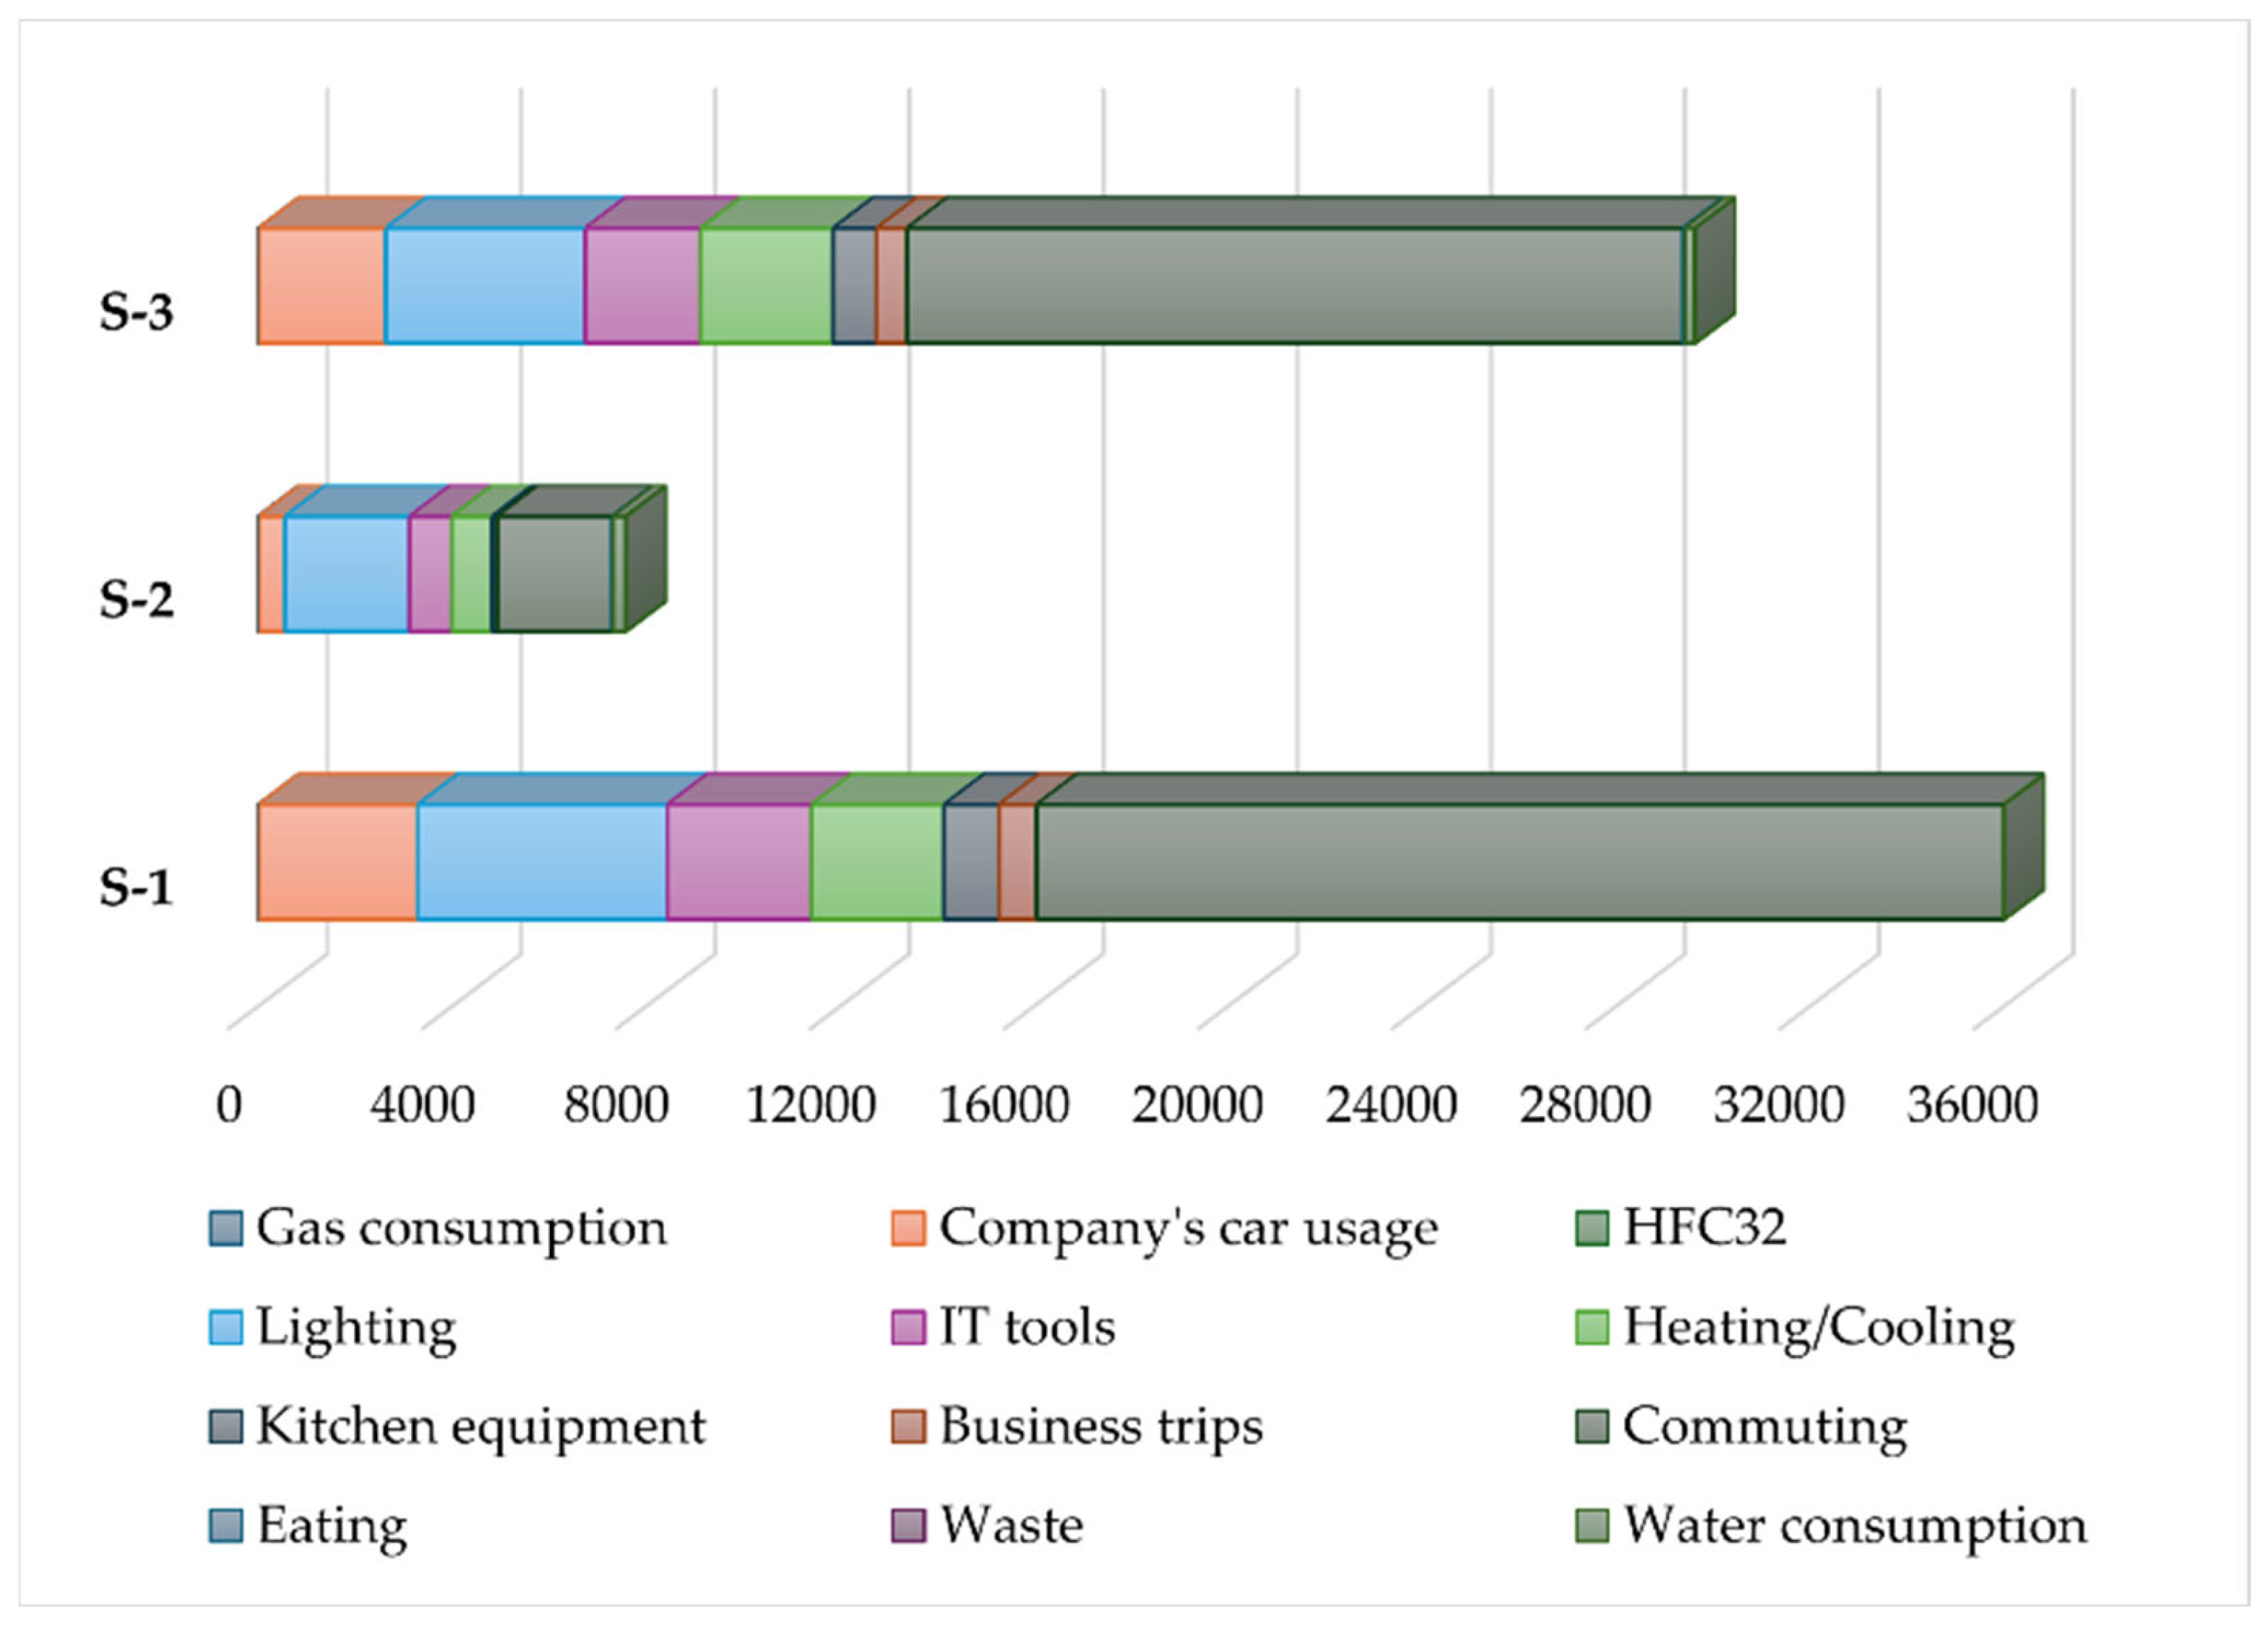
Figure 8.
Life cycle cost per full month in Hungarian forint (HUF).
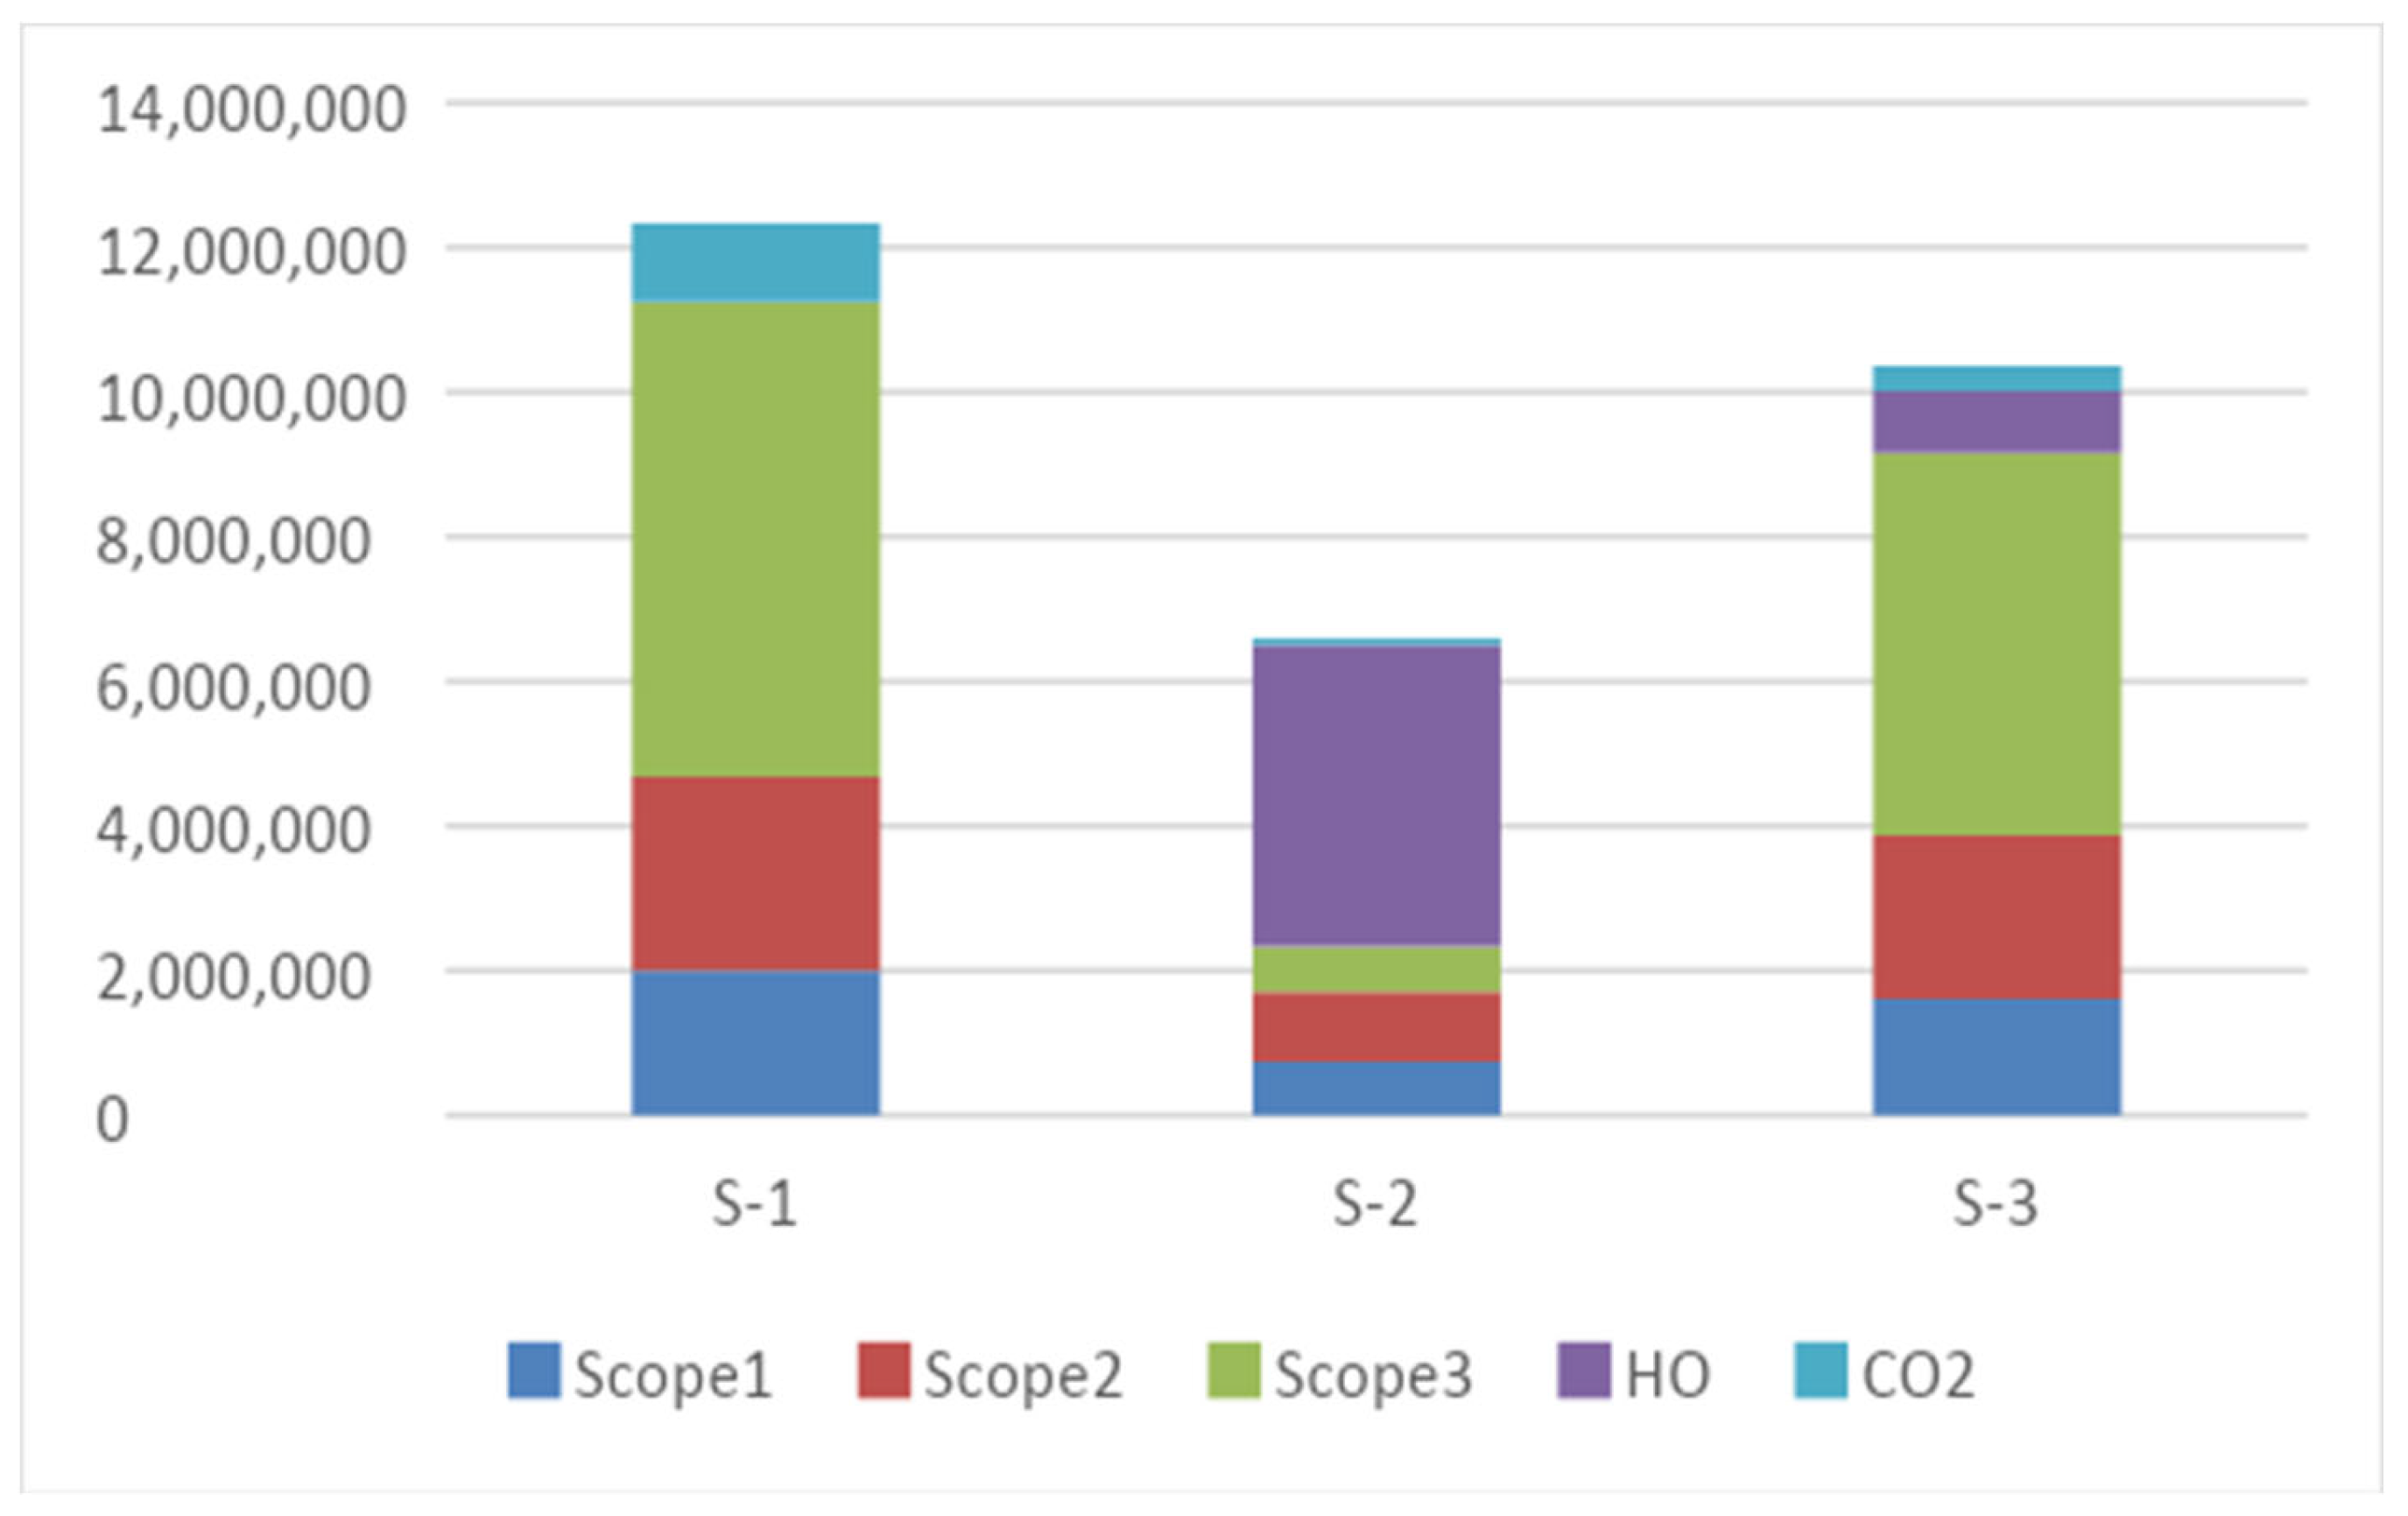
Figure 9.
Specific life cycle cost per person (HUF/hour).
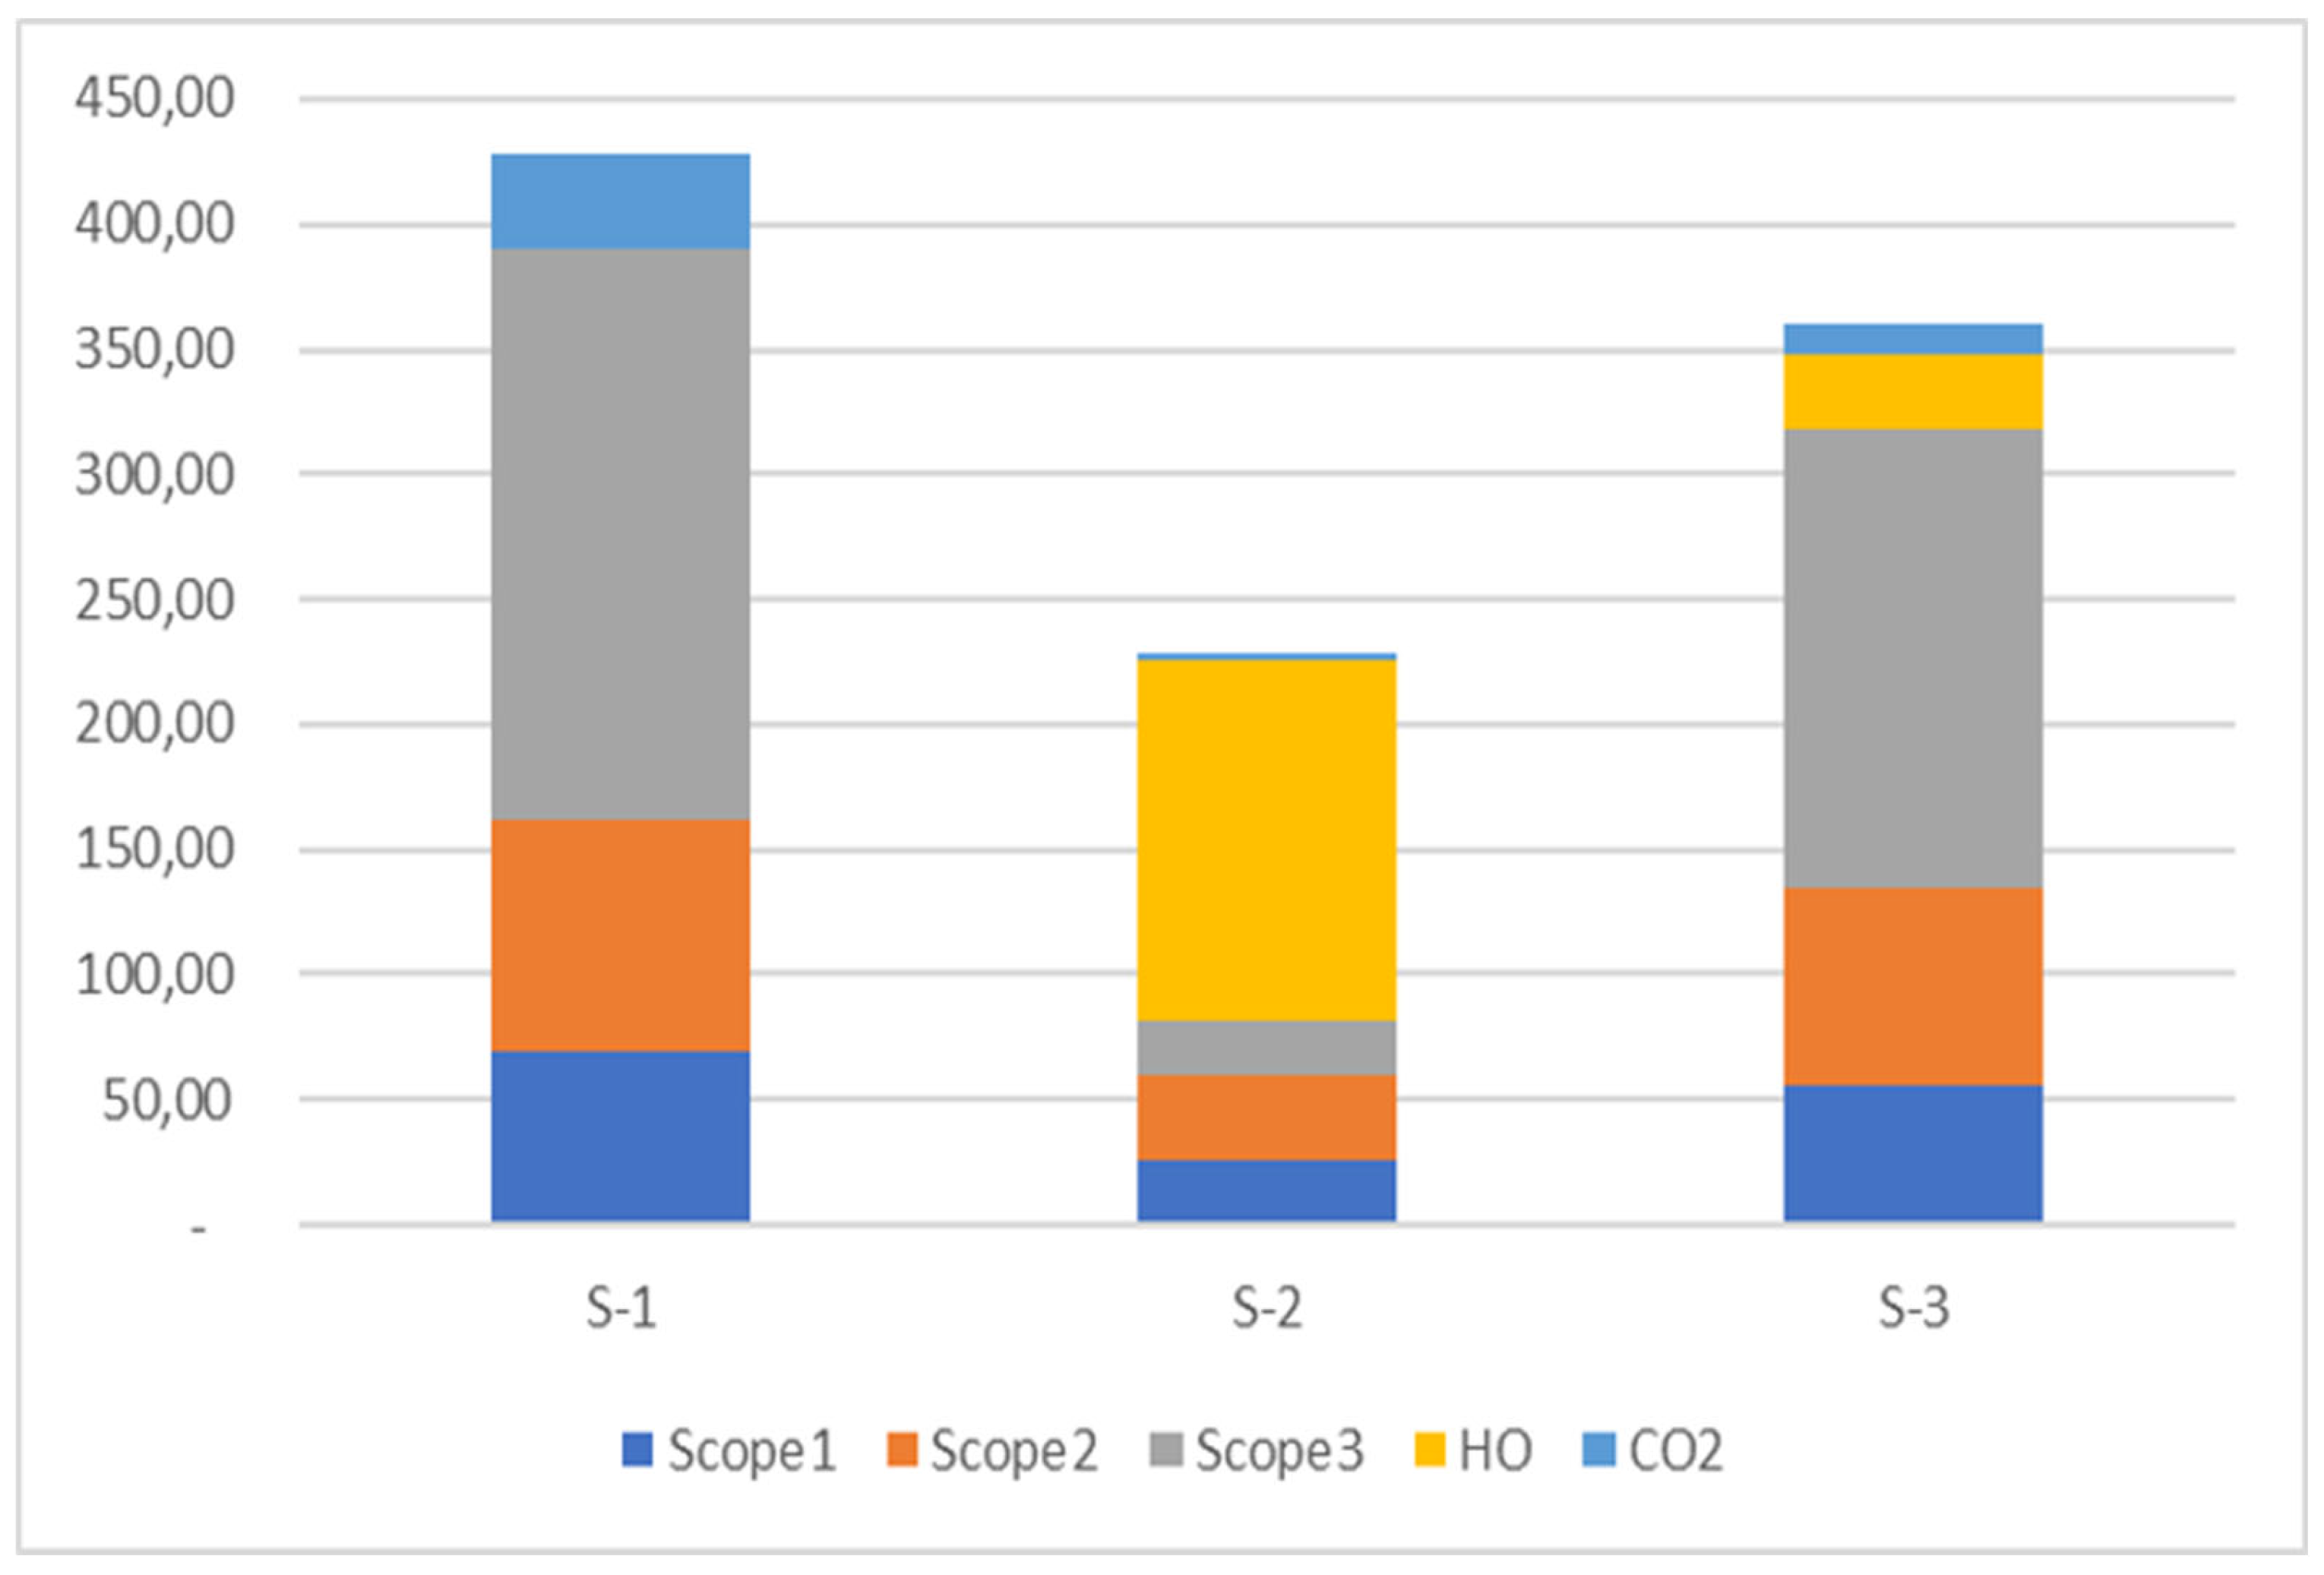
Figure 10.
Percentage distribution of carbon footprint for in-person conference based on the CML 2016 LCIA method. (Functional unit: one person/ one hour).
Figure 10.
Percentage distribution of carbon footprint for in-person conference based on the CML 2016 LCIA method. (Functional unit: one person/ one hour).
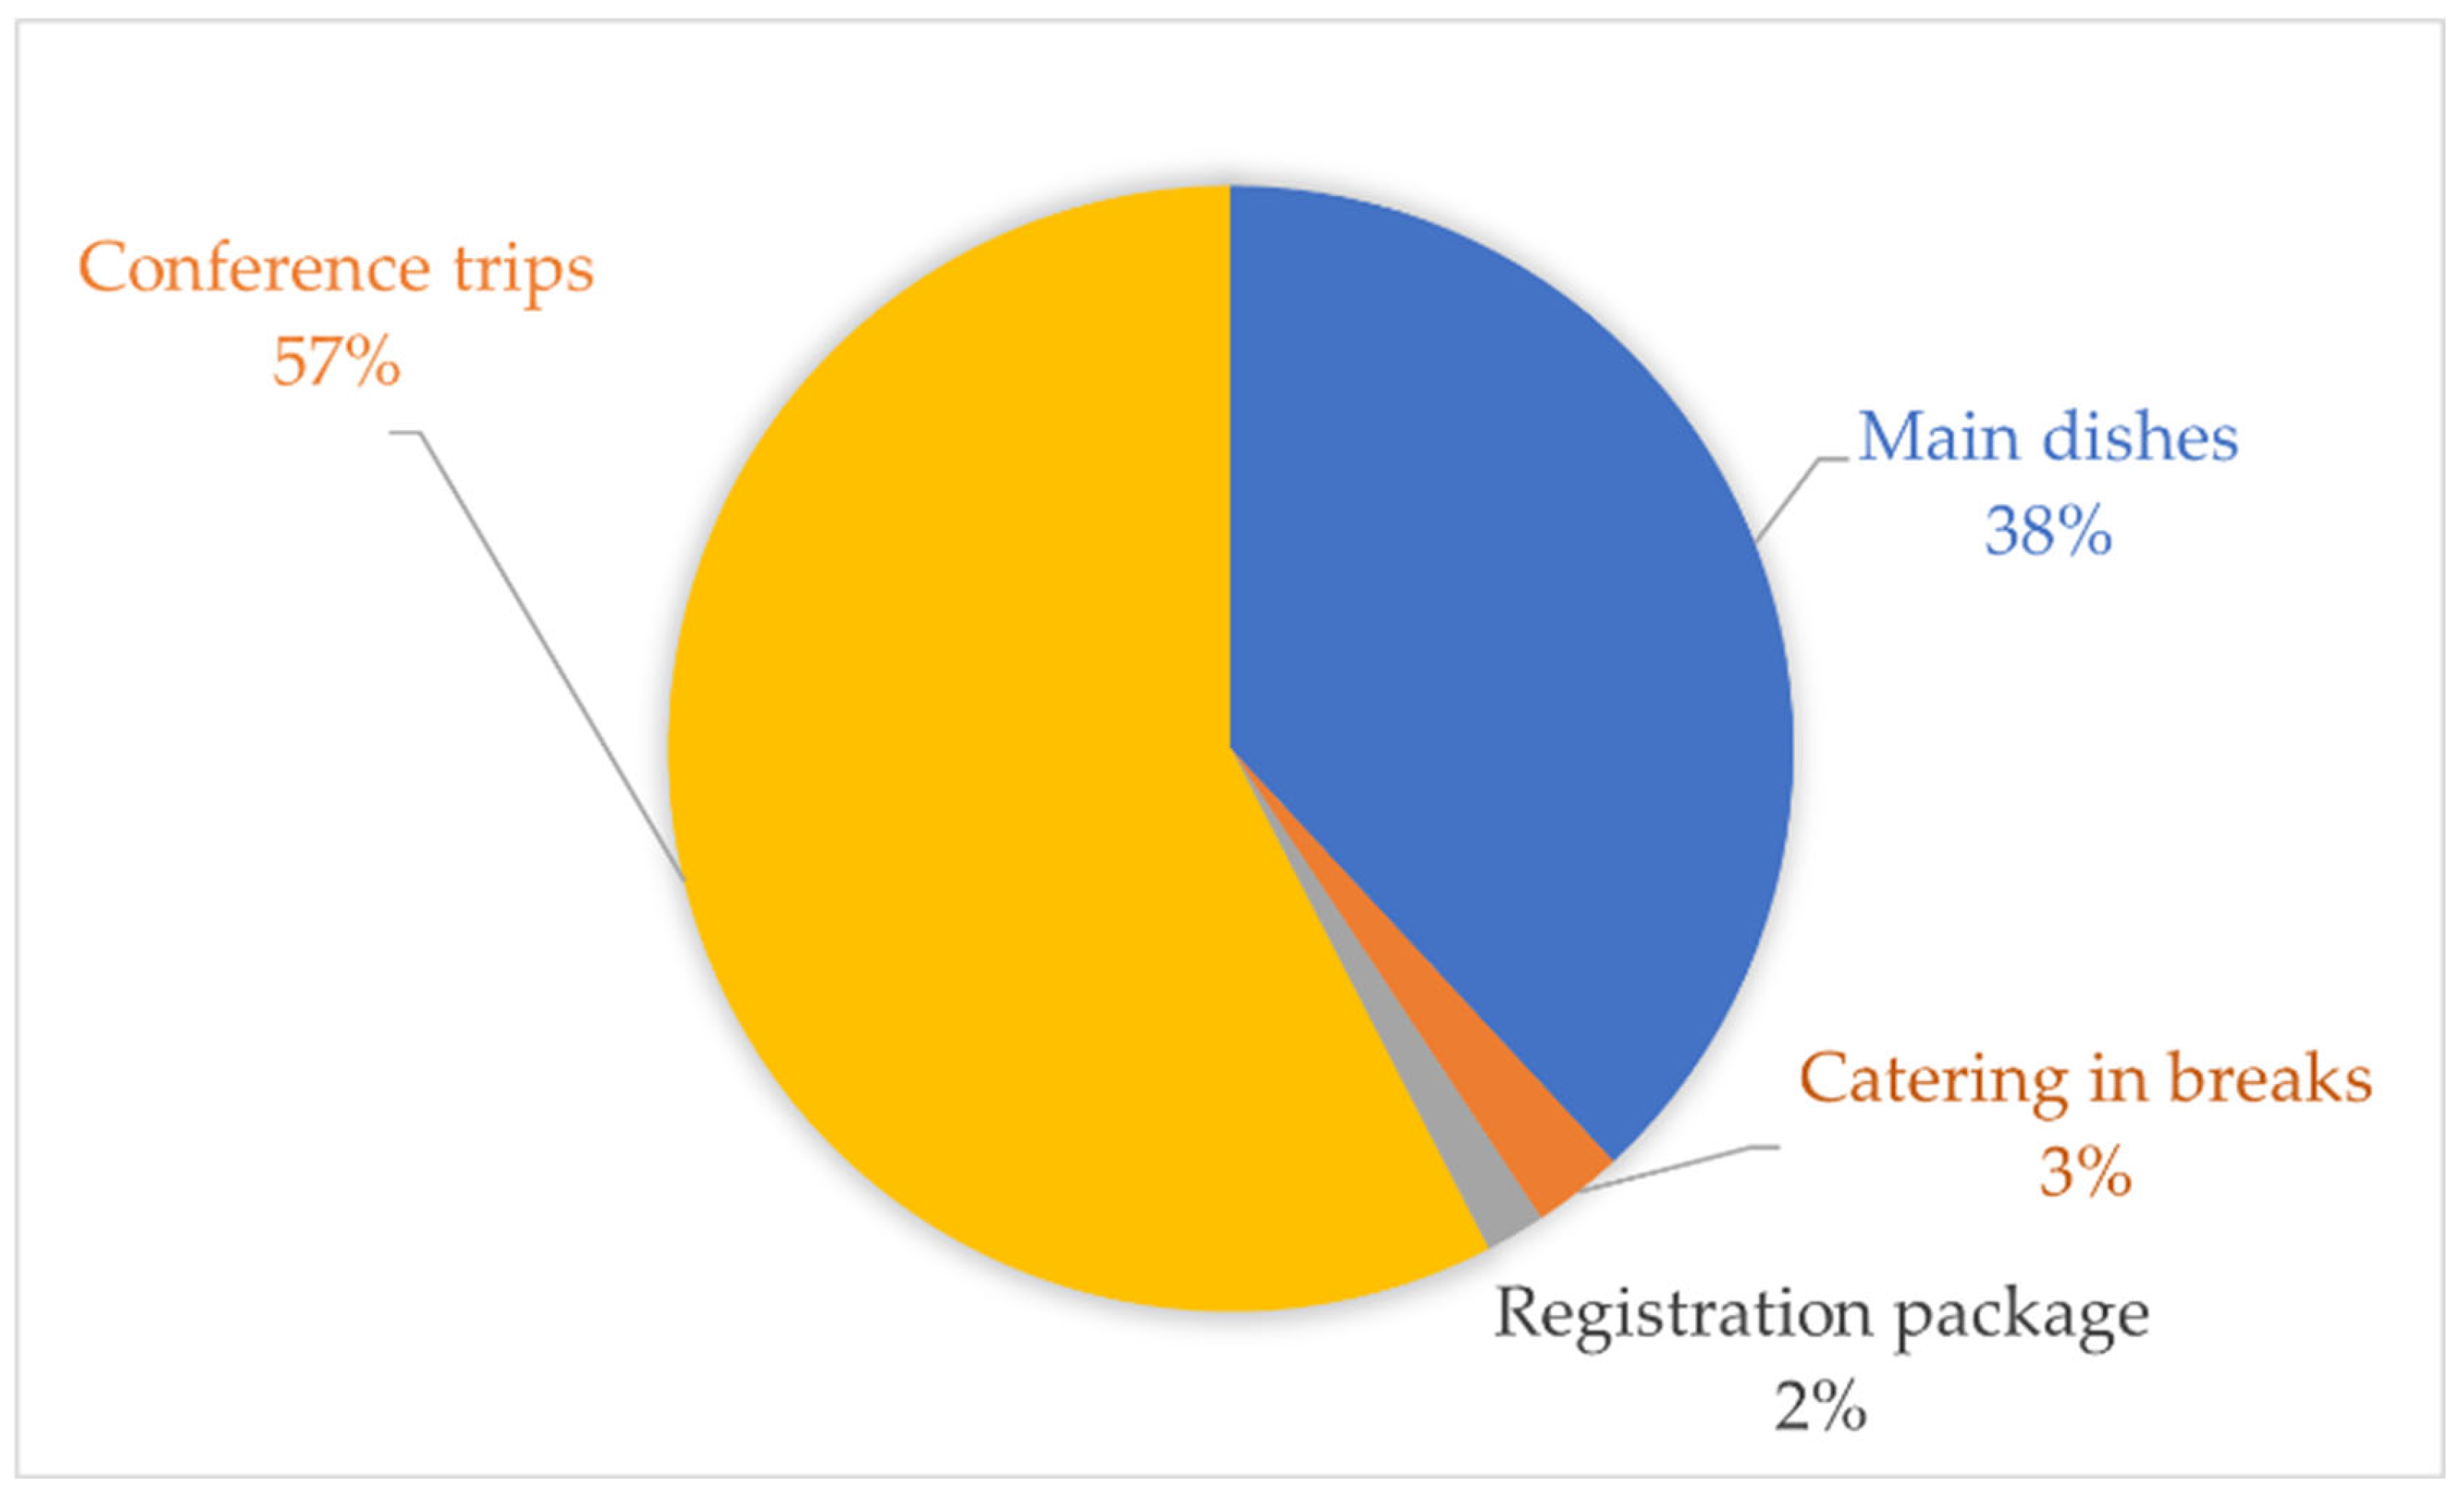
Figure 11.
Percentage distribution of carbon footprint for online conference based on the CML 2016 LCIA method. (Functional unit: one person/ one hour).
Figure 11.
Percentage distribution of carbon footprint for online conference based on the CML 2016 LCIA method. (Functional unit: one person/ one hour).
Disclaimer/Publisher’s Note: The statements, opinions and data contained in all publications are solely those of the individual author(s) and contributor(s) and not of MDPI and/or the editor(s). MDPI and/or the editor(s) disclaim responsibility for any injury to people or property resulting from any ideas, methods, instructions or products referred to in the content. |
© 2025 by the authors. Licensee MDPI, Basel, Switzerland. This article is an open access article distributed under the terms and conditions of the Creative Commons Attribution (CC BY) license (http://creativecommons.org/licenses/by/4.0/).
Copyright: This open access article is published under a Creative Commons CC BY 4.0 license, which permit the free download, distribution, and reuse, provided that the author and preprint are cited in any reuse.


