
Submitted:
02 February 2025
Posted:
03 February 2025
You are already at the latest version
Abstract
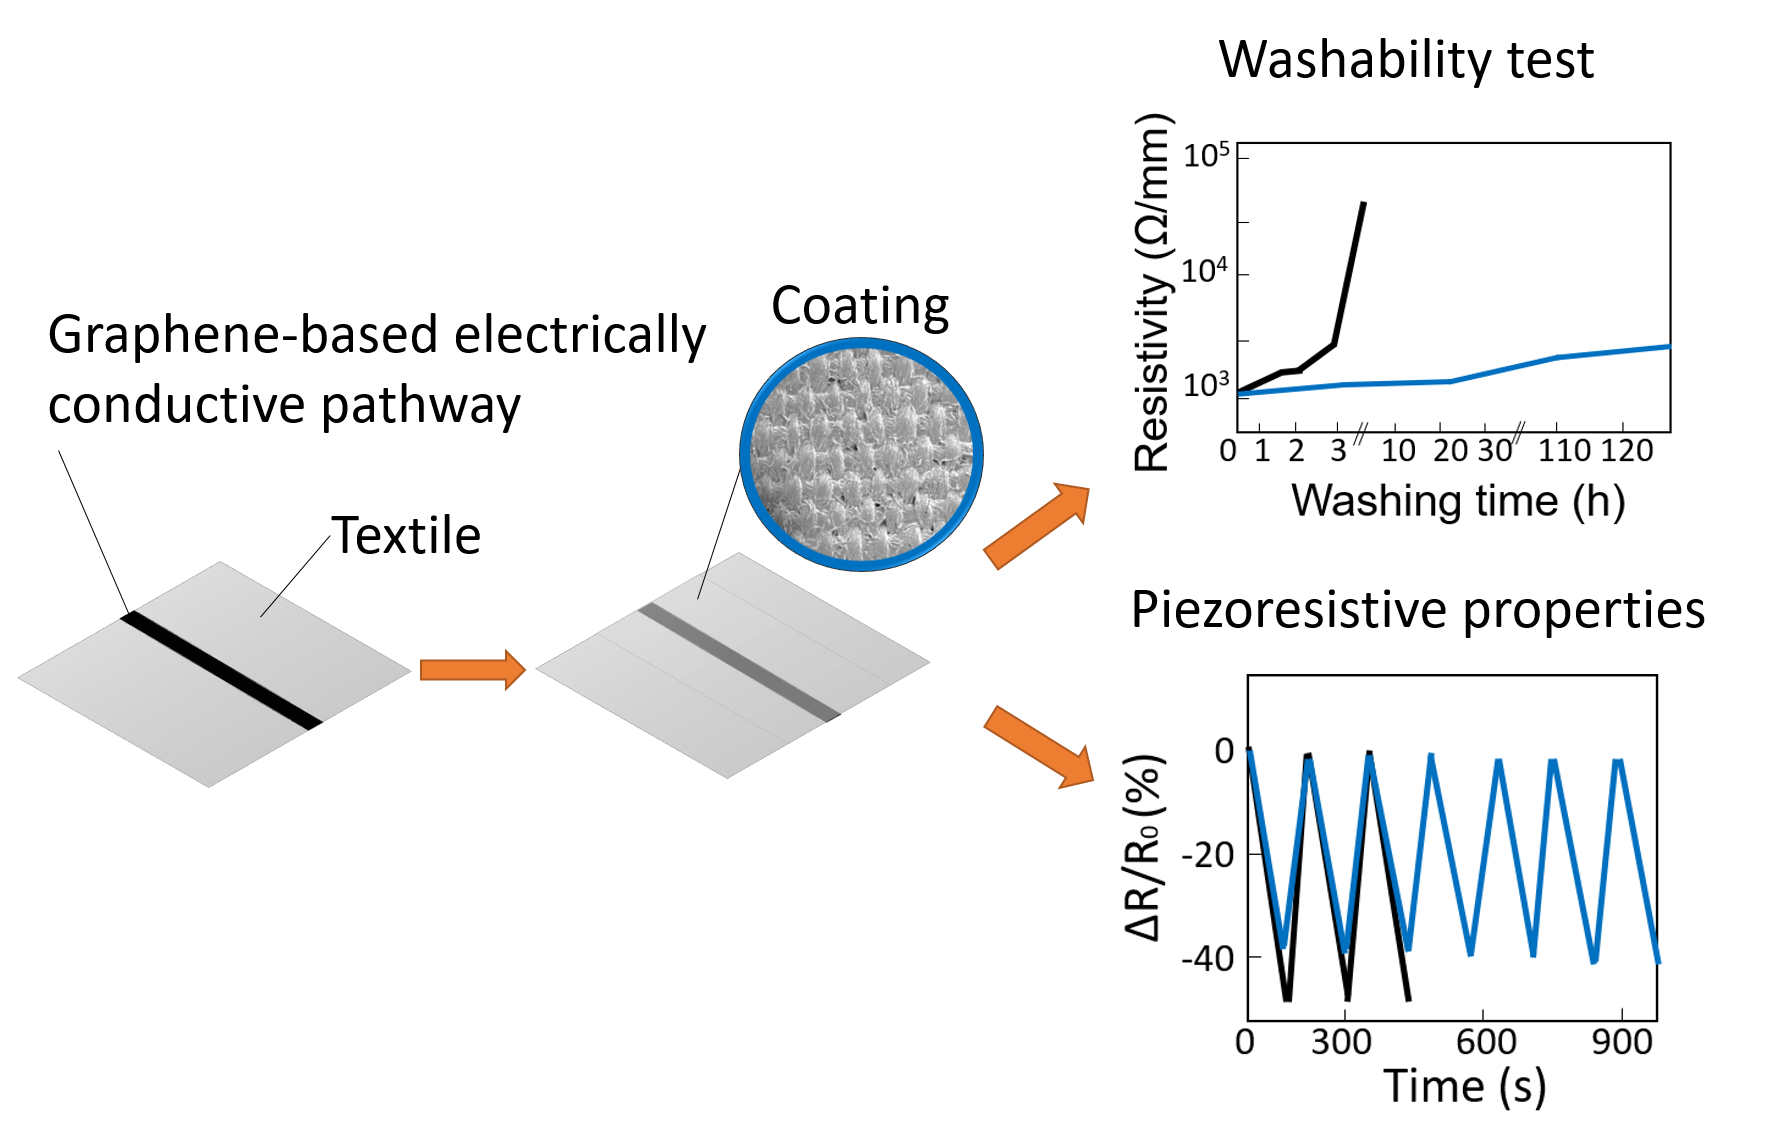
This research explores the development of highly durable, flexible electronic textiles (e-textiles) for wearable electronics, focusing on improving their washability and performance. A conductive graphene-based ink is screen-printed onto a polyester textile. Water-based polyurethane (PU) coatings with variable crosslinker ratios and thickener are applied to solve washability issues. The results show that PU coatings significantly enhance the electrical stability and durability of printed pathways after multiple washing cycles. The conductivity remains intact after 120 washing cycles, indicating that the final properties of the e-textile, which contains 6 wt% thickener and 3 wt% crosslinker, provide effective water protection. The results highlight the promise of these coated e-textiles for wearable electronics applications, especially in the occupational and healthcare sectors, where long-term flexibility, washability are critical.
Keywords:
Coating
; thermoplastic polyurethane
; conductive textile
; e-textile
; electrical conductivity
; graphene
1. Introduction
The growing interest in wearable technology has spurred substantial innovation in smart fabrics and advanced materials, especially for monitoring vital human metrics. [1,2]. Recent advances in printable inks-based on 2D materials have created new opportunities to integrate electrical sensors directly into textiles, enhancing the use and comfort of wearable technology [3,4,5]. In this context, graphene has attracted considerable attention due to its remarkable properties, such as excellent conductivity (3000-5000 W/m*K), high Young’s modulus (≈ 1 TPa), optical transparency (≈ 97.7%), and high carrier mobility (≈ 10,000 cm2/V*s) [6,7]. Graphene electrodes printed on textiles offer effective and adaptable options for continuous health monitoring [8,9].
The application of fabric-printed graphene, i.e. in electrocardiogram (ECG) monitoring, is considered a major step towards wearable medical technology that is less intrusive and more comfortable [10,11,12].
However, despite the promising advantages of graphene-based printed electronics, several challenges remain in ensuring the durability and stability of conductive pathways on textiles [13,14,15].
Typically, graphene-based inks are water-based and environmentally friendly. The washing and wear resistance of graphene inks applied to fabrics are the two main disadvantages. In fact, these inks are susceptible to degradation from mechanical stress during washing cycles and exposure to moisture. The printed conductive paths lose electrical performance if not properly protected [16,17,18,19]. To overcome these problems, advanced coating strategies are necessary to improve the durability and reliability of printed graphene circuits on textiles [20]. Polymer coatings can be used to maintain the elasticity and permeability of the fabric while improving adhesion, water resistance, and mechanical strength. In this context, polyurethane (PU) is one of the most promising materials with these characteristics. However, conventional PU coatings often show excessive absorption into the textile fibres, which can result in uneven protection of the conductive path [21,22,23].
To mitigate this issue, the present research explores the formulation of waterborne coatings incorporating polyurethane-based thickeners and aliphatic isocyanurate crosslinkers. These additives modify the viscosity and crosslinking density of the PU matrix, creating a uniform protective layer that enhances the tailoring of the coating and increases washability and conductivity retention. In particular, the urethane-based thickener increases the density of the PU network, while the isocyanurate crosslinker forms inter-chain links that reduce polymer mobility and improve water resistance [24,25]. The combined effect of these components, in specific proportions, represents a novel approach to stabilizing graphene-based printed electronics on polyester fabric textiles by screen-printing.
To understand the effect of the coating formulation on the performance of the printed conductors on textiles, morphology, wetting, electrical and washing properties of graphene conductors, and the effect of the pathway width were correlated with physiological monitoring. The research highlights the importance of coating formulation and investigates the effectiveness of waterborne green polyurethane coatings. The combined properties of the two additives in different proportions, in the ratio identified, represent an element of novelty within the state of the art. The ability to effectively coat and protect conductive pathways printed on textiles with water-based inks from washing enables wearables e-textiles.
2. Materials and Methods
A screen-printing machine (K-SER1 EVOs by KEY, Italy) was used to apply the ink (GUP® C-Paste kindly provided by GrapheneUP, Rep Ceka) onto the 100% shuttle-woven polyester previously treated for dyeing.
Conductive pathways with a length of 180 mm and variable widths of 5, 3 and 1 mm were used. After each deposition, the textiles are cured at 120 C for 3 minutes. The screen-printing and ink curing process was repeated 3 times, obtaining 3 layers of ink. This was done to maximize electrical conductivity, as reported in the literature [3]. The ink was deposited by screen-printing following the direction of the warp.
After the ink is cured, the polyurethane coating is applied to cover the ink pathways (top and bottom of the fabric in order to prevent water contact with the water-soluble ink). The average thickness of the coating results approximately in 15 µm.
Coatings were obtained by mixing water-based POLYTECH BIO E02 thermoplastic polyurethane (TPU) with different amounts of CROSSTECH 655 aliphatic polyisocyanate crosslinker and VIXTECH 872 water-based urethane thickener (kindly provided by ICAP-SIRA Chemicals and Polymers, Italy). These two additives are commercially indicated to improve TPU processing conditions. The technical data sheets for each additive indicate that CROSSTECH 655 can be used at levels between 1 and 6 wt%, while VIXTECH 872 can be used at levels between 0.5 and 3 wt%. To find the satisfactory condition for the screen-printing deposition, starting from the minimum percentages indicated in the technical data sheets of the materials, a step-by-step evaluation of the minimum percentage concentration is required. For this reason, the first coating formulation, namely T1 (Table 1), is a composition of 2 wt% of crosslinker and 2.5 wt% of thickener; instead the sample namely T2 contains an average amount (2.5 wt% of crosslinker and 2.5 wt% of thickener, in order to consider a ratio of 1:1), and the sample namely T3 includes the maximum amount for each material (that corresponds in a percentage of 6 wt% of crosslinker and 3 wt% of thickener). To identify the different prepared systems, the following nomenclature was used: PE/Ink/Tx/y, where x is 1, 2 and 3 according to Table 1 and y is 5, 3 1, expressed in mm, as width of the deposited pathways.
2.1. Fourier-Transform Infrared Spectroscopy (FT-IR) Analysis
Using a Frontier FT-IR/NIR spectrometer (PerkinElmer, Massachusetts, USA) in Attenuated Total Reflectance (ATR) mode, the FT-IR spectra of TPU-based films at room temperature were recorded in the range 650 to 4000 cm-1. The results are the average of 64 scans with spectra acquired at 4 cm-1 resolution. TPU films with different percentages of crosslinker and thickener were tested. Origin-Pro 8.5.0 SR1 software was used to evaluate the specta.
2.2. Wettability Properties
The angle that forms at the point where a liquid and a flat surface meet is known as the contact angle. Surfaces that have a water contact angle of more than 90° are hydrophobic, whereas surfaces that have an angle of less than 90° are hydrophilic [26].
The measurements of static contact angle were carried out using the Optical Contact Angle instrument (OCA 20 by Dataphysics, Germany) dispensing a 1 µL drop to assess the wettability of the surface.
Water (polar solvent) and diiodiomethane (apolar solvent) were dropped onto at least 10 different sites of the tested samples, and the static contact angle was reported as the average value of each measurement. A roll-coating assembly with a roll bar of 50 µm was used to obtain thin layer films for each composition.
2.3. Scanning Electron Microscopy Analysis (SEM)
The morphology was investigated using scanning electron microscopy (SEM) (Quanta 200 FEG, FEI, The Netherlands) on samples previously coated with ~10 nm layer of an Au-Pd alloy (Emitech K575, Quorum Technologies LTD, UK) and mounted on aluminium stubs using carbon adhesive discs.
2.4. Atomic Force Microscopy Analysis (AFM)
The surface morphology of the films was analysed using atomic force microscopy (AFM Nanosurf with C3000 Controller, LOT Quantum Design s.r.l., Italy). Soft tapping mode stabilised by amplitude-modulation feedback was used to acquire topographies. The obtained images were evaluated by Gwyddion software v2.66.
In the analysis of surface roughness, the parameters Ra (Average Roughness), Rz (Average maximum height of the profile), and Sm (Mean spacing of profile irregularities) were calculated for three samples using 10 topography images (20×20 μm²). Ra represents the absolute mean deviation of the surface from the mean profile but does not effectively differentiate surfaces with significant variations in peak and valley distribution or height. Therefore, Rz, which focuses on the height difference between peaks and valleys, is also considered, as it provides more information about large variations. Sm measures the average distance between peaks, helping to compare surfaces with frequent small peaks versus larger, more spaced ones. This allows for assessing not only peak and valley heights but also the frequency and distribution of surface roughness.
2.5. Tensile Tests
The mechanical properties of the graphene-coated fabrics with different coatings were evaluated using a dynamic mechanical analysis instrument (DMA Q800, TA Instruments, New Castle, DE, USA) in a uniaxial test set-up with a preload of 0.1 N at a fixed temperature of 25 C. The loading rate was set at 0.5 N/min and the specimen was strained to 18 N, and the values reported are the average of ten replicates [19]. Measurements were taken in the direction of the warp.
2.6. Electrical Resistance, Resistivity and Washability Tests
The resistivity of the printed ink was evaluated using a 2-probe tester (Multimeter 34401A 6½ by Agilent Technologies, USA) changing the deposition width of conductive pathways, and calculated using the second Ohm’s law:
were ρ is the resistivity (Ω*mm), R is the electrical resistance (Ω), S is the surface (mm2), l is the length (mm).
The electrical resistance tests were carried out at a distance of 10 mm, and the values reported were averaged over the three conductive pathways prepared. Resistivity and electrical resistance tests with the coating were carried out using a stainless-steel conductive ribbon (5 mm wide) fixed to the ink with a conductive paste. The conductive tape was attached to the end of the printed pathways so that the resistivity value could be read even after applying the insulating coating, as shown in Figure S1. To evaluate the washability of textile-based conductive pathways, a standard washing test has been established by ISO 6330 [27]. The conductive pathways were tested for 120 cycles of soap washing with 5 g/L soap stirred at 500 rpm for an hour at 30 C and dried at room temperature.
2.7. Piezoresistive Characterization
Piezoresistive behaviour consists in the variation of electrical resistance when a tensile or compressive force is varied. This allows electrical resistance values to be correlated with corresponding strain or load values [28,29]. The samples were tested under strain control using a universal testing machine (CMT 4304, Sans Materials Testing Co. Ltd., Shenzhen, China). Bending/unbending cycles were performed with a 15 mm deformation at 10 mm/min. The electrical signal was monitored and recorded with a multimeter (Keysight 34401A 6½ Digit Multimeter, Agilent Technologies, Santa Clara, CA, USA, 2006) controlled by a homemade LabVIEW program. The results were evaluate to calculate the Gauge Factor (GF), which is the transduction factor defined as the ratio of the fractional change in electrical resistance (ΔR = R-R0, where R is the electrical resistance value at maximum deformation and R0 is the electrical resistance without deformation) to the fractional change in length (strain, ε) expressed according to the formula [30,31]:
2.8. Measurement Chain for ECG Signal Acquisition
A MedSim 300B (Fluke Corporation, Everett, WA, USA) patient simulator was used to acquire the echocardiographic ECG signal. The ECG signal for the study was obtained using an Arduino Uno and the Gravity Heart Rate Monitor sensor. The ECG signal was obtained using BITalino (r)evolution (Plux wireless biosignals, Lisbon, LIS, Portugal) connected to the patient simulator [32]. The BITalino data were acquired using a PC running Open Signal software (Plux wireless biosignals, Lisbon, LIS, Portugal), and the signals from the Arduino UNO board were acquired using a PC running CoolTerm software.
3. Results and Discussion
3.1. FT-IR Analysis
Figure 1 shows the comparison between the spectra of TPU films with different crosslinker and thickener ratios. The N-H stretching mode is responsible for the absorption peak at 3320 cm-1. The peak at 2935 cm-1 is due to the stretching of asymmetric methylene (-CH2), while 2856 and 2798 cm-1 peaks is responsible to symmetric methylene. The shoulder at 2917 cm-1 adding the polyurethane thickener in systems T1, T2, and T3 leads to stretching of -CH2 and splitting of the symmetric and asymmetric stretches (Figure 1b) [33].
The peak at 1739 cm-1 is attributed to the carbonyl group (C=O) stretching mode in urethane. At 1530 and 1245 cm-1, amide II (st C-N+δ N-H) and amide III (st C-N+C=O) are reflected respectively. The band at 1691 cm-1, which appears starting from T1 and increase in T3 (Figure 1c), is attributed to the H-bonded C=O stretching modes in isocyanurate of the crosslinker [34,35]. The 1000-1200 cm-1 signals are due to polyoxyethylene (POE) units of the thickener with urethane groups and terminal hydrophobic groups contribute to a higher intensity of C-O-C stretching [36]. The absorption at 780 cm-1 is responsible of bending mode of the non-planar CO-O-C in the urethane structure [37,38].
3.2. Morphological and Topographical Analysis
The morphology of the surfaces without and with polyurethane coatings was observed using SEM analysis and comparing the uncoated and coated fabrics before and after washing and drying cycles.
In particular, Figure 2 shows that the uncoated samples have an irregular surface, exposing the ink with the graphene filler inside. Instead, Figure 3 shows the coated fabric surfaces. The amount of crosslinker and thickener affects the morphology of the surfaces; in particular, the surface roughness decreases as the percentage of crosslinker increases, as reported in Figure 3b,d,f. This observation is confirmed by topographical analysis, as shown in Figure 3g–i, and l [39]. Figure 3m,n and o shows the distributions of PU, T1, T2, and T3 film surface roughness parameters measured from each topography image; it can be observed that the lowest roughness values were obtained for the T3, indicating a smoother surface, as indicated by Ra, according with the contact angle observations and Wenzel model predictions. From Rz, the roughness is given by the presence of peaks on the surface and not by the valleys. Sm value shows that by increasing the crosslinker percentage, there is a decrease in the size of the peaks and their greater distribution on the surface.
Figure 4 and Figure 5 show respectively the uncoated and coated samples subjected to washing cycles. In particular, Figure 5 shows how the uncoated ink began to peel off after 3 hours of washing, leaving uncovered many parts of PE fabric.
Figure 5 shows SEM images of samples coated with T1, T2 and T3 coatings. By increasing the crosslinker and thickener amounts, a more continuous surface is gradually observed. In fact, after 120 washing cycles, T1 shows an evident degradation, which also shows the substrate fibres of the fabric. On the other hand, after the same number of washing cycles, the interface between the coating and the fibres for T3 is still free of defects and without discontinuities on the surface.
3.3. Wettability Properties
Figure 6 shows the wettability at two different solvents, water and diiodomethane, evaluated by measuring the contact angle. As the percentage of crosslinker and thickener is increased, the contact angle with aqueous solvent decreases and the contact angle with diiodiomethane increases. On the other hand, the sample without the coating showing a hydrophilic fabric surface, while the angle formed with diiodiomethane is zero.
The increased exposure of hydrophilic groups results in an overall wetter surface; in particular, more polyisocyanate crosslinker leads to the exposure of urethane or urea polar groups, as shown in the FT-IR in Figure 1, which interact with water to decrease the contact angle [40]. A smoothness surface with a higher density of exposed polar groups can interact more strongly with water, and provides a larger contact area between the water droplet and the material. This effect is described by the Wenzel model, which states that water tends to spread out on a smooth surface, reducing the contact angle. Therefore, when the surface is less rough, water will adhere better, increasing wettability [41].
3.4. Tensile Tests
To evaluate the coating effect on stretchability and flexibility of wearable smart electrical textiles, tensile experiments were conducted [42].
The initial part of the stress-strain curve, the red box in Figure 7, shows a complex variety of deformations such as elimination of yarn curl and straightening, followed by a rapid increase in fabric tension. A comparative analysis of the various samples was therefore carried out by calculating the tensile modulus between 6 and 8% of stress in order to eliminate the initial phenomena characteristic of the fabric [43,44].
Table 2 shows that the pristine PE fabric had the lowest tensile modulus and the highest elongation, which increased with the application of the conductive path. The development of three-dimensional networks connecting individual fibres within the fabric increased the creep resistance of adjacent fibres, affecting their mobility and increasing the stiffness of the coated samples. As can be seen from Figure 7 and the values in Table 2, the application of the coatings did not result in significant changes in modulus compared to PE/Ink [19].
3.5. Electrical Analysis
Figure 8a shows the electrical resistance values for the different widths of the conductive pathways. The electrical resistance of the sample with 1 mm paths differs from that of the 3 mm and 5 mm pathways by an order of magnitude and is not linear as would be expected from Ohm’s law. This shows that, in addition to the decrease in percolative paths due to the smaller conductive section for the 1 mm samples, there is also the edge effect due to the intrinsic nature of the coupling of the fabric with the ink, which results in irregular edges [45].
In order to assess the influence of the coating on the passage of electrical charges within the conductive pathways, resistivity tests were carried out on the fabric before and after coating. Figure 8b, shows the trend for the 1 mm conductive pathways. In all cases, it is possible to measure an increase in resistivity after coating deposition (by approximately 200 Ω/mm). This behaviour is due to the intercalation of the coating within the deposited ink, decreasing the connections between the FLGs.
Resistivity tests were also carried out on the samples subjected to the washing tests.
The results obtained are shown in Figure 8, Figure 9 and Figure 10 for tests on 5, 3, and 1 mm conductive pathways coated with T1, T2 and T3.
In Figure 9a, it is observed that after 3 hours of washing, the uncoated ink is no longer conductive, which is consistent with the degradation phenomena observed in the SEM analysis and therefore justifies the application of a protective coating. T1 gives the highest resistivity values after 120 hours. This is due to the lower crosslinker percentage, which allows the soapy water to penetrate the coating, causing its degradation observed in the SEM analysis also.
Furthermore, unlike T3, T1 and T2 show an increase in resistivity after 48 hours of washing, relating to the larger surface area to be coated, which increases the likelihood that the coating will deteriorate during washing and that water will be exposed to the ink and fabric.
Figure 10b shows that, after 120 hours of washing, the LED lights up by applying a potential difference of 3.7 V. In addition, the LED light becomes progressively more intense from T1 to T3, correlating with the electrical resistivity.
3.6. Piezoresistive and ECG Signal Acquisition Performance
Based on the results of the mechanical and washing resistance tests, performance tests were carried out in this section to assess the piezoresistive properties and the possibility of using the conductive ink coated within a measurement chain for the acquisition of an ECG signal.
Piezoresistive tests showed the sensitivity of the conductive inks to bending and unbending deformation. In Figure 11, the uncoated sample, PE/Ink/3, is overloaded after 4 cycles. The inset in Figure 11I shows a crack in the deposited ink, and subsequent interruption of the conductive pathways.
On the other hand, the samples with the coating (i.e. system with the T3 coating shown in Figure 11) preserves the condition of the conductive ink and increases its durability. In Figure 11III the conductive line is free of defects after more than 10 cycles.
In addition, when the sample is completely unbended (Figure 11II), the coating reduces the sensitivity and stability of the signal, especially. The decrease in sensitivity caused by the application of the coating is quantified by the GF, using formula (2), which is 4.94±0.029 for the PE/Ink/3 system and 4.28±0.054 for the PE/Ink/T3/3, with a percentage loss of 13%.
Therefore, the coating can be used to increase the long-term usability, taking into account the high error at low strains.
The study found that the resistivity of the conductive pathways had a direct impact on ECG signal quality. The acceptable threshold for effective ECG signal transmission was determined to be a resistivity below 104 Ω∙mm [46]. Fabrics with resistivity lower than this threshold provided clear ECG signals, indicating proper electrical conduction. However, when resistivity values exceeded 104 Ω∙mm, the signal quality diminished significantly, becoming either excessively noisy or failing to pass through the system. Figure 12 shows the 1 mm wide conductive pathways struggling to transmit the ECG signal effectively even without a coating, indicating that narrower lines face greater challenges in maintaining conductivity for physiological monitoring applications. These findings underscore the importance of optimizing both the conductive ink formulation and the coating to ensure reliable performance in healthcare-related wearable devices.
5. Conclusions
This study shows how waterborne graphene-based conductive ink, appropriately coated, may be successfully used to create long-lasting, flexible, and washable e-textiles. A water-based polyurethane (PU) coating is used to overcome significant problems with the washability and long-term performance of wearable e-textiles. The role of CROSSTECH 655 aliphatic polyisocyanate crosslinker and VIXTECH 872 water-based urethane thickener was evaluated at different ratios. The results suggest that the washing resistance of the coating was greatly improved by raising the concentration of thickener and crosslinker, which prevented the conductive pathways from degrading even after 120 washing cycles.
The coated textiles demonstrated their suitability for continuous use in wearable applications by retaining their mechanical flexibility and electrical conductivity. In particular, the system namely T3 (which formulation contains 6 wt% of thickener and 3 wt% of crosslinker) shows the best results in terms of electrical resistivity value after 120 h of washing cycle. Elastic modulus increases approximately 4 times when ink and coatings are applied to the textile, going from ~20 MPa to ~80-85 MPa in each case.
In order to evaluate applicative potentiality, the conductive pathways with a length of 180 mm and a variable width of 5, 3 and 1 mm are tested. The decrease of conductive section and the subsequent border effects, increase the electrical resistivity values.
Piezoresistive behaviour demonstrates that the coating decreases the sensitivity of 13% but permits to preserve the long-term usability of the conductive pathways regarding mechanical stress also. The ECG tests show that the system at 1 mm of width produces unevaluable noisy signals. In terms of electrical resistivity, it demonstrates that the coatings increase by one order unit of the values, without any preference between the three compositions.
Finally, PU-coated e-textiles showed promising results for a range of applications, especially in healthcare and occupational settings, where dependable, durable, and machine-washable smart textiles are crucial.
Supplementary Materials
The following supporting information can be downloaded at the website of this paper posted on Preprints.org, Figure S1: Conductive pathways detail of connection between ink conductive pathways and stainless-steel conductive ribbon., Figure S2: TGA with DTGA insert zooming between 200-500 C a) and DSC data heating cycle b) of pristine TPU (black), T1 (green), T2 (light blue) and T3 (navy blue) films.
Author Contributions
Writing, original draft, formal analysis, methodology, data curation, I.I. and G.R.; supervision and investigation, project administration, validation, review and editing, funding acquisition, M.L; supervision, project administration, review and editing, G.G.B.; validation of experimental data, S.D.F. and V.M.; formal analysis and participation in the validation of experimental data, G.D.A. and A.D.R. All authors have read and agreed to the published version of the manuscript.
Funding
This research was funded by SMART materials and technologies for thermal-stress & physio-monitoring SHIRT project by INAIL with grant INAIL BRIC 2022-ID 39.
Institutional Review Board Statement
Not applicable.
Data Availability Statement
The data presented in this study are available on request from the corresponding author.
Acknowledgments
The authors acknwoledge iENTRANCE@ENL - Infrastructure for ENergy TRAnsition aNd Circular Economy @ Eu-roNanoLab with grant IR PNRR IR0000027, and ISIS@MACH ITALIA Research Infrastructure, the hub of ISIS Neutron and Muon Source (UK), (MUR official registry No. U. 0008642.28-05-2020—April 16, 2020). Kind regards to ICAP for materials and each technical datasheet. Kind thanks to Dr. Alessia Cabrini (CNR-IPCB in Lecco) for the topography images in Figure 3.
Conflicts of Interest
The authors declare no conflicts of interest.
References
- Wei, B.; Yang, N.; Tian, M.; Qu, L.; Zhu, S. Effect of Coating Methods on Thermal Conductivity of Graphene-Coated Fabrics for Welding Protective Clothing. Mater. Lett. 2022, 314, 131787. [CrossRef]
- Sajovic, I.; Kert, M.; Boh Podgornik, B. Smart Textiles: A Review and Bibliometric Mapping; 2023; Vol. 13; ISBN 3861200325.
- Islam, M.R.; Afroj, S.; Beach, C.; Islam, M.H.; Parraman, C.; Abdelkader, A.; Casson, A.J.; Novoselov, K.S.; Karim, N. Fully Printed and Multifunctional Graphene-Based Wearable e-Textiles for Personalized Healthcare Applications. iScience 2022, 25, 103945. [CrossRef]
- Hong, H.; Jiyong, H.; Moon, K.S.; Yan, X.; Wong, C. ping Rheological Properties and Screen Printability of UV Curable Conductive Ink for Flexible and Washable E-Textiles. J. Mater. Sci. Technol. 2021, 67, 145–155. [CrossRef]
- Xu, X.; Luo, M.; He, P.; Guo, X.; Yang, J. Screen Printed Graphene Electrodes on Textile for Wearable Electrocardiogram Monitoring. Appl. Phys. A 2019, 125, 714. [CrossRef]
- Lee, C.; Wei, X.; Kysar, J.W.; Hone, J. Measurement of the Elastic Properties and Intrinsic Strength of Monolayer Graphene. Science (80-. ). 2008, 321, 385–388. [CrossRef]
- Tadakaluru, S.; Thongsuwan, W.; Singjai, P. Stretchable and Flexible High-Strain Sensors Made Using Carbon Nanotubes and Graphite Films on Natural Rubber. Sensors (Switzerland) 2014, 14, 868–876. [CrossRef]
- Jiang, L.; Hong, H.; Hu, J. Facile Thermoplastic Polyurethane-Based Multi-Walled Carbon Nanotube Ink for Fabrication of Screen-Printed Fabric Electrodes of Wearable e-Textiles with High Adhesion and Resistance Stability under Large Deformation. Text. Res. J. 2021, 91, 2487–2499. [CrossRef]
- Cui, T.R.; Li, D.; Huang, X.R.; Yan, A.Z.; Dong, Y.; Xu, J.D.; Guo, Y.Z.; Wang, Y.; Chen, Z.K.; Shao, W.C.; et al. Graphene-Based Flexible Electrode for Electrocardiogram Signal Monitoring. Appl. Sci. 2022, 12. [CrossRef]
- Libanori, A.; Chen, G.; Zhao, X.; Zhou, Y.; Chen, J. Smart Textiles for Personalized Healthcare. Nat. Electron. 2022, 5, 142–156. [CrossRef]
- Amitrano, F.; Coccia, A.; Ricciardi, C.; Donisi, L.; Cesarelli, G.; Capodaglio, E.M.; D’addio, G. Design and Validation of an E-Textile-Based Wearable Sock for Remote Gait and Postural Assessment. Sensors (Switzerland) 2020, 20, 1–20. [CrossRef]
- Cesarelli, G.; Donisi, L.; Coccia, A.; Amitrano, F.; D’Addio, G.; Ricciardi, C. The E-Textile for Biomedical Applications: A Systematic Review of Literature. Diagnostics (Basel, Switzerland) 2021, 11. [CrossRef]
- Islam, M.R.; Afroj, S.; Yin, J.; Novoselov, K.S.; Chen, J.; Karim, N. Advances in Printed Electronic Textiles. Adv. Sci. 2024, 11. [CrossRef]
- Cataldi, P.; Steiner, P.; Liu, M.; Pinter, G.; Athanassiou, A.; Kocabas, C.; Kinloch, I.A.; Bissett, M.A. A Green Electrically Conductive Textile with Tunable Piezoresistivity and Transiency. Adv. Funct. Mater. 2023. [CrossRef]
- Cao, R.; Pu, X.; Du, X.; Yang, W.; Wang, J.; Guo, H.; Zhao, S.; Yuan, Z.; Zhang, C.; Li, C.; et al. Screen-Printed Washable Electronic Textiles as Self-Powered Touch/Gesture Tribo-Sensors for Intelligent Human–Machine Interaction. ACS Nano 2018, 12, 5190–5196. [CrossRef]
- Saidina, D.S.; Eawwiboonthanakit, N.; Mariatti, M.; Fontana, S.; Hérold, C. Recent Development of Graphene-Based Ink and Other Conductive Material-Based Inks for Flexible Electronics. J. Electron. Mater. 2019, 48, 3428–3450. [CrossRef]
- Htwe, Y.Z.N.; Mariatti, M. Printed Graphene and Hybrid Conductive Inks for Flexible, Stretchable, and Wearable Electronics: Progress, Opportunities, and Challenges. J. Sci. Adv. Mater. Devices 2022, 7, 100435. [CrossRef]
- Huang, Q.; Zhu, Y. Printing Conductive Nanomaterials for Flexible and Stretchable Electronics: A Review of Materials, Processes, and Applications. Adv. Mater. Technol. 2019, 4, 1800546. [CrossRef]
- Abdi, B.; Tarhini, A.; Baniasadi, H.; Tehrani-Bagha, A.R. Developing Graphene-Based Conductive Textiles Using Different Coating Methods. Adv. Mater. Technol. 2024, 9, 2301492. [CrossRef]
- Rotzler, S.; Schneider-Ramelow, M. Washability of E-Textiles: Failure Modes and Influences on Washing Reliability. Textiles 2021, 1, 37–54. [CrossRef]
- Maizal Hairi, N.I.I.; Md Ralib, A.A.; Nordin, A.N.; Mohamad Yunos, M.F.A.; Ming, L.L.; Tung, L.H.; Samsudin, Z. Recent Advance in Using Eco-Friendly Carbon-Based Conductive Ink for Printed Strain Sensor: A Review. Clean. Mater. 2024, 12, 100248. [CrossRef]
- Zhang, Y.; Zhu, Y.; Zheng, S.; Zhang, L.; Shi, X.; He, J.; Chou, X.; Wu, Z.S. Ink Formulation, Scalable Applications and Challenging Perspectives of Screen Printing for Emerging Printed Microelectronics. J. Energy Chem. 2021, 63, 498–513. [CrossRef]
- Abdelkrim Boumegnane Ayoub Nadi, C.C.F.B.O.C.; Tahiri, M. Formulation of Conductive Inks Printable on Textiles for Electronic Applications: A Review. Text. Prog. 2022, 54, 103–200. [CrossRef]
- Kazani, I.; Declercq, F.; Scarpello, M.L.; Hertleer, C.; Rogier, H.; Vande Ginste, D.; De Mey, G.; Guxho, G.; Van Langenhove, L. Performance Study of Screen-Printed Textile Antennas after Repeated Washing. 2014, 14, 47–54. [CrossRef]
- Tian, S. Recent Advances in Functional Polyurethane and Its Application in Leather Manufacture: A Review. Polymers (Basel). 2020, 12, 1–16. [CrossRef]
- Elmogahzy, Y.; Farag, R. 7 - Tensile Properties of Cotton Fibers: Importance, Research, and Limitations. In Handbook of Properties of Textile and Technical Fibres (Second Edition); Bunsell, A.R., Ed.; The Textile Institute Book Series; Woodhead Publishing, 2018; pp. 223–273 ISBN 978-0-08-101272-7.
- Rotzler, S.; Schneider-Ramelow, M. Development of a Testing Protocol to Assess the Washability of E-Textiles. Solid State Phenom. 2022, 333, 3–10. [CrossRef]
- Rollo, G.; Ronca, A.; Cerruti, P.; Xia, H.; Gruppioni, E.; Lavorgna, M. Optimization of Piezoresistive Response of Elastomeric Porous Structures Based on Carbon-Based Hybrid Fillers Created by Selective Laser Sintering. Polymers (Basel). 2023, 15. [CrossRef]
- Liu, J.; Lama, G.C.; Recupido, F.; Santillo, C.; Gentile, G.; Buonocore, G.G.; Verdolotti, L.; Zhang, X.; Lavorgna, M. A Multifunctional Composite Material with Piezoresistivity and Mechanoluminescence Properties for a Wearable Sensor. Compos. Sci. Technol. 2023, 236, 109993. [CrossRef]
- Alblalaihid, K.S.; Aldoihi, S.A.; Alharbi, A.A. Structural Health Monitoring of Fiber Reinforced Composites Using Integrated a Linear Capacitance Based Sensor. Polymers (Basel). 2024, 16. [CrossRef]
- Rollo, G.; Ronca, A.; Cerruti, P.; Gan, X.P.; Fei, G.; Xia, H.; Gorokhov, G.; Bychanok, D.; Kuzhir, P.; Lavorgna, M. On the Synergistic Effect of Multi-Walled Carbon Nanotubes and Graphene Nanoplatelets to Enhance the Functional Properties of SLS 3D-Printed Elastomeric Structures. Polymers 2020, 12, 1841. [CrossRef]
- Silva, H.; Guerreiro, J.; Lourenço, A.; Fred, A.L.N.; Martins, R. BITalino: A Novel Hardware Framework for Physiological Computing. In Proceedings of the International Conference on Physiological Computing Systems; 2014.
- Snyder, R.G.; Hsu, S.L.; Krimm, S. Vibrational Spectra in the CH Stretching Region and the Structure of the Polymethylene Chain. Spectrochim. Acta Part A Mol. Spectrosc. 1978, 34, 395–406. [CrossRef]
- Kaminski, A.M.; Urban, M.W. Interfacial Studies of Crosslinked Polyurethanes; Part I. Quantitative and Structural Aspects of Crosslinking near Film-Air and Film-Substrate Interfaces in Solvent-Borne Polyurethanes. J. Coatings Technol. 1997, 69, 55–66. [CrossRef]
- Choong, P. Sen; Rusli, W.; Seayad, A.M.; Seayad, J.; Jana, S. Crosslinked Succinic Acid Based Non-Isocyanate Polyurethanes for Corrosion Resistant Protective Coatings. Prog. Org. Coatings 2024, 186, 107961. [CrossRef]
- Orgilés-Calpena, E.; Arán-Aís, F.; Torró-Palau, A.M.; Orgilés-Barceló, C.; Martín-Martínez, J.M. Addition of Different Amounts of a Urethane-Based Thickener to Waterborne Polyurethane Adhesive. Int. J. Adhes. Adhes. 2009, 29, 309–318. [CrossRef]
- Wilhelm, C.; Gardette, J.-L. Infrared Analysis of the Photochemical Behaviour of Segmented Polyurethanes: 1. Aliphatic Poly(Ester-Urethane). Polymer (Guildf). 1997, 38, 4019–4031. [CrossRef]
- Lee, W.-J.; Chao, C.-Y. Effect of Containing Polyhydric Alcohol Liquefied Wood on the Properties of Thermoplastic Polyurethane Resins. Eur. J. Wood Wood Prod. 2018, 76, 1745–1752. [CrossRef]
- Bueno-Ferrer, C.; Hablot, E.; del Carmen Garrigós, M.; Bocchini, S.; Averous, L.; Jiménez, A. Relationship between Morphology, Properties and Degradation Parameters of Novative Biobased Thermoplastic Polyurethanes Obtained from Dimer Fatty Acids. Polym. Degrad. Stab. 2012, 97, 1964–1969. [CrossRef]
- Nielsen, L.E. Cross-Linking–Effect on Physical Properties of Polymers. J. Macromol. Sci. Part C 1969, 3, 69–103. [CrossRef]
- Yoshimitsu, Z.; Nakajima, A.; Watanabe, T.; Hashimoto, K. Effects of Surface Structure on the Hydrophobicity and Sliding Behavior of Water Droplets. Langmuir 2002, 18, 5818–5822. [CrossRef]
- Herrera, M.; Matuschek, G.; Kettrup, A. Thermal Degradation of Thermoplastic Polyurethane Elastomers (TPU) Based on MDI. Polym. Degrad. Stab. 2002, 78, 323–331. [CrossRef]
- Barros Junior, L.P.; de Souza, L.R.; Rahimzadeh, R.; Manas-Zloczower, I. Improving Performance of TPU by Controlled Crosslinking of Soft Segments. Polym. Eng. Sci. 2024, 64, 3982–3992. [CrossRef]
- Karbach, A.; Drechsler, D. Atomic Force Microscopy—a Powerful Tool for Industrial Applications. Surf. Interface Anal. 1999, 27, 401–409. [CrossRef]
- Song, X.; Ji, J.; Zhou, N.; Chen, M.; Qu, R.; Li, H.; Zhang, L.; Ma, S.; Ma, Z.; Wei, Y. Stretchable Conductive Fibers: Design, Properties and Applications. Prog. Mater. Sci. 2024, 144, 101288. [CrossRef]
- Krifa, M. Electrically Conductive Textile Materials—Application in Flexible Sensors and Antennas. Textiles 2021, 1, 239–257. [CrossRef]
Figure 1.
FT-IR spectra of a) TPU (black) and coatings T1 (green), T2 (light blue), T3 (navy blue) and zoom between b) 3600-2600 cm-1 and c) 1900-600 cm-1.
Figure 1.
FT-IR spectra of a) TPU (black) and coatings T1 (green), T2 (light blue), T3 (navy blue) and zoom between b) 3600-2600 cm-1 and c) 1900-600 cm-1.
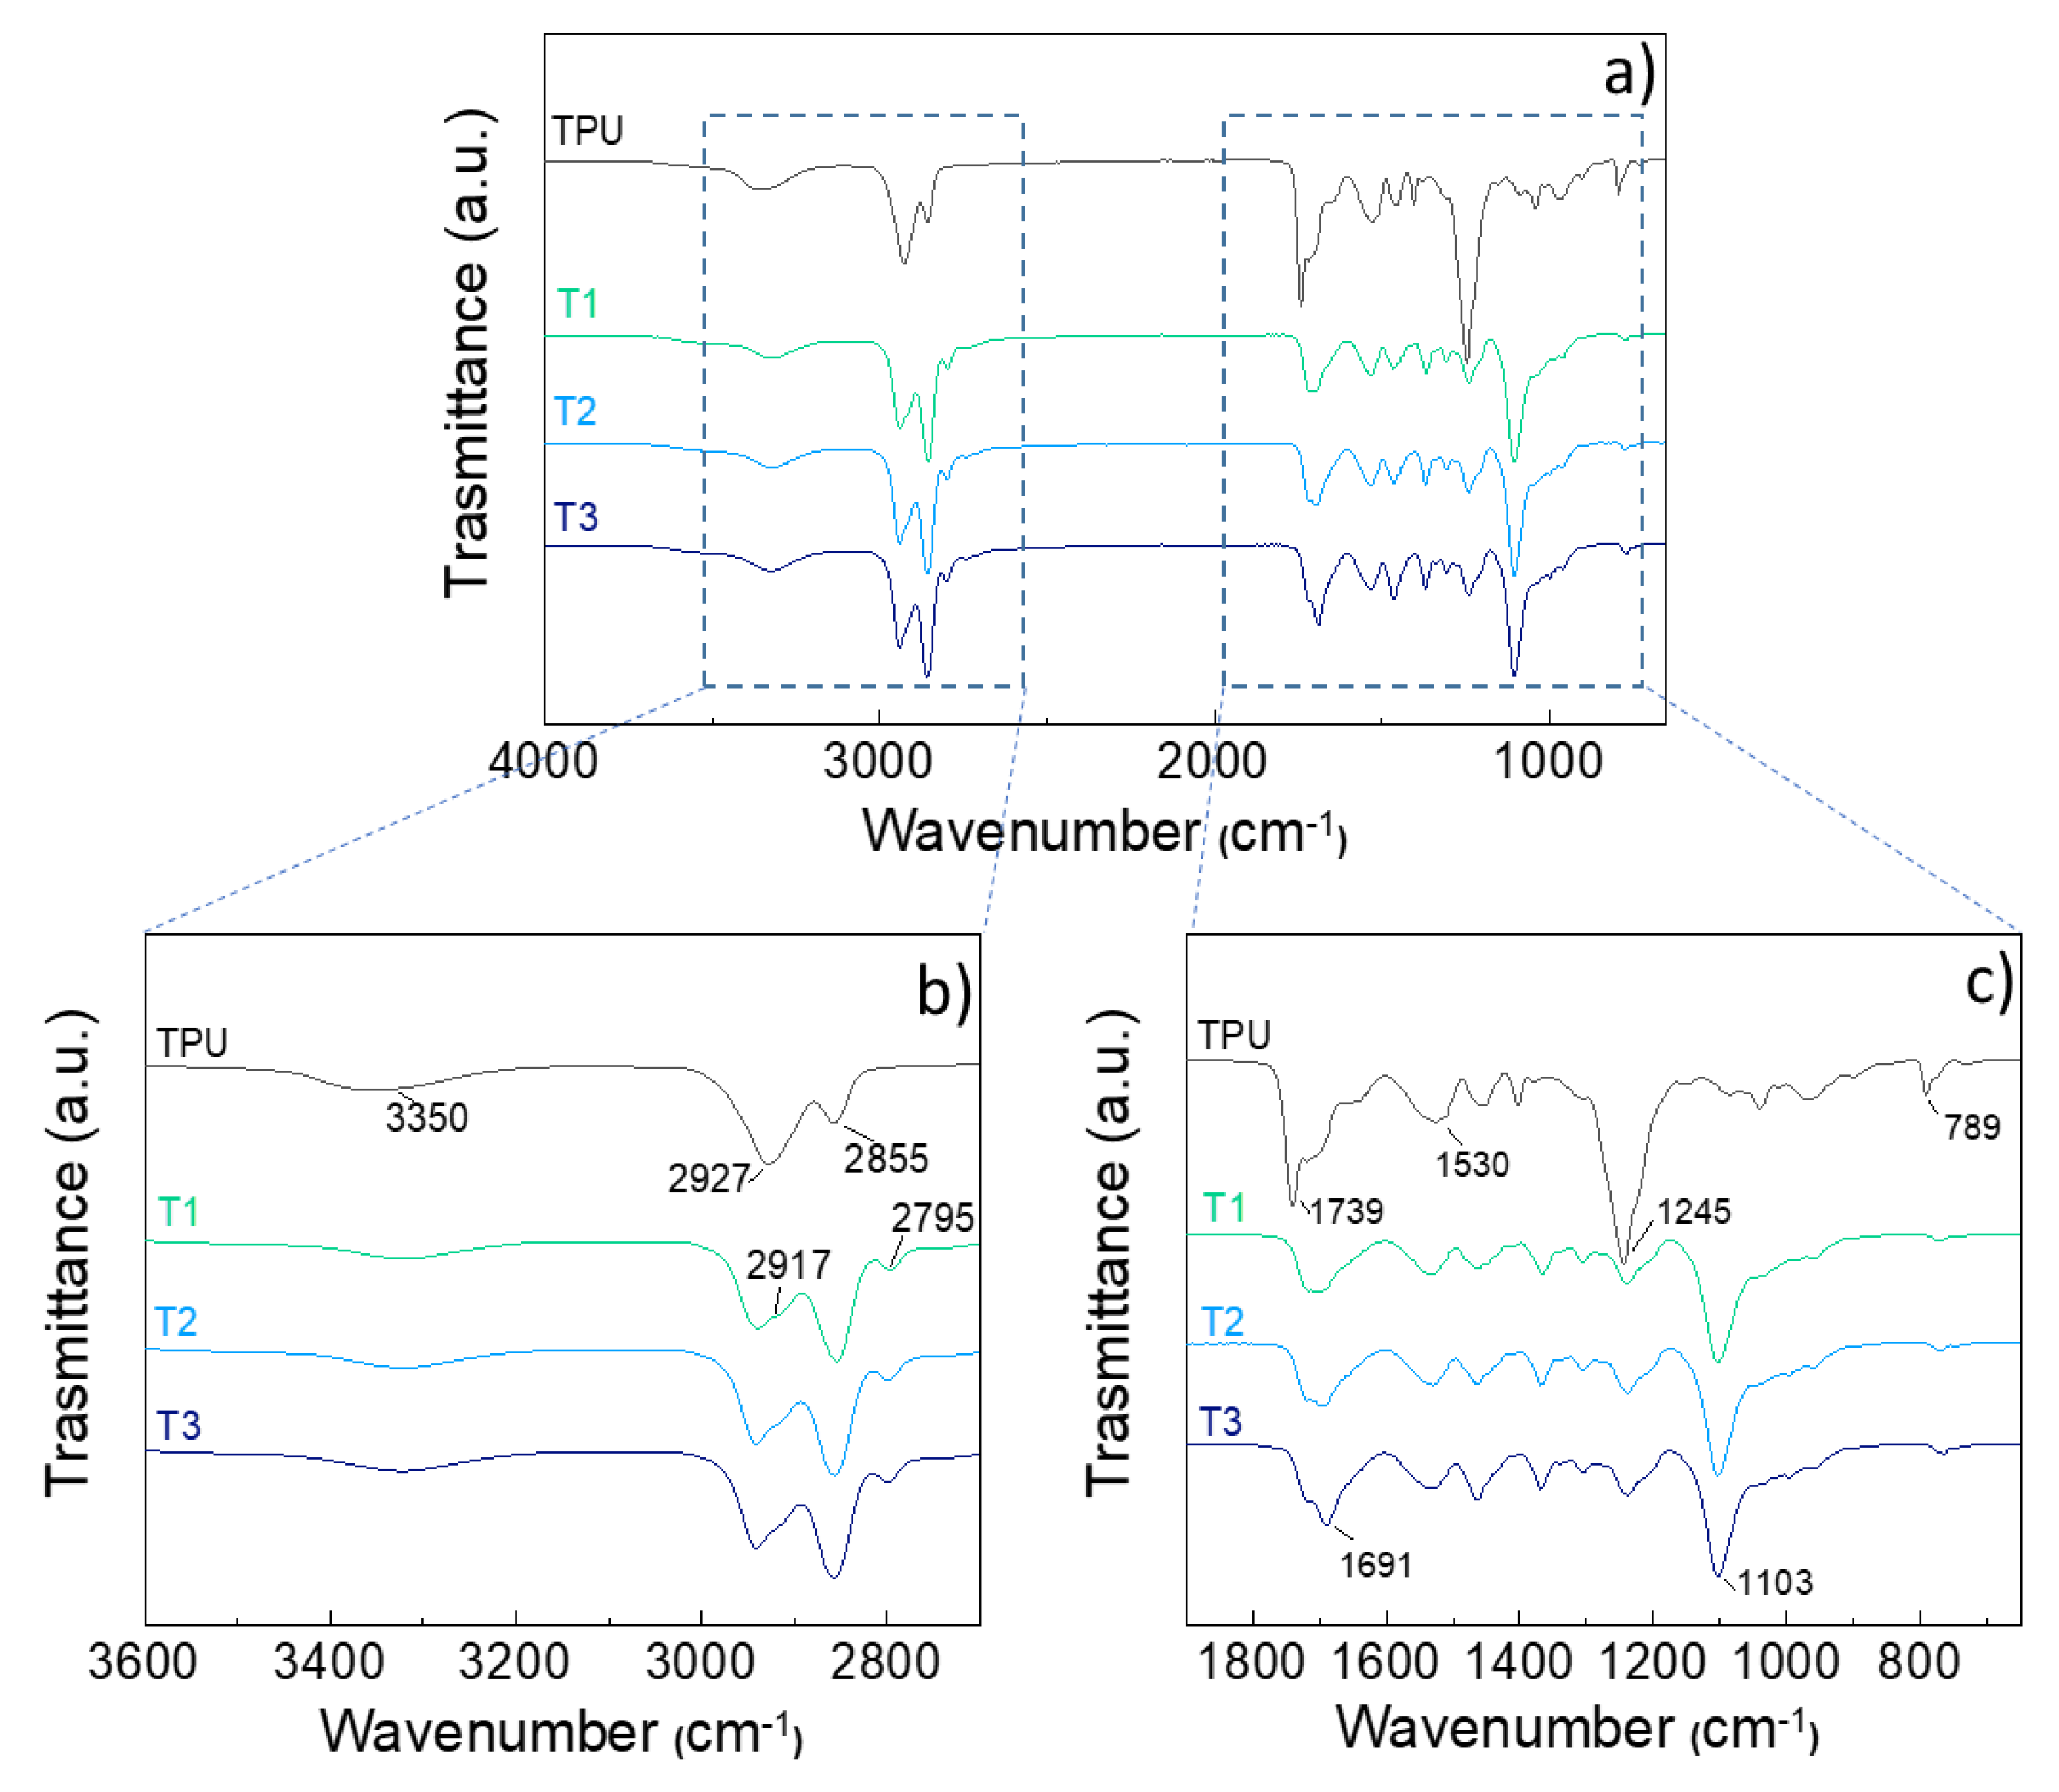
Figure 2.
SEM images of PE/Ink of ink at magnifications of a) 100x, b) 800x, and c) 1600x.
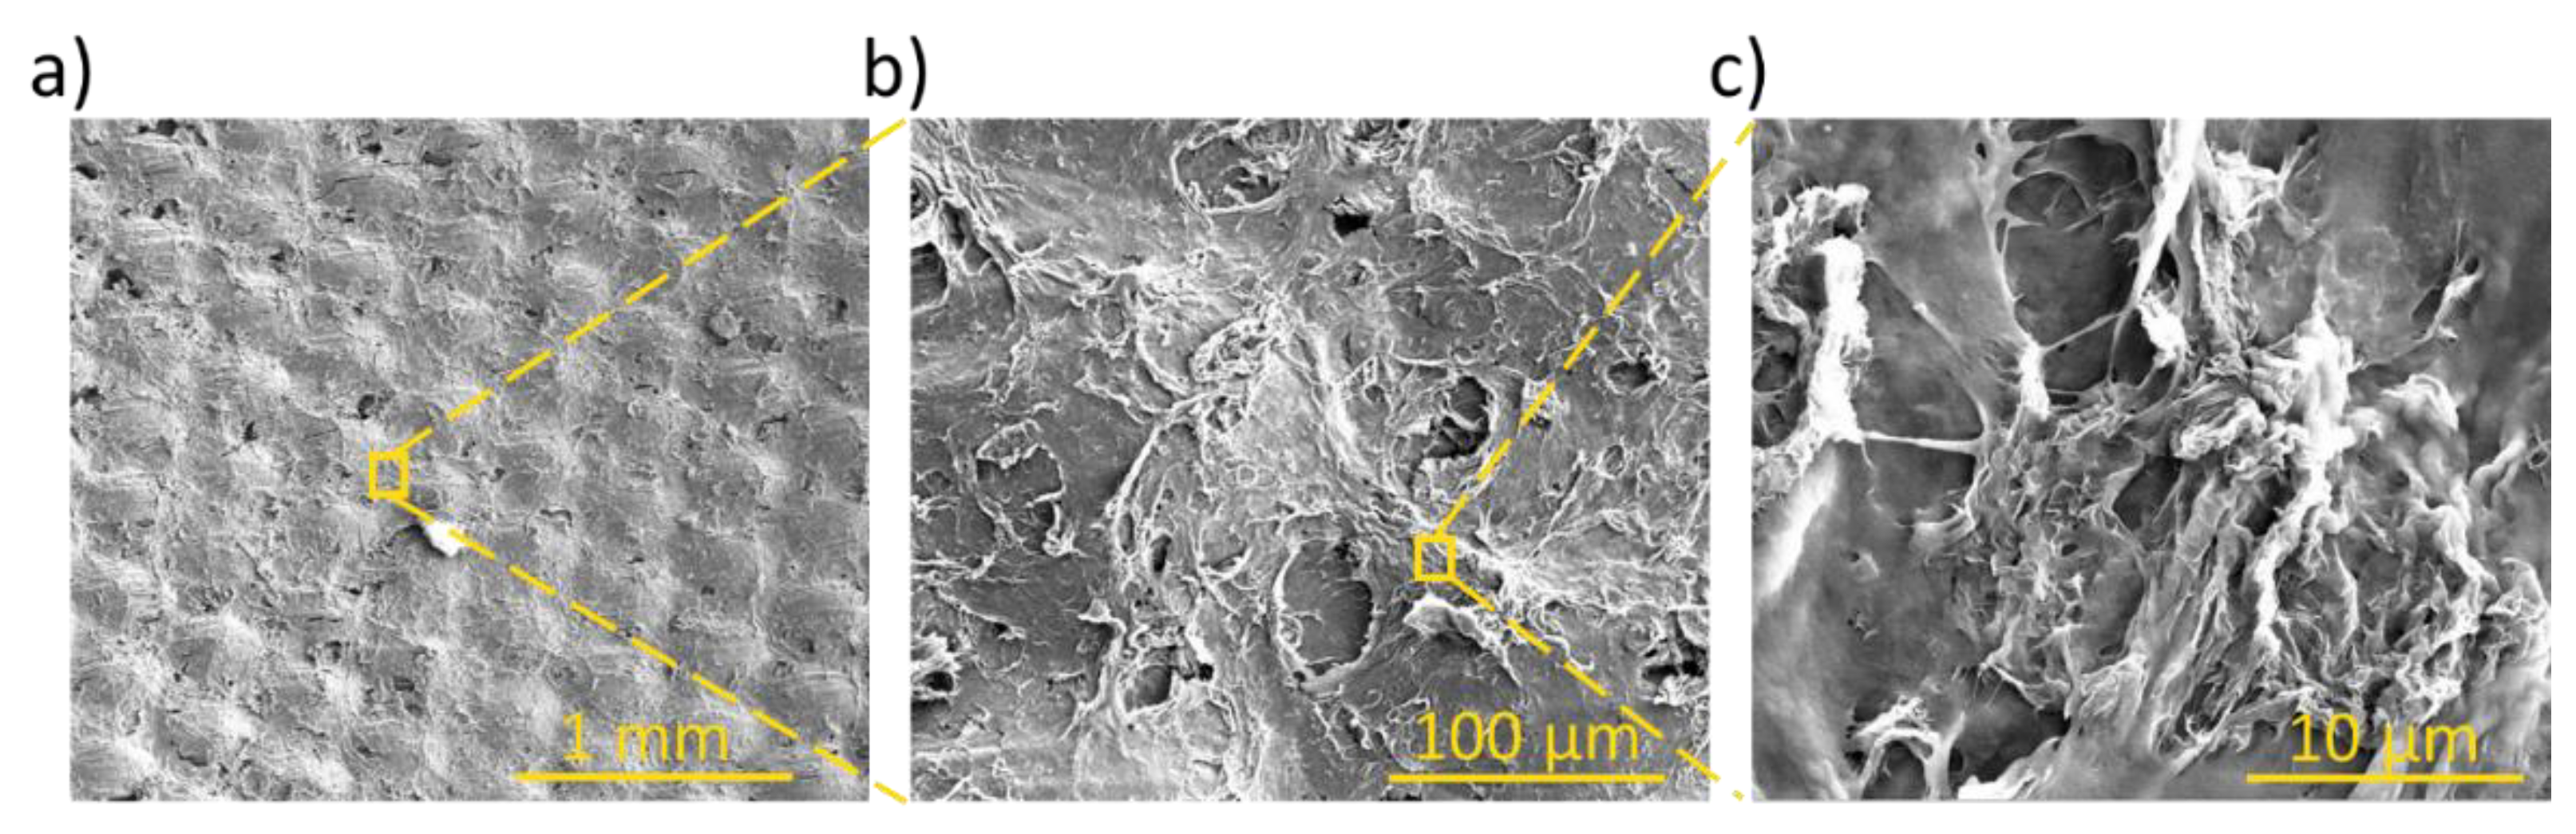
Figure 3.
SEM images of PE fabrics a-b) PE/Ink/T1/5, c-d) PE/Ink/T2/5 and e-f) PE/Ink/T3/5 at magnifications of 100x and 800x. AFM images of pristine g) PU, h) T1, i) T2, and l) T3. m) Average Roughness (Ra), n) average maximum height of the profile (Rz), o) mean spacing of profile irregularities (Sm) for pristine PU (black), T1 (green), T2 (light blue) and T3 (navy blue) films.
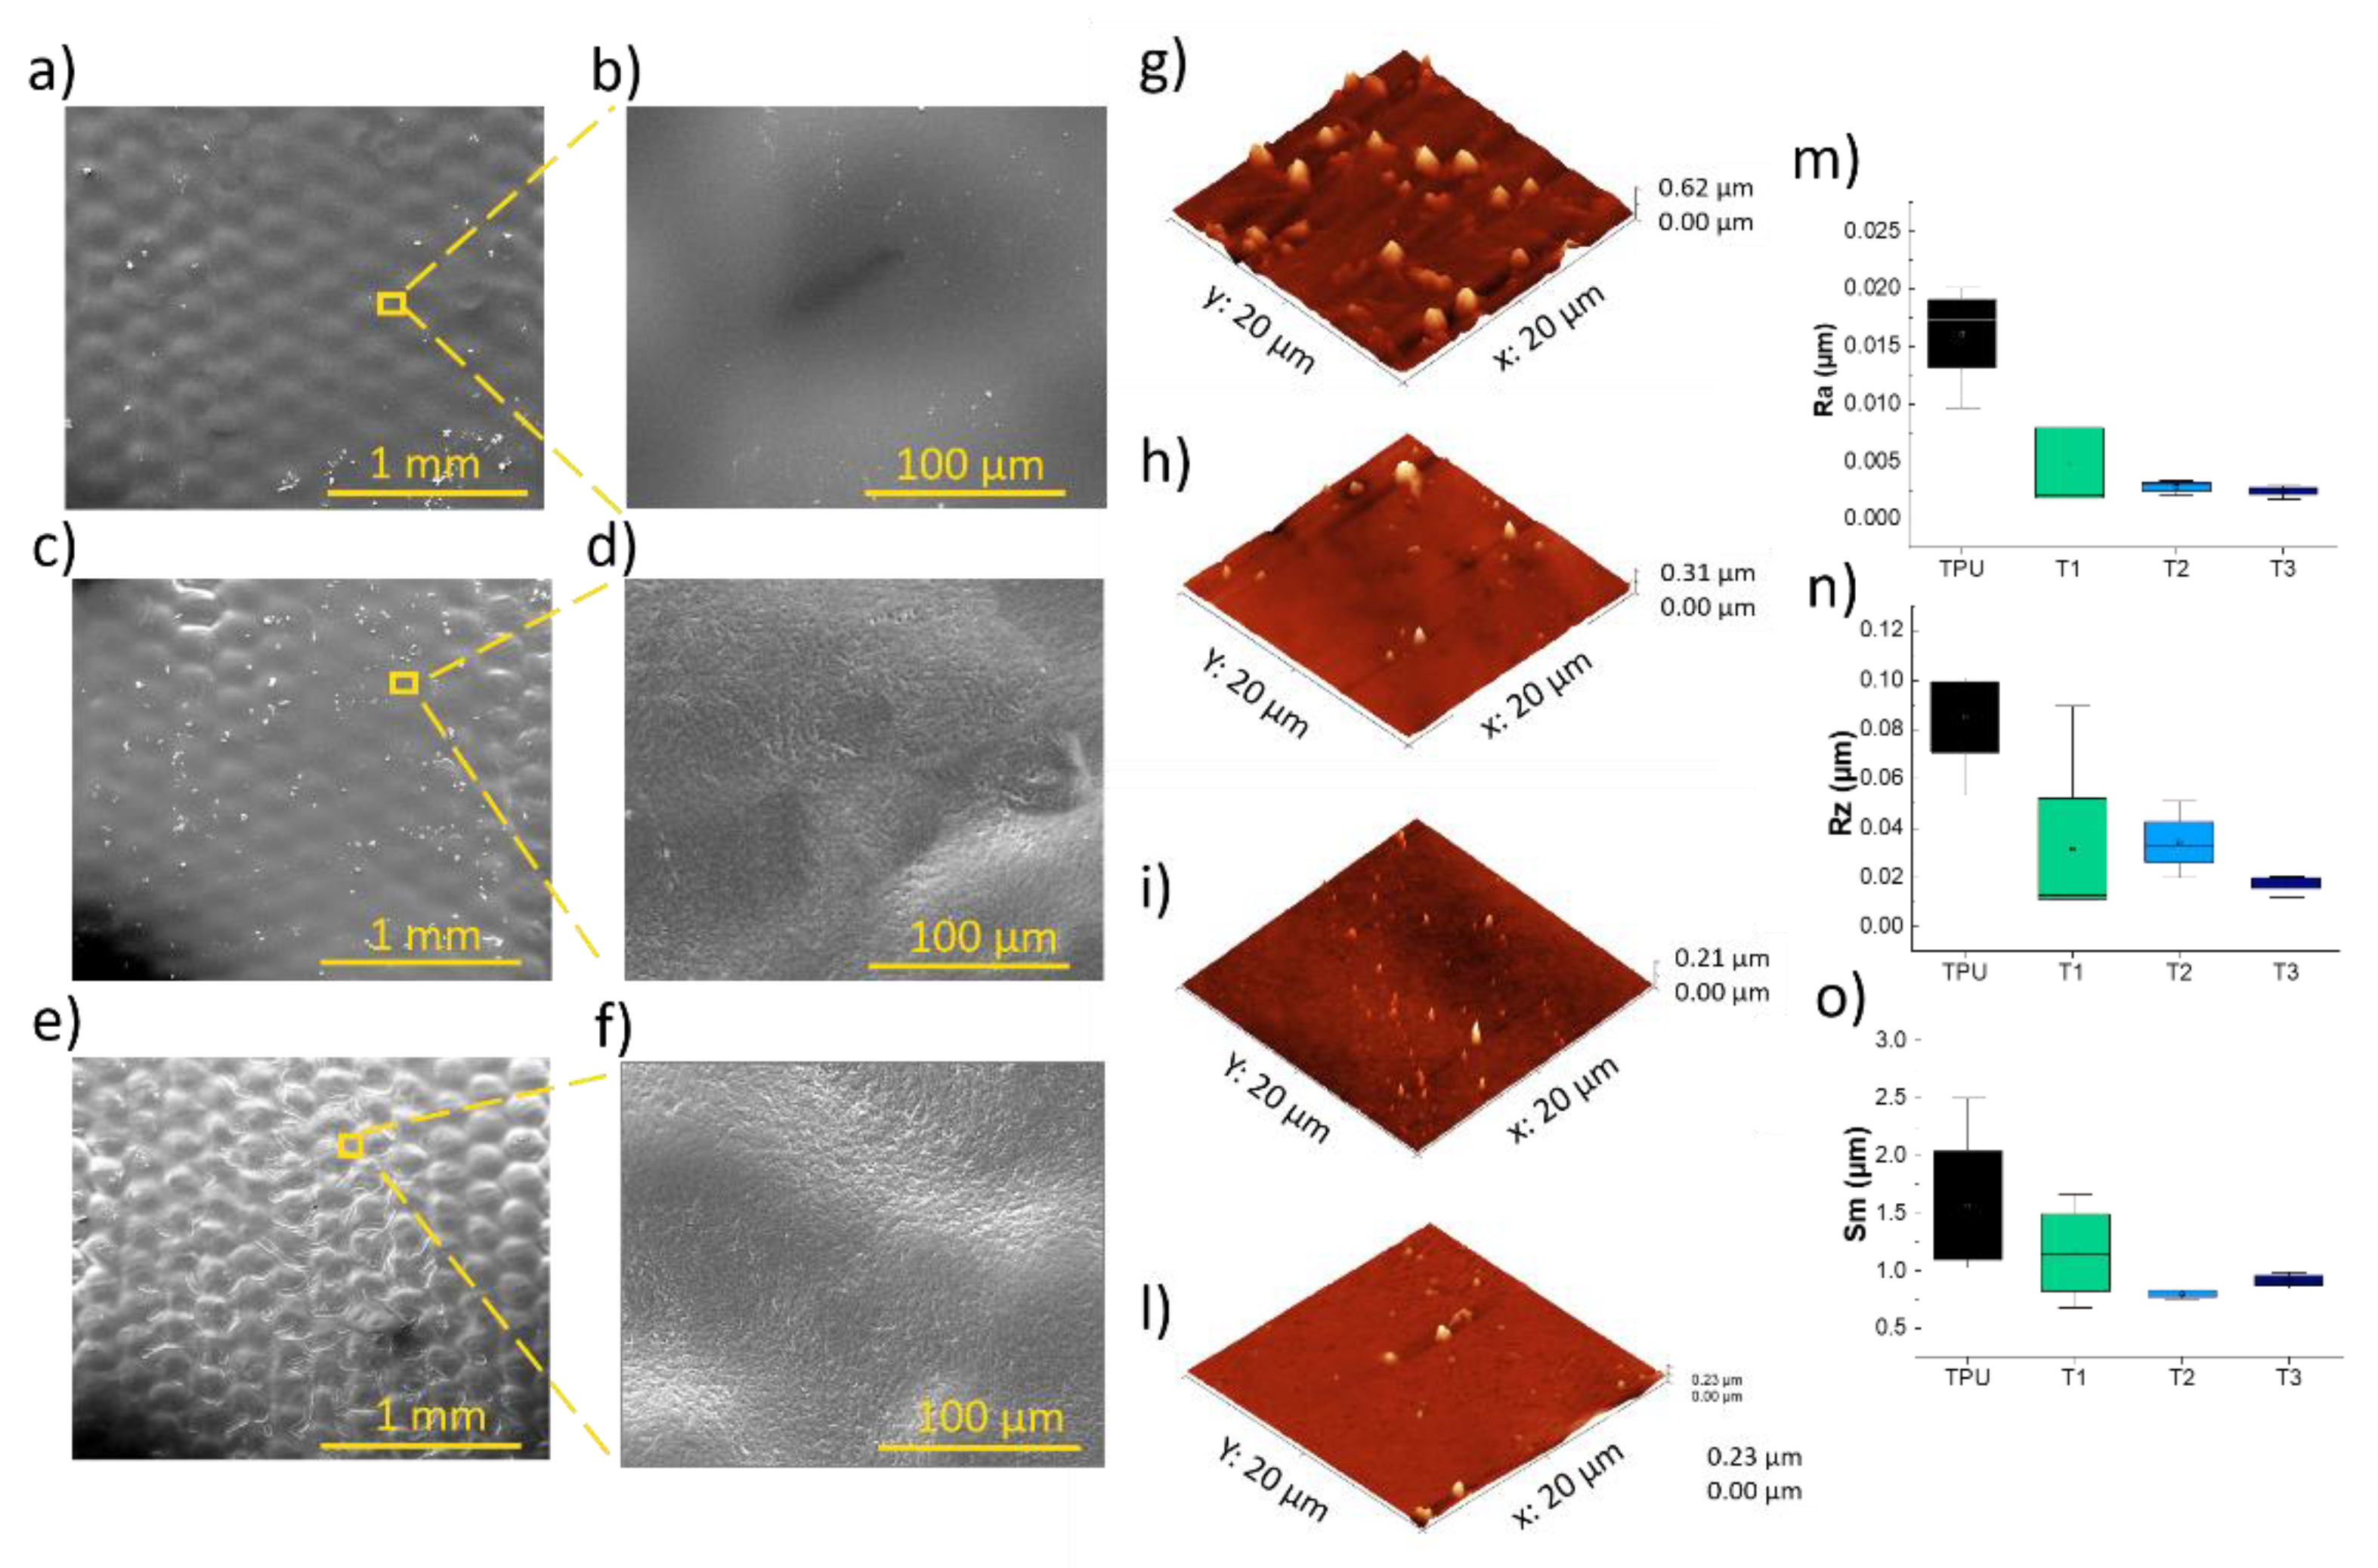
Figure 4.
SEM images of PE/Ink after 3hr of washing at a) 100x, b) 800x, and c) 1600x magnifications.
Figure 4.
SEM images of PE/Ink after 3hr of washing at a) 100x, b) 800x, and c) 1600x magnifications.
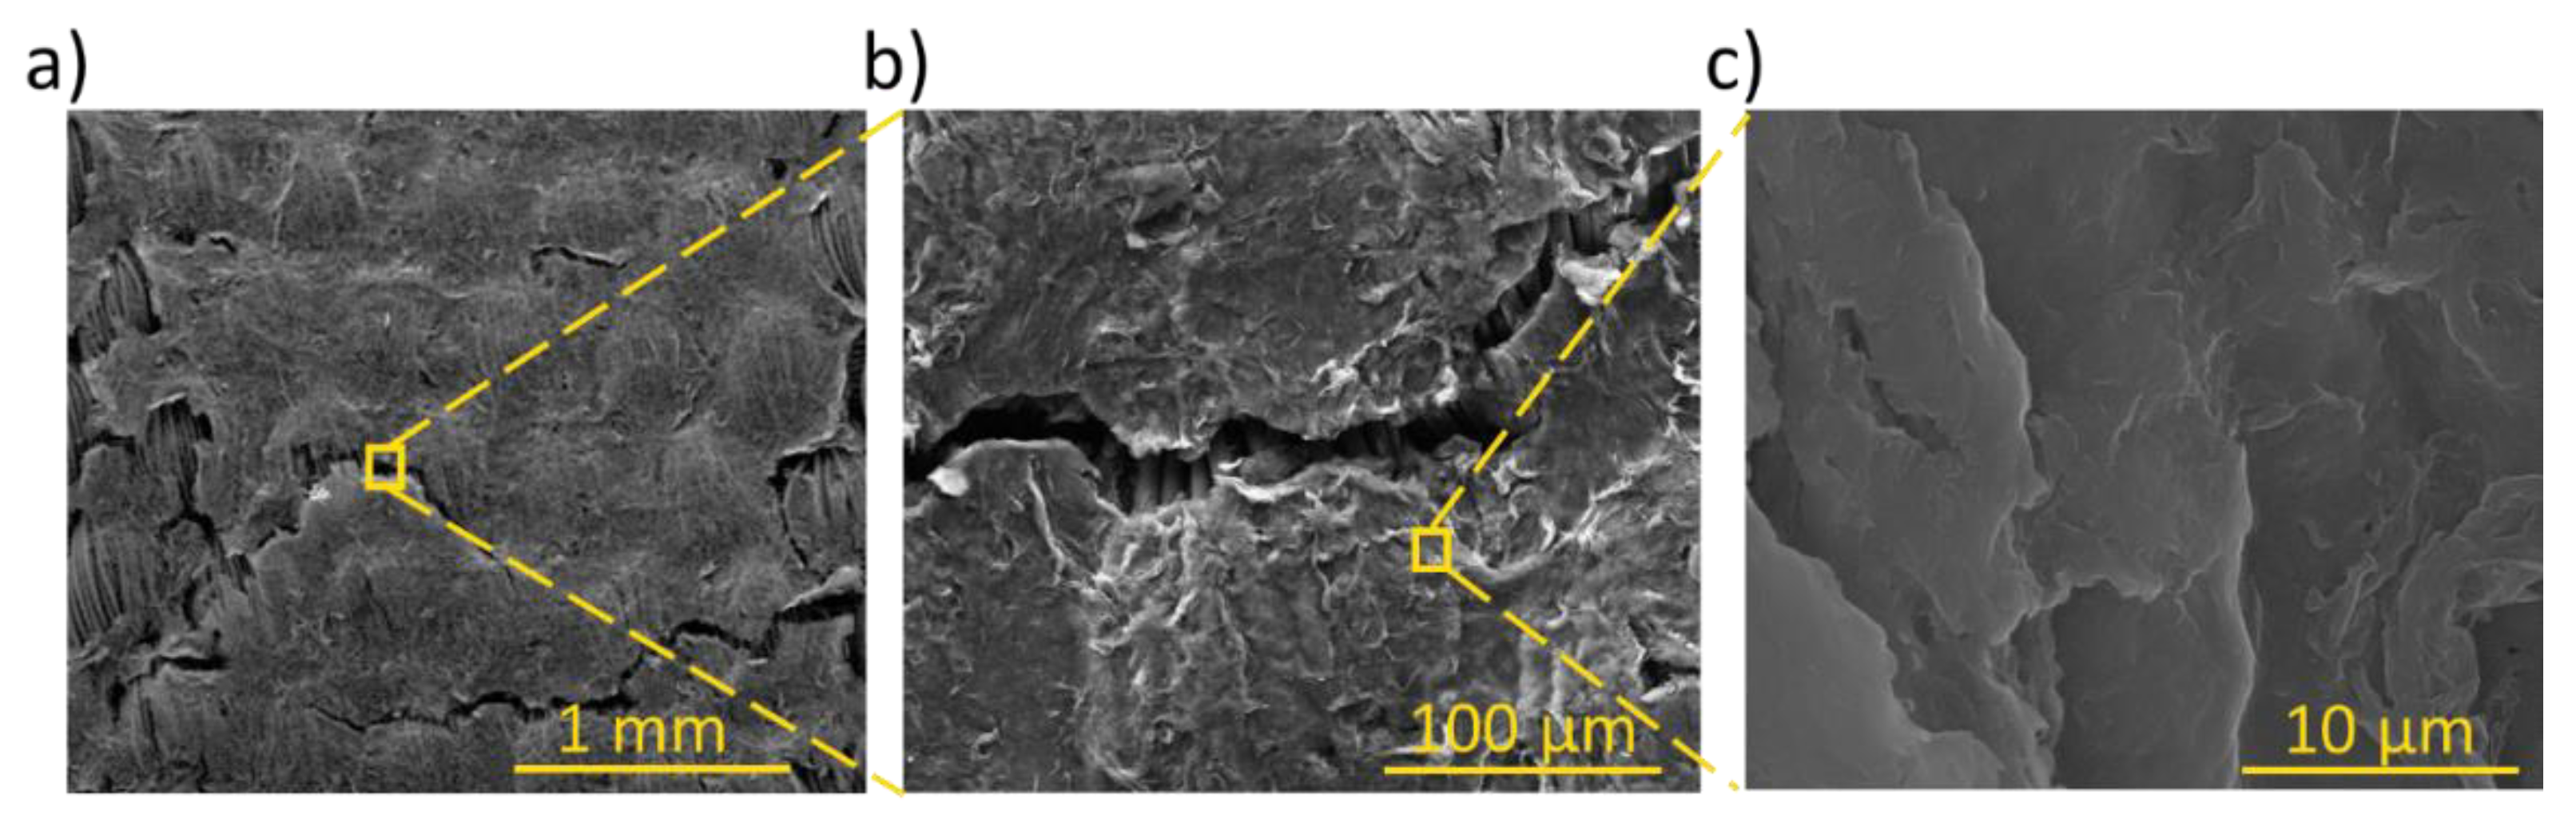
Figure 5.
SEM images of a-b) PE/Ink/T1/5, c-d) PE/Ink/T2/5, and e-f) PE/Ink/T3/5 at magnification of 100x and 800x.
Figure 5.
SEM images of a-b) PE/Ink/T1/5, c-d) PE/Ink/T2/5, and e-f) PE/Ink/T3/5 at magnification of 100x and 800x.
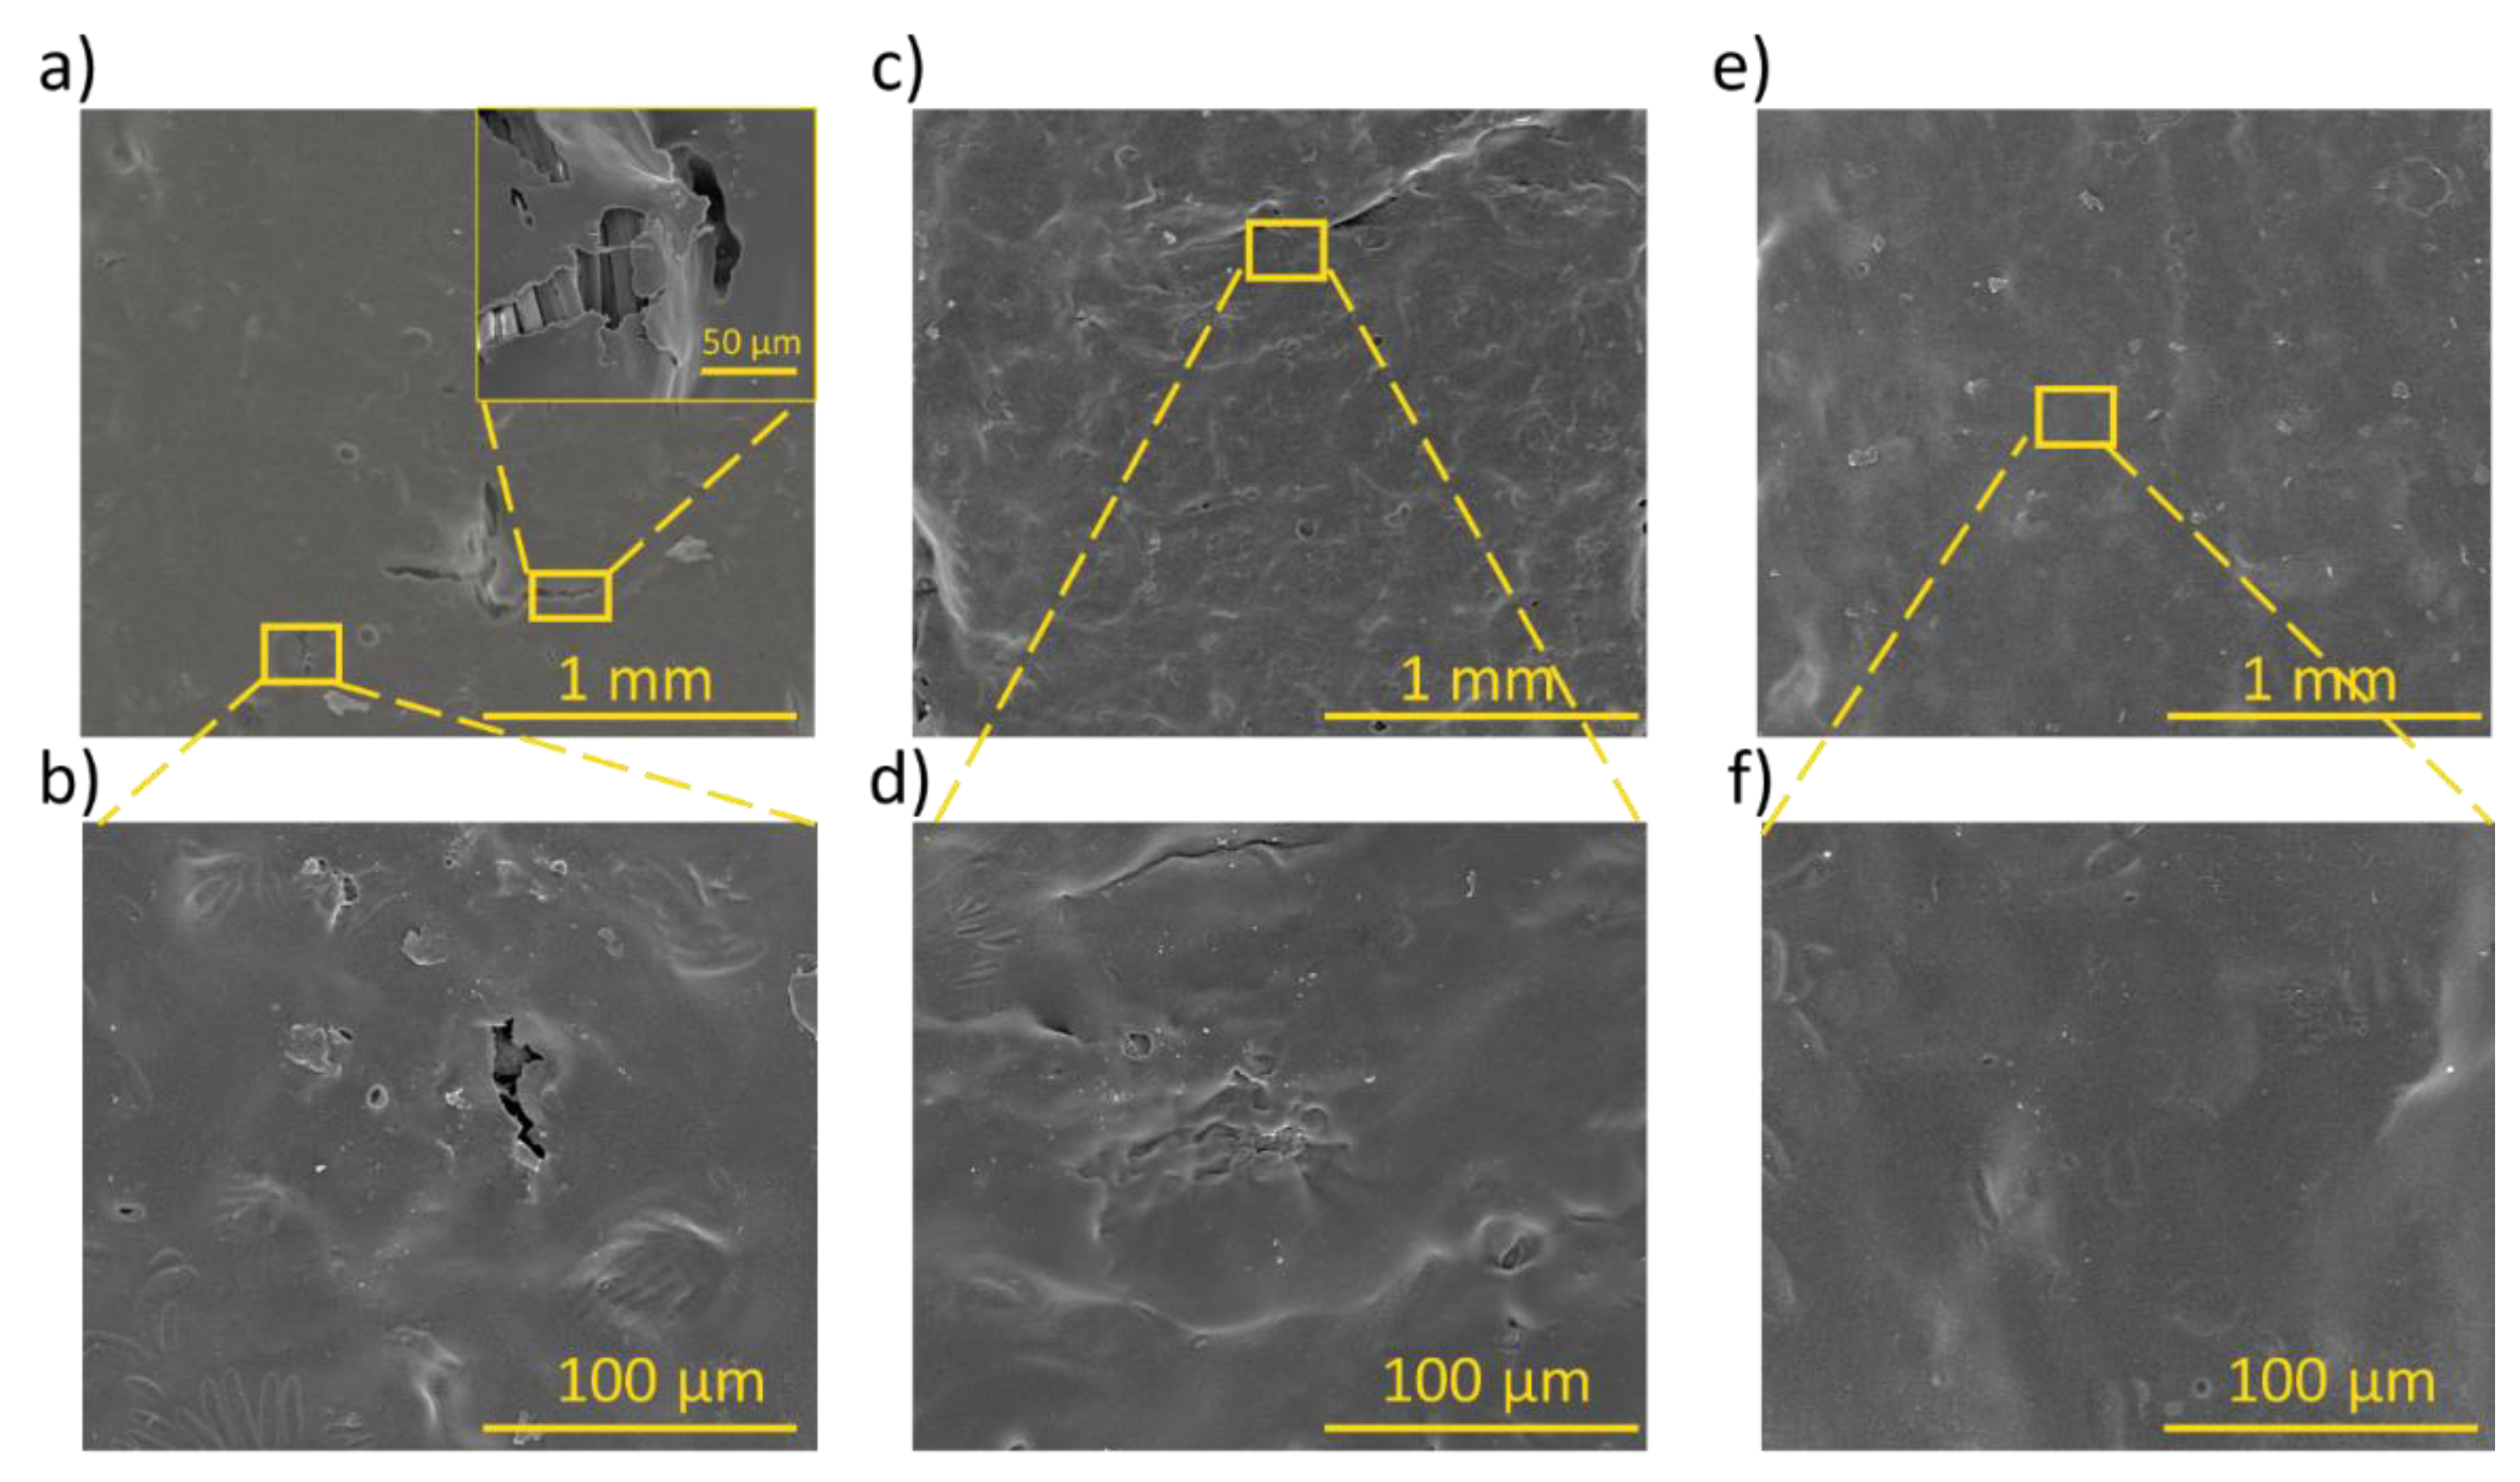
Figure 6.
Static contact angle measurements on the polyester fabric surface and coatings a) T1, b) T2, and c) T3 with water and diiodiomethane solvent.
Figure 6.
Static contact angle measurements on the polyester fabric surface and coatings a) T1, b) T2, and c) T3 with water and diiodiomethane solvent.
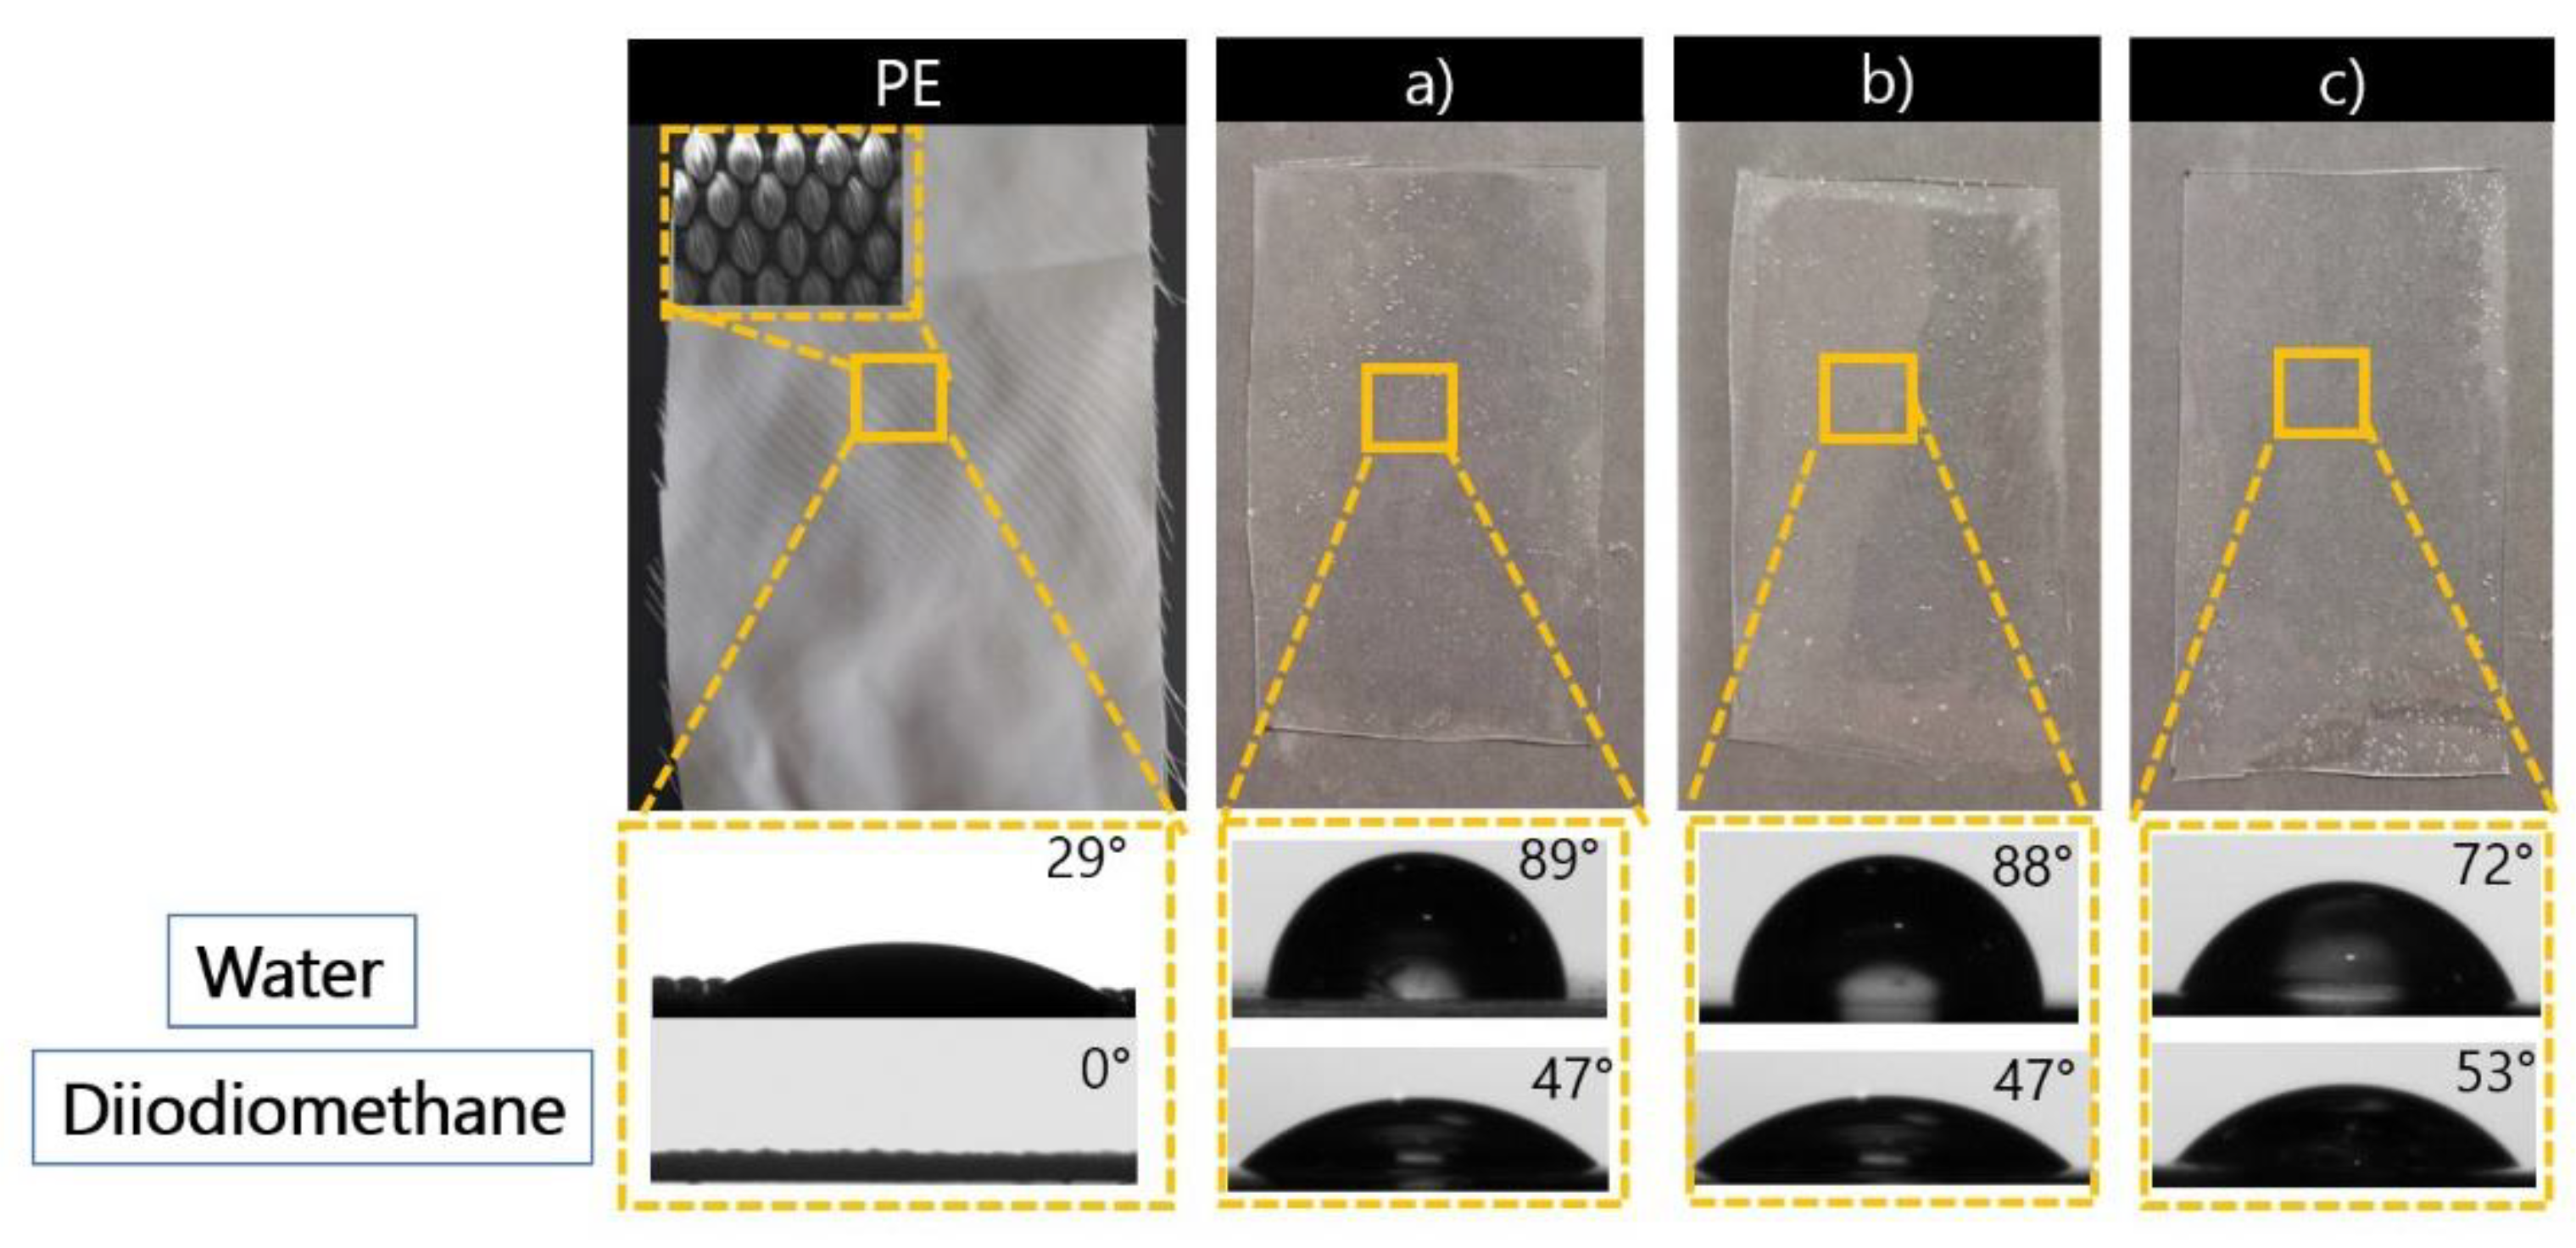
Figure 7.
Mechanical properties of pristine PE textile (black dots) with three layers of ink (black) and coated with PU, T1 (green), T2 (light blue), and T3 (navy blue).
Figure 7.
Mechanical properties of pristine PE textile (black dots) with three layers of ink (black) and coated with PU, T1 (green), T2 (light blue), and T3 (navy blue).
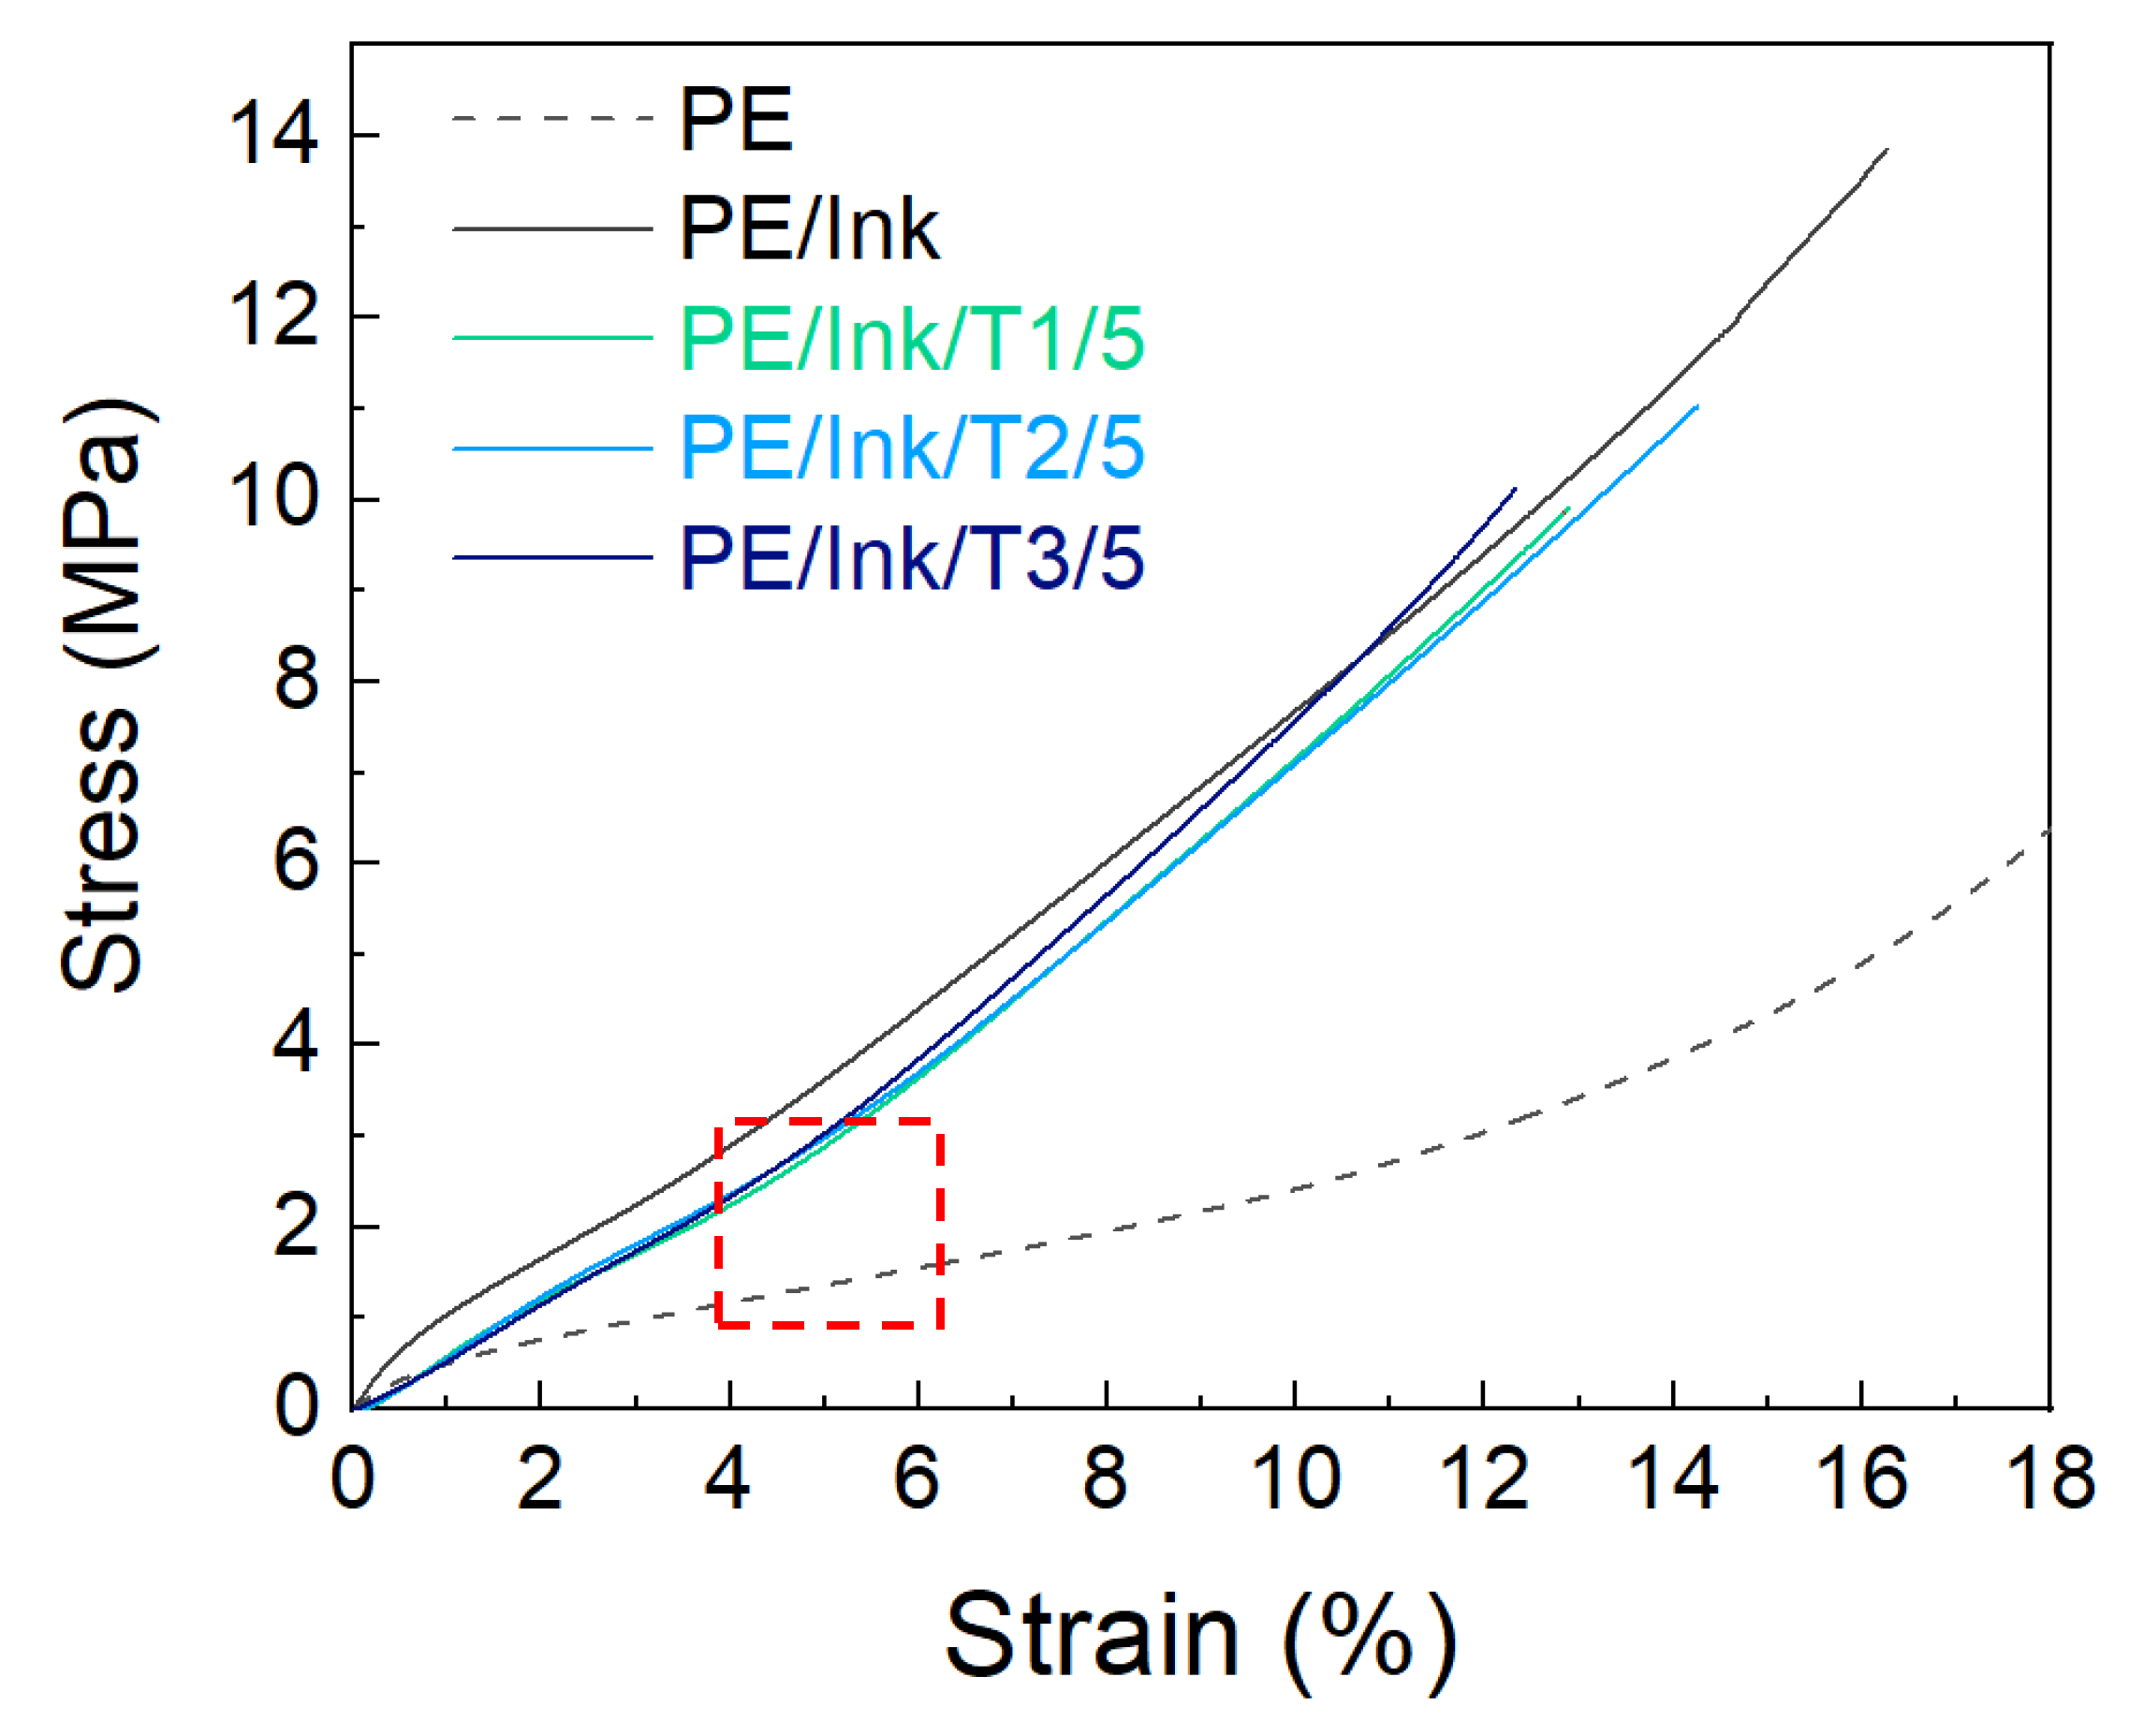
Figure 8.
a) Electrical resistance values for the different uncoated conductive line widths (5, 3, and 1 mm), and b) Resistivity tests on the ink fabric before and after T1, T2 and T3 deposition on 1 mm conductive line.
Figure 8.
a) Electrical resistance values for the different uncoated conductive line widths (5, 3, and 1 mm), and b) Resistivity tests on the ink fabric before and after T1, T2 and T3 deposition on 1 mm conductive line.
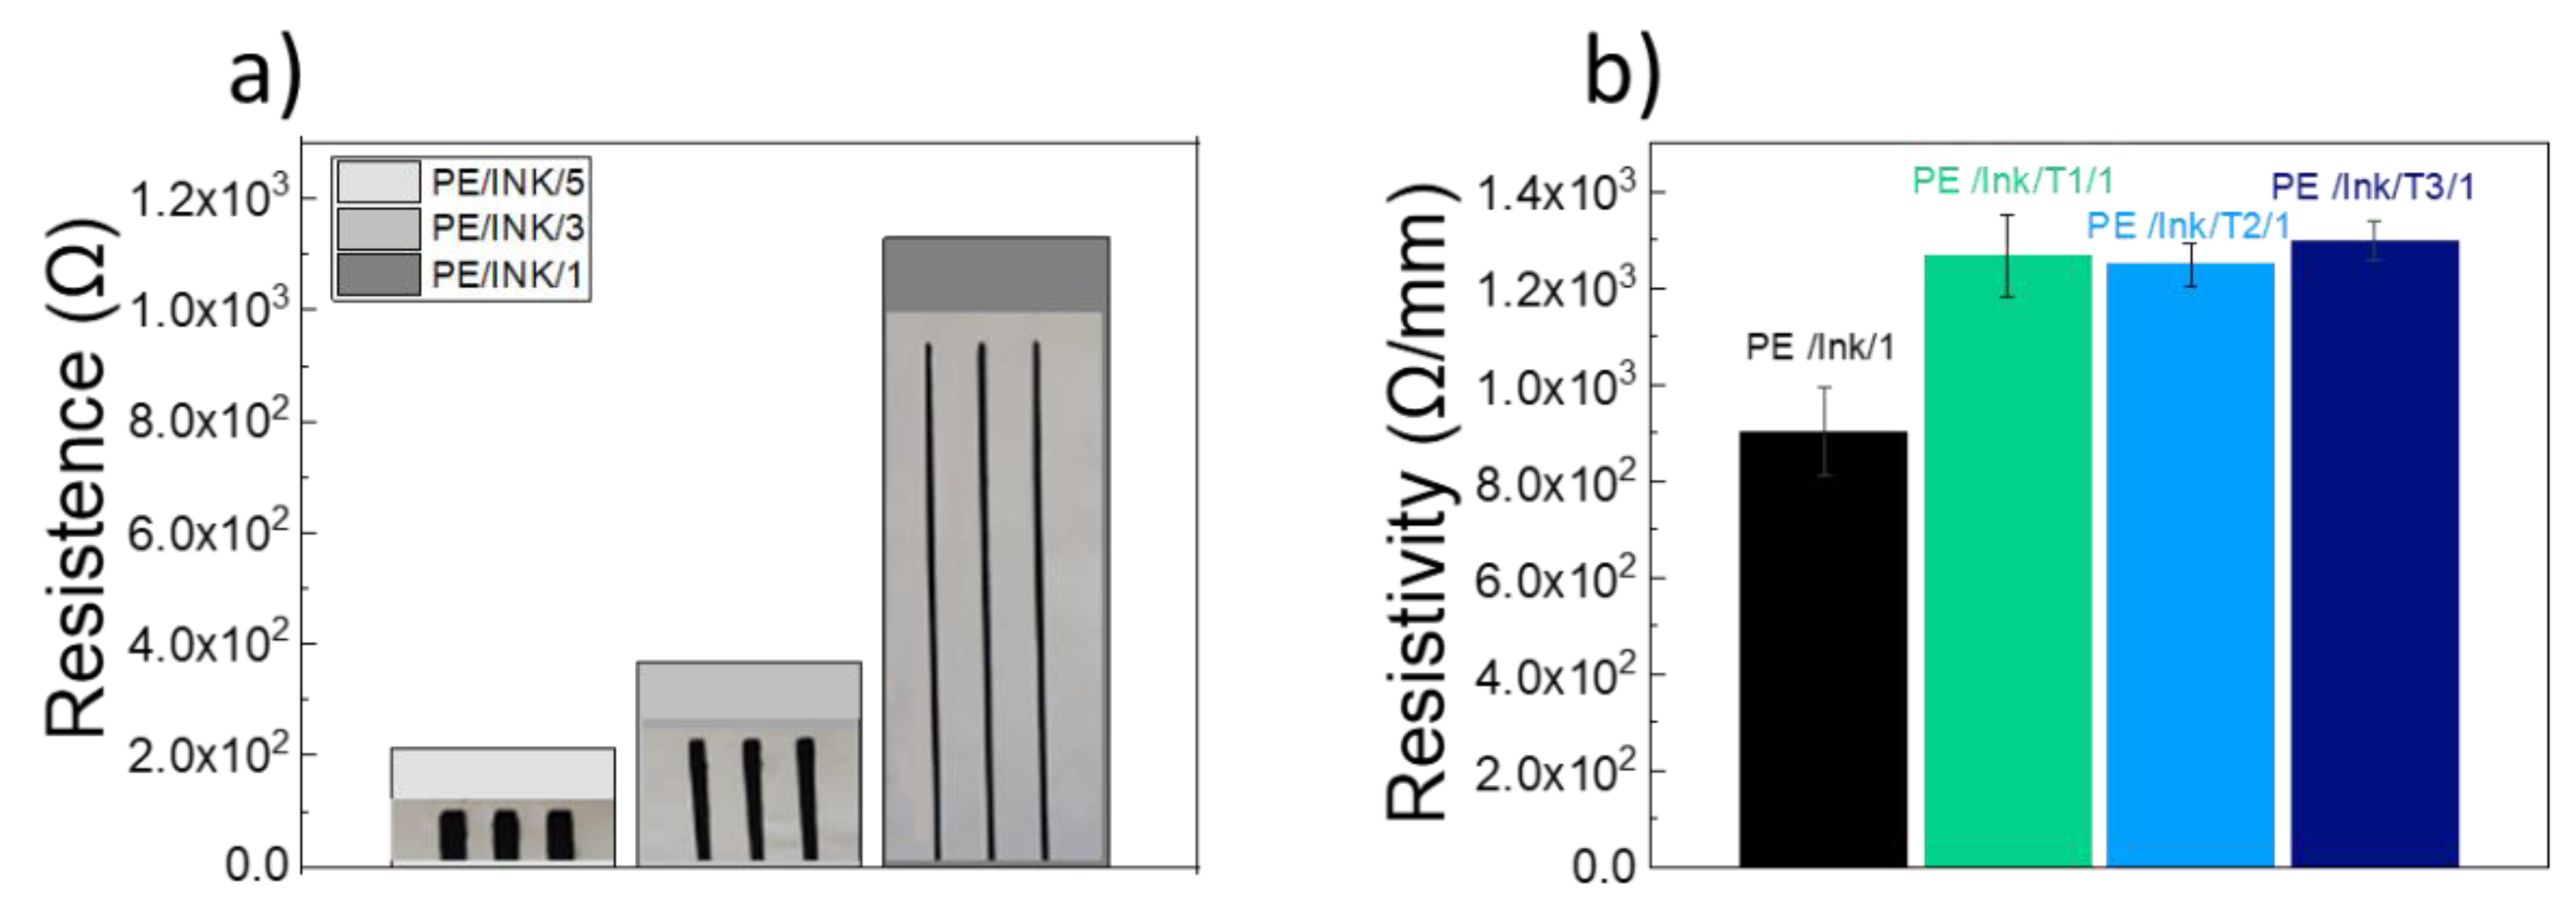
Figure 9.
Resistivity values during 120 h washing test for electrically conductive ink line with width b) 5 mm, c) 3 mm, and d) 1 mm, coated with T1, T2, and T3.
Figure 9.
Resistivity values during 120 h washing test for electrically conductive ink line with width b) 5 mm, c) 3 mm, and d) 1 mm, coated with T1, T2, and T3.
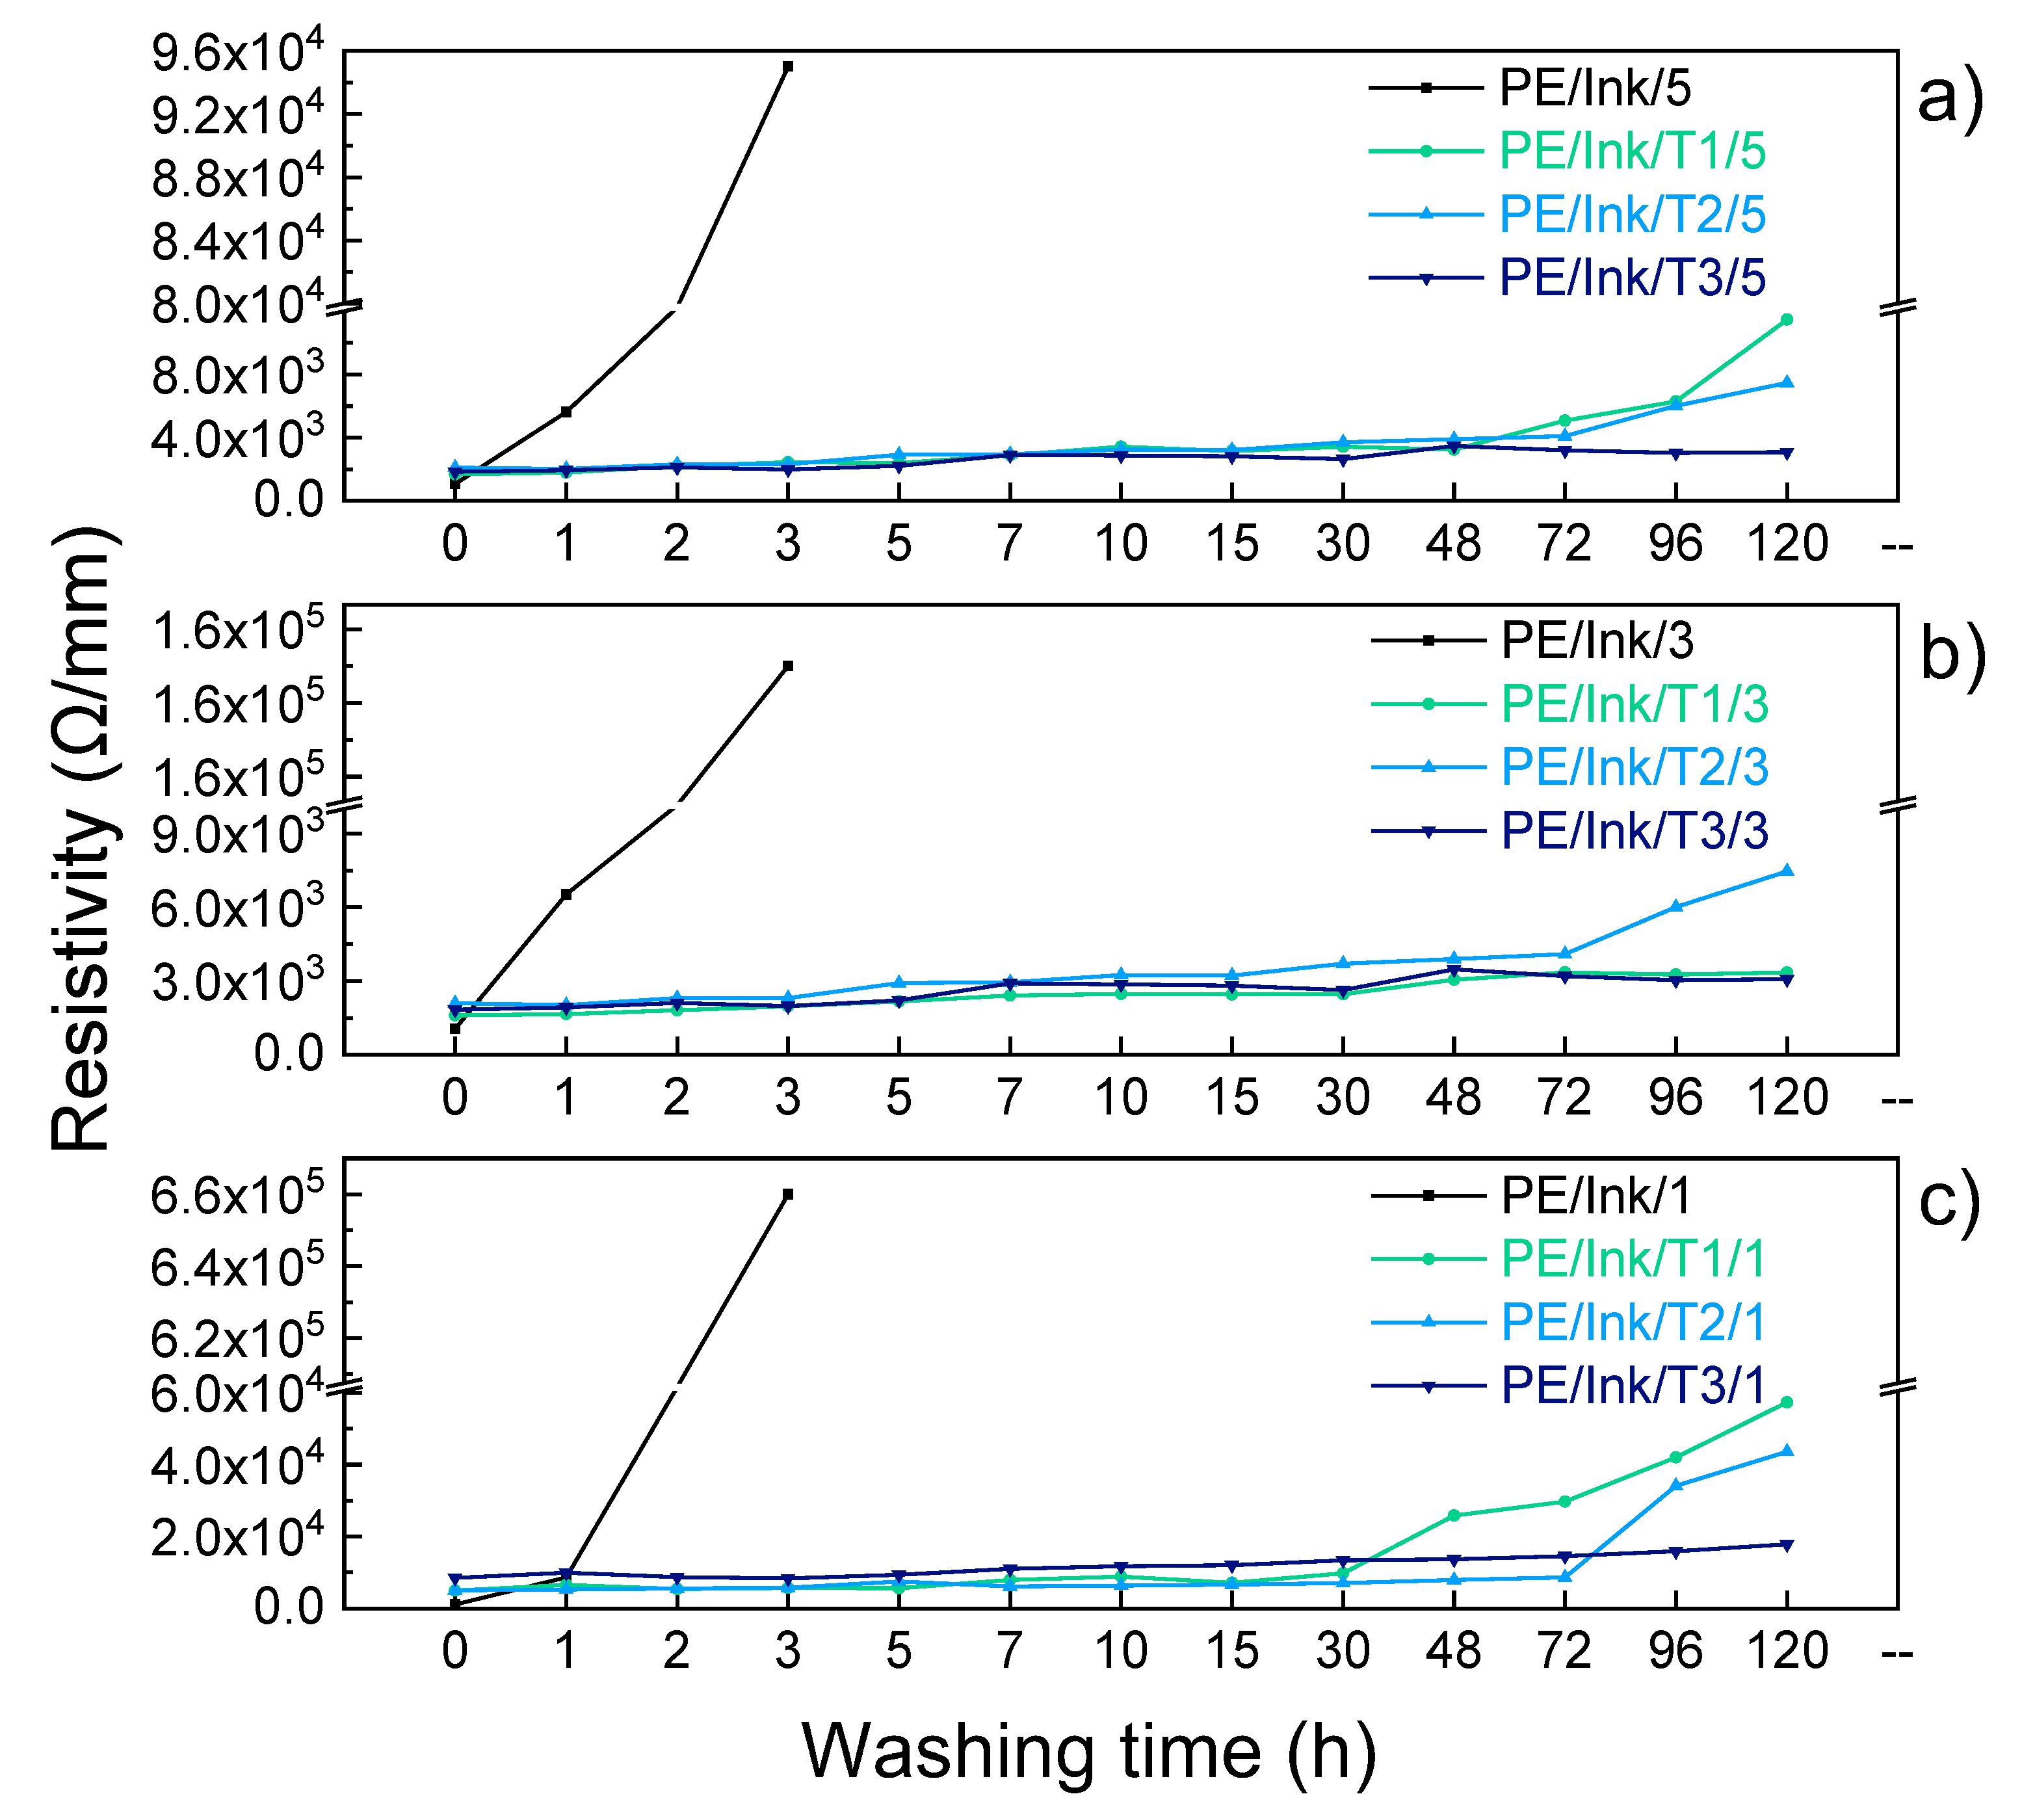
Figure 10.
a) Schematic representation of chain for checking current flow, b) using a blue LED test with 1 mm conductive pathways after 120 h of washing.
Figure 10.
a) Schematic representation of chain for checking current flow, b) using a blue LED test with 1 mm conductive pathways after 120 h of washing.
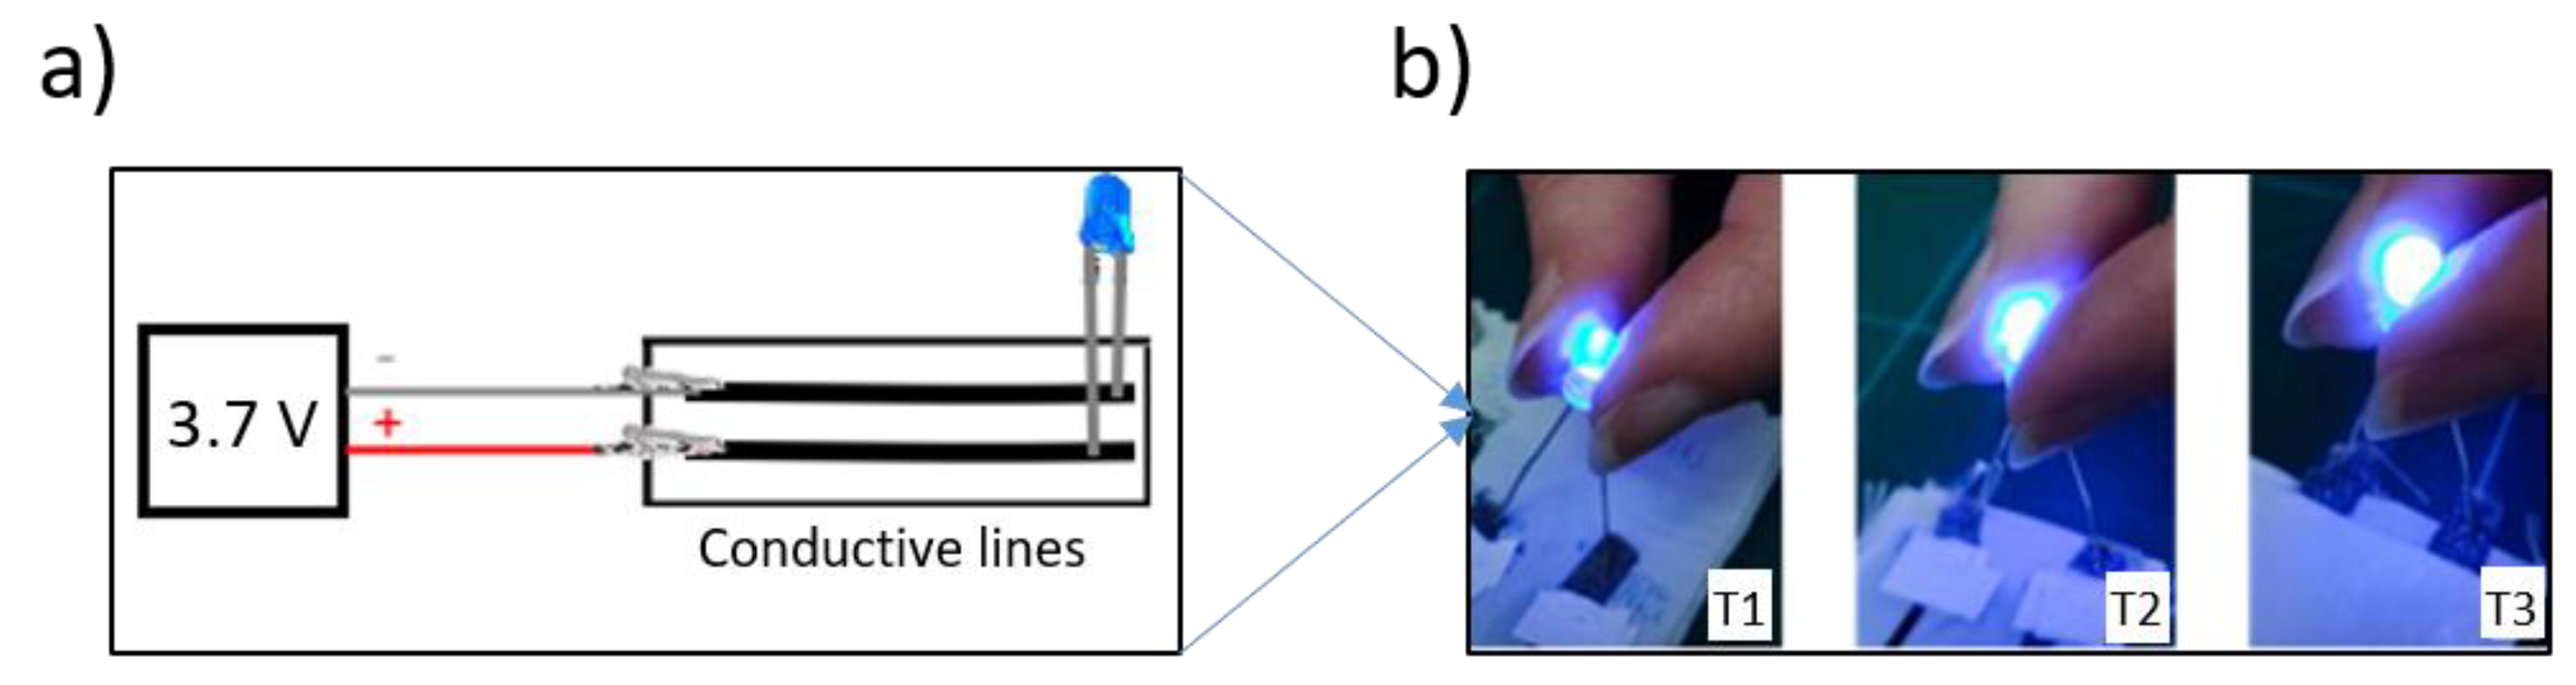
Figure 11.
Piezoresistive behavior of PE/Ink/3 (black) and PE/Ink/T3/3 (navy blue) for bending/unbending cycles.
Figure 11.
Piezoresistive behavior of PE/Ink/3 (black) and PE/Ink/T3/3 (navy blue) for bending/unbending cycles.
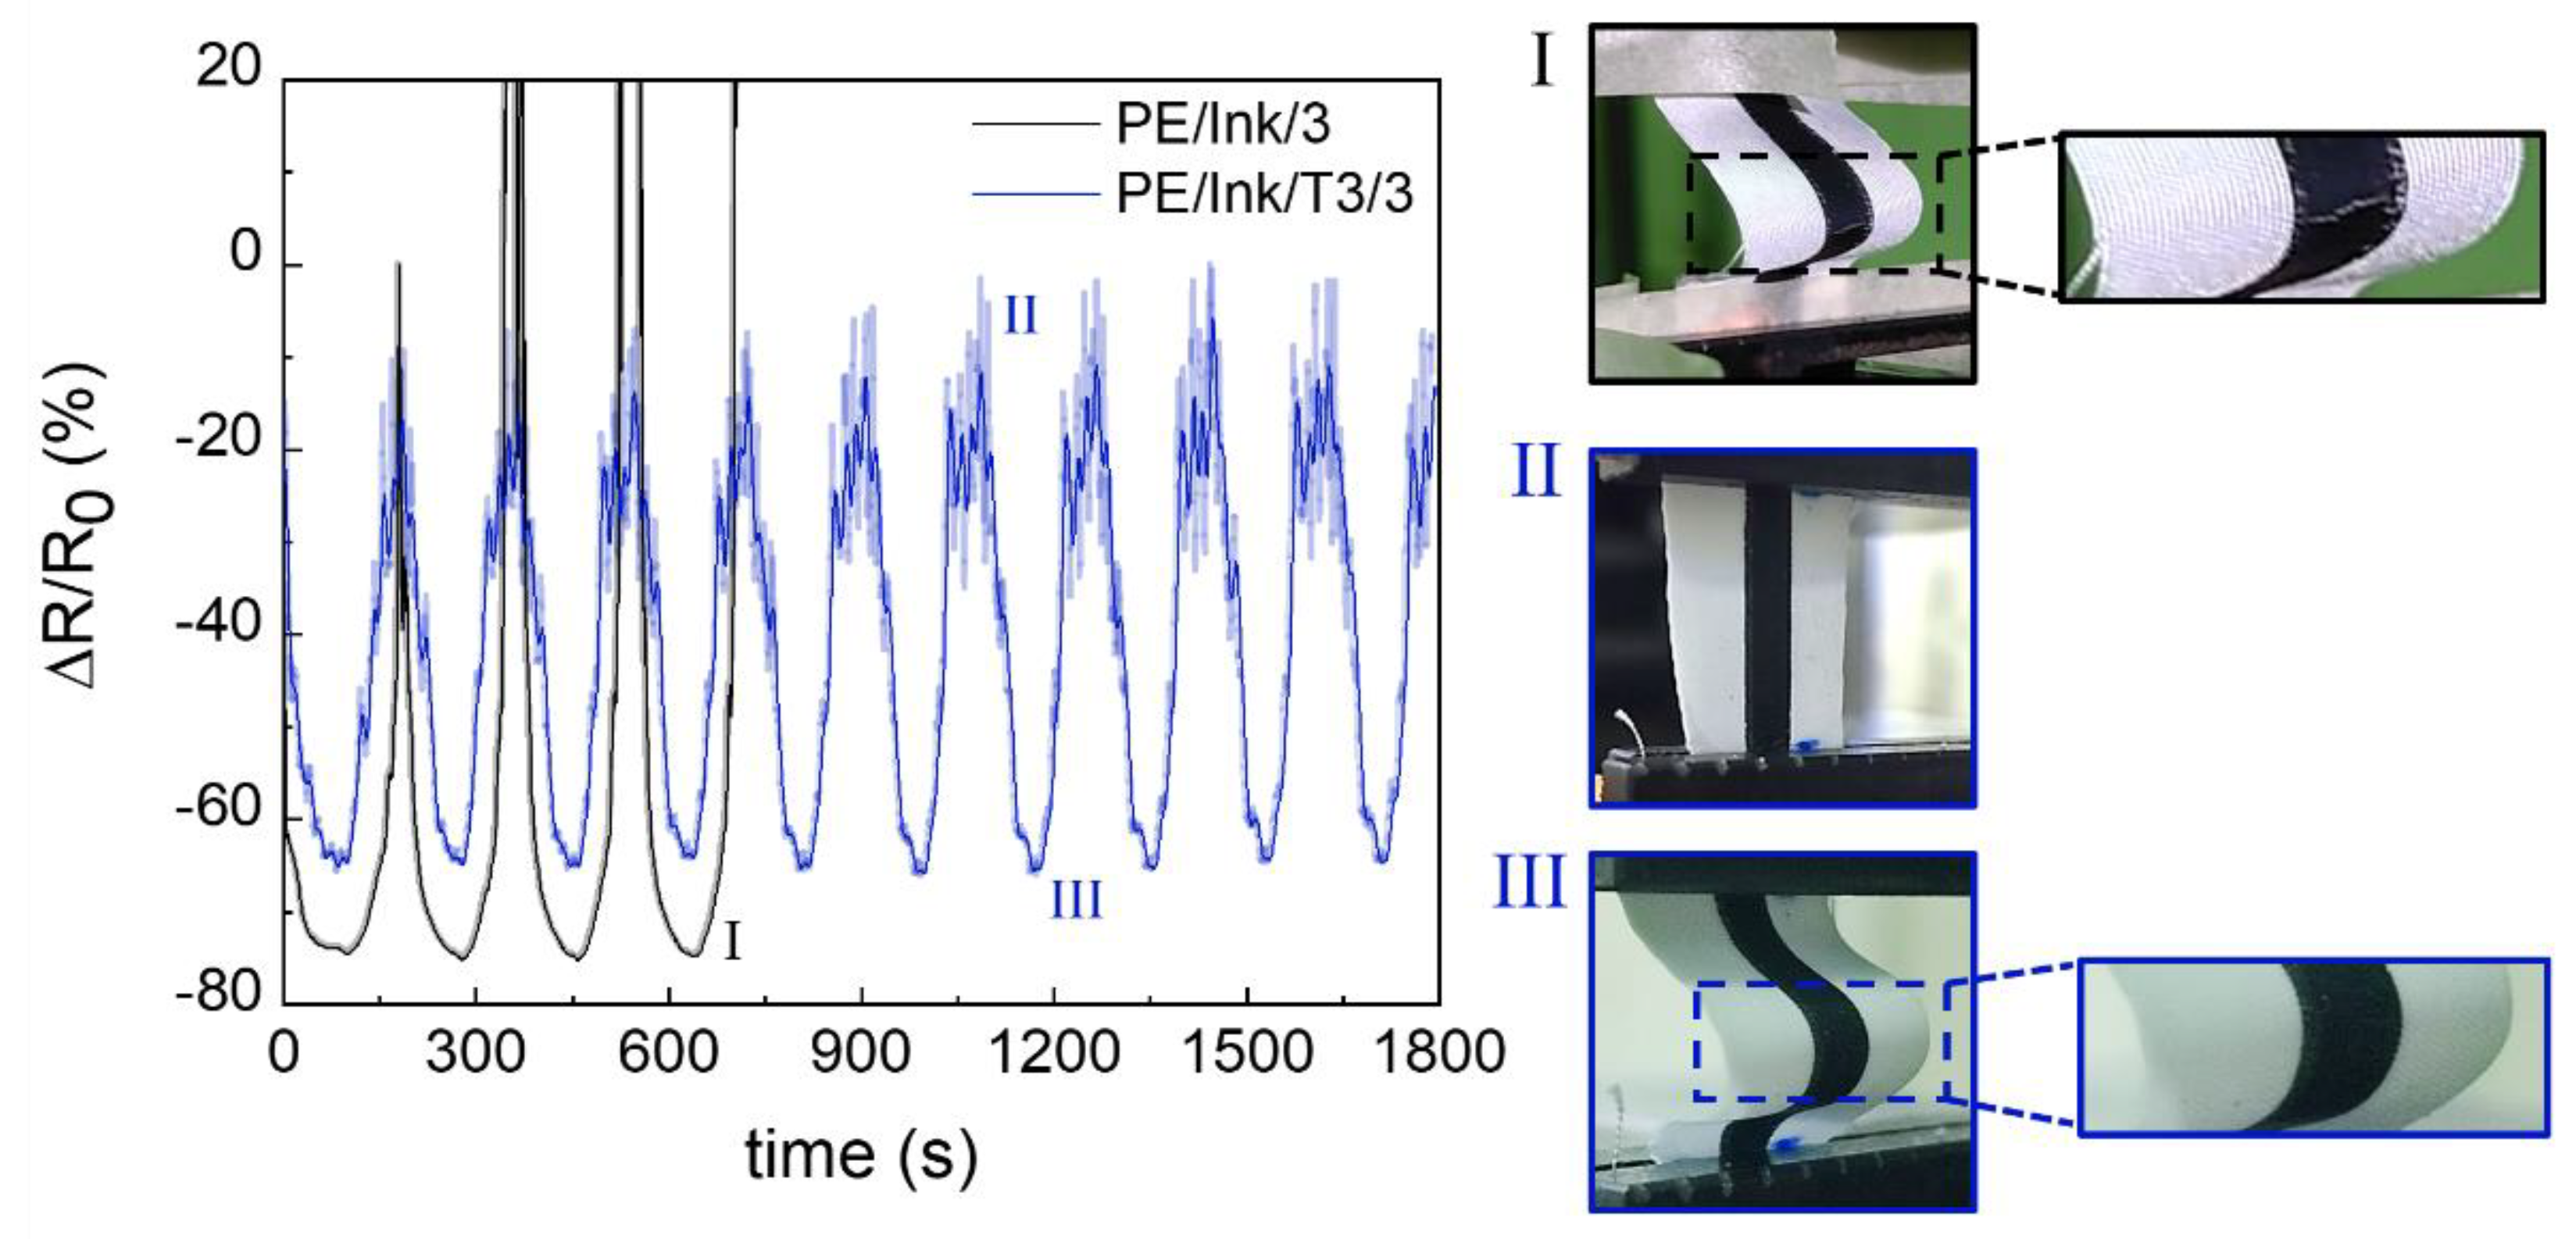
Figure 12.
Simulated signal (a) and transmitted signal at 80 bpm for three different widths of conductive line coated with T3. Signals for specimens b) without coating, c) with coating pre-washing and d) with coating post-washing for conductive lines of 5 mm width; signals for specimens e) without coating, f) with coating pre-washing and g) with coating post-washing for conductive pathways of 3 mm width; signals for specimens h) without coating for conductive pathways of 1 mm width. i) and l) are measure not collected.
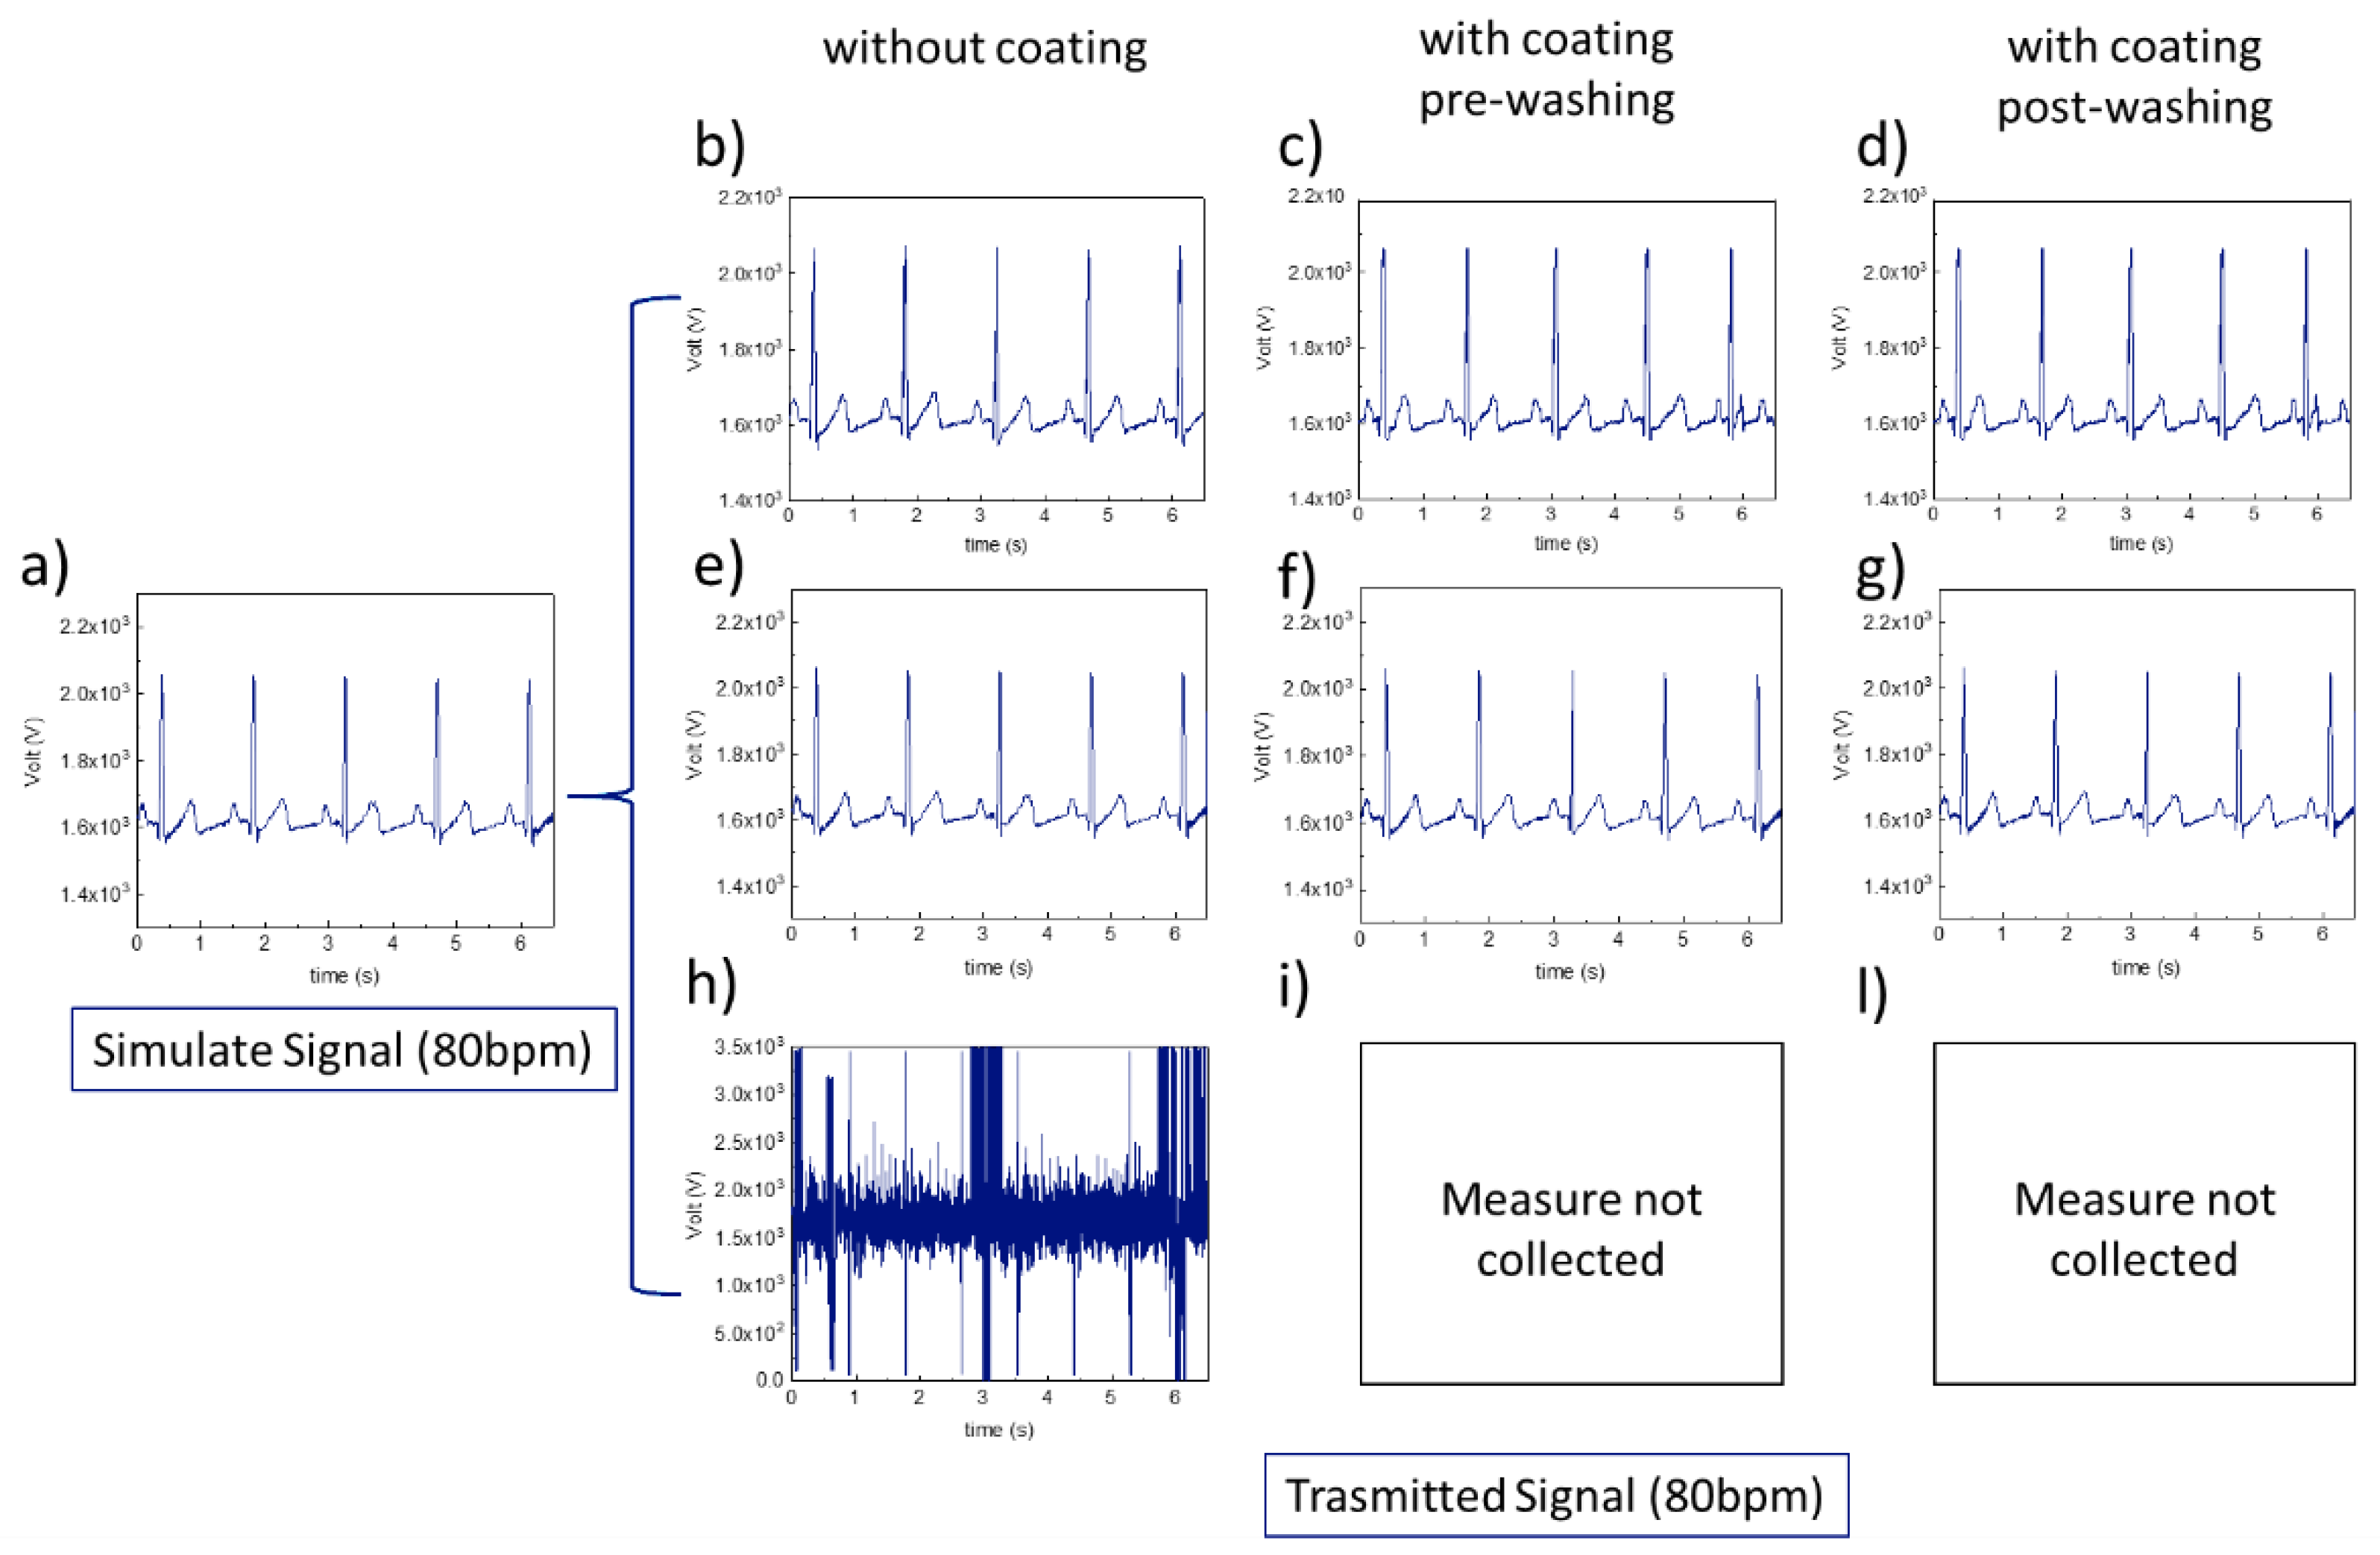

Table 1.
Composition of the coatings.
| Coating name | Crosslinker (wt%) | Thickener (wt%) |
|---|---|---|
| T1 | 2 | 2.5 |
| T2 | 2.5 | 2.5 |
| T3 | 6 | 3 |
Table 2.
Mechanical properties of pristine PE textile, with three layers of ink and coated with the T1, T2 and T3.
Table 2.
Mechanical properties of pristine PE textile, with three layers of ink and coated with the T1, T2 and T3.
| Sample | Tensile modulus [MPa] |
Tensile strength* [MPa] |
Ultimate strain* [%] |
|---|---|---|---|
| PE | 20.17 ± 8.73 | 19.13 ± 2.7 | 7.53 ± 1.96 |
| PE/Ink | 81.06 ± 0.85 | 16.26 ± 0.63 | 13.84 ± 5.07 |
| PE/Ink/T1/5 | 86.45 ± 8.70 | 12.89 ± 1.72 | 9.90 ± 1.29 |
| PE/Ink/T2/5 | 82.96 ± 13.43 | 14.25 ± 0.85 | 11.02 ± 2.63 |
| PE/Ink/T3/5 | 90.5 ± 6.10 | 12.31 ± 0.33 | 11.02 ± 0.40 |
*Values extracted after the force reached 18N.
Disclaimer/Publisher’s Note: The statements, opinions and data contained in all publications are solely those of the individual author(s) and contributor(s) and not of MDPI and/or the editor(s). MDPI and/or the editor(s) disclaim responsibility for any injury to people or property resulting from any ideas, methods, instructions or products referred to in the content. |
© 2025 by the authors. Licensee MDPI, Basel, Switzerland. This article is an open access article distributed under the terms and conditions of the Creative Commons Attribution (CC BY) license (http://creativecommons.org/licenses/by/4.0/).
Copyright: This open access article is published under a Creative Commons CC BY 4.0 license, which permit the free download, distribution, and reuse, provided that the author and preprint are cited in any reuse.


