
Submitted:
14 November 2024
Posted:
15 November 2024
You are already at the latest version
Abstract
Aloe vera is well known for its biological properties as a bioflavonoid-anti-inflammatory, antibacterial agent. It has been used frequently in the food sector as food coating for its hygroscopic properties and as an ingredient in the lucrative industry. Studies have also included Aloe vera as an eco-friendly green solution based on these properties. The current research focuses on the use of Aloe vera gel in printing pastes as an alternative sustainable solution to synthetic thickeners, evaluating its wet performance and ease of fabric stitching, and has been inspired by studies that similarly used this substance measuring its effect on the fabric's coefficient of friction and antimicrobial action. In the current study, printing pastes with natural colourants and Aloe vera gel thickener derived from natural leaves from Crete increased the fabric's mechanical resistance to abrasion compared to the untreated pastes. The measured performance did not differ substantially from prints with traditional synthetic pastes, hence tolerating the substitution with the non-contaminant variant. The enhanced resistance to abrasion and wear prolongates the fabric's serviceable life and resulting garments, decreasing the need for high industry processing volumes and, as a result, reducing pollution. The resistance to wear was evaluated using the dominant method in textile testing of the Martindale apparatus, which measured the cycles to failure, weight loss, and general appearance deterioration using the official photographic standards.
Keywords:
aloe vera printing
; aloe vera coating
; fabric wear
; green fashion
1. Introduction
The apparel and fashion industry, in general, is known to be one of the most polluting sectors on the planet, according to the U.N. and NRDC [1,2], where 93 billion m³ of water is used annually, and around half a million tons of microfibre is being dumped into the ocean yearly. Husaini et al. [3] reported that only a few industries treat their effluents according to Pakistan’s accepted national environmental quality standard, a country well known to produce many of today’s textile goods [4].
The term serviceability of a garment is a generic term that composes several aspects exceeding the limits of the garment’s properties. A fully functional but old stylish garment can still be considered unserviceable, as in the case of a lightly discoloured formal suit in the elbows area [5,6]. Based on this concept, consumers are encouraged to buy and discard clothes and textile goods frequently, in general, through constantly changing collections at low prices as the old collections become unserviceable. Consequently, wear-resistance characteristics are usually overlooked as the garments are not intended to have a prolonged short life. Low-cost and quality garments tend to abrade, discolour or change in appearance faster than average and often, their useful life terminates even sooner. Modern sustainable trends require reusing cloths as raw materials for new ones [7]. Based on these facts, it is essential to improve the resistance to wear of the fabric.
As we approach a sustainability dead end, the serviceable life of garments is a critical issue and the Fashion Industry Charter for Climate Action in view of the Paris Agreement of 2015 highlighted the need for waste reduction in textiles. The beneficial effects of Aloe Vera of coated surfaces have been introduced previously. However, no studies in the literature have investigated the effect on the abrasive resistance of the substrate when used as a thickening agent in the pastes for printed fabrics. This article aims to investigate the incorporation of Aloe Vera gel in the printing paste as a sustainable solution for thickening agents, comprising potential innovation in the textile industry by extending the serviceable life of garments, reducing fabric wear, and minimizing waste.
Wear is determined by several factors, such as the abradant, abrasion conditions, lubrication and inherent mechanical properties of the fabric [6,8]. The abrasion can assess wear evaluation to failure point where holes are prominent in the fabric, change of appearance with fuzzing and pill formation or with percentage mass loss reflecting the impact on all mechanical properties related to mass density.
Microorganisms are present on almost every surface when conditions, such as moisture, nutrients, and temperature, allow them to [9]. The growth of microorganisms on textiles can be a hazard to the user, leading to pathogenic or odour-causing microorganisms. At the same time, the garment itself may suffer damage caused by mould, mildew or rot-producing microorganisms, leading to functional, hygienic and aesthetic difficulties such as stains [10]. Synthetic man-made fibres exhibit higher resistance to microbial attacks than natural fibres due to their hydrophobicity. Protein fibres and carbohydrates in cotton can be a source of nutrients themselves [9]. Their susceptibility explains the importance of using antimicrobial properties on these fibres.
Colour is a fundamental aspect of fashion as it characterises collections and can be achieved in yarn or garment form; however, fabric colouring is the most usual case and can be implemented using dyeing and printing methods. For many years, synthetic dyes were used for this scope; however, the need for a greener process gave rise to alternative sources based on natural dyes and resources [11].
Although digital printing is rapidly growing the traditional screen printing, remains the industry dominant methods for 2022 when higher production volumes are needed and constitutes a market of 8.14 billion $, only in the US [12]. The method be applied by rotary or flat screens and the latter is ideal for home and laboratory runs.
Synthetic thickeners are mainly acrylic based which are widely used in textile printing due to their ability to provide consistent viscosity, good print definition, and compatibility with various dye types. [11,13,14,15,16,17,18,19] Researchers have looked for alternatives including the polyurethanes based synthetic thickeners which share the same downsides, particularly concerning biodegradability and sustainability. Synthetic thickeners often comprise petrochemical derivatives, which are resistant to natural degradation processes. [20,21] This persistence can lead to long-term environmental contamination, as well as bioaccumulation in the ecosystem.
Aloe vera is a plant belonging to the Liliaceae family. It has been used frequently in the food sector as a food coating for its hygroscopic properties [22] and as an ingredient in the lucrative cosmetic industry [23]. It is cultivated in many farms worldwide, and it could lead to promising cultivation in Greece if a direct market chain with the pharmaceutical and cosmetic industries is established [24,25]. In conjunction with these industries, the textile industry can also raise the need for the plant, as discussed later. Historically, Aloe vera has been used for medicinal purposes, and it has been known as a “healing plant” as it possesses some biological activities that include the promotion of wound healing, antifungal activity, hypoglycaemic or anti-diabetic effects, anti-inflammatory, anticancer and gastroprotective properties. Following that path in this modern generation, researchers claim that Aloe vera treatment can speed wound healing [26,27], offer U.V. protection, and has antioxidant [28] and antimicrobial properties [29,30,31] when used in textiles.
Aloe vera leaves contain polysaccharides, and the gel contained is viscous and colourless, making it possible to be used as a thickener agent accompanied by natural dyes and avoid the harmful effects of synthetic thickeners and dyes [32,33,34]. Researchers have used aloe by padding and coating as an ingredient in the printing paste in moderate concentrations and measured changes in the coefficient of friction and antimicrobial performance [9,35]. The current study, as a supplementary study of previous work on the use of natural colourant prints, incorporates more significant volumes of aloe to substitute the commercial thickening agent while measuring the impact of the print on the wear resistance characteristics of the fabric, using the same natural occurring dyes from saffron, curcumin and annatto. These natural dyes are known for their low toxicity and are readily used in the food industry. At the same time, in their application on textiles, they have proven to impart delicate shades on cotton fabrics as reported by Zarkogianni et al. [36] and for convenience presented the Table 1 and Table 2, including the fastness to washing and rubbing where the Aloe Vera (AV) treated samples exhibit similar performance to the commercial thickener (CT).
The fabric’s wear resistance is evaluated by abrading the fabric using the Martindale apparatus and measuring cycles to failure, percentage mass loss and change of appearance. Similar multifunctional antimicrobial-abrasion-resistant coatings have been reported in the literature for use on silk fibres [37]. The eco-friendly thickener printed fabric with the combined aloe-natural colour pastes and fabric printed with commercial thickener-natural dye paste were tested and compared against their untreated scoured cotton of woven and knitted fabric construction to claim possible benefits in abrasion resistance, implying longer-lasting serviceable garments.
2. Materials and Methods
2.1. Scope
The scope of the current work was to determine whether the eco-friendly thickener printing paste containing natural dyes and aloe vera thickening agent intended to substitute the commercial thickener can contribute to abrasion resistance to demote wear and extend the useful product life of garments as part of a sustainable textile solution. Consequently, using aloe as a thickening agent can reduce the need for high textile production volumes, leading to pollution.
2.2. Materials
The substrate composition was selected to be 100% cotton owing to their microbial and abrasion resistance susceptibility, as mentioned in the introduction, in the form of the two main fabric constructions. Namely, knitted single jersey fabric with a mass density of 170g*m-² and woven poplin of a 1/1 plain weave fabric of 192 g*m-² were used. Substrates were prepared to undergo desizing and bleaching without optical brightening agents before use, achieving absorbability and forming the control (untreated) samples. The ingredients for the preparation of the printing pastes were the following: the acrylic binder Novabind 1001H, Prochimica Novarese, Italy, soft 100%, the acrylic thickener Kahaptrint RCF, Kyke Hellas SA and the fixing agent Novabind ICP: Prochimica Novarese, Italy, isocyanate based free of formaldehyde. Annatto and Curcumin powders supplied by Alps Industries Ltd. (India) were used without further purification for all printing processes. A commercial sample of saffron stigmas (Cooperative de Saffron, Crocus, Kozani, Greece) was used. Aloe Vera was extracted from Aloe Vera leaves containing polysaccharides and was purchased from Crete, Greece. Sodium Alginate was purchased from Glentham Life Sciences, UK. The standard 100% wool fabric from SDC was used as an abradant in the Martindale apparatus, conforming to the ISO12947–2 standard.
2.3. Methods
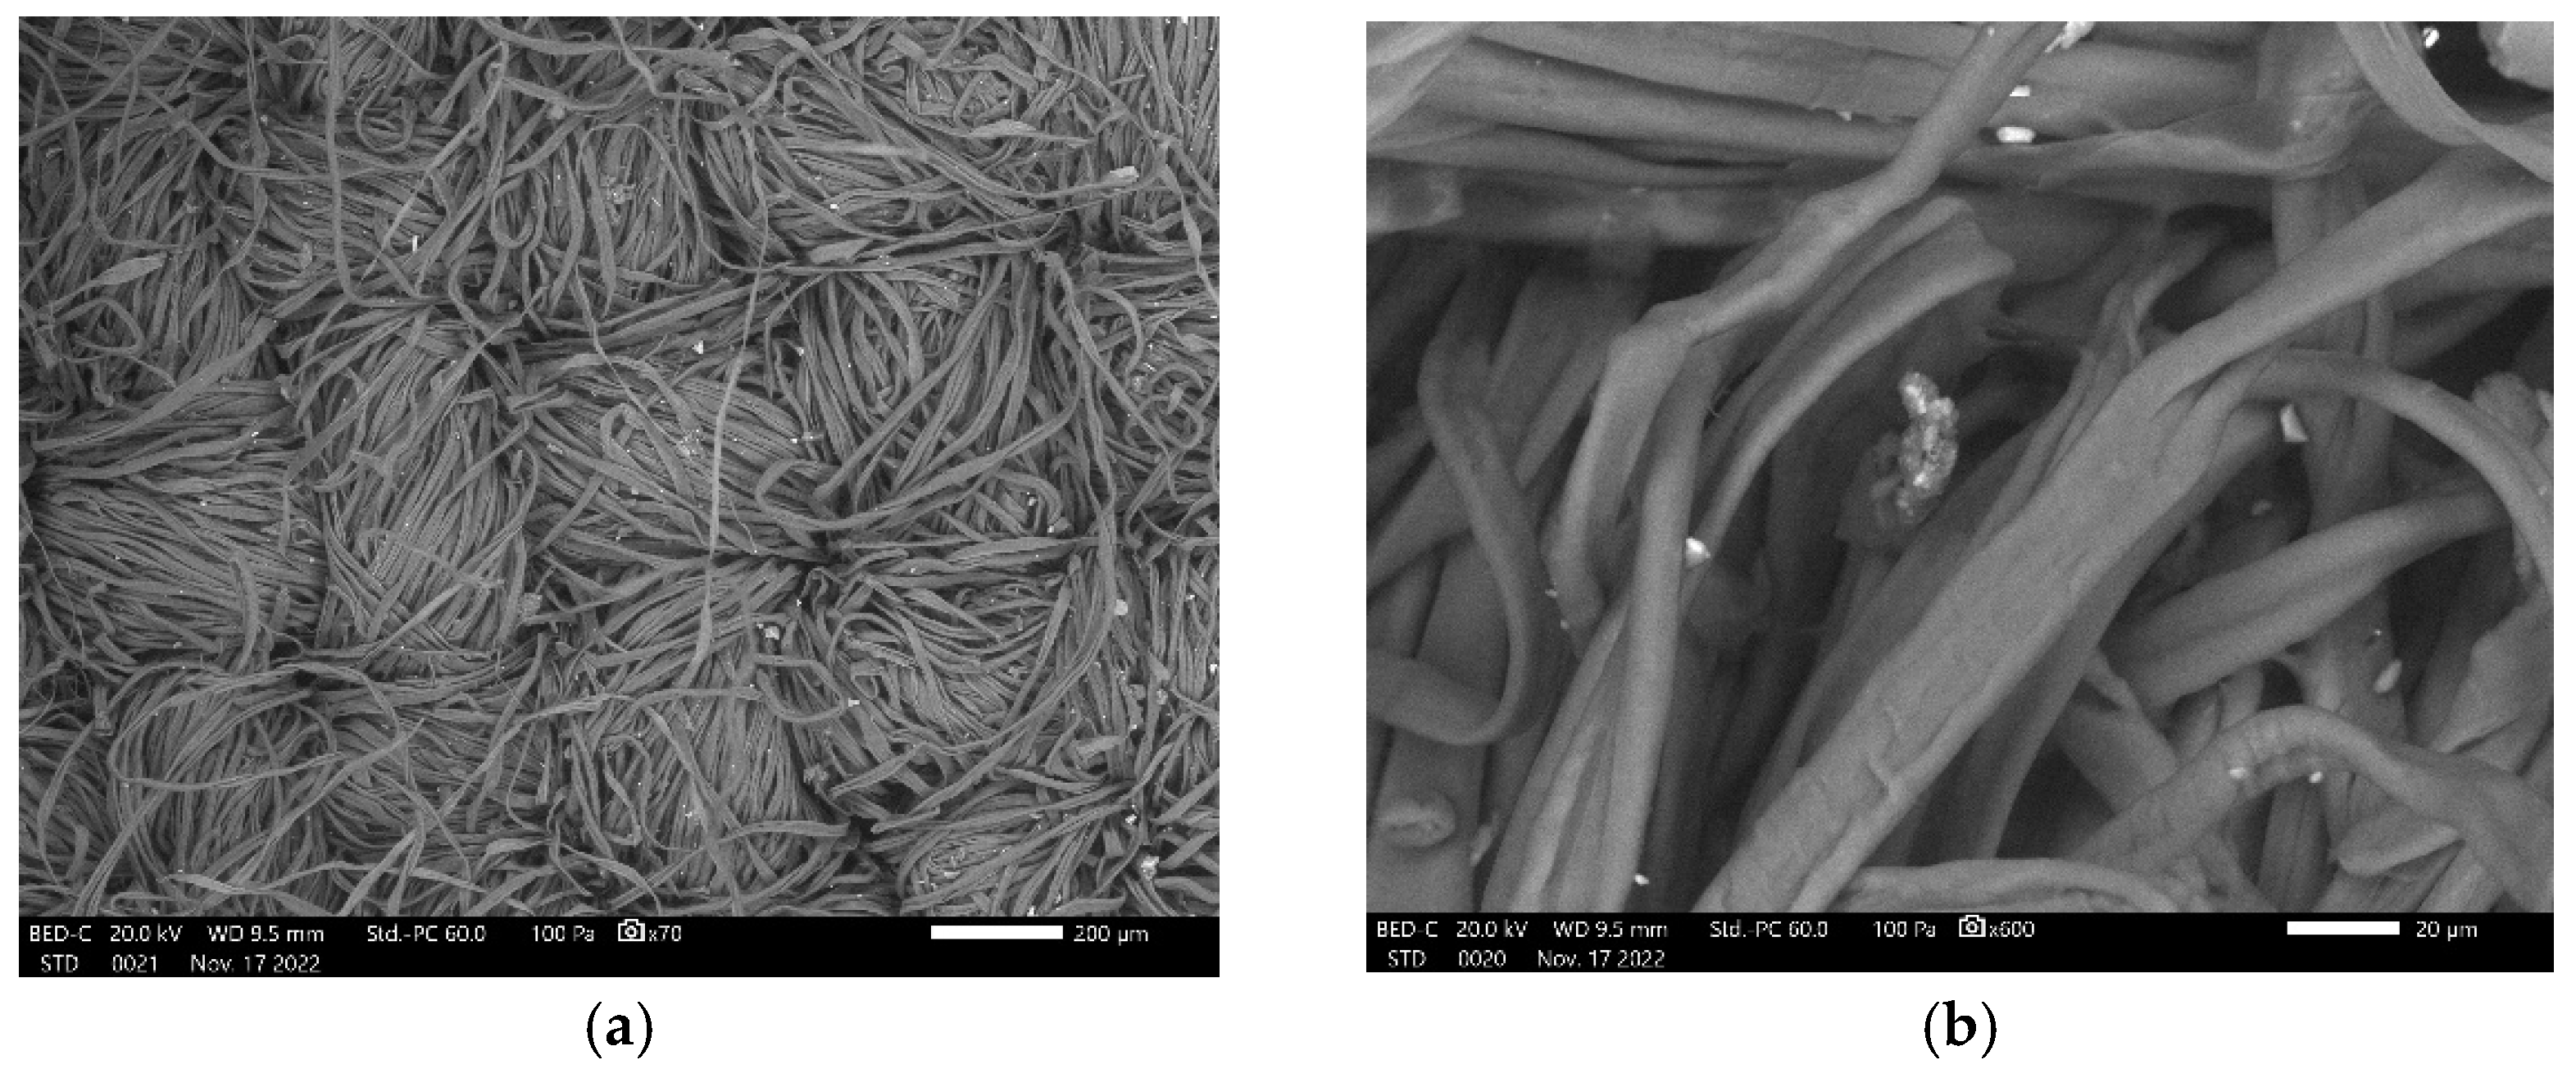
The overhand mixer used was obtained from IKA-WERCK (RW 14H). The ultrasonic processor used was the UP 100H from Hielscher. Printing paste was incorporated using the flat screen-printing method by applying a uniform film using a 160-count mesh over the substrate which was treated at 150°C for 3 minutes, and the weight and fabric thickness were checked before and after printing with acceptable discrepancies considering the natural origin of the substrate (CV<5%). Microscopic analysis was performed using the Scan Electron Microscope (SEM) JEOL model JSM-IT500 and the Meiji Techno MX9430 polarising microscope.
Mean percentage dry mass gain and mean percentage thickness gain are presented in Table 3 for the woven and knitted structure.
Mean Dry Mass Gain (%)
The test for woven and knitted fabric indicates that the p-values for the F-test are over the a=0.05, which signifies that the null hypothesis (Ho) is accepted; hence, the variances are accepted as equal, and the t-test of equal variances case has proceeded.
The findings clearly show that the p-values were way under a=0.05 in the subsequent t-test, which signifies that the means are statistically different. Therefore, this proves that the thickness of the printed fabric has increased compared to the control fabric in both cases, namely woven and knitted, Table 4 and Table 5.
Mean Dry Mass Gain (%)
The test for woven and knitted fabric indicates that the p-values for the F-test are under the a=0.05, which signifies that the null hypothesis (Ho) is rejected; hence, the variances are accepted as unequal, and the t-test of unequal (Welch’s t-test) variances case has proceeded.
The findings clearly show that the p-values were way under a=0.05 in the subsequent t-test (Welch’s t-test), which signifies that the means are statistically different. Therefore, this proves that the printed fabric’s weight (in the dry state) has increased compared to the control fabric in both woven and knitted cases, Table 6 and Table 7.
The printing pastes were prepared using the recipes in Table 8.
The Martindale abrasion and pilling testing apparatus (Gester) was used to abrade the samples, which were cut to a diameter of 38mm under the pressure of 12 kPa (ISO 12947–2) and abraded at the speed of 47.5 cycles per minute using the standard woollen abradant, as presented in the set up in Figure 1. The masses before and after specified abrasion cycles were measured, and the mass loss was calculated and reported as a percentage of the initial specimen mass (ISO 12947–3). The percentage mass loss and cycles to failure were measured at the point where two different threads broke for the woven fabric and one thread for the knitted (ISO 12947-1). A minimum of four specimens per run was used to obtain statistically significant results. Statistical analysis was conducted using SPSS v.13 at a 95% confidence level to detect between group differences of the treated samples.
Deterioration of the appearance and pilling was evaluated using standard photographic gradings (ISO 12945-2). The comparison was conducted at pre-determined suggested points and critical points of abrasive wear, taking notes on crucial observations. The assessment was carried out using the light cabinet, illuminating the samples at 5°-15° with the fluorescent source while observing them at right angles from a distance of 30-50cm under the same atmospheric conditions to avoid the influence of any other factor, as temperature and humidity as aloe vera is known to be hygroscopic.
3. Results and Discussions
Initially, the untreated control fabrics for knitted and woven versions were compared against the printed ones with both types of thickeners, commercial and aloe, as represented in Figure 2 and Figure 3.
Results show that the influence of both types of printing pastes promotes abrasion resistance, expanding the life span of the samples. As seen from Figure 2 and Figure 3, a considerable increase in the abrasion resistance is exerted by the printed samples of both versions of paste thickeners, commercial and aloe. The increase is highly prominent on the knitted substrate, which could be attributed mainly to the following factors.
Firstly, the printing paste acts as an intermediate film separating the yarns of the substrate and keeping from coming into direct contact with the woollen abradant. This action protects the fibres until the coating film itself wears out. It should be noted that the polymerised binder on the fabric surface is in solid form with near to zero rheological properties, whereas the abrasion takes place at low speeds with a rough textile surface; hence, hydrodynamic or semi-boundary lubrication cannot be claimed [38]. Tribological analysis of boundary or semi-boundary lubrication was off the scope of the current work. Ibrahim et al. [13] presented only minor differences in the dynamic coefficient of friction, as in the case of abrasion testing. He mentioned that the antibacterial properties of aloe were not detected as the molecules were trapped within this binder film.
Secondly, the binder linkages enhance the fibre cohesion in the substrate, which is a crucial factor in fabric abrasion [8,39]. The primary scope of the binder is to bind the printing paste, which includes the pigment, to the substrate (fabric); however, a secondary action seems to fix the adjacent fibres within the yarn of the abraded fabric, promoting abrasion resistance and offering a longer serviceable garment life. Very similar trends in the abrasion resistance between the untreated and printed samples have been reported by Kokol et al. for flame-resistance-treated fabrics [40].
Yarn crossings occur in every successive warp and weft thread in the plain weave, which locks the fibres in place and promotes cohesion. In addition, crown points are formed, leading to higher abrasion resistance, especially in the balanced warp-to-weft yarn crimp fabrics [39,41,42,43]. The looser structure of the knitted fabric, where the yarn in the loops forms longer floats compared to the woven fabric, which is more susceptible to wear [44]. Therefore, the knitted structure benefits more from the binder fibre fixing effect analysed earlier, which is reflected in the results of percentage mass loss.
While synthetic dyes, such as multifunctional reactive dyes, actively crosslink with cellulose to enhance substrate abrasion resistance, natural dyes do not form covalent bonds with the substrate [45]. The selected natural dyes behave as direct dyes or acid dyes where Van der Walls and hydrogen forces, or ionic forces, respectively, are the primary mechanism of substantivity to the substrate in exhaust dyeing [46]. The colour was applied by the printing method, where the binder is responsible for keeping the printed paste on the fabric, which significantly differs from the exhaustion method. The colourant was applied at low concentrations with a minute, if any, to the mechanical behaviour of the printed structure. Spectrophotometric analysis of the abraded samples is beyond the scope of the current study, which concentrates on the abrasion resistance of the substrate.
Figure 4 and Figure 5 show that all printed samples with commercial and aloe thickeners suffer a significant mass loss of the specimen in the early stage of 1000-5000 cycles. The printed side faces the abradant where the wear primarily occurs. This loss evens out in the following cycles until it reaches a sudden failure. Treated samples show a more symmetrical and progressive deterioration in mass loss, which can be attributed to the superficial printed paste (coating) loss, which acts as a protective intermediate layer that absorbs the impact from the first part of the abrasion test cycles. Since the untreated sample’s fabric failure occurs earlier than the printed fabric, mass loss measurement of the untreated sample cannot be performed at the ultimate stage.
Additionally, not all samples break at the same time. Some samples fail before the ultimate stage, leaving some testing positions in the Martindale inactive. Mass measurements only for the printed samples at the ultimate stage were plotted in Figure 4 and Figure 5 but should not be considered as the average can become inconsistent. This trend conforms with the literature where, according to the disciplines of tribology, under standard mechanical and practical procedures, the rate of wear passes under three main stages [39]. Initially, the two surfaces adapt to each other, and the duration of this stage depends on the morphology and softness of the surfaces. In the primary stage, the adhesive-shearing wear occurs at the contact points where the normal force exerts an initially high pressure, i.e., higher than the elastic limit or the yield value, causing deformation of the junctions and increase in the contact area, reducing the pressure to the point that the force deforms the material mainly elastically [38]. The second stage is the longest, with a steady rate of wear and in the third, the components are subjected to rapid failure due to the extreme rate of wearing.
Aloe is known for its hygroscopic nature [22,36,47], which influences the heat dissipation at the ‘cold junctions’ formed by the textile fibres during abrasion [38], while humidity directly affects the viscoelastic behaviour of the fibres through tensile creeping and energy absorption [8,27,39,43]. Saville states that the ability to absorb energy is more critical than high tensile strength for achieving high abrasion resistance [8]. Fabric treated with aloe tends to have a slightly higher abrasion resistance, which is less prominent in knitted fabric than woven fabric, as the latter’s tighter and less elastic structure benefits more.
Pictures at a microscopic level (Appendix A) and at lower magnification were taken, although the latter was more beneficial for appearance evaluation. Pictures confirm the findings where the fabric surface fuzzing is prominent in the untreated samples compared to the printed of both thickener types, Figure 6.
The selected fabrics used for substrate were of good quality combed cotton yarn, which exhibits good resistance to abrasion [39,42] and, therefore, surface appearance change and pilling formation were minimal in most of the fabrics but especially in the printed samples with both thickening agents, Table 9 and 10. The lack of surface change in the evaluation system is reflected by number 5, while 4-5 indicates minimal changes. The assessment was performed visually comparing the samples against the photographic standards EMPA for knitted and woven fabrics (SDL Atlas), following the ISO 12945-2 recommended protocol by two examiners to ensure objective judgment. The untreated fabric has reached level 3-4 after 15,000 cycles for the knitted fabric, indicating poor performance and 4-5 for the woven samples of which the yarns are more densely interweaved. All treated fabrics, especially those coated with aloe vera, exhibited no surface alteration and pill formation and received the punctuation 9.
An interesting observation was noted. Samples printed with the aloe thickener paste present a smoother surface with the broken fibrils equally protruding from the fabric surface, similar to a “peach skin effect”, which deliberately is caused on lyocell fabric for enhanced ‘fabric hand’ [45], Figure 7. A combination of the previously discussed effect of long yarn floating and fibre fixing in yarn by the binder could be responsible. Saville explains that the initial impact of abrasion on the fabric’s surface is the appearance of fuzzing as the result of the brushing up of free fibre ends not enclosed within the yarn structure and the transformation of loops into free fibre ends by the pulling out of one of the two ends of the loop [8].
As mentioned before, a marginal gain in the abrasion resistance is recorded with the aloe thickening agent for mainly saffron and curcumin-printed pastes, which can be related to aloe’s hygroscopic and lubricating nature. At the same time, similar findings have been reported on the coefficient of friction, drape and resistance abrasion applied by padding [9,31].
Figure 8 and Figure 9 demonstrate comprehensively the differences between the printed (coated) fabric and the control fabric and compare the effect of the thickener in the printed paste, followed by stepwise-specific t-tests analyses and investigate the specific differences between the printed (coated) fabric and the control fabric, comparing the effect of the thickener in the printed paste. Stepwise-specific t-tests with equal and unequal variance were performed and presented in Tables 11 to 18 determine the statistical significance differences of the mean values plotted in Figure 8 and Figure 9. A F-test detects the type of variance of the data, where values of p above the a=0,05 accept the Ho of equal variance and greater values reject it, signifying the unequal variance and proposes the execution of Welch’s t-test of unequal variance, as explained in the method. Likewise, for the t-tests performed, of both variance types, the values of p lower than the a=0,05 reject the Ho, signifying the mean values compared are significantly different, even if the Bonferroni correction is applied to avoid type I error, where a=0.05/3 number of treatments = 0.0166.
Figure 8 and Figure 9 and Tables 11 to 18 demonstrate the statistically significant improvement in printed (coated) fabrics, which is prominent irrespectively to the thickener used. Additionally, the same observation is seen for individual comparisons of the control samples against the specific types of thickener paste formulation, for both substrates, knitted and woven. However, there is no evidence of significant difference of the improvement of abrasion resistance between the commercial and the Aloe thickener paste compositions. This signifies that Aloe Vera can used as a thickener and replace the commercial thickener with no sacrifice to the previously stated improvement, while the gain in sustainability is obvious endorsing the scope of the current study. The ability of increased abrasion resistance and decreased flexural rigidity have been reported on aloe vera-treated silk fabric [48], supporting current findings.

Table 11.
Variance analysis (F-test) and mean comparison (t-test) of control (untreated, KCtrl) and printed (coated-KP) fabrics on knitted fabrics, irrespective of the thickener.
Table 11.
Variance analysis (F-test) and mean comparison (t-test) of control (untreated, KCtrl) and printed (coated-KP) fabrics on knitted fabrics, irrespective of the thickener.
| F-Test Two-Sample for Variances | t-Test: Two-Sample Assuming Unequal Variances | ||||
| KCtrl | KP | KCtrl | KP | ||
| Mean | 17500 | 19270,833 | Mean | 17500 | 19270,83333 |
| Variance | 0 | 1347373,2 | Variance | 0 | 1347373,188 |
| Observations | 4 | 24 | Observations | 4 | 24 |
| df | 3 | 23 | Hypothesised Mean Difference | 0 | |
| F | 0 | df | 23 | ||
| P(F<=f) one-tail | 0 | t Stat | -7,4737636 | ||
| F Critical one-tail | 0,1156974 | P(T<=t) one-tail | 6,753*10-08 | ||
| t Critical one-tail | 1,7138715 | ||||
| P(T<=t) two-tail | 1,351*10-07 | ||||
| t Critical two-tail | 2,0686576 | ||||
Table 12.
Variance analysis (F-test) and mean comparison (t-test) of control (untreated, KCtrl) and printed (coated, KPc) fabrics with commercial thickener on knitted fabrics.
Table 12.
Variance analysis (F-test) and mean comparison (t-test) of control (untreated, KCtrl) and printed (coated, KPc) fabrics with commercial thickener on knitted fabrics.
| F-Test Two-Sample for Variances | t-Test: Two-Sample Assuming Unequal Variances | ||||
| KCtrl | KPc | KCtrl | KPc | ||
| Mean | 17500 | 18958,333 | Mean | 17500 | 18958,333 |
| Variance | 0 | 1657197 | Variance | 0 | 1657197 |
| Observations | 4 | 12 | Observations | 4 | 12 |
| df | 3 | 11 | Hypothesised Mean Difference | 0 | |
| F | 0 | df | 11 | ||
| P(F<=f) one-tail | 0 | t Stat | -3,9242834 | ||
| F Critical one-tail | 0,114111836 | P(T<=t) one-tail | 0,0011876 | ||
| t Critical one-tail | 1,7958848 | ||||
| P(T<=t) two-tail | 0,0023753 | ||||
| t Critical two-tail | 2,2009852 | ||||
Table 13.
Variance analysis (F-test) and mean comparison (t-test) of control (untreated, KCtrl) and printed (coated, KPa) fabrics with aloe thickener on knitted fabrics.
Table 13.
Variance analysis (F-test) and mean comparison (t-test) of control (untreated, KCtrl) and printed (coated, KPa) fabrics with aloe thickener on knitted fabrics.
| F-Test Two-Sample for Variances | t-Test: Two-Sample Assuming Unequal Variances | ||||
| KCtrl | KPa | KCtrl | KPa | ||
| Mean | 17500 | 19583,333 | Mean | 17500 | 19583,333 |
| Variance | 0 | 946969,7 | Variance | 0 | 946969,7 |
| Observations | 4 | 12 | Observations | 4 | 12 |
| df | 3 | 11 | Hypothesised Mean Difference | 0 | |
| F | 0 | df | 11 | ||
| P(F<=f) one-tail | 0 | t Stat | -7,4161985 | ||
| F Critical one-tail | 0,1141118 | P(T<=t) one-tail | 6,663*10-06 | ||
| t Critical one-tail | 1,7958848 | ||||
| P(T<=t) two-tail | 1,333*10-05 | ||||
| t Critical two-tail | 2,2009852 | ||||
Table 14.
Variance analysis (F-test) and mean comparison (t-test) between the printed (coated) knitted fabrics with different thickeners, commercial (KPc) and aloe (KPa).
Table 14.
Variance analysis (F-test) and mean comparison (t-test) between the printed (coated) knitted fabrics with different thickeners, commercial (KPc) and aloe (KPa).
| F-Test Two-Sample for Variances | t-Test: Two-Sample Assuming Equal Variances | ||||
| KPc | KPa | KPc | KPa | ||
| Mean | 18958,33333 | 19583,333 | Mean | 18958,33333 | 19583,333 |
| Variance | 1657196,97 | 946969,7 | Variance | 1657196,97 | 946969,7 |
| Observations | 12 | 12 | Observations | 12 | 12 |
| df | 11 | 11 | Pooled Variance | 1302083,333 | |
| F | 1,75 | Hypothesised Mean Difference | 0 | ||
| P(F<=f) one-tail | 0,183657775 | df | 22 | ||
| F Critical one-tail | 2,81793047 | t Stat | -1,341640786 | ||
| P(T<=t) one-tail | 0,096698958 | ||||
| t Critical one-tail | 1,717144374 | ||||
| P(T<=t) two-tail | 0,193397917 | ||||
| t Critical two-tail | 2,073873068 | ||||
Table 15.
Variance analysis (F-test) and mean comparison (t-test) of control (untreated, WCtrl) and printed (coated, WP) fabrics on woven fabrics, irrespective of the thickener.
Table 15.
Variance analysis (F-test) and mean comparison (t-test) of control (untreated, WCtrl) and printed (coated, WP) fabrics on woven fabrics, irrespective of the thickener.
| F-Test Two-Sample for Variances | t-Test: Two-Sample Assuming Unequal Variances | ||||
| WCtrl | WP | WCtrl | WP | ||
| Mean | 20000 | 23541,667 | Mean | 20000 | 23541,667 |
| Variance | 0 | 5389492,8 | Variance | 0 | 5389492,8 |
| Observations | 4 | 24 | Observations | 4 | 24 |
| df | 3 | 23 | Hypothesised Mean Difference | 0 | |
| F | 0 | df | 23 | ||
| P(F<=f) one-tail | 0 | t Stat | -7,4737636 | ||
| F Critical one-tail | 0,1156974 | P(T<=t) one-tail | 6,753*10-08 | ||
| t Critical one-tail | 1,7138715 | ||||
| P(T<=t) two-tail | 1,351*10-07 | ||||
| t Critical two-tail | 2,0686576 | ||||
Table 16.
Variance analysis (F-test) and mean comparison (t-test) of control (untreated, WCtrl) and printed (coated, WPc) fabrics with commercial thickener on woven fabrics.
Table 16.
Variance analysis (F-test) and mean comparison (t-test) of control (untreated, WCtrl) and printed (coated, WPc) fabrics with commercial thickener on woven fabrics.
| F-Test Two-Sample for Variances | t-Test: Two-Sample Assuming Unequal Variances | ||||
| WCtrl | WPc | WCtrl | WPc | ||
| Mean | 20000 | 22916,6667 | Mean | 20000 | 22916,6667 |
| Variance | 0 | 6628787,88 | Variance | 0 | 6628787,88 |
| Observations | 4 | 12 | Observations | 4 | 12 |
| df | 3 | 11 | Hypothesised Mean Difference | 0 | |
| F | 0 | df | 11 | ||
| P(F<=f) one-tail | 0 | t Stat | -3,9242834 | ||
| F Critical one-tail | 0,114111836 | P(T<=t) one-tail | 0,00118764 | ||
| t Critical one-tail | 1,79588482 | ||||
| P(T<=t) two-tail | 0,00237529 | ||||
| t Critical two-tail | 2,20098516 | ||||
Table 17.
Variance analysis (F-test) and mean comparison (t-test) of control (untreated, WCtrl) and printed (coated, WPa) fabrics with aloe thickener on woven fabrics.
Table 17.
Variance analysis (F-test) and mean comparison (t-test) of control (untreated, WCtrl) and printed (coated, WPa) fabrics with aloe thickener on woven fabrics.
| F-Test Two-Sample for Variances | t-Test: Two-Sample Assuming Unequal Variances | ||||
| WCtrl | WPa | WCtrl | WPa | ||
| Mean | 20000 | 24166,6667 | Mean | 20000 | 24166,6667 |
| Variance | 0 | 3787878,79 | Variance | 0 | 3787878,79 |
| Observations | 4 | 12 | Observations | 4 | 12 |
| df | 3 | 11 | Hypothesised Mean Difference | 0 | |
| F | 0 | df | 11 | ||
| P(F<=f) one-tail | 0 | t Stat | -7,41619849 | ||
| F Critical one-tail | 0,11411184 | P(T<=t) one-tail | 6,6625*10-06 | ||
| t Critical one-tail | 1,79588482 | ||||
| P(T<=t) two-tail | 1,333*10-05 | ||||
| t Critical two-tail | 2,20098516 | ||||
Table 18.
Variance analysis (F-test) and mean comparison (t-test) between the printed (coated) woven fabrics with different thickeners, commercial and aloe (WPc) and aloe (WPa).
Table 18.
Variance analysis (F-test) and mean comparison (t-test) between the printed (coated) woven fabrics with different thickeners, commercial and aloe (WPc) and aloe (WPa).
| F-Test Two-Sample for Variances | t-Test: Two-Sample Assuming Unequal Variances | ||||
| WCtrl | WPc | WCtrl | WPc | ||
| Mean | 20000 | 22916,6667 | Mean | 20000 | 22916,6667 |
| Variance | 0 | 6628787,88 | Variance | 0 | 6628787,88 |
| Observations | 4 | 12 | Observations | 4 | 12 |
| df | 3 | 11 | Hypothesised Mean Difference | 0 | |
| F | 0 | df | 11 | ||
| P(F<=f) one-tail | 0 | t Stat | -3,9242834 | ||
| F Critical one-tail | 0,114111836 | P(T<=t) one-tail | 0,00118764 | ||
| t Critical one-tail | 1,79588482 | ||||
| P(T<=t) two-tail | 0,00237529 | ||||
| t Critical two-tail | 2,20098516 | ||||
The following abbreviations have been used in Tables 11 to 18
- KCtrl: Knitted Substrate Control (untreated)
- KP: Knitted Substrate Printed
- KPc: Knitted Substrate Printed with commercial thickener
- Kpa: Knitted Substrate Printed with Aloe thickener
- WCtrl: Woven Substrate Control (untreated)
- WP: Woven Substrate Printed
- WPc: Woven Substrate Printed with commercial thickener
- WPa: Woven Substrate Printed with Aloe thickener
The structure, with reduced resistance to deformation, flexes, stretches, and bends easier, which enhances softness. The latter can be attributed to a secondary effect from the water content of the hygroscopic character of aloe vera [22].
5. Conclusions
The findings showed that the abrasion resistance of printed fabrics is improved compared to untreated fabrics, and this is reflected in the visual assessment of surface appearance, cycles to failure, and percentage mass loss. Aloe vera can be used as a thickening agent in the printing paste, promoting a sustainable textile solution substituting the commercial thickeners with equally or marginally superior properties, considering the secondary antimicrobial behaviour, marginal gains on abrasion resistance and handle but mainly in the sustainability achieved. Aloe vera thickener printed cotton fabrics exhibited longer life to the untreated with an increase in wear resistance during abrasion and did not differ statistically from the commercial thickener printed fabrics indicating no deficiencies in abrasion resistance performance while promoting the sustainability of the printing paste concerning thickener composition. An increase in abrasion resistance of aloe vera-treated silk has been reported, as well as a decrease in flexural rigidity, which means a softer and more pleasant fabric [48].
Author Contributions
Conceptualisation, M.K. and E.G.A.; methodology, M.K., M.Z. and A.K.; investigation, M.K., M.Z. and A.K.; data curation, M.K. and A.S.; writing—original draft preparation M.K. and M.Z.; writing—review and editing, M.K., A.K. and EGA; visualisation, M.K. and E.G.A.; supervision, M.K.; project administration, M.K.; funding acquisition, M.K. All authors have read and agreed to the published version of the manuscript.
Funding
This research received no external funding.
Institutional Review Board Statement
Not applicable.
Informed Consent Statement
Not applicable.
Data Availability Statement
Not applicable.
Acknowledgments
The authors thank Maria Zarkogianni for contributing to the investigation stage.
Conflicts of Interest
The authors declare no conflict of interest. No external funders were present to take any role in the design of the study; in the collection, analysis, or interpretation of data; in the writing of the manuscript; or in the decision to publish the results.
Appendix A
Figure A1.
The abraded fabric under SEM analysis. (a) low magnification; (b) and high magnification, at 5000 cycles.
Figure A1.
The abraded fabric under SEM analysis. (a) low magnification; (b) and high magnification, at 5000 cycles.
References
- United Nations UN Launches Drive to Highlight Environmental Cost of Staying Fashionable Available online: https://news.un.org/en/story/2019/03/1035161 (accessed on 20 May 2024).
- Natural Resources Defense Council Encourage Textile Manufacturers to Reduce Pollution Available online: 7- https://www.nrdc.org/issues/encourage-textile-manufacturers-reduce-pollution (accessed on 20 April 2024).
- Husaini, S.N.; Zaidi, J.H.; Matiullah; Akram, M. Comprehensive Evaluation of the Effluents Eluted from Different Processes of the Textile Industry and Its Immobilization to Trim down the Environmental Pollution. J Radioanal Nucl Chem 2011, 288, 903–910. [CrossRef]
- Sabanoglu, T. Top Textile Exporting Countries Worldwide 2022 2023.
- Karypidis, M.; Savvidis, G. The Effect of Wear and Softeners on the Sewability of Woven Structures. IJSR 2020, 9, 919–923. [CrossRef]
- Booth, J.E. Principles of Textile Testing: An Introduction to Physical Methods of Testing Textile Fibres, Yarns and Fabrics; 3rd ed.; Heywood Books: London, 1968; ISBN 0-592-06325-9.
- Warren, L. These 6 Brands Offer Textile Recycling Programs to Keep Your Clothes Out of Landfills Available online: https://sourcingjournal.com/denim/denim-brands/levis-madewell-north-face-zara-reformation-textile-recycling-denim-179386 (accessed on 20 April 2024).
- Saville, B.P. Serviceability. In Physical Testing of Textiles; Elsevier, 1999; pp. 184–208 ISBN 978-1-85573-367-1.
- Ibrahim, W.; Sarwar, Z.; Abid, S.; Munir, U.; Azeem, A. Aloe Vera Leaf Gel Extract for Antibacterial and Softness Properties of Cotton. J Textile Sci Eng 2017, 07. [CrossRef]
- Schindler, W.D.; Hauser, P.J. Antimicrobial Finishes. In Chemical Finishing of Textiles; Elsevier, 2004; pp. 165–174 ISBN 978-1-85573-905-5.
- Scott, A. Cutting Out Textile Pollution. Chem. Eng. News Archive 2015, 93, 18–19. [CrossRef]
- US Census Bureau, & Statista Commercial Screen Printing Revenue in the U.S. 2012-2022 (in Million U.S. Dollars) 2018.
- Khattab, T.A.; Abou-Yousef, H.; Kamel, S. Photoluminescent Spray-Coated Paper Sheet: Write-in-the-Dark. Carbohydrate Polymers 2018, 200, 154–161. [CrossRef]
- Khattab, T.A.; Fouda, M.M.G.; Abdelrahman, M.S.; Othman, S.I.; Bin-Jumah, M.; Alqaraawi, M.A.; Al Fassam, H.; Allam, A.A. Development of Illuminant Glow-in-the-Dark Cotton Fabric Coated by Luminescent Composite with Antimicrobial Activity and Ultraviolet Protection. J Fluoresc 2019, 29, 703–710. [CrossRef]
- Khattab, T.A.; Fouda, M.M.G.; Abdelrahman, M.S.; Othman, S.I.; Bin-Jumah, M.; Alqaraawi, M.A.; Al Fassam, H.; Allam, A.A. Co-Encapsulation of Enzyme and Tricyanofuran Hydrazone into Alginate Microcapsules Incorporated onto Cotton Fabric as a Biosensor for Colorimetric Recognition of Urea. Reactive and Functional Polymers 2019, 142, 199–206. [CrossRef]
- Khattab, T.A.; Haggag, K.M.; Elnagdi, M.H.; Abdelrahman, A.A.; Abdelmoez Aly, S. Microwave-Assisted Synthesis of Arylazoaminopyrazoles as Disperse Dyes for Textile Printing. Zeitschrift anorg allge chemie 2016, 642, 766–772. [CrossRef]
- Khattab, TawfikA.; Elnagdi, MohamedH.; Haggaga, KarimaM.; Abdelrahmana, AmalA.; Abdelmoez Aly, S. Green Synthesis, Printing Performance, and Antibacterial Activity of Disperse Dyes Incorporating Arylazopyrazolopyrimidines. aatcc j res 2017, 4, 1–8. [CrossRef]
- Wang, Q.; Sun, J.; Yao, Q.; Ji, C.; Liu, J.; Zhu, Q. 3D Printing with Cellulose Materials. Cellulose 2018, 25, 4275–4301. [CrossRef]
- Abdelrahman, M.S.; Nassar, S.H.; Mashaly, H.; Mahmoud, S.; Maamoun, D.; Khattab, T.A. Polymerization Products of Lactic Acid as Synthetic Thickening Agents for Textile Printing. Journal of Molecular Structure 2020, 1203, 127421. [CrossRef]
- Luo, W.; Cai, J.; Zhu, L.; Zhu, X.; Huang, L.; Xu, Z.; Cen, P. Toxic Effects of Acrylic Acid on C Lostridium Propionicum and Isolation of Acrylic Acid-tolerant Mutants for Production of Acrylic Acid. Engineering in Life Sciences 2012, 12, 567–573. [CrossRef]
- Sverdrup, L.E.; Källqvist, T.; Kelley, A.E.; Fürst, C.S.; Hagen, S.B. Comparative Toxicity of Acrylic Acid to Marine and Freshwater Microalgae and the Significance for Environmental Effects Assessments. Chemosphere 2001, 45, 653–658. [CrossRef]
- Soltanizadeh, N.; Mousavinejad, M.S. The Effects of Aloe Vera (Aloe Barbadensis) Coating on the Quality of Shrimp during Cold Storage. J Food Sci Technol 2015, 52, 6647–6654. [CrossRef]
- Javed, S.; Atta-ur-Rahman Aloe Vera Gel in Food, Health Products, and Cosmetics Industry. In Studies in Natural Products Chemistry; Elsevier, 2014; Vol. 41, pp. 261–285 ISBN 978-0-444-63294-4.
- Liontakis, A.; Tzouramani, I. Economic Sustainability of Organic Aloe Vera Farming in Greece under Risk and Uncertainty. Sustainability 2016, 8, 338. [CrossRef]
- Solomou, A.; Germani, R.; Georgakopoulou, M. ECOLOGICAL VALUE, CULTIVATION, UTILIZATION AND COMMERCIALIZATION OF ALOE VERA IN GREECE. THE JAPS 2020, 30. [CrossRef]
- Chelu, M.; Musuc, A.M.; Popa, M.; Calderon Moreno, J. Aloe Vera-Based Hydrogels for Wound Healing: Properties and Therapeutic Effects. Gels 2023, 9, 539. [CrossRef]
- Mondal, Md.I.H.; Saha, J.; Rahman, Md.A. Functional Applications of Aloe Vera on Textiles: A Review. J Polym Environ 2021, 29, 993–1009. [CrossRef]
- Hossen, M.M.; Hossain, M.L.; Mitra, K.; Hossain, B.; Bithi, U.H.; Uddin, M.N. Phytochemicals and In-Vitro Antioxidant Activity Analysis of Aloe Vera by-Products (Skin) in Different Solvent Extract. Journal of Agriculture and Food Research 2022, 10, 100460. [CrossRef]
- Chelu, M.; Musuc, A.M.; Aricov, L.; Ozon, E.A.; Iosageanu, A.; Stefan, L.M.; Prelipcean, A.-M.; Popa, M.; Moreno, J.C. Antibacterial Aloe Vera Based Biocompatible Hydrogel for Use in Dermatological Applications. IJMS 2023, 24, 3893. [CrossRef]
- Maduna, L.; Patnaik, A. A Review of Wound Dressings Treated with Aloe Vera and Its Application on Natural Fabrics. Journal of Natural Fibers 2023, 20, 2190190. [CrossRef]
- Mondal, Md.I.H.; Saha, J. Antimicrobial, UV Resistant and Thermal Comfort Properties of Chitosan- and Aloe Vera-Modified Cotton Woven Fabric. J Polym Environ 2019, 27, 405–420. [CrossRef]
- Hamman, J.H. Composition and Applications of Aloe Vera Leaf Gel. Molecules 2008, 13, 1599–1616. [CrossRef]
- Ni, Y.; Tizard, I.R. Analytical Methodology: The Gel-Analysis of Aloe Pulp and Its Derivatives. In Aloes. The genus Aloe; CRC Press: BocaRaton, 2004; pp. 111–126 ISBN 978-0-429-20414-2.
- El-Zairy, E.M. NEW THICKENING AGENT BASED ON ALOE VERA GEL FOR DISPERSE PRINTING OF POLYESTER. AUTEX Research Journal 2011, 11, 66–70.
- Chauhan, P.; Kumar, A. Development of a Microbial Coating for Cellulosic Surface Using Aloe Vera and Silane. Carbohydrate Polymer Technologies and Applications 2020, 1, 100015. [CrossRef]
- Zarkogianni, M.; Karypidis, M. The Use of Aloe Vera as a Natural Thickening Agent for the Printing of Cotton Fabric with Natural Dyes. IJSR 2019, 8, 147–151. [CrossRef]
- Aslanidou, D.; Karapanagiotis, I. Superhydrophobic, Superoleophobic and Antimicrobial Coatings for the Protection of Silk Textiles. Coatings 2018, 8, 101. [CrossRef]
- Gupta, B. Fundamental Concepts of Friction and Lubrication Affecting Textile Fibers. In Friction in Textile Materials; Elsevier, 2008; pp. 37–66 ISBN 978-1-85573-920-8.
- Arora, A. Effect of Abrasion Resistance on the Woven Fabric and Its Weaves. IJSBAR 2020, 50, 9–19.
- Kokol, V.; Vivod, V.; Peršin, Z.; Kamppuri, T.; Dobnik-Dubrovski, P. Screen-Printing of Microfibrillated Cellulose for an Improved Moisture Management, Strength and Abrasion Resistant Properties of Flame-Resistant Fabrics. Cellulose 2021, 28, 6663–6678. [CrossRef]
- Seyam, A.M. Developments in Jacquard Woven Fabrics. In Specialist Yarn and Fabric Structures; Elsevier, 2011; pp. 223–263 ISBN 978-1-84569-757-0.
- Kubra, K.; Topalbekiroglu, M. Influence of Fabric Pattern on the Abrasion Resistance Property of Woven Fabrics. Fibres & Textiles in Eastern Europe 2008, 16, 54–56.
- Backer, S. The Relationship Between the Structural Geometry of a Textile Fabric and Its Physical Properties: I: Literature Review. Textile Research Journal 1948, 18, 650–658. [CrossRef]
- Abdullah, I.; Blackburn, R.S.; Russell, S.J.; Taylor, J. Abrasion Phenomena in Twill Tencel Fabric. J of Applied Polymer Sci 2006, 102, 1391–1398. [CrossRef]
- Karypidis, M.; Wilding, M.A.; Carr, C.M.; Lewis, D.M. The Effect of Crosslinking Agents and Reactive Dyes on the Fibrillation of Lyocell. AATCC Magazine 2001, 1, 40–44.
- Yadav, S.; Tiwari, K.S.; Gupta, C.; Tiwari, M.K.; Khan, A.; Sonkar, S.P. A Brief Review on Natural Dyes, Pigments: Recent Advances and Future Perspectives. Results in Chemistry 2023, 5, 100733. [CrossRef]
- Minjares-Fuentes, R.; Femenia, A.; Comas-Serra, F.; Rosselló, C.; Rodríguez-González, V.M.; González-Laredo, R.F.; Gallegos-Infante, J.A.; Medina-Torres, L. Effect of Different Drying Procedures on Physicochemical Properties and Flow Behavior of Aloe Vera (Aloe Barbadensis Miller) Gel. LWT 2016, 74, 378–386. [CrossRef]
- Nadiger, V.G.; Shukla, S.R. Antimicrobial Activity of Silk Treated with Aloe-Vera. Fibers Polym 2015, 16, 1012–1019. [CrossRef]
Figure 1.
Experimental set-up of . (a) abrasion resistance on Martindale abrasion apparatus, (b) microscope and (c) test specimen failing point.
Figure 1.
Experimental set-up of . (a) abrasion resistance on Martindale abrasion apparatus, (b) microscope and (c) test specimen failing point.
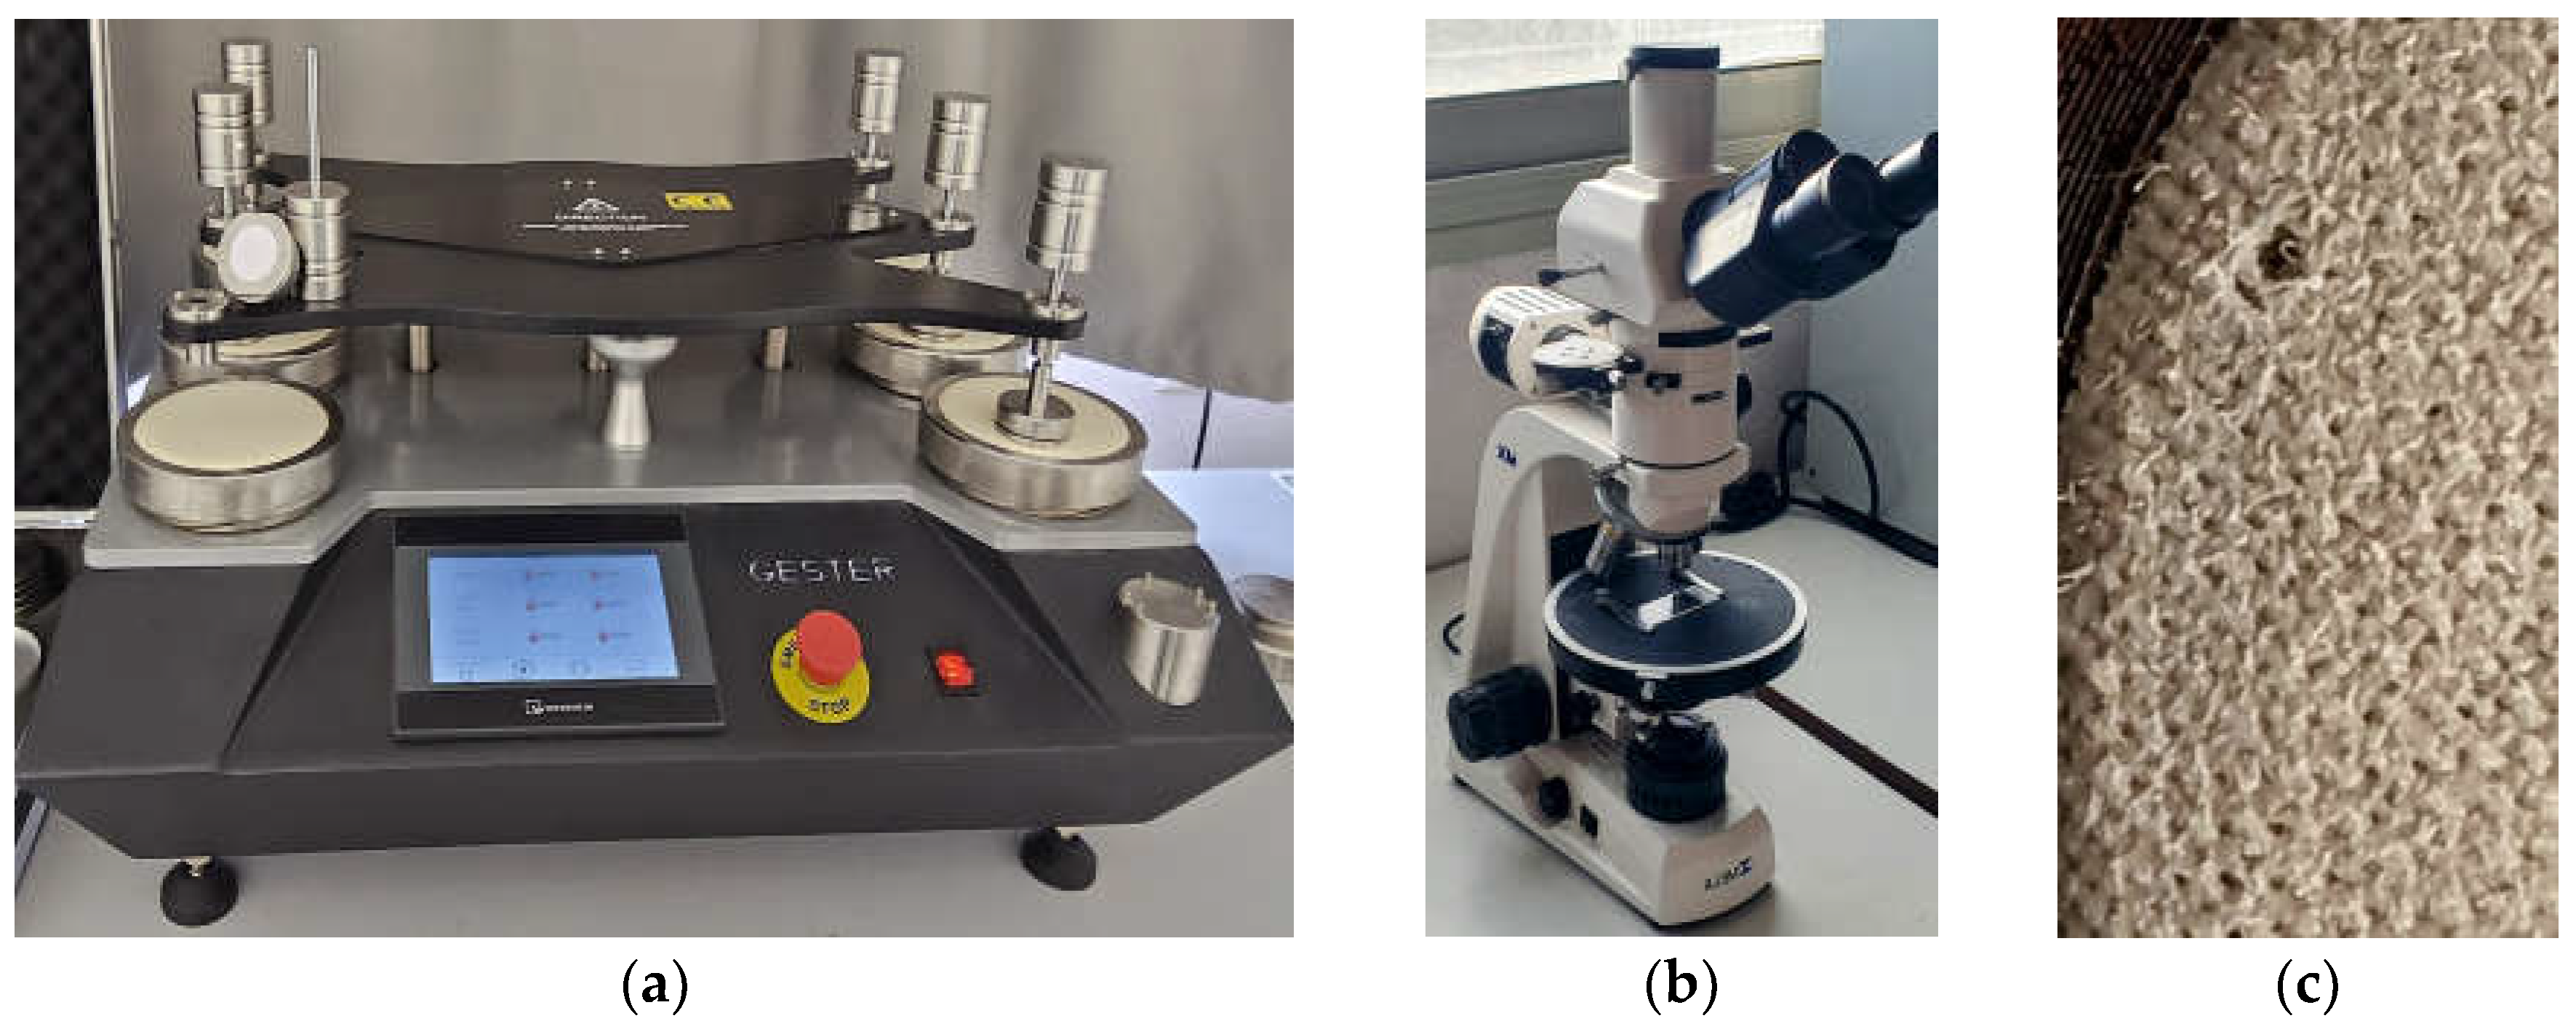
Figure 2.
Abrasion resistance cycles to failure for knitted fabric.
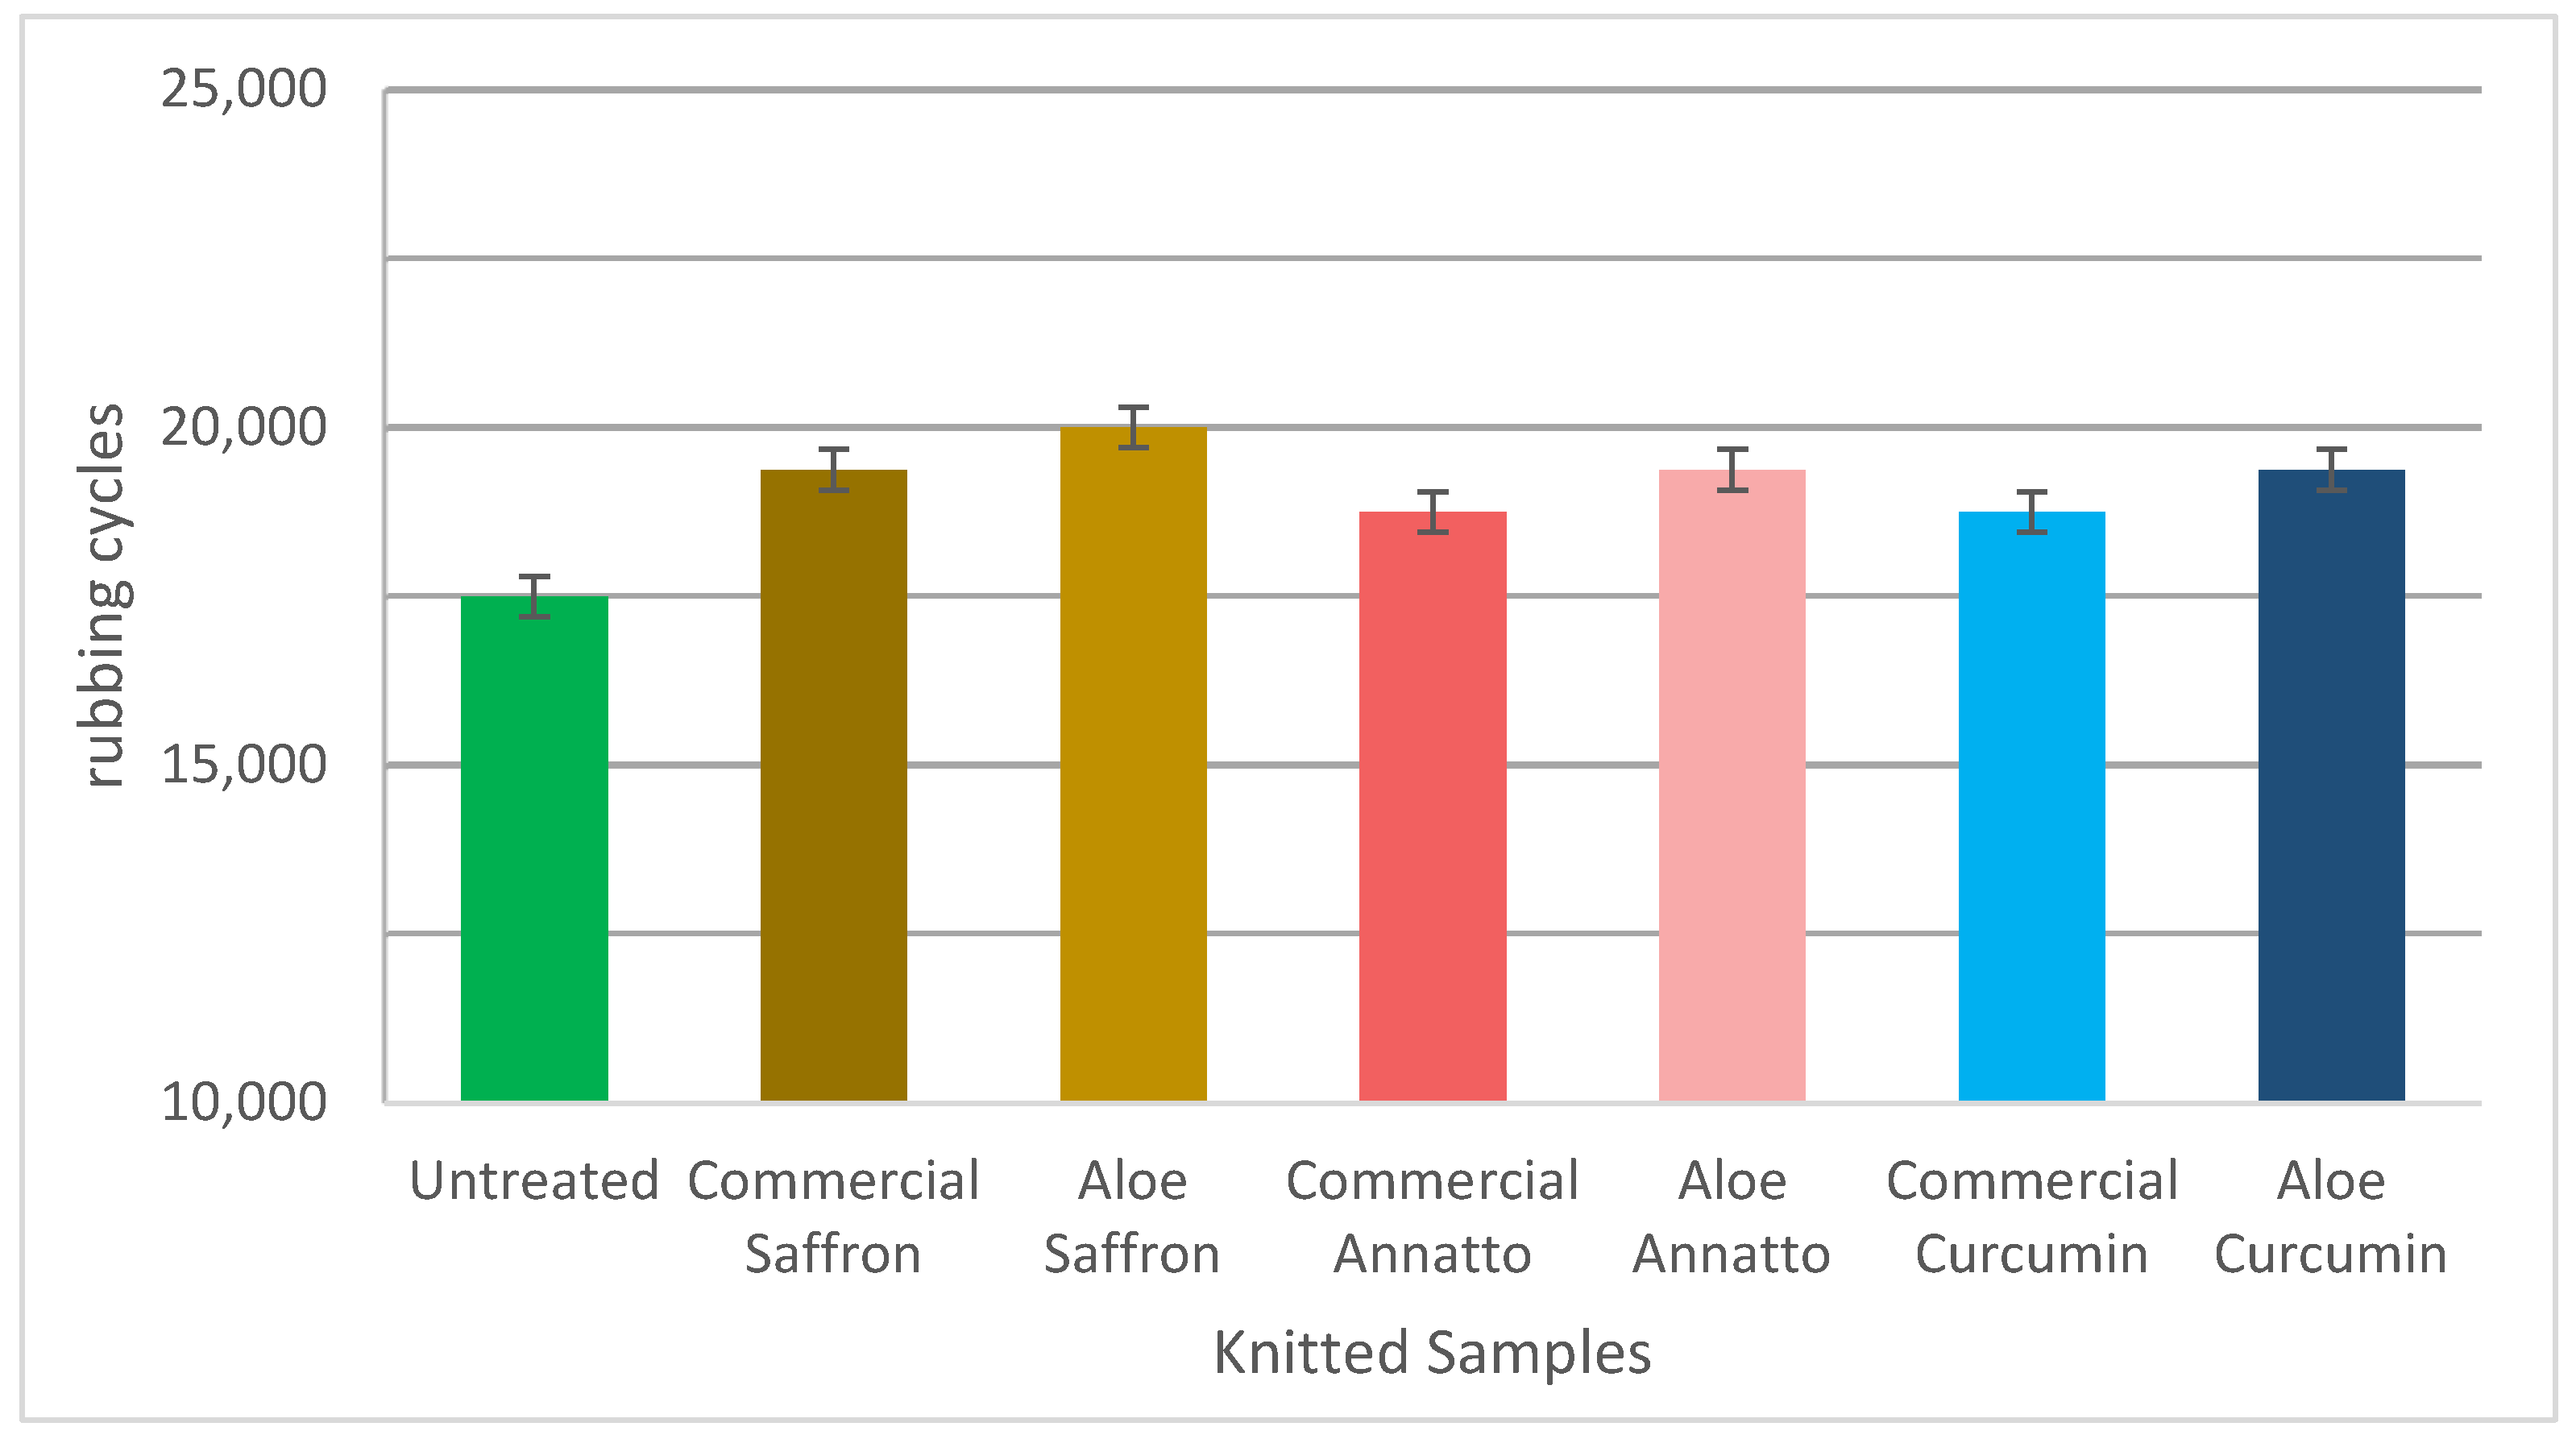
Figure 3.
Abrasion resistance cycles to failure for woven fabric.
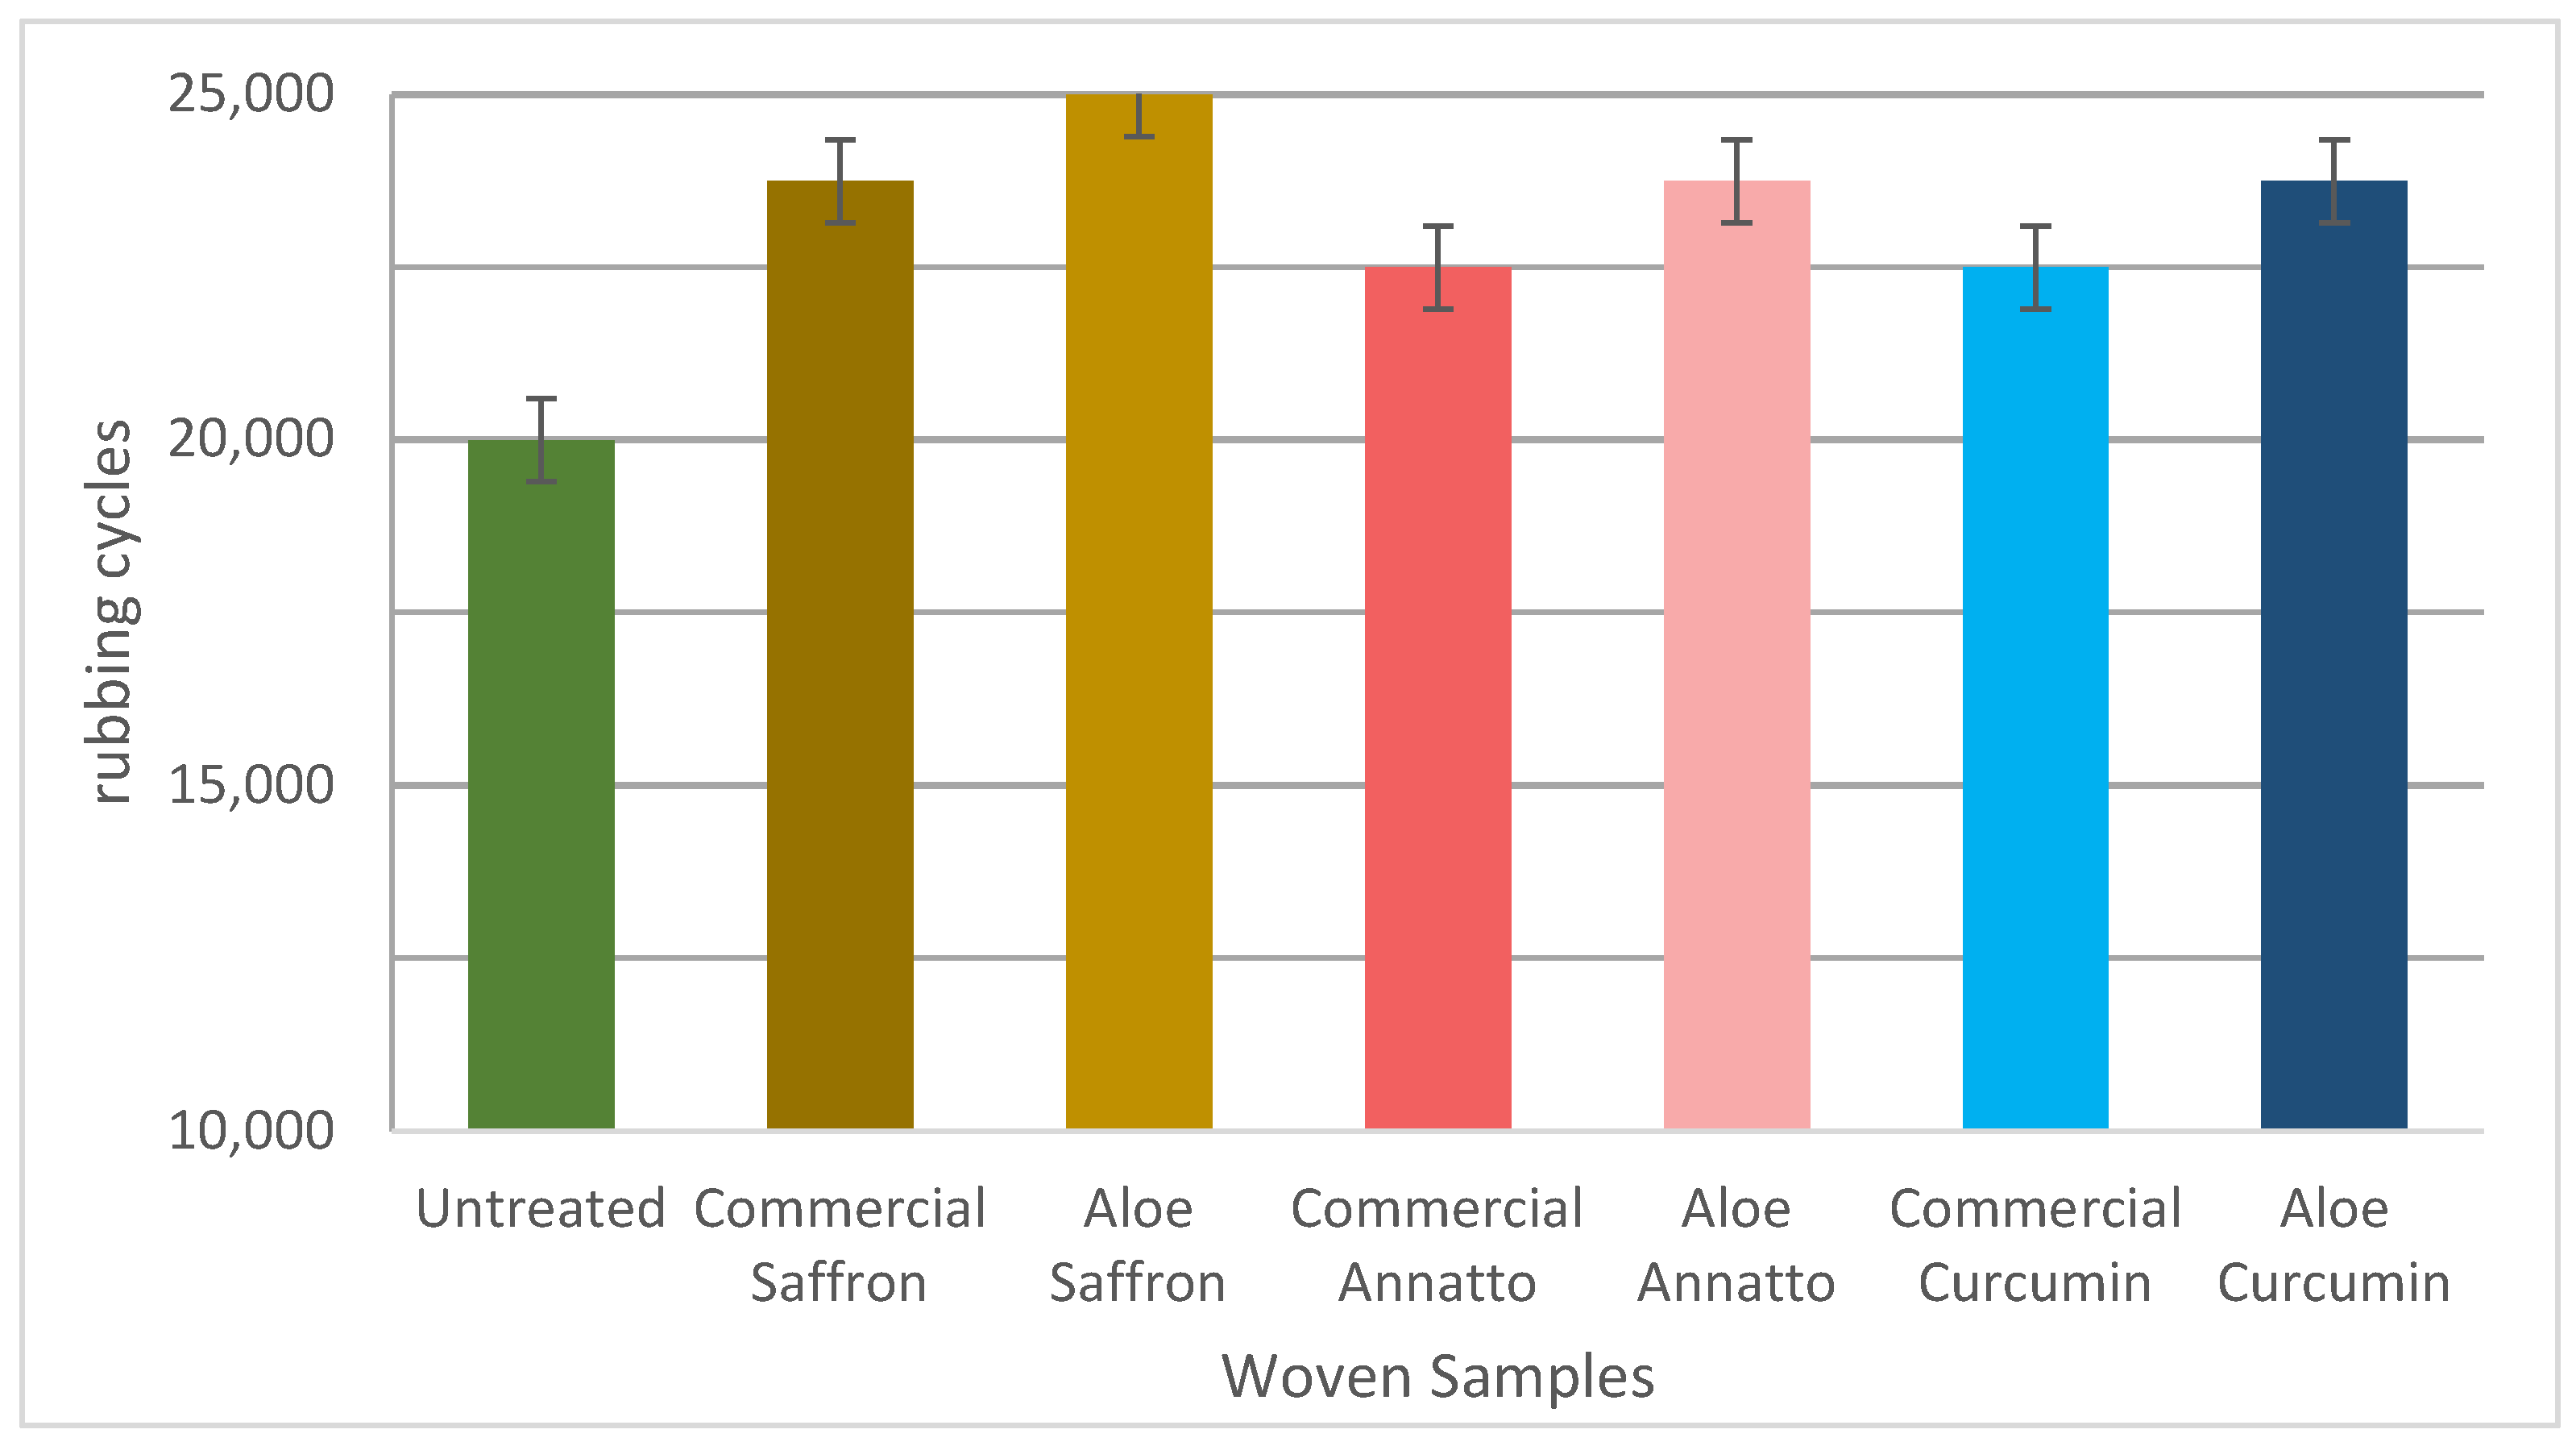
Figure 4.
Percentage mass loss due to abrasion for knitted fabric.
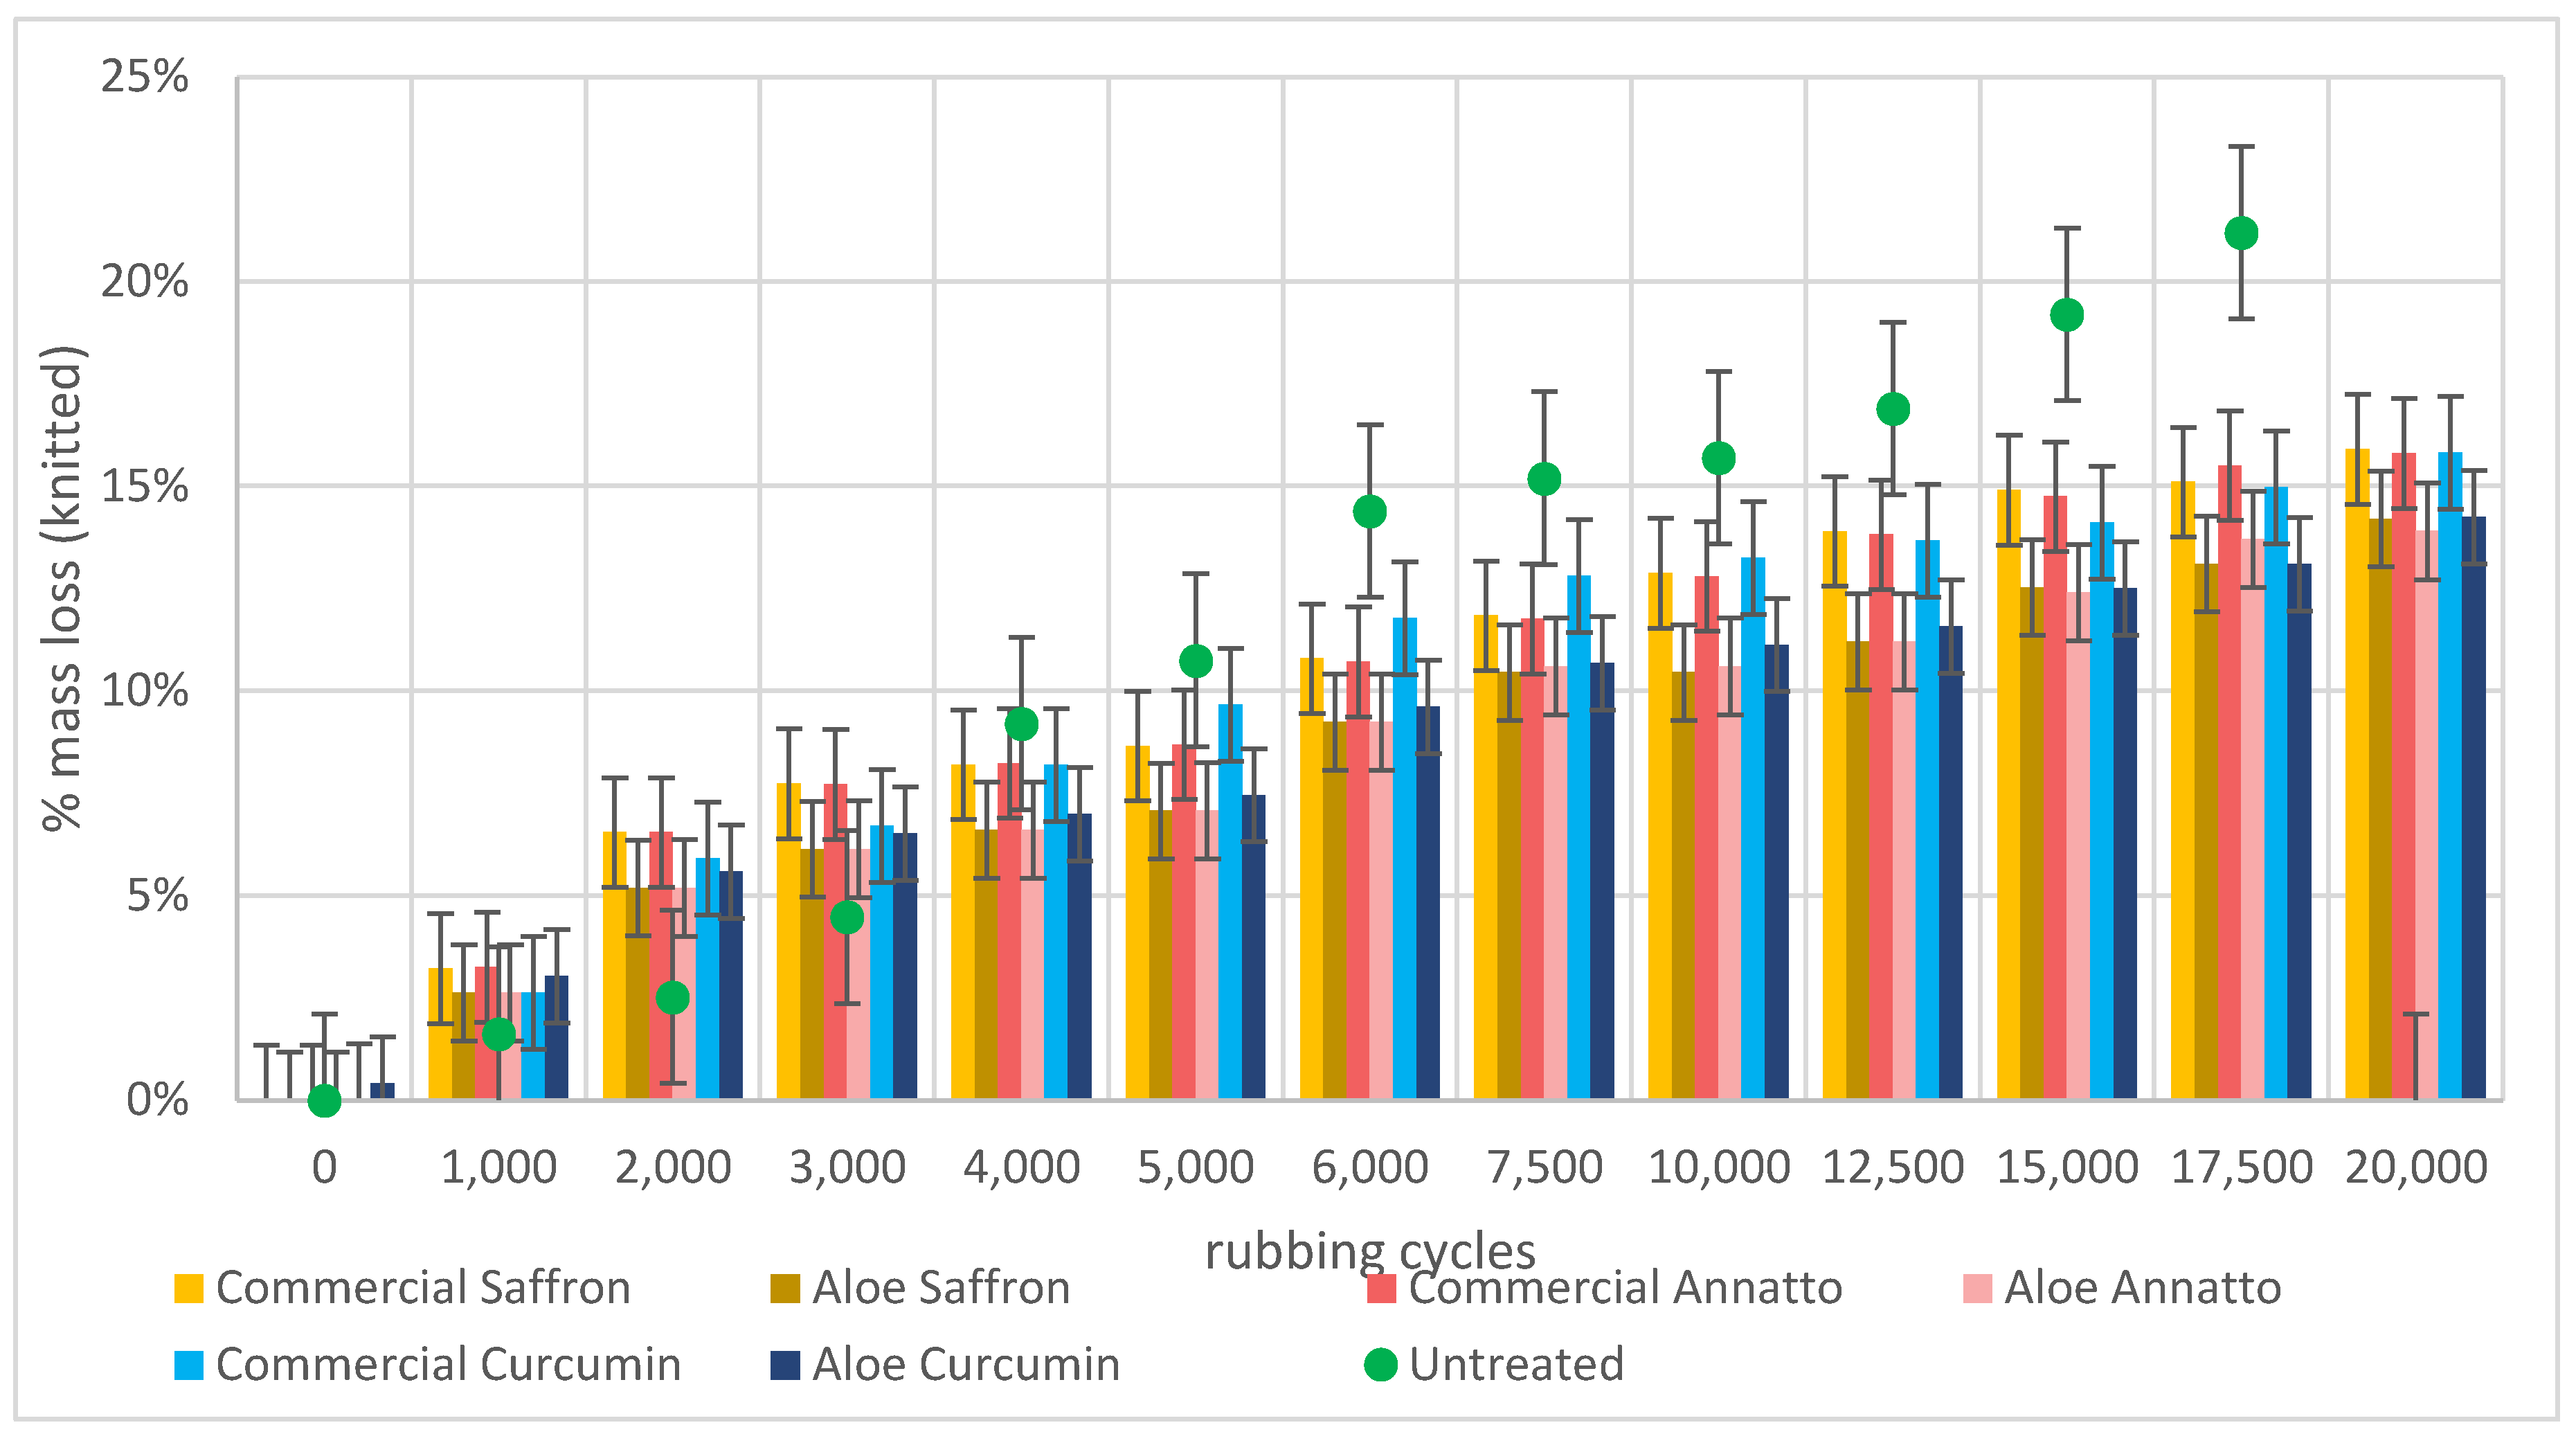
Figure 5.
Percentage mass loss due to abrasion for woven fabric.
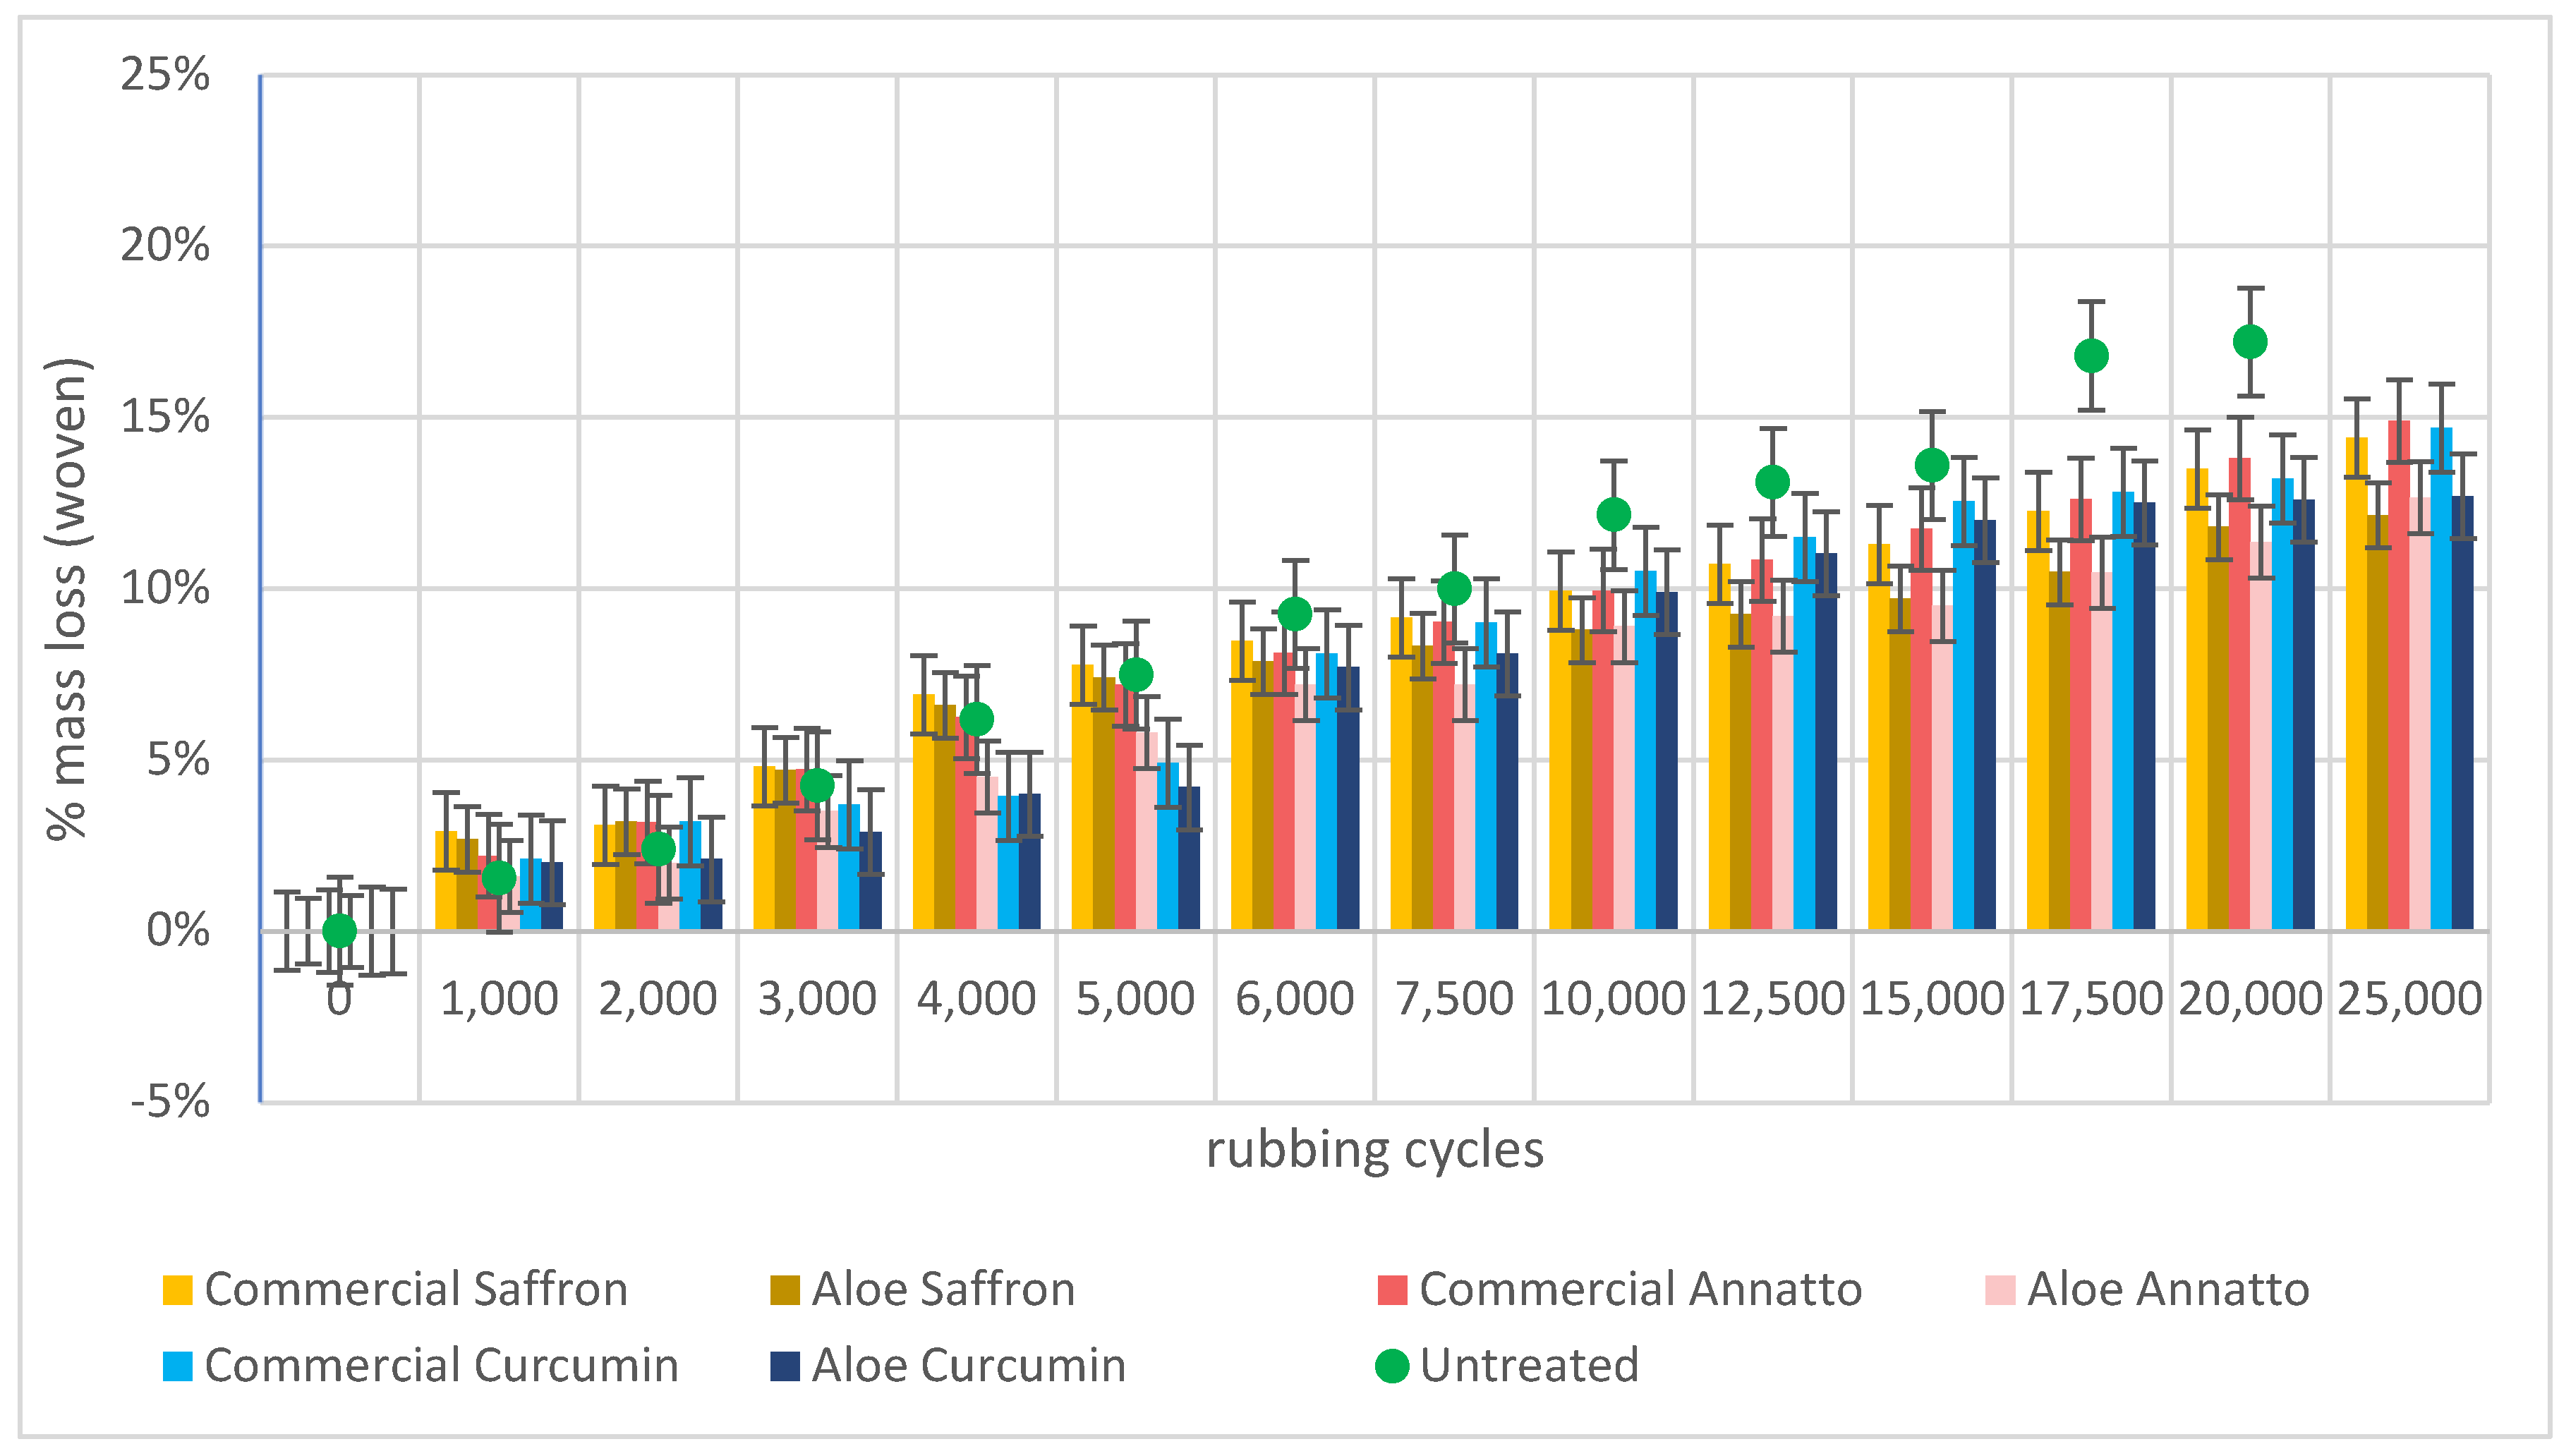
Figure 6.
Surface fuzzing of fabric samples comes at a later stage in coated samples. (a) untreated knitted fabric; (b) printed knitted fabric; (c) untreated woven fabric; (d) printed woven fabric.
Figure 6.
Surface fuzzing of fabric samples comes at a later stage in coated samples. (a) untreated knitted fabric; (b) printed knitted fabric; (c) untreated woven fabric; (d) printed woven fabric.
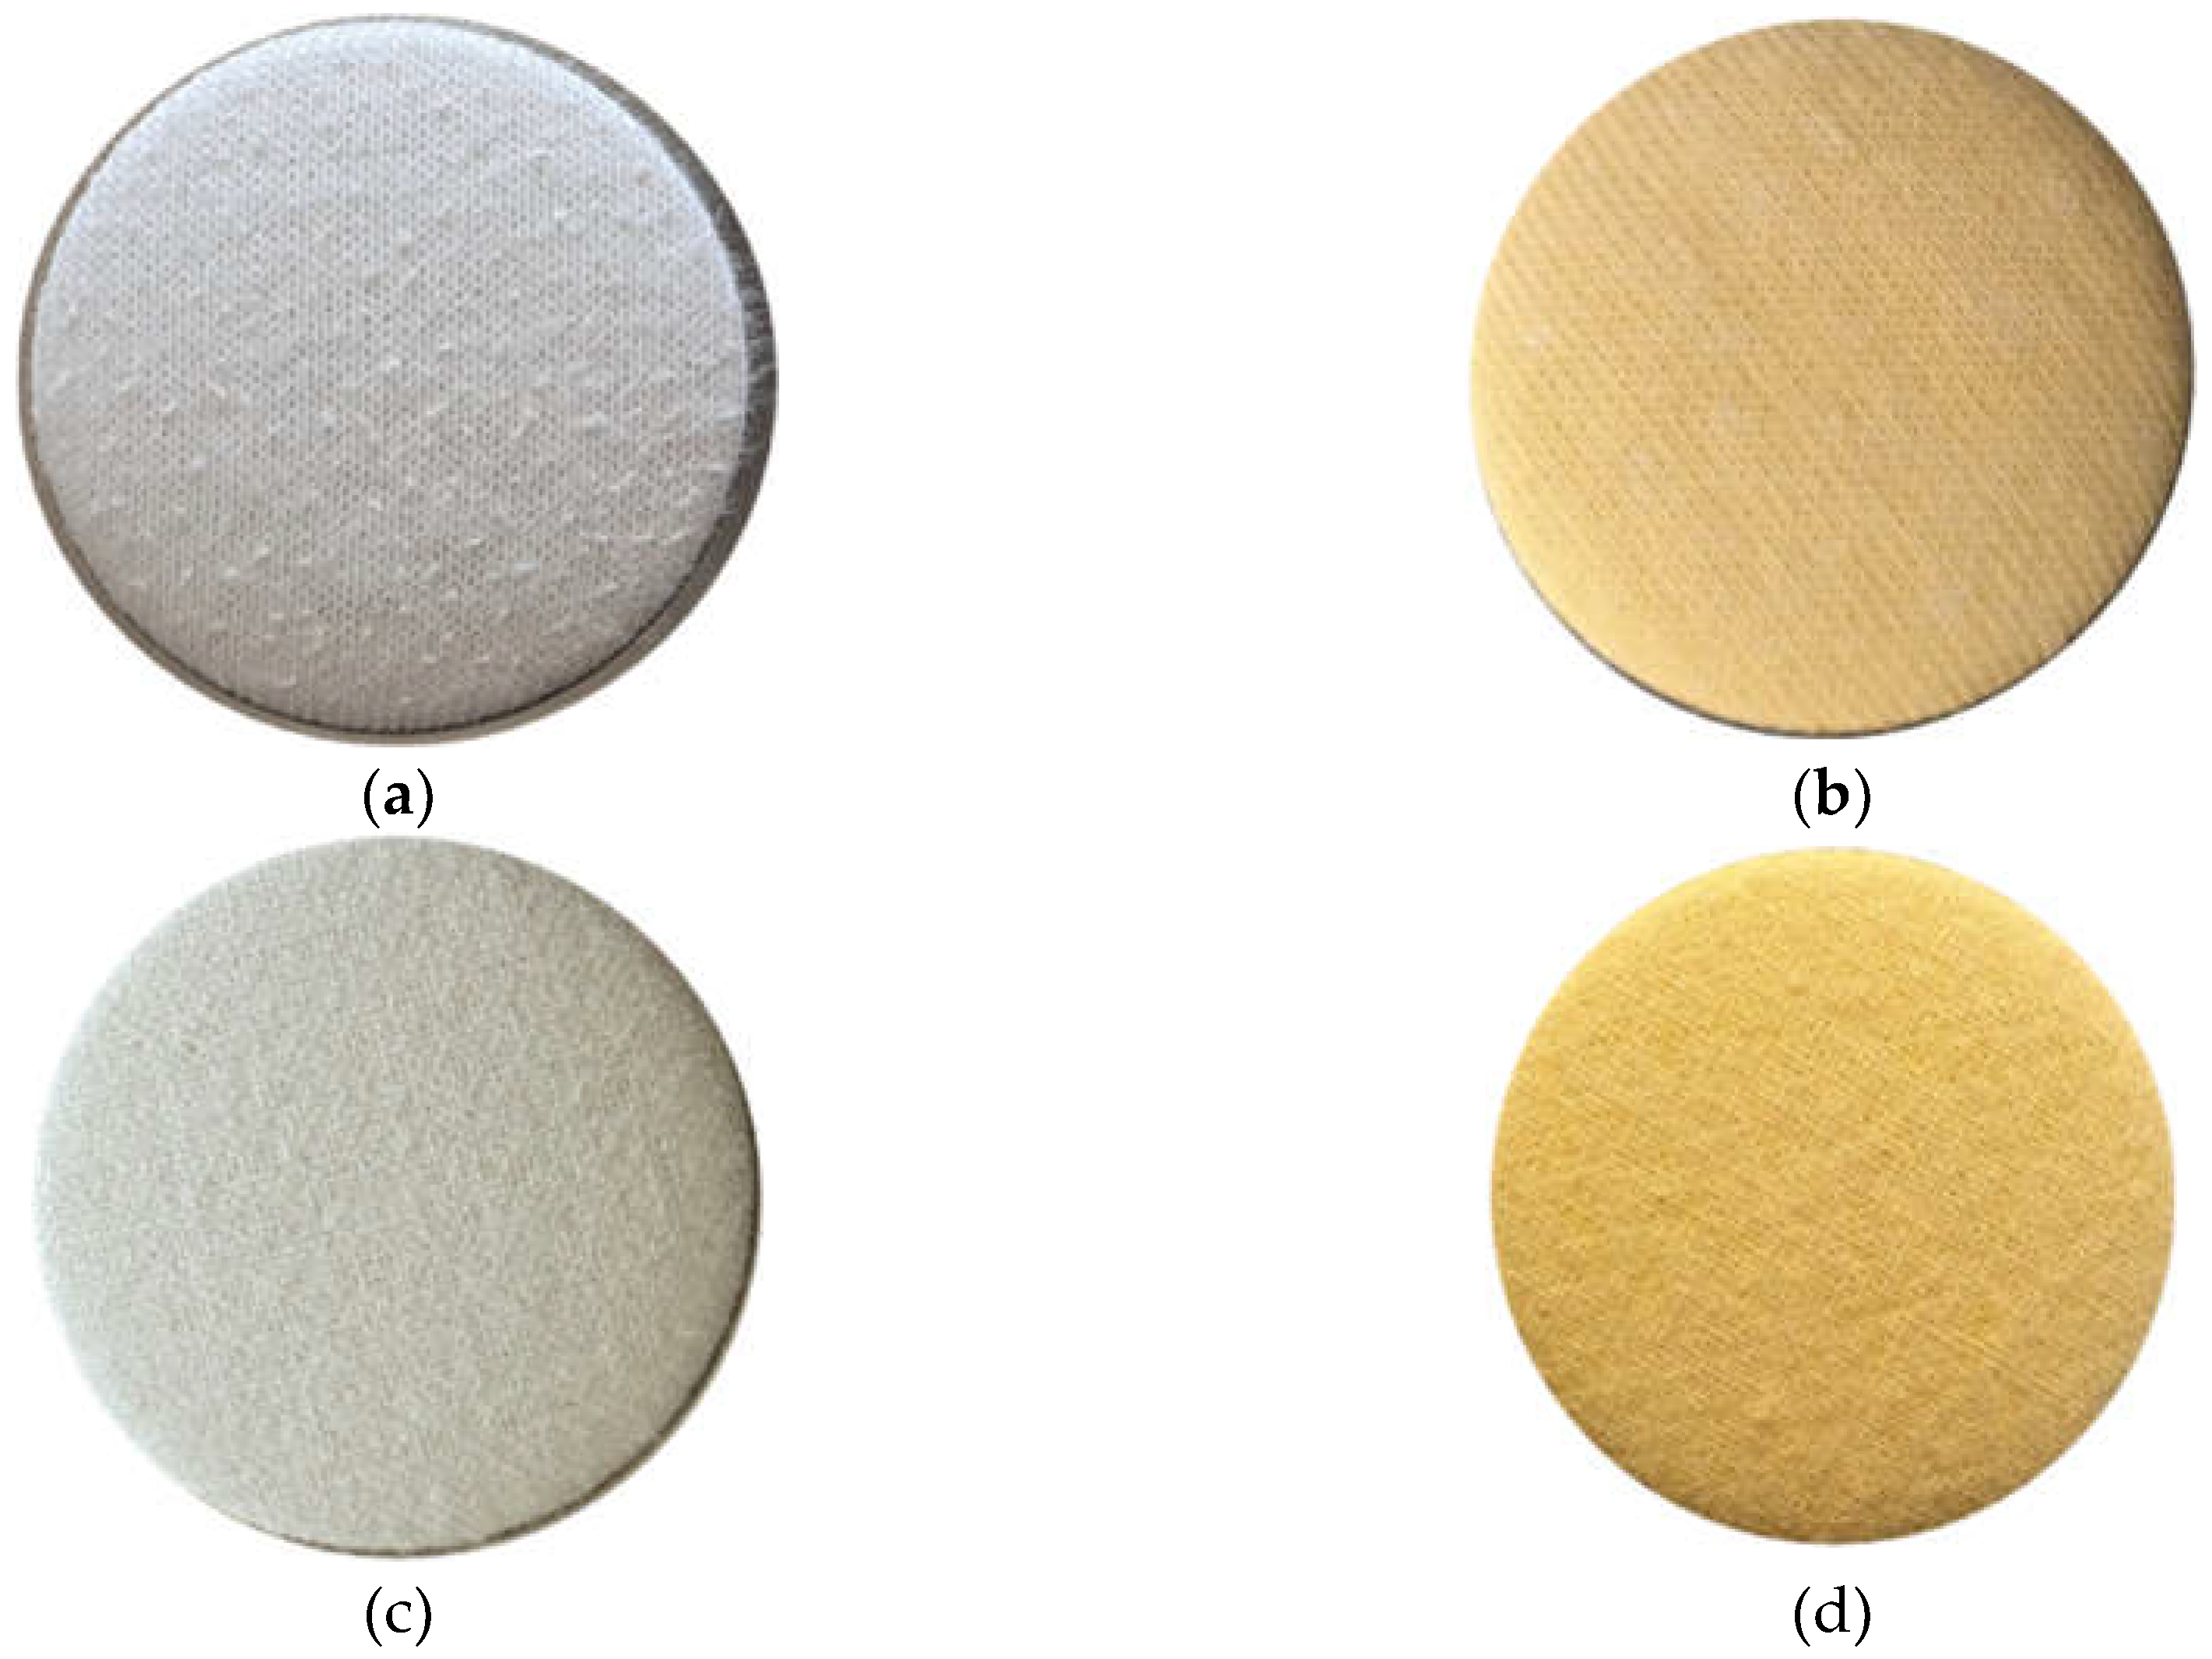
Figure 7.
Longer fibrils protruding from the surface of the knitted (a) untreated samples compared to (b) aloe-treated pastes coated samples, after 6.000 rubbing cycles.
Figure 7.
Longer fibrils protruding from the surface of the knitted (a) untreated samples compared to (b) aloe-treated pastes coated samples, after 6.000 rubbing cycles.
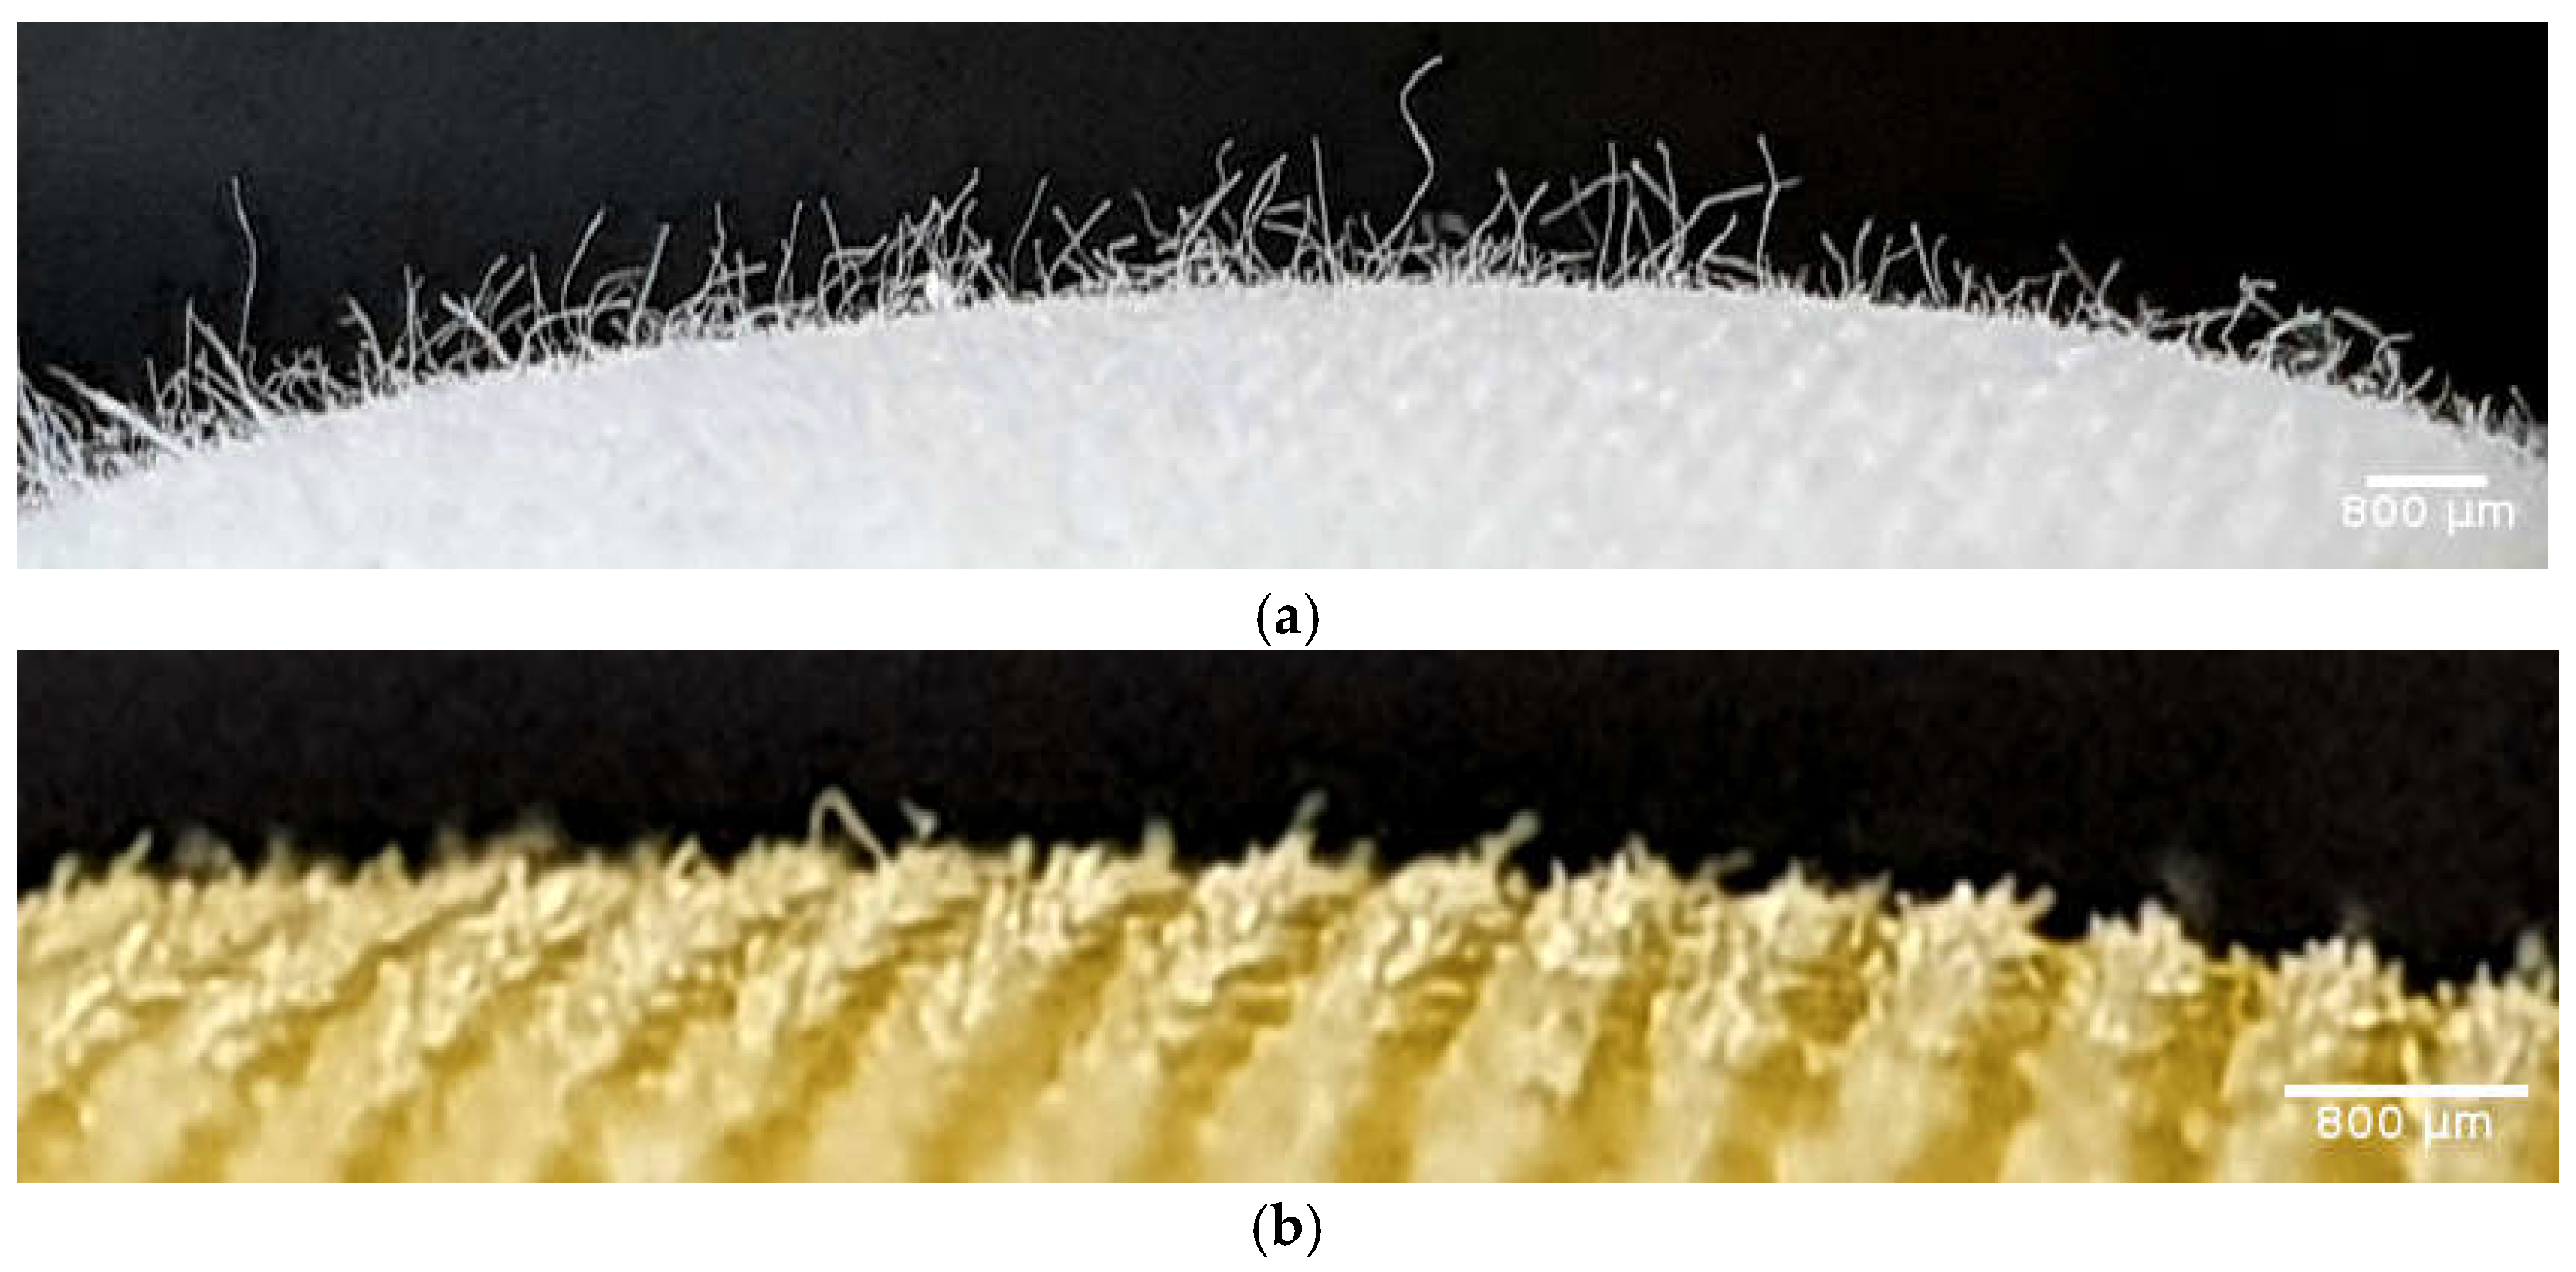
Figure 8.
Abrasion resistance cycles to failure plot of knitted fabric substrates for stepwise-statistical analysis.
Figure 8.
Abrasion resistance cycles to failure plot of knitted fabric substrates for stepwise-statistical analysis.
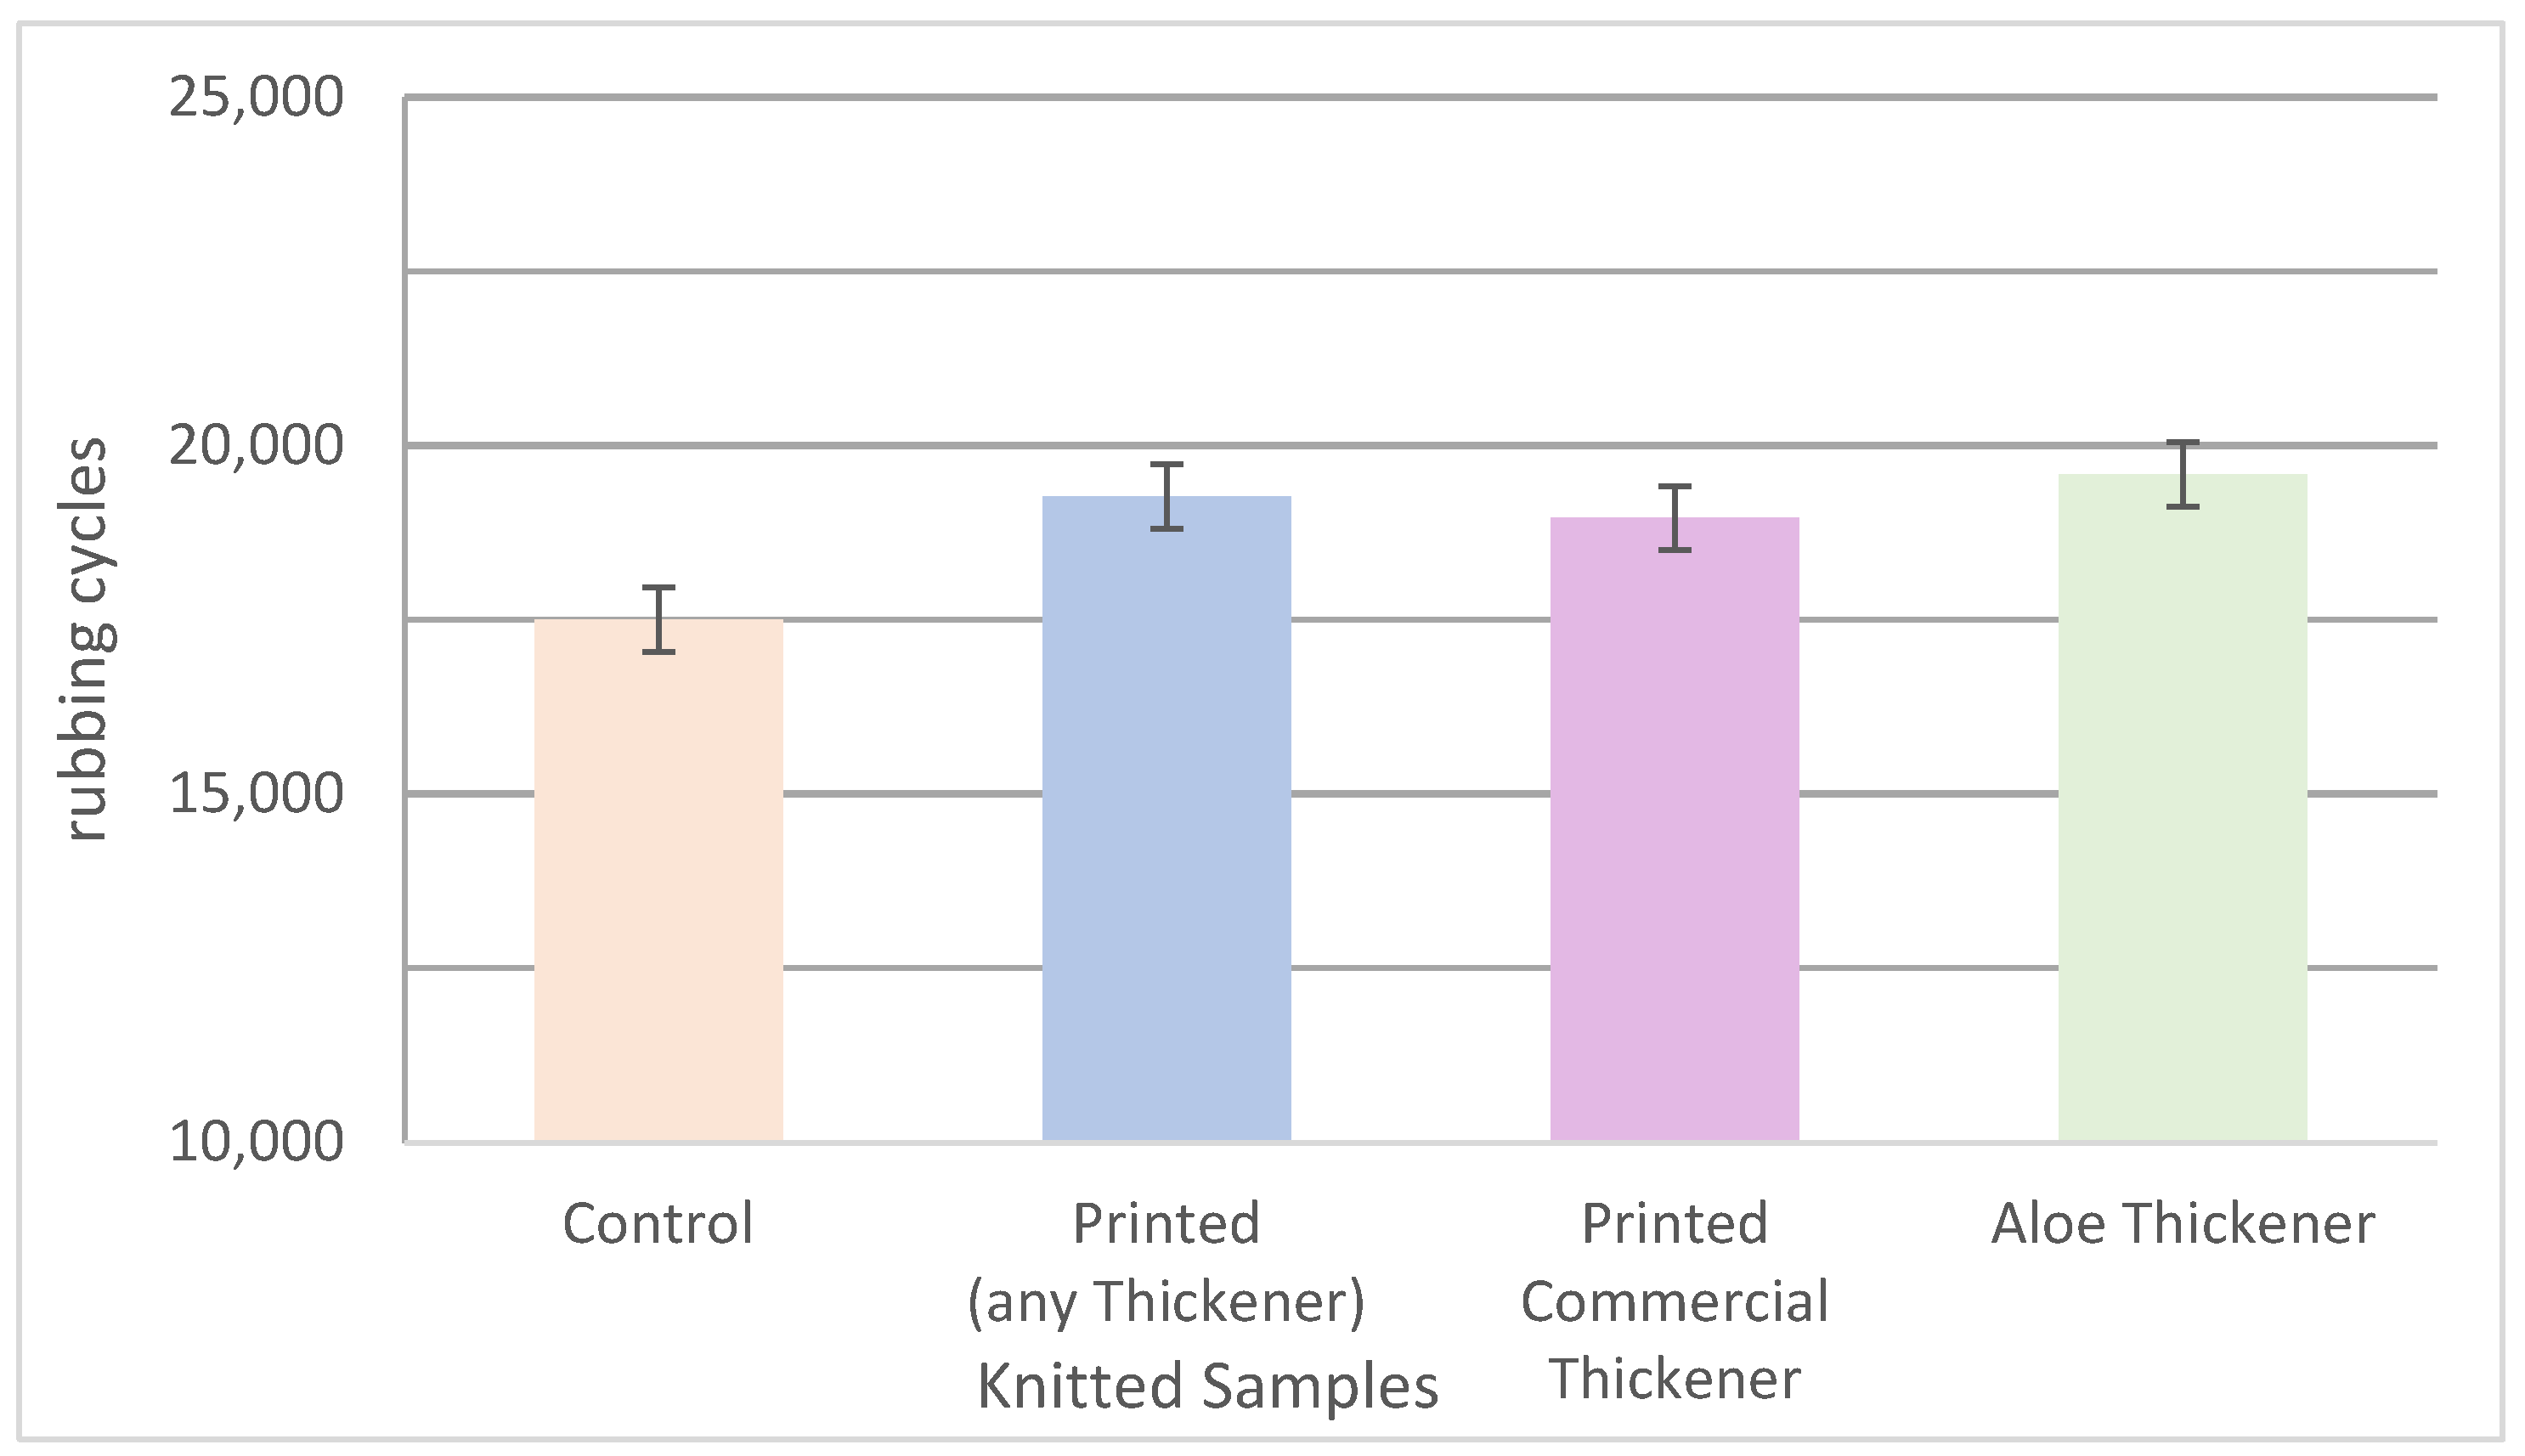
Figure 9.
Abrasion resistance cycles to failure plot of woven fabric substrates for stepwise-statistical analysis.
Figure 9.
Abrasion resistance cycles to failure plot of woven fabric substrates for stepwise-statistical analysis.
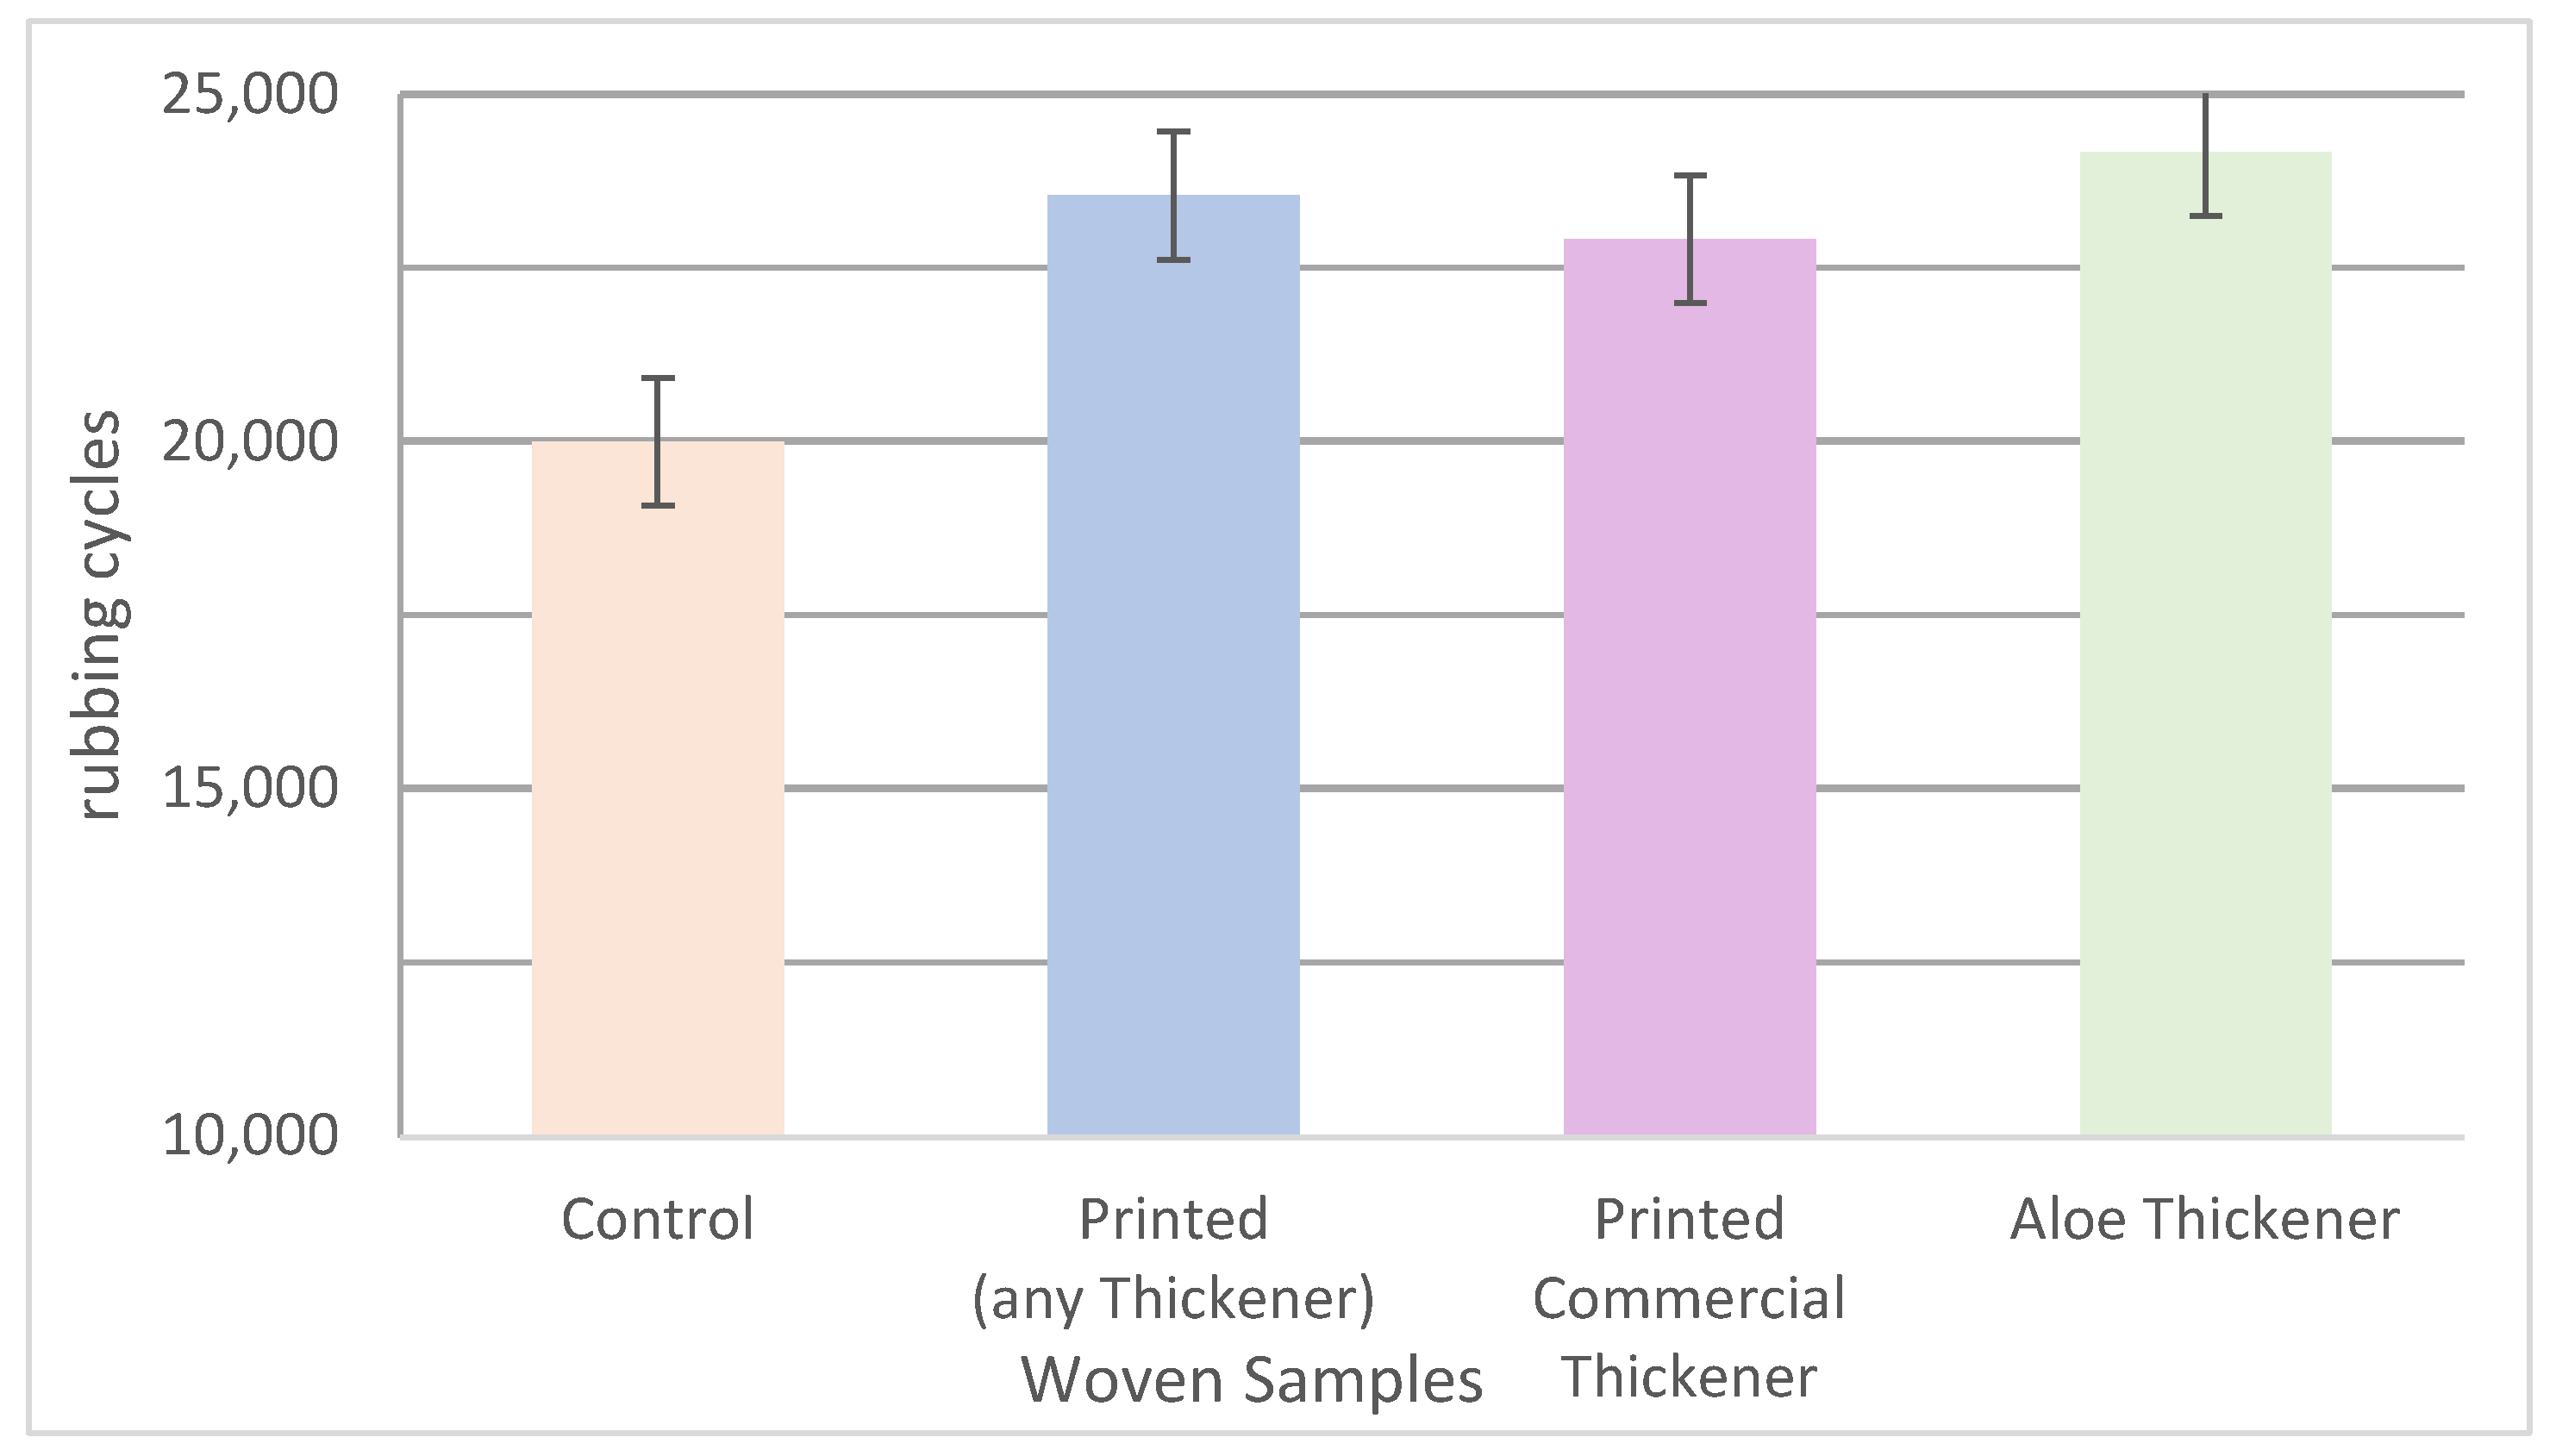
Table 1.
Colorimetric data (L*, a*, b*, C*, h°, K⁄S λmax values) of knitted samples, and colour fastness to rubbing, washing and staining of multifibre strip (W-wool, A-acrylic, P-polyester, PA-polyamide, C-cotton, AC-acetate.
Table 1.
Colorimetric data (L*, a*, b*, C*, h°, K⁄S λmax values) of knitted samples, and colour fastness to rubbing, washing and staining of multifibre strip (W-wool, A-acrylic, P-polyester, PA-polyamide, C-cotton, AC-acetate.
| Washing fastness | Rubbing fastness | ||||||||||||||
| Colorimetric data | Colour Fastness | Colour Staining | |||||||||||||
| Sample | K/S | L⃰ | a⃰ | b⃰ | C⃰ | h° | W | A | P | PA | C | AC | Dry | Wet | |
| AV-Saffron | 17.2 | 76.4 | 4 | 43.8 | 44 | 84.8 | 3 | 5 | 5 | 5 | 4/5 | 4/5 | 5 | 5 | 4 |
| CT-Saffron | 4.9 | 68.8 | 15.1 | 69.3 | 70.9 | 77.7 | 3 | 5 | 5 | 5 | 5 | 3/4 | 5 | 5 | 3 |
| AV-Curcumin | 15.1 | 81.6 | -2.8 | 51.5 | 51.6 | 93.1 | 3 | 5 | 5 | 5 | 3/4 | 4/5 | 4/5 | 4-5 | 3 |
| CT-Curcumin | 14.1 | 80.9 | -3.1 | 49.8 | 49.9 | 93.6 | 4/5 | 5 | 5 | 5 | 4/5 | 4/5 | 5 | 5 | 4 |
| AV-Annatto | 17.4 | 72.8 | 6.8 | 30.8 | 31.6 | 77.5 | 2/3 | 5 | 5 | 5 | 5 | 4/5 | 5 | 5 | 4-5 |
| CT-Annatto | 24.3 | 77.4 | 8.9 | 29.9 | 31.2 | 73.6 | 2/3 | 5 | 5 | 5 | 5 | 5 | 5 | 5 | 5 |
Table 2.
Colorimetric data (L*, a*, b*, C*, h°, K⁄S λmax values) of woven samples, and colour fastness to rubbing, washing and staining of multifibre strip (W-wool, A-acrylic, P-polyester, PA-polyamide, C-cotton, AC-acetate.
Table 2.
Colorimetric data (L*, a*, b*, C*, h°, K⁄S λmax values) of woven samples, and colour fastness to rubbing, washing and staining of multifibre strip (W-wool, A-acrylic, P-polyester, PA-polyamide, C-cotton, AC-acetate.
| Washing fastness | Rubbing fastness | ||||||||||||||
| Colorimetric data | Colour Fastness | Colour Staining | |||||||||||||
| Sample | K/S | L⃰ | a⃰ | b⃰ | C⃰ | h° | W | A | P | PA | C | AC | Dry | Wet | |
| AV-Saffron | 16 | 76.6 | 4.6 | 43.8 | 44 | 84 | 3 | 5 | 5 | 5 | 5 | 5 | 5 | 5 | 4/5 |
| CT-Saffron | 4.8 | 69.2 | 14.5 | 70.3 | 71.8 | 78.3 | 3 | 5 | 5 | 5 | 5 | 4/5 | 5 | 5 | 3/4 |
| AV-Curcumin | 10.5 | 77.5 | -1 | 53.6 | 53.6 | 91.1 | 3/4 | 5 | 5 | 5 | 3/4 | 4/5 | 4/5 | 5 | 4 |
| CT-Curcumin | 10.2 | 78.9 | -4.7 | 54.1 | 54.3 | 94.9 | 3/4 | 5 | 5 | 5 | 4 | 4/5 | 4/5 | 5 | 4/5 |
| AV-Annatto | 24.2 | 79.1 | 5.7 | 27.6 | 28.2 | 78.3 | 2/3 | 5 | 5 | 5 | 5 | 5 | 5 | 5 | 4/5 |
| CT-Annatto | 19.6 | 76.6 | 8.3 | 33.4 | 34.4 | 76.1 | 2/3 | 5 | 5 | 5 | 3 | 4/5 | 4 | 5 | 5 |
Table 3.
Sample preparation properties.
| Property | Woven | Knitted |
|---|---|---|
| Mean Dry mass gain (%) | 9.85 | 10.70 |
| Mean Thickness increase (%) | 10.81 | 13.25 |
Table 4.
Sample variance analysis (F-test) and mean comparison (t-test) for %Thickness increase of control and printed knitted substrates.
Table 4.
Sample variance analysis (F-test) and mean comparison (t-test) for %Thickness increase of control and printed knitted substrates.
| F-Test Two-Sample for Variances | t-test: Two-Sample Assuming Equal Variances | |||||
| Control | Printed | Control | Printed | |||
| Mean | 0,5848 | 0,6623 | Mean | 0,5848 | 0,6623 | |
| Variance | 0,0001397 | 0,000509 | Variance | 0,0001397 | 0,000509 | |
| Observations | 5 | 30 | Observations | 5 | 30 | |
| df | 4 | 29 | Pooled Variance | 0,00046422 | ||
| F | 0,2744727 | Hypothesised Mean Difference | 0 | |||
| P(F<=f) one-tail | 0,1079623 | df | 33 | |||
| F Critical one-tail | 0,1739182 | t Stat | -7,446525 | |||
| P(T<=t) one-tail | 7,3715*10-09 | |||||
| t Critical one-tail | 1,69236031 | |||||
| P(T<=t) two-tail | 0.0000000147430 | |||||
| t Critical two-tail | 2,0345153 | |||||
Table 5.
Sample variance analysis (F-test) and mean comparison (t-test) for %Thickness increase of control and printed woven substrates.
Table 5.
Sample variance analysis (F-test) and mean comparison (t-test) for %Thickness increase of control and printed woven substrates.
| F-Test Two-Sample for Variances | t-test: Two-Sample Assuming Equal Variances | ||||
| Control | Printed | Control | Printed | ||
| Mean | 0,488 | 0,540733 | Mean | 0,488 | 0,540733 |
| Variance | 0,000322 | 0,000741 | Variance | 0,000322 | 0,000741 |
| Observations | 5 | 30 | Observations | 5 | 30 |
| df | 4 | 29 | Pooled Variance | 0,00069 | |
| F | 0,434733 | Hypothesised Mean Difference | 0 | ||
| P(F<=f) one-tail | 0,217612 | df | 33 | ||
| F Critical one-tail | 0,173918 | t Stat | -4,15616 | ||
| P(T<=t) one-tail | 0,000108 | ||||
| t Critical one-tail | 1,69236 | ||||
| P(T<=t) two-tail | 0,000216 | ||||
| t Critical two-tail | 2,034515 | ||||
Table 6.
Sample variance analysis (F-test) and mean comparison (t-test) for %Dry mass gain of control and printed knitted substrates.
Table 6.
Sample variance analysis (F-test) and mean comparison (t-test) for %Dry mass gain of control and printed knitted substrates.
| F-Test Two-Sample for Variances | t-Test: Two-Sample Assuming Unequal Variances | ||||
| Control | Printed | Control | Printed | ||
| Mean | 0,2055 | 0,227486 | Mean | 0,2055 | 0,227486 |
| Variance | 0.00000033333 | 0,000038 | Variance | 0.00000033333 | 0,0000038 |
| Observations | 4 | 24 | Observations | 4 | 24 |
| df | 3 | 23 | Hypothesised Mean Difference | 0 | |
| F | 0,0878174 | df | 17 | ||
| P(F<=f) one-tail | 0,0339875 | t Stat | -44,741052 | ||
| F Critical one-tail | 0,1156974 | P(T<=t) one-tail | 2,2209*10-19 | ||
| t Critical one-tail | 1,73960673 | ||||
| P(T<=t) two-tail | 4,4419*10-19 | ||||
| t Critical two-tail | 2,10981558 | ||||
Table 7.
Sample variance analysis (F-test) and mean comparison (t-test) for %Dry mass gain of control and printed woven substrates.
Table 7.
Sample variance analysis (F-test) and mean comparison (t-test) for %Dry mass gain of control and printed woven substrates.
| F-Test Two-Sample for Variances | t-Test: Two-Sample Assuming Unequal Variances | ||||
| Control | Printed | Control | Printed | ||
| Mean | 0,2255 | 0,247708 | Mean | 0,2255 | 0,247708 |
| Variance | 0.0000003333 | 0,0000171 | Variance | 0.00000033333 | 0.0000171 |
| Observations | 4 | 24 | Observations | 4 | 24 |
| df | 3 | 23 | Hypothesised Mean Difference | 0 | |
| F | 0,0195101 | df | 26 | ||
| P(F<=f) one-tail | 0,0038112 | t Stat | -24,904272 | ||
| F Critical one-tail | 0,1156974 | P(T<=t) one-tail | 5,7174*10-20 | ||
| t Critical one-tail | 1,70561792 | ||||
| P(T<=t) two-tail | 1,1435*10-19 | ||||
| t Critical two-tail | 2,05552944 | ||||
Table 8.
Printing paste recipes of Aloe vera Gel and Commercial Thickener.
| Ingredients (gr/100gr paste) |
Thickening Agents | |
|---|---|---|
| Aloe vera Gel | Commercial | |
| Natural dye | 2 | 2 |
| Thickening agent | 80 | 1 |
| Sodium Alginate | 2 | - |
| Binder | 15 | 15 |
| Fixer | 1 | 1 |
| Water | - | 81 |
Table 9.
Pilling surface evaluation for knitted fabric.
| Knitted Substrate | Abrasion Cycles | |||
|---|---|---|---|---|
| 5,000 | 7,000 | 10,000 | 15,000 | |
| Untreated | 5 | 4-5 | 4-5 | 3-4 |
| Printed Saffron AV | 5 | 5 | 5 | 5 |
| Printed Saffron Comm | 5 | 5 | 5 | 5 |
| Printed Annatto AV | 5 | 5 | 5 | 5 |
| Printed Annatto Comm | 5 | 5 | 5 | 4-5 |
| Printed Curcumin AV | 5 | 5 | 5 | 5 |
| Printed Curcumin Comm | 5 | 5 | 5 | 4-5 |
Table 10.
Pilling surface evaluation for woven fabric.
| Knitted Substrate | Abrasion Cycles | ||
|---|---|---|---|
| 7,000 | 10,000 | 15,000 | |
| Untreated | 5 | 5 | 4-5 |
| Printed Saffron AV | 5 | 5 | 5 |
| Printed Saffron Comm | 5 | 5 | 5 |
| Printed Annatto AV | 5 | 5 | 5 |
| Printed Annatto Comm | 5 | 5 | 4-5 |
| Printed Curcumin AV | 5 | 5 | 5 |
| Printed Curcumin Comm | 5 | 5 | 5 |
Disclaimer/Publisher’s Note: The statements, opinions and data contained in all publications are solely those of the individual author(s) and contributor(s) and not of MDPI and/or the editor(s). MDPI and/or the editor(s) disclaim responsibility for any injury to people or property resulting from any ideas, methods, instructions or products referred to in the content. |
© 2024 by the authors. Licensee MDPI, Basel, Switzerland. This article is an open access article distributed under the terms and conditions of the Creative Commons Attribution (CC BY) license (http://creativecommons.org/licenses/by/4.0/).
Copyright: This open access article is published under a Creative Commons CC BY 4.0 license, which permit the free download, distribution, and reuse, provided that the author and preprint are cited in any reuse.


