
Submitted:
30 January 2025
Posted:
03 February 2025
You are already at the latest version
Abstract
Gridded Ion Thruster (GIT) is a versatile space propulsion device that can be used for a wide range of space missions being characterized by a high trust-to-power ratio and a relatively high specific impulse. In recent years, there has been a significant increase in academic and scientific interest in interplanetary and deep space exploration that has shifted research resources toward boosting the performances of GITs. One promising concept is to separate the extraction process of the ions from their acceleration (Dual Stage). Some researches focused the attention on basic experiments to assess the functioning principle, some tried to simply model its Optical System (OS) and only few of them used a numerical approach to verify it. In this work a global plasma model for both the Direct Current (DC) ionization chamber and OS is proposed. The model combines analytical formulas, describing the plasma physics into ionization chamber, a linear optic model for OS, and a curve-fitting approach, to get performances and working parameters. As input it requires the diameter of the engine and the thrust or power. An educated guess is made by considering the validity of the thrust/diameter-total efficiency curve, obtained for conventional GIT, due to the lack of these data for Dual Stage Gridded Ion Thrusters (DSGIT). Despite this hypothesis, the results obtained by the model are in good agreement with the performances and working parameters of preliminary designed high power (25-50 kW) thrusters, available in open literature and selected for the validation, obtaining for the most differences less than 5 %. Finally the model has been applied to exploit the advantage of DS approach by designing a 1kW thruster: the results are very promising because a ten times smaller thruster than a conventional GIT, could have hundred times higher thrust and power density and an increment of the efficiency and the specific impulse by 25 %.
Keywords:
Electric Propulsion
; Gridded Ion Thruster
; Plasma
; Modeling
; Dual Stage
1. Introduction
In recent years, the use of electric propulsion for space applications is undergoing rapid development, related to very accurate and low thrust requirements for precise satellite control in scientific and civil missions [1]. Electric Propulsion (EP) is a propulsion technology in which electricity is exploited to create thrust with high exhaust velocities. Despite low thrust levels, in the order of millinewtons and reaching a maximum of 1 N, EPs are able to achieve excellent performances, 10-20 times greater than the conventional thrusters [2]. Moreover, EP requires the use of small amounts of propellants for its successful operation and returns high exhaust velocities on the order of / for heavy propellants such as Xenon and / for light ones such as Helium [3].
Electric thrusters are classified according to the method of acceleration employed to produce thrust and can be classified into three categories [4]:
- Electrothermal systems include all techniques regarding the electrical heating and expansion of a propellant gas in order to convert its thermal energy to kinetic energy. There exist different types of Electrothermal Thrusters depending on the way the propellant flow is heated. The flow can either pass over an electrically heated solid surface (Resistojet), or through an arc discharge, (Arcjet), otherwise it can be heated by high-frequency excitation. The achievable exhaust velocity, 3.5-20 / [5], which is an important value in terms of fuel efficiency, depends both on the maximum tolerable temperature by the chamber surfaces and the nozzle and on the propellant thermodynamic and kinetic properties;
- Electrostatic systems regard the branch of propulsion in which the propellant is ionized and accelerated by electrostatic forces and characterized by low thrusts and high specific impulses. The most common use of electric forces on a propellant flow is in an ion thruster, where a beam of positive ions is accelerated by an electrostatic field. The obtainable thrust only depends on the exhaust velocity, 20-40 / [5], the mass of the ion, and the total ion flux;
- Electromagnetic systems accelerate ionized gas by means of their interaction with electric and magnetic fields. They are promising in terms of high exhaust velocities, 20-30 / [5], and high mass flows.
A comparison of thrust-to-power ratio and specific impulse for these three major categories is provided in Figure 1 for completeness.
Among the outlined categories of electric thrusters, the electrostatic systems are the most fully developed concept in EP. These engines include the Gridded Ion Thrusters (GITs), which are a well-established technology that have proven to be a suitable and efficient alternative to conventional propulsion systems. They enable a wide range of missions, such as facing the problem of the drag compensation in Very Low Earth Orbit (VLEO), due to the high specific impulses and low thrust profiles they provide [2].
GITs main components are two hollow cathodes, two or three grids (i.e. the Optic System), and a discharge chamber, in which the propellant is ionized to generate and confine plasma (Figure 2). The discharge chamber consists of a cathode, an anode and magnets for plasma confinement. The hollow cathode emits electrons through a thermionic process, where heat causes the cathode to release electrons. These electrons collide with neutral propellant atoms, ionizing them and forming plasma, the basis of the thruster’s operation. To optimize ionization, various magnetic field configurations are employed along the anode wall, in order to lengthen the electron mean free path, thereby increasing collision frequency and ionization probability. Among the existing different types of magnetic confinement, the ring cusp magnetic field, generated by permanent magnets, has emerged as the most effective configuration [3]. At the discharge chamber’s exit, two or three perforated grids shape the ion beam. The extraction and acceleration of ions from plasma by GITs involves the use of these grids, whose potential difference establishes the electrostatic forces needed to generate the thrust. The first electrode of the optical system is the screen grid which is held at a high positive potential, while the second one, the acceleration grid, is set at a significantly negative potential that further accelerates the ions. The last and optional electrode, the deceleration grid, is needed to mitigate erosion on the acceleration grid by shielding it from ion bombardment and removing erosion phenomena, such as pits-and-grooves; however, it also increases the thruster complexity [6]. To neutralize the ion beam and prevent spacecraft charging, a smaller hollow cathode, the neutralizer, is placed outside the chamber, close to its exit. This counteracts the Ion Backstream phenomenon, ensuring efficient thrust generation and safeguarding satellite’s electric neutrality [3]. The outputs of the GITs are very good in terms of efficiency and specific impulse: the first reaches values between 60 % and 80 %, the latter is characterized by values between 2000 and 10000 [3]. However, GITs present an intrinsic trade-off between maximum extractable current density and specific impulse, which limits the maximum achievable thrust, usually of the order of a few Newtons, for a given specific impulse.
In conventional GITs, the extraction and acceleration process occurs in a single stage, imposing a constraint on the acceleration potential of the grids so as to limit excessive electric field penetration within the discharge chamber. This penetration leads to a curvature of the plasma sheath, which is bigger as the beam potential increases. It results in an increment of the extracted ion beamlet divergence until significant impingement occurs on the acceleration and deceleration grids, leading to excessive grid erosion, performance degradation and limitation of thruster lifetime. To avoid these effects, the grid acceleration potential is limited to maximum values of 5 , being able to achieve specific impulse to <10000 , thrust density to < /cm2 and power density to <20 /cm2 with Xenon propellant [7,8].
To overcome this limitation, D. Fearn proposed a solution [9] inspired by the United Kingdom Atomic Energy Authority (UKAEA) Culham Laboratory’s Controlled Thermonuclear Reactor (CTR), a multi-stage ion optics system, initially designed for high-energy injections into tokamaks [11,12,13,29]. The CTR design is based on a 4-grid optical system that allows extremely high acceleration potentials and, therefore, high ion velocities with light gases, such as hydrogen. This configuration allows the decoupling of the extraction and acceleration process, effectively creating a dual-stage system, as shown in Figure 2. It is achieved through the introduction of an additional electrode, the extraction grid, placed between screen and acceleration grid. From this concept, then, originates the idea of a DSGIT, which, theoretically, enables improved performance and overcomes the limitations of the classic GIT architecture (Figure 2). Thus, the dual stage system results in improved specific impulse, thrust density and thrust, as well as beam divergence (reduced to values of - compared to - in conventional GIT systems) at the expense of higher input power [14].
Fearn’s idea paved the way for the scientific community, encouraging them to investigate and make improvements on this technology. The first attempt, conducted jointly by the European Space Agency (ESA), Australia and Great Britain, allowed to develop a prototype of Dual Stage 4-Grid (DS4G), powered by Xenon and with a radio frequency source. This new technology allows to obtain a specific impulse of 14500 , a beam divergence angle of about and beam energies up to 80 . These parameters, comparable to those found in fusion devices, are accomplished with an active grid diameter of only 2 cm [7,9,15]. The University of Southampton and Mars Space Ltd. are working on the design of a DS4G ion thruster with a Kaufman ion source, whose many theoretical research and numerical simulation reports are available but not the experimental ones [16,17,18,19]. Theoretical research and numerical simulation of the DS4G ionic optical systems was also conducted by the Lanzhou Institute of Physics in 2015, and the prototype was developed in 2017 [20,21]. This study presents the decoupling mechanism of ion extraction and acceleration processes of the DS4G optical system by experiment and simulation.
Coletti et al. [17] proposed a modified design of the DS4G, known as the Dual-Stage 3-Grid (DS3G), which removes the deceleration grid to reduce thruster complexity while preserving erosion control. Experimental tests have shown that the DS3G has a significantly longer operating life (≈ 50000 ) than conventional grid ion thrusters (≈ 25000 ) due to reduced erosion and power losses. These results were confirmed by a study conducted by Bramer [22], using Particle In Cell (PIC) code, which revealed that the slight performance improvement of the DS4G over the DS3G does not justify the increased complexity introduced by the deceleration grid.
The current research activity has focused on the development of a Global Plasma Model (GPM) for Direct Current Dual Stage Gridded Ion Thruster (DC-DSGIT). The methodology, similarly to the models presented in Ref. [23,24], begins with either input power or thrust, combines analytical formulas, that describe the underlying physics of DC-DSGIT and employs a curve-fitting approach based upon open literature data from similar ion thrusters. In the curve fitting part, an educated guess is made about the thrust/diameter-total efficiency curve of DC-DSGITs (i.e. conventional GIT curve is used), given the lack of data in the literature. The model is able to calculate both performances (e.g. specific impulse, efficiency) and operative parameters (e.g. voltages, magnetic field intensity and propellant flow rates).
The paper is organized as follows: the description of the model is in Chapter 2; the results that validate the model is shown and discussed in Chapter 3; the conclusions are drawn in Chapter 4.
2. Global Plasma Model for DC-DSGITs
2.1. Definition and assumptions
The model for DC-DSGIT takes in input the chamber diameter, either the power or the thrust and the propellant. Figure 3 shows a flow chart illustrating the main parts, inputs and outputs of the model.
Additionally, the GPM is characterized by some Degrees of Fredoom (DoF) set by considering the operating life, efficiency and complexity:
The model can be run in two different ways: the first one consists in taking thrust (or power) or the size of the discharge chamber in input, in order to determine the performance of the thruster; the second one involves setting thrust (or power) requirements that the thruster must meet and, through an iterative procedure, it is possible to determine the minimum size. Using the analytical Equations discussed in the next sections, the magnetic field and the corresponding design parameters can be calculated. The Table 1 summarizes the input, output and degrees of freedom of the developed tool.
2.2. Curve Fitting Approach
This part of the model allows for the calculation of such important performance parameters such as efficiencies and thrust (or power), Figure 3.
The main performances, under different operating conditions, are collected from the open literature [15,22] to build useful interpolating curves that can be used to easily get these data. Following Refs. [23,24], these curves are the thrust/diameter-total efficiency and the power density-thrust density curves.
Due to the novelty of the technology there is few total efficiency data, thus only the power density-thrust density curve has been built (e.g. Figure 4). Therefore, to cover the gap, the validity of the thrust/diameter-total efficiency curve, obtained for conventional GIT [23], was supposed. This hypothesis is validated by the fact that the total efficiency estimate using this interpolating curve provides relatively low errors (on average less than 4-8%) compared to the few available data regarding DSGITs.
2.3. Ion Optic System Modeling
Ion acceleration and thrust production in a GIT occur through the use of electro-polarized grids. The design of such grids results from a trade-off between lifetime, size, and performance. In general, the main factor turns out to be durability, since ion thrusters must operate for months or years. The aim of the grids is to extract ions from the plasma and accelerate them, while minimizing the impacts of ions on the shielding grid and the loss of neutral atoms out of the chamber, in order to maximize the mass utilization efficiency, as described in the following sections.
The main parameters that define the grid geometry are the grid thickness, distance between grids, the diameter and number of holes. These parameters are expressed considering the confinement of neutrals and the minimization of impacts between ions and accelerating grid. In particular, one of the advantages of a Dual-Stage ion optics system is the possibility of obtaining highly focused ion beams with rather low divergence values. In DSGITs, although the extraction and acceleration processes occur in different regions (in the first and second grid gaps, respectively), if a well-collimated jet is desired, the magnitude of the acceleration process will influence the requirements of the extraction process in terms of the optimal perveance ratio (Equations 7, Equations 8). This effect can be easily understood by representing the grids as electrical lenses. An electrode separating two regions with different electric field strengths is equivalent to an electrostatic lens with focal length f explicated in Equation (2).
In Equation (2), V is the ion energy at the position of the grids, while and are the electric fields in the extraction and acceleration gaps, respectively. Consequently, using Equation (2), it can be seen that in a conventional GIT extraction system, as visible in Figure 5, the divergent lens is the second grid that balances the effect of sheath shape, ideally producing a perfectly collimated ion beam.
In a dual stage system, the lens corresponding to the second grid can be convergent or divergent according to the relative electric field strength in the first and second gaps, as shown in Figure 6. When the electric field in the first gap, , is weaker than the one in the second gap, , the lens is convergent and a flatter shape of the plasma sheath can be tolerated (compared with a conventional extraction system), leading to higher perveance values and, therefore, higher extracted current densities. Instead, if the field in the first gap, , is stronger than the one in the second gap, , the second grid corresponds to a divergent lens. This results in the plasma sheath having to penetrate more into the plasma to have more convergent ion trajectories so as to compensate for the presence of two divergent lenses. As a consequence, there is a reduction in perveance and, therefore, a reduction in the total extracted current.
The change in the optimal perveance can be investigated as a function of the ratio between the voltage drop applied to the acceleration stage, , and the voltage drop applied to the extraction stage, , as can be seen in Equation (4). For this purpose, the four-grid ion optics model developed in Ref. [29] is used; this analytical model, based on the theory of linear optics, allows the calculation of the divergence of the ion beam as a function of grid geometry and applied voltages. Figure 7 represents the flowchart showing the logic of ion optics’ parameters determination.
The linear optics model proposed in Ref. [29], hence, allows the beam divergence to be defined by Equation (3).
In Equation (3), is the ratio of the acceleration voltage to the extraction voltage , the ratio of the acceleration gap to the extraction gap and S the ratio of the screen grid aperture radius to the extraction gap.
Given the grid geometry in Figure 8, using Equation (3), and varying , it is possible to obtain the optimal perveance ratio () to produce a beam jet with almost zero divergence.
To be able to understand the ion extraction process and its influence on a GIT performance and lifetime, the perveance of an extraction system is defined in Equation (7).
Where I is the extraction current and is the extraction voltage drop (). The perveance results to be strongly related to space charge effects on the extraction of a ionic current and its maximum value is governed by the Child-Langmuir equation, reported in Equation (8).
Consequently, in Equation (8) refers to the Child-Langmuir limit perveance, while , e and M are, respectively, the vacuum dielectric constant, the electron charge and the mass of the extracted ions, is the first grid aperture diameter and the gap between the first two grids of the extraction system. Assuming a constant extraction voltage (), the lower the specific impulse is, the lower the optimal work perveance and the extracted current are. In particular, the optimal value of for a Dual Stage ion engine decreases below the one of a conventional GIT for values of less than 0.7-1.5. This reduction in working perveance could be balanced by reducing the ratio between the distance of the first and second stages. However, decreasing the value of means either increasing the gap of the first stage, causing a decrease in the maximum perveance , or decreasing the grid spacing in the acceleration stage. It should be noted, however, how the minimum grid gap is limited by the maximum electric field (≈ 4 / for Molybdenum) that can be applied between two grids before the arcing occurs [30]. These two limitations discussed above are applied in the identical manner to both extraction stage (screen and extraction grid) and acceleration stage (extraction and acceleration grid), so it is possible to verify the value of the relative electric fields by Equations (9) and (10).
The parameter in Equation (9) is the sheath thickness or gap equivalent of the extraction stage which can be defined by Equation (11).
It should be noted from the Equation (12) that the maximum current density of the extractable beam is found to be related to the electric field in the extraction stage gap .
The thrust density is likewise proportional to the electric field of the DSGIT extraction stage, as can be observed from Equation (13).
In Equation (13), the term is the ion acceleration potential in the dual stage system, which corresponds to the difference between the beam voltage and twice the absolute value of the acceleration grid potential .
Hence, given the thrust density and the ratio of voltages , it is possible to obtain the extraction grid voltage and the screen grid voltage , respectively.
The acceleration grid voltage, calculated by the voltage ratio and the potential difference of the extraction stage , must be compared iteratively in order to determine the optimal value of perveance with analytical model of electron backstreaming for ion thrusters [3,31]. This analytical model, shown in Equation (17), enables the explication of the backstreaming limit, coinciding with the minimum potential of the acceleration grid, which allows the backstreaming current to be reduced to a specific percentage of the beam current .
In Equation (17), is the minimum local potential (or “saddle-point” voltage) required for the electronic backstreaming limit. It is quantified in terms of the ratio of the backstreaming current to the beam current. The term represents the potential difference between the beam axis and acceleration aperture wall, while B is a geometric factor that considers the acceleration grid geometry, as shown in Equation (20).
In Equation (18), corresponds to the plasma potential into the beam, which, as a first approximation, can be set equal to 0 ; is the beam plasma electronic temperature in eV (usually of the order of 1-2 eV). In Equation (19), represents the beam diameter obtained through the analytical model developed in Ref. [29]. With this model the beam radius can be estimated along the ion beam trajectory.
In Equation (21), is the radius of the ion beam at the exit of the last grid and is the radius of the initial beam. In Equations (22)-(24) are reported, respectively, the U term, related to the Acceleration-Extraction voltage ratio , corresponding to the measurement of boundary curvature and to the effect of plasma boundary curvature in extraction stage [30].
2.4. Performances Calculation
Once the grid voltages have been obtained by Kim’s linear optics model [29] and the electron backstreaming model [31], it is possible, through the general equations of electric propulsion, to determine the performances of the thruster.
The curve-fitting approach has enabled the determination of the main performance parameters, such as thrust T (or input power ) and total efficiency . In GITs there are different energy loss mechanisms that can be summarized in three main coefficients , and . The first is the mass utilization efficiency , which takes into account the amount of neutrals that escape from the discharge chamber without being ionized and can be expressed by using Equation (25).
In Equation (25), is the total propellant mass flux and is the mass flux of ions, thus the mass utilization efficiency represents the fraction of the total ionized propellant flux. This expression is valid in the case of singly ionized particles, but in the presence of many multi-ionized particles, Equation (25) must be redefined with a correction factor. Sometimes it is useful to define a discharge chamber propellant utilization efficiency by dividing by the fraction of propellant injected into the chamber, as shown in Equation (26).
In Equation (26), represents the neutralizer propellant flow rate outside the chamber and is assumed, as a first approximation, around 10% of the total mass flow rate of the thruster, . The second efficiency is the electrical one , defined in Equation (27) as the ratio of the beam power to the total input power.
Equation (29) provides the last efficiency, the total thruster one , denoted as the jet power divided by the total power. In this expression is a correction factor related to beam divergence and double ionization in the thruster; its value can be estimated experimentally with Equation (28) or by codes that calculate the beam divergence and consider the propellant multi-ionization.
Combining the previous relations Equation (30) can be easily obtained. It can be observed that, for a given input power and total efficiency, an increase in specific impulse results in a decrease in thrust of the same amount.
As Equation (30) shows, a trade-off between thrust and specific impulse must be achieved in the development of an ion thruster, thus the efficiency needs to be increased. It is also important to compute the power loss in Equation (31), which is not exactly an efficiency but still represents a power loss.
The discharge loss indicates the cost of ion production, specifically it represents the power required to generate unit ion beam current. Since it is a power loss, it should be as small as possible. In Equation (32), it is reported the discharge current , produced inside the discharge chamber, in which it can be seen the dependence on net beam voltage , discharge voltage and electrical efficiency .
2.5. Discharge Chamber Model
Analytical equations, derived from Goebel and Katz 0-D model [3], allow the determination of the maximum transverse magnetic field between magnetic rings and magnetic field strength in the cusps along the anode wall. These values are used to size magnets arranged in a ring cusp magnetic field configuration, which is one of the most effective solutions for electron and ion confinement [32,33].
In the model, a homogeneous plasma is assumed within the volume confined by the magnetic field, an assumption that is generally valid except for the area near the cathode plume. Therefore, the predictions of the model is expected to deviate only marginally from the experimental results.
The main equations are given by the power balance in the discharge chamber and in the overall thruster expressed respectively in Equations (33) and (34).
In Equation (33), the term represents the power in the discharge chamber. This power, as shown in Equation (35), depends on the current emitted by the hollow cathode and the voltage to which the electrons inside it are subjected. The second term, , given by Equation (36), represents the output power of the ionization chamber, considering the phenomena of ion production and neutral excitation, as well as electrode losses, related to the power . Equation (34) considers the energy balance of the entire thruster, where represents the input power of the thruster, assumed to be the model DoF. On the other hand, , defined in Equation (37), includes not only the power required for the ionization chamber, but also the power destined for the electrodes.
In Equation (35), is the electron current, the discharge voltage, the cathode voltage drop, the sheath potential relative to the anode wall, the plasma potential drop related to the electron temperature (see Equation (38)).
In Equations (36) and (37), the first term represents the power to produce ions, where is the ion production rate and is the ionization potential. The second term refers to the power to excite neutrals, where is the neutral excitation rate and is the average excitation potential ( and , for Xenon, are respectively eV and 10 eV). As for the production rate of ions and the neutral excitation rate are described respectively in Equations (39) and (40).
In these last two Equations, is the neutral density, the electron density, the primary electron density, e the electron charge and V the plasma volume inside the discharge chamber. The first terms within the brackets, in Equation (39) and in Equation (40), represent respectively the ionization and the excitation reaction rate coefficients, i.e., the cross section averaged over the Maxwellian electron velocity distribution function.
The second terms within the brackets, and , are respectively the ionization and excitation cross section averaged over the primary electron velocity, depending on the electron temperature. By assuming mono-energetic electrons, the second term in brackets can be expressed as a product of the cross section and the primary velocity , considered constant [3].
In the case of DSGIT Xenon-fed:
- The ionization and excitation reaction coefficients expressed as a function of electronic temperature, can be computed by the fits reported in Ref. [3];
- Ionization and excitation cross-sections are obtained as a function of the primary electron energy . Equation (41) is a seventh-order Gaussian fit, derived from the study of De Heer et al. [34] and using the coefficients given in Table 2 and Table 3. These curve fits, shown in Figure 9 and Figure 10, are in accordance with experimental data, yielding an R-squared value of 1, and operate in the energy range 20-4000 eV.
For the calculation hereinafter, the energy of the primary electron, , is set to 20 eV, thus the values of cross sections are calculated at the same energy level, E, by using Equation (41).
The remaining terms in the Equations (36) and (37), describe the power lost to the electrodes and to the anode wall due to ions recombination and electrons loss. the ions on the screen grid, the ions back to the cathode, the ions beam current, the ion current lost to the anode, the electron current from the plasma that go to the anode, the primary electron current lost to the anode and the plasma electron energy lost to the wall, expressed as . Furthermore, in the Equation (37), corresponds to the ion beam voltage and to the potential drop in the extraction stage. The term is added, compared with the conventional GIT equations [3], in the power balance of the overall thruster to consider the decoupling effect of the extraction and acceleration process in the DSGIT.
Regarding magnetic confinement, it is decided to focus on the currents , and , found in Equations (42)-(45), due to their dependence on the magnetic field. Equations (42) and (43) represent the conservation of particles flowing to the anode and the current emitted from the hollow cathode, respectively, while Equations (44) and (45) express the rate of ion production. The term is put equal to zero, given the negligible values it generally assumes.
Figure 11 shows the defined currents and potentials in the discharge chamber.
Equation (46) allows to define the primary electron current lost directly to the anode wall at the cusps of the magnetic field, since the magnetic field lines are perpendicular to the surface.
The term is the primary electron density, the primary electron velocity and the loss area at anode expressed in the Equation (47).
As reported in Equation (48), is the total length of the magnetic cusps in the azimuthal direction given by the sum of the single length of the cusps.
The value is the Larmor radius shown in the Equation (49) and influenced by , which is the magnetic field strength at the cusp of the anode wall.
As can be seen, and are inversely proportional, thus the higher the magnetic field, the lower the loss area; therefore, the probability, P, that a primary electron undergoes a collision without being lost at the anode is higher, in agreement with the Equation (50).
The term is the neutral density, the total inelastic collision cross-section for the primary electrons and V the discharge chamber volume. Typically, most of the electrons lost at the anode magnetic cusps are plasma electrons, the so-called secondary electrons. The plasma electrons current lost to the anode magnetic cusps can be expressed by the Equation (51).
In this expression, is the electron density in the plasma, the electron temperature, m the electron mass, the anode sheath potential and a hybrid anode area reported in Equation (52).
In Equation (52), represents the hybrid Larmor radius, which depends on the magnetic field strength B at the magnetic cusps on the anode wall; while and are respectively the electron Larmor radius and the ion Larmor radius, explicated in the Equations (53) and (54).
The ion current to the anode wall is expressed in the Equation 55, where is the total surface area of the anode exposed to the plasma and the confinement factor.
The factor is related to the presence of magnetized electrons that influence the motion of ions, causing a reduction of the Bohm current toward the wall area between the cusps.
The confinement factor corresponds to the ratio of the transverse ion velocity to the Bohm velocity , as reported in Equation (56). Furthermore, it depends primarily on the magnetic field configuration since the transverse ion velocity is expressed, as seen in Equation (57), as a function of the maximum transverse magnetic field . The latter induces a reduction in the expected ion flux to the anode, which also directly affects the ion velocity. As a result, ions are conserved because those that do not flow to the anode wall, due to the transverse magnetic field, impact toward the grids, i.e. in a region of no confinement.
In Equation (57), represents the electron-ion collision frequency, is the sum of the electron-neutral collision frequency and the electron-ion one , the electron mobility and l the diffusion length. The latter term, corresponding to the transverse location of the maximum magnetic field magnitude between magnets, in the case of the ring cusp magnetic field, can be determined with good approximation as , where d is the distance of the magnets.
The term represents the Average Maxwellian inelastic cross-section, i.e. the measure of the probability of a particle interaction in a gas or plasma. This cross-section is determined as a function of the electronic temperature and depends on the selected propellant. Curve fits valid in the electronic temperature range 0.1-100 eV, can be found in Ref. [35] .
3. Results
3.1. Validation
For the validation of the model, Ref. [15] has been selected because it deals with the preliminary design of DSGITs for different mission classes and reports the highest number of data to compare with. Particularly those referring to the following missions have been selected: Infra-structure to Earth-Moon L1 in Table 4 and Table 5 and NEO NEP in Table 6, Table 7 and Table 8. Each one has several mission levels, thus only a few of them are randomly chosen to make the comparison, e.g., for Infra-structure to Earth-Moon L1, mission level 1 and 2.
In each simulation, the power and discharge chamber diameter have been used as inputs to the model. Xenon has been used as propellant. As regarding the OS, in Table 4 and in Table 6, Table 7 and Table 8 the comparison is made using the grids in Ref. [8], while in Table 5 and Table 9 those in Ref. [20].
The performances and working parameters predicted by the model, Table 4, Table 5, Table 6, Table 7 and Table 8, compared to those reported in Ref. [15], show differences which are, for the most of the parameters, lower than 5 %, even if one parameter for each test case can exceed this value, reaching also value close to 10 %.
Specifically, regarding the results of the simulation of the NEO NEP Mission Level 1, reported in Table 6, the highest difference is about the value of , i.e. %. This can be attributed to the dependence of this parameter on the and , as in Equation 14. The differences of these parameters with respect the data reported in open literature, are probably due to the thrust obtained by the curve fitting approach. In general, it can be seen that in all Table 4, Table 5, Table 6, Table 7, Table 8 and Table 9 the acceleration grid voltage has the highest difference among the working parameters, due to its dependence on the total acceleration voltage and on the extraction grid voltage.
This is true except for Table 5 and Table 9, where it can be seen that the specific impulse and the total propellant mass flow rate , related to the total efficiency , have errors up to a maximum of 9 % and 10 %, respectively. This highlights that the educated guess, applied to total thruster efficiency, allows for more accurate values as the diameter increases, as seen in Table 4 and Table 6, Table 7 and Table 8, to a similar trend with respect to that of conventional GITs.
3.2. GIT vs DSGIT
The previous section has dealt with the validation of the model that has involved high power thruster (25-50 kW). In this section the model has been applied to show the advantages of DSGIT against GIT, in low power range (i.e. 1 ). Particularly a DSGIT was designed to match the thrust and the power of NSTAR (Throttle level 5, TH5) [37], a well studied and characterized ion thruster.
Table 10 clearly shows how the DS technology is promising: with ten times smaller thruster, hundred times thrust and power density can be achieved. Moreover, the specific impulse and the total efficiency are increased by 25 %. Obviously thermal analysis would be necessary to verify if such high power on such small thruster could be managed.
4. Conclusions
The paper has described a Global Plasma Model able to compute the performances and the main working parameters of a Direct Current Dual Stage Gridded Ion Thruster, a promising Electric Propulsion architecture.
The model makes use of a curve-fitting approach, the classic performance definition for Gridded Ion Thruster, a linear Optic System model and a plasma model for the ionization chamber. It takes as input the discharge chamber diameter and the thrust or the total power; it is assumed a cylindrical ionization chamber with the length equal to its diameter; the extraction and discharge voltages are set respectively to 1000 V and 28V. The grid geometry can be arbitrary assigned as well as the divergence beam angle. The main assumption of the model is that the thrust/diameter-total efficiency curve, used in the curve-fitting approach, obtained for conventional GIT, is supposed to be valid for Dual Stage Thrusters, too.
The results of the validation tests, conducted on the data available in open literature, regarding high power DSGIT (25-50kW), and get by means of a preliminary design tool, has shown the reliability of the model. Except for very few parameters the differences are below 5 %. Perhaps, the usage of thrust/diameter-total efficiency curve built by using specifically experimental data regarding DSGITs, would improve predictions’ accuracy.
The model has been proved to be used for the design of new thrusters, too. As example, a 1kW DSGIT, with the same thrust and power of NSTAR, was designed. A diameter ten times lower (3cm vs. 30cm) has resulted, leading to hundred times higher power/thrust density; moreover the specific impulse and the total efficiency have been increased by 25 %.
Author Contributions
Conceptualization, F.B. M.P. G.C.; methodology, E.L., V.S., E.R., F.C., L.M. and S.F.; software, E.L., E.R., V.S., F.C., S.F. and L.M.; validation, E.L., S.F., F.C., E.R., L.M. and V.S.; data curation, L.M., S.F., V.S., E.L., F.C. and E.R.; writing—original draft preparation, V.S., E.L., E.R., L.M., S.F. and F.C. ; writing—review and editing, M.P. G.C.; visualization, E.L., L.M., F.C., S.F., V.S. and E.R.; supervision, F.B.,M.P.,G.C.; project administration, F.B. All authors have read and agreed to the published version of the manuscript.
Funding
This research was funded by the Italian research program in aerospace, PRORA (Programma Operativo Ricerche Aerospaziali) entrusted by MIUR (Ministero dell’Istruzione, Ministero dell’Università e della Ricerca).
Institutional Review Board Statement
Not applicable.
Informed Consent Statement
Not applicable.
Data Availability Statement
The data presented in this study are available on request from the corresponding author.
Acknowledgments
The authors would like to thank professors M. Grassi, M. Guida and G. Cardone (University of Naples, Federico II) who entrusted their students to CIRA space propulsion laboratory, giving them the possibility to carry this study in the framework of Aerospace Design Project course.
Conflicts of Interest
The authors declare no conflict of interest.
Abbreviations
The following abbreviations are used in this manuscript:
| CTR | Controlled Thermonuclear Reactor |
| DC | Direct Current |
| DoF | Degrees of Freedom |
| DS3G | Dual Stage 3-Grid |
| DS4G | Dual Stage 4-Grid |
| DSGIT | Dual Stage Gridded Ion Thruster |
| EP | Electric Propulsion |
| ESA | European Space Agency |
| GIT | Gridded Ion Thruster |
| NSTAR | NASA Solar Technology Application Readiness |
| OS | Optic System |
| PIC | Particle in Cell |
| UKAEA | United Kingdom Atomic Energy Authority |
| VLEO | Very Low Earth Orbit |
| GPM | Global Plasma Model |
Symbols
The following symbols are used in this manuscript:
| Coefficient used in Gaussian fit for Xenon ionization cross-section | |
| A | Discharge chamber area |
| Electron loss area at anode | |
| Total surface area of the anode exposed to the plasma | |
| Primary electron loss area at anode | |
| Coefficient used in Gaussian fit for Xenon ionization cross-section | |
| B | Grid geometric factor |
| Magnetic field strength at the magnetic cusps on the anode wall | |
| Coefficient used in Gaussian fit for Xenon ionization cross-section | |
| Extraction stage gap | |
| Acceleration stage gap | |
| D | Discharge chamber diameter |
| Extraction grid aperture diameter | |
| Screen grid aperture diameter |
| E | Electric field |
| Electric field between screen and extraction grids | |
| Electric field between extraction and acceleration grids | |
| Acceleration stage electric field | |
| Extraction stage electric field | |
| Maximum electric field between two grids | |
| f | Electrostatic lens focal length |
| Effect of the curvature of the plasma boundary in extraction stage | |
| Ion-confinement factor | |
| g | Gravitational acceleration at sea level |
| I | Extraction current |
| Neutral excitation rate | |
| Electron current leaving plasma to anode | |
| Ion beam current | |
| Discharge current | |
| Current emitted by the hollow cathode | |
| Ion current lost to the anode | |
| Ion current back to the cathode | |
| Primary electron current lost directly to the anode | |
| Ion production rate | |
| Ion current to the screen grid | |
| Specific impulse | |
| Maximum Child-Langmuir current density | |
| Measure of the curvature of the boundary | |
| l | Diffusion length |
| Sheath thickness or gap equivalent of the extraction stage | |
| L | Discharge chamber length |
| Total length of magnetic cusps | |
| M | Ion mass |
| m | Electron mass |
| Ion mass flow rate | |
| Neutralizer propellant flow rate | |
| Total propellant mass flow rate | |
| Neutral density | |
| Electron density | |
| Primary electron density | |
| P | Perveance; Probability |
| Ion beam power | |
| Discharge chamber pressure | |
| Input power | |
| Input power of the ionization chamber | |
| Input power of the thruster | |
| Jet power | |
| Maximum perveance | |
| Output power of the ionization chamber | |
| Output power of the thruster | |
| Electron Larmor radius | |
| Hybrid Larmor radius | |
| Ion Larmor radius | |
| Larmor radius | |
| Beam diameter | |
| S | Screen grid aperture radius-to-extraction gap ratio |
| Acceleration grid thickness |
| Extraction grid thickness | |
| Screen grid thickness | |
| T | Thrust |
| Acceleration grid trasparency | |
| Electronic temperature in eV | |
| Beam plasma electron temperature in eV | |
| Extraction grid trasparency | |
| Screen grid trasparency | |
| U | Term relative to the Acceleration-Extraction voltage ratio |
| Ionization potential | |
| Second Ionization potential | |
| Average excitation potential | |
| Bohm velocity | |
| Transverse electron velocity | |
| Transverse ion velocity | |
| Primary electron velocity | |
| V | Potential at grid position, Plasma volume inside discharge chamber |
| Acceleration grid voltage | |
| Minimum backstreaming acceleration grid voltage | |
| Net beam voltage | |
| Plasma potential into the beam | |
| Cathode drop voltage | |
| Discharge voltage | |
| Extraction grid voltage | |
| Primary electron voltage | |
| Voltage drop in the plasma | |
| Minimum local potential (or “saddle-point” voltage) | |
| Screen grid voltage | |
| Total voltage across accelerator gap | |
| Thrust correction factor | |
| Acceleration-Extraction voltage ratio | |
| Initial attempt value of acceleration-extraction voltage ratio | |
| Potential difference between the beam axis and acceleration aperture wall | |
| Acceleration stage voltage drop | |
| Extraction stage voltage drop | |
| Vacuum dielectric constant | |
| Plasma electron energy lost to the wall | |
| Discharge loss | |
| Electrical efficiency | |
| Propellant utilization efficiency |
| Discharge chamber propellant utilization efficiency | |
| Total efficiency | |
| Beam divergence angle | |
| Acceleration-extraction gap ratio | |
| Electron mobility | |
| Sum of the electron-neutral collision frequency and the electron-ion one | |
| Electron-ion collision frequency | |
| Radius of the initial beam | |
| Total inelastic collision cross-section for the primary electrons | |
| Ionization cross section | |
| Average Maxwellian inelastic cross-section | |
| Excitation cross section | |
| Anode sheath potential | |
| Acceleration-Extraction electric field ratio |
References
- Dale, E., Jorns, B., & Gallimore, A. (2020). Future directions for electric propulsion research. Aerospace, 7(9), 120. [CrossRef]
- Kawnine, T., & Kawnine, M. (2015). Short review on electric propulsion system: Ion thruster.
- Goebel, D. M., Katz, I., & Mikellides, I. G. (2023). Fundamentals of electric propulsion. John Wiley & Sons.
- Jahn, R. G. (1964). Electric propulsion. American Scientist, 52(2), 207-217.
- Tripathy, P. (2020). Overview On Electric Propulsion Systems. International Journal of Scientific and Research Publications, 10(12), 422-439.
- Wirz, R. E., Anderson, J. R., Goebel, D. M., & Katz, I. (2008). Decel grid effects on ion thruster grid erosion. IEEE transactions on plasma science, 36(5), 2122-2129.
- Walker R. et al. (2006, July). Initial experiments on a dual-stage 4-grid ion thruster for very high specific impulse and power. In 42nd AIAA/ASME/SAE/ASEE Joint Propulsion Conference & Exhibit (p. 4669).
- Coletti, M., & Gabriel, S. B. (2011, September). Numerical investigation of a dual stage variable Isp ion engine. In 32nd International Electric Propulsion Conference.
- Bramanti, C., & Fearn, D. (2007, September). The design and operation of beam diagnostics for the dual stage 4-grid ion thruster. In 30th International Electric Propulsion Conference, Florence, Italy September (pp. 17-20).
- Kim, J., Gardner, W. L., & Menon, M. M. (1979). Experimental study of ion beam optics in a two-stage accelerator. Review of Scientific Instruments, 50(2), 201-206. [CrossRef]
- Martin, A. R. (1984). High power beams for neutral injection heating. Vacuum, 34(1-2), 17-24. [CrossRef]
- Coupland, J. R., & Thompson, E. (1971). The production of high current, high quality beams of ions and neutral particles. Review of Scientific Instruments, 42(7), 1034-1037. [CrossRef]
- Okumura, Y., Matsuda, S., Mizutani, Y., Ohara, Y., & Ohga, T. (1980). Quasi–dc extraction of 70 keV, 5 A ion beam. Review of Scientific Instruments, 51(6), 728-734. [CrossRef]
- Bramanti, C., et al. (2006). The innovative dual-stage 4-grid ion thruster concept-theory and experimental results. In 57th International Astronautical Congress (pp. C4-4).
- Marques, R. I., & Gabriel, S. B. (2009, September). Dual stage four grid (DS4G) ion engine for very high velocity change missions. In 31 st International Electric Propulsion Conference (pp. 20-24).
- Coletti, M., & Gabriel, S. (2011). Dual stage ion optics, a parametric study. In 42nd AIAA Plasmadynamics and Lasers Conference in conjunction with the 18th International Conference on MHD Energy Conversion (ICMHD) (p. 3741).
- Coletti, M., & Gabriel, S. (2011). Dual Stage Ion Optics, a Parametric Study on Performances and Lifetime. In 47th AIAA/ASME/SAE/ASEE Joint Propulsion Conference & Exhibit (p. 5735).
- Coletti, M., Gessini, P., & Gabriel, S. B. (2010). A 4-gridded ion engine for high impulse mission. Space Propulsion.
- Coletti, M., Marques, R. I., & Gabriel, S. B. (2010, March). Discharge hollow cathode design for a 4-Gridded ion Engine. In 2010 IEEE Aerospace Conference (pp. 1-12). IEEE.
- Jia, L., et al. (2019). An experimental study of a dual-stage 4-grid ion thruster. Plasma Sources Science and Technology, 28(10), 105003. [CrossRef]
- Jia, L., Zhang, T., Chen., J., Jia, Y., Liu, M. (2017). Geometryc Parameteric Study of Dual Stage Ion Optics. Plasma Sources Science and Technology, 54(10), 7300000.
- Bramer, E. C. (2014). Development of a particle in cell code for the simulation of dual stage ion thrusters (Doctoral dissertation, University of Sussex).
- Alifano, F., Panelli, M., & Battista, F. (2023). Preliminary Design Tool for Medium-Low-Power Gridded Ion Thrusters. Applied Sciences, 13(9), 5600. [CrossRef]
- Lettera, E., et al. (2024). Preliminary Design for Air-Breathing Gridded Ion Thruster. In International Astronautical Conference.
- Patterson, M. J., Grisnik, S. P., & Soulas, G. C. (1998, May). Scaling of Ion Thrusters to Low Power. In International Electric Propulsion Conference (No. IEPC-97-098).
- Rapp, D., & Englander-Golden, P. (1965). Total cross sections for ionization and attachment in gases by electron impact. I. Positive ionization. The Journal of Chemical Physics, 43(5), 1464-1479. [CrossRef]
- Hayashi, M. (1983). Determination of electron-xenon total excitation cross-sections, from threshold to 100 eV, from experimental values of Townsend’s α. Journal of Physics D: Applied Physics, 16(4), 581. [CrossRef]
- Wirz, R., Polk, J., Marrese, C., Mueller, J., Escobedo, J., & Sheehan, P. (2001, October). Development and testing of a 3cm electron bombardment micro-ion thruster. In International Electric Propulsion Conference. Pasadena, CA: Jet Propulsion Lab.
- Kim, J., Whealton, J. H., & Schilling, G. (1978). A study of two-stage ion-beam optics. Journal of Applied Physics, 49(2), 517-524. [CrossRef]
- Holmes, A. J. T., & Thompson, E. (1981). Beam steering in tetrode extraction systems. Review of Scientific Instruments, 52(2), 172-179. [CrossRef]
- Williams, J., Goebel, D., & Wilbur, P. (2003, July). Analytical model of electron backstreaming for ion thrusters. In 39th AIAA/ASME/SAE/ASEE Joint Propulsion Conference and Exhibit (p. 4560).
- Sovey, J. S. (1984). Improved ion containment using a ring-cusp ion thruster. Journal of Spacecraft and Rockets, 21(5), 488-495. [CrossRef]
- Beattie, J. R., & Poeschel, R. L. (1984, January). Ring-cusp ion thrusters. In International Electric Propulsion Conference.
- De Heer, F. J., Jansen, R. H. J., & Van der Kaay, W. (1979). Total cross sections for electron scattering by Ne, Ar, Kr and Xe. Journal of Physics B: Atomic and Molecular Physics, 12(6), 979. [CrossRef]
- De Riso, V., Panelli, M., & Battista, F. (2024). Particle-In-Cell Simulation of Heavy Species in Air Breathing Hall Effect Thruster.
- Knapp, D. W. (2012). Implementation of a ¼ inch hollow cathode into a miniature xenon ion thruster (MiXI). California Polytechnic State University.
- Polk, J. E., Kakuda, R. Y., Anderson, J. R., Brophy, J. R., Rawlin, V. K., Sovey, J., & Hamley, J. (2000, March). In-flight performance of the NSTAR ion propulsion system on the Deep Space One mission. In 2000 IEEE Aerospace Conference. Proceedings (Cat. No. 00TH8484) (Vol. 4, pp. 123-148). IEEE. [CrossRef]
Figure 1.
Specific impulse and thrust operating ranges for electric space propulsion systems with power level contours.
Figure 1.
Specific impulse and thrust operating ranges for electric space propulsion systems with power level contours.
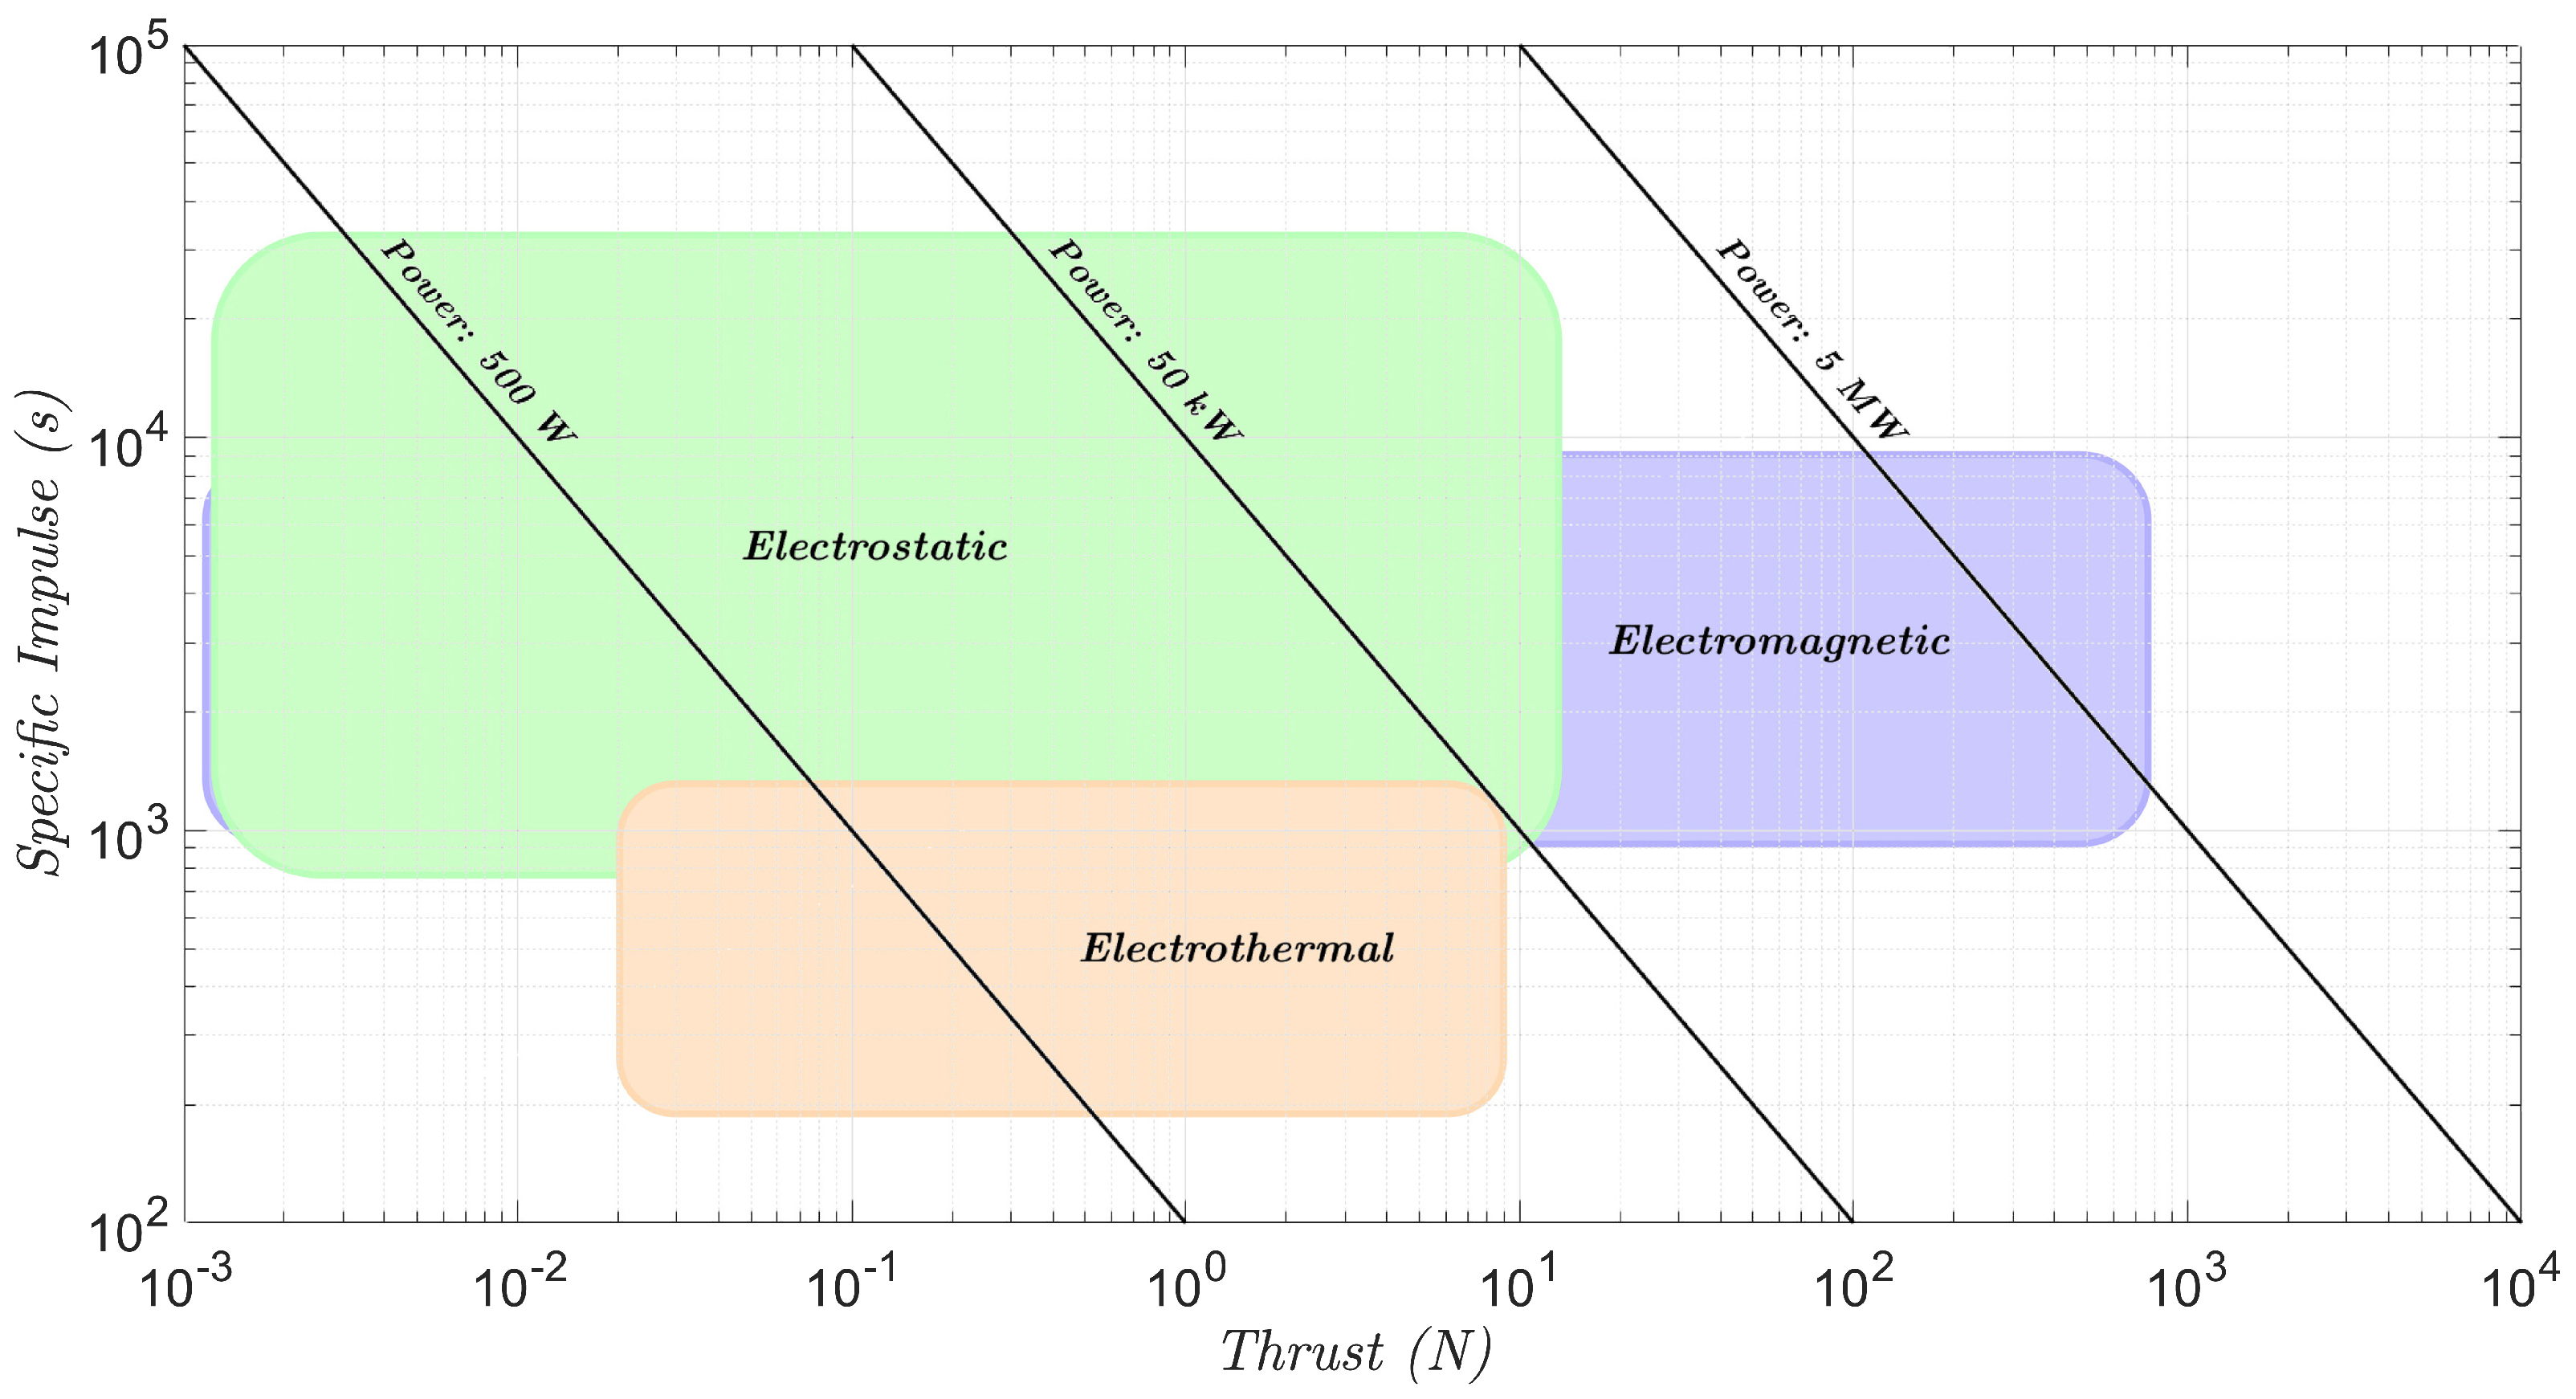
Figure 2.
Dual Stage Gridded ion thruster main components and working principle.
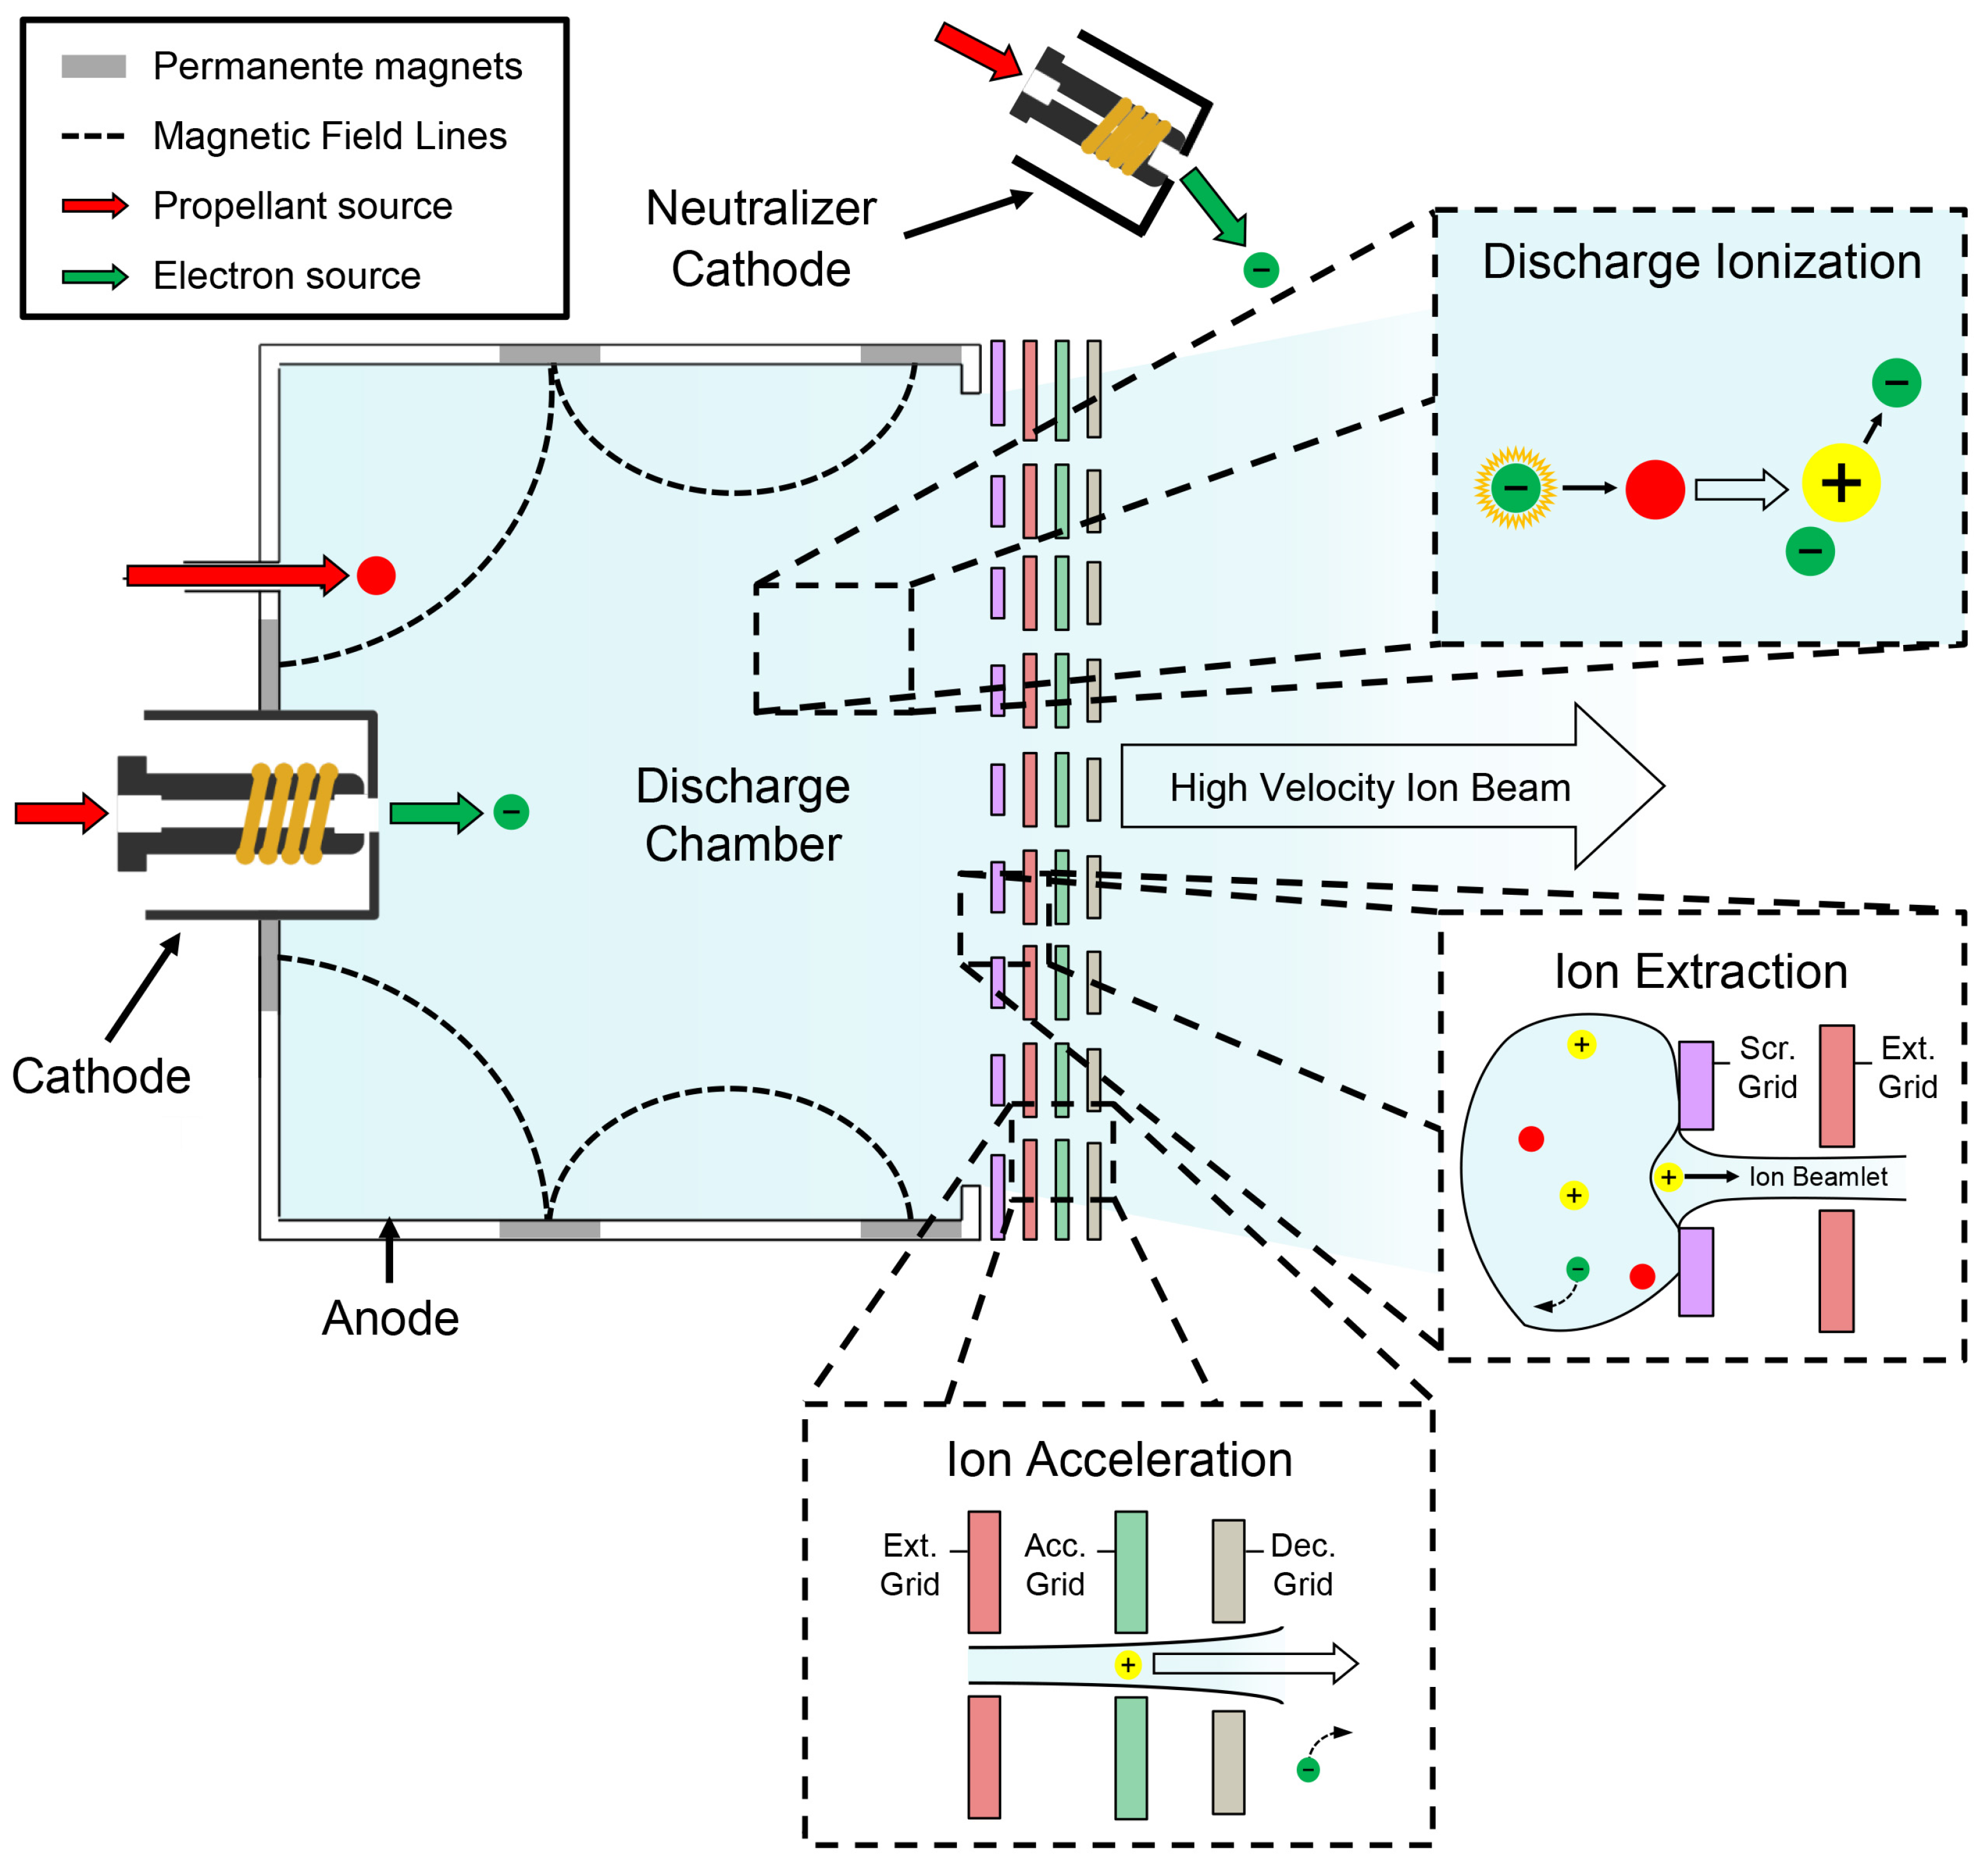
Figure 3.
Flowchart of the GPM for DC-DSGITs with inputs and main outputs.
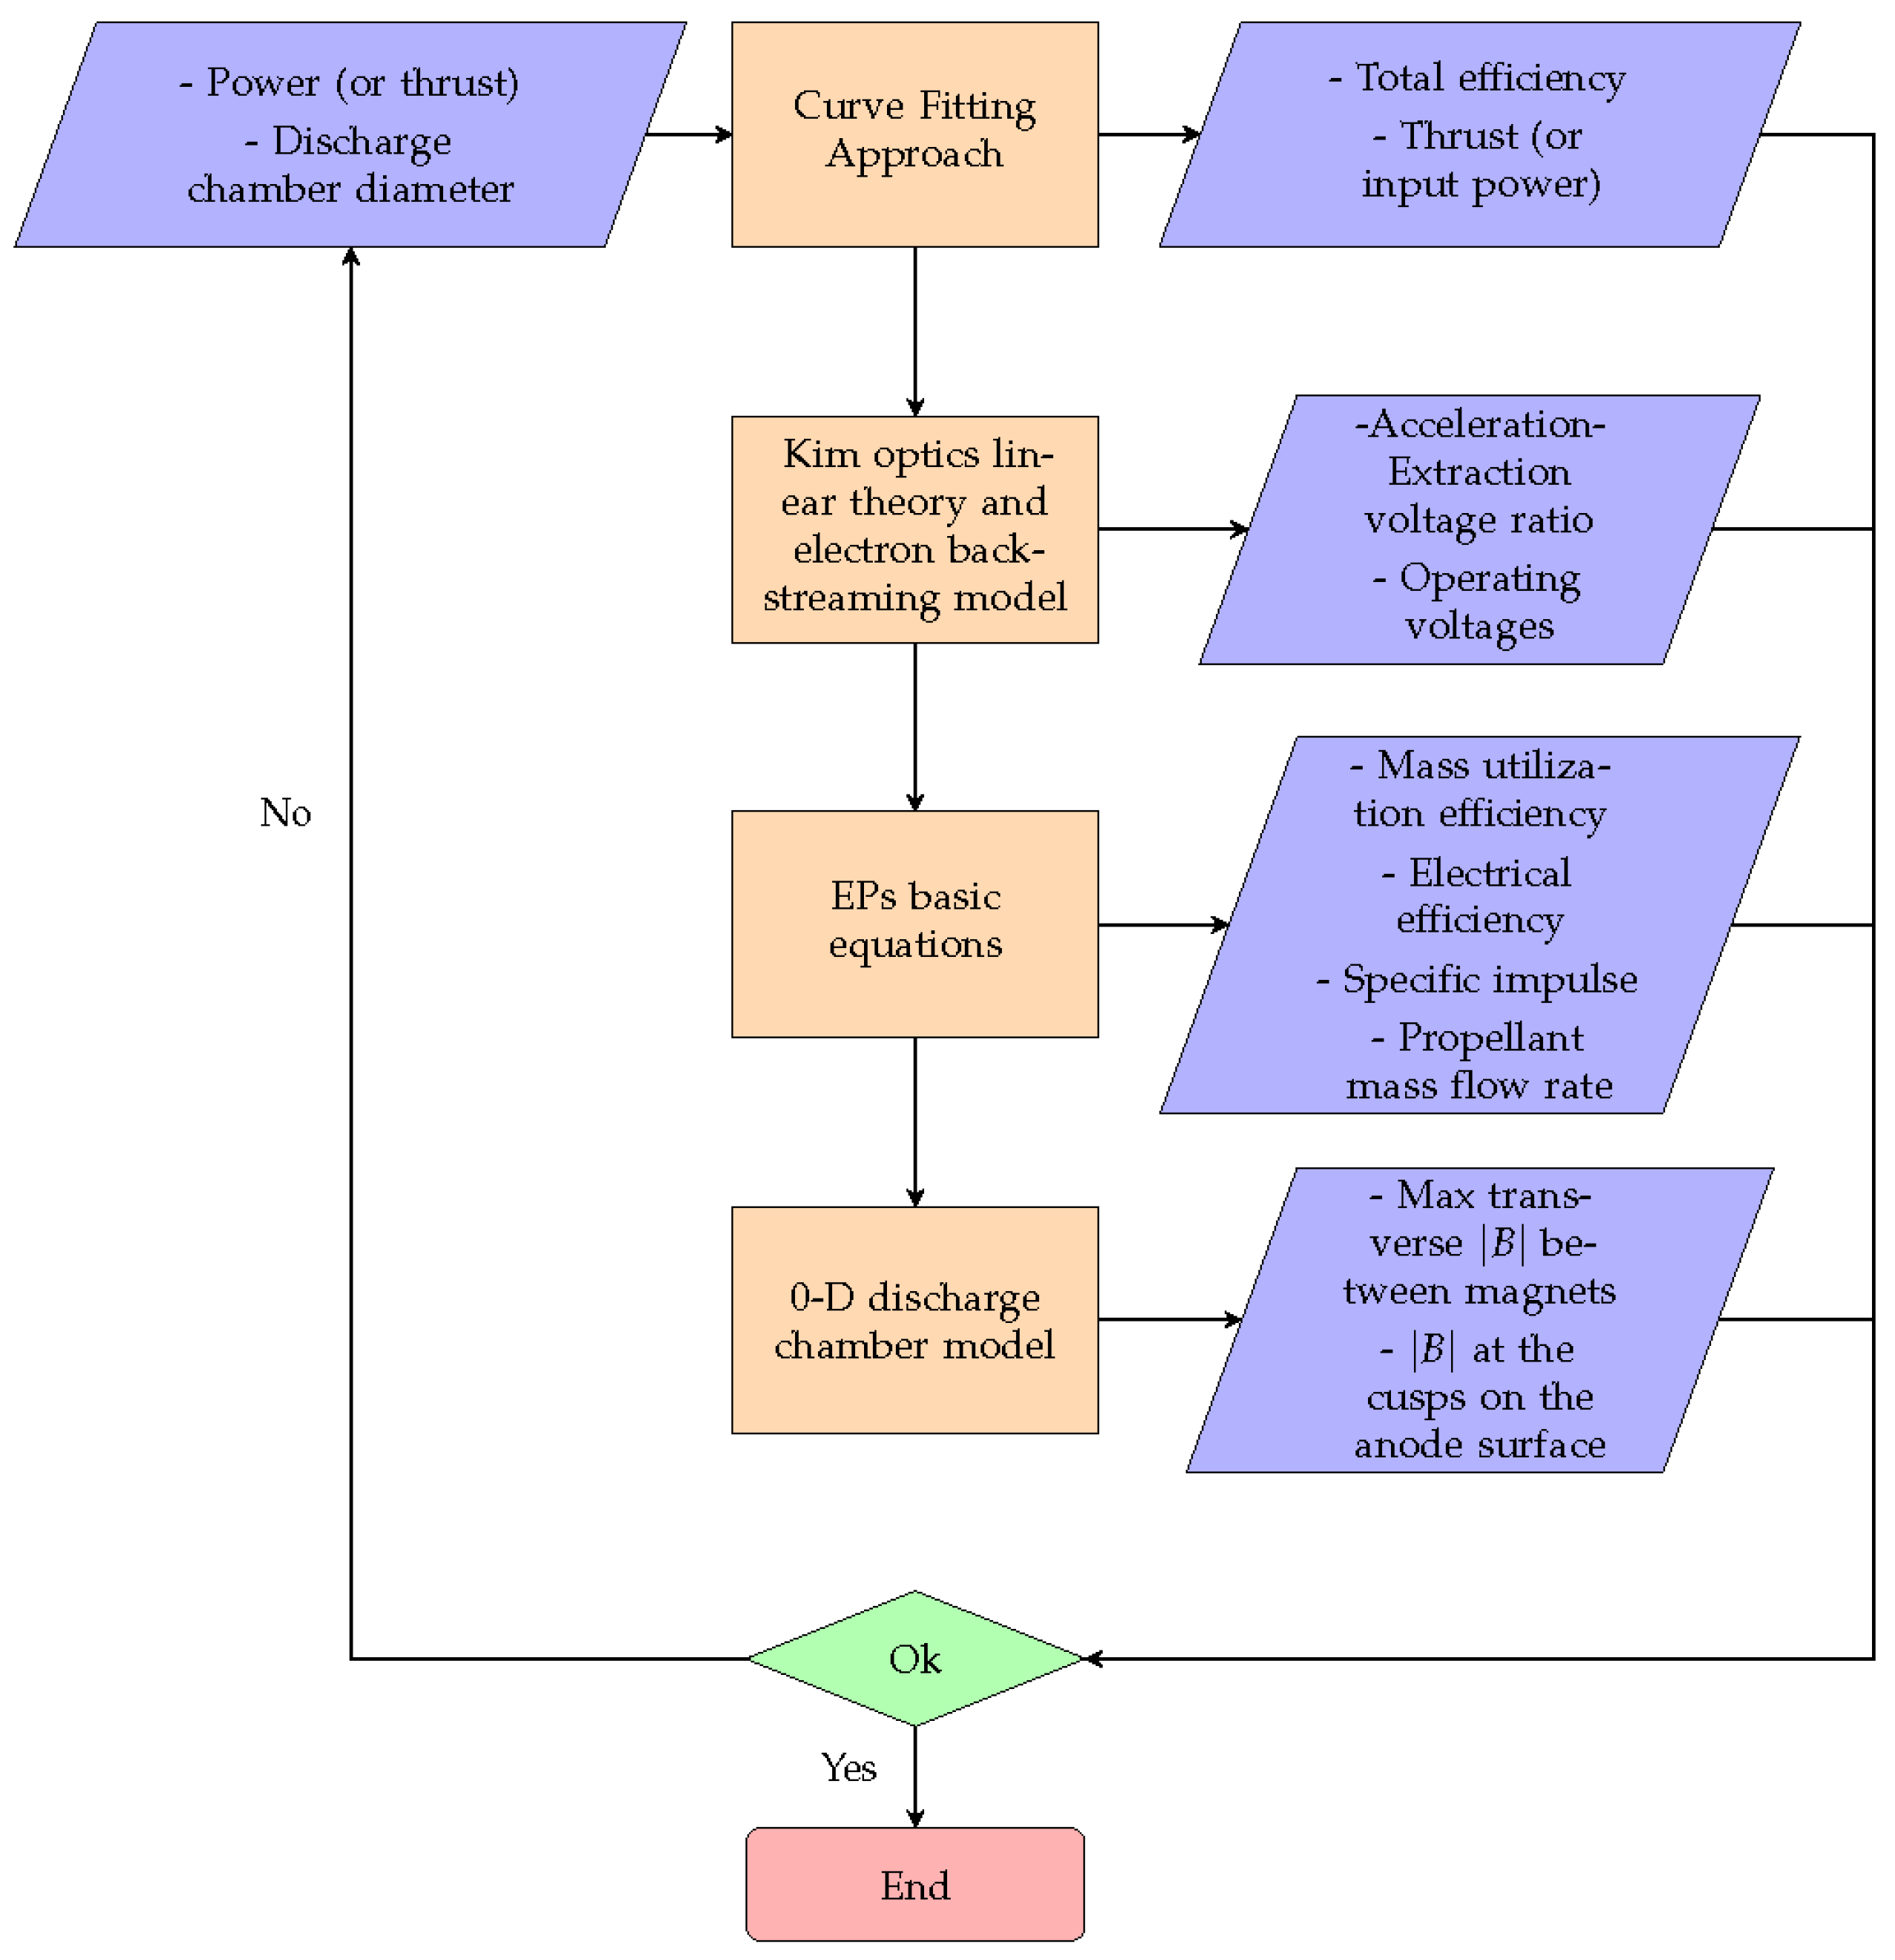
Figure 4.
Power density-thrust density curve for DSGIT using Xenon as propellant. The black dots represent the data collected for the DSGIT experiments [15,22], under different operating conditions, while the red line represents the fitting curve exploited in the model.
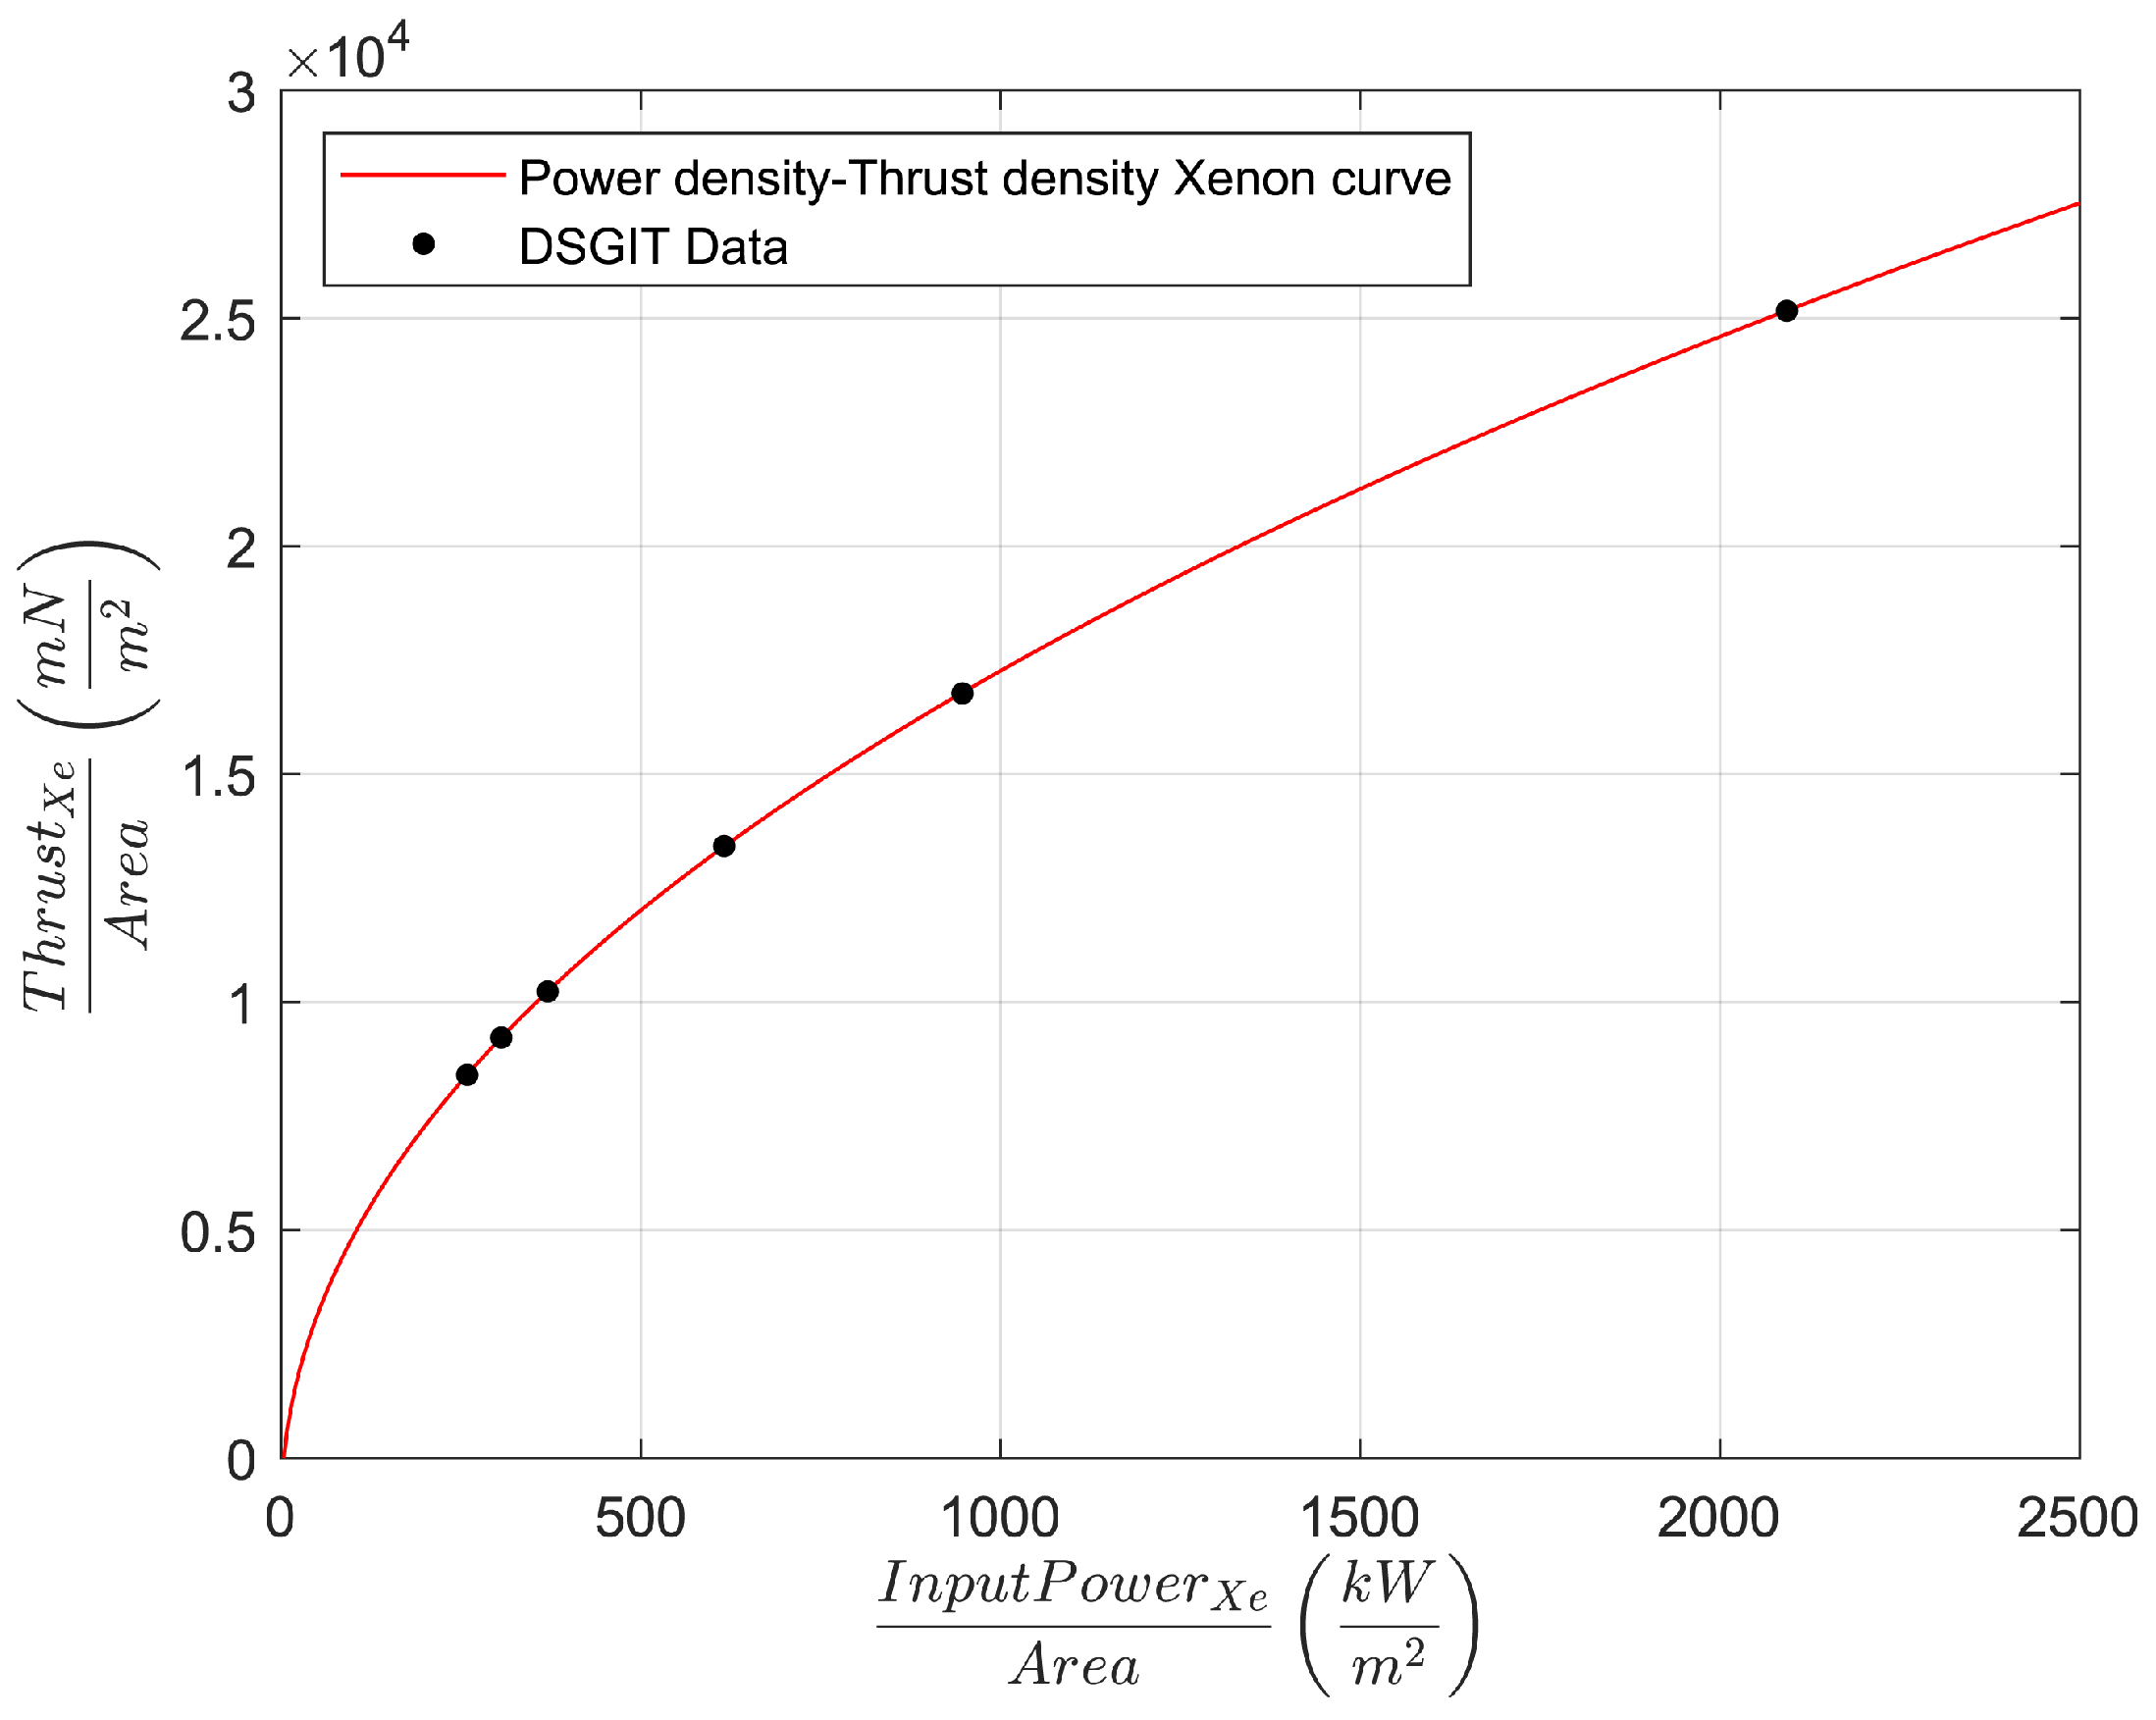
Figure 5.
Sketch of a convention GIT extraction system with electric lens analogy.
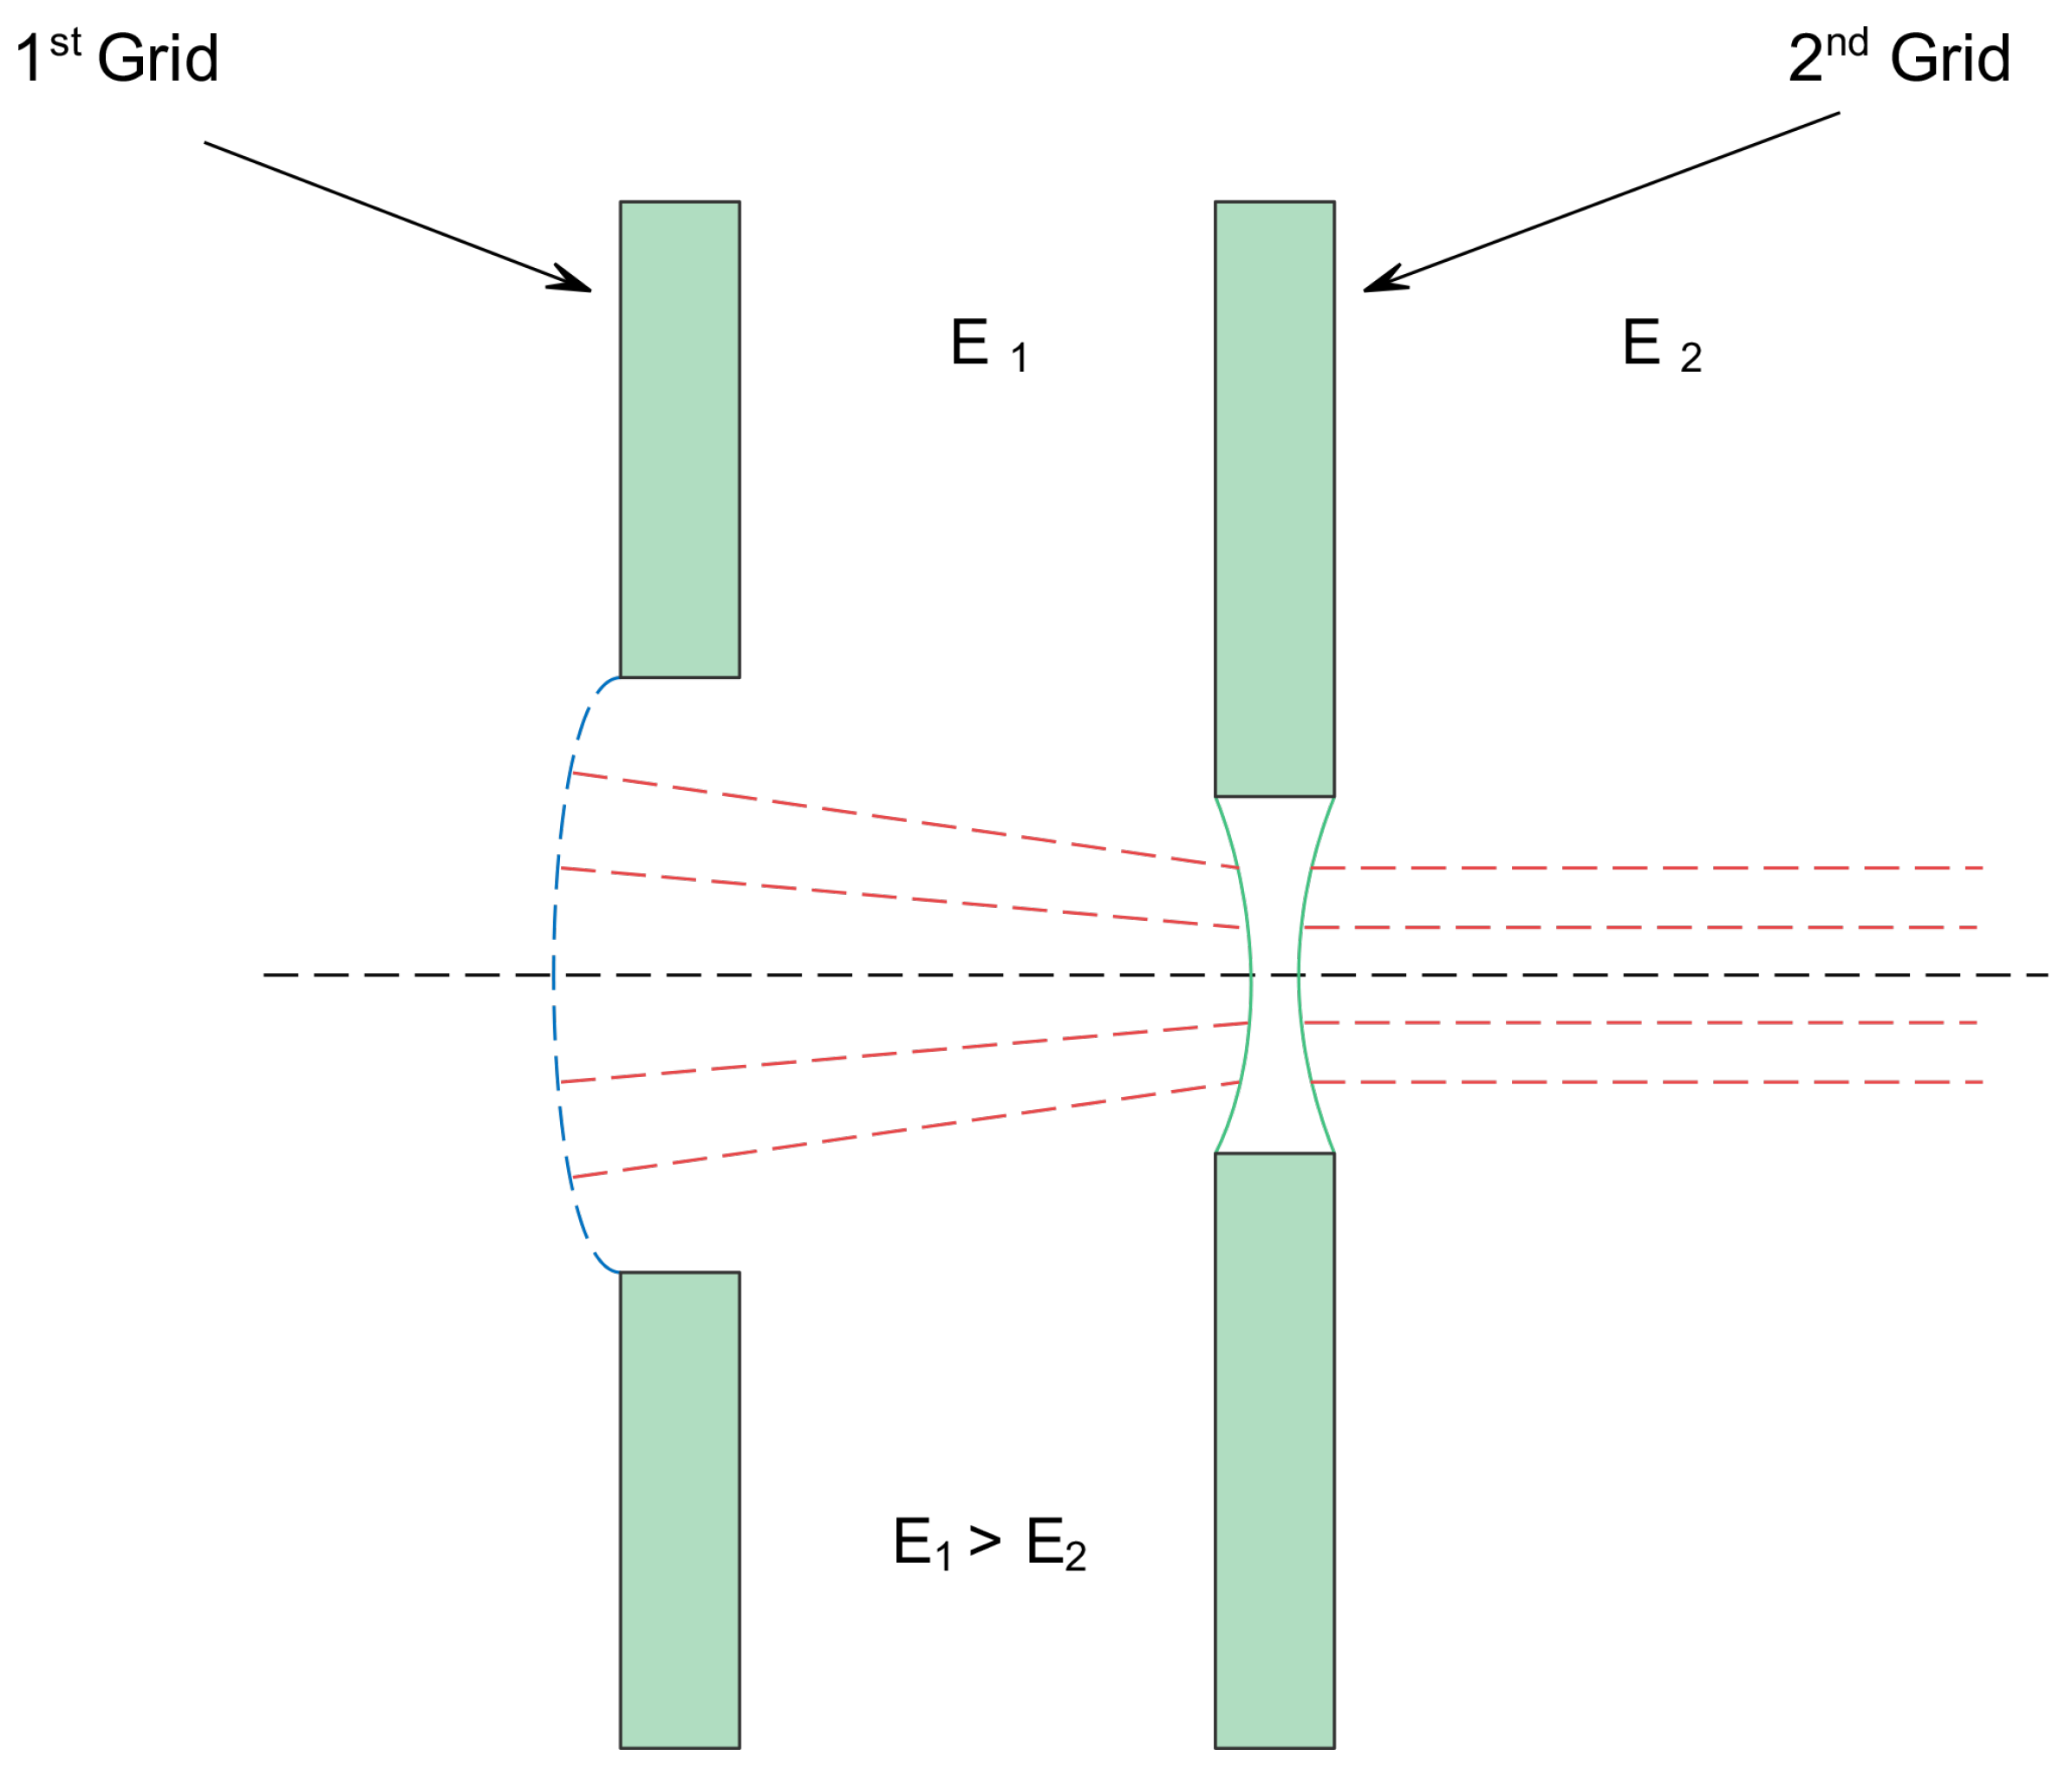
Figure 6.
Sketch of a DSGIT extraction system with the electric lens analogy: (a) ; (b) .
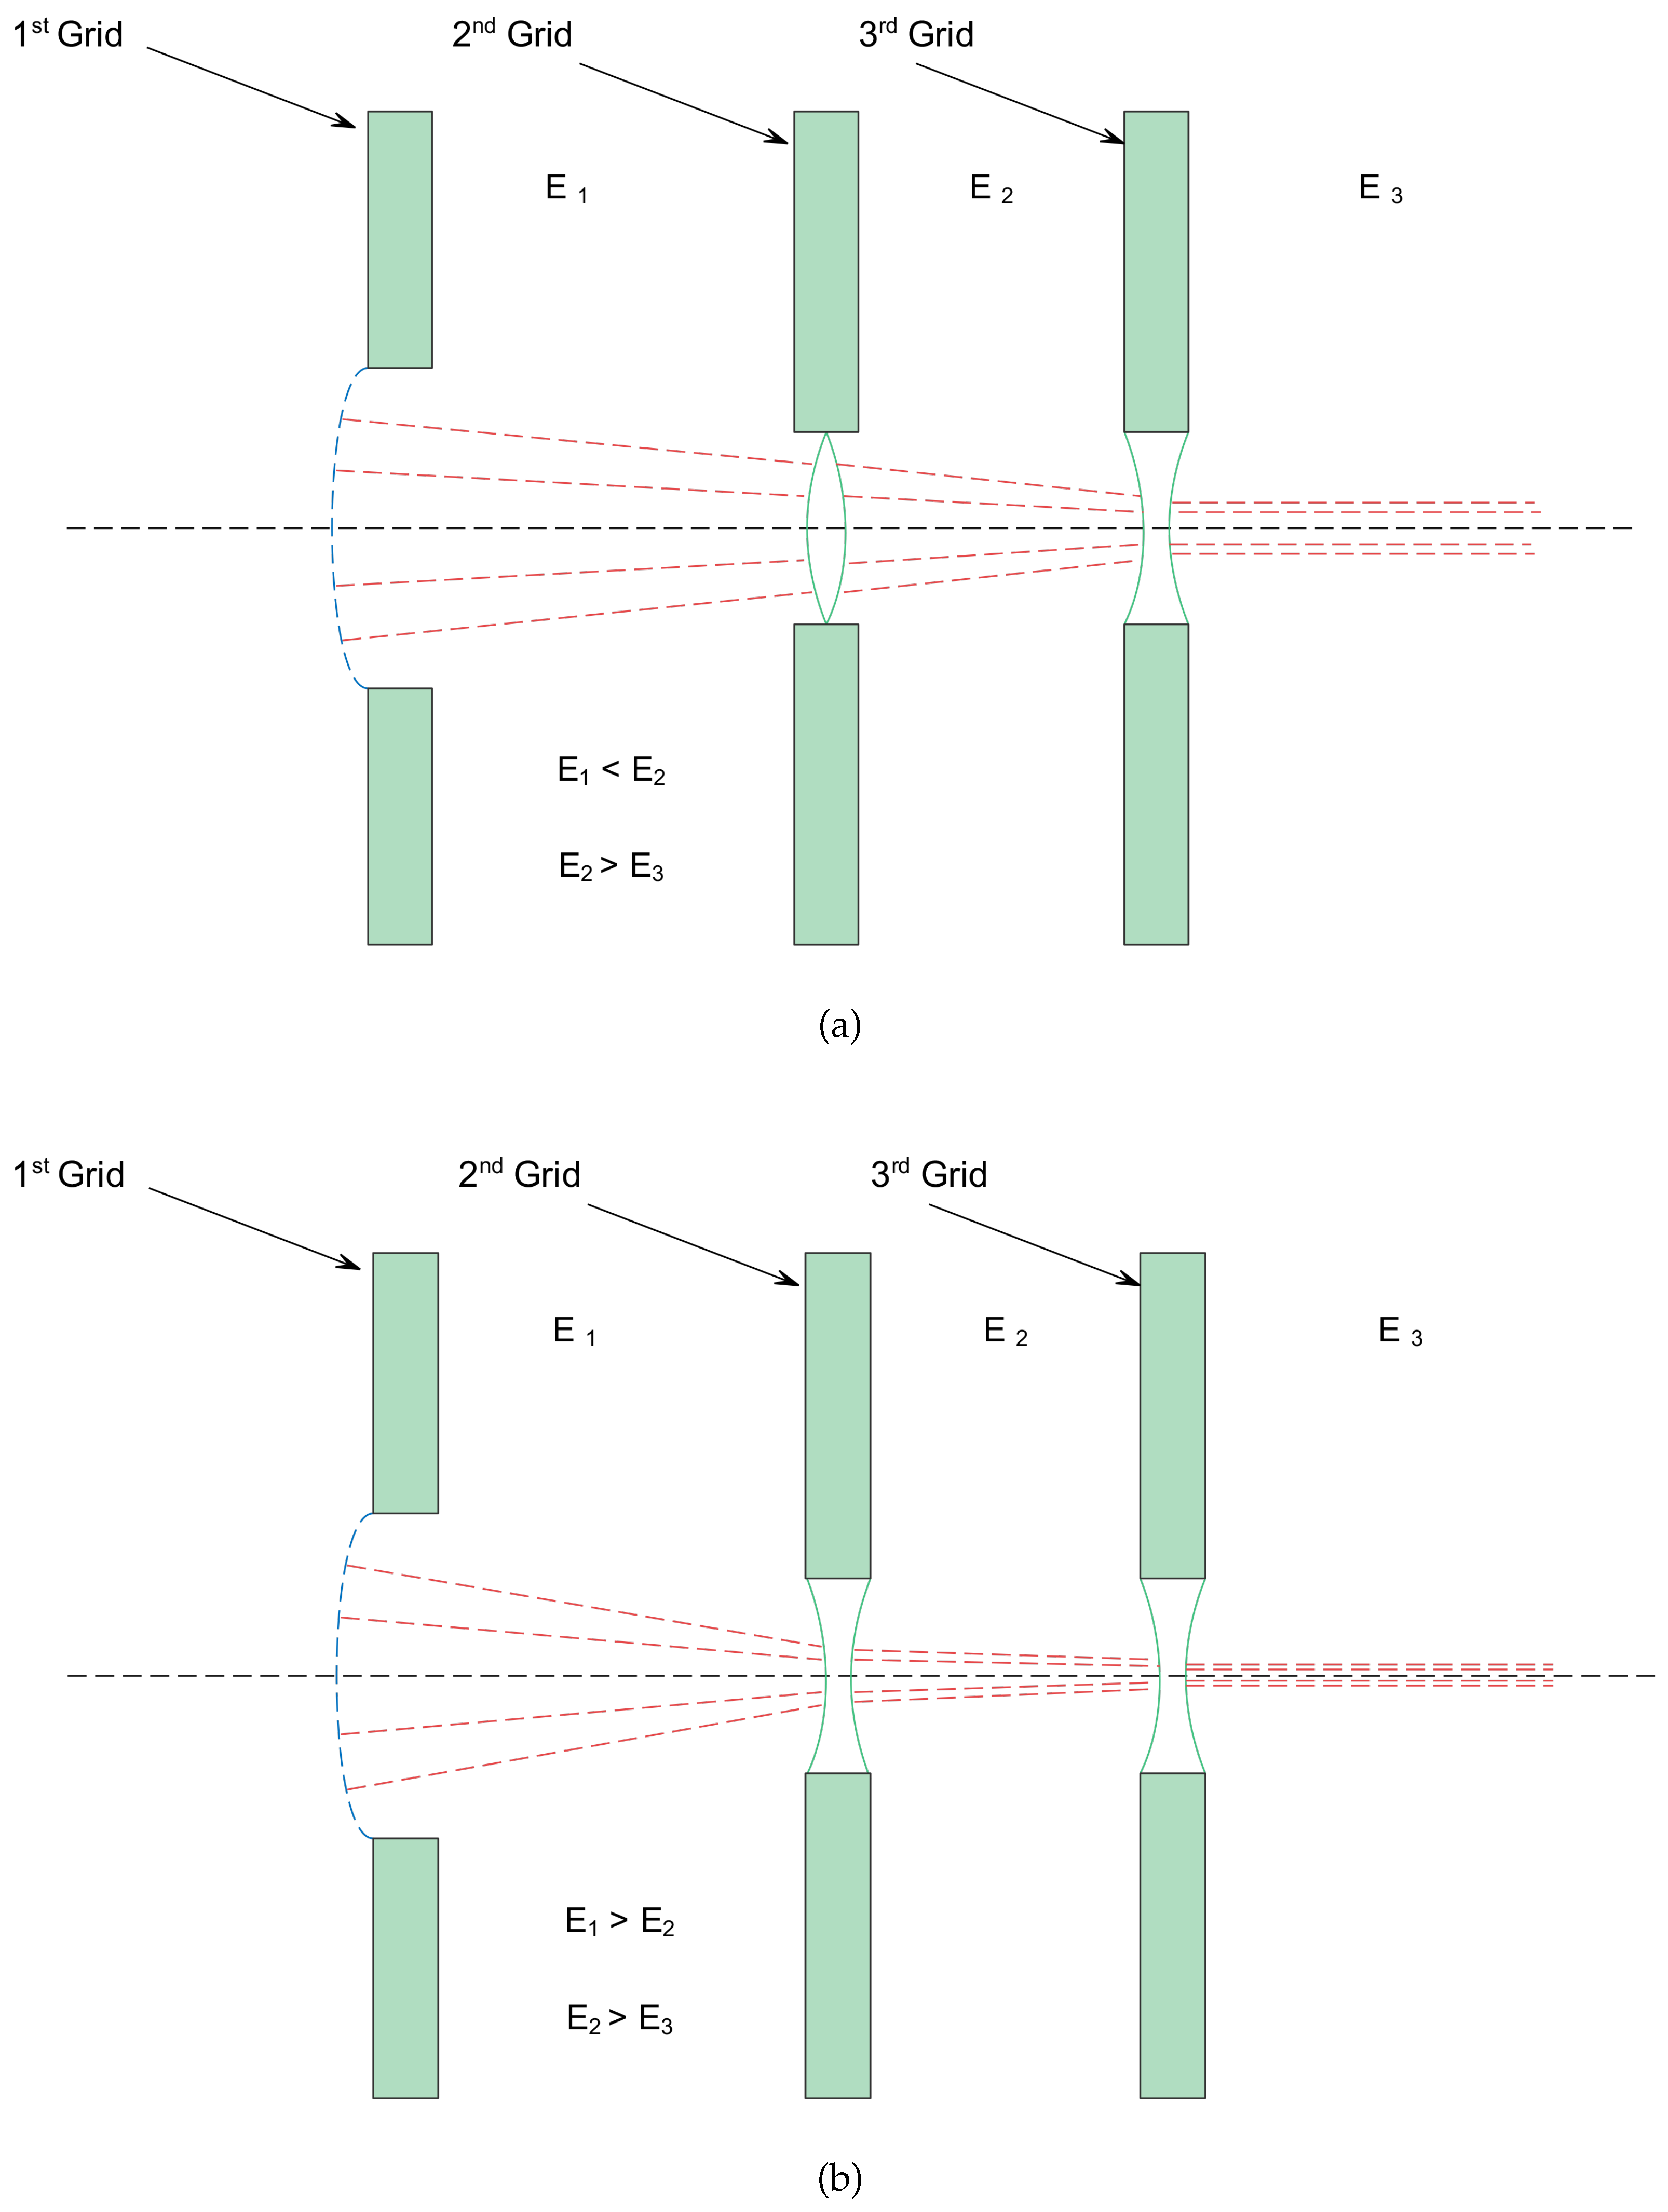
Figure 7.
Flowchart of the ion optic and working parameters determination.
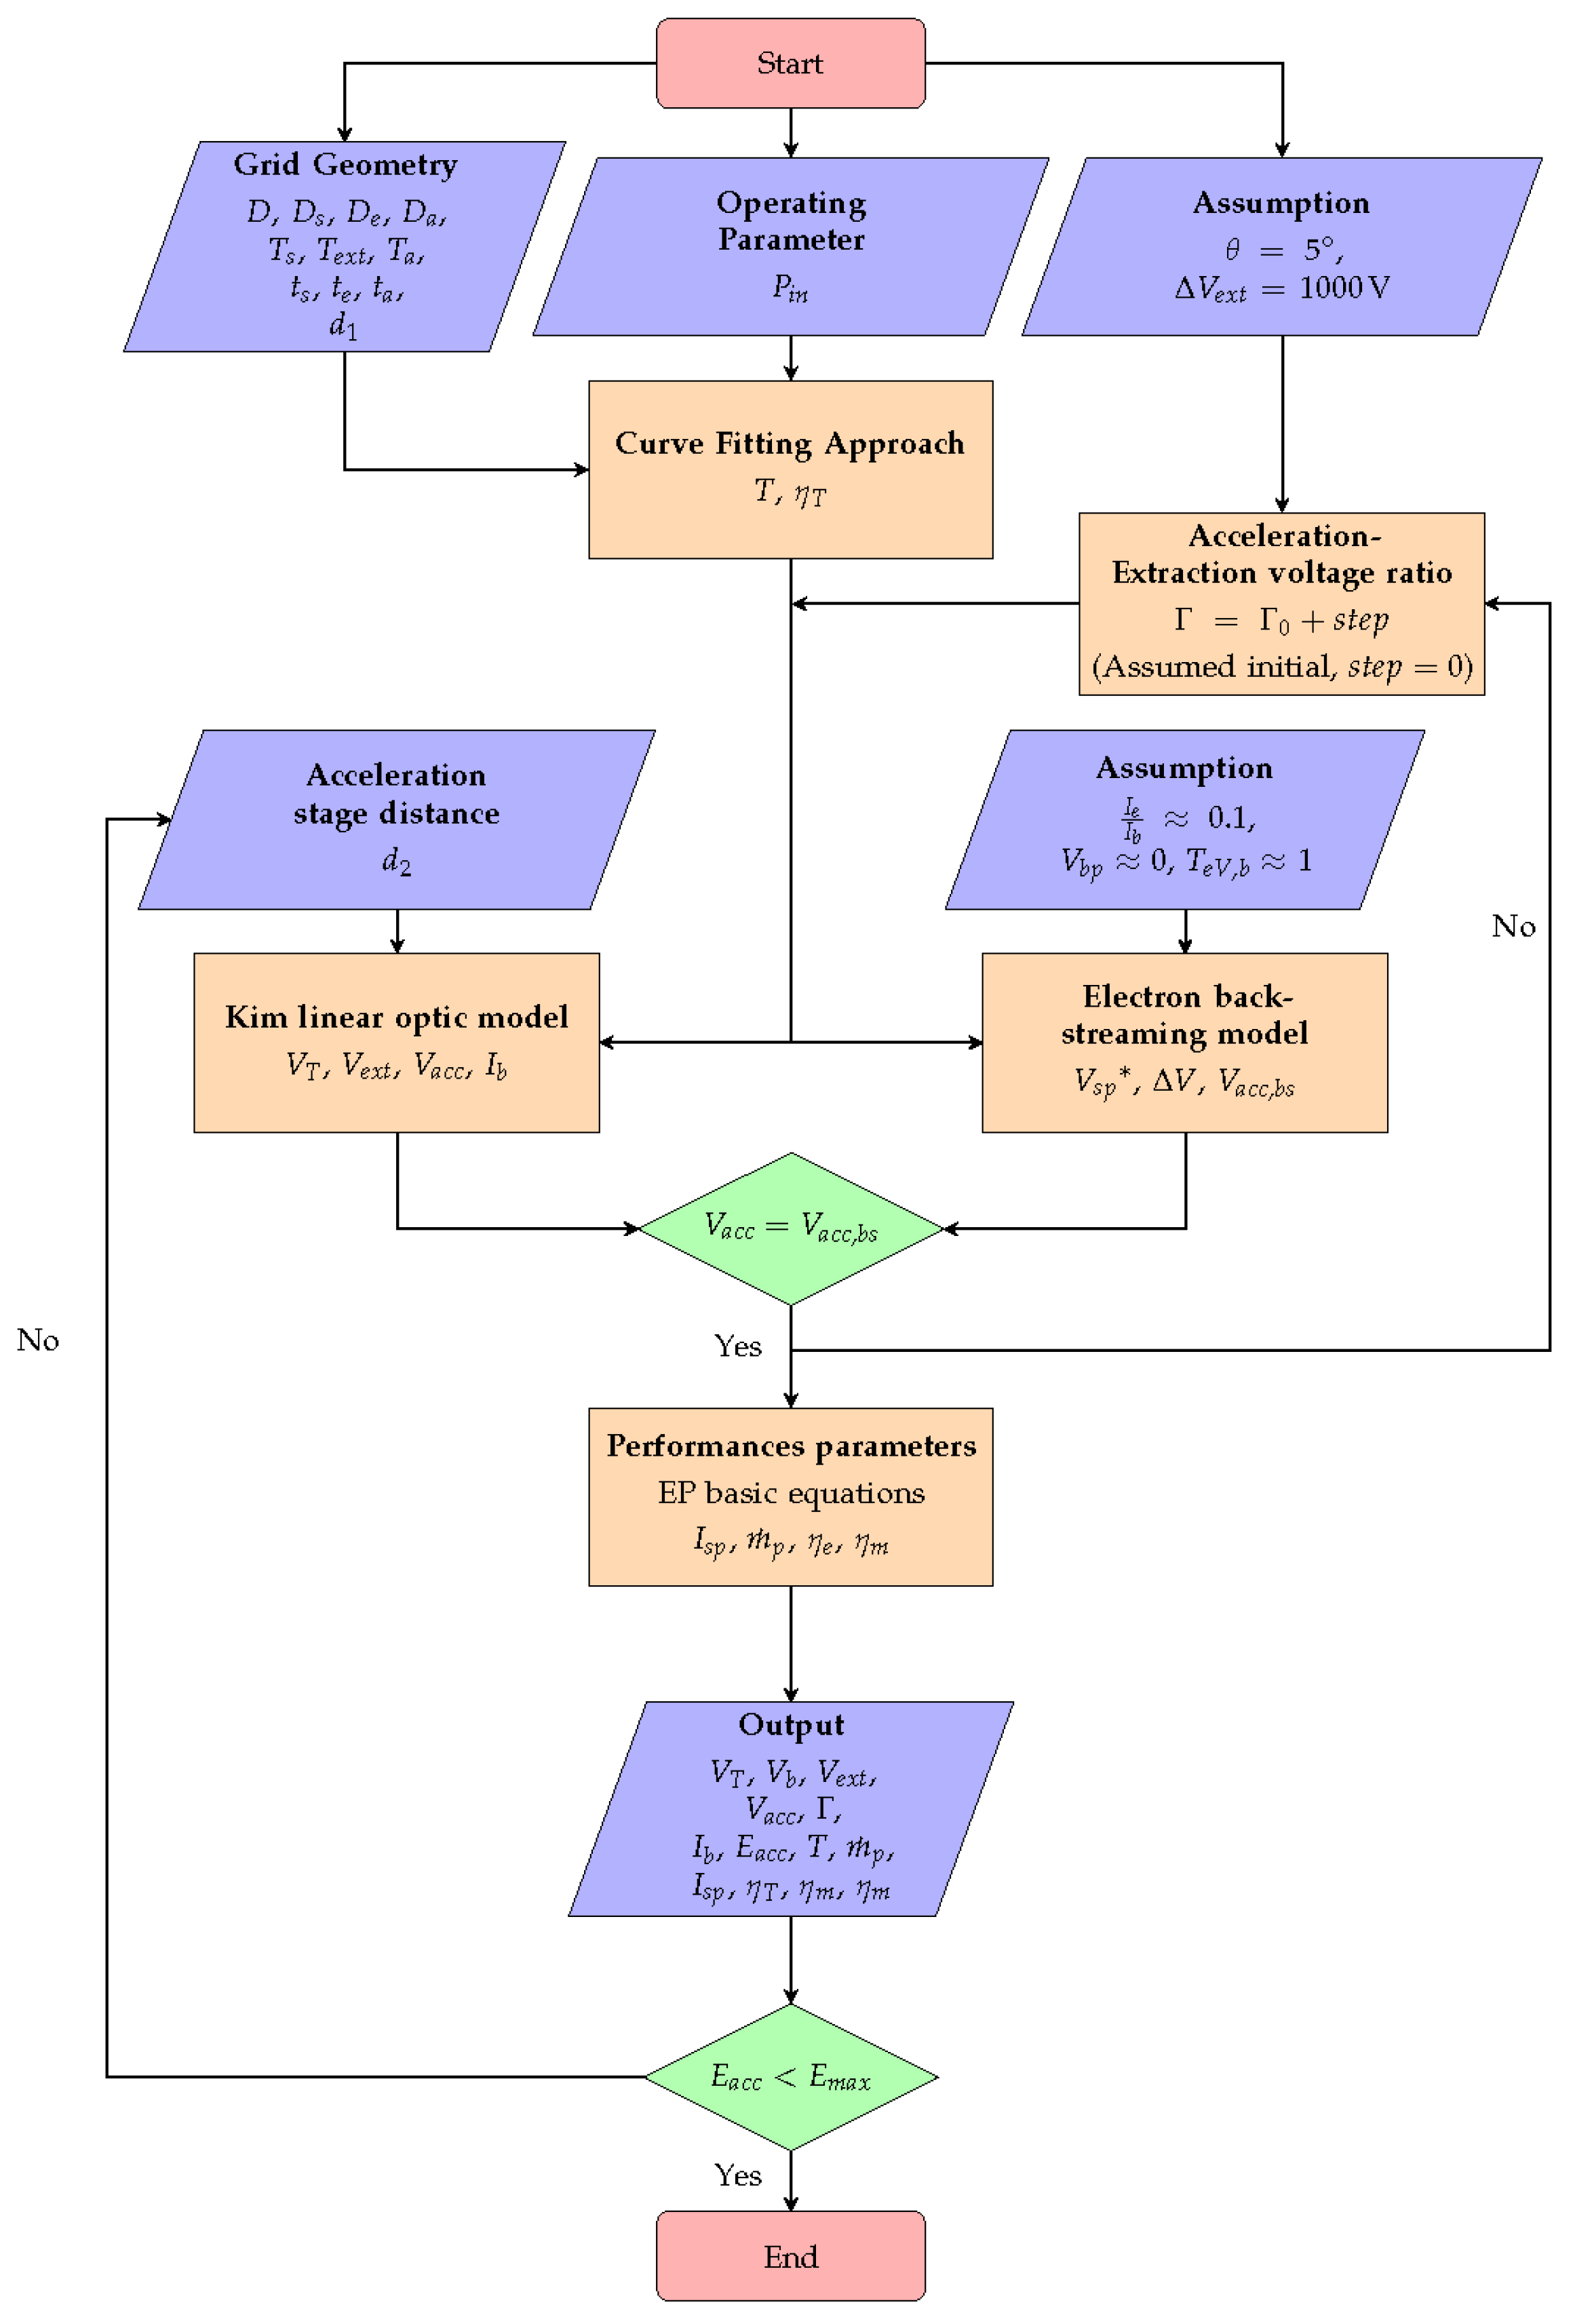
Figure 8.
Rapresentation of the main geometrical parameters of the grids.
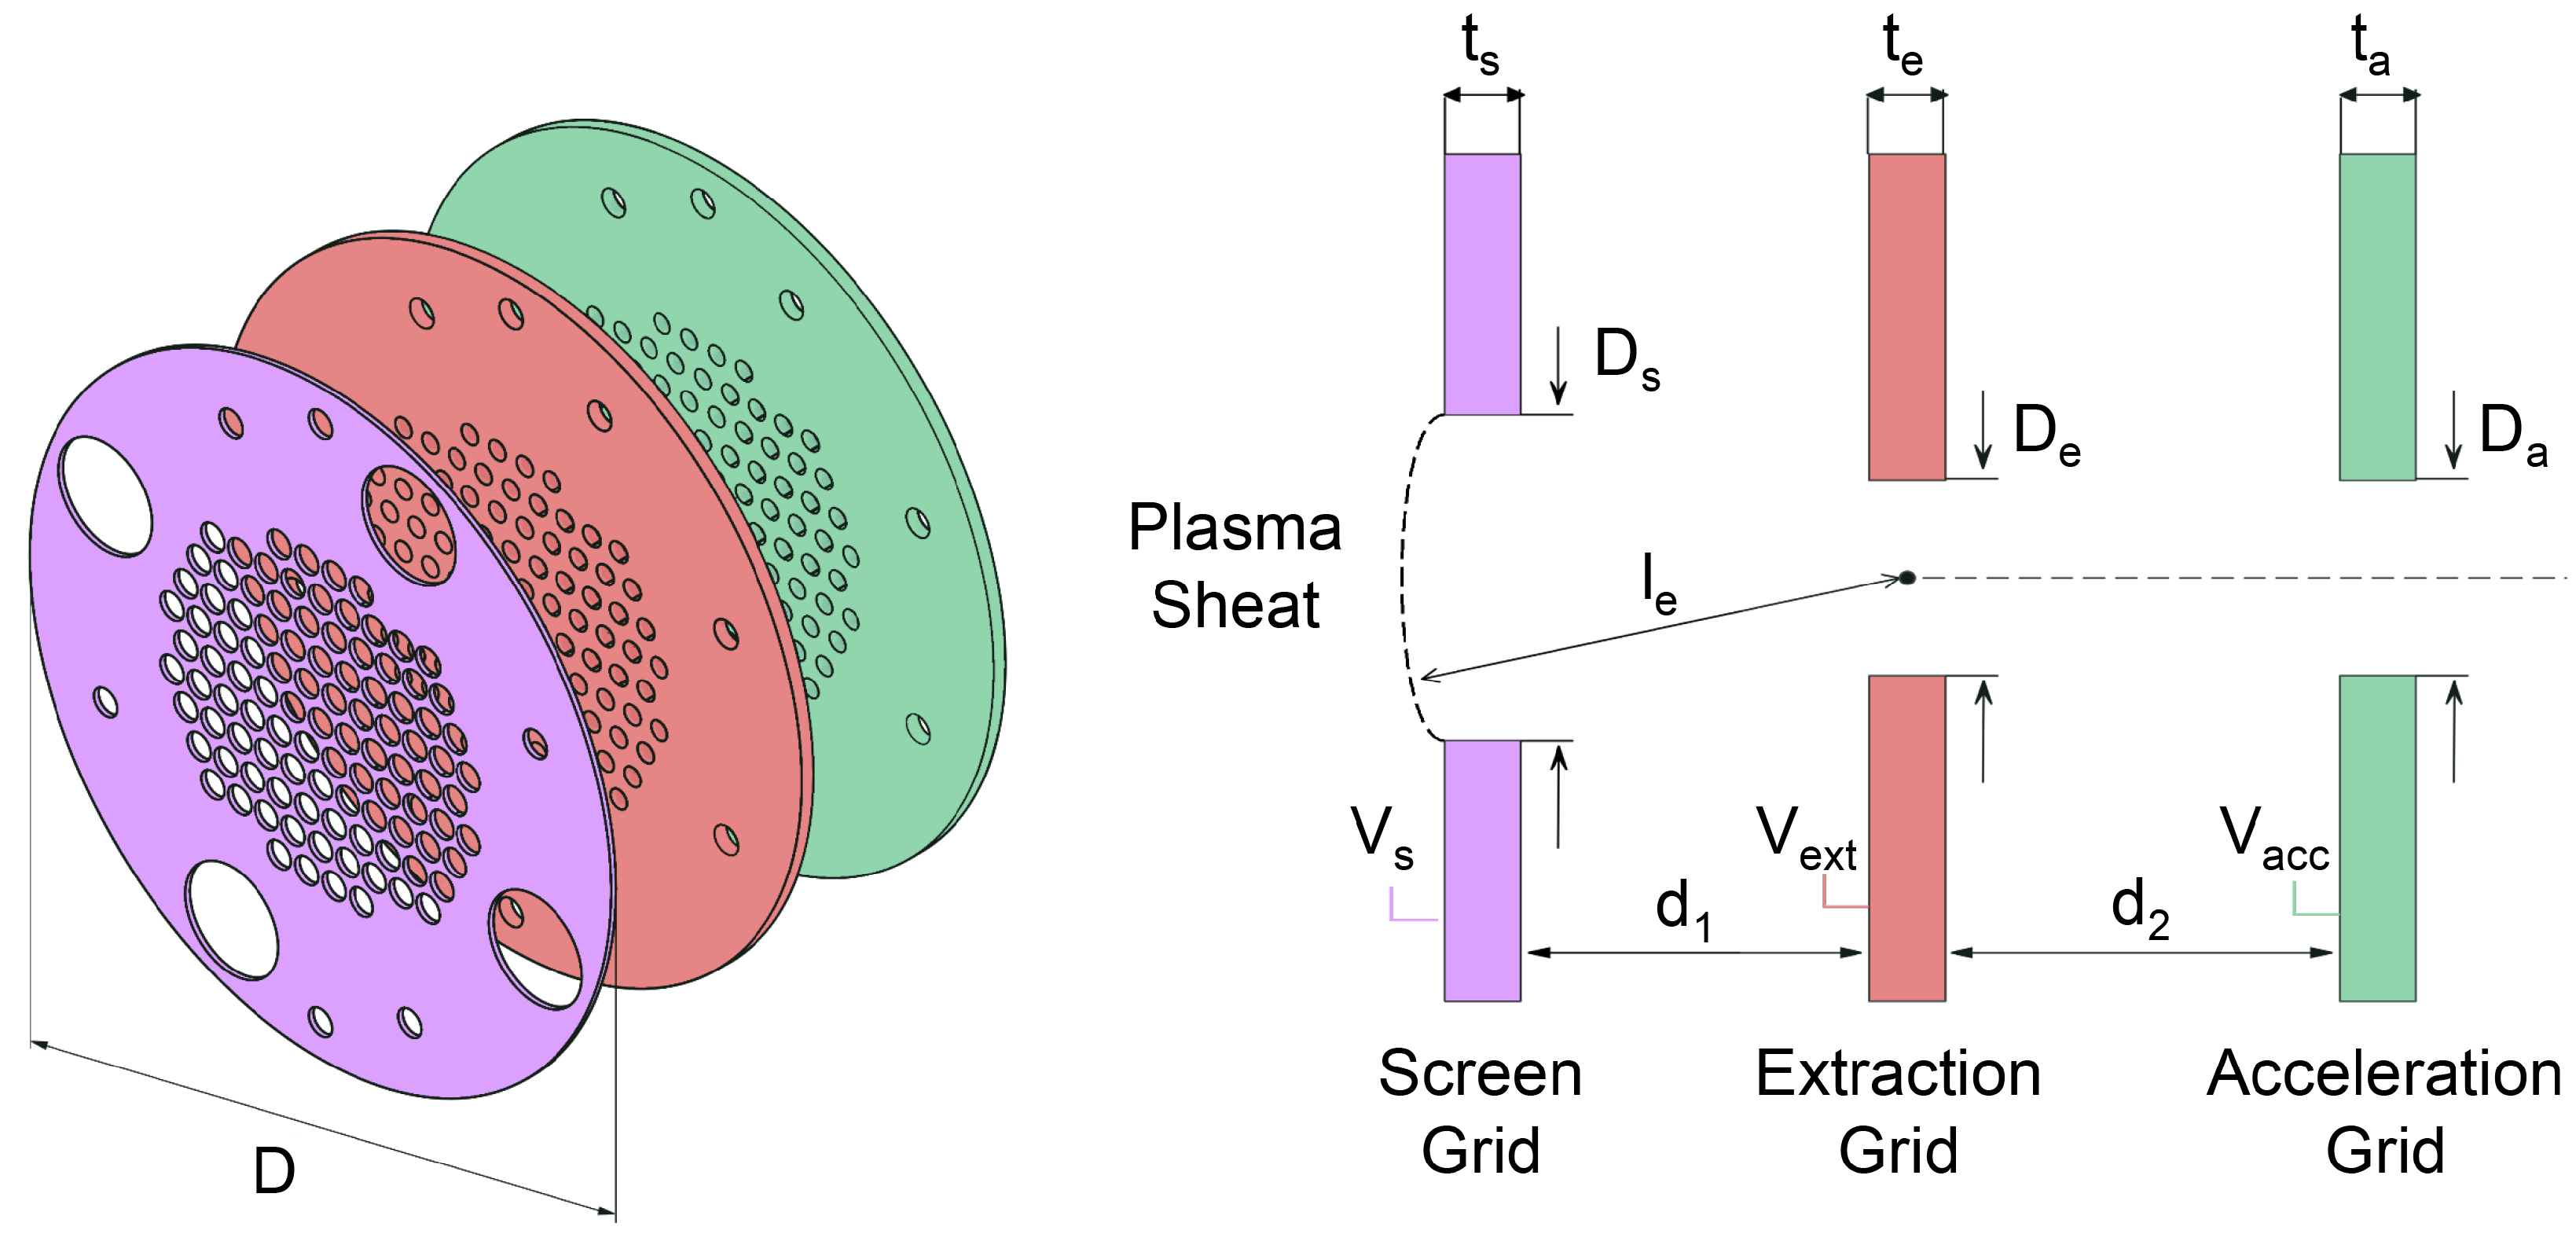
Figure 9.
Xenon ionization cross-section.
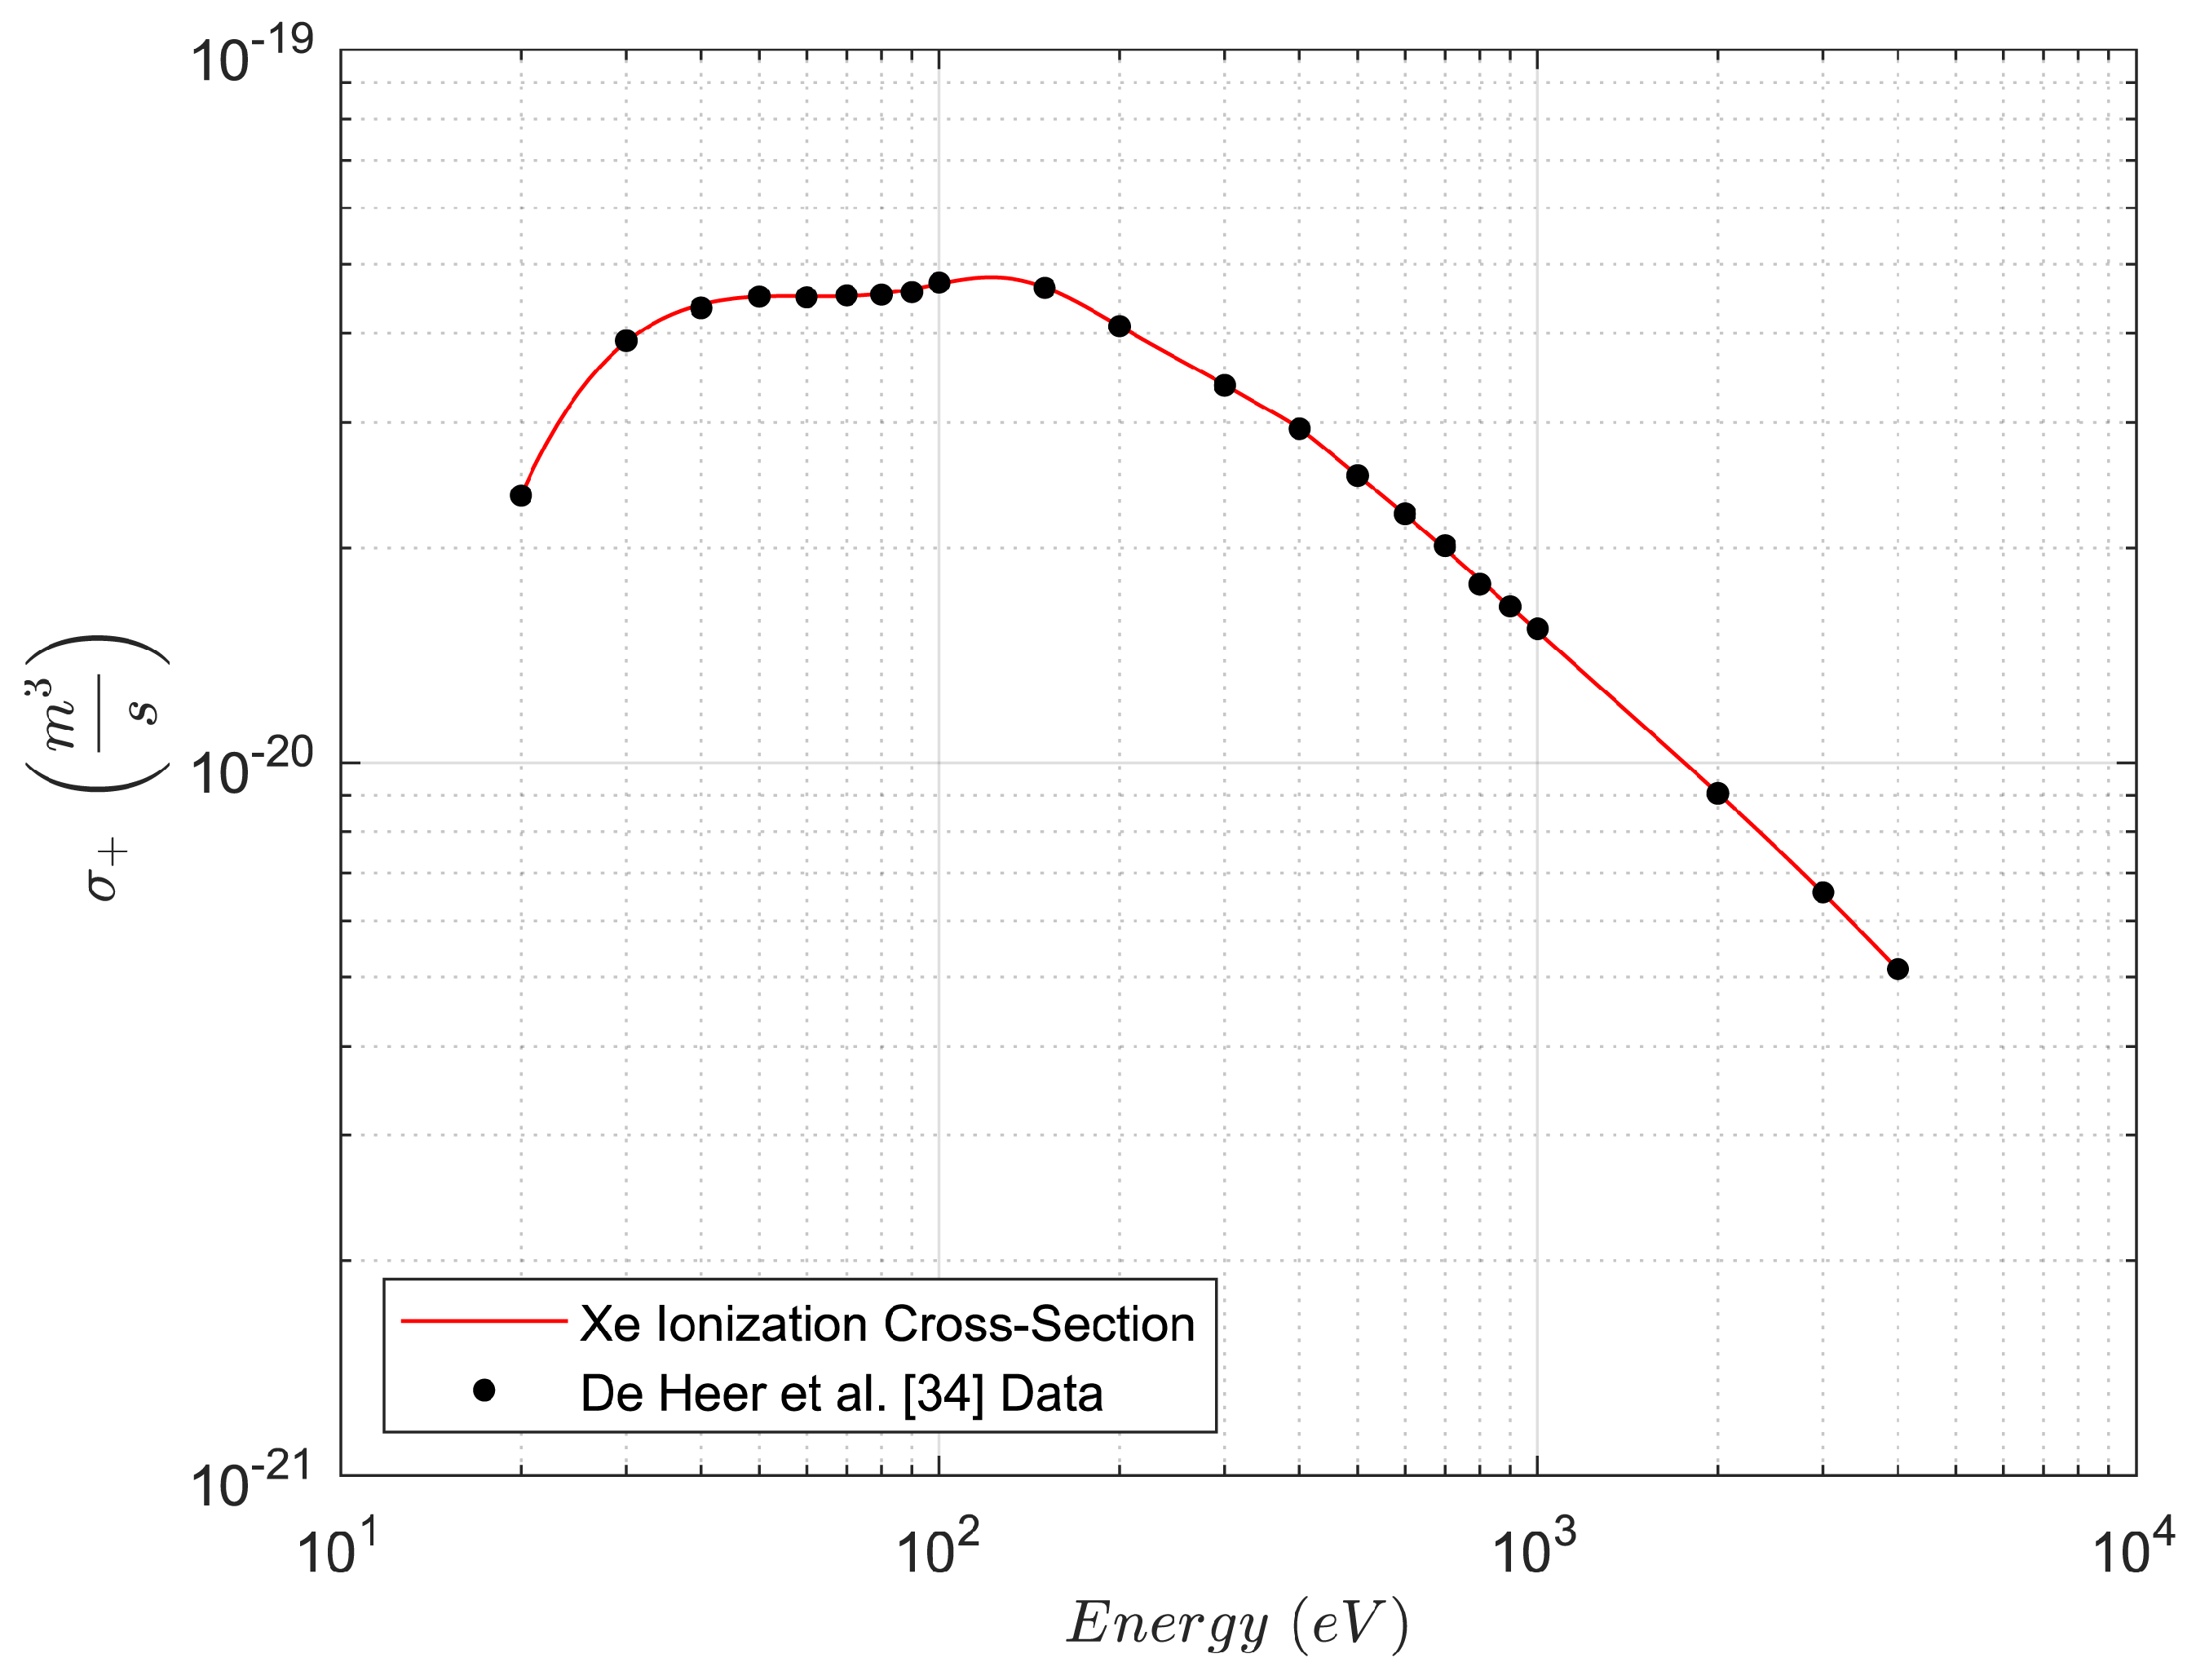
Figure 10.
Xenon excitation cross-section.
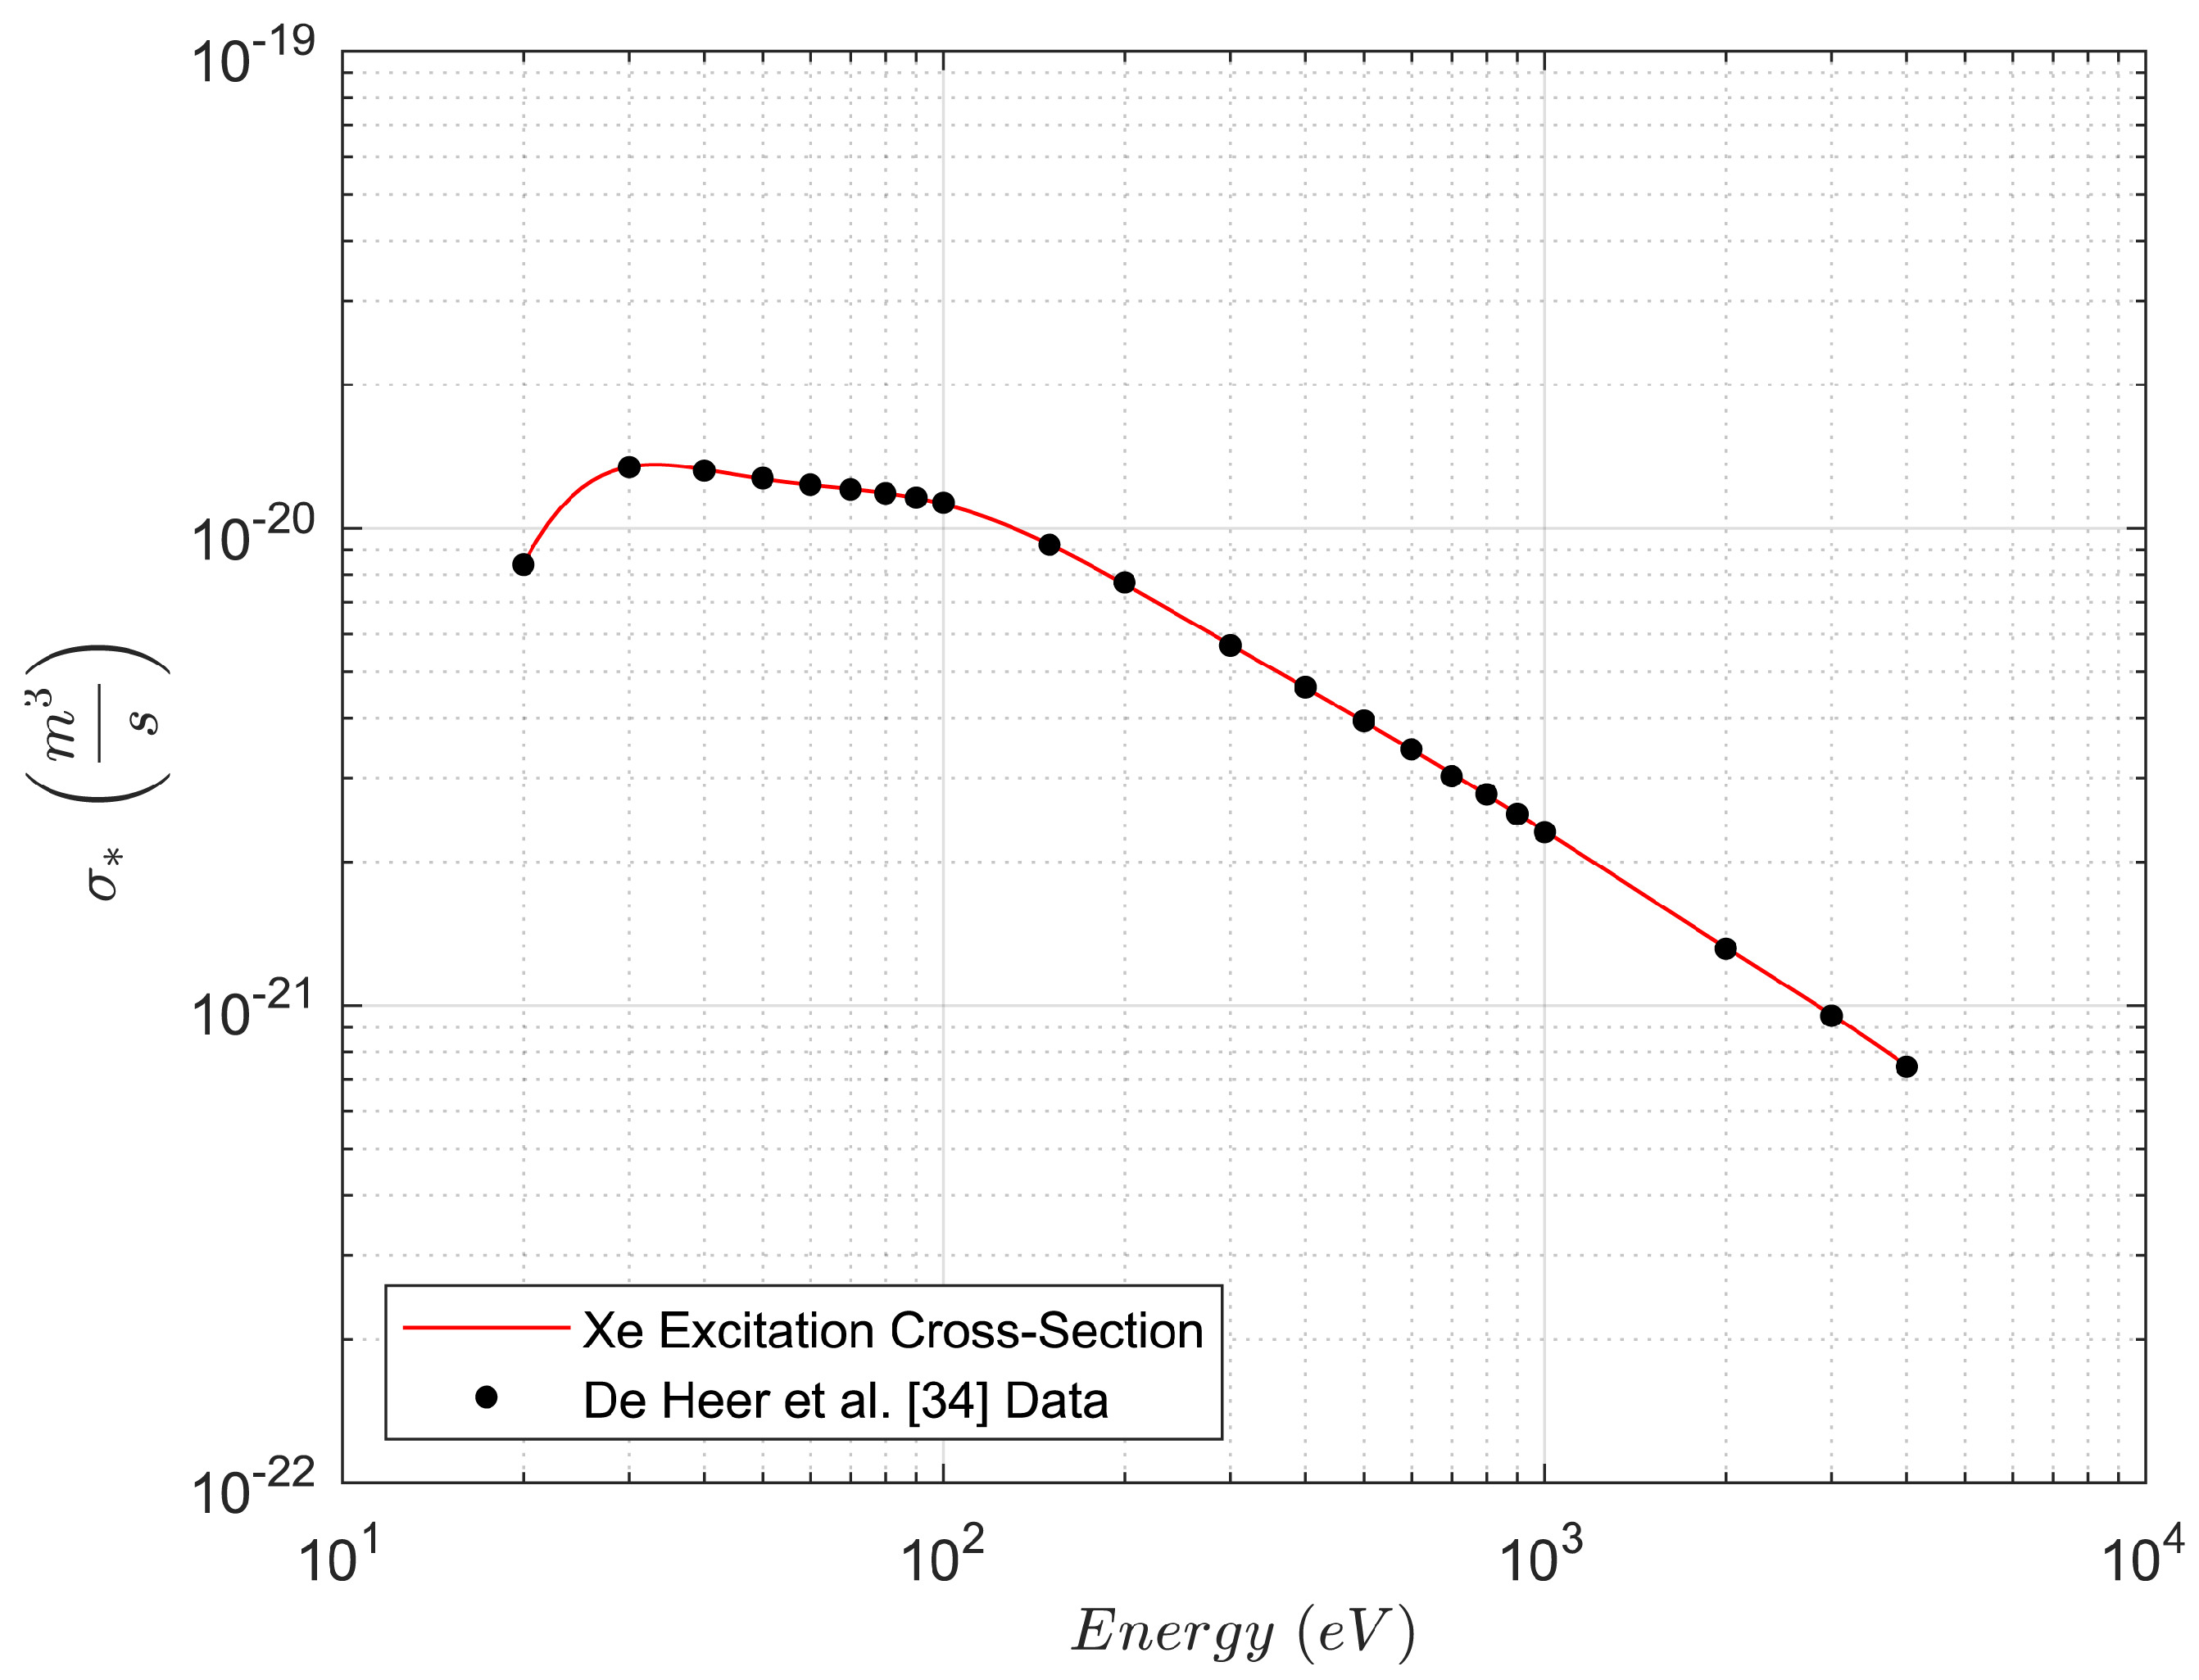
Figure 11.
Currents and potential distribution in the discharge chamber of a DSGIT.
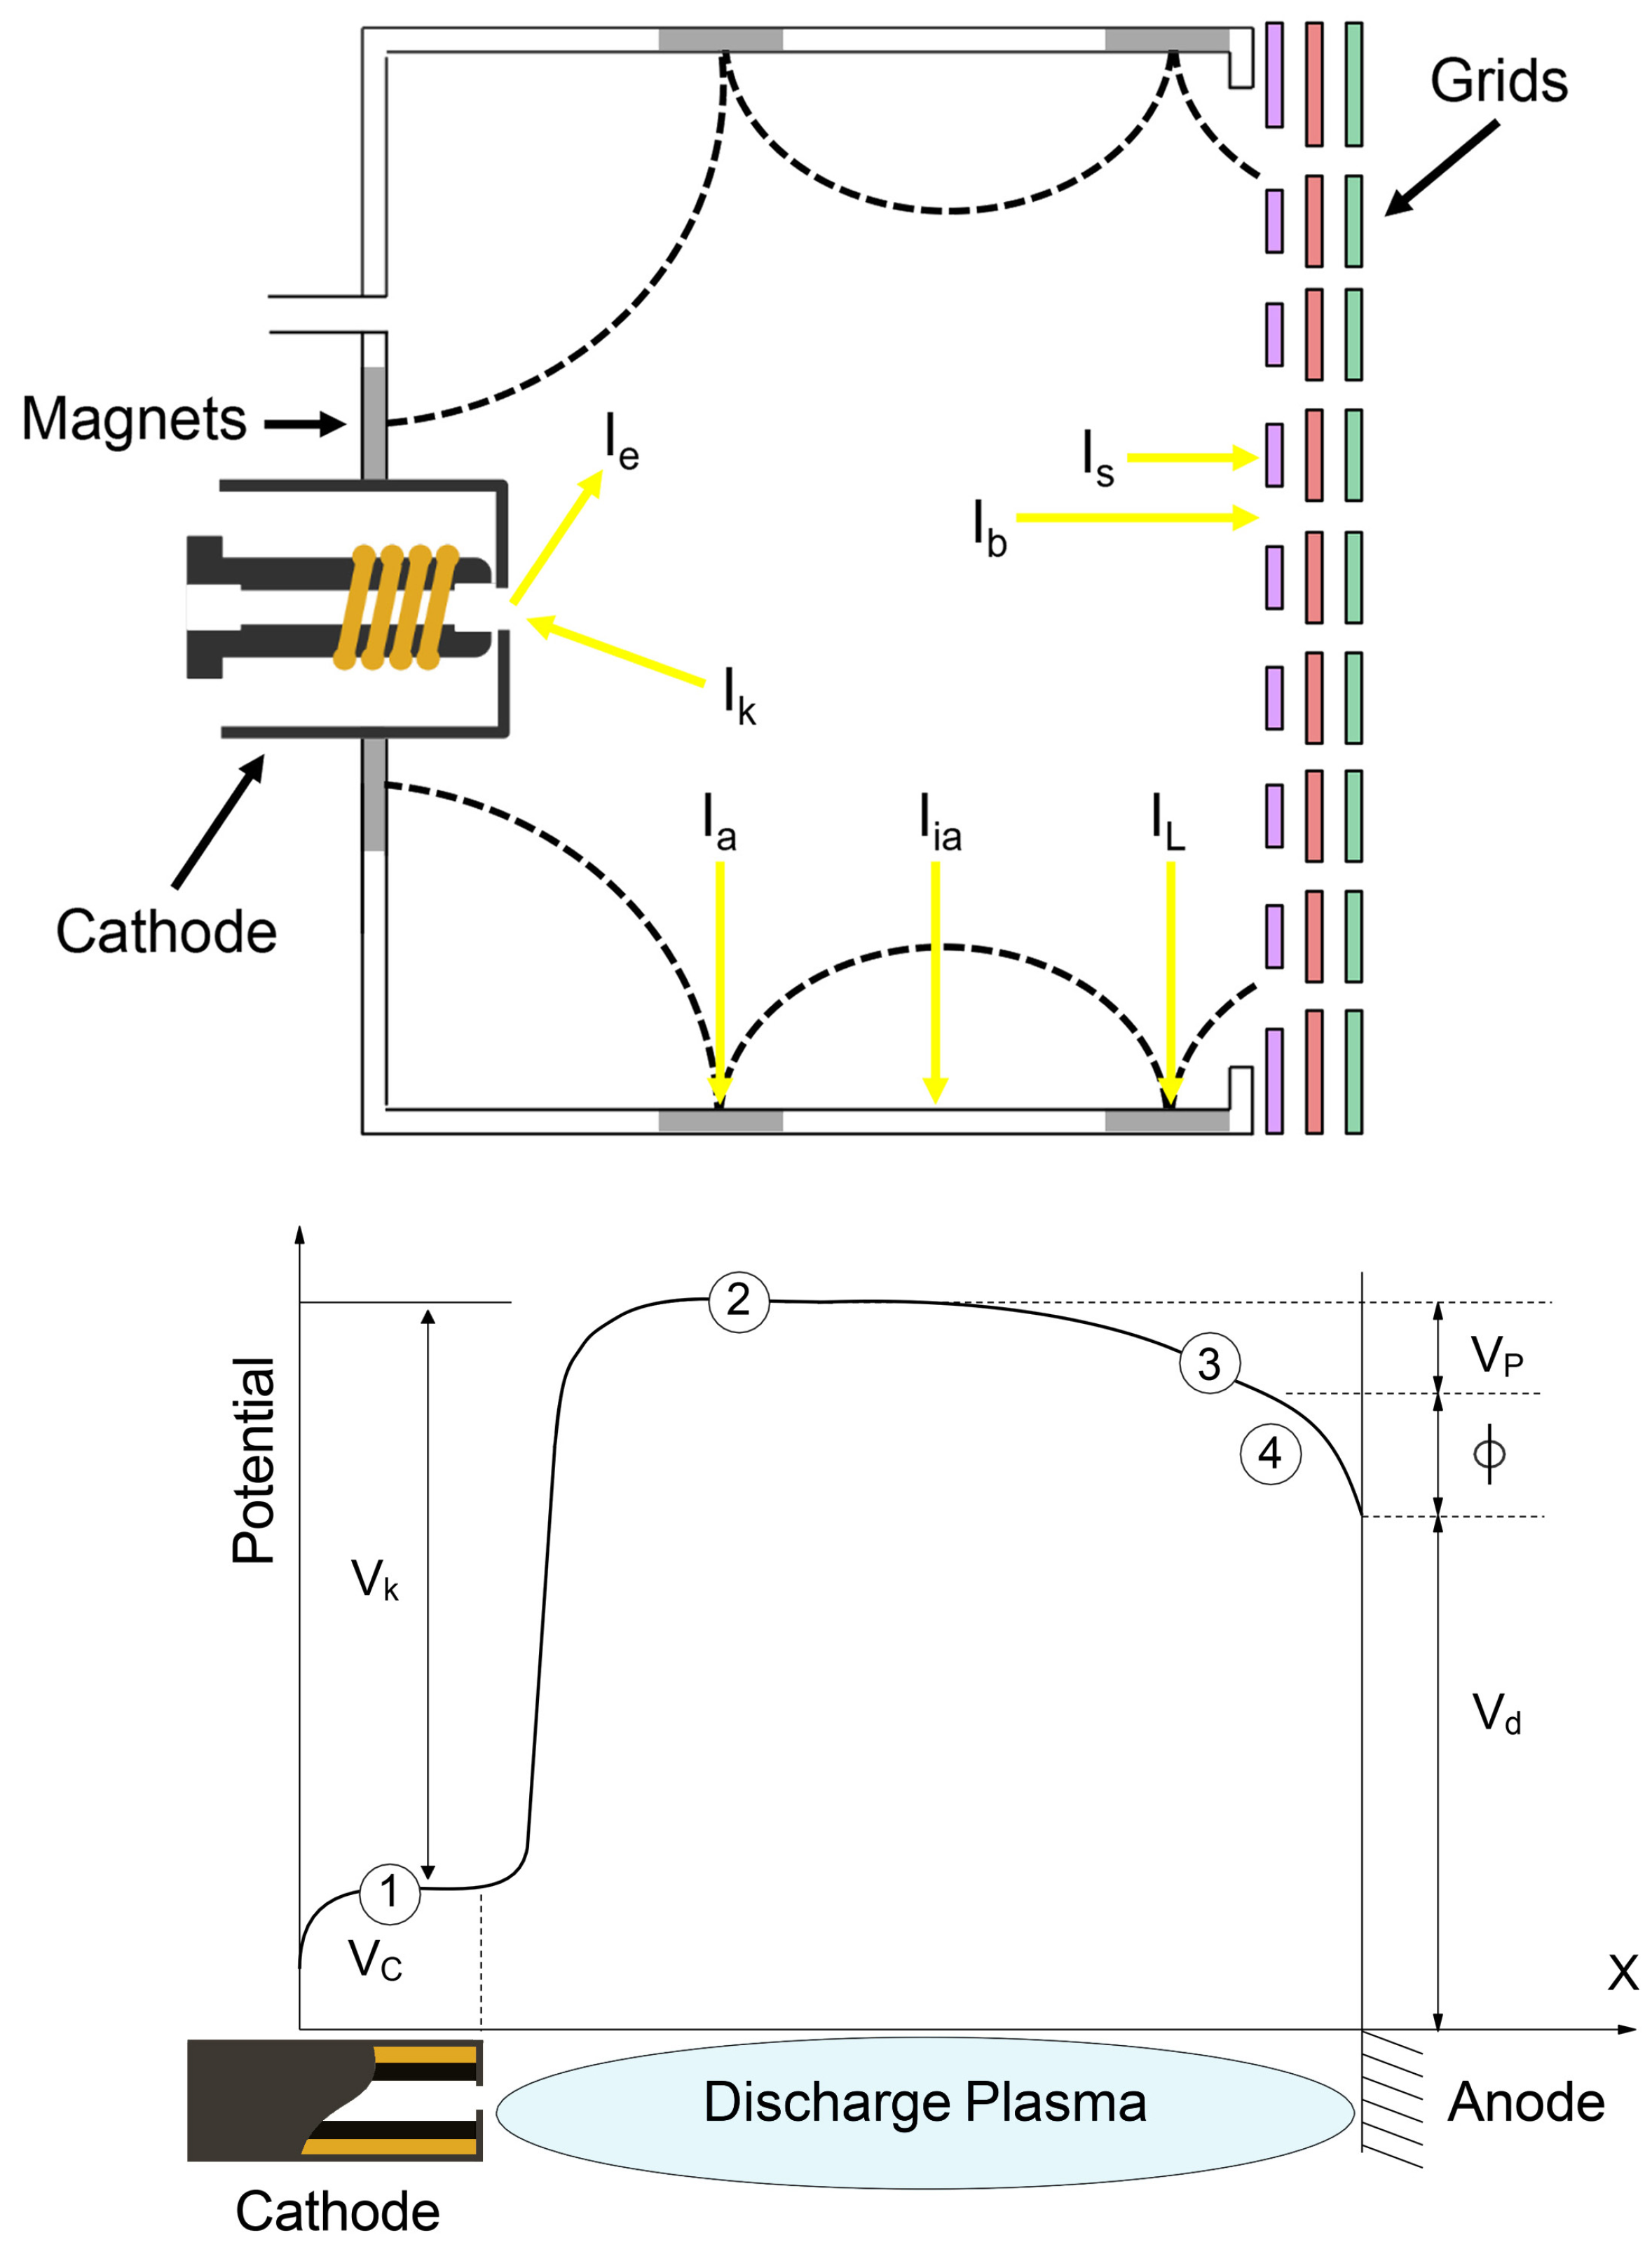

Table 1.
Input, output and degree of freedom of the GPM.
| Inputs | Degrees of Freedom and Assigned Values | Outputs |
|---|---|---|
| • Discharge chamber diameter D | • Discharge voltage | • Input power (or Thrust T) |
| • Thrust T (or Input power ) | • | • Specific impulse |
| • Extraction stage drop voltage | • Propellant utilization efficiency | |
| • Divergence beam angle | • Acceleration-Extraction voltage ratio | |
| • Length-to-diameter ratio | • Acceleration-Extraction electric field ratio | |
| • Grids geometry [8,20] | • Discharge Loss | |
| • Electrical efficiency | ||
| • Total efficiency | ||
| • Extraction grid voltage | ||
| • Accelerator grid voltage | ||
| • Net beam voltage | ||
| • Total voltage across accelerator gap | ||
| • Discharge current | ||
| • Ion beam current | ||
| • Extraction stage electric field | ||
| • Acceleration stage electric field | ||
| • Propellant mass flow rate | ||
| • Discharge chamber pressure | ||
| • at the cusps on the anode surface | ||
| • Max transverse between the magnets |
Table 2.
Coefficients used in Gaussian fit for Xenon ionization cross-section.
| n | |||
|---|---|---|---|
| 1 | 304.0369 | 2.4406 | 3.1716 |
| 2 | 0.1294 | 4.8862 | 0.4281 |
| 3 | -545.8000 | 4.4769 | 5.0502 |
| 4 | 0 | 12.8160 | 0.6531 |
| 5 | 167.2716 | 7.8153 | 3.0177 |
| 6 | 0.0108 | 5.9886 | 0.1323 |
| 7 | 268.5503 | 5.2372 | 2.8991 |
Table 3.
Coefficients used in Gaussian fit for Xenon excitation cross-section.
| n | |||
|---|---|---|---|
| 1 | 134.8861 | 3.3295 | 2.0839 |
| 2 | 30.1554 | 4.4438 | 1.2661 |
| 3 | -258.1798 | 5.4002 | 4.4532 |
| 4 | 0 | 13.3627 | 0.6514 |
| 5 | 96.0117 | 7.9469 | 2.1821 |
| 6 | 23.8686 | 5.3734 | 1.2777 |
| 7 | 112.3340 | 6.1165 | 1.8095 |
Table 4.
Comparison between the characteristics and performances of preliminary design of DSGIT for Infra-structure to Earth-Moon L1 (Mission Level 1) [15] and the model.
Table 4.
Comparison between the characteristics and performances of preliminary design of DSGIT for Infra-structure to Earth-Moon L1 (Mission Level 1) [15] and the model.
| Infra-structure to Earth-Moon L1 (Mission Level 1) [15] | Model | Difference | |
|---|---|---|---|
| D (cm) | 35 | 35 | / |
| (kW) | 25.26 | 25.26 | / |
| T (N) | 0.82 | 0.815 | 0.61% |
| (s) | 5000 | 4928 | 1.44% |
| 0.796 | 0.783 | 1.63% | |
| (V) | 1669 | 1672 | 0.18% |
| (A) | 11.03 | 10.98 | 0.45% |
| (V) | 2030 | 2039 | 0.44% |
| (V) | 669 | 672 | 0.45% |
| (V) | 181 | 183 | 1.10% |
| (mg/s) | 16.72 | 16.86 | 0.84% |
| (G) | Not available | 797 | / |
| (G) | Not available | 16 | / |
Table 5.
Comparison between the characteristics and performances of preliminary design of DSGIT for Infra-structure to Earth-Moon L1 (Mission Level 1) [15] and the model.
Table 5.
Comparison between the characteristics and performances of preliminary design of DSGIT for Infra-structure to Earth-Moon L1 (Mission Level 1) [15] and the model.
| Infra-structure to Earth-Moon L1 (Mission Level 2) [15] | Model | Difference | |
|---|---|---|---|
| D (cm) | 18 | 18 | / |
| (kW) | 25.41 | 25.41 | / |
| T (N) | 0.45 | 0.44 | 2.22% |
| (s) | 10000 | 9236 | 7.64% |
| 0.869 | 0.783 | 9.89% | |
| (V) | 7511 | 7601 | 1.20% |
| (A) | 3.03 | 2.95 | 2.64% |
| (V) | 8120 | 8198 | 0.96% |
| (V) | 6511 | 6601 | 1.38% |
| (V) | 305 | 299 | 1.96% |
| (mg/s) | 4.59 | 4.84 | 5.44% |
| (G) | Not available | 2773 | / |
| (G) | Not available | 30 | / |
Table 6.
Comparison between the characteristics and performances of preliminary design of DSGIT for NEO NEP (Mission Level 1) [15] and the model.
Table 6.
Comparison between the characteristics and performances of preliminary design of DSGIT for NEO NEP (Mission Level 1) [15] and the model.
| NEO NEP (Mission Level 1) [15] | Model | Difference | |
|---|---|---|---|
| D (cm) | 32 | 32 | / |
| (kW) | 25.24 | 25.24 | / |
| T (N) | 0.76 | 0.752 | 1.05% |
| (s) | 5500 | 5344 | 2.84% |
| 0.81 | 0.78 | 3.86% | |
| (V) | 2052 | 2086 | 1.66% |
| (A) | 9.31 | 9.21 | 1.07% |
| (V) | 2540 | 2464 | 2.99% |
| (V) | 1052 | 1086 | 3.23% |
| (V) | 199 | 189 | 5.02% |
| (mg/s) | 14.66 | 14.34 | 2.18% |
| (G) | Not available | 1236 | / |
| (G) | Not available | 14 | / |
Table 7.
Comparison between the characteristics and performances of preliminary design of DSGIT for NEO NEP (Mission Level 2) [15] and the model.
Table 7.
Comparison between the characteristics and performances of preliminary design of DSGIT for NEO NEP (Mission Level 2) [15] and the model.
| NEO NEP (Mission Level 2) [15] | Model | Difference | |
|---|---|---|---|
| D (cm) | 46 | 46 | / |
| (kW) | 50.15 | 50.15 | / |
| T (N) | 1.51 | 1.52 | 0.66% |
| (s) | 5500 | 5370 | 2.36% |
| 0.81 | 0.798 | 1.76% | |
| (V) | 1968 | 1963 | 0.25% |
| (A) | 18.51 | 18.66 | 0.81% |
| (V) | 2450 | 2456 | 0.24% |
| (V) | 968 | 963 | 0.52% |
| (V) | 241 | 247 | 2.49% |
| (mg/s) | 28.08 | 28.86 | 2.81% |
| (G) | Not available | 1267 | / |
| (G) | Not available | 28 | / |
Table 8.
Comparison between the characteristics and performances of preliminary design of DSGIT for NEO NEP (Mission Level 3) [15] and the model.
Table 8.
Comparison between the characteristics and performances of preliminary design of DSGIT for NEO NEP (Mission Level 3) [15] and the model.
| NEO NEP (Mission Level 3) [15] | Model | Error | |
|---|---|---|---|
| D (cm) | 50 | 50 | / |
| (kW) | 50.21 | 50.21 | / |
| T (N) | 1.630 | 1.639 | 0.55% |
| (s) | 5000 | 4983 | 0.34% |
| 0.796 | 0.798 | 0.23% | |
| (V) | 1669 | 1671 | 0.12% |
| (A) | 21.93 | 22.1 | 0.77% |
| (V) | 2030 | 2026 | 0.20% |
| (V) | 669 | 671 | 0.30% |
| (V) | 181 | 178 | 1.65% |
| (mg/s) | 33.15 | 33.54 | 1.18% |
| (G) | Not available | 912 | / |
| (G) | Not available | 15 | / |
Table 9.
Comparison between the characteristics and performances of preliminary design of DSGIT for Mars Infra-structure (Mission Level 1) [15] and the model.
Table 9.
Comparison between the characteristics and performances of preliminary design of DSGIT for Mars Infra-structure (Mission Level 1) [15] and the model.
| Mars Infra-structure (Mission Level 1) [15] | Model | Difference | |
|---|---|---|---|
| D (cm) | 23 | 23 | / |
| (kW) | 25.24 | 25.24 | / |
| T (N) | 0.55 | 0.55 | 0.00% |
| (s) | 8000 | 7274 | 9.08% |
| 0.855 | 0.782 | 8.54% | |
| (V) | 4877 | 4869 | 0.16% |
| (A) | 4.63 | 4.68 | 1.08% |
| (V) | 5190 | 5173 | 0.33% |
| (V) | 3877 | 3869 | 0.20% |
| (V) | 157 | 152 | 3.18% |
| (mg/s) | 7.01 | 7.75 | 10.55% |
| (G) | Not available | 870 | / |
| (G) | Not available | 36 | / |
Table 10.
Main performances comparison between NSTAR Ion Thruster (throttle level 5) [37] and an equivalent (i.e. same power and thrust) Dual Stage Gridded Ion Thruster.
Table 10.
Main performances comparison between NSTAR Ion Thruster (throttle level 5) [37] and an equivalent (i.e. same power and thrust) Dual Stage Gridded Ion Thruster.
| Parameter | NSTAR (Throttle Level 5) [37] | DSGIT |
|---|---|---|
| Input power (kW) | 1.09 | 1.09 |
| Diameter (cm) | 30 | 3 |
| Thrust (N) | 0.0425 | 0.0425 |
| Thrust density (N/m2) | 0.6 | 60 |
| Power density (kW/m2) | 15.4 | 1542 |
| Specific impulse (s) | 3002 | 3925 |
| Total efficiency | 0.57 | 0.751 |
Disclaimer/Publisher’s Note: The statements, opinions and data contained in all publications are solely those of the individual author(s) and contributor(s) and not of MDPI and/or the editor(s). MDPI and/or the editor(s) disclaim responsibility for any injury to people or property resulting from any ideas, methods, instructions or products referred to in the content. |
© 2025 by the authors. Licensee MDPI, Basel, Switzerland. This article is an open access article distributed under the terms and conditions of the Creative Commons Attribution (CC BY) license (http://creativecommons.org/licenses/by/4.0/).
Copyright: This open access article is published under a Creative Commons CC BY 4.0 license, which permit the free download, distribution, and reuse, provided that the author and preprint are cited in any reuse.


