Submitted:
30 January 2025
Posted:
31 January 2025
You are already at the latest version
Abstract
The drawbacks of density separation techniques and the dangers inherent in the usage of organic high-density liquids are well-known since a few decades. Among those who face the challenge of separating Foraminifera from sand, avocational micropaleontologists and citizen scientists may not be able to obtain non-toxic alternatives for density separation, such as Polytungstates, nor to afford their relevant price. While the highly dangerous Carbon Tetrachloride is virtually unavailable for non-professional users, other “heavy liquids” traditionally used for density separation including Trichloroethylene (density above 1.6 g/cm3) and Perchloroethylene – usually sold as stain removers – can be easily purchased, pose less relevant dangers and, with appropriate caution, may be used in a domestic environment. Combined with an easily obtainable separatory funnel and with very basic equipment such as beakers and filter paper, Perchloroethylene can bring the advantages of density separation within the capabilities of non-professional scientists. This short, non-quantitative report documents how density separation may be performed at home at a total cost of around 100 Euro, and can provide an incomparably more efficient alternative to hand picking by wet brush.
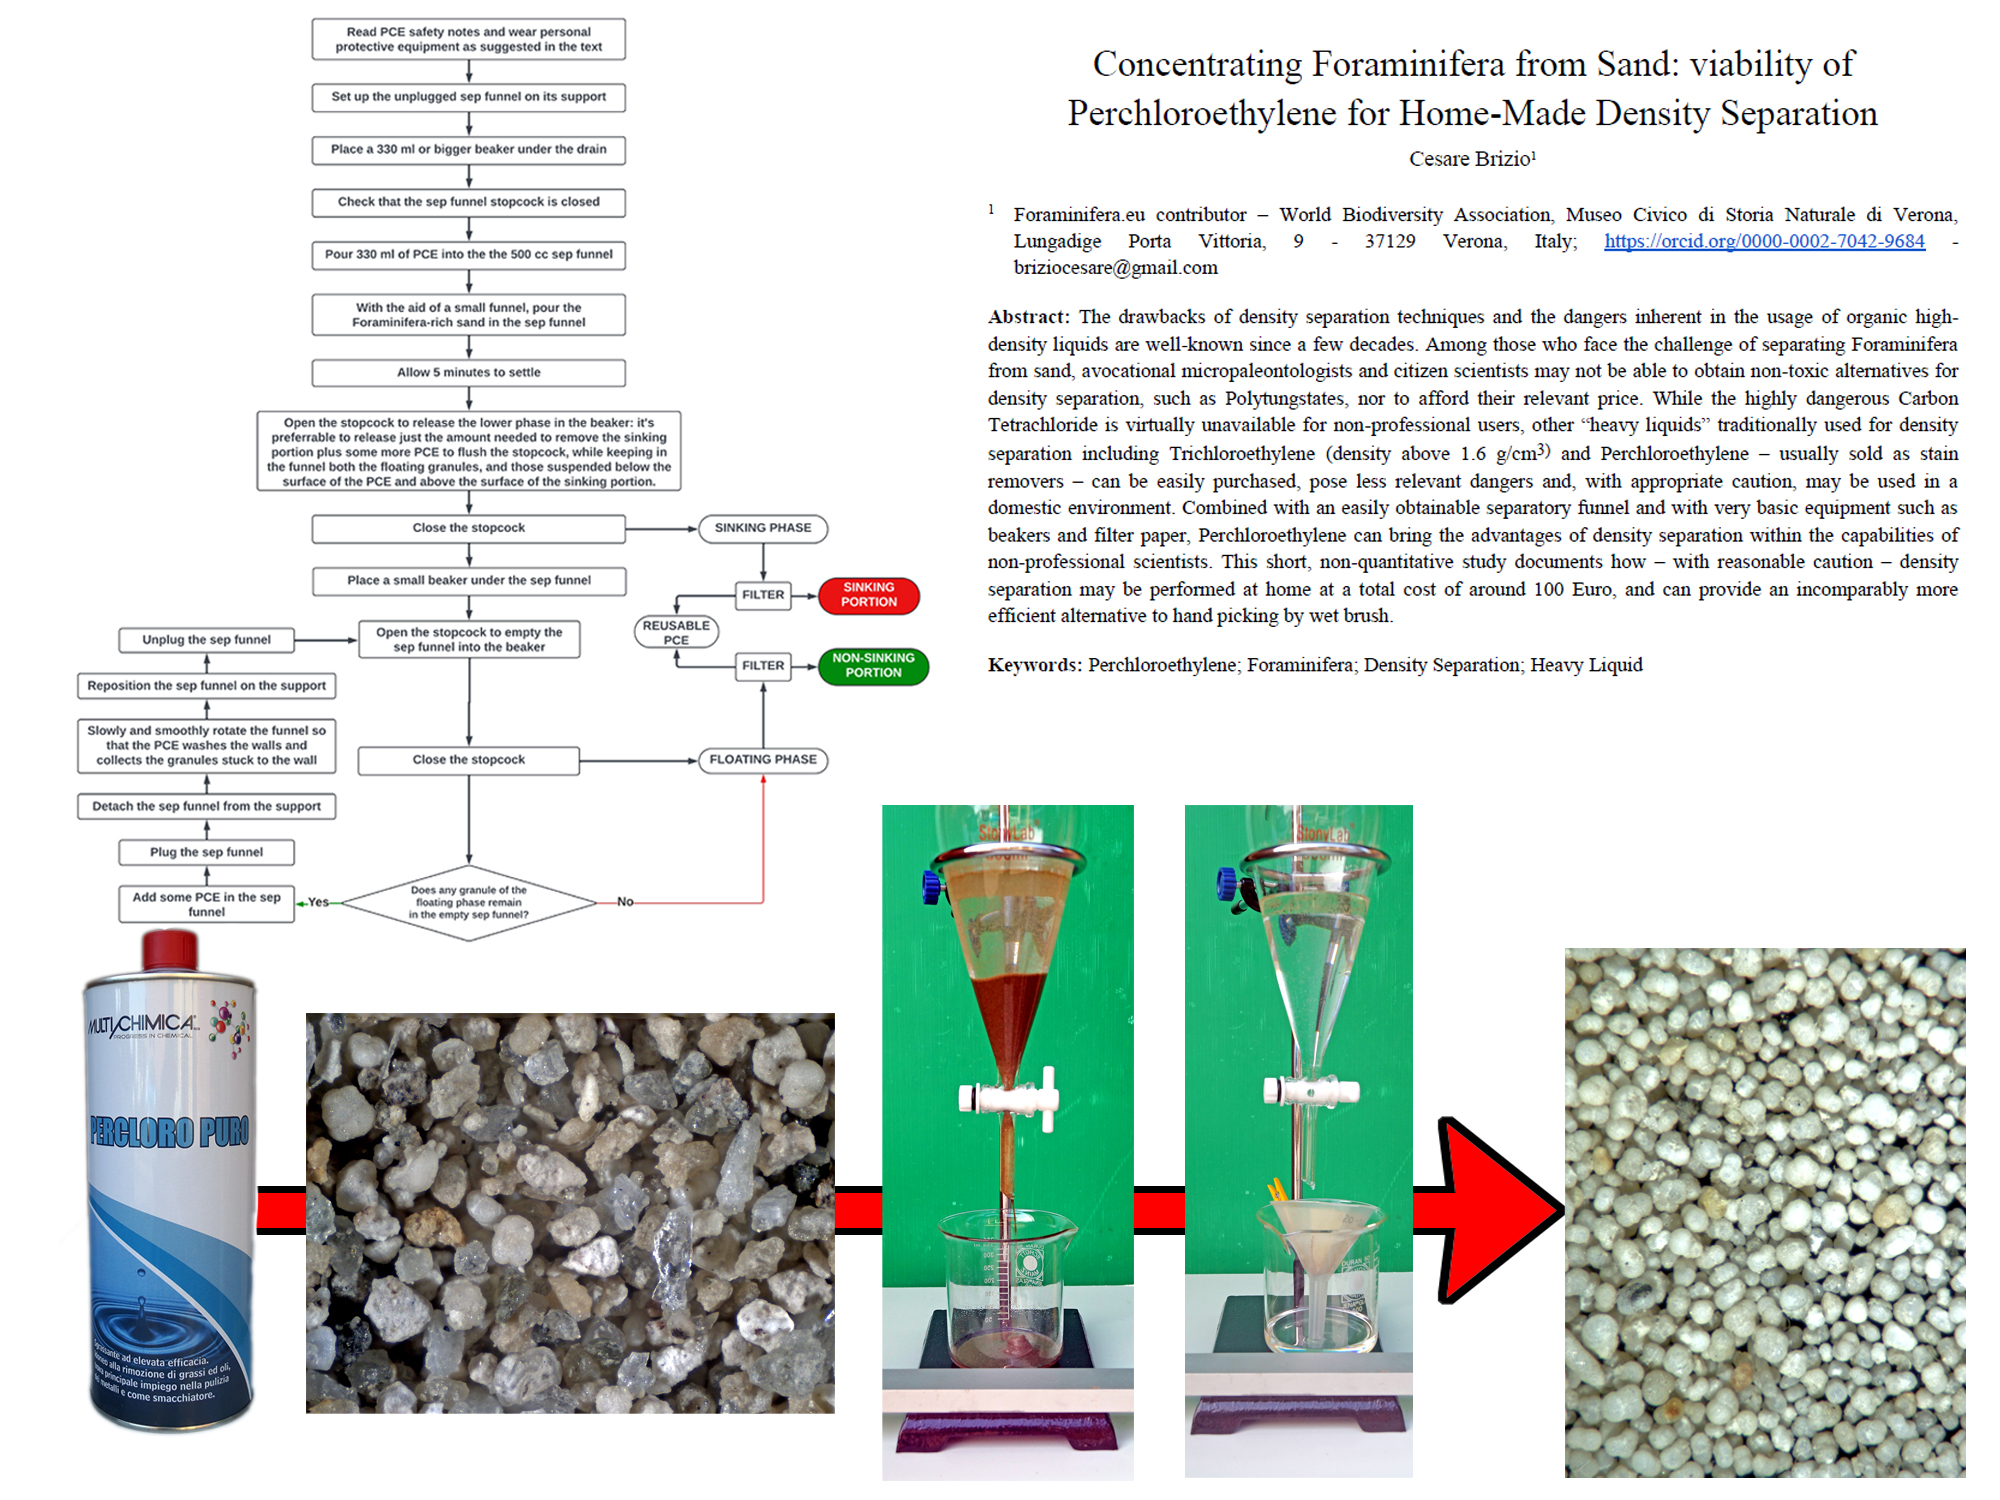
Keywords:
1. Introduction
2. Materials and Methods
3. Results
- -
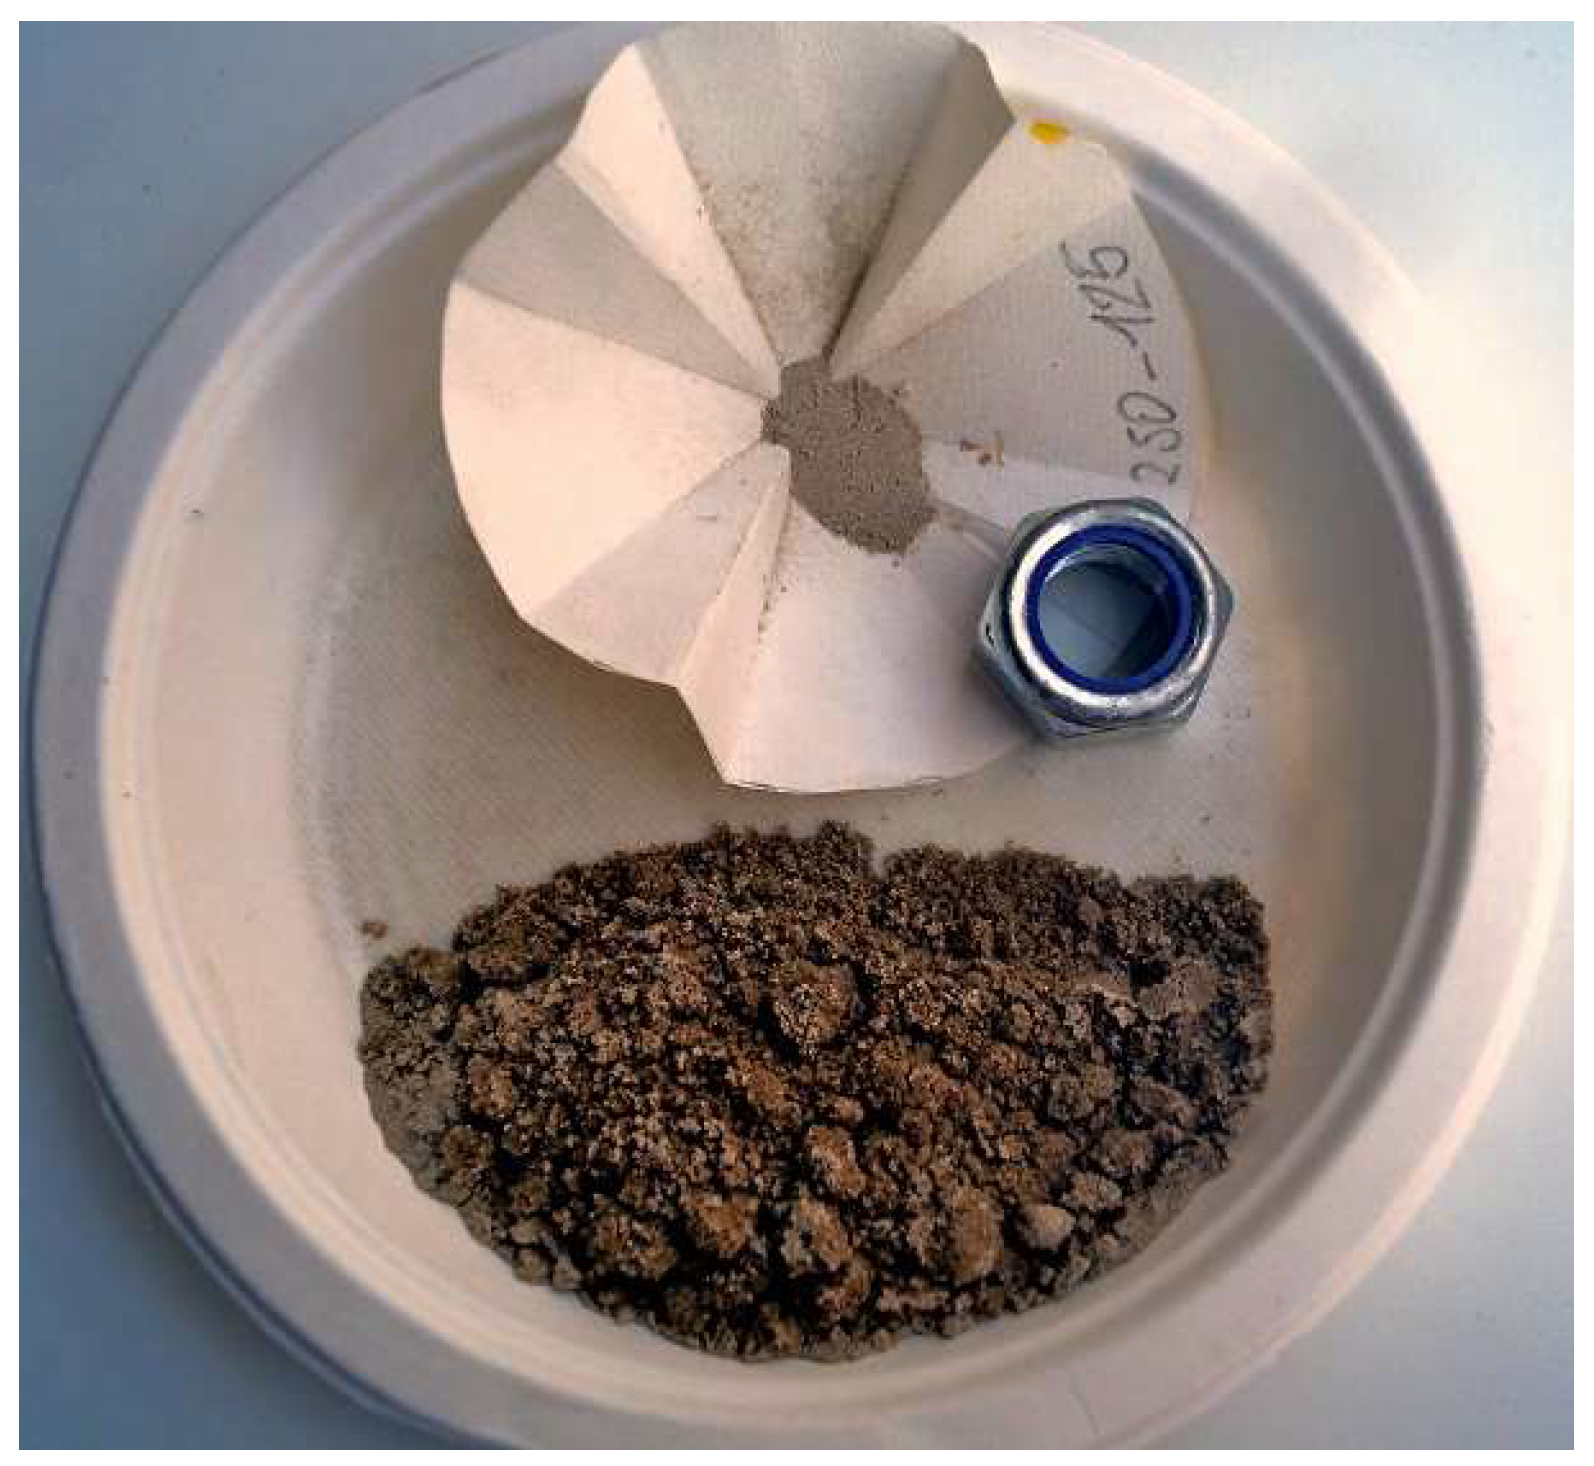
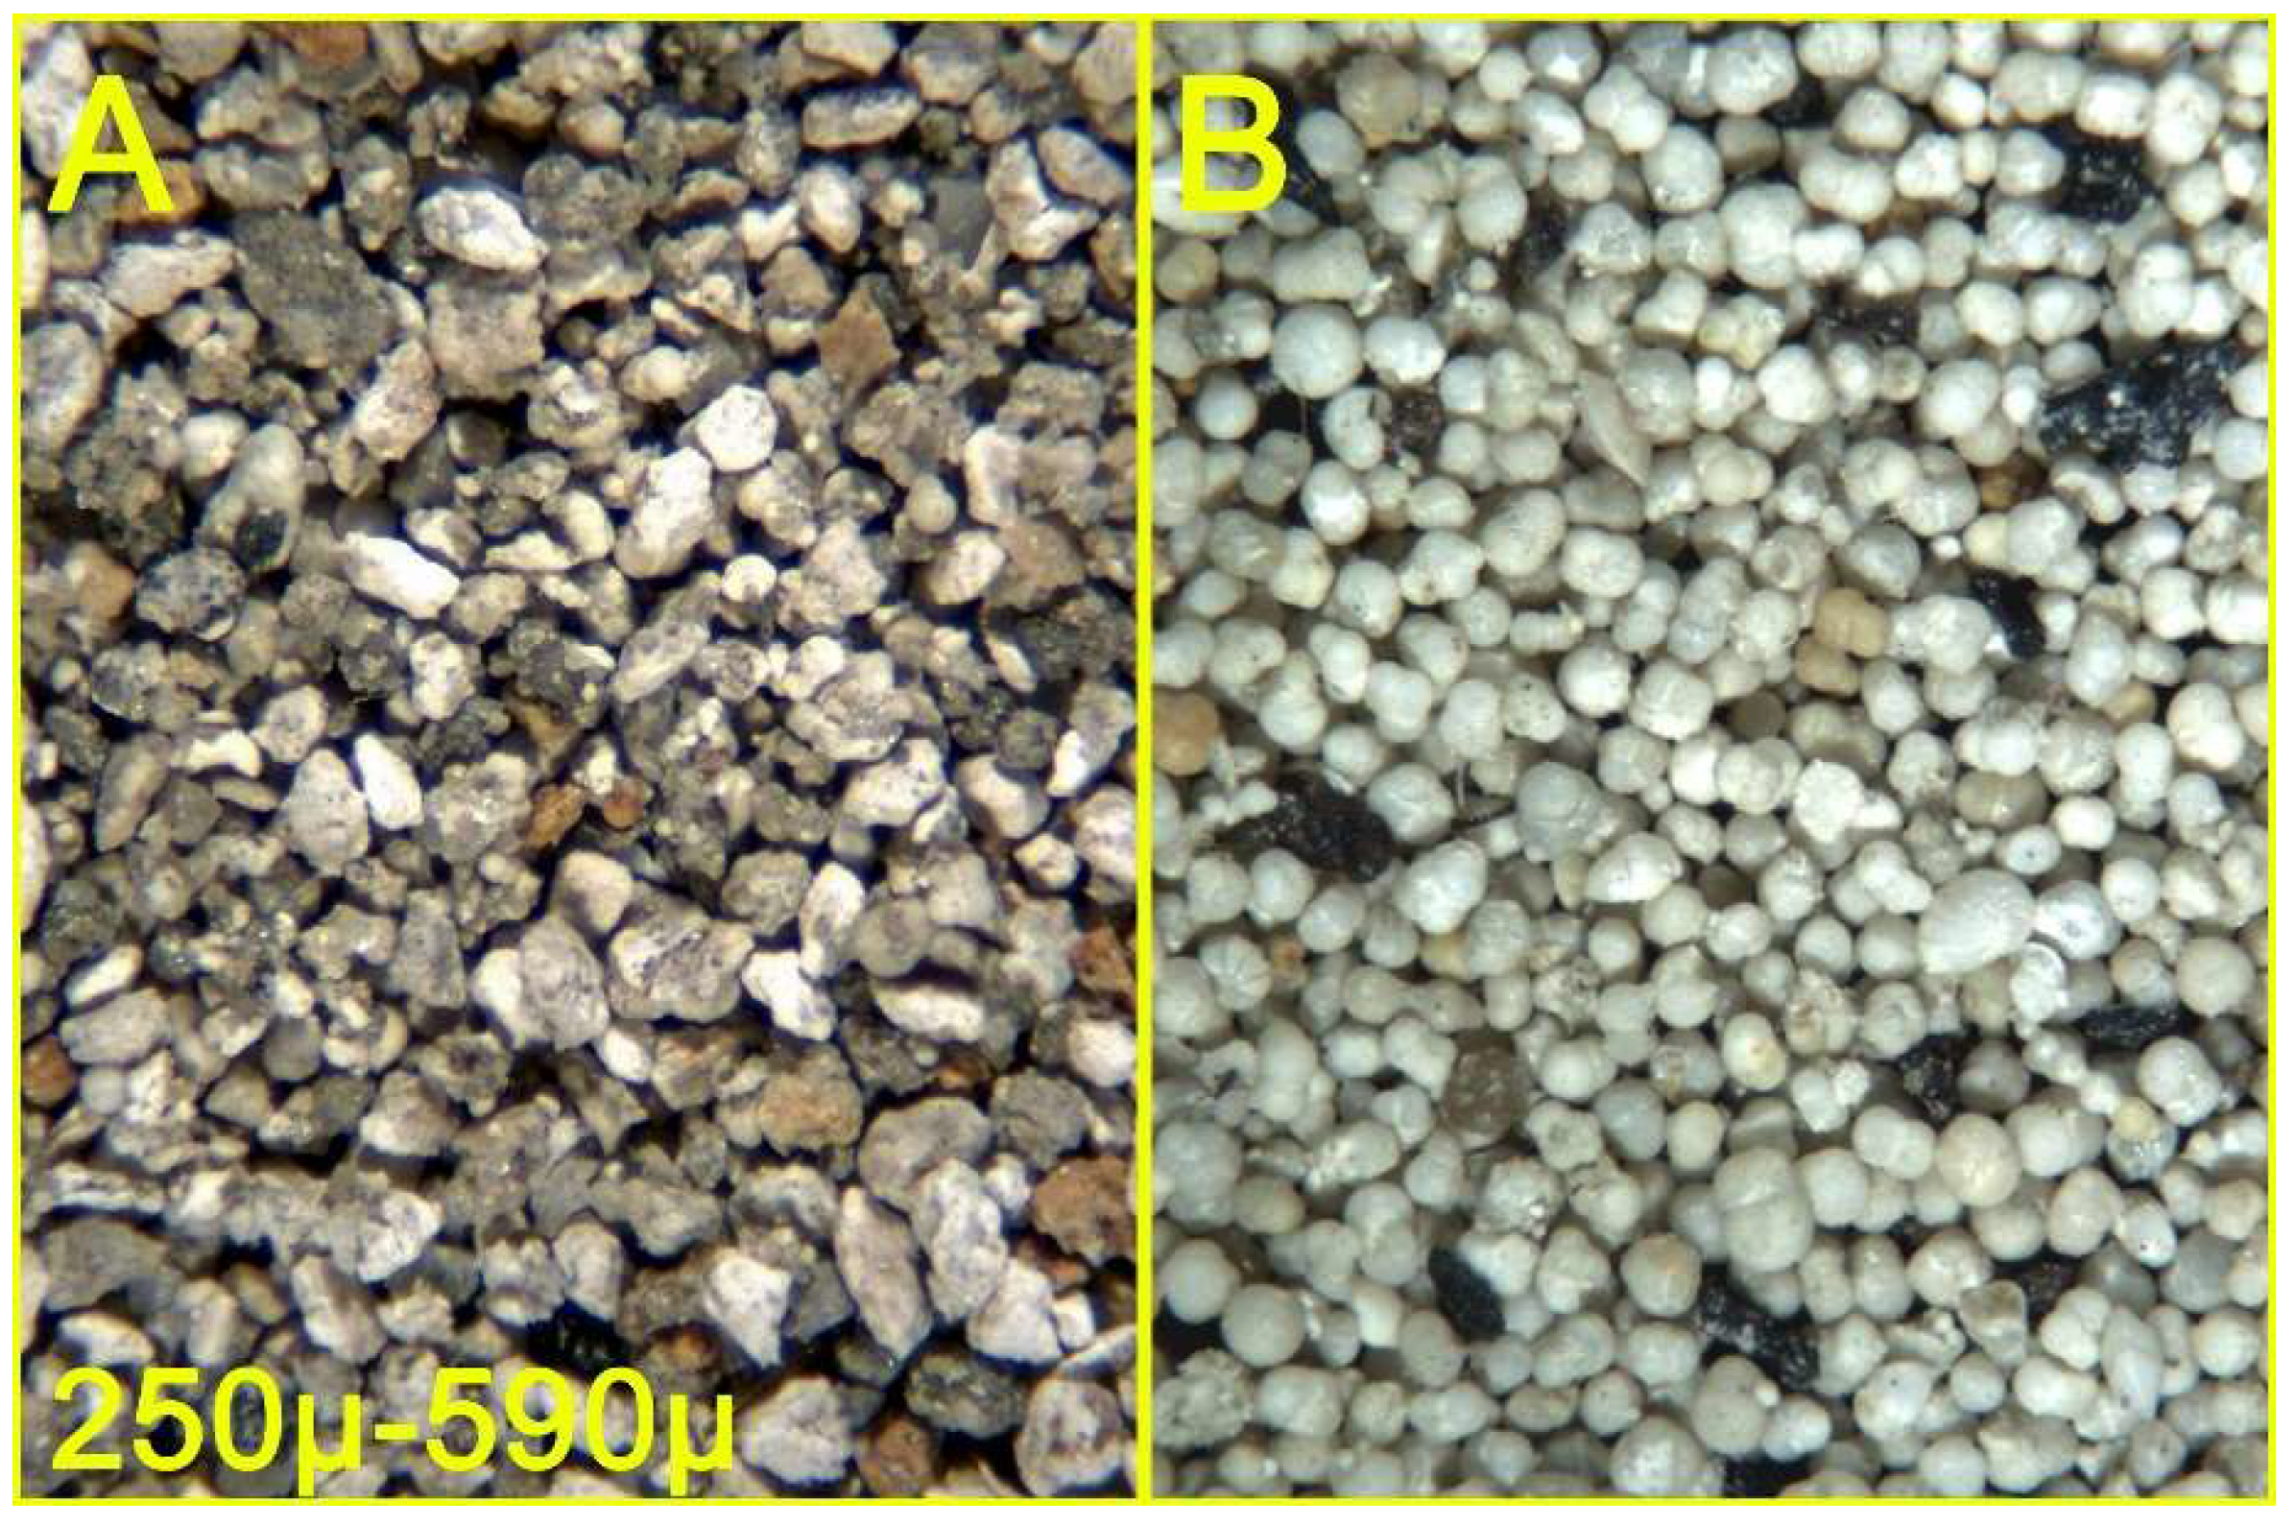
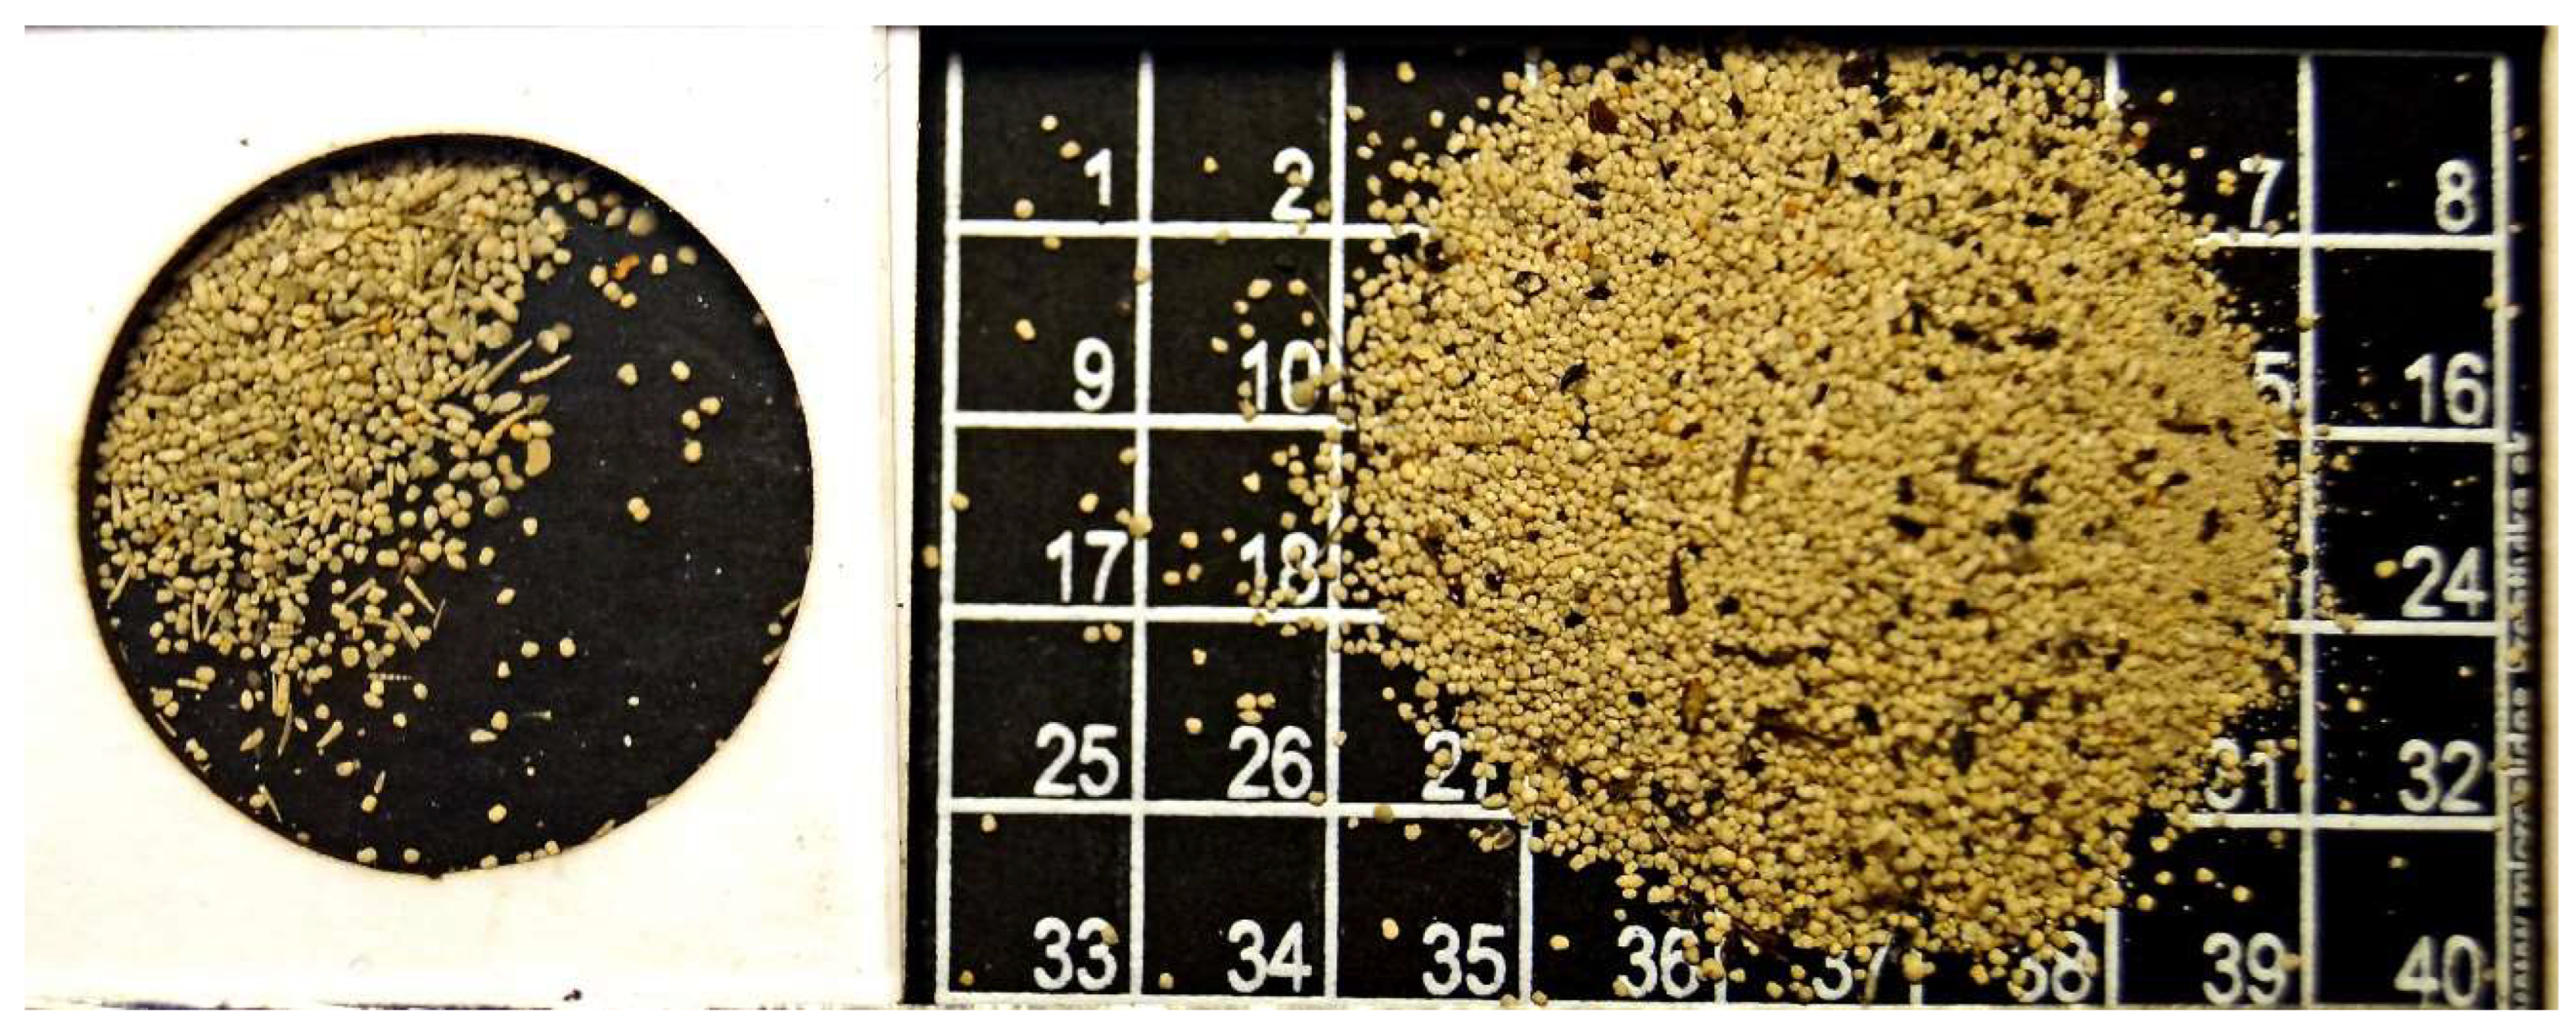
- In the 590μ - 250μ class, the only non-Foraminifera granules are low-density woody carbonised remains, an organic component very common in Tertiary clays. Small green stains were observed on the filter paper after the recovery of the non-floating fraction, hinting at some degree of reaction between TCE and light granules of organic origin;
- -
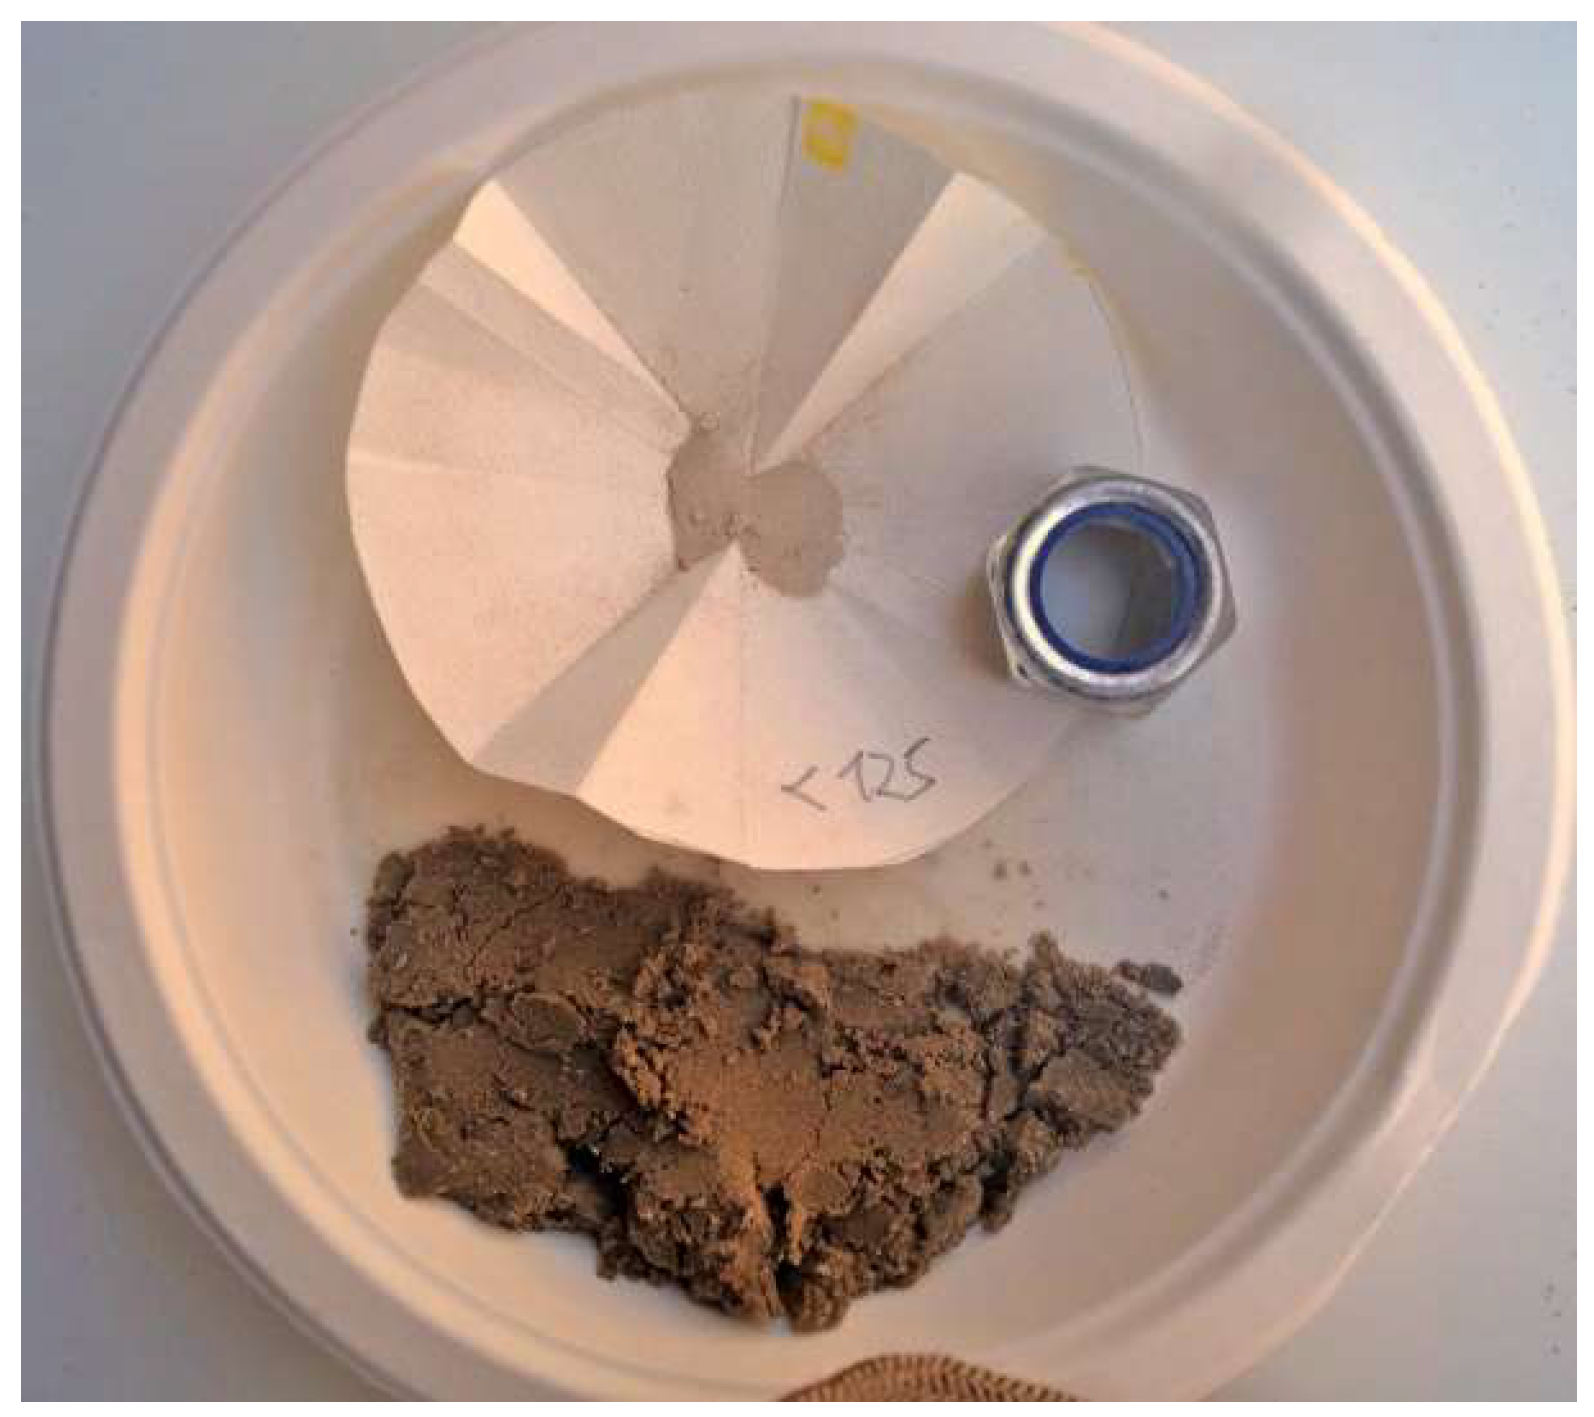
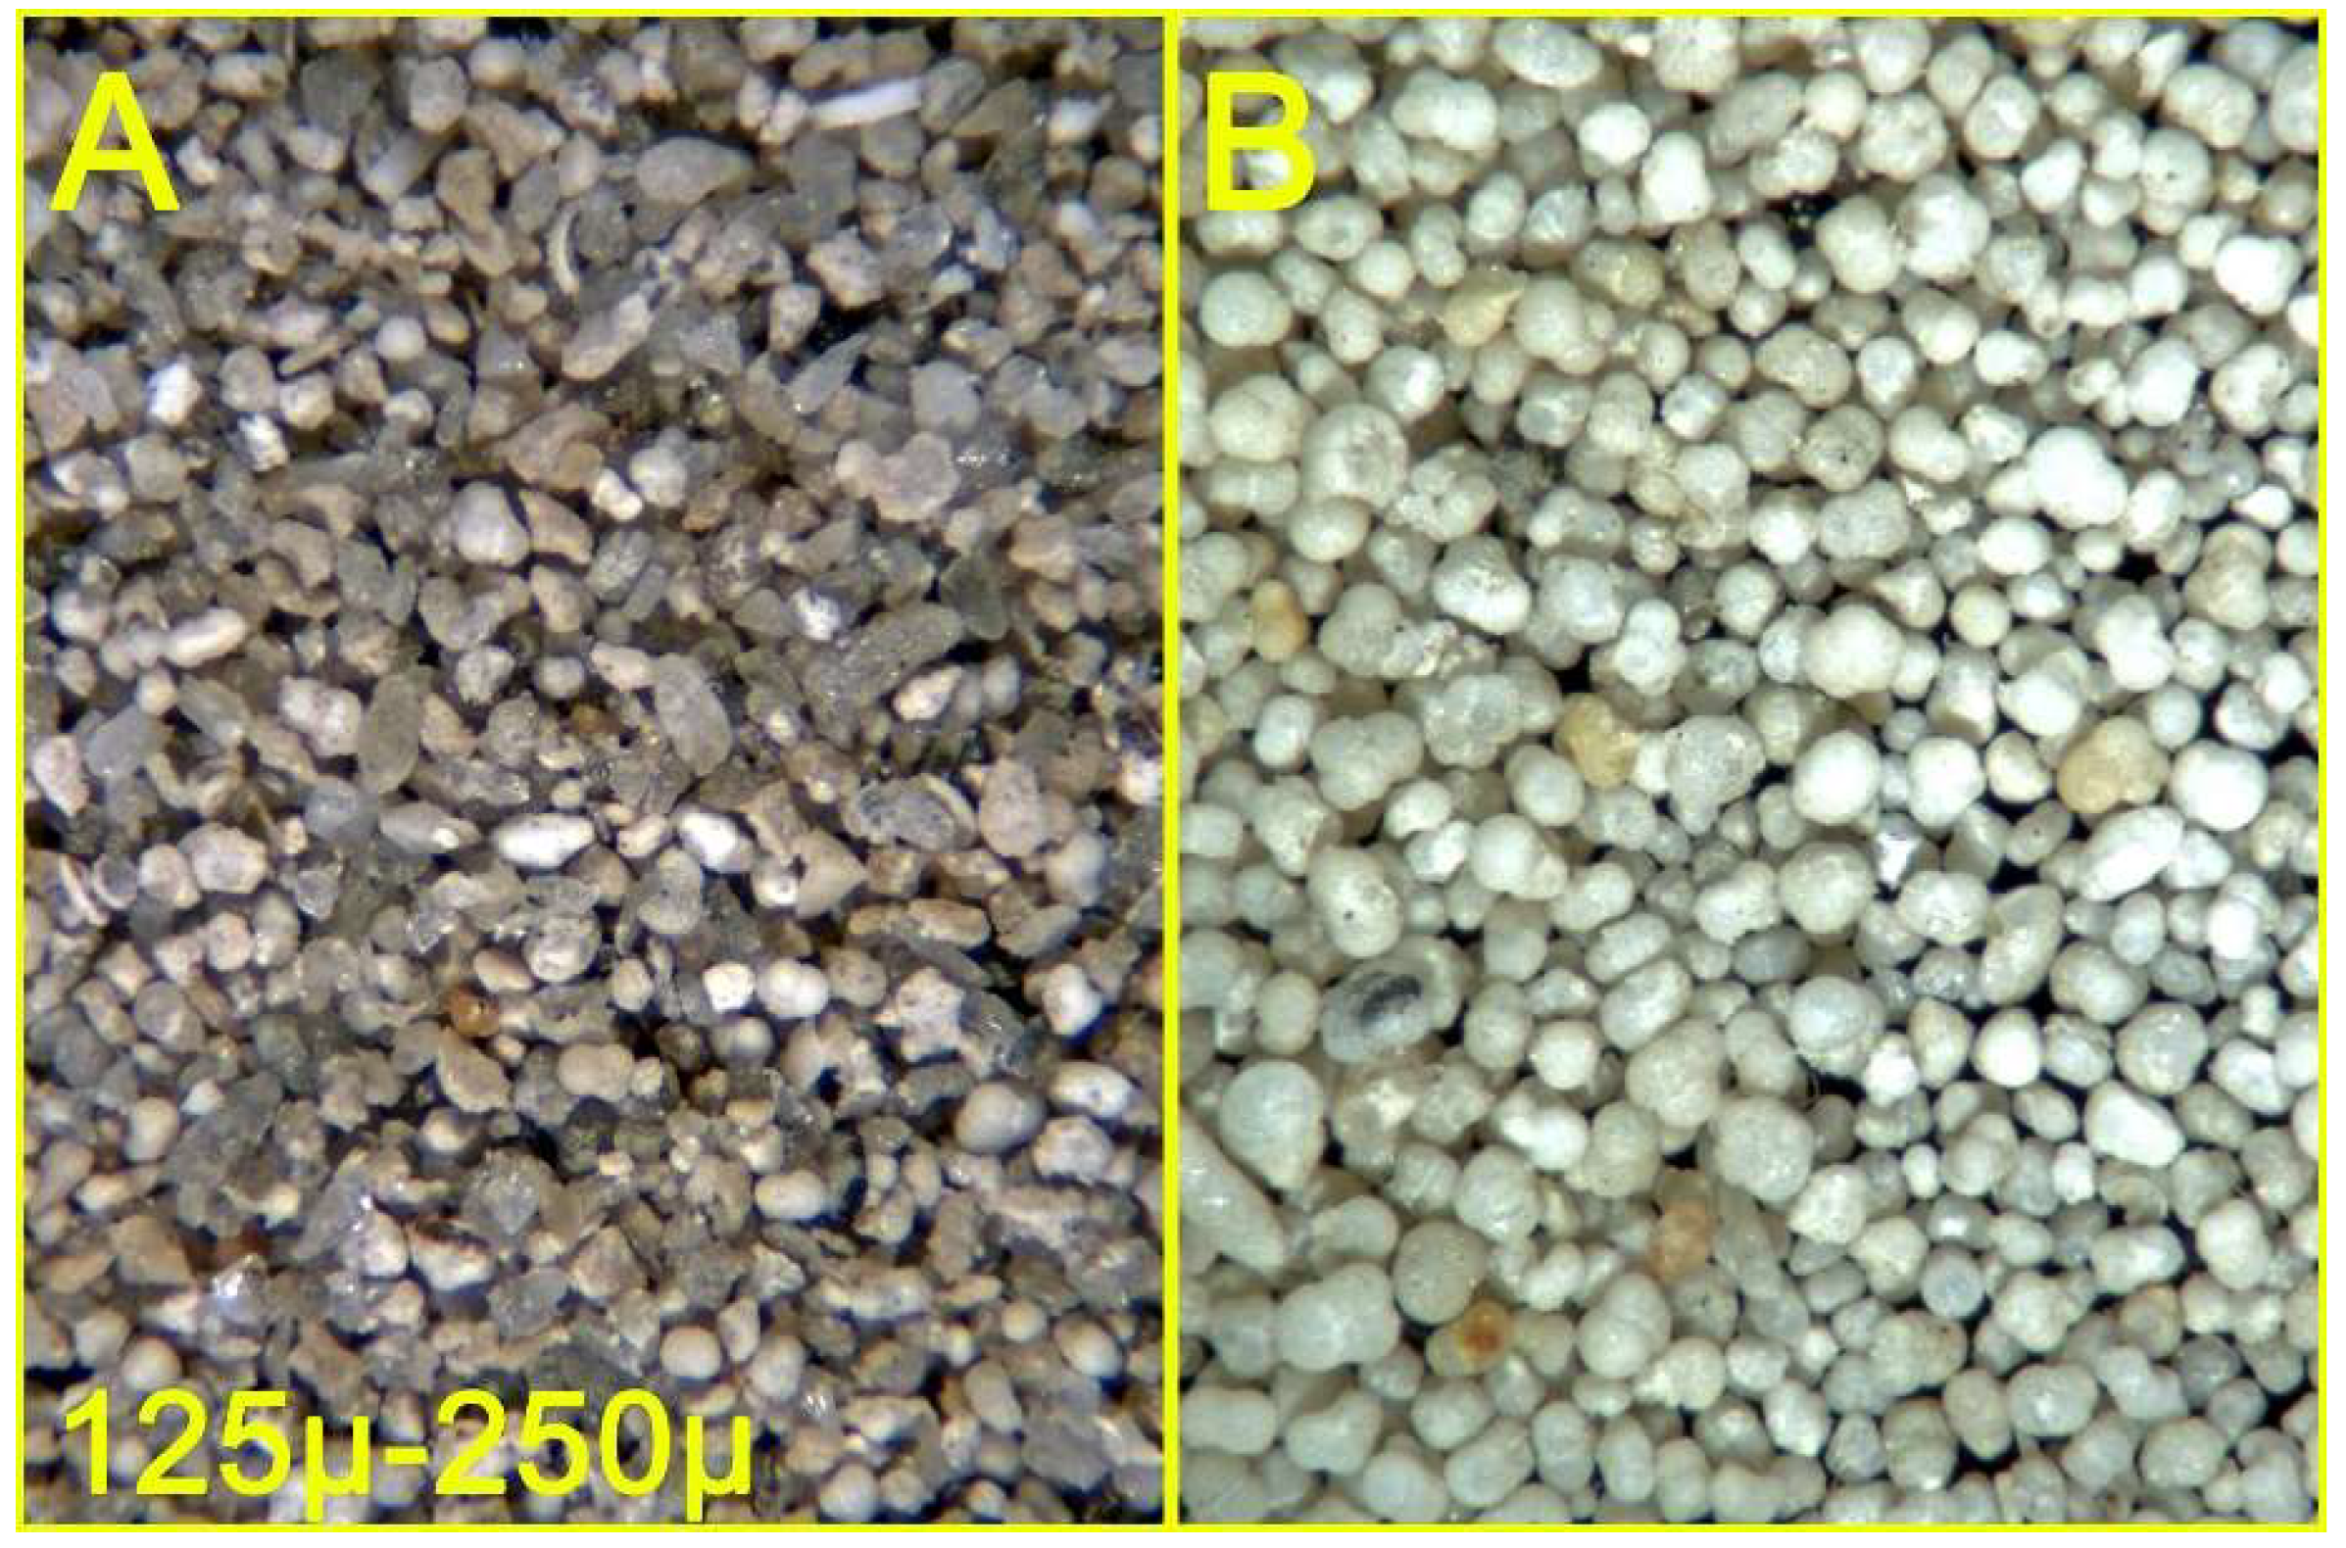
- In the other fractions, only Foraminifera were recovered;
- -
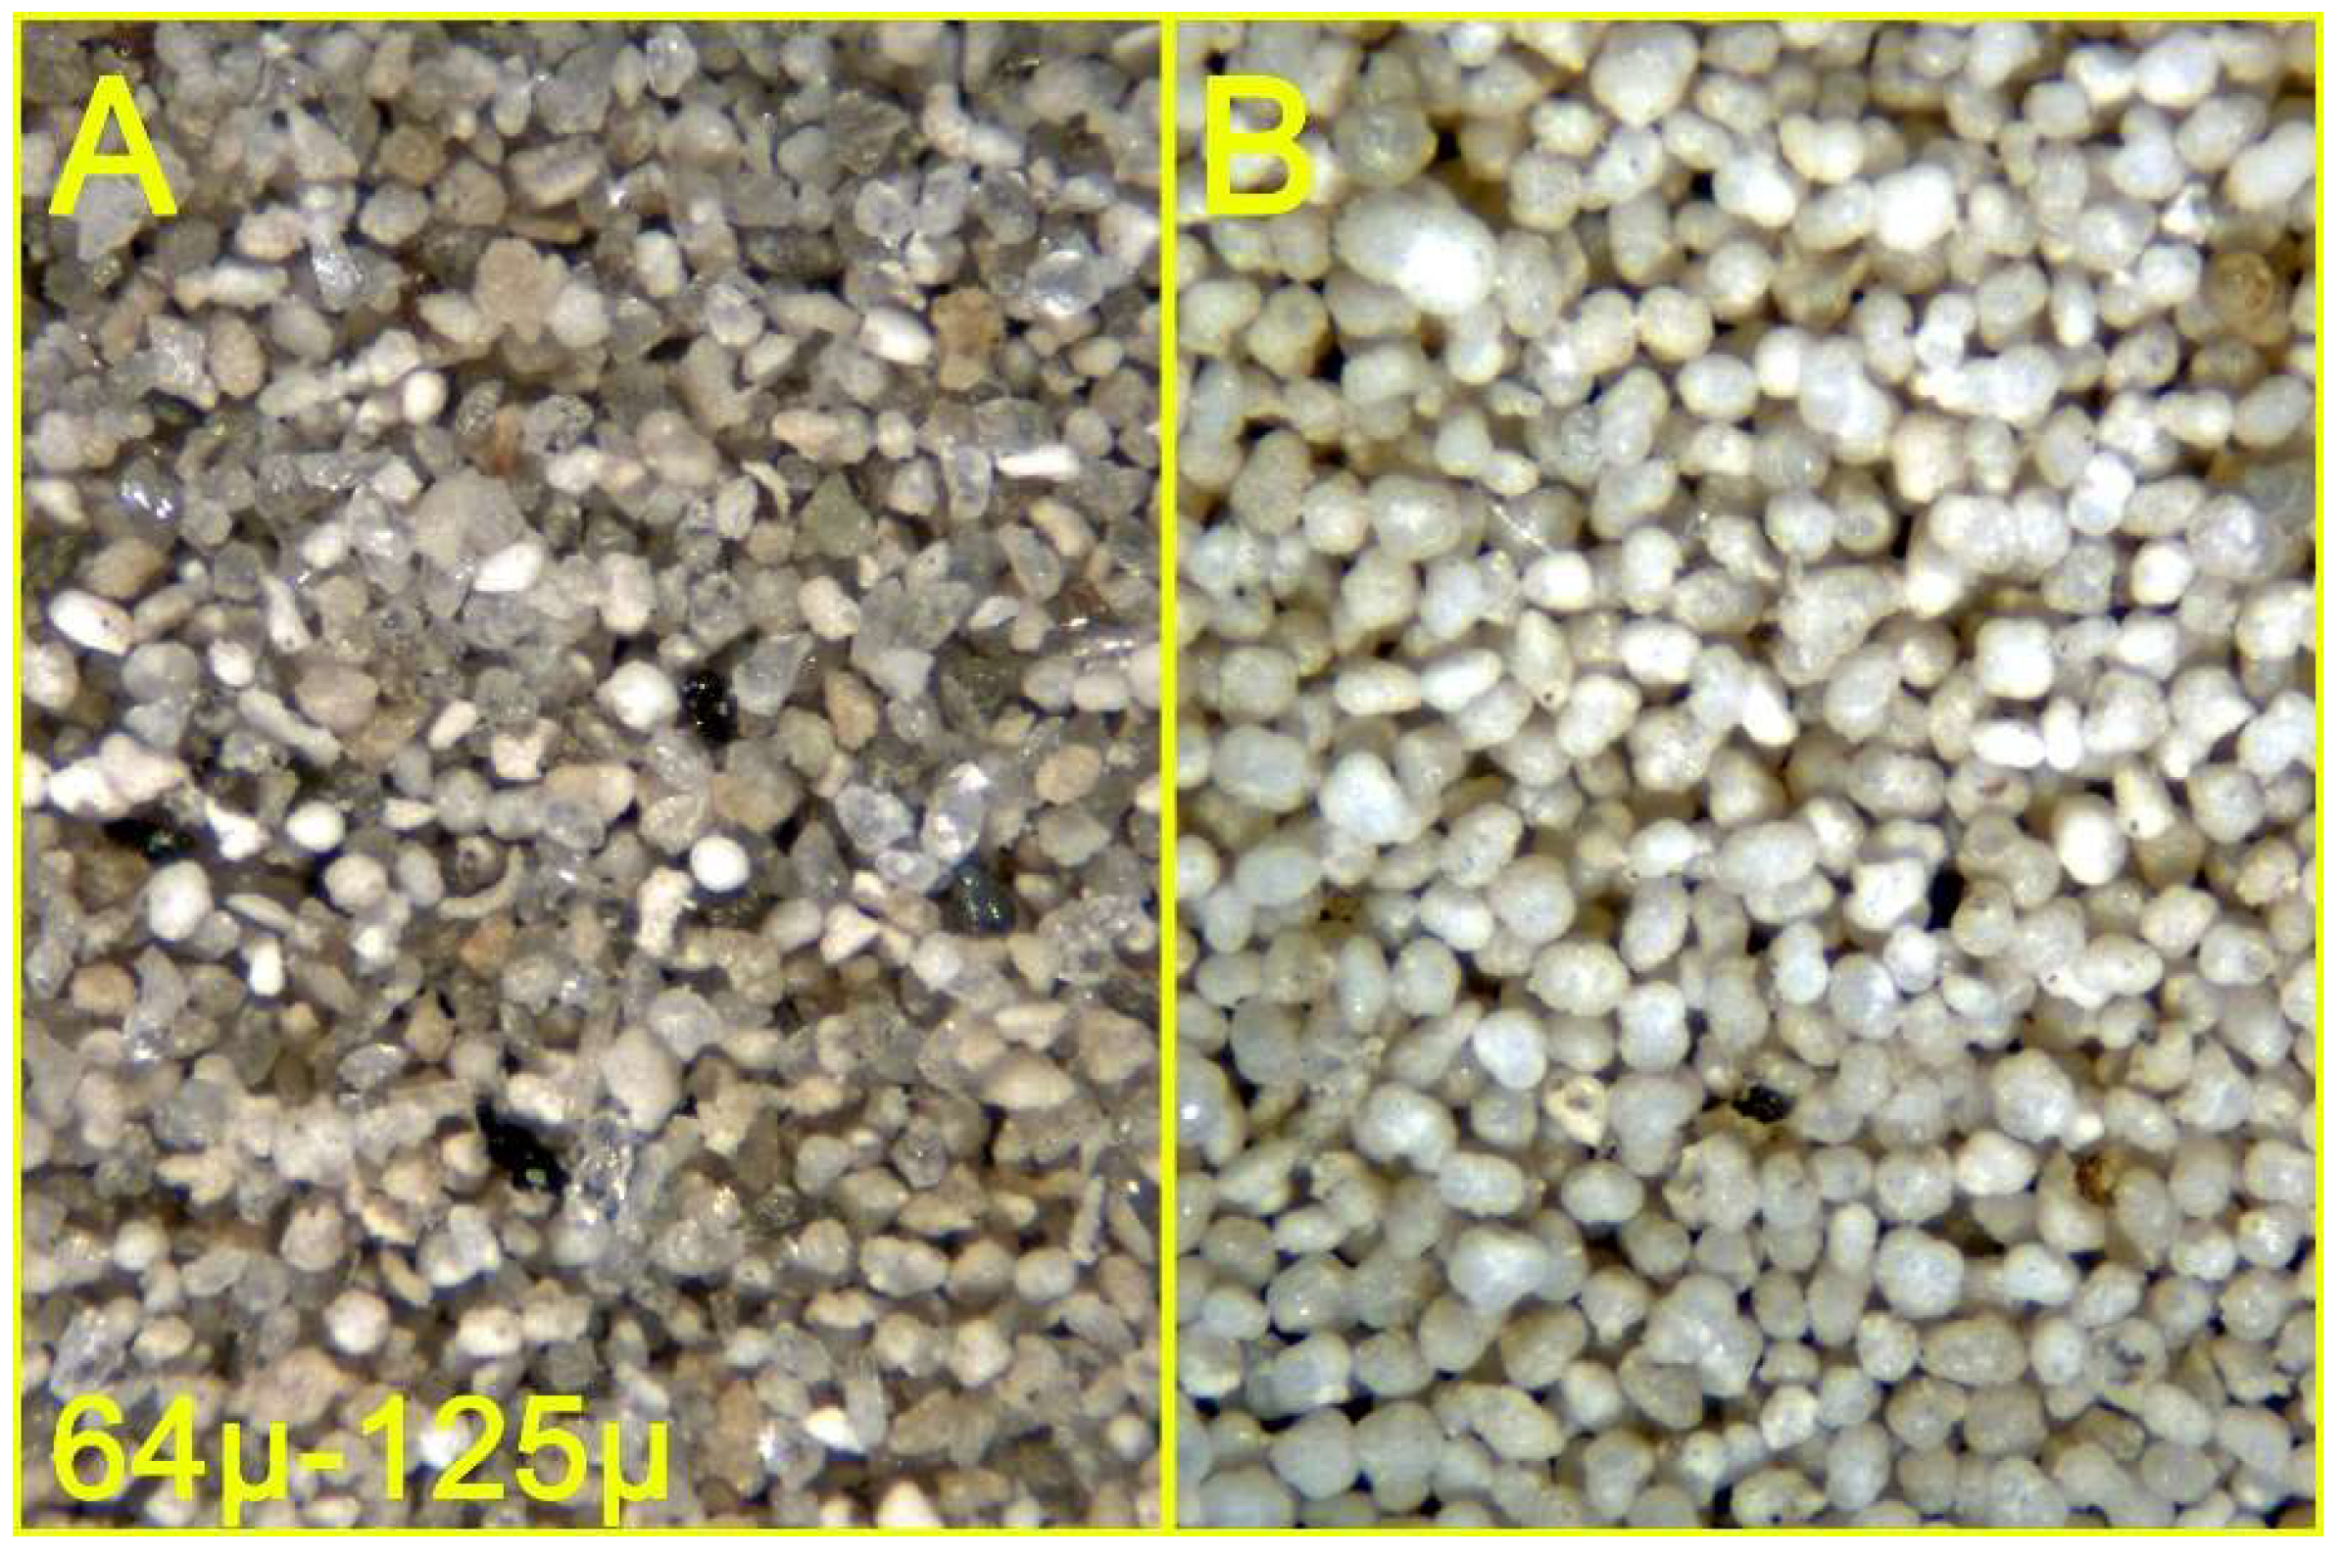
- Subjectively, the recovery rate was generally higher than expected, and particularly useful for the smallest grain-size class, in which tests – especially when interspersed in overwhelming sand, may be entirely impossible to recover by wet brush.
4. Conclusions
Conflicts of Interest
References
- Coulbourn, W.T.; Resig, J.M. On the Use of Benthic Foraminifera as Sediment Tracers in a Hawaiian Bay. Pacific Science 1975, 29, 99–115. [Google Scholar]
- de Vernal, A.; Henry, M.; Bilodeau, G. Micropaleontological preparation techniques and analyses, 3rd ed.; Notes prepared for students of course SCT 8245; Département des Sciences de la Terre, UQAM - Les Cahiers du GEOTOP 3, 2010. [Google Scholar]
- Debenay, J.P. A Guide to 1,000 Foraminifera from Southwestern Pacific (New Caledonia); MNHN Publications Scientifiques du Muséum: Paris, 2012. [Google Scholar]
- Hempel, S.; Flemming, B. Benthic Foraminifera of the Agulhas Bank coastal shelf in the vicinity of Plettenberg Bay, South Africa: a reconnaissance survey. Geo-Marine letters 2021, 41, 21. [Google Scholar] [CrossRef]
- Kotthoff, U.; et al. Reconstructing Holocene temperature and salinity variations in the western Baltic Sea region: a multi-proxy comparison from the Little Belt (IODP Expedition 347, Site M0059). Biogeosciences 2017, 14, 5607–5632. [Google Scholar] [CrossRef]
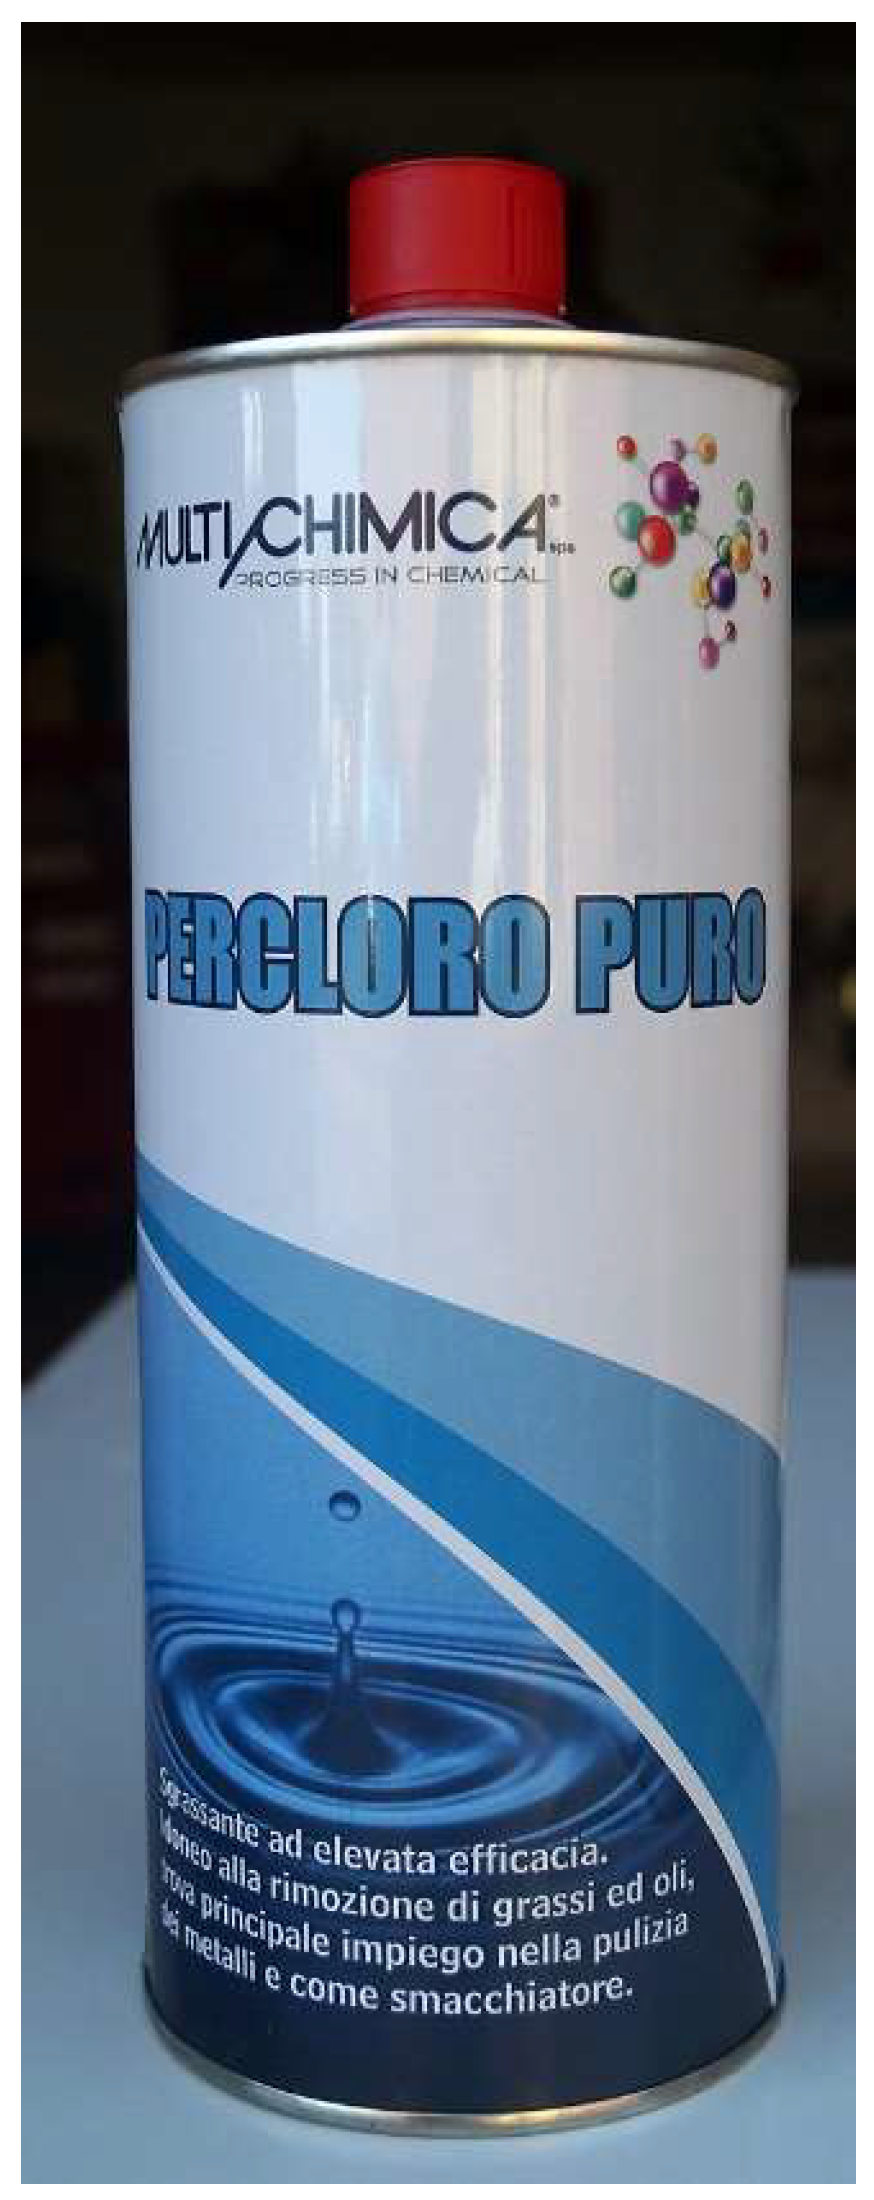
- Multichimica Percloro Puro. Available online: https://www.multichimica.it/prodotto/percloro-puro-1640/ (accessed on 7 August 2024).
- Murray, J.W.; Alve, E. Taphonomic experiments on marginal marine Foraminiferal assemblages: how much ecological information is preserved? Palaeogeography Palaeoclimatology Palaeoecology 1999, 149, 183–197. [Google Scholar] [CrossRef]
- Parent, B.; Barras, C.; Jorissen, F. An optimised method to concentrate living (Rose Bengal-stained) benthic Foraminifera from sandy sediments by high density liquids. Mar. Micropaleontol. 2018, 144, 1–13. [Google Scholar] [CrossRef]
- Schönfeld, J.; Alve, E.; Geslin, E.; Jorissen, F.; Korsun, S.; Spezzaferri, S. The FOBIMO (FOraminiferal BIo-MOnitoring) initiative—Towards a standardised protocol for soft-bottom benthic Foraminiferal monitoring studies. Mar. Micropaleontol. 2012, 94–95, 1–13. [Google Scholar] [CrossRef]
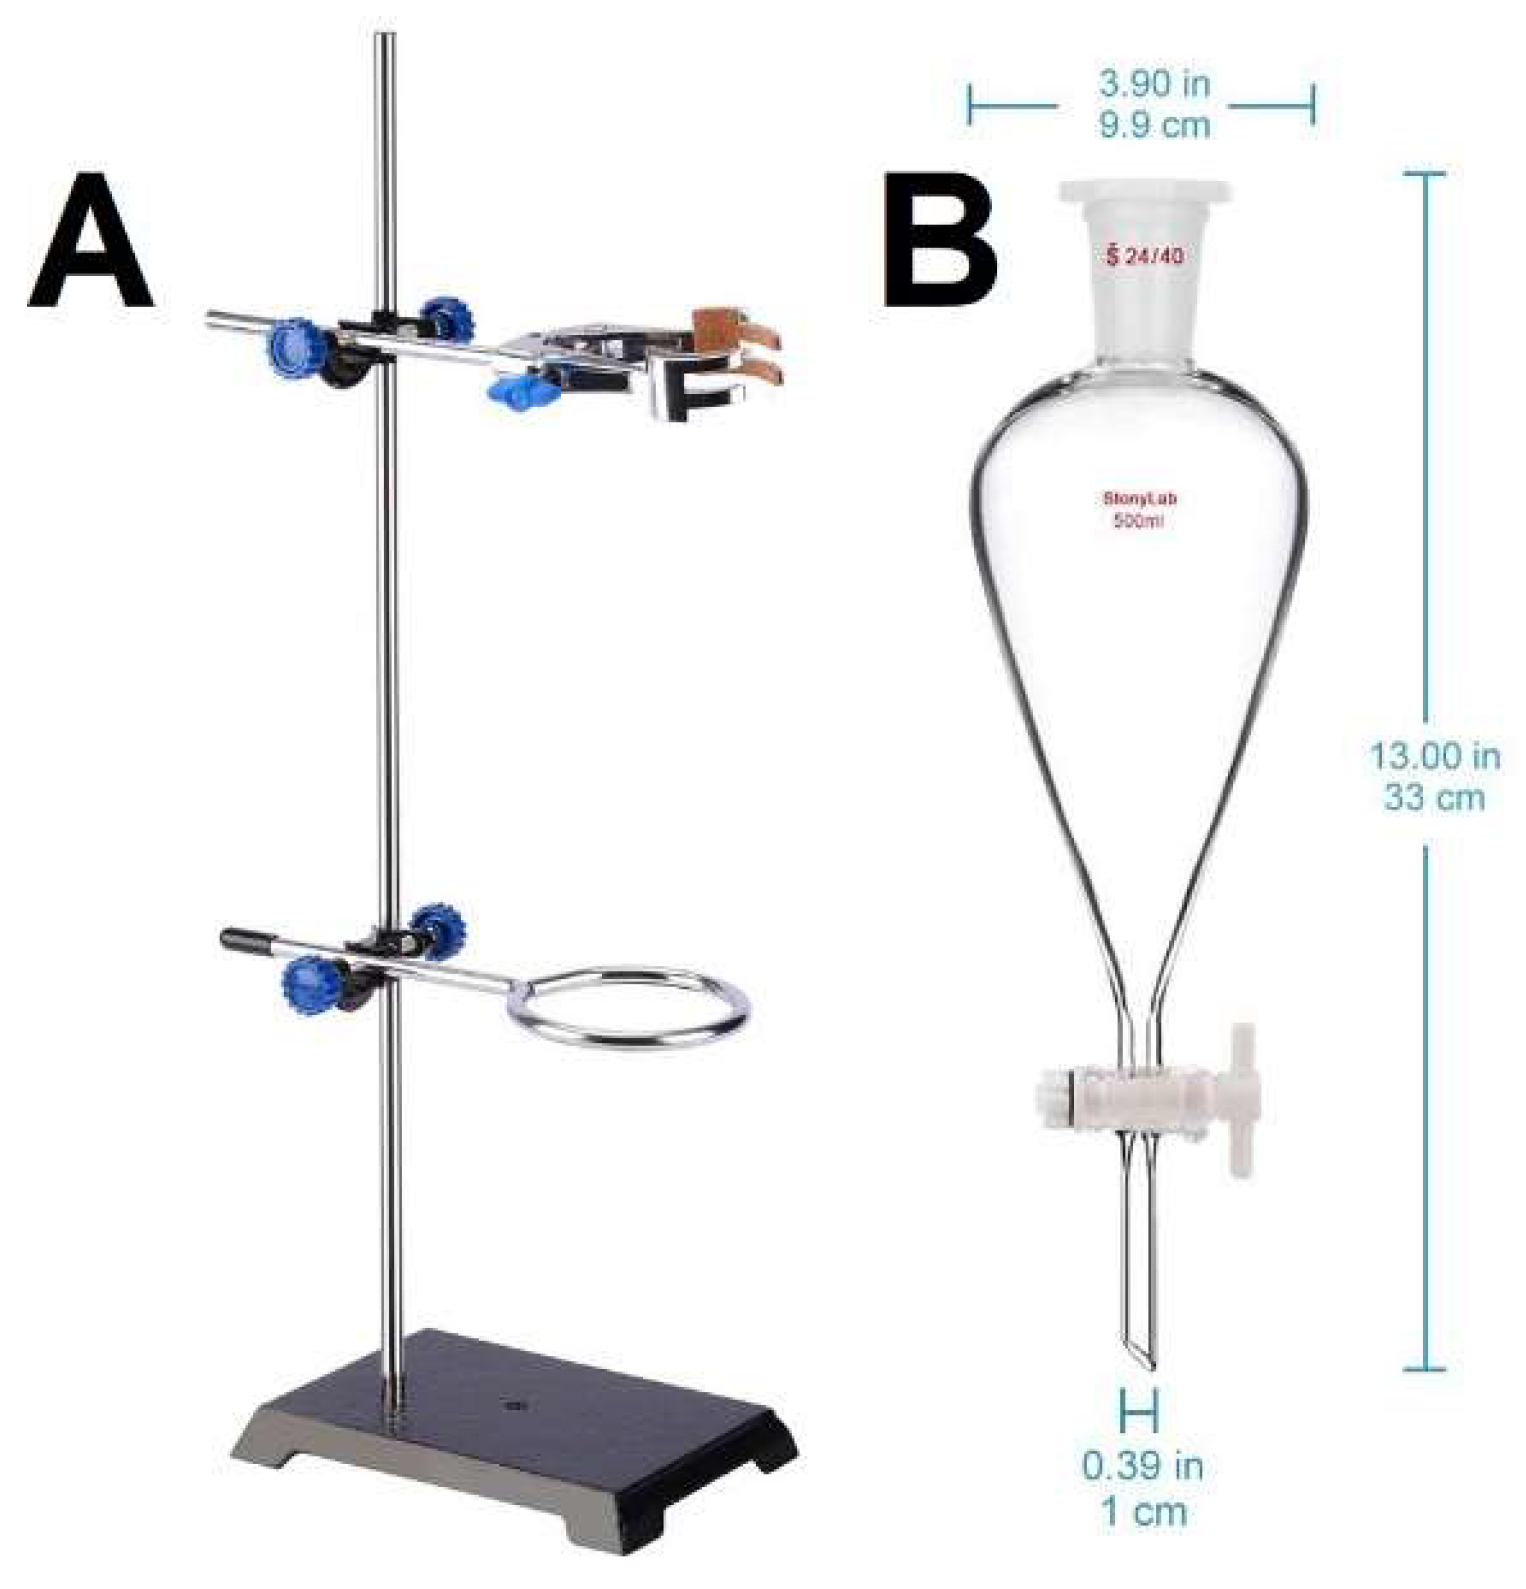
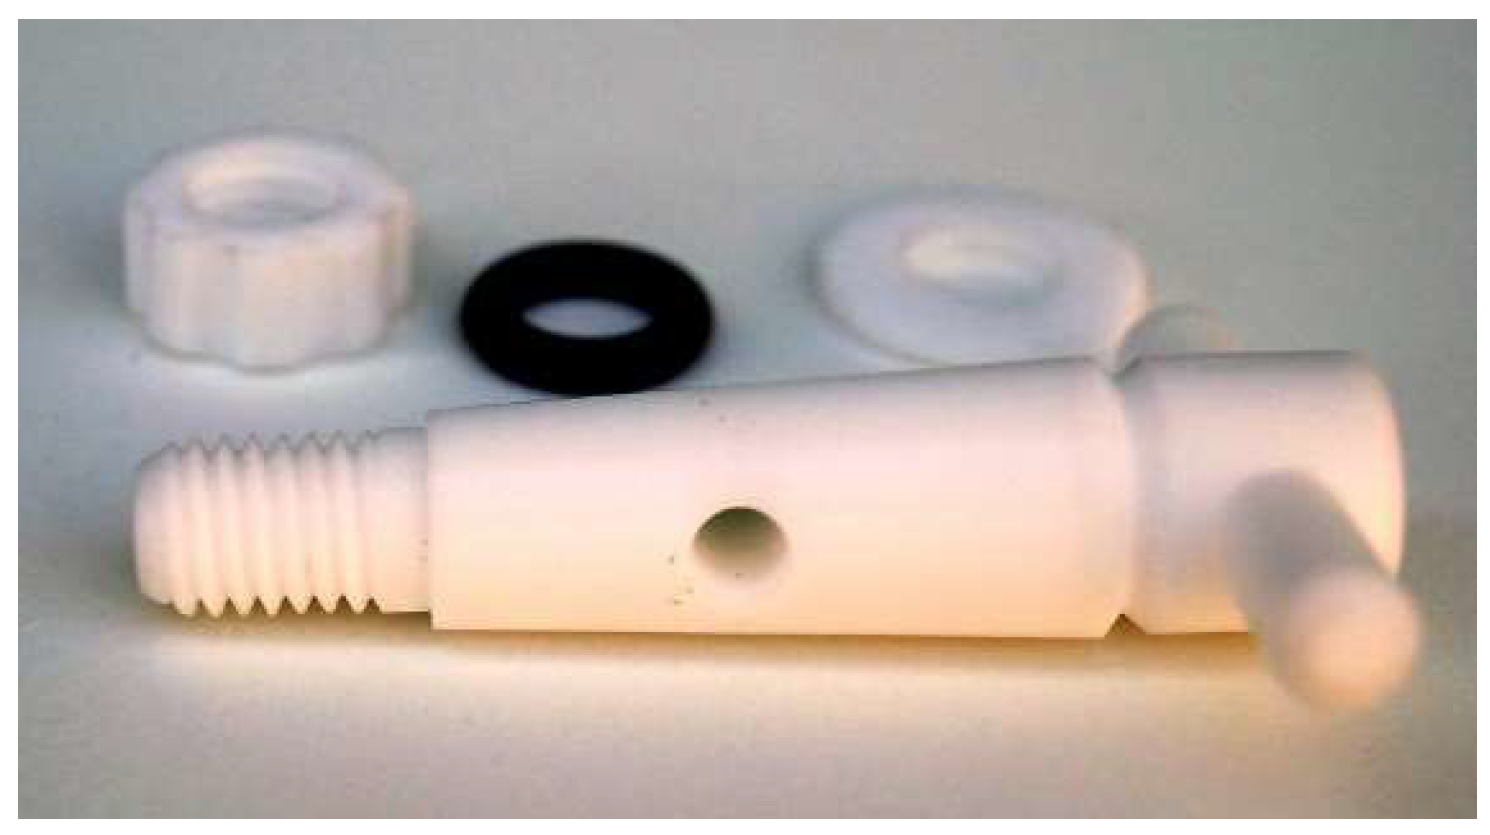
- Stonylab 500ml Separatory Funnel. Available online: https://www.amazon.it/dp/B07HG1KCPL (accessed on 7 August 2024).
- Stonylab Lab Stand Set. Available online: https://www.amazon.it/dp/B08P6Z5L68 (accessed on 7 August 2024).
- Thomsen, L. Bakterien und Meiofauna in Gangsystemen der Makrofauna. Berichte aus dem Sonderforschungsber. 313. Kiel 1989, 19, 1–155. [Google Scholar]
- Thomsen, L. Treatment and splitting of samples for bacteria and meiofauna biomass determinations by means of a semi-automatic image analysis system. Mar. Ecol. Prog. Ser. 1991, 71, 301306. [Google Scholar] [CrossRef]
- Savage, N.M. The use of sodium polytungstate for conodont separations. J. micropalaeontol. 1988, 7, 39–40. [Google Scholar] [CrossRef]
- Sigma-Aldrich. Safety Data Sheet Tetrachloroethylene Version 4.11. 2019.
- Available online: https://www.vanderbilt.edu/vinse/facilities/safety_data_sheets/Tetrachloroethylene.pdf (accessed on 7 August 2024).
- Univar Solutions. Safety Data Sheet Perchloroethylene Version 1.6. 2022. [Google Scholar]
- Available online: https://labelsds.com/images/user_uploads/Perchloroethylene%20Univar%20SDS%205-24-22.pdf (accessed on 7 August 2024).
Disclaimer/Publisher’s Note: The statements, opinions and data contained in all publications are solely those of the individual author(s) and contributor(s) and not of MDPI and/or the editor(s). MDPI and/or the editor(s) disclaim responsibility for any injury to people or property resulting from any ideas, methods, instructions or products referred to in the content. |
© 2025 by the authors. Licensee MDPI, Basel, Switzerland. This article is an open access article distributed under the terms and conditions of the Creative Commons Attribution (CC BY) license (http://creativecommons.org/licenses/by/4.0/).


