
Submitted:
01 February 2025
Posted:
03 February 2025
You are already at the latest version
Abstract
Understanding mold flux crystallization is essential for evaluating heat transfer during steel casting. In casting, the mold gap's complexity raises questions about the ideal testing method and nucleation type—heterogeneous or homogeneous. This study examines how crucible materials influence mold flux crystallization, focusing on the wetting behaviors of platinum and graphite with mold flux. Confocal laser scanning microscopy (CLSM) was employed to observe in-situ nucleation, and differential scanning calorimetry (DSC) was used under non-isothermal conditions across cooling rates (5–30°C/min) for the flux sample to determine the crystallization temperatures. Results showed significantly lower crystallization temperatures in graphite crucibles versus platinum, with similar trends for synthetic slag and Li2SO4, validated through experimental DSC data and Factsage® simulations. X-ray diffraction (XRD) and scanning electron microscopy- energy dispersive X-ray spectroscopy (SEM-EDS) were utilized to identify crystal phases and interactions between the flux and graphite wall. Graphite’s non-wetting characteristics hindered nucleation, requiring greater undercooling, while platinum’s superior wetting properties facilitated nucleation by lowering surface energy and the free energy barriers. These findings highlight the influence of crucible materials on nucleation behavior, providing valuable insights for refining mold flux testing methodologies and, ultimately, advancing the understanding of nucleation mechanisms during solidification in the casting process.
Keywords:
mold fluxes
; nucleation
; crystallization
; crucible materials
; wetting conditions
; DSC
; CLSM
1. Introduction
Mold flux is a multi-component oxyfluoride powder that is employed on top of liquid steel during continuous casting process. The mold powder melts when heated by the liquid steel pool and penetrates between the solidifying steel shell and the mold as casting occurs. The initially slag film that forms in the mold gap is mostly glassy, driven by the high cooling rates as it quenches against the cold mold wall. Over time, however, the fraction of crystallized phases in the slag film progressively increases as the glassy layer undergoes devitrification [1]. Crystallization, being one of the most pivotal factors for controlling heat transfer, plays a crucial role in steel casting. Alterations in its characteristics can lead to non-uniform horizontal heat transfer and suboptimal lubrication, potentially compromising process efficiency and product quality [2].
The study of mold flux crystallization kinetics provides insights into the crystalline phase fraction as a function of time and temperature. It also reveals the crystallization mechanisms of mold fluxes and helps in understanding variations in crystallization behavior across different flux systems [3]. Sarkar and Li [1] conducted a comprehensive literature review on isothermal and non-isothermal crystallization kinetics studies of mold fluxes. Differential scanning calorimetry (DSC) and confocal laser scanning microscopy (CLSM) are widely used thermo-analytical techniques for investigating crystallization kinetics. As reported in the literature [1], platinum pans or crucibles are commonly employed in DSC testing of mold fluxes due to their chemical inertness and high melting point.
Platinum is a precious and expensive crucible material. Some cases, especially for mold flux examinations, destructive post-processing for sample characterization is required, i.e., crucibles are cut and destroyed since mold flux strongly adheres to the inner wall of the crucible. Also, when the crucible is reused, it goes through a cleaning process that involves harsh chemicals, which can lead to safety and cost-related concerns. However, graphite is an inexpensive and abundant high-temperature material. Under conditions of low oxygen potential, graphite demonstrates chemical stability and high resistance to thermal shock. Furthermore, it is a relatively soft material, facilitating machining into a various shapes and configurations [4]. Although, graphite tends to oxidize at high temperature in air, it can still be employed as a crucible material in advanced thermo-analytical techniques such as DSC and CLSM, as a neutral environment is ensured with the purging of high-purity inert gases. Moreover, graphite is an integral part of most mold flux systems. Graphite is the principal component for controlling the melting rate of the flux. It is important to note that, mold flux wetting behavior varies with the substrate or crucible material that it is in contact when tested using advanced thermo-analytical techniques.
Wettability describes how well a liquid can spread across a solid surface, assessed by the angle of wetting formed between the substrate and the tangent drawn at the triple point. Wetting is quantified using the contact angle, denoted θ. This angle forms where the substate, liquid, and gas interfaces meet, reflecting the balance of surface tension forces acting on the liquid droplet [5]. A contact angle of 180° signifies complete non-wetting, while practically, a solid is considered non-wetting if the contact angle exceeds 90° [6]. Conversely, complete wetting occurs when the contact angle is 0°, allowing the liquid to spread spontaneously across the solid surface [5]. Standardized tests, such as DSC and CLSM, provide data on the onset of crystallization. However, in the complex environment of the mold gap during continuous casting, the wetting conditions among the mold, steel, and mold flux remain unclear. Numerous studies [7,8,9,10,11,12,13] have explored the wetting characteristics of mold flux droplets on steel substrates using sessile drop tests. These investigations primarily focused on the effects of compositional changes in slag and steel on wettability, arguing that the initial wettability of slag on steel significantly influences slag entrapment during the casting process and, consequently, the surface quality of the final slab. However, the literature reveals a notable knowledge gap regarding the impact of mold flux wetting behavior on copper molds and its role in crystallization, which in turn affects interfacial heat transfer during the casting process, as nucleation usually occurs on the mold wall side of the mold gap. Kromhout [14] reported from the literature that the pumping during oscillation forced the liquid slag to spread on the copper mold surface. The interface adhering is non-wetting in that case. However, the condition during casting seems to be opposite to this claim and require additional investigation. Park and Sohn [15] examined interfacial heat transfer between mold flux and a copper disc mold simulator (CDMS) as a function of the average waviness of the flux disc where the liquid slag was poured into the concentric disc groove of the CDMS. Their study did not address the wettability of mold flux on the copper mold and the nature of the environment.
Apart from the copper disc mold simulator, a lab-scale mold simulator is another tool for understanding heat transfer during steel casting, particularly concerning the evolution of the flux film between the mold and cast steel. The literature offers a broad range of research on mold simulators [16,17,18,19,20,21,22,23,24,25,26], covering topics such as mold flux crystallization, heat transfer through mold flux, lubrication of mold flux, and interfacial thermal resistances in continuous casting of various steel grades. Recently, Nazim et al. [27] have implemented a novel approach to an optical-fiber instrumented mold simulator that can be further used to enhance the understanding of heat transfer through mold flux. According to the study, high-resolution optical-fiber-based distributed temperature sensors can capture transient heat transfer phenomena. Figure 1 shows a micrograph of the mold flux film’s cross-section recovered from a mold simulator experiment. The flux film contains two component layers: a crystallite layer, which forms from the devitrification of the glassy layer and is non-dendritic in appearance, and a dendritic layer that grows against the heat transfer and is close to the steel side. These dendrites may nucleate heterogeneously from the pre-existing non-dendritic crystals, as supported by a previous study [28]. The key challenge lies in determining the testing methodology that best represents this environment and whether nucleation in the system is primarily heterogeneous or homogeneous. Another important consideration is the nature of this environment, and whether the mold wall contributes to wetting for nucleation, though the exact answer remains unclear.
To the best of our knowledge, no study has been performed to date on the effect of crucible material’s wettability on crystal nucleation in continuous casting mold flux. Novak et al. [29] investigated the wetting behavior of graphite and platinum substrates at 1550°C with borate oxide glass systems containing B2O3 with an average basicity of 0.21. This study showed that contamination occurred in the oxide glass samples, as the graphite substrate wetted them due to high adhesion and the formation of reaction products at the interface. However, continuous casting mold flux has a higher basicity, is silicate based, and is utilized in different applications than the borate glass system. Additionally, the operating temperature of mold flux is significantly lower, and its wetting behavior with graphite and platinum appears to be the opposite of what was observed in the present study due to the formation of boron carbide.
This paper aims to investigate the influence of crucible wetting behavior on crystallization of an industrial-grade mold flux. Thermo-analytical techniques, including DSC and CLSM, were used to quantify the onset of primary crystallization of the flux through non-isothermal testing at various cooling rates. The flux samples were characterized using scanning electron microscopy coupled with energy dispersive X-ray spectroscopy (SEM-EDS) and X-ray diffraction (XRD). Additional calibrations were conducted using gold and Li2SO4, followed by thermodynamic equilibrium simulations in Factsage® to assess potential reaction with graphite. SEM-EDS analysis was performed post-mortem at the interface to assess potential reactions between the mold flux sample and the graphite crucible wall. This study aims to enhance understanding of how wetting versus non-wetting affects crystal nucleation in mold flux, depending on whether platinum or graphite crucibles are used. The findings are of practical significance, as carbon or graphite is an essential component in mold flux design. Moreover, this work paves the way for future investigations into the influence of wetting characteristics on mold flux in the complex environment of the meniscus during continuous casting of steels.
2. Materials and Methods
2.1. Sample Preparation
An industrial CaO-SiO2-based mold flux was used in the present study. The flux is used to cast medium carbon, hyper-peritectic steel grades in a thin slab caster. Table 1 and Table 2 tabulate the flux’s chemical composition and physical properties, respectively. A sample size of 60 mg was maintained for each experiment in both DSC and CLSM. Raw mold flux powder was calcined at 725°C for 5 hours in air, then pre-melted in a resistance furnace at 1300°C. The molten flux was subsequently poured and rapidly quenched between two room-temperature copper plates. This process promotes oxidation of the flux powder and removes volatile carbon and carbonaceous elements. The resulting glassy samples were later used for crystallization studies in DSC and CLSM.
2.2. Test Procedures and Methods
2.2.1. Crystallization Temperature Measurements using Differential Scanning Calorimetry (DSC)
The DSC experiments were performed using a Thermal Gravimetric Analyzer/Differential Scanning Calorimeter (TGA-DSC), model Netzsch 449 F5 Jupiter (Netzsch-Gerätebau GmbH, Selb, Germany), with argon as the purge gas. Before testing, the setup was calibrated using pure substances (Indium, Tin, Aluminum, Bismuth, and Au) for both temperature and sensitivity calibration. A new baseline was established for each specific heating and cooling rate using empty crucibles, both graphite and platinum. After calibration, 60 mg of glassy samples were heated to 1300°C at a rate of 20°C/min and held for 2 minutes for volatilization, followed by continuous cooling to room temperature at various rates of 5, 10, 15, 20, 25, and 30°C/min, using platinum and graphite crucibles separately. The controls ensured that the test sample and the reference temperatures were maintained the same throughout the experiment. The tests were conducted in an inert environment with an argon flow of 50 mL/min. Platinum pans used in the tests were 5 mm long with an inner diameter of 5 mm, while the graphite crucibles were 7 mm long and had similar inner diameter. High purity platinum pans were sourced from an external vendor, while graphite crucibles were machined from high-purity graphite rods.
2.2.2. Observation of Onset of Crystallization using Confocal Laser Scanning Microscopy (CLSM)
A 60 mg glassy flux sample was placed in a graphite crucible, and the experiment was conducted in the melting stage using a Lasertec VL2000DX-SVF17SP High-Temperature CLSM system in an ultra-high-purity argon environment. Details of the experimental apparatus have been discussed elsewhere [30]. The thermal cycle in the CLSM was identical to that of the DSC, except for testing only one cooling rate (20°C/min). The heating and holding phases were the same, with heating provided by light emitted from a halogen lamp. The test aimed to observe in-situ crystallization on the flux surface within the graphite crucible during non-isothermal experiments at a cooling rate of 20°C/min. The crystallization process was monitored and video recorded at a scanning rate of 60 frames per second. The specimen’s image was captured based on contrast differences produced by the scanning laser, operating within the ultraviolet wavelength range.
2.2.3. X-Ray Diffraction for Phase Detection
XRD analysis is widely used to identify crystals formed during crystallization processes. Post-experiment samples from the graphite crucibles were taken from the CLSM experiment, crushed into powder, and subjected to XRD analysis. Following the same thermal cycle as in the CLSM experiment, the sample was cooled slowly to 1000°C at a rate of 5°C/min; this temperature is below the primary crystallization temperature, allowing sufficient time for primary crystals to nucleate. The sample was then rapidly quenched to room temperature at a 2000°C/min cooling rate. This process ensured that the formed primary crystal phase was retained and detectable by SEM and XRD. The XRD analysis was conducted using a Panalytical X’Pert Multi-Purpose Diffractometer with a 1.8 kW sealed copper X-ray source. The resulting peak list was compared with the Inorganic Crystal Structure Database (ICSD) data. XRD was also used to characterize the crystal phase of a common standard (Li2SO4) cooled from the melt.
2.2.4. Computational Thermodynamic Analysis
Thermodynamic simulations were performed to assess the potential reactions between carbon or platinum and the common standard, Li2SO4. The equilibrium phases were calculated by simulating the reaction of 1 gram of carbon or platinum with Li2SO4 using the Equilib module in FactSage® 8.3 (Thermfact Ltd. and GTT Technologies, Montreal, Canada/Aachen, Germany). The FToxid and FTmisc databases were utilized for the simulation. Phase stability diagrams were generated for a temperature range from 1000°C to 0°C.
2.2.5. Calibration of Graphite Crucible using Synthetic Slag, Pure Gold, and Li2SO4
The graphite crucible was calibrated using a gold standard in DSC with a moderate cooling rate of 20°C/min. Additionally, a synthetic slag was tested in both graphite and platinum crucibles under the same cooling rate in DSC to evaluate the reactivity between the amphoteric oxide (FeO/Fe2O3 and MnO) components in the mold flux and the inner wall of the graphite crucible. Furthermore, a common standard, Li2SO4, was tested in both crucibles using the same procedure for calibration purposes.
2.2.6. Elemental Map using Scanning Electron Microscopy Coupled with Energy Dispersive X-Ray Spectroscopy (SEM-EDS)
SEM was used to further investigate the precipitated crystals. Additionally, SEM-EDS was employed for compositional analysis of the post-CLSM samples at room temperature and the post-experiment DSC mold flux sample. It was also used to examine the interface of the graphite-run DSC sample in a TESCAN VEGA SEM. The post-experiment flux sample was mounted in epoxy and polished to 0.5 microns. The polished surface was then coated with a gold-palladium (Au-Pd) layer to enhance electrical conductivity using a Denton sputter coater, set to 8mA for 45 seconds. A copper tape was applied to create an electrical path from the bottom to the top (surface) of the sample for SEM analysis. This analysis helps determine whether carbon particles from the graphite crucible infiltrated the mold flux sample, providing insights into potential interactions at the interface between the mold flux and the graphite inner wall.
3. Results and Discussion
3.1. Crucible Material-Dependent Wetting Characteristics
Mold flux in contact with the mold wall/substrate is considered as a surface assisted heterogeneous nucleation process owing to less energy requirement across the bonding interface than homogeneous nucleation [31]. In heterogeneous nucleation, the wetting/contact angle (θ) characterizes the interaction between the newly formed phase and the substrate/mold wall, by reducing the energy needed. The free energy required for heterogeneous nucleation is equal to the product of homogeneous nucleation and a function of the contact/wetting angle (θ) as follows [31]:
where, f((θ) = ; θ = wetting/contact angle
ΔGheterogeneous = ΔGhomogeneous * f((θ)
Crucible-mold flux system best represents the gas-liquid-mold system. The classical Young’s equation defines the equilibrium contact angle at the interface of the system, which is determined by the balance of surface energies, as follows:
where, γ = surface tension, and (G-M), (G-L), and (L-M) represents gas-mold, gas-liquid and liquid-mold interface respectively.
γ(G-M) =γ(G-L) +γ(L-M) cosθ
Figure 2 illustrates the schematics of wetting and non-wetting conditions of a droplet of a material (in this case, mold flux) that solidify from a melt in contact with different crucible materials/mold wall. The cross-section of the post-experiment DSC solidified mold flux samples revealed concave and convex surface shapes for platinum and graphite crucibles, respectively. Figure 3 shows the post DSC experiment mold flux in graphite and platinum crucibles and the schematics of the surface shape of solidified flux samples in graphite and platinum crucibles from a cross-sectional view.
The mold flux exhibited non-wetting behavior with a large contact angle associated the graphite crucible, whereas it wetted the platinum crucible with a small contact angle, resulting in opposite surface orientations.
3.2. Measurements of Crystallization Temperature Depending on Crucible Materials in DSC
In the DSC, changes in heat flow or calorific values were measured across various temperatures. During fusion or crystallization, the DSC curve showed an exothermic peak, indicating the release of excess heat during crystallization. This process decreased the system’s entropy, driving it to a lower energy state. Figure 4 presents the heat flow versus temperature curves from non-isothermal DSC tests performed on 60 mg mold flux samples at various cooling rates (5, 10, 15, 20, 25, and 30°C/min) using platinum and graphite crucibles. Crystallization temperatures were determined by the onset of exothermic peaks (shown in a downward direction in Figure 4) during cooling.
In Equation (2), θ becomes small when the surface tension between the two phases is low. Complete wetting is defined by θ = 0. When θ < 90°, in the wetting condition, surface tension and free energy for nucleation increase. This is observed in mold flux tested in platinum crucibles. In contrast, in a non-wetting scenario, more undercooling is required to provide the additional free energy for nucleation. As a result, the primary crystallization temperature decreases under non-wetting conditions, such as when the mold flux is tested in graphite crucibles. All DSC experiments with mold flux in graphite crucibles showed lower primary crystallization temperatures than those with platinum crucibles, across all cooling rates. Figure 5 illustrates this phenomenon across the range of cooling rates for both crucible materials. In Figure 5(a), CCT curves are plotted based on the primary crystallization tested for all cooling rates in both graphite and platinum crucibles. Figure 5(b) shows the onset of primary crystallization shifting to lower temperatures when graphite crucibles are used. It was also observed that the exothermic peaks on the DSC curves shifted to lower temperatures, and the shape of these peaks became sharper as the cooling rate increased. A similar trend was seen for both crucibles. This can be attributed to the dependence of crystal nucleation and growth rates on viscosity and undercooling. At higher cooling rates, viscosity increases rapidly, requiring a stronger driving force to initiate mold flux nucleation [2,32]. For simplicity, only the primary crystallization temperatures of the mold flux were considered in this study, as secondary crystallization temperatures are beyond the scope of this paper. There was also insignificant difference (only 5°C) in the mold flux melting peaks for both crucibles during the heating at a heating rate of 20°C/min (Figure 6) which could be from small experimental errors. This small difference in the melting onset temperature is negligible as compared to the crystallization temperature difference during cooling that shows evidence of effect of wetting on mold flux crystallization.
Table 3 summarizes the various onset temperatures for primary crystallization in graphite and platinum crucibles. On average, the onset of primary crystallization occurred 143°C lower during cooling when switching from a platinum crucible to a graphite crucible. In the case of the platinum crucible, good wettability between the liquid flux and the crucible appeared to favor heterogeneous nucleation of solid. As a result, increased wetting promoted crystallization. Consequently, lower onset crystallization temperatures (higher undercoolings) were observed in the presence of graphite crucibles.
Table 4 presents the mass losses during all tests in both crucibles in the DSC. On average, the DSC tests showed a mass loss of approximately 3%, indicating minimal material degradation or volatilization during the experiments. Moreover, the losses were decreased with increased cooling rates for each crucible type.
3.3. Observation of Onset of Primary Crystallization in CLSM
In-situ crystal nucleation and growth on the mold flux liquid surface were observed using CLSM. A graphite crucible was used to analyze the mold flux in CLSM. Figure 6 presents images captured during the crystallization process of the flux when the temperature was decreasing from the melt at a cooling rate of 20°C/min. Initially, a bright spot was identified and focused on once the flux sample became fully liquid, which occurred 2 minutes after homogenization at 1300°C, following a heating rate of 20°C/min. As the cooling continued, the edge of the crystal phase emerged from the left and expanded diagonally toward the right. Figure 7 presents images captured at specific times and temperatures, accompanied by a scale bar for reference. The growing crystal phase became visible on the surface of the molten flux, appearing to move through the molten material. As the temperature gradually decreased, the primary crystal phase continued to grow. In Figure 7(b), secondary dendritic arms are visible, forming perpendicular to the surface as the temperature decreases.
The onset of primary crystallization for the tested flux at the same cooling rate of 20°C/min in the CLSM was slightly offset (47°C) compared to the DSC results in the graphite crucible. Literature reports [33] indicate that the temperature difference between the sample surface and the bottom of the crucible (where the thermocouple is positioned) can be as much as 40°C in CLSM, which is consistent with the findings of this study. The confocal microscope uses spatial filtering to create a focused illumination spot. As a result, crystallization can only be visualized at the focused spot in CLSM [1]. Therefore, the quantification of crystallization temperature in CLSM is less precise than in DSC. Using CLSM, locating the nucleation point is challenging; however, crystal growth can be visualized. Furthermore, nucleation appears to occur on the crucible wall, with crystals migrating from one side of the crucible in CLSM, as shown in Figure 7.
These crystals apparently nucleate at low temperatures on the crucible wall, and it is not possible to directly measure the temperature of the crucible wall. Instead, reliance must be placed on the system’s overall temperature, which is detected at the bottom of the crucible by the thermocouples in CLSM. Nevertheless, the onset of primary crystallization temperature in the graphite crucible found in CLSM was significantly lower than in the platinum crucible under the same conditions that found in DSC test. This phenomenon is consistent with the observation that non-isothermal crystallization tests of mold flux in a non-wetting graphite crucible resulted in delayed crystal precipitation during cooling. This delay was attributed to the need for additional energy to overcome the nucleation barrier, facilitated by greater undercooling.
3.4. Identification of Primary Crystal phase in XRD and SEM-EDS
The flux sample, quenched in CLSM after primary crystal formation, was further analyzed using SEM-EDS. The post-experiment CLSM mold flux sample in the graphite crucible was found to form into a spherical shape due to non-wetting interactions with the graphite wall. As a result, the sample was easily recovered from the crucible. Microstructural analysis of the flux sample, combined with EDS (Figure 8), revealed the presence of primary cuspidine crystals (Ca4Si2O7F2) dispersed within a glassy matrix. Elemental mapping of the observed area shows that Ca, Si, O, and F are concentrated in the white regions of the BSE image, while Na, Al, Si, and O are concentrated in the gray areas. This illustrates the distribution of the cuspidine crystalline phase within the glassy matrix. Since the primary crystals nucleated and grew at a slow cooling rate (5°C/min) from 1300°C to 1000°C before rapid cooling, the morphology of the cuspidine crystals was found to be faceted, consistent with findings from a previous study [2].
To confirm the accuracy of the obtained results, another sample underwent the same thermal cycle and was then crushed into powder for XRD analysis. This SEM-EDS observation was consistent with the XRD results, as shown in Figure 9, which identified cuspidine as the primary and only crystalline phase. The absence of the any other phases in the XRD analysis can be attributed to its glassy matrix appearance in the sample. Although the XRD results showed distinct diffraction peaks for cuspidine, a prominent amorphous hump was initially observed at low angles. This hump is characteristic of a glassy phase, likely due to the significant presence of a glassy matrix. The SEM-EDS analysis, mentioned earlier, alsoidentified the elements that seems to be in the glassy matrix.
3.5. Sensitivity of Graphite Crucible in DSC
To verify its sensitivity, the graphite crucible was calibrated in the DSC using a gold standard at a moderate cooling rate of 20°C/min. The calibrated DSC curves for both heating and cooling are shown in Figure 10. The standard phase transition temperature of gold is 1064°C. Gold tested in the graphite crucible displayed good agreement with the expected standard transformation, with deviations of only 1°C during heating and 2°C during cooling which verifies the test equipment and methodology.
Notably, there is a possibility of a reaction between the transition metal oxides in the mold flux and the graphite crucible. To eliminate this factor, a synthetic slag was tested in the DSC (20°C/min cooling rate) using both graphite and platinum crucibles. Table 5 presents the chemical composition of the slag, which is devoid of transition metal oxides such as Fe2O3 and MnO.
A higher basicity, synthetic slag that readily crystallizes during cooling was selected for the experiment. Notably, the onset of primary crystallization occurred at 21°C lower in the graphite crucible than the platinum crucible, despite the synthetic slag containing no transition metal oxides. This observation supports the notion that the wetting characteristics between the slag and the inner wall of the platinum crucible promote nucleation and that the differences on crystallization temparature are not the result of reactions with the crucible. This experiment required an additional 21°C of undercooling for the initial phase transition. Figure 11 illustrates the exothermic peaks of phase transitions during the cooling of synthetic slags in both graphite and platinum crucibles, tested at a cooling rate of 20°C/min.
Li₂SO₄ is the only standard calibration material compatible with both graphite and platinum crucibles. Consequently, it was tested in the DSC at a cooling rate of 20°C/min using both crucible types to measure the phase transformation temperature, as shown in Figure 12. The melting temperatures during heating were found to be very similar: -3°C for the graphite crucible and +4°C for the platinum crucible, relative to the standard melting temperature of Li₂SO₄ (578°C). During cooling, the phase transformation temperatures were also comparable, measuring 572°C for the platinum crucible and 565°C for the graphite crucible. The -6°C temperature deviation observed in the platinum crucible could be attributed to operational error, whereas the -13°C offset for the graphite crucible is likely due to a more pronounced non-wetting condition. This condition may necessitate greater undercooling to supply the additional free energy required for nucleation to occur.
After the DSC experiment, the Li2SO4 sample tested in the graphite crucible was collected and ground into powder for XRD analysis. To remove any moisture content, the sample was preheated prior to analyzing. The diffraction peaks confirmed the presence of only Li2SO4, with no additional phases observed from ICSD database. Figure 13 presents the XRD results.
3.6. Thermodynamic Equilibrium Simulations of Li2SO4 with Carbon and Platinum.
Potential interfacial reactions between Li2SO4 and either platinum or graphite were investigated using thermodynamic equilibrium simulations. Figure 14 presents the phase stability diagrams for reactions involving 1 g of carbon (C) or platinum (Pt.) with Li2SO4 over the temperature range of 1000°C to 0°C, generated using FactSage®. In both cases, Li2SO4 solidified at 578°C without the formation of any additional phases. The experimental results were in close agreement with the thermodynamic simulation predictions. Therefore, the observed reduction in the solidification temperature of Li2SO4 in the graphite crucible can be attributed solely to its wetting behavior.
3.7. Detection of Potential Interactions at the Interface of Flux and Graphite Crucible in SEM-EDS
After the DSC experiment, the mold flux sample tested in the graphite crucible at a cooling rate of 20°C/min was recovered and mounted in epoxy to enable grinding and polishing. The sample was coated with an Au-Pd layer and subjected to SEM-EDS analysis to investigate potential interfacial reactions. Prior to testing, the mold flux samples were calcined to eliminate any carbon content in the flux.
Figure 15 presents the elemental maps obtained through SEM-EDS from a cross-section of the flux sample. The image was captured to include a portion of the epoxy for reference. The EDS analysis confirmed that no appreciable carbon was detected within the mold flux and no reaction layers were observed at the flux-crucible interface. This indicates no reactions likely occurred between the mold flux and the graphite crucible’s inner wall during the DSC experiments and that no chemical reactions between the flux sample and the graphite crucible occurred. This analysis clarified that the observed variations in crystallization behavior were due to physical wetting effects rather than chemical interactions, highlighting the role of the crucible material in influencing crystallization.
3.8. Wetting Conditions on Crystallization
Mold flux nucleation or cuspidine crystallization is dominated by solid wetting in the liquid-solid-substrate system. On the other hand, there is a gas-liquid-mold interface in the vicinity of mold wall side in the mold gap. Wetting of the liquid to the crucibles in DSC and CLSM does not necessarily indicate that the solid also wets the crucible material. In these experiments, cuspidine appeared to be preferentially nucleated under liquid wetting conditions, suggesting that the solid also wets the substrate as well. So there appears to be some correspondence between the solid wettability and the inherent liquid wettability to lower the overall interfacial energy.
The present study suggests that the occurance of the crystallization at the crucible wall , i.e., wettability of solid cuspidine to the crucible, is enhanced when the liquid flux wets the platinum crucible. For cuspidine crystallization in a graphite crucible, the nucleation is suppressed to a low temperature, suggesting that the solid-liquid wetting angle for cuspadine in graphite is higher and nucleation is suppressed.
5. Conclusions
The effect of mold flux wetting conditions with varying crucible materials on crystallization was conducted in this article, and the following conclusions can be drawn:
- The conventional CaO-SiO₂-based mold flux exhibits strong wetting behavior with platinum crucibles but demonstrates a non-wetting condition when in contact with graphite crucibles.
- In all non-isothermal DSC experiments, mold flux samples in graphite crucibles consistently showed significantly lower primary crystallization temperatures compared to those in platinum crucibles across all tested cooling rates (5, 10, 15, 20, 25, and 30°C/min). The tendency for heterogeneous nucleation suppressed in a system that is non-wetting (graphite) than in a system that is wetting (platinum).
- In-situ solidification tests of mold flux in graphite crucibles using CLSM also revealed a decrease in the onset of primary crystallization temperature.
- Temperature measurements in the DSC with graphite and platinum crucibles using gold and Li2SO4 standards were found to be accurate to within a few degrees. DSC tests on synthetic slag exhibited a similar trend to mold flux, having lower crystallization temperatures in graphite crucibles compared to platinum crucibles.
- SEM-EDS analysis of the flux sample in the graphite crucible confirmed that no reactions occurred between the mold flux and the graphite crucible during the DSC experiments, clarifying that observed variations in crystallization behavior were due to the wetting characteristics of the crucible material rather than chemical interactions.
Author Contributions
Conceptualization, M.A.N., A.E., and R.O.; Methodology, M.A.N., A.E., and R.O.; Investigation, M.A.N.; Resources, T.S., and R.O.; Writing—original draft preparation, M.A.N.; Writing—review and editing, M.A.N., A.E., T.S., and R.O.; Supervision, A.E., and R.O.; Project administration, M.A.N., A.E., and R.O.; Funding acquisition, A.E., and R.O. All authors have read and agreed to the published version of the manuscript.
Funding
This research was funded by the Peaslee Steel Manufacturing Research Center (PSMRC) at Missouri University of Science and Technology (Missouri S&T).
Institutional Review Board Statement
Not applicable.
Informed Consent Statement
Not applicable.
Data Availability Statement
The original contributions presented in this study are included in the article. Further inquiries can be directed to the corresponding author.
Acknowledgments
The authors thank William Kirk for sample preparation, Katelyn Kiser, and Viraj Athavale for helping in CLSM tests, and Eric Bohanan for conducting DSC tests. Special thanks to all of the faculty including advisor of the project, Laura Bartlett as well as the industrial mentoring committee of the PSMRC for their help and guidance.
Conflicts of Interest
The authors declare no conflicts of interest.
Abbreviations
The following abbreviations are used in this manuscript:
| MDPI | Multidisciplinary Digital Publishing Institute |
| DSC | Differential Scanning Calorimetry |
| CLSM | Confocal Laser Scanning Microscopy |
| SEM-EDS | Scanning Electron Microscopy Coupled with Energy Dispersive X-Ray Spectroscopy |
| XRD | X-ray Diffraction |
| CDMS | Copper Disc Mold Simulator |
| TGA | Thermal Gravimetric Analyzer |
| ICSD | Inorganic Crystal Structure Database |
| C | Carbon |
| Pt. | Platinum |
References
- Sarkar, R.; Li, Z. Isothermal and Non-isothermal Crystallization Kinetics of Mold Fluxes used in Continuous Casting of Steel: A Review. Metall. Mater. Trans. B 2021, 52, 1357–1378. [Google Scholar] [CrossRef]
- Leng, M.; Lai, F.; Li, J. Effect of Cooling Rate on Phase and Crystal Morphology Transitions of CaO–SiO2-Based Systems and CaO–Al2O3-Based Systems. Materials 2018, 12, 62. [Google Scholar] [CrossRef] [PubMed]
- Shi, C.-B.; Seo, M.-D.; Wang, H.; Cho, J.-W.; Kim, S.-H. Crystallization Kinetics and Mechanism of CaO–Al2O3-Based Mold Flux for Casting High-Aluminum TRIP Steels. Metall. Mater. Trans. B 2015, 46, 345–356. [Google Scholar] [CrossRef]
- White, J. F.; Lee, J.; Hessling, O.; Glaser, B. Reactions Between Liquid CaO–SiO₂ Slags and Graphite Substrates. Metall. Mater. Trans. B 2017, 48, 506–515. [Google Scholar] [CrossRef]
- Kang, T. W.; Gupta, S.; Saha-Chaudhury, N.; Sahajwalla, V. Wetting and Interfacial Reaction Investigations of Coke/Slag Systems and Associated Liquid Permeability of Blast Furnaces. ISIJ Int. 2005, 45, 1526–1535. [Google Scholar] [CrossRef]
- Blake, T.D.; Berg, J.C. Wettability; Marcel Dekker Inc.: New York, USA, 1993. [Google Scholar]
- Chen, Z.; Yu, B.; Yao, T.; Du, W.; Ma, J. Wetting and Reaction Behavior of TiN and TiO2 with Different Mold Fluxes for High Ti-Bearing Stainless Steel. Metall. Mater. Trans. B 2024. [Google Scholar] [CrossRef]
- Si, X.; Wang, W.; Zhou, L.; Zeng, S.; Zhang, L.; Qi, J.; Liu, P. Wettability of Mold Flux with Various Droplet Sizes on Stainless Steel Substrates. Steel Res. Int. 2025, 96, 2400270. [Google Scholar] [CrossRef]
- Wang, W.; Gao, E.; Zhou, L.; Zhang, L.; Li, H. Effect of Al₂O₃/SiO₂ and CaO/Al₂O₃ Ratios on Wettability and Structure of CaO–SiO₂–Al₂O₃-Based Mold Flux System. J. Iron Steel Res. Int. 2019, 26, 355–364. [Google Scholar] [CrossRef]
- Yang, J.; Zhang, J.; Ostrovski, O.; Sasaki, Y.; Zhang, C.; Cai, D. Dynamic Wetting of High-Al Steel by CaO–SiO₂- and CaO–Al₂O₃-Based Mold Fluxes. Metall. Mater. Trans. B 2019, 50, 2175–2185. [Google Scholar] [CrossRef]
- Yang, Y.; Wang, W.; Zhou, L.; Luo, H.; Zheng, Q.; Zhao, R. Influence of Fluorine and CaO/Al₂O₃ Ratio on the Wetting Behavior Between CaO–Al₂O₃-Based Mold Flux and Steel Substrate. Steel Res. Int. 2023, 94. [Google Scholar] [CrossRef]
- Yuan, H.; Dan, Z.; Wang, Q.; He, S. Contact Angle and Adhesion of CaO–SiO₂- and CaO–Al₂O₃-Based Mold Slags on Solid Steel of Various Compositions. J. Mater. Res. Technol. 2020, 9, 7828–7837. [Google Scholar] [CrossRef]
- Zhou, L.; Li, J.; Wang, W.; Sohn, I. Wetting Behavior of Mold Flux Droplet on Steel Substrate With or Without Interfacial Reaction. Metall. Mater. Trans. B 2017, 48, 1943–1950. [Google Scholar] [CrossRef]
- Kromhout, J. Mould powders for high speed continuous casting of steel. Doctoral Thesis, TU Delft, Netherlands, 2011. [Google Scholar]
- Park, J.-Y.; Sohn, I. Evaluating the Heat Transfer Phenomena and the Interfacial Thermal Resistance of Mold Flux Using a Copper Disc Mold Simulator. Int. J. Heat Mass Transf. 2017, 109, 1014–1025. [Google Scholar] [CrossRef]
- Park, J. Y.; Ko, E.; Choi, J.; Sohn, I. Characteristics of Medium Carbon Steel Solidification and Mold Flux Crystallization Using the Multi-Mold Simulator. Met. Mater. Int. 2014, 20, 1103–1114. [Google Scholar] [CrossRef]
- Ko, E. Y.; Choi, J.; Park, J. Y.; Sohn, I. Simulation of Low Carbon Steel Solidification and Mold Flux Crystallization in Continuous Casting Using a Multi-Mold Simulator. Met. Mater. Int. 2014, 20, 141–151. [Google Scholar] [CrossRef]
- Liu, Y.; Wang, W.; Ma, F.; Zhang, H. Study of Solidification and Heat Transfer Behavior of Mold Flux Through Mold Flux Heat Transfer Simulator Technique: Part I. Development of the Technique. Metall. Mater. Trans. B 2015, 46, 1419–1430. [Google Scholar] [CrossRef]
- Ma, F.; Liu, Y.; Wang, W.; Zhang, H. Study of Solidification and Heat Transfer Behavior of Mold Flux Through Mold Flux Heat Transfer Simulator Technique: Part II. Effect of Mold Oscillation on Heat Transfer Behaviors. Metall. Mater. Trans. B 2015, 46, 1902–1911. [Google Scholar] [CrossRef]
- Wang, W.; Long, X.; Zhang, H.; Lyu, P. Mold Simulator Study of Effect of Mold Oscillation Frequency on Heat Transfer and Lubrication of Mold Flux. ISIJ Int. 2018, 58, 1695–1704. [Google Scholar] [CrossRef]
- Zhang, H.; Wang, W. Mold Simulator Study of Heat Transfer Phenomenon During the Initial Solidification in Continuous Casting Mold. Metall. Mater. Trans. B 2017, 48, 779–793. [Google Scholar] [CrossRef]
- Zhou, L.; Wang, W.; Xu, C.; Zhang, C. An Investigation of the Mold-Flux Performance for the Casting of Cr12MoV Steel Using a Mold Simulator Technique. Metall. Mater. Trans. B 2017, 48, 2017–2026. [Google Scholar] [CrossRef]
- Zhang, H.; Wang, W.; Ma, F.; Zhou, L. Mold Simulator Study of the Initial Solidification of Molten Steel in Continuous Casting Mold. Part I: Experiment Process and Measurement. Metall. Mater. Trans. B 2015, 46, 2361–2373. [Google Scholar] [CrossRef]
- Zhang, H.; Wang, W. Mold Simulator Study of the Initial Solidification of Molten Steel in Continuous Casting Mold: Part II. Effects of Mold Oscillation and Mold Level Fluctuation. Metall. Mater. Trans. B 2016, 47, 920–931. [Google Scholar] [CrossRef]
- Lyu, P.; Wang, W.; Zhang, H. Mold Simulator Study on the Initial Solidification of Molten Steel Near the Corner of Continuous Casting Mold. Metall. Mater. Trans. B 2017, 48, 247–259. [Google Scholar] [CrossRef]
- Kamaraj, A.; Tripathy, S.; Chalavadi, G.; Sahoo, P. P.; Misra, S. Characterization and Assessment of Mold Flux for Continuous Casting of Liquid Steel Using an Inverse Mold Simulator. Steel Res. Int. 2022, 93, 1–13. [Google Scholar] [CrossRef]
- Nazim, M.; Buchely, M.; Emdadi, A.; Huang, J.; Saha, R. K.; O’Malley, R. A Lab-Scale Mold Simulator Employing an Optical-Fiber-Instrumented Mold to Characterize Initial Steel Shell Growth Phenomena. In Proceedings of the AISTech, Columbus, USA; 2024; pp. 947–958. [Google Scholar] [CrossRef]
- O’Malley, R. J.; Neal, J. An Examination of Mold Flux Film Structures and Mold Gap Behavior Using Mold Thermal Monitoring and Petrographic Analysis at Armco’s Mansfield Operations. In Proceedings of the METEC Congr., Düsseldorf, Germany; 1999; pp. 1–8. [Google Scholar]
- Novák, D.; Řeháčková, L.; Novák, V.; Matýsek, D.; Peikertová, P. Wetting of Graphite and Platinum Substrate by Oxide System with Graded B2O3 Content. Crystals 2023, 13, 1618. [Google Scholar] [CrossRef]
- Kiser, K.; Athavale, V. A.; Bartlett, L.; Buchely, M.; O’Malley, R. Growth Kinetics and Development of the Solid–Liquid Interface in Low-Carbon and High-Alloy Steel Castings Enabled by Confocal Microscopy. Int. J. Metal-casting 2024. [Google Scholar] [CrossRef]
- Peterson, E. Mold Flux Crystallization and Mold Thermal Behavior. Master’s Thesis, Missouri University of Science and Technology, Rolla, Missouri, USA, 2017. [Google Scholar]
- Kölbl, N.; Marschall, I.; Harmuth, H. Single Hot Thermocouple Technique for the Characterization of the Crystallization Behavior of Transparent or Translucent Liquids. J. Mater. Sci. 2011, 46, 6248–6254. [Google Scholar] [CrossRef]
- Mu, W.; Hedström, P.; Shibata, H.; Jönsson, P. G.; Nakajima, K. High-Temperature Confocal Laser Scanning Microscopy Studies of Ferrite Formation in Inclusion-Engineered Steels: A Review. JOM 2018, 70, 2283–2295. [Google Scholar] [CrossRef]
Figure 1.
The micrograph of the mold flux film cross-section obtained through scanning electron microscopy (SEM). Courtesy: US Steel Research and Technology Center, PA, USA.
Figure 1.
The micrograph of the mold flux film cross-section obtained through scanning electron microscopy (SEM). Courtesy: US Steel Research and Technology Center, PA, USA.
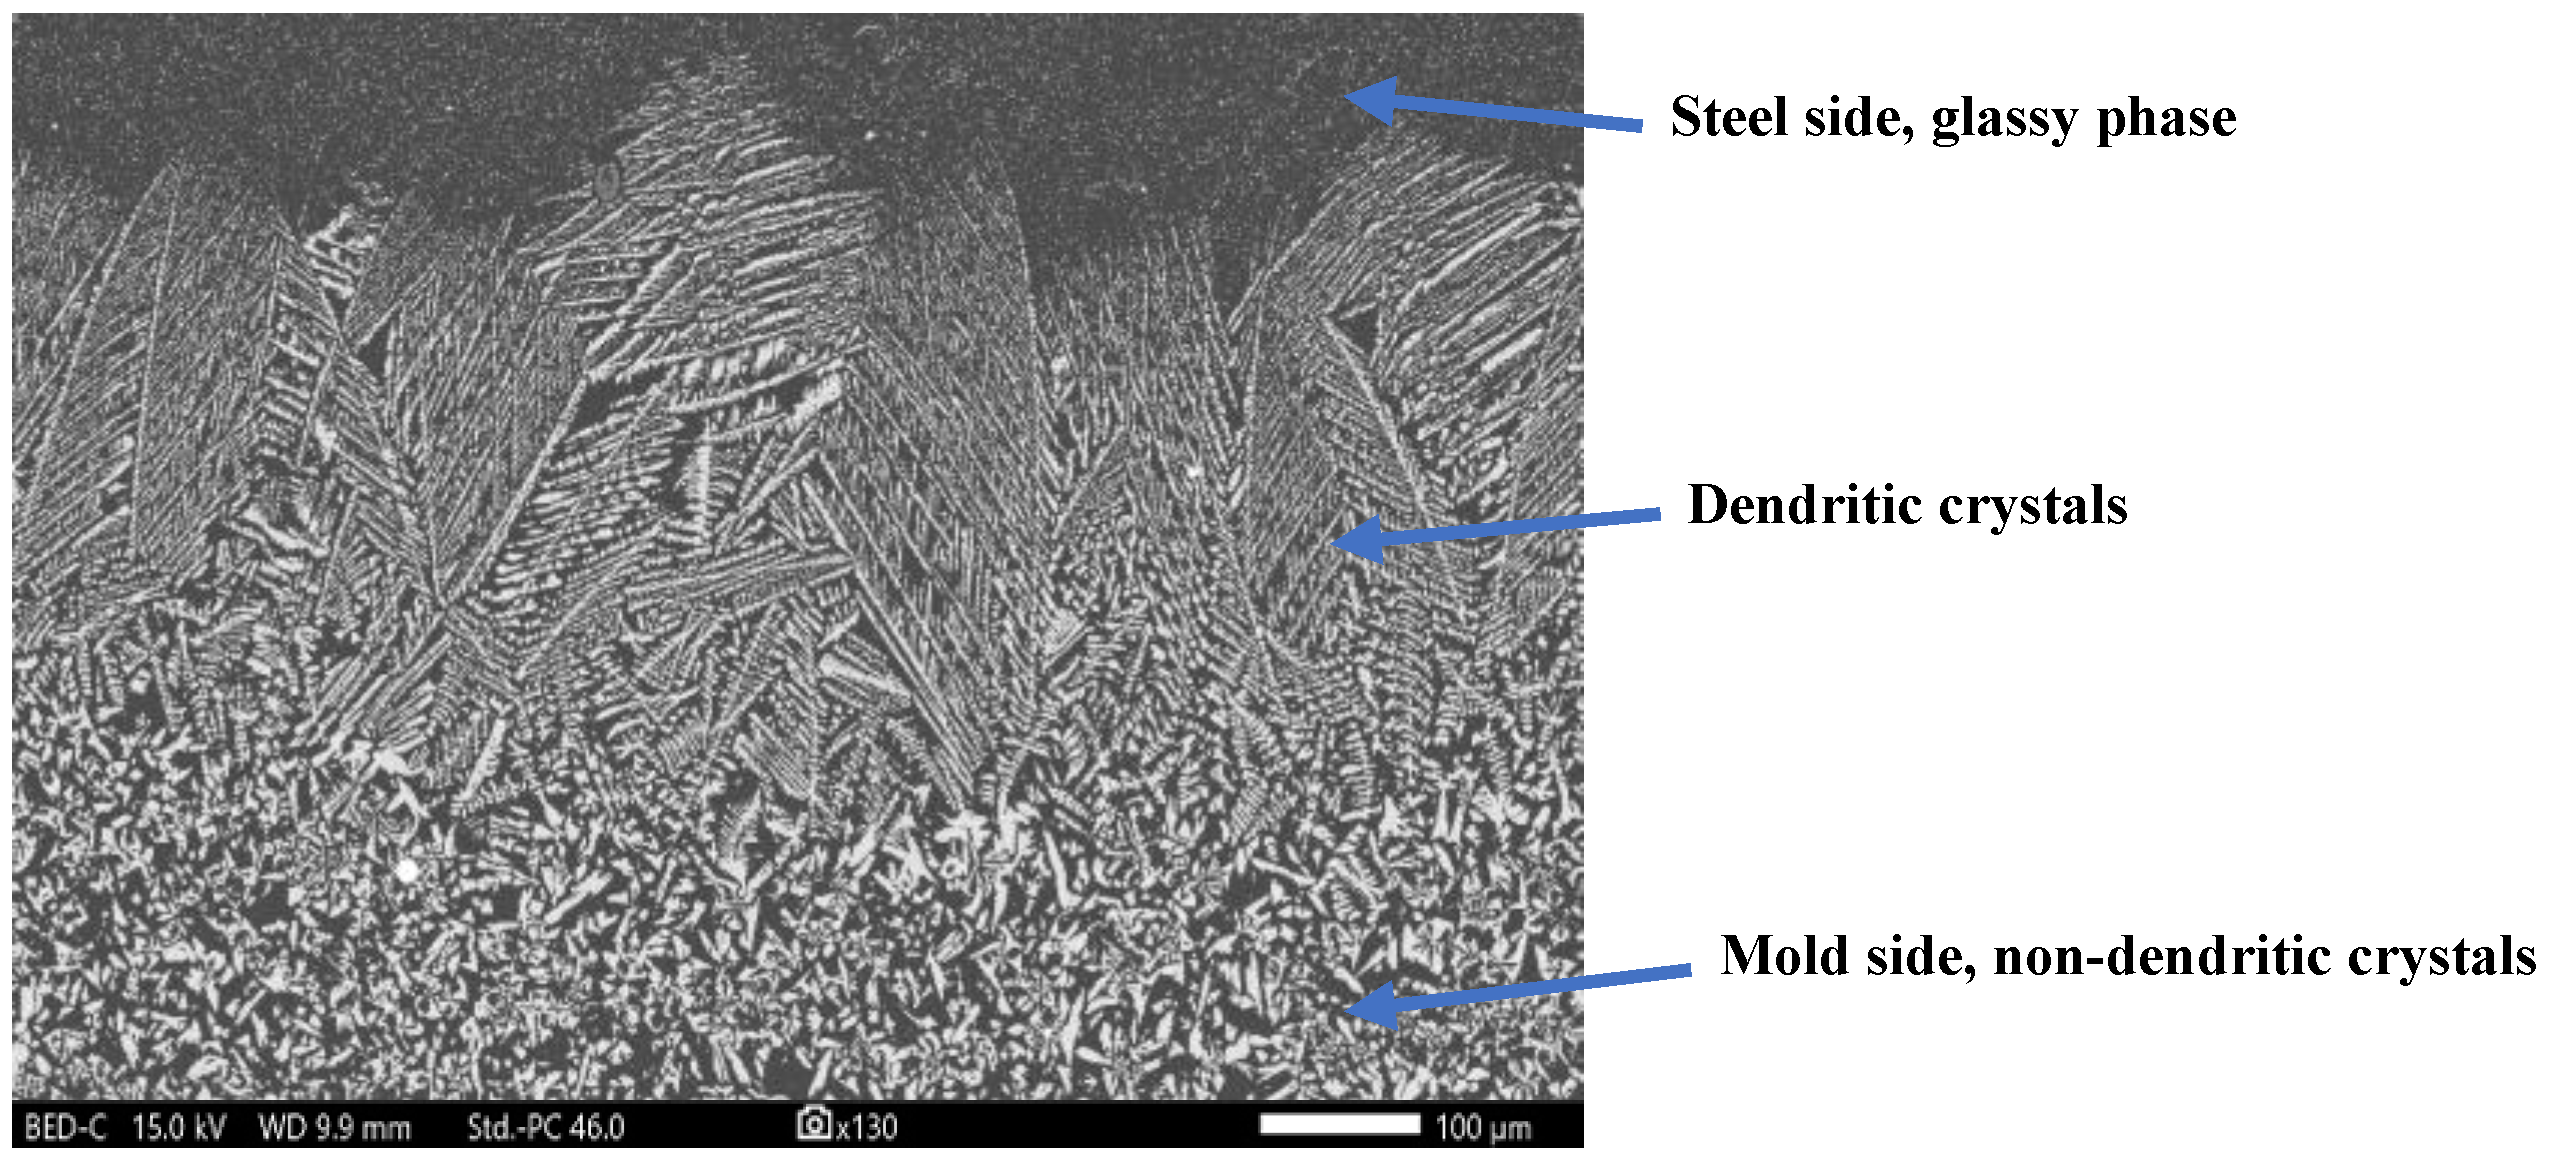
Figure 2.
Schematics of (a) wetting and (b) non-wetting conditions of mold flux in contact with mold wall.
Figure 2.
Schematics of (a) wetting and (b) non-wetting conditions of mold flux in contact with mold wall.
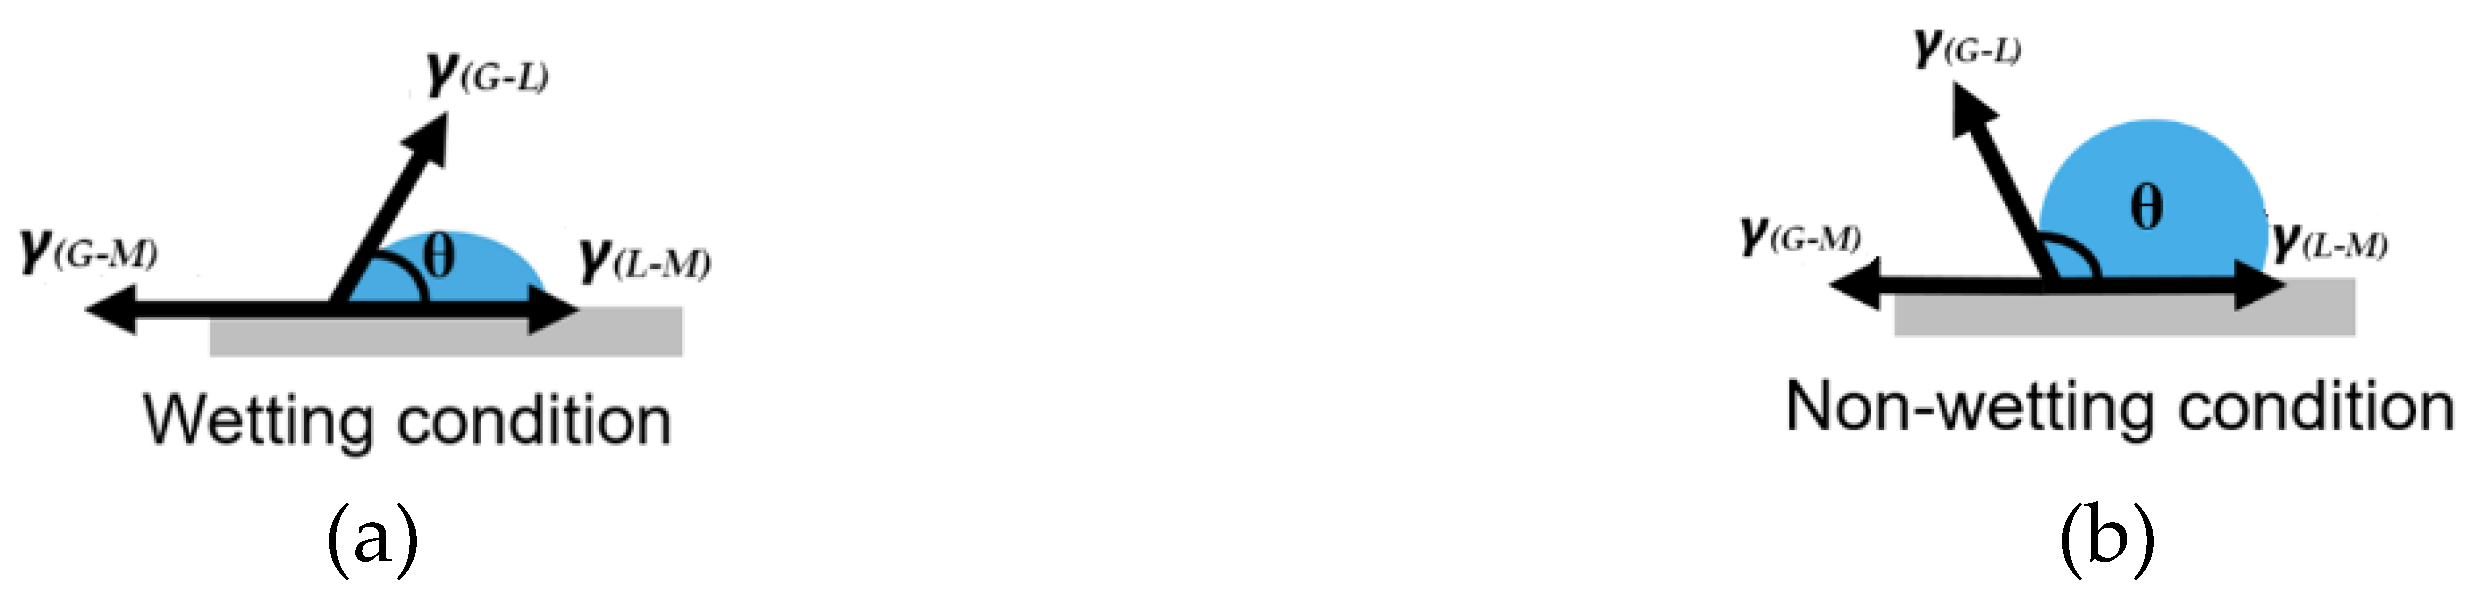
Figure 3.
Schematics of the section slice of the flux-crucible appearance right after the DSC test in: (a) graphite crucible; and (b) platinum crucible.
Figure 3.
Schematics of the section slice of the flux-crucible appearance right after the DSC test in: (a) graphite crucible; and (b) platinum crucible.
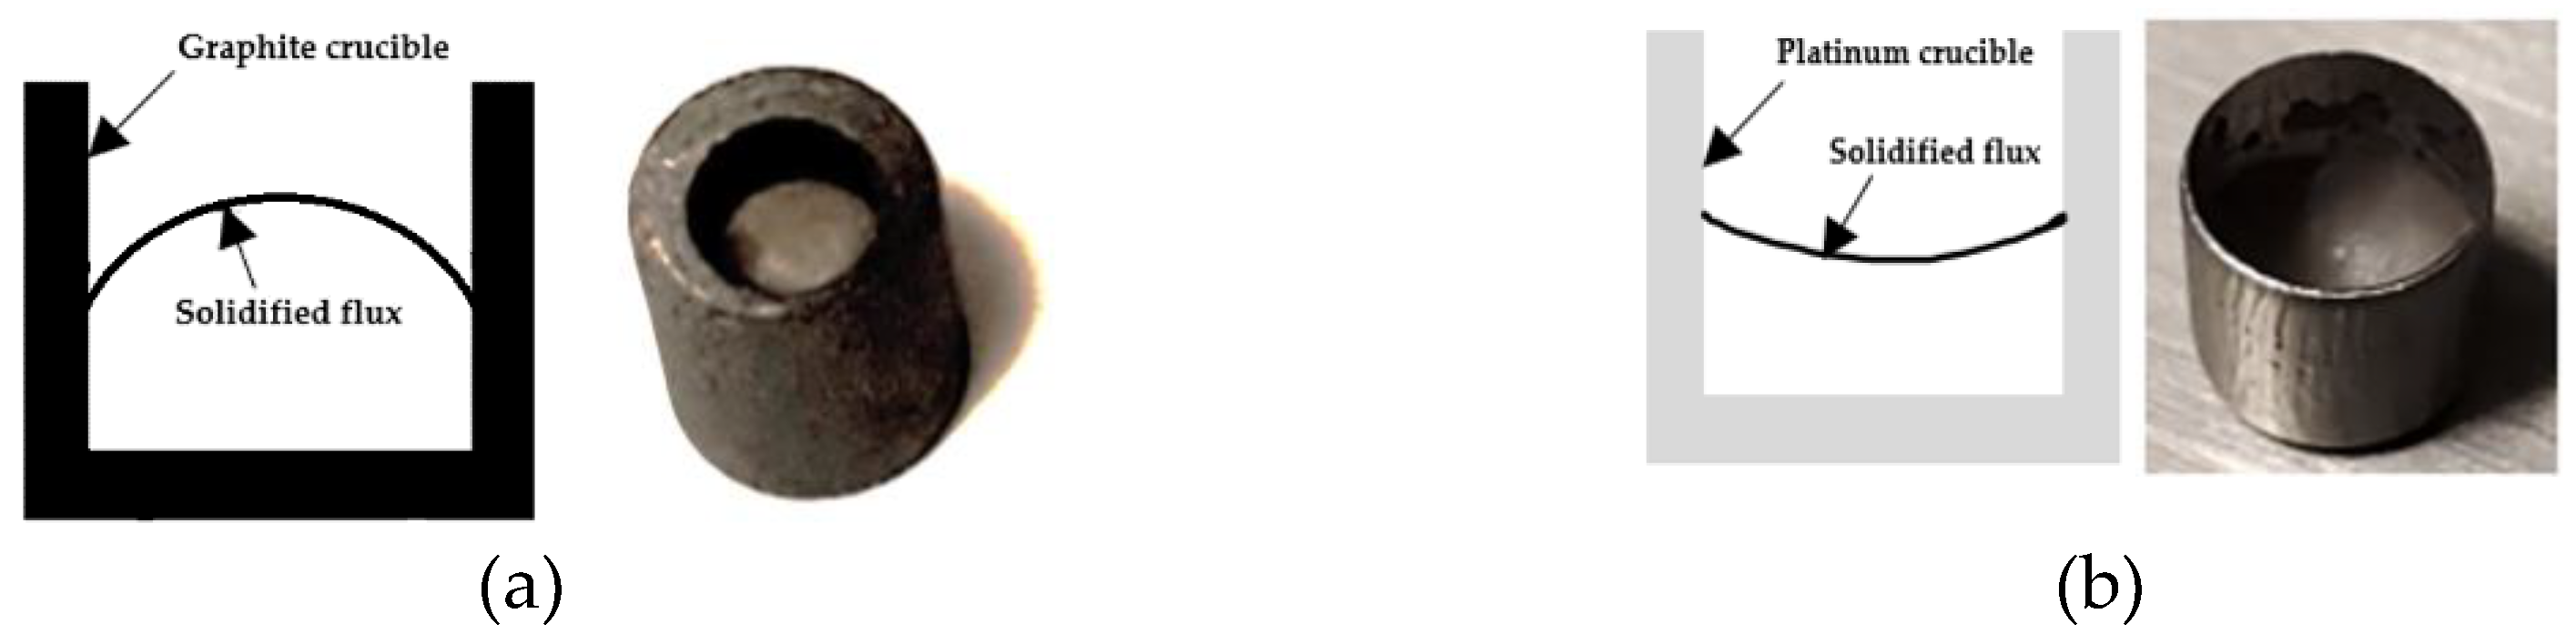
Figure 4.
DSC curves from non-isothermal tests of mold flux samples at various cooling rates, were conducted in (a) Platinum crucibles; and (b) Graphite crucibles. The legends indicate 5, 10, 15, 20, 25, and 30°C/min cooling rates. Arrows mark the onset of primary crystallizations for each cooling rate, with arrow colors corresponding to the DSC curves. In the images above, the exothermic heat flow is directed downward.
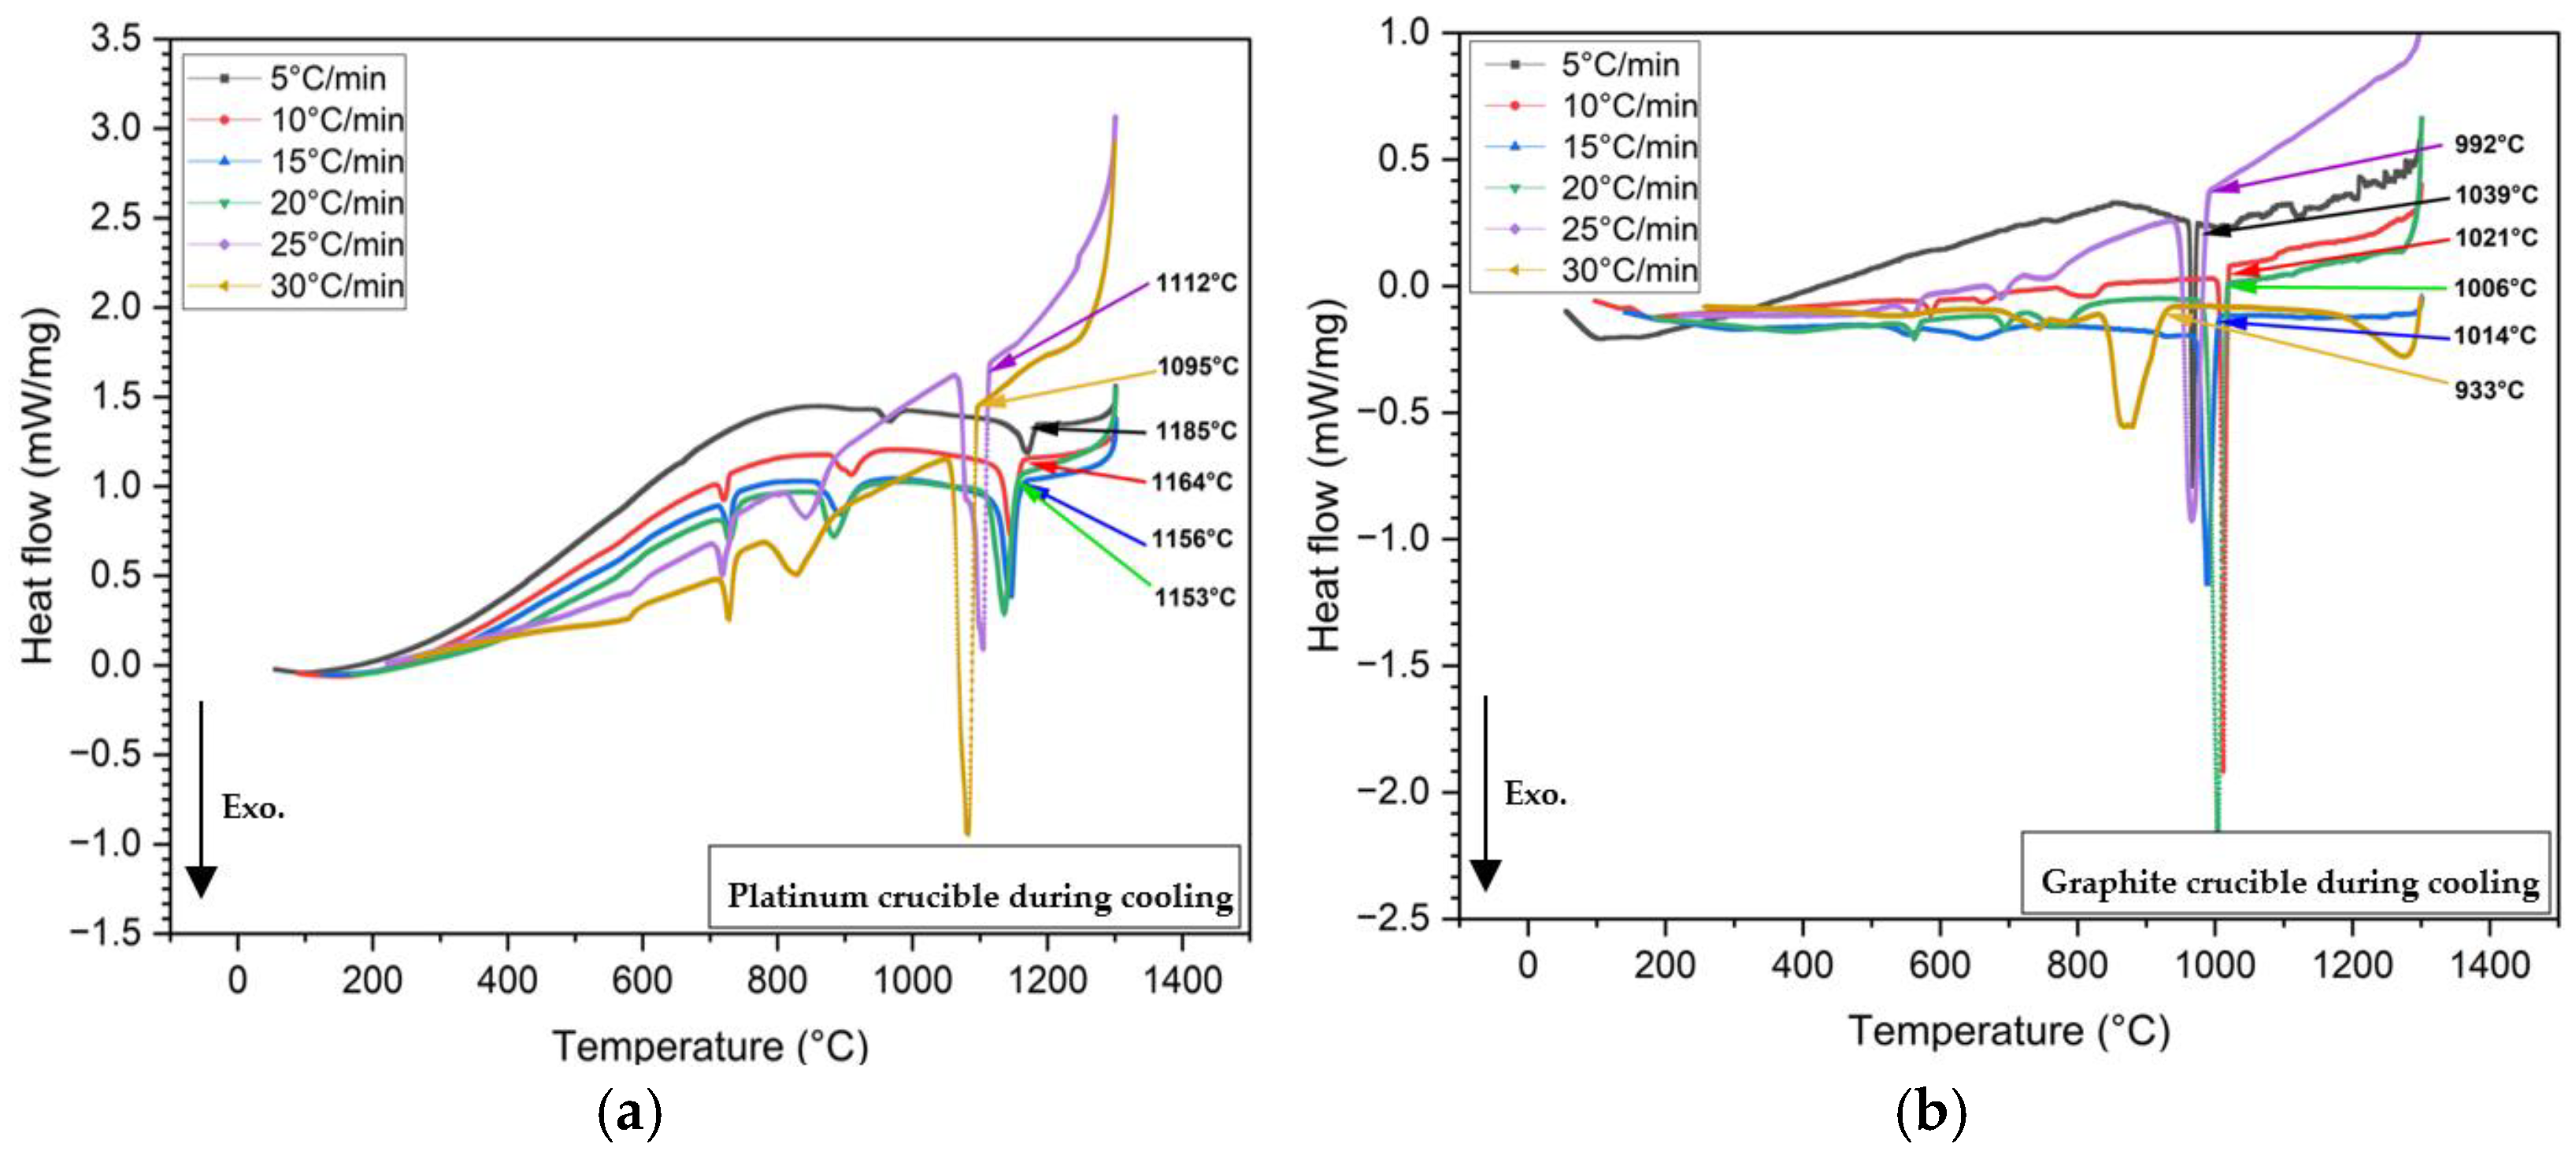
Figure 5.
(a) The CCT diagram of the mold flux, shows a standard half-circle transformation curve. Red diamonds with the green curve and black stars with the blue curve represent primary crystallization temperatures from platinum and graphite crucible tests, respectively. The legend indicates the cooling rates; (b) The difference in the onset of primary crystallization temperatures of the mold flux at different cooling rates in platinum and graphite crucibles.
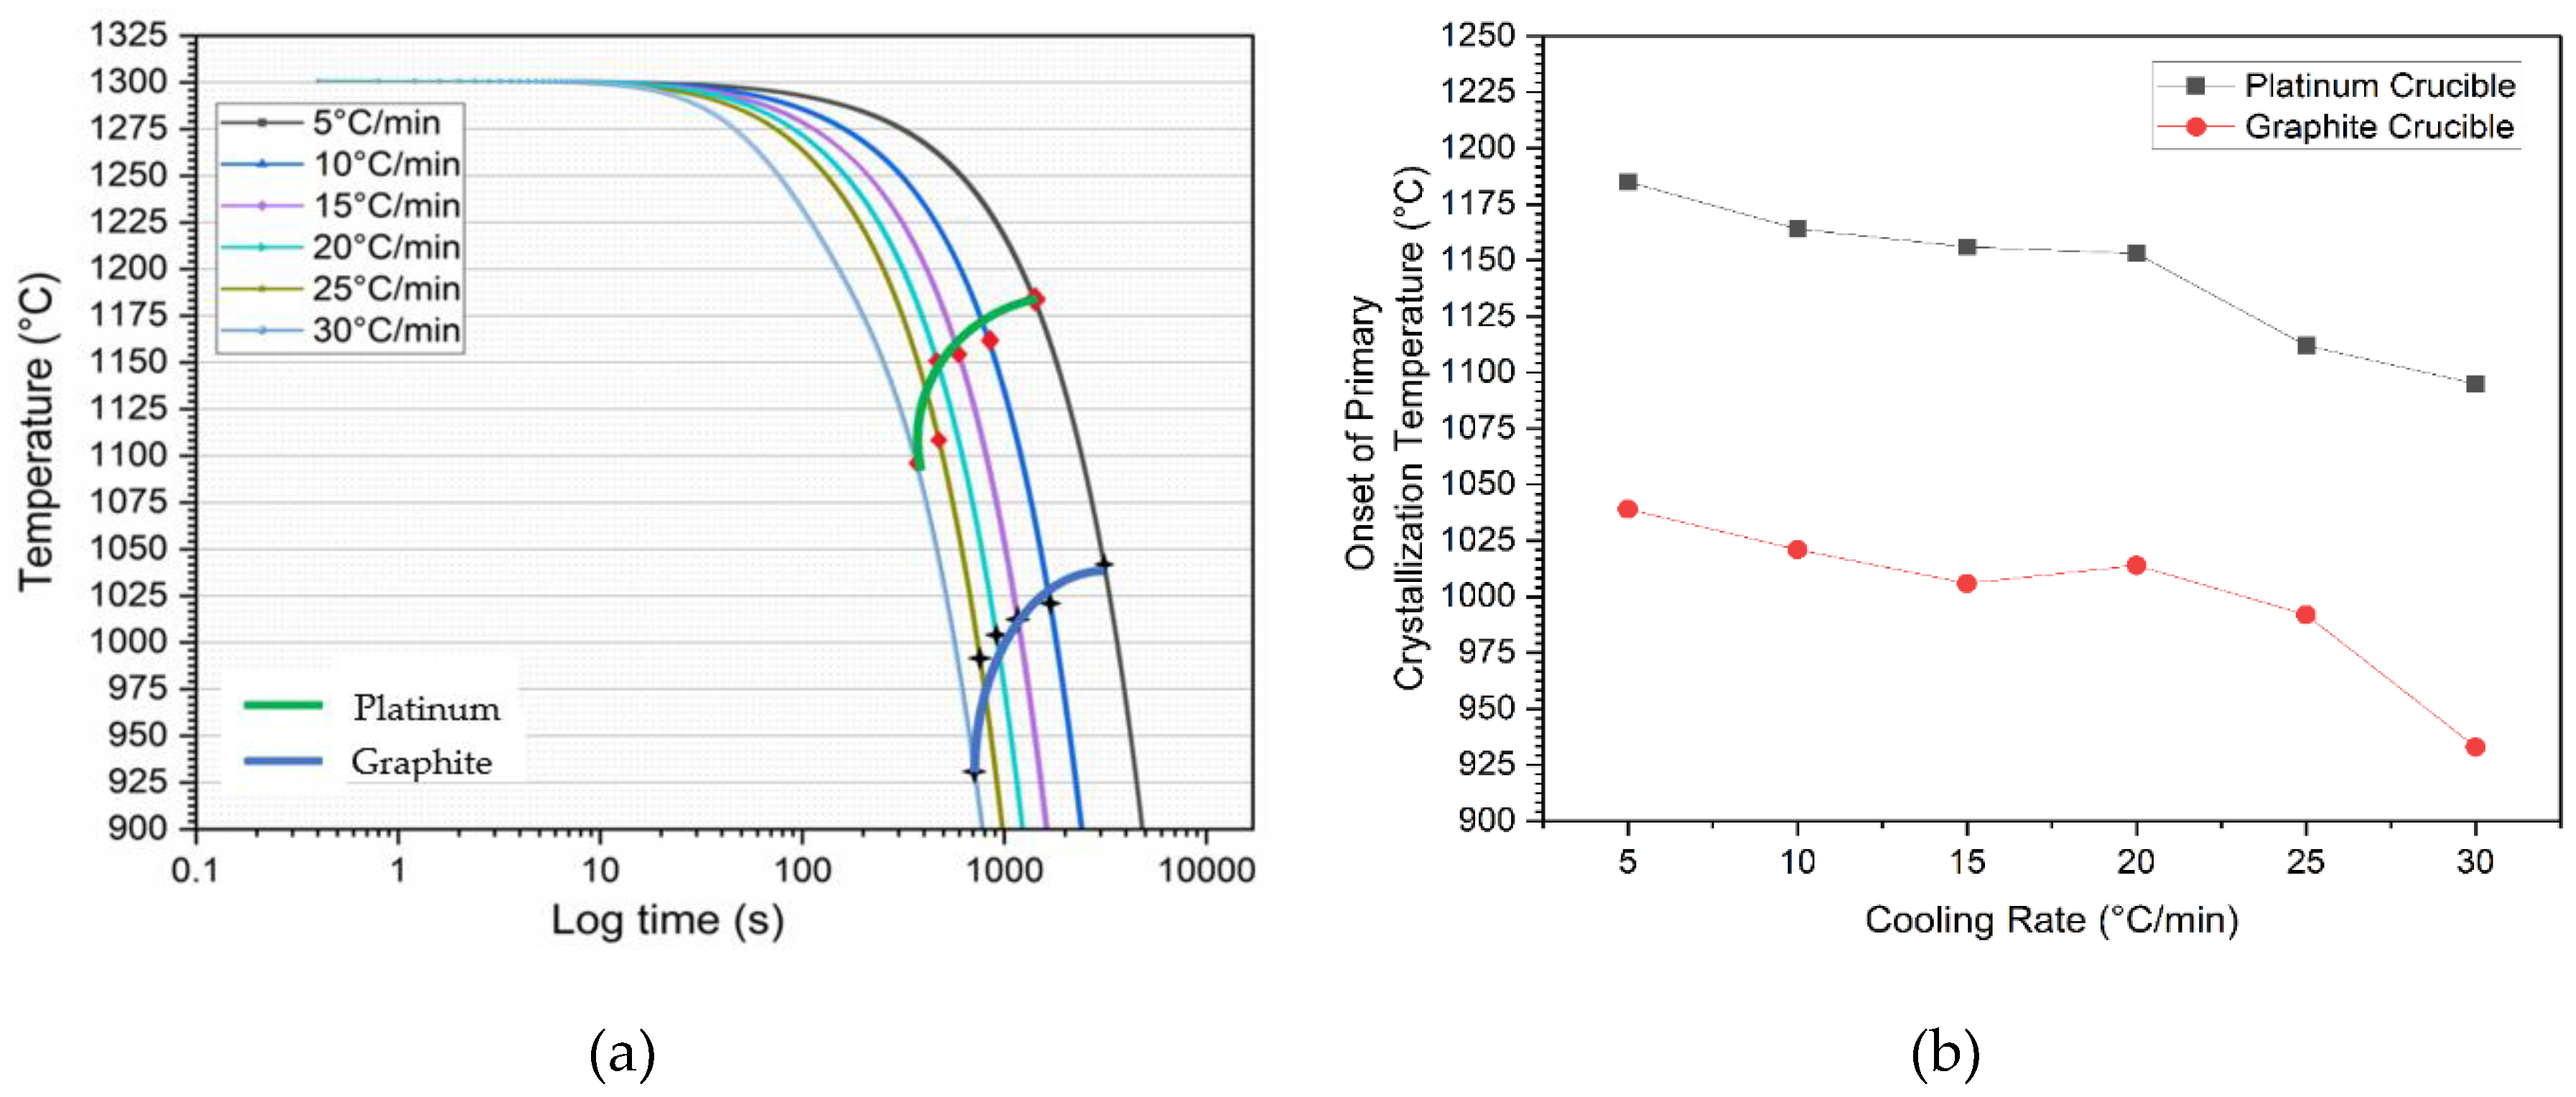
Figure 6.
DSC heat flow curves from non-isothermal tests of mold flux samples at 20°C/min heating rate, were conducted in platinum and graphite crucibles. Arrows mark the onset of mold flux melting peaks during heating, with arrow colors corresponding to the DSC curves. In the images above, the exothermic heat flow is directed upward.
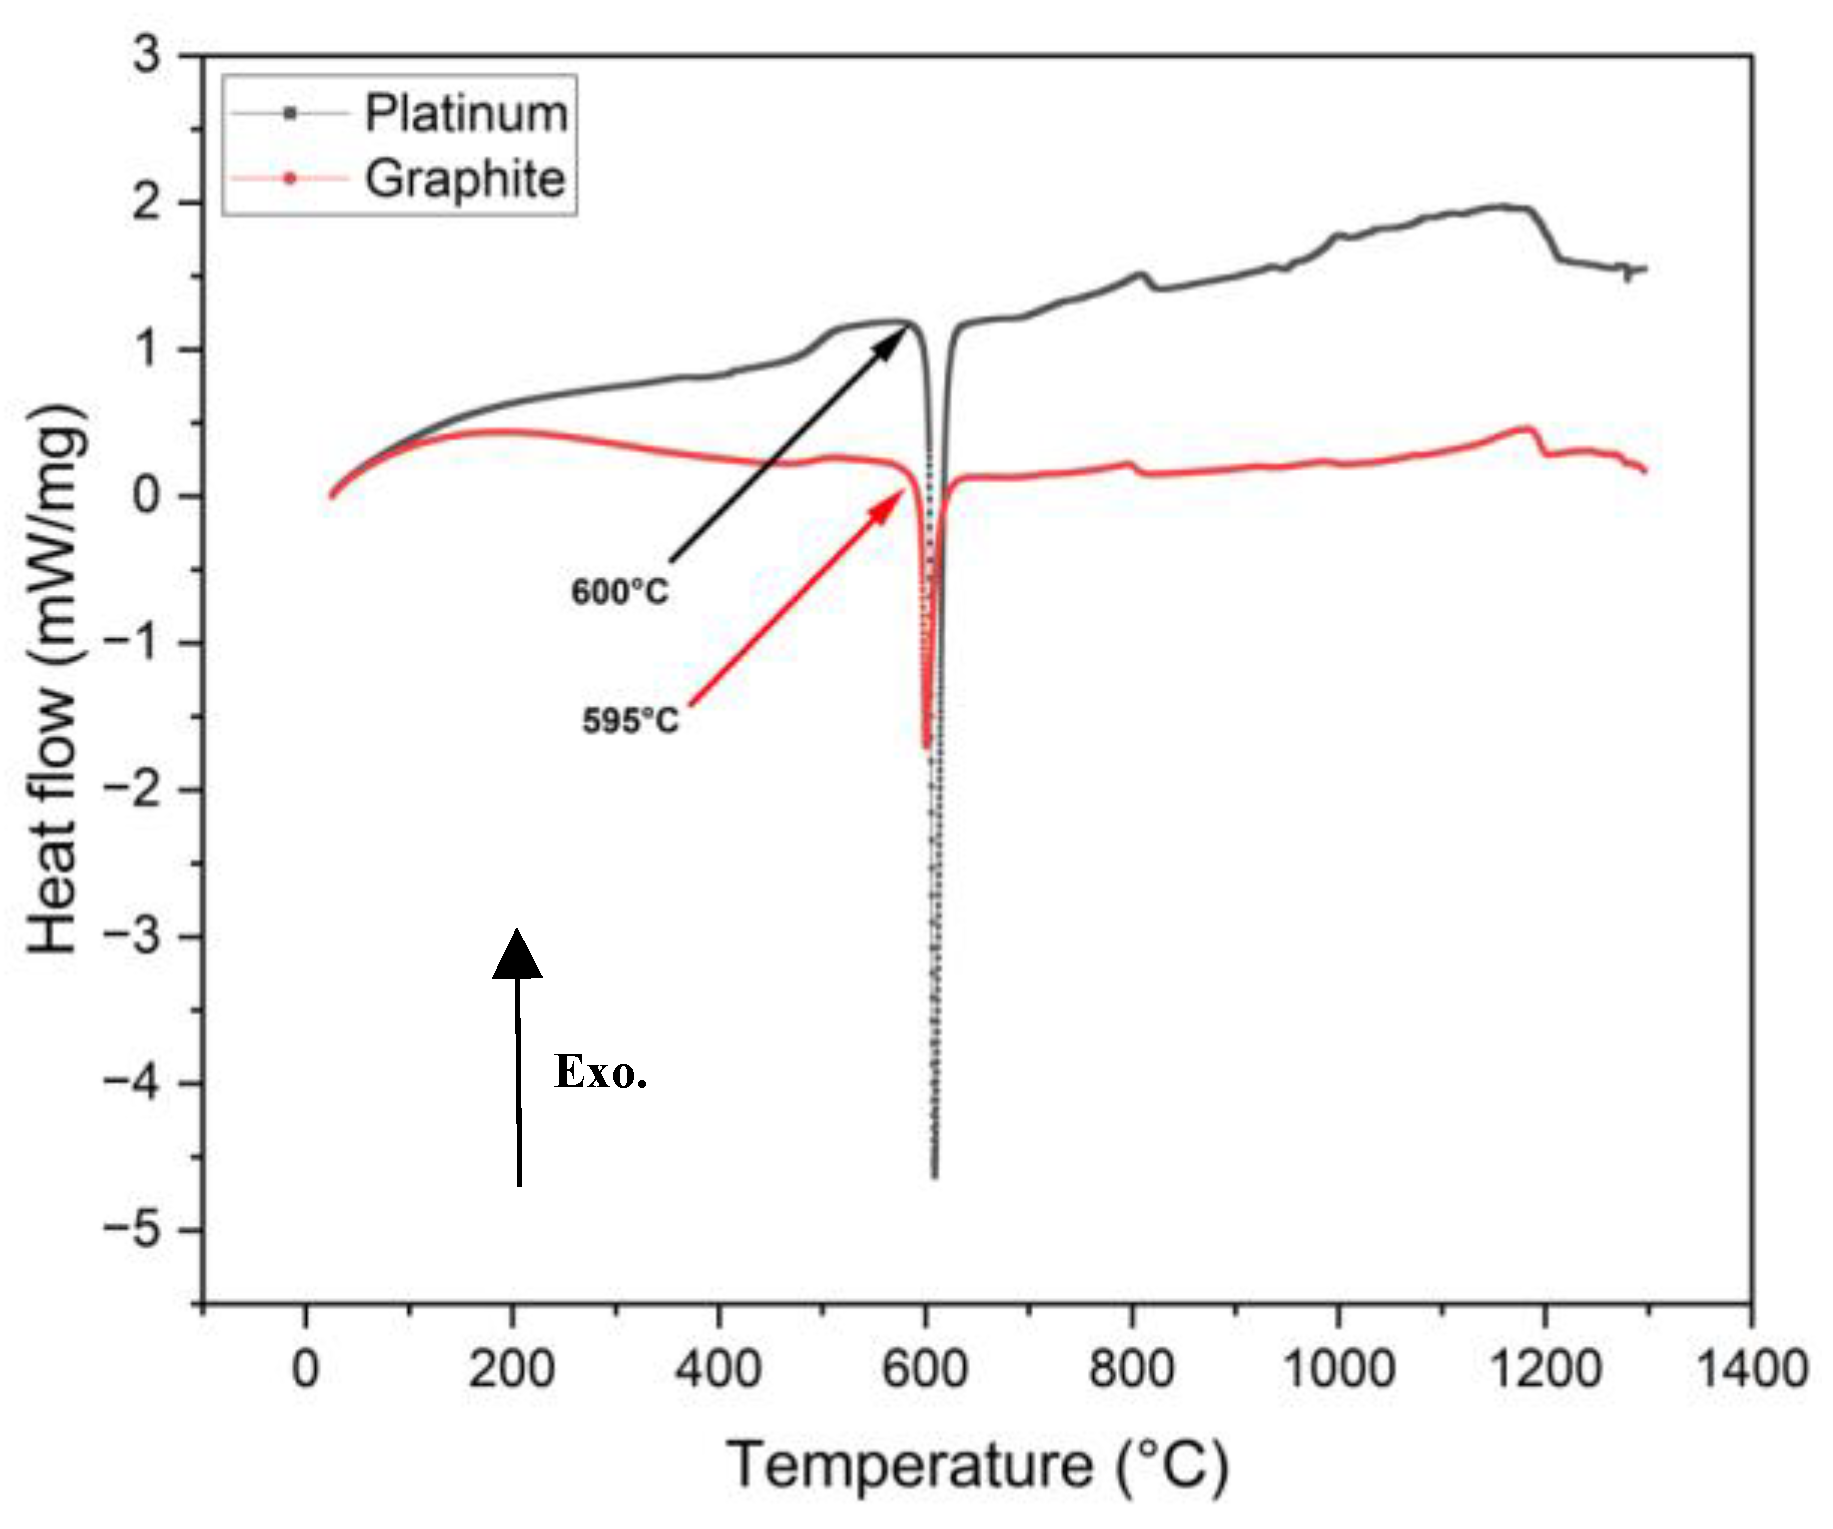
Figure 7.
The crystallization process of the mold flux sample in the graphite crucible was observed at a cooling rate of 20°C/min. The images were focused on the center of the sample surface, where the bright spot was located, (a) growth of the primary crystalline phase as it moved diagonally across the liquid flux; (b) instantaneous time of progressed undercooling, which led to crystal growth and the development of secondary dendritic arms perpendicular to the surface.
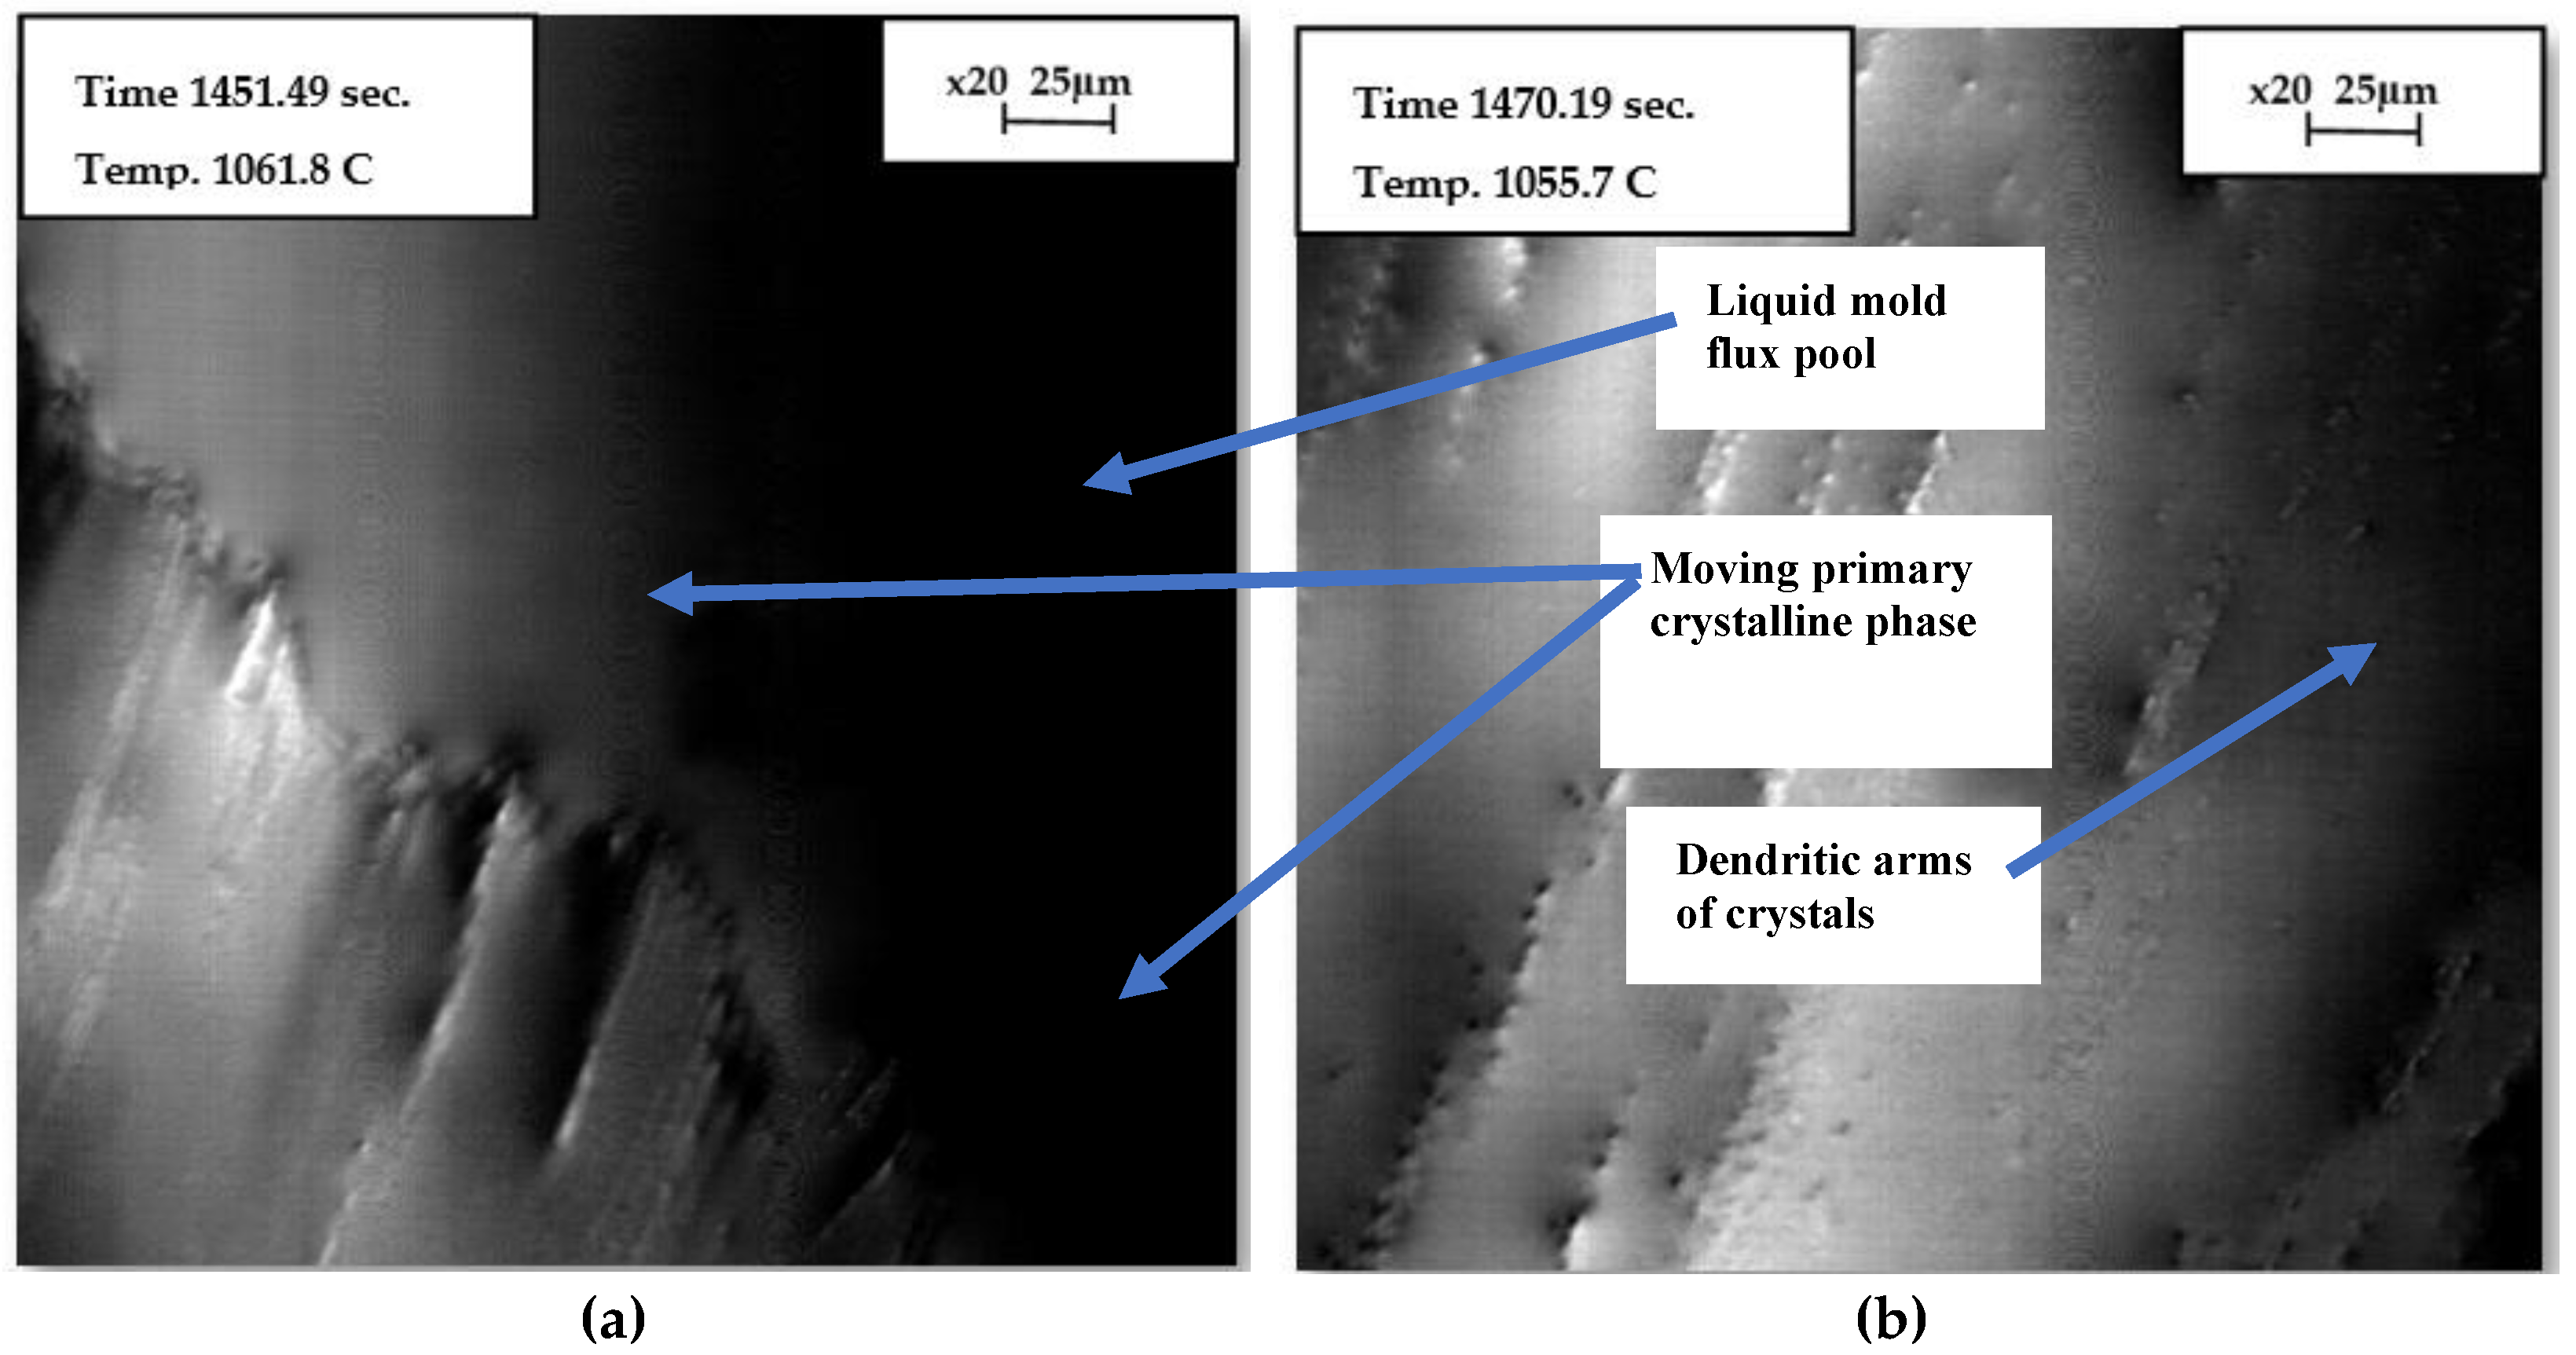
Figure 8.
The Backscattered Electron (BSE) SEM image of the polished and coated mold flux sample is shown in the top-left corner, along with images generated from elemental maps using SEM-EDS. The black region at the top of the images represents the epoxy area.
Figure 8.
The Backscattered Electron (BSE) SEM image of the polished and coated mold flux sample is shown in the top-left corner, along with images generated from elemental maps using SEM-EDS. The black region at the top of the images represents the epoxy area.
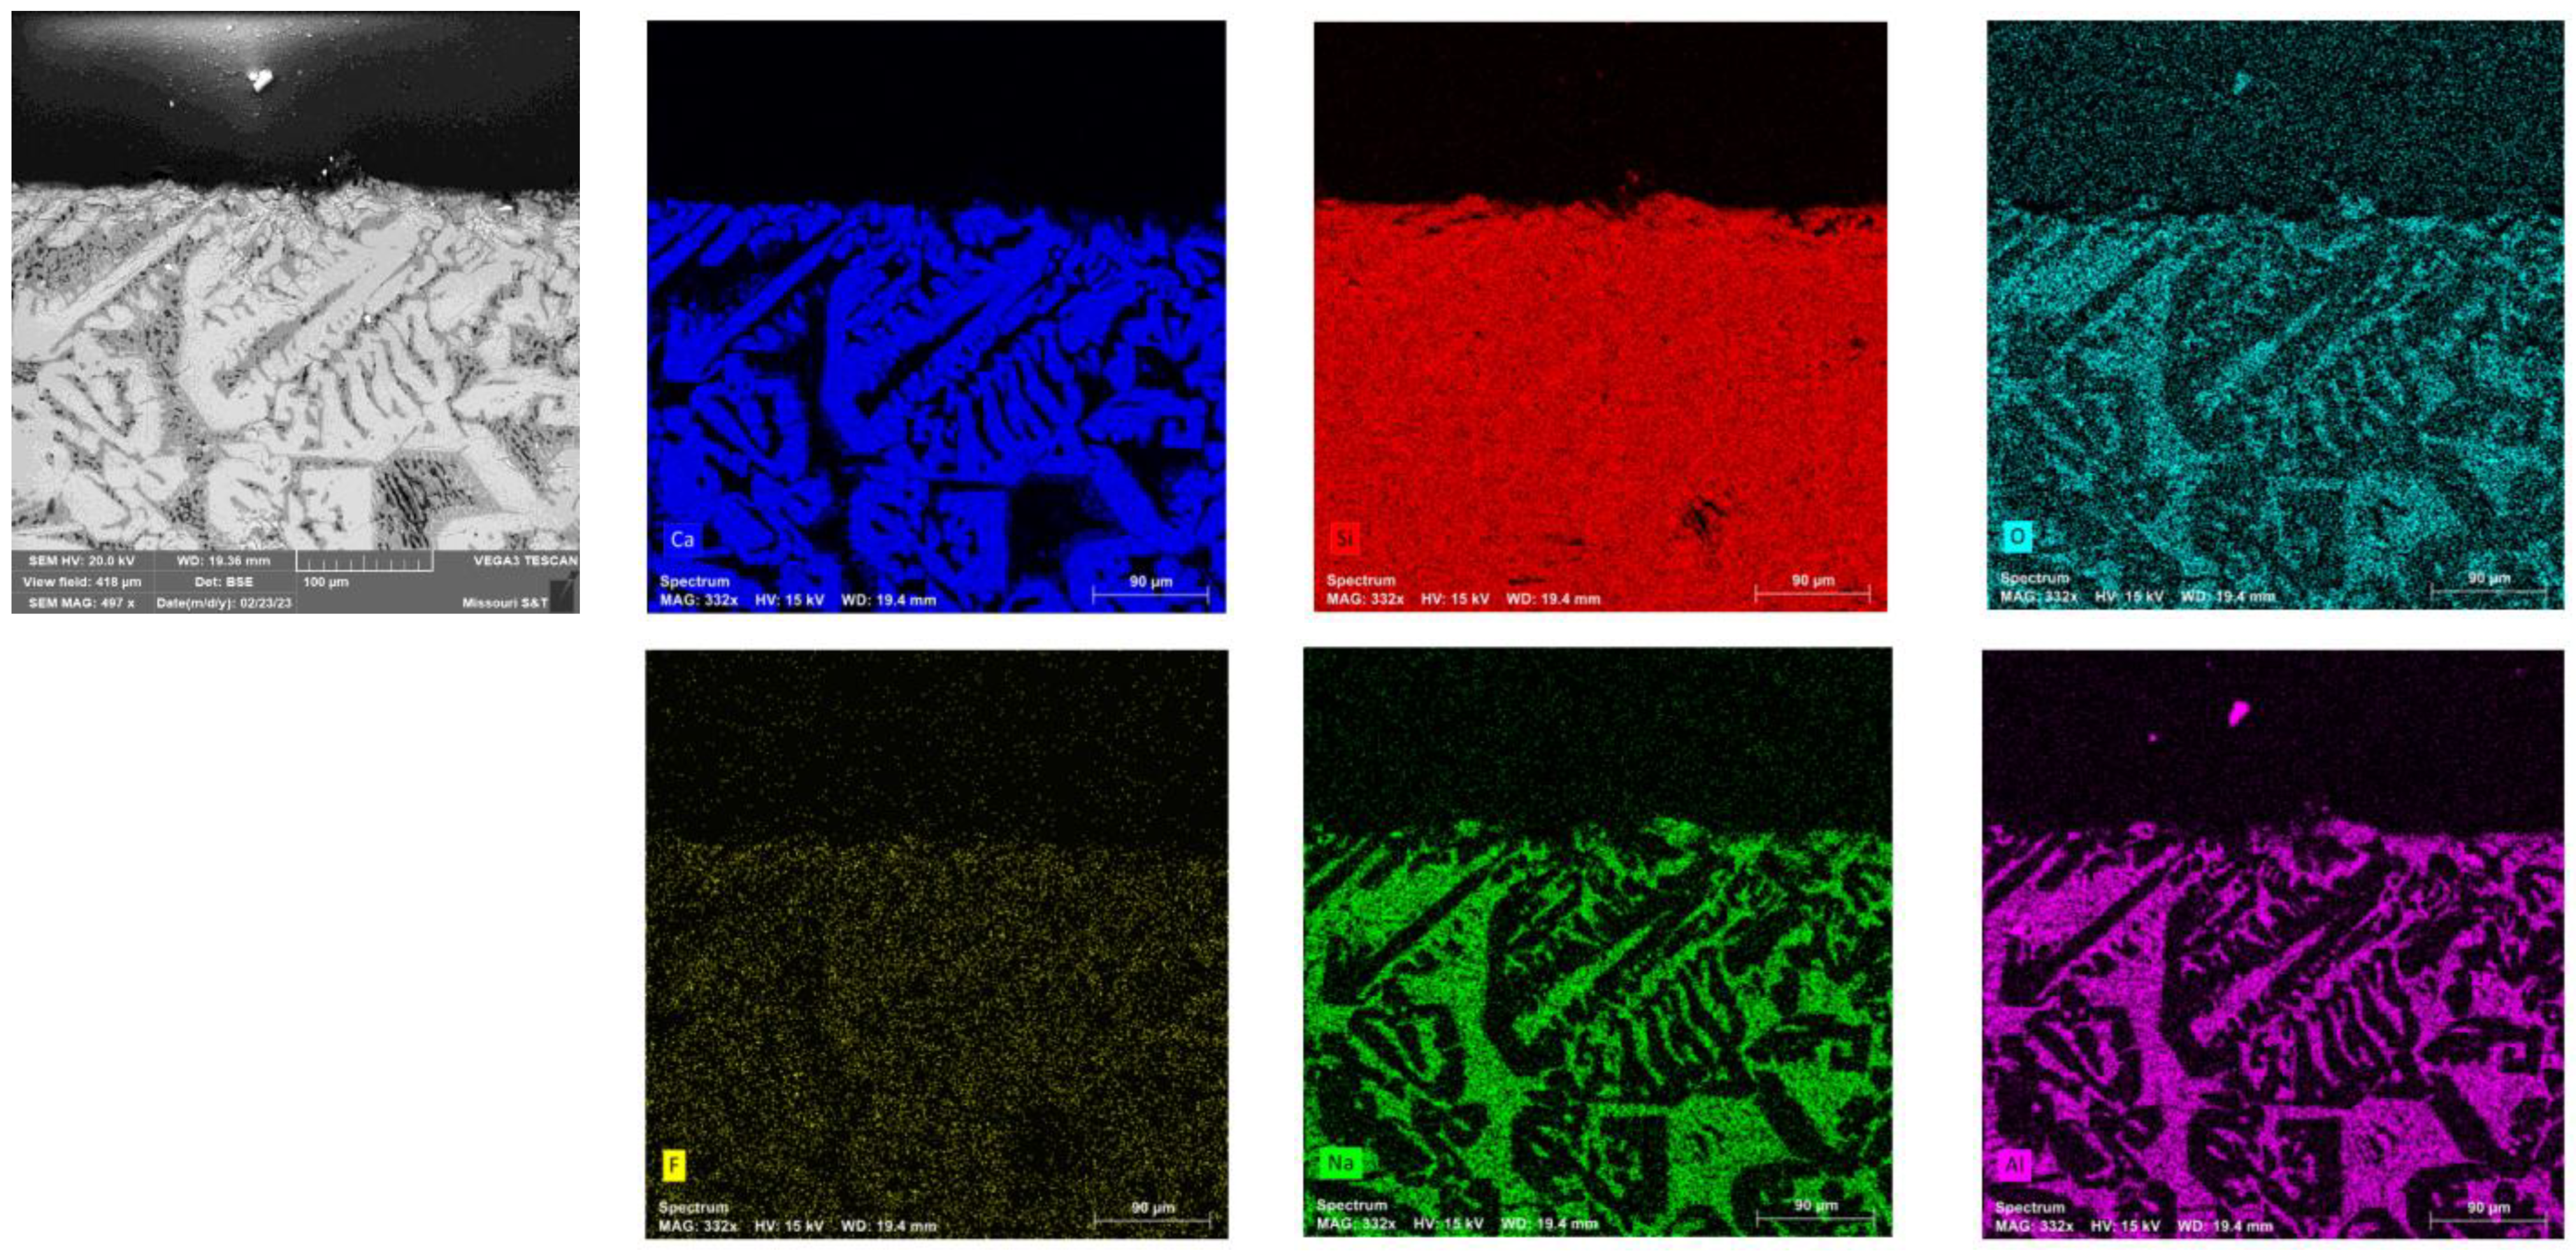
Figure 9.
The XRD result of the mold flux sample shows cuspidine as the primary crystal phase.
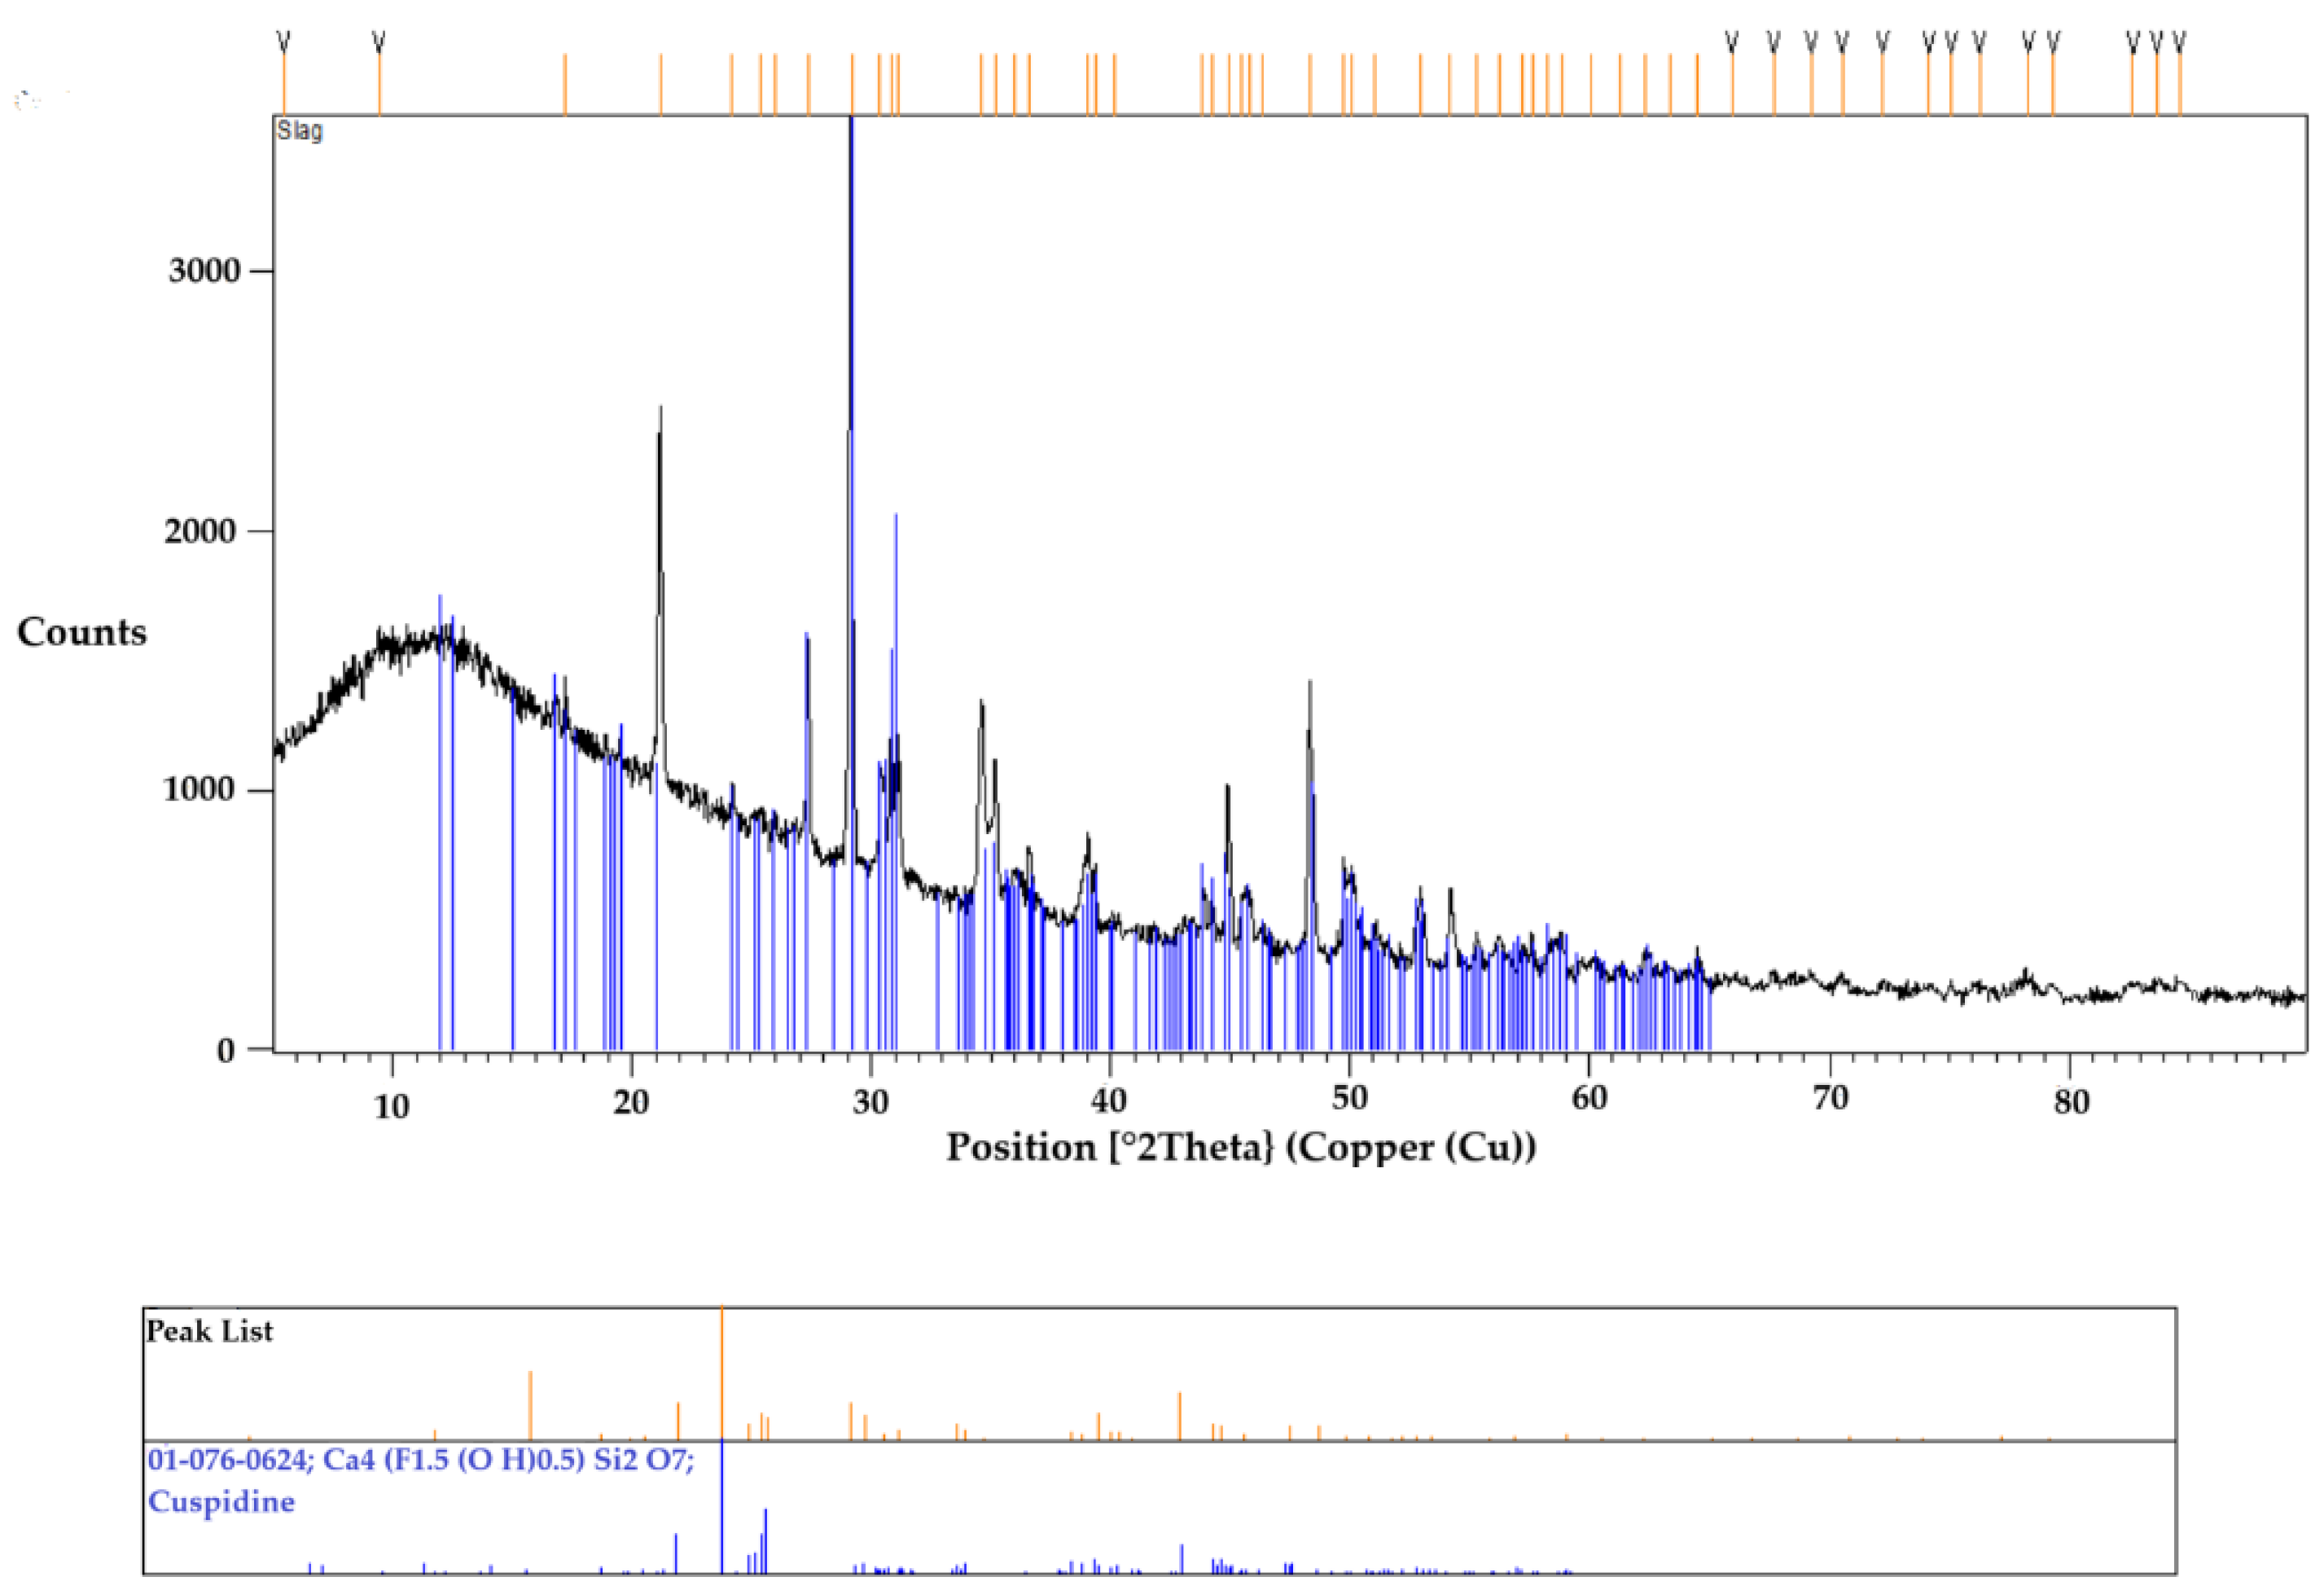
Figure 10.
DSC curves of gold tested in graphite crucible during (a) heating; and (b) cooling at a 20°C/min heating/cooling rate. Arrows indicate the onset of solidification or phase transformation, corresponding to the temperature. In the images above, the exothermic heat flow is directed downward.
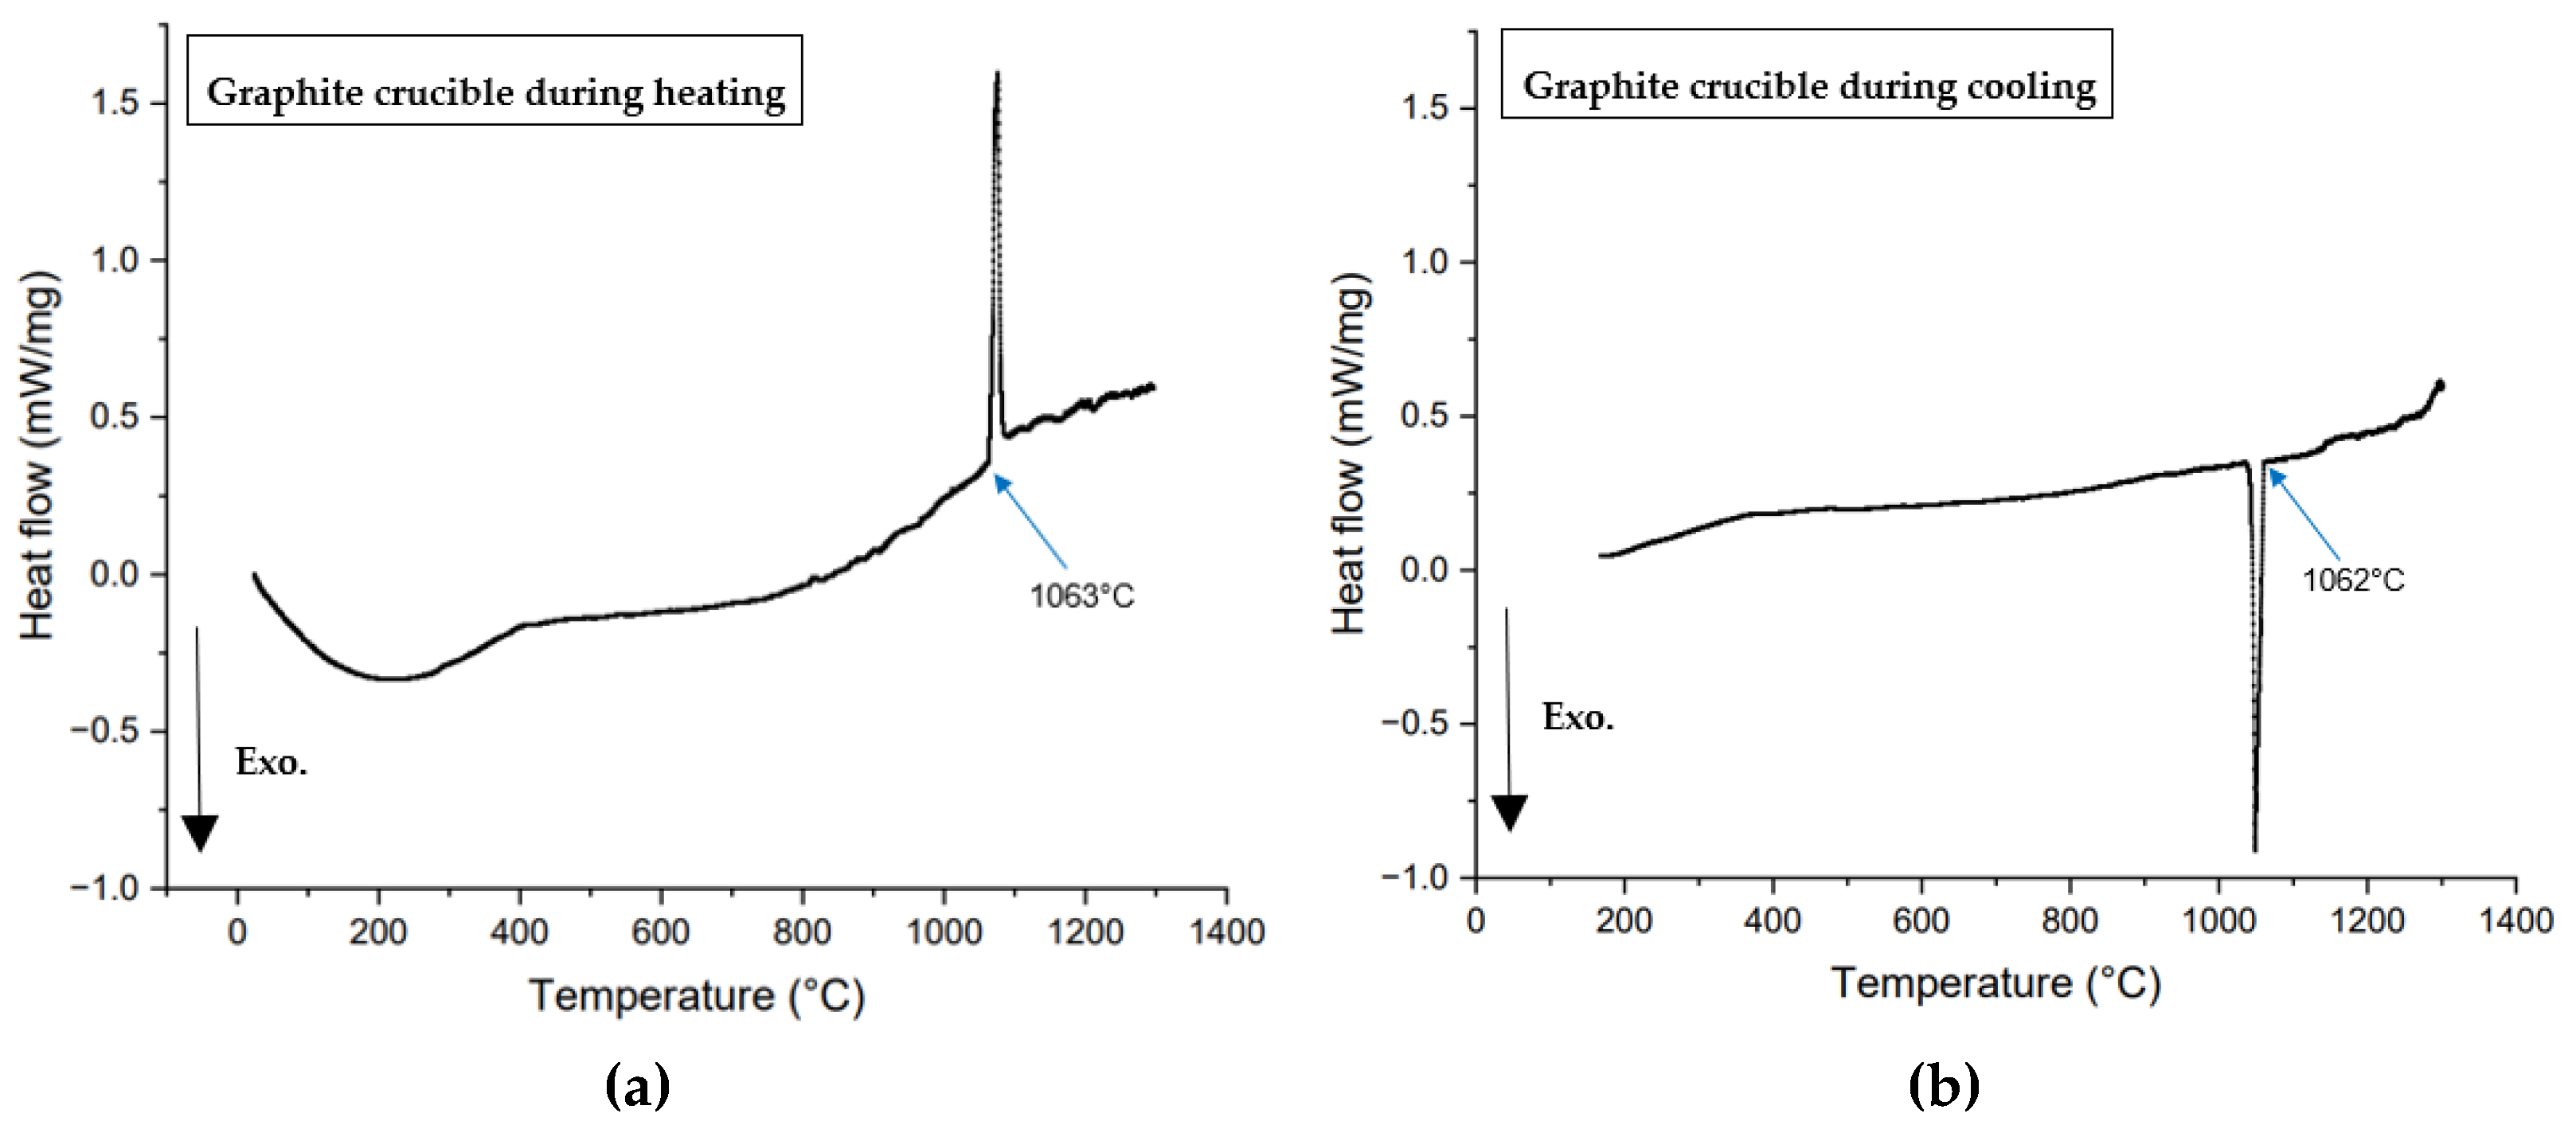
Figure 11.
DSC curves of synthetic slags tested in (a) a graphite crucible; and (b) a platinum crucible at a cooling rate of 20°C/min Arrows indicate the onset of solidification or phase transformation corresponding to the temperature. In the above pictures, the direction of exothermic heat flow is downward.
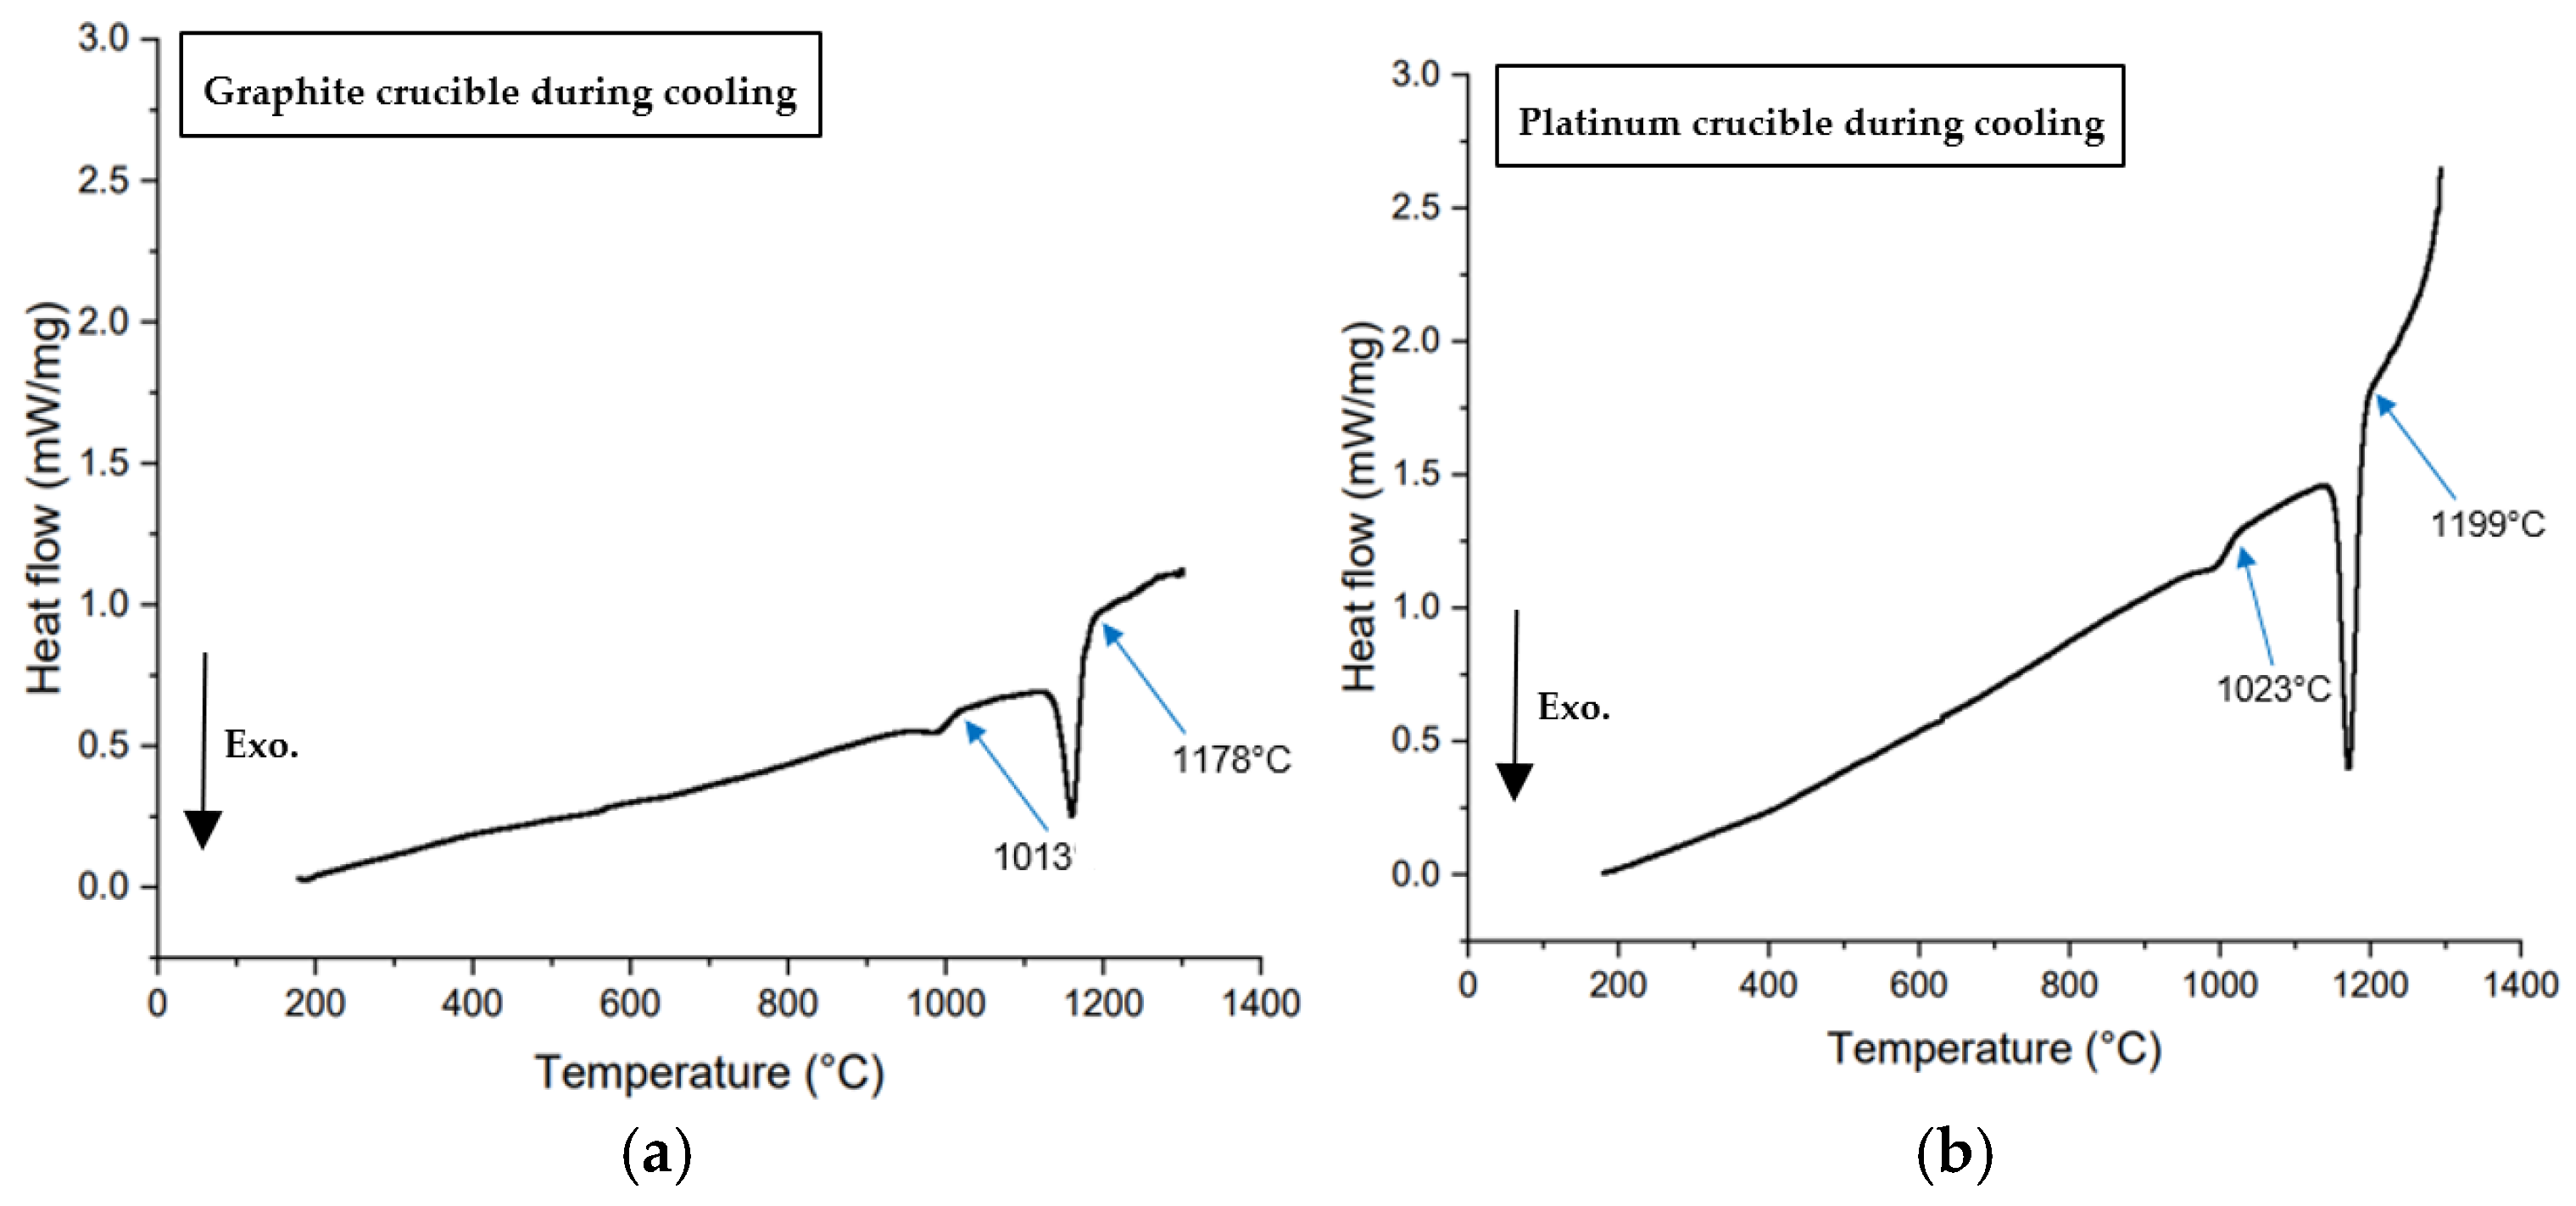
Figure 12.
DSC curves of the standard material Li2SO4 tested under the following conditions: (a) in a graphite crucible at a heating rate of 20°C/min, (b) in a platinum crucible at a heating rate of 20°C/min, (c) in a graphite crucible at a cooling rate of 20°C/min, and (d) in a platinum crucible at a cooling rate of 20°C/min. Arrows mark the onset of solidification or phase transformation at the corresponding temperatures. In the images above, exothermic heat flow is directed upward.
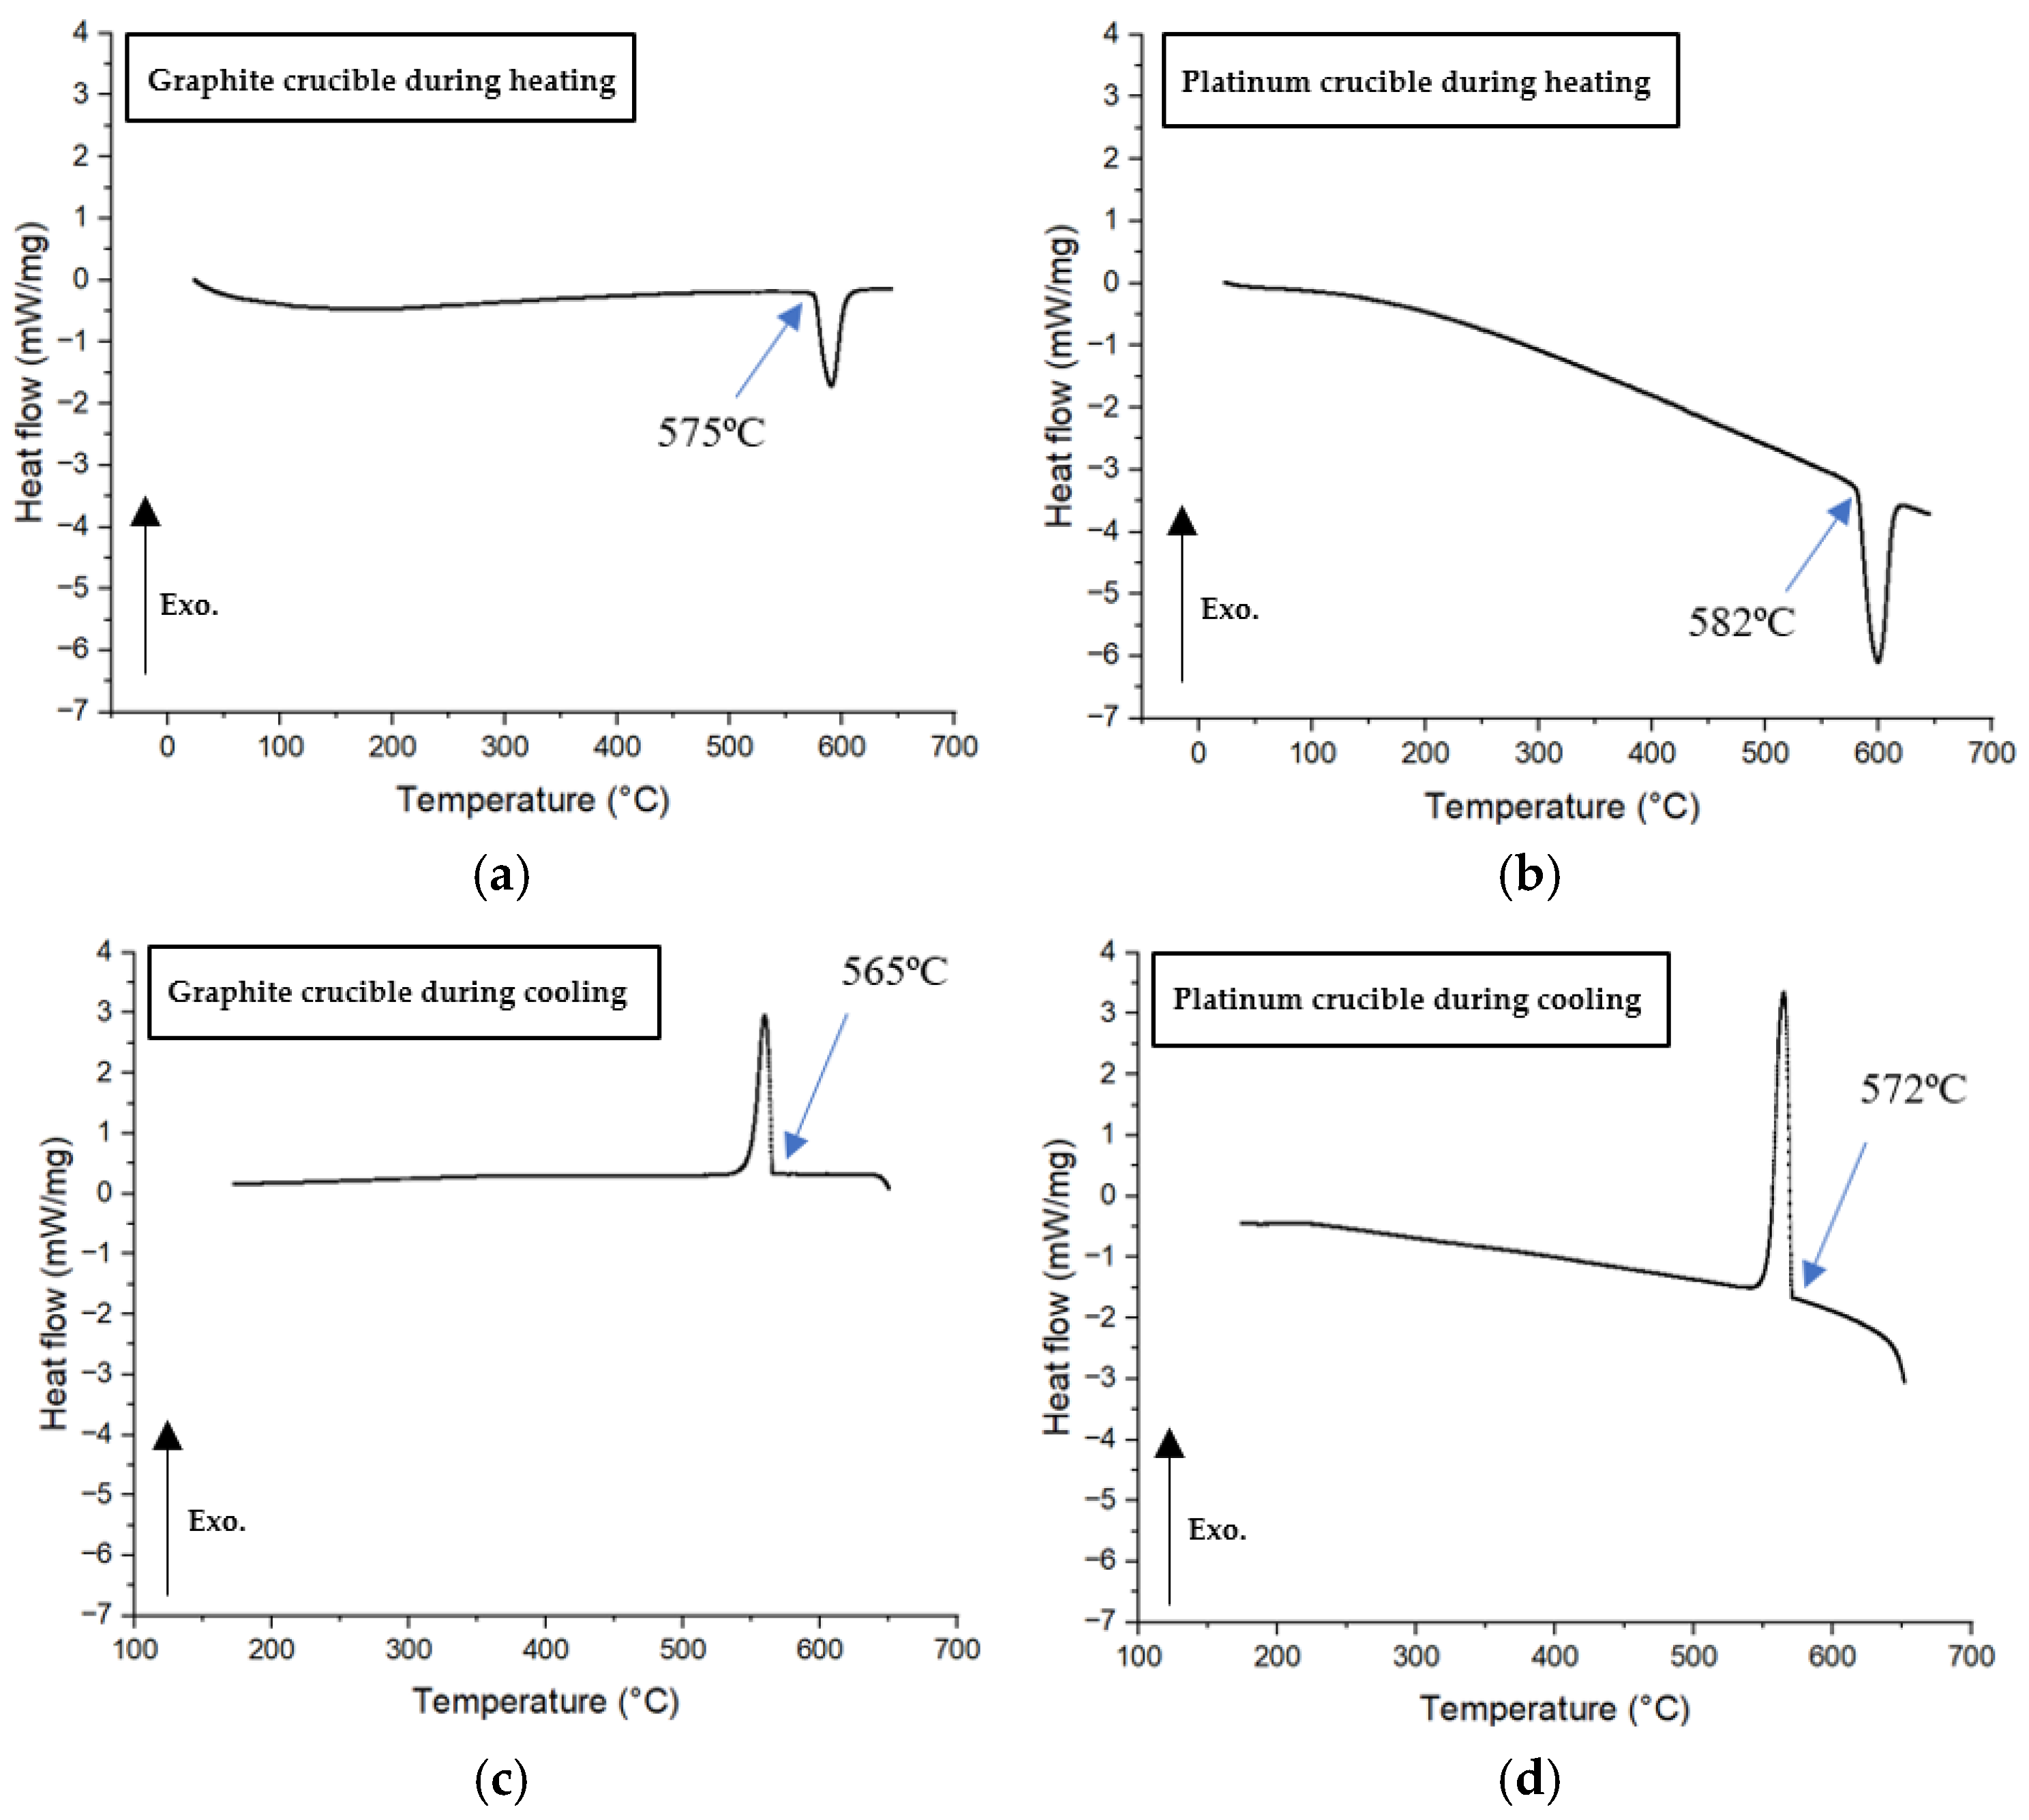
Figure 13.
XRD result of Li2SO4 sample showing the only phase of Lithium Sulfate tested in graphite crucible.
Figure 13.
XRD result of Li2SO4 sample showing the only phase of Lithium Sulfate tested in graphite crucible.
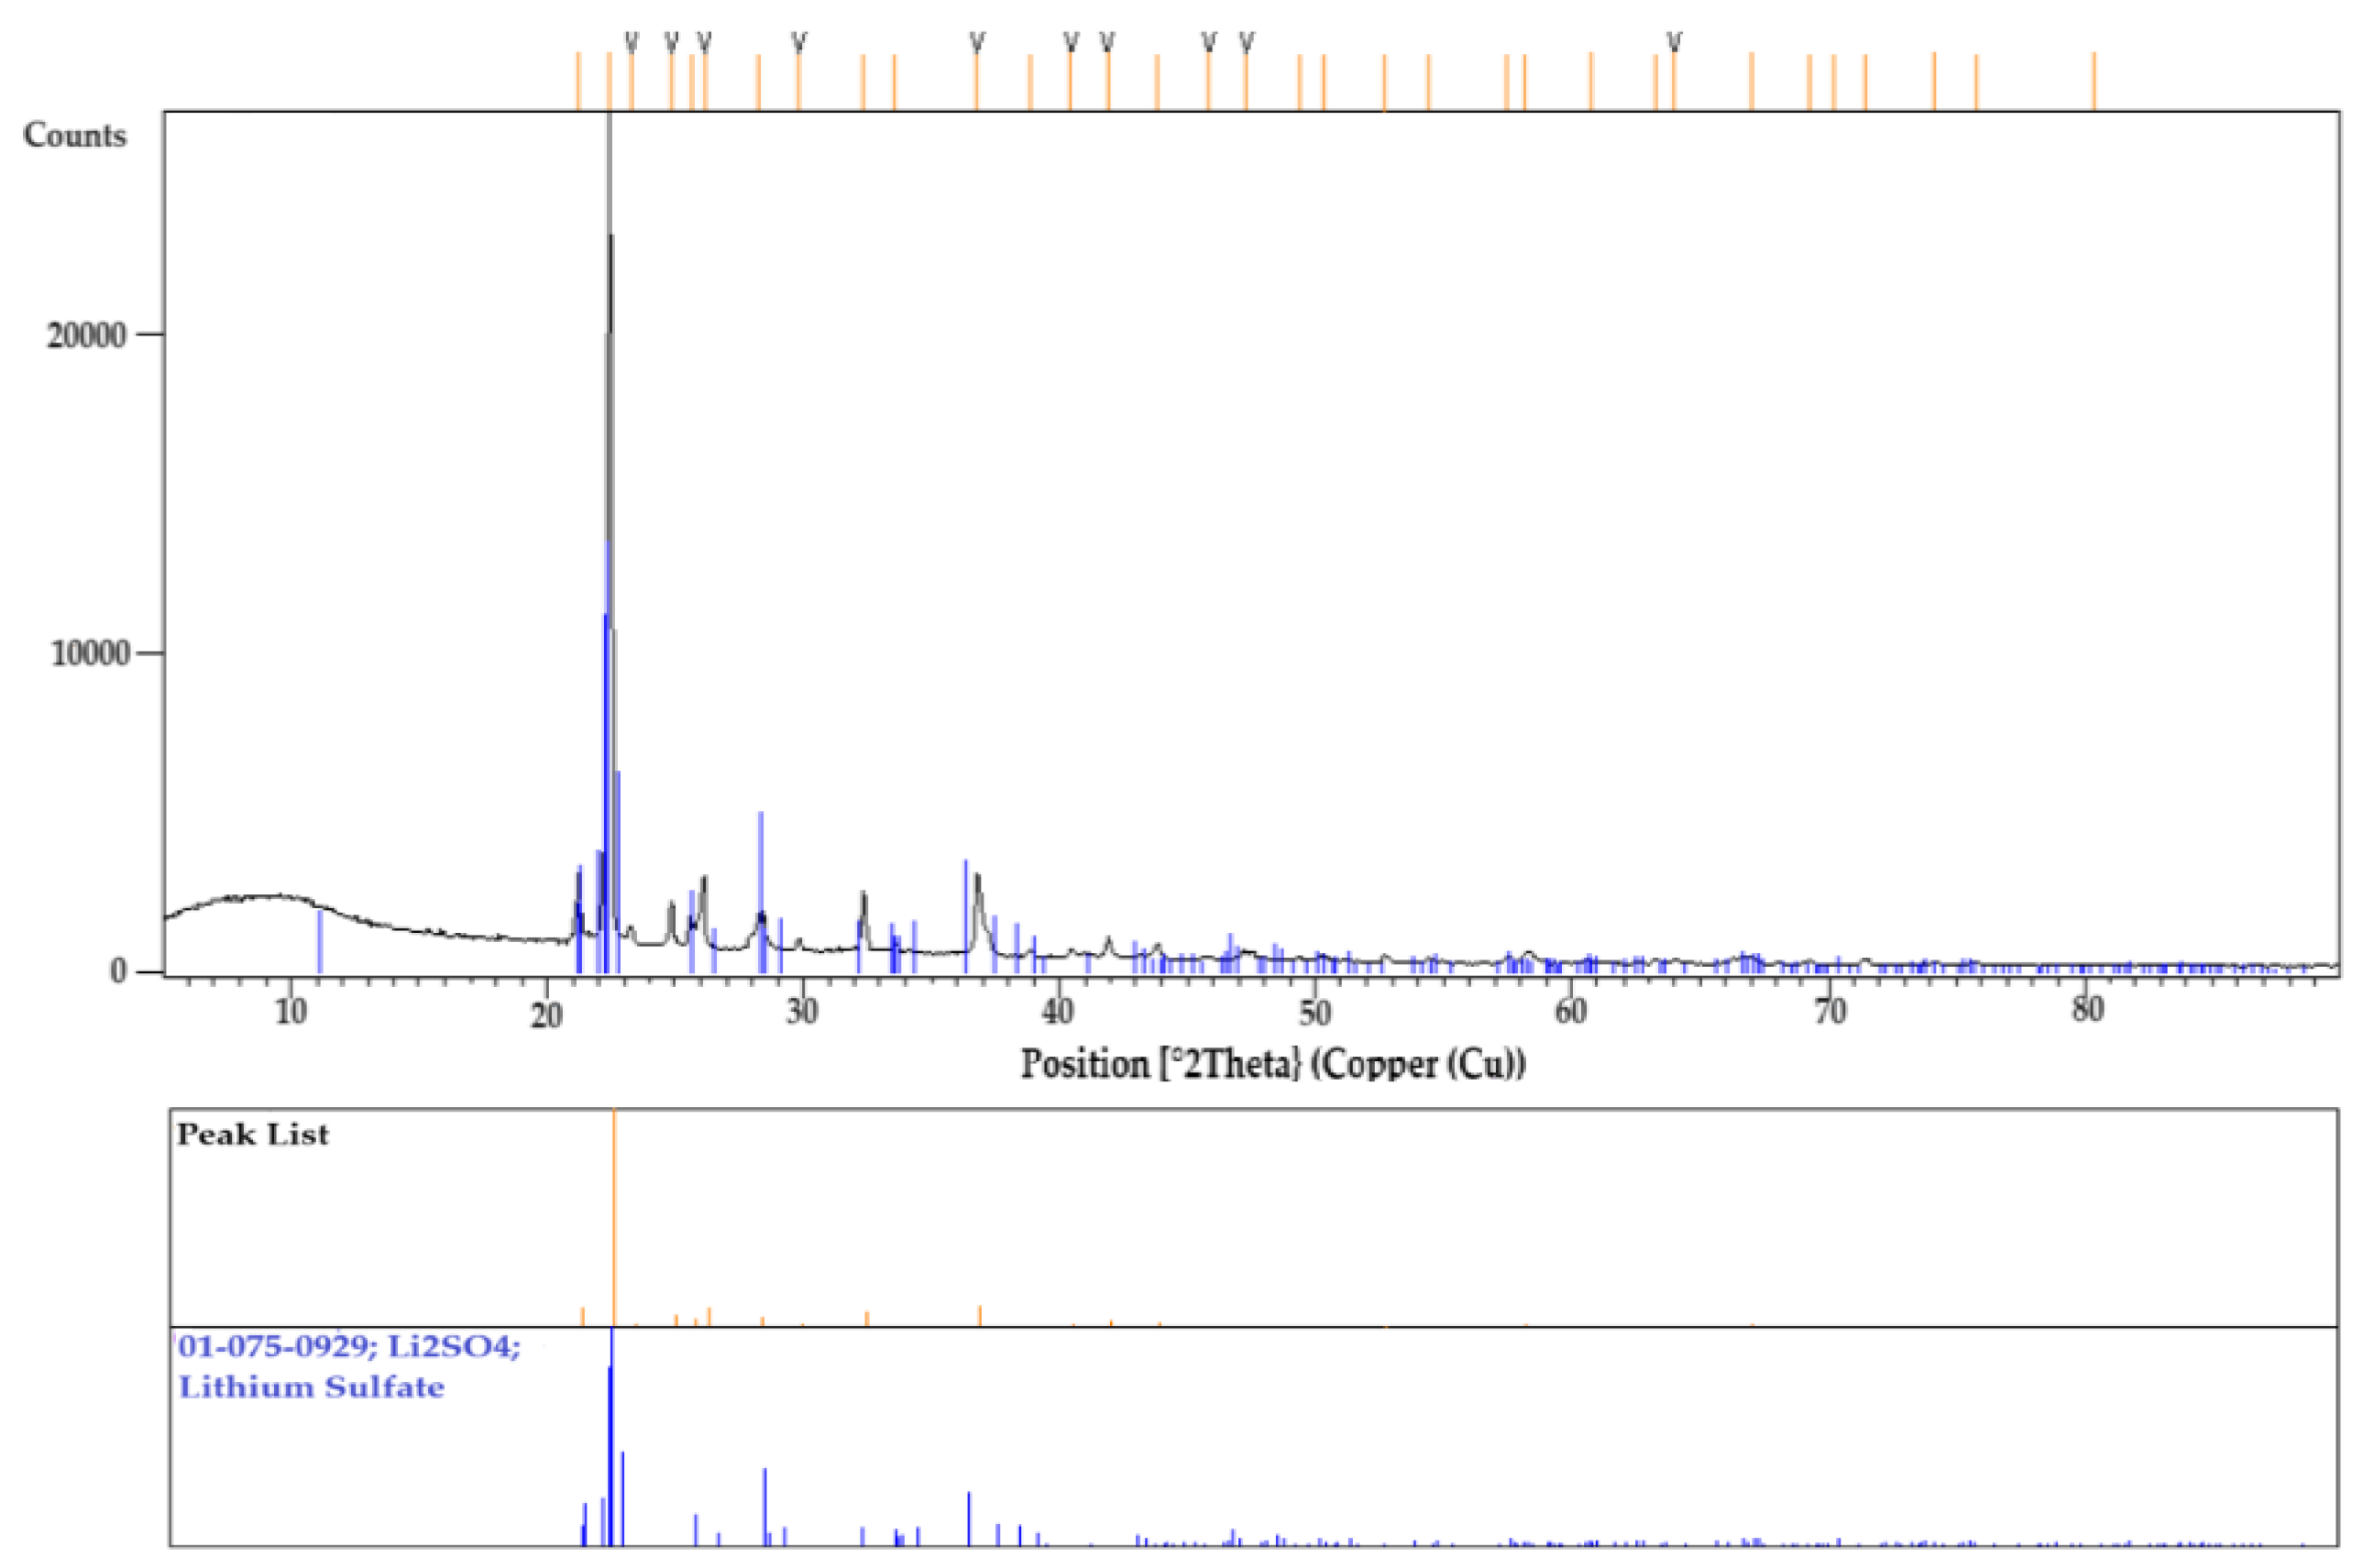
Figure 14.
Phase evolution in equilibrium for the reaction: (a) C with Li2SO4; and (b) Pt. with Li2SO4, as determined through thermodynamic calculations.
Figure 14.
Phase evolution in equilibrium for the reaction: (a) C with Li2SO4; and (b) Pt. with Li2SO4, as determined through thermodynamic calculations.
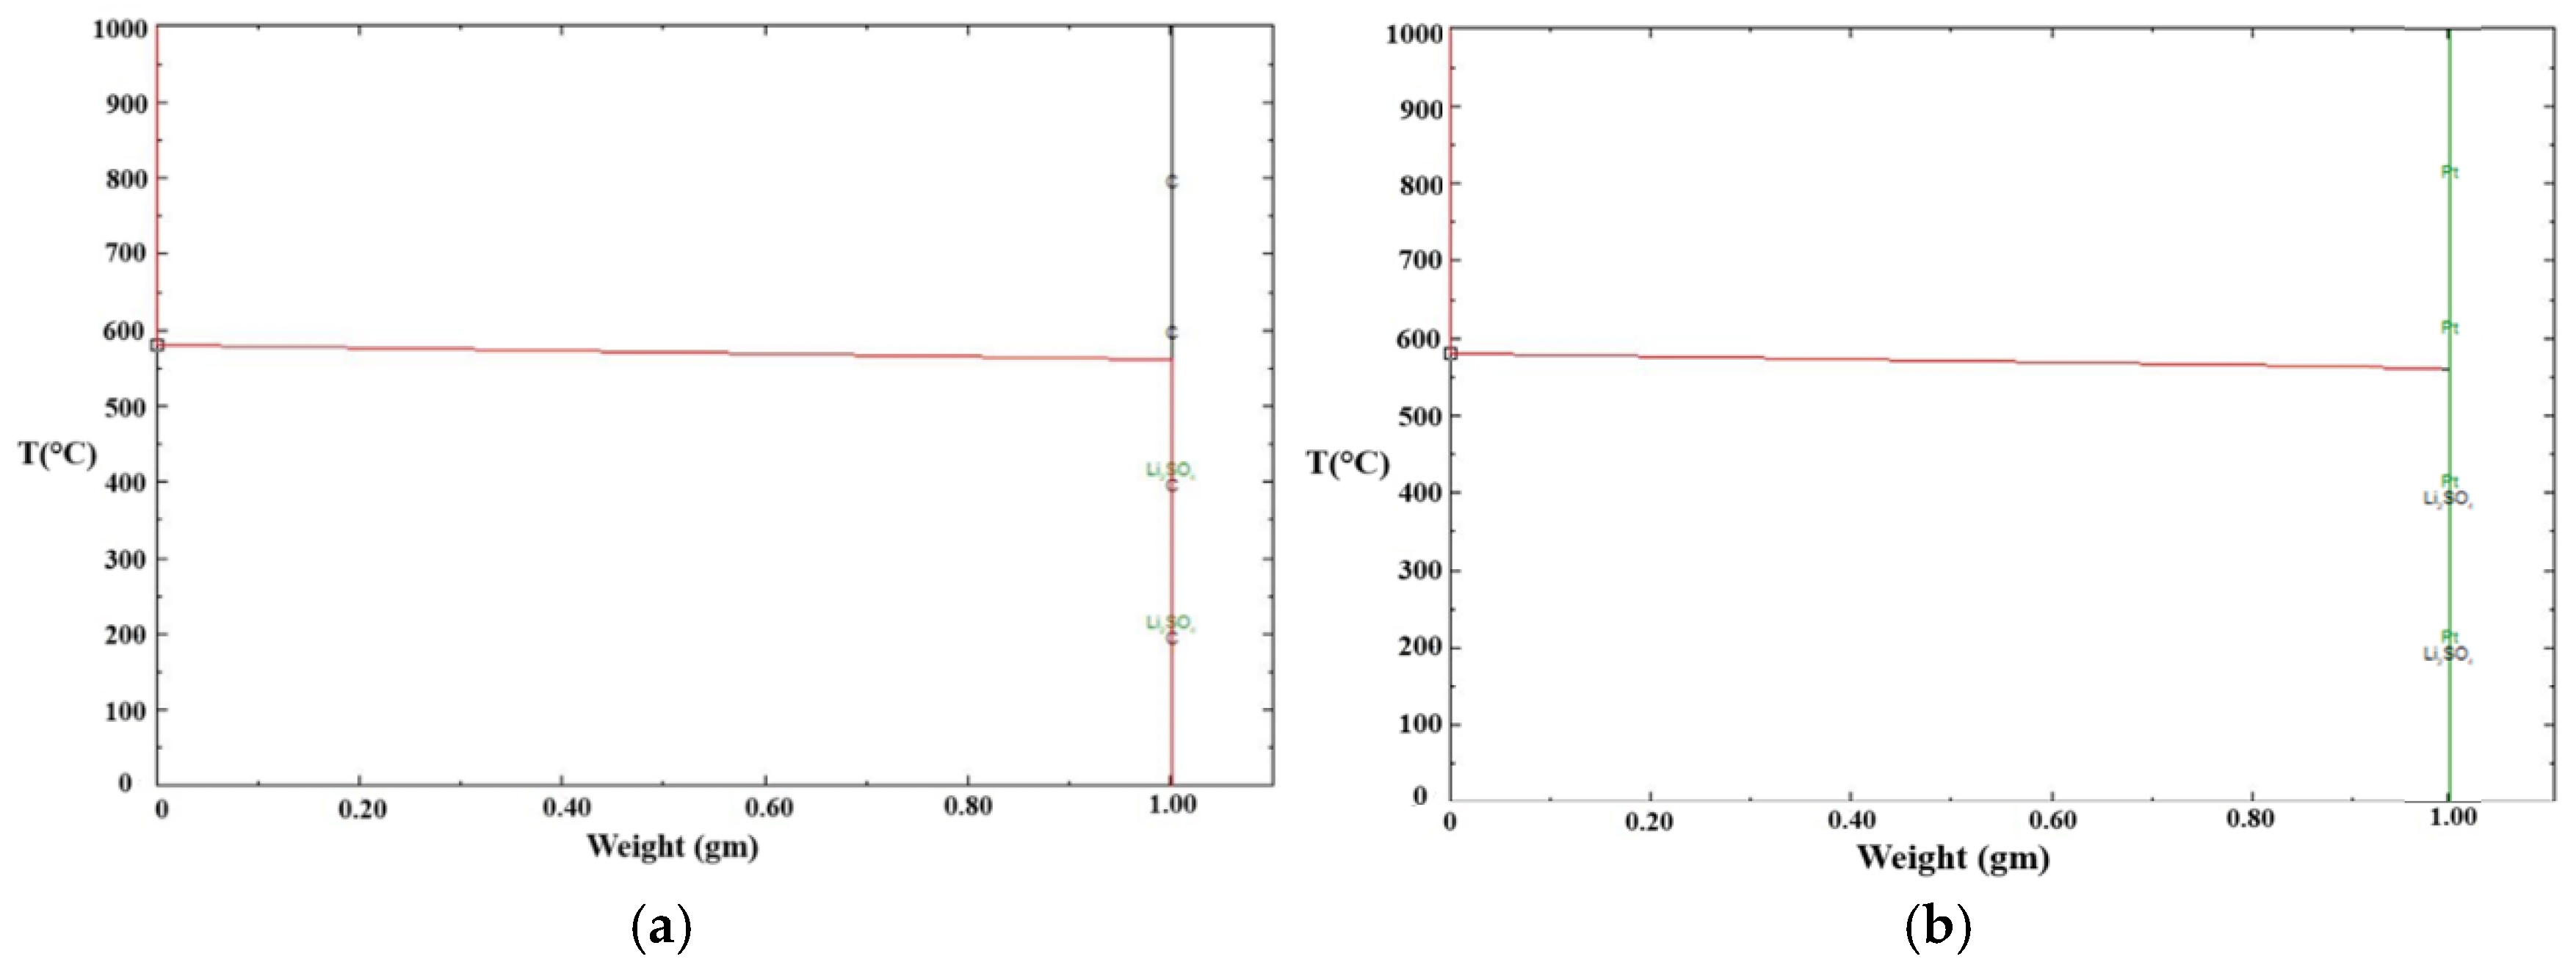
Figure 15.
The Backscattered Electron (BSE) SEM image of the polished and coated mold flux sample (top-left corner) alongside elemental maps generated by SEM-EDS. The black area in the top-left image corresponds to the epoxy region. No traces of carbon were detected within the mold flux, except in the epoxy region and no reaction layers were observed at the interface. The cuspidine crystals (Ca4Si2O7F2) dispersed within a glassy matrix (consists of Na, Al, Si, and O) in the mold flux sample as explained earlier.
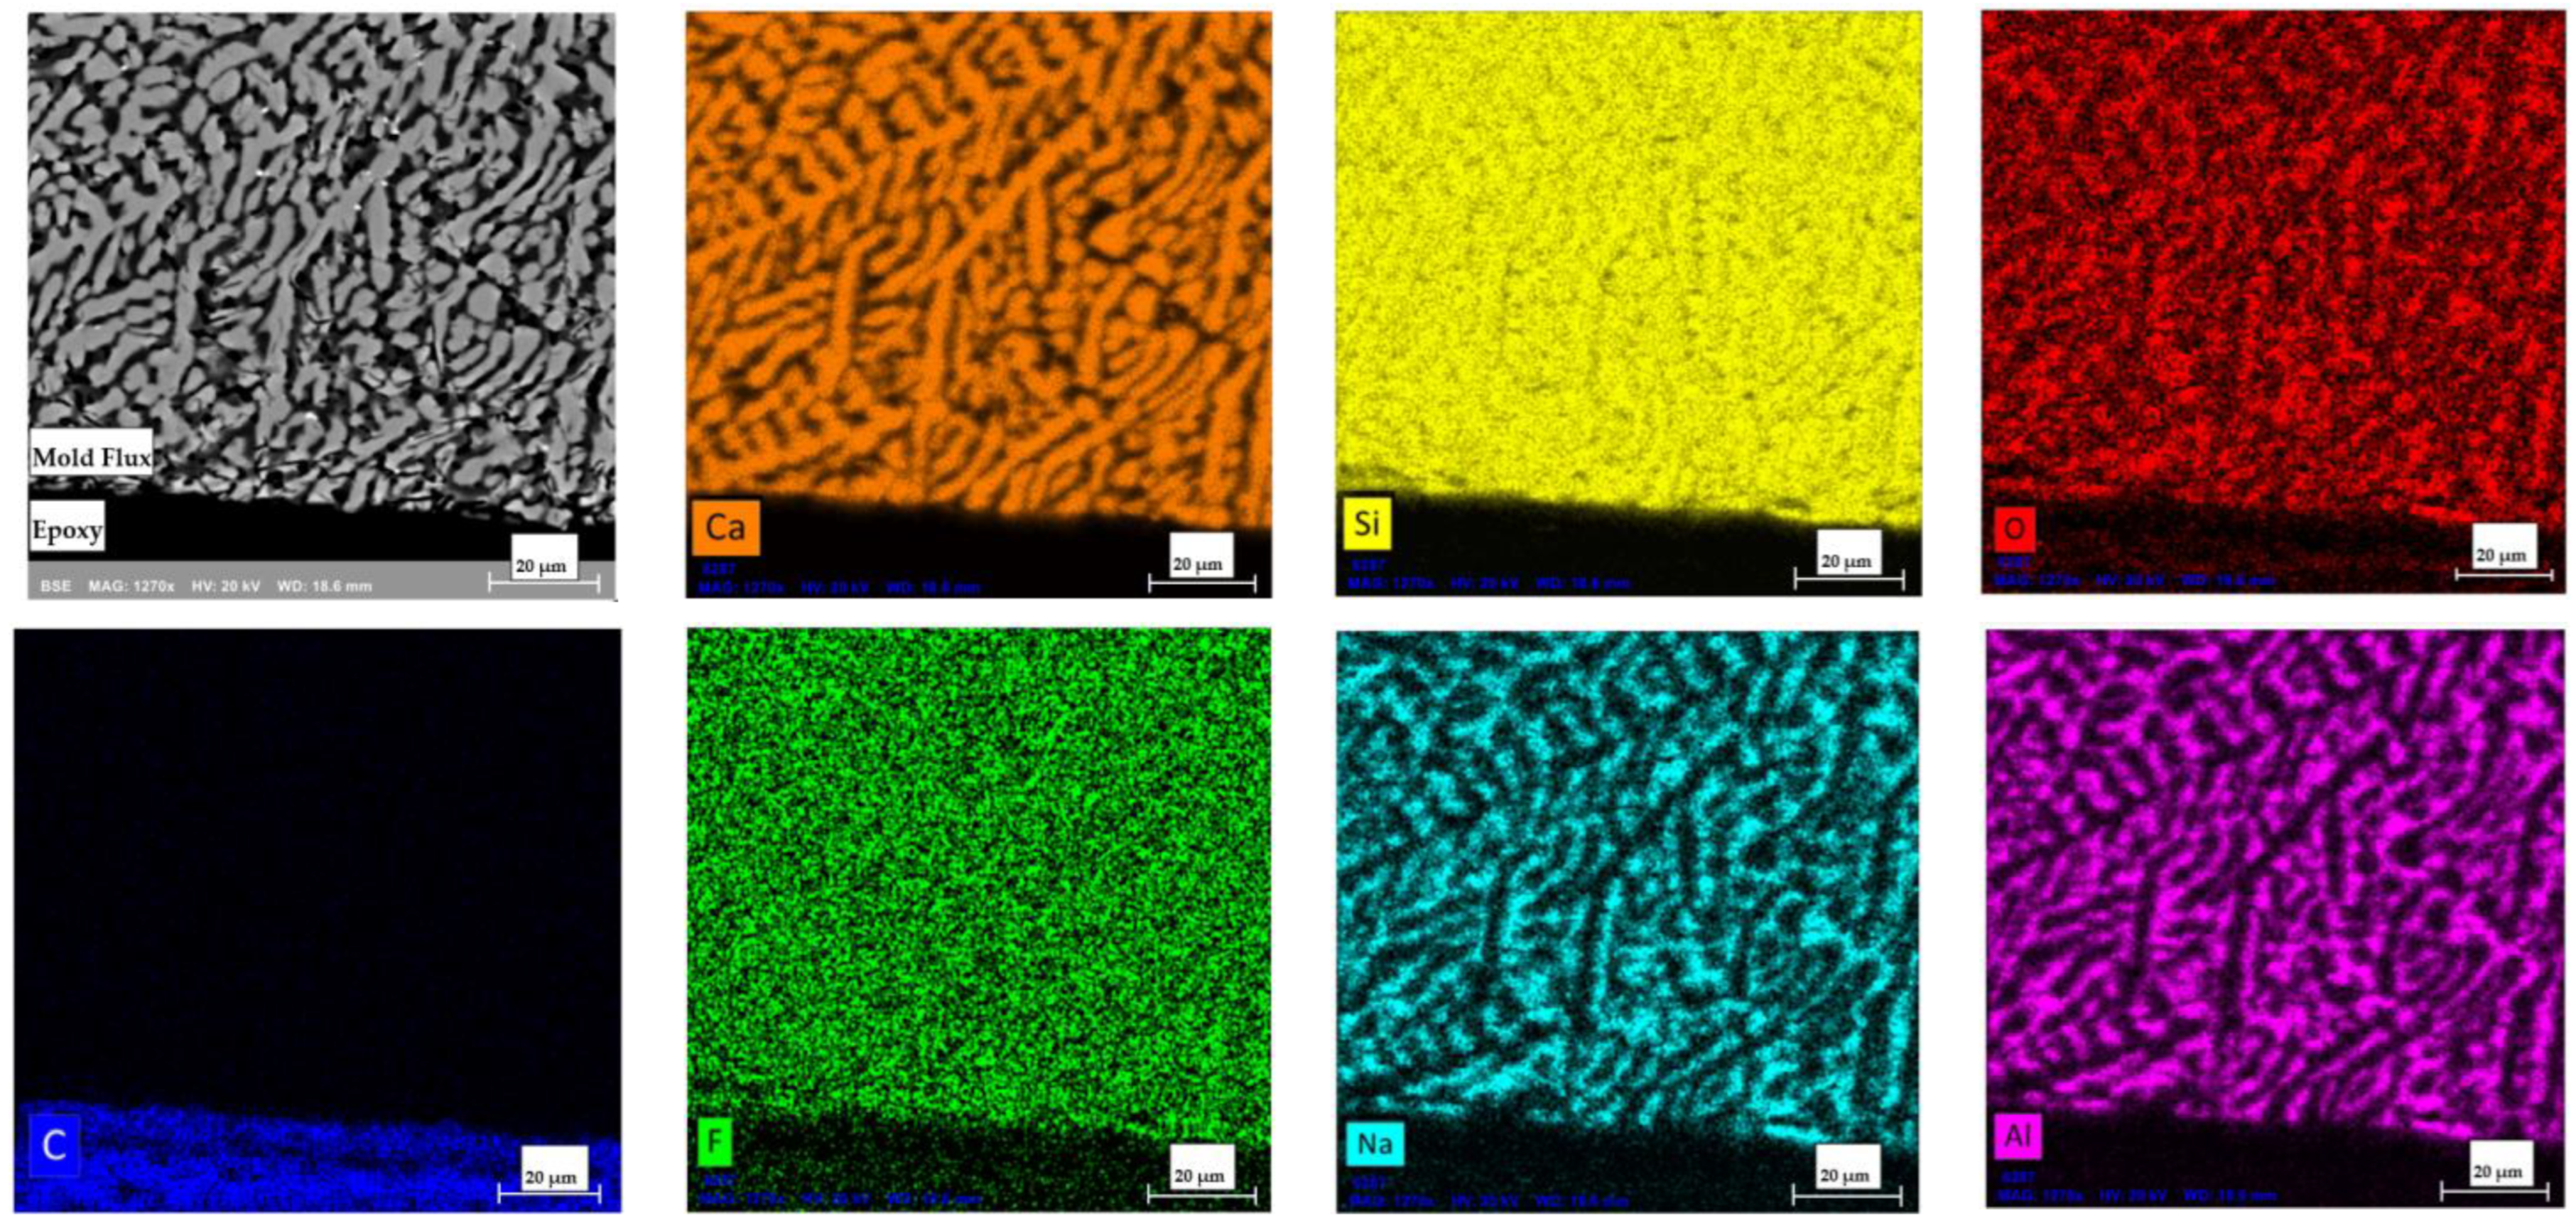

Table 1.
Chemical composition of the mold flux (wt.%).
| CaO | SiO2 | Na2O | F | Al2O3 | MnO | Li2O | Fe2O3 | MgO | C(Total) |
| 31.7 | 27.5 | 9.2 | 7.6 | 5.2 | 2.8 | 0.7 | 0.5 | 0.3 | 9.4 |
Table 2.
Physical properties of the mold flux.
| Basicity (CaO/ SiO2) | Solidification temperature | Viscosity at 1300°C |
| 1.15 | 1130°C | 0.7 Poise |
Table 3.
The onset of primary crystallization temperatures in graphite and platinum crucibles at various cooling rates.
Table 3.
The onset of primary crystallization temperatures in graphite and platinum crucibles at various cooling rates.
| Cooling rates | 5°C/min | 10°C/min | 15°C/min | 20°C/min | 25°C/min | 30°C/min |
| Crucibles | Primary Crystallization Temperatures | |||||
| Platinum | 1185°C | 1164°C | 1156°C | 1153°C | 1112°C | 1095°C |
| Graphite | 1039°C | 1021°C | 1006°C | 1014°C | 992°C | 933°C |
| Crystallization temperature difference | 146°C | 143°C | 150°C | 139°C | 120°C | 162°C |
Table 4.
Mass loss during all tests in both crucibles at various cooling rates.
| Cooling rates | 5°C/min | 10°C/min | 15°C/min | 20°C/min | 25°C/min | 30°C/min |
| Crucibles | Mass loss during the test | |||||
| Platinum | 5% | 3% | 2.5% | 2.5% | 2.5% | 2% |
| Graphite | 5% | 4% | 4% | 2% | 3% | 2% |
Table 5.
Chemical composition of the synthetic slag (wt.%).
| Sample ID | CaO | SiO2 | Al2O3 | Na2O | F | Basicity |
| SA-3 | 39.3 | 34.1 | 10 | 7.5 | 9.1 | 1.15 |
Disclaimer/Publisher’s Note: The statements, opinions and data contained in all publications are solely those of the individual author(s) and contributor(s) and not of MDPI and/or the editor(s). MDPI and/or the editor(s) disclaim responsibility for any injury to people or property resulting from any ideas, methods, instructions or products referred to in the content. |
© 2025 by the authors. Licensee MDPI, Basel, Switzerland. This article is an open access article distributed under the terms and conditions of the Creative Commons Attribution (CC BY) license (http://creativecommons.org/licenses/by/4.0/).
Copyright: This open access article is published under a Creative Commons CC BY 4.0 license, which permit the free download, distribution, and reuse, provided that the author and preprint are cited in any reuse.


