
Submitted:
04 January 2023
Posted:
10 January 2023
You are already at the latest version
Abstract
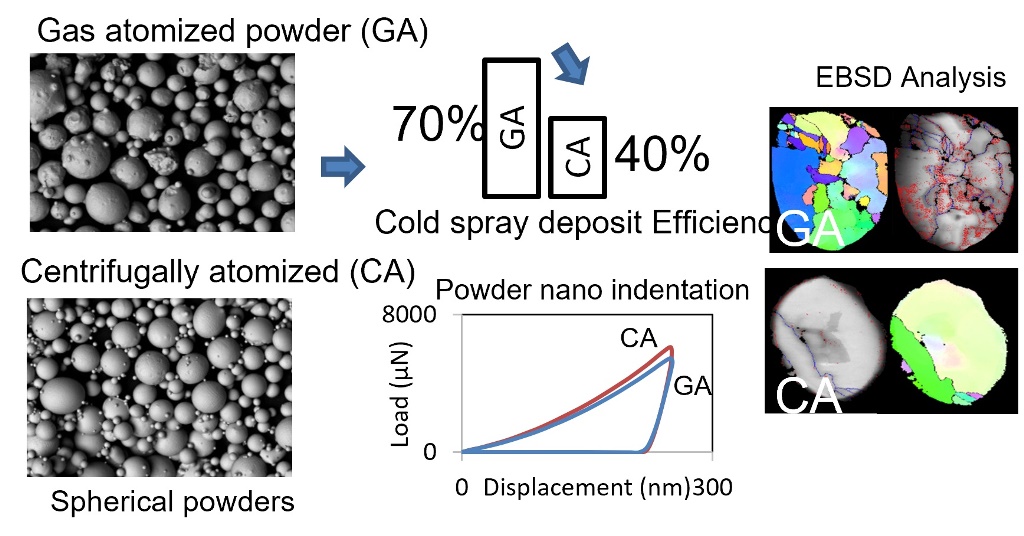
Cold gas dynamic spray (CS) is a unique technique to deposit material using high strain rate solid state deformation. A major challenge for this technique is its dependence on the powder properties and lack of standards to assess them between lots and manufacturers. The motivation of this research was to understand the variability in powder atomization techniques for stainless steel powders and their subsequent properties for their corresponding impact on CS. A drastic difference (~30%) was observed in deposition efficiencies (DE) of unaltered, spherical, and similar sized stainless steel (316) powders produced using centrifugal (C.A) and traditional gas atomization (G.A) techniques. The study highlights more on differences on precursor level. Using recent advancements in large scale statistical measurements like laser diffraction shape analysis, µCT scanning, traditional methods like EBSD, nano-indentation, an attempt is made to understand the powder property. Insights on powder size and shape are documented. Significant differences were observed between C.A and G.A powders in terms of grain size, fraction of higher angle grain boundaries (HAGB) and nano hardness. The outcomes of this study would be helpful to understand the commercialization of the cold-spray process for bulk manufacturing of powder precursors
Keywords:
coldspray
; 316 stainless steel powder
; EBSD
; atomization
Introduction
Cold spray (CS) is a solid-state deposition process which is used to manufacture protective coatings or for repair and restoration and near net shape consolidation applications [1,2,3]. Known as the kinetic energy based additive manufacturing solution, the build-up occurs when powder particles impact and plastically deform on the prior layer. This high strain rate deformation results in a combination of plastic deformation and hydrodynamic jetting [4] and adiabatic shear instability [5] at the surface of the powder creating anchoring points that result in exceptional high bond strength that the CS process is known for [6]. The coating also benefits from mechanical interlocking [7] and break up of its peripheral oxide layer [8] which enables metallurgical bonding[6,9]. The concept of critical velocity is widely accepted as a threshold value above which deposition occurs. This velocity is defined by transition from elastic particle rebound to a plastic deformation regime [10] and is dictated by its material properties and processing conditions. The applications of CS have expanded over 30 years; further strides are being made in-order to commercialize cold-spray as a po4wder consolidation technique to make geometric parts with desirable properties [11].
Widespread commercial adoption of this technique requires significant reduction in development and final manufacturing costs. Being a plastic deformation-based manufacturing process, the starting microstructure of the powder plays a major role in CS coating process. The microstructure in turn is dictated by the powder production or synthesis technique. Figure 1 shows a short list of powder characteristics/parameters affecting the cold-spray deposition. Parameters such as size, morphology, microstructure, phase, porosity, and oxide content have been systematically shown to affect the deformation process [12,13,14,15]. A thorough understanding of these factors was recently review and presented by Nastic et al [16]. As mentioned by other researchers extremely limited data is reported on the effect of starting microstructure – phase, grain size, porosity of the starting powder particles on CS. Adding to the complexity is the variability in production of powders between manufacturers and within production lots. Brewer et al [17] have studied these in detail and have raised the need for better standards for powder quality. Therefore, development of standards and tailoring techniques for the powder is critical for CS application. This will enable higher deposition efficiency (DE) and reduce manufacturing costs. There are challenges in tailoring of feed stock powder. One is the costs associated with the tailoring techniques which usually require fluidization in inert gasses at high temperatures. The other is scalable quality control techniques to analyze the powders for CS process [18,19,20,21].
Cold spraying of austenitic stainless steels is widely used to improve surface corrosion resistance and is well studied by several researchers. Powder size [13], nozzle dimensions[22], mixed powders [23], laser assisted[24] spray has been well documented. In the CS study using water atomized (W.A), and gas atomized (G.A) stainless steel powders extensive deformation was observed in W.A powder leading to more hardness in its coating [25]. The irregular powder morphology results in better drag characteristics resulting in higher particle velocities [25]. Brewer’s study [17] compares 3 different G.A stainless-steel 316 powders with different particle distribution and observed different initial phases in the powders. They recorded a variation in atomized powders between batches/lots and manufacturers. These have been systematically identified as factors that affect CS deposition.
Centrifugal atomization (C.A) is a process that utilizes centrifugal forces to break up a rotating sheet of liquid into fine droplets. While C.A powders are widely used in additive manufacturing, powder metallurgy, limited information is available on its use with CS [26,27]. Unlike two-fluid atomization techniques, the centrifugal process can be controlled better and can achieve a narrow particle size distribution (PSD). This process also results in higher solidification rates 108 °Cs-1 w.r.t to G.A 106 °Cs-1 and W.A 107 °Cs-1 atomization techniques [28]. C.A technique typically produces powders with higher density, similar sphericity and roundness compared to gas atomization. Hence comparing the properties of C.A and G.A powder would improve the understanding of their impact on CS ability and assist towards the development of powder production for CS. This article emphasizes more towards powder assessment and significant coating properties are presented.
Materials and Methods
Cold-Spray Deposition
Commercially atomized powders from two reputed manufacturers were used in this study. To prevent readers from getting distracted from the results, the powder manufacturers are not disclosed. The sample names in the article would be further abbreviated as G.A (Gas Atomized 316 powder and coating) and C.A (Centrifugal Atomized 316 powder and coating).
The chemical composition of the powders is listed in Table 1. To delineate the differences in deposition characteristics, coatings were sprayed on large aluminum 6061 plates (12”x12x”1/2”) to minimize the influence of target heating. The CS deposition parameters were kept identical for both types of powders as mentioned in Table 2a. The deposition efficiency of the process was simply calculated as the ratio of the coating weight vs. the powder amount fed for the respective cycle time excluding technological losses. A convergent-divergent nozzle with a rectangular cross section (expansion ratio 8.79) was used in this study. The details of the nozzle and deposition parameter optimization can be found in our previous study [24]. Nitrogen was used as process and carrier gas. Deposition was conducted with 3.44 MPa process gas pressure and 0.47 MPa carrier gas pressure. Powder was fed using a Thermach AT-1200HP (Appleton, WI, USA) powder feeder. Substrates were degreased with alcohol; no additional surface preparation was performed. During deposition, the nozzle was stationery while substrate was guided on a 2 axis CNC system (X- linear; Y- Rotational). A 50% overlap of the coating with respect to the nozzle width was maintained during deposition of both the powders for the subsequent linear and rotary motion of the substrate. The rotation speed was varied to maintain constant linear surface velocity of approximately 12mm/s across the surface. Coatings were deposited to a thickness of 1.3mm. C.A powder required additional deposition time to achieve the same thickness as the G.A powder (Table 2b)
Characterization
Microstructural characterization of the powders and cold-sprayed coatings was done with scanning electron microscopy (Secondary/Back scattered images) on a Hitachi S-3600N SEM to analyze the grain size and the quality of the powders and the coating. Standard metallographic procedures were followed using an epoxy resin to prepare cold mount samples for the SEM. The internal structure of the powders was evaluated by mounting, polishing, and etching. A swab etch was done on the cross-section of powders using dil. HNO3 (1:9) as the etchant with 10 seconds of etching time. Etching was carried out to reveal the microstructure grains of the precursor (powder). A Rigaku Miniflex X-ray Diffractometer (Cu Kα radiation λ~1.5402Å) was used to determine the phases in the powders as well as the coatings. Scherrer equation was used to calculate the average crystallite size for all peaks with K=0.9 (Scherrer constant).
A Tescan Mira SEM coupled with an EBSD detector with an EDAX Hikari camera was used for microstructure measurements, an accelerating voltage signal of 30kV was used with a high beam intensity. Diffraction patterns were indexed using crystallographic information imported from the ICSD database [29]. The crystallographic information is mentioned in Table 3. Data was collected with a step size of 0.04 and 0.1 µm at a working distance of 15-17mm. Individual particles were examined over an area of ~4000µm2. The EBSD scans were later processed using TSL OIM analysis and the patterns only with C.I >0.2 were mapped.
A Microtrac Sync system was used to measure the PSD and shape analysis using laser diffraction (LD) and dynamic image analysis respectively (Microtrac Retsch GmbH, Duesseldorf,Germany). A ZEISS Versa 620 X-ray Microscope was used to characterize the powder in 3D. The scan used a voltage of 140 kV and power of 21 W to image the powder prepared in glass capillary tubes. A pixel size of 0.75 μm was obtained with the 4x objective. The powder was segmented using commercially available software from Zeiss - Powder Analyzer. Visualization was completed in TXM3DViewer, allowing for 2D cross-sections and 3D views to be obtained.
The micro hardness was measured using a Vickers Hardness equipment (Streurs, USA). A load of 10gF and 300gF for 20 secs was applied for hardness measurement on powder particles and on the cold-sprayed coatings, respectively. The indents on the powder cross section were measured on the same particle as well as different particles to ensure homogeneity of the precursor micro-hardness. Micro-hardness on coatings was determined at 3 different positions/locations away from the substrate. An average of 5 readings at each offset from the substrate has been reported.
Mechanical properties of the powder precursors were also determined using a nano-indentation technique. A hysitron 950 tribometer equipped with a standard Berkowich probe (half-angle 65.23° Eindenter =1140GPa, νindenter=0.07) was used for measurements. Only larger particles in the range of 35-50µm were considered for nano-measurements to avoid the effect of immersion in epoxy[30]. Indentations were made using a constant displacement of 250nm to avoid any surface effects. The applied load was held for 5 seconds. Multiple indents spaced at significant distances were taken on same particles to prevent local strain effects during indentation.
The tribological properties of the coatings were measured using a commercial reciprocating ball-on-disc setup (CSM Tribometer, Switzerland) according to ASTM G99. Machined coatings were used for the testing in order avoid excess loading on the tribometer. A 6mm tungsten carbide ball (McMaster Carr) was used as a friction media. Test was conducted at room temperature (~24°C) with a 3.25cm/s sliding speed and a load of 9N for 25000 cycles. Corresponding wear profiles were later measured for a travel span of 6mm using a Mitutoyo Surf test equipment. The resulting plot Ra value v/s the length is reported for repetitive and uniform measurements.
Adhesion strength on the coating was measured by a hydraulic tensile adhesion tester. The equipment used was P.A.T (Precision adhesion testing) by DFD instruments, UK. The test performed as per ASTM C633[31]. A FM-1000 epoxy adhesive film (Cytec Industries, Woodland Park, NJ, USA) was used. Grit blasting was done on the contact face of the bond pin. The film was glued to the coating at 175°C for 2 hours (later air cooled at ~25C) followed by the pull-test. A total of 4 measurements were taken from each of the coatings. It was ensured that the test results represent the values at separation of the coatings from their respective substrates, other results with partial delamination were discarded.
The corrosion behavior of the coatings was measured by the electrochemical/galvanic technique using a VMP3 potentiostat (Biologic). An Ag/AgCl and Pt wire were used as reference and counter electrode respectively in a 0.5% NaCl solution used as an electrolyte. Two tests were conducted from each coating at room temperature (~25degC) to measure the open circuit potential (OCP) and the polarization behavior (potentio-dynamic curve) according to ASTM G59. The collected data was analyzed for Tafel-fitting and slopes ßa and ßc were calculated using commercially available software EC lab by Biologic (Seyssinet-Pariset,France).
Results
Powder Characterization
The feedstock powders obtained from both C.A and G.A techniques were spherical. This is shown in the SEM micrographs of as received, and cross-section etched powder particles in Figure 2. The G.A powder showed many agglomerated satellites (Figure 2a). The outer surface structure of G.A powder did not reveal complete structure (Figure 2b). The cross-section (Figure 2c) shows that G.A powders had a near complete transition from the columnar dendrites to multi-crystalline anisotropic grains due to the cooling time during atomization, ranging from 5-10µm. The outer surface structure of C.A powder (shown in Figure 2e) showed a cellular dendritic combination[32,33] The cross section shows majority of the internal features of the C.A powder to be under 5µm (shown in Figure 2f). The differences in the solidification rates during atomization, leads to a different dendritic network in the powders. Similar features were present in both G.A powder and C.A powder with a z-contrast present along the grain boundaries [32,33,34,35]. This is further assessed using EBSD analysis presented later in this study.
PSD collected using LD and µCT is shown in Figure 3. The powder flow properties obtained from manufacturer data sheets are summarized in Table 4. Difference in two measurement technique is that they compute the particle diameter from the actual measurement which is the area (LD) and volume using 2D rotation (µCT) respectively. For the C.A powder the PSD calculated using particle area and volume are similar. For the G.A powder, there was a significant difference in the calculated diameters from scanned volume vs scanned area. This difference highlights the limitation of optical techniques and image analysis that are limited to two dimensions.
A snapshot of the morphology of the powder along with sphericity and roundness characteristics collected using LD are shown in Figure 4. These snapshots were taken from a camera attached to the Microtrac Sync equipment. The statistics was calculated from well over 50,000 particles. Non spherical atomization artifacts in G.A and C.A powders are shown in Figure 4a and 4b but account for a statistically small fraction. Figure 4c and d show the roundness and sphericity of both powders. Sphericity is the ratio of minimum circumscribed and maximum inscribed circles and for the roundness is the ratio of area of the particle to the area of a circle with the same convex perimeter.
While typically, the centrifugal powders exhibited higher sphericity and roundness, when segregated based on calculated particle diameters, both powders were identical below 35μm. Above this size, the centrifugal powder was more spherical and exhibited higher roundness. These details are shown in Figure 5. Further insight into particle’s internal porosity was obtained from µCT scan and are shown in Figure 6. A snapshot of the scanned volume is shown in Figure 6a and b. The individual pore volumes are calculated using the Zeiss software and is presented in Figure 6c. The C.A powder had a significantly lower fraction of fine pores with size of 15 microns or less and larger fraction of coarse pores compared to gas atomized powder. Correlation of the particle volume to the pore volume was not available. But given that particle diameter must be greater than pore diameter, at dimensions of 30-60μm, the C.A powders exhibited slightly higher porosity compared to gas atomization.
Powder X-ray diffraction (Figure 7) indicates a small presence of ferrite along with austenite in the as received stainless steel powders (G.A and C.A). From the diffraction pattern, the fraction of residual ferrite was higher in the C.A powder. This could be due to higher solidification rates that can be achieved in centrifugal atomization. Brewer et al [17] have analyzed phase content within gas atomized stainless steel powders and have found powders with overall smaller size distribution particles had a higher fraction ferritic phase due to their higher solidification rate.
EBSD characterization of the powders in shown in Figure 8. About 10 -15 particles weanalyzed from each of the atomization techniques. Figure 8 a, d shows typical IPF maps obtained from each of the powders, corresponding phase and IQ maps are shown in Figure 8 b, c and Figure 8 e, f respectively. The phase maps clearly show that the ferrite content was present in smaller fragments of the powder and can be associated with higher solidification rates of the particle. The grain boundary angle is superimposed on the IQ map. The low angle grain boundaries (LAGB) <15deg and high angle grain boundaries (HAGB) are shown in blue/green and red, respectively.
The mis-orientation angle and grain size distribution from different powders were extracted using OIM software and plotted in Figure 9a, b. The effect on grain structure due to differences in solidification kinetics achieved in gas and centrifugal techniques can be observed in terms of grain boundary angle and size distribution. From the obtained data set (Fig 9a), we observed significantly lower fraction of grain boundaries < 5deg or sub grain boundaries with the centrifugally atomized powder. The absence of low angle grain boundaries could be due to higher solidification rates. Similar conclusion has been derived by other researchers[36]. Similar effect is found in the grain size distribution (Figure 9b), while both atomization techniques produce grains of similar size, a lower solidification rate in the G.A powder appears to result in a combination of high fraction of LAGB leading to grain coarsening. While both powders had recorded grain size between 1 to 12μm, larger grains were present in the C.A powder and can been seen in Figure 8 (d,e,f)
Table 5 represents the micro and nano hardness measurements on both powders. These hardness values were within a range for austenitic stainless steels reported in literature [17,34,37,38,39,40,41,42] . Nano hardness was measured on the cross-section surface of both powder particles. Various areas within the particle were indented to delineate the differences within the particle. The nano-indentation curves are shown in Figure 10. This curve represents an average and 3σ distribution in the loading section of the test. The C.A particles required a higher load for the given indenter displacement. An average hardness of 2.65 GPa and 2.87 GPa was recorded for G.A and C.A powders respectively. This higher hardness in the C.A powder could be due to the higher fraction of HAGB observed with EBSD measurements. The difference in cooling rates during atomization could be another contributing factor. Other differences in hardness could be due to grain orientation with respect to nano indent and has been studied by Roa et. al [43].
Coating Characterization
The DE of C.A powder was significantly lower compared to G.A and required additional deposition layers to achieve the 1.3mm coating thickness. Cross-section images of both the coatings are presented in Figure 11. The arrow in the figures indicates the direction of particle travel during deposition. Inter-splat voids and boundaries were present in the coatings. It is typical in CS for a softer substrate to extrude around a harder particle [44]. Since a softer substrate (aluminum) was used, the initial layer of particle-substrate bonding occurs due to a phenomenon termed as surface-scrubbing. This results in extrusion of aluminum in between the particles which limits the hardness of the bottom layer [45]. Similar observation is present for the G.A coating. In comparison, its magnitude and occurrence are limited in the C.A coating.
Figure 7 shows the XRD of the powder their respective coatings. A complete austenite phase was observed in both coatings. Peak shift and broadening are frequently observed in cold sprayed coatings[46]. The shift occurs due to intensity of the residual stress which increases proportionately to the degree of cold work. The peak shift of ~0.8° is visible in the G.A coating and reveals higher degree of residual stress accumulated in the coating compared to the C.A coating. Significant peak broadening was observed in the FCC (γ) phases of both the coatings compared to the peaks of the precursors. It led to a change in the crystallite size compared to the precursor. A lattice parameter of ~0.41-0.42nm was calculated from the XRD patterns of both the powders and their respective coatings. Crystallite size reduced significantly from the precursor to its respective coating as mentioned in Table 5. The C.A powder had more crystallite size than G.A with a difference of ~0.1nm which reduced to ~0.02 nm in the respective coatings. The broadening and reduction in crystallite size for a coating corresponds to a non-uniform micro-strain [47,48] which is a typical phenomenon observed in CS [49].
Microhardness measurements for powders and respective coatings are listed in Table 6 and Figure 12. Hardness values of the G.A and C.A coatings varied from ~217 HV to 260 HV and 219 HV to 220 HV respectively. These values are well within the typical range for cold sprayed stainless-steel coatings [17,37]. The Ultimate tensile strength (UTS) was derived from Vickers hardness measurements[50] and is calculated to be 695-710 MPa for C.A and from 695-895 MPa for G.A coatings. As it is usually observed with cold sprayed coatings on softer substrates at the bond line, the coating hardness is relatively low which then increases with coating thickness as deposition mechanism switches from impingement to plastic deformation[51]. Both C.A and G.A coatings showed similar low hardness levels near the bond line. However, with increasing the distance from the bondline only the G.A coating demonstrated a corresponding increase in hardness. The C.A coating had a monotonic hardness value of ~220 HV from the substrate to the free surface indicating lack of cold work and a low degree of deformation.
Table 7 represents results of the bond test. G.A coating showed higher bond strength than C.A coating. The location of bond failure is critical to understanding the bond quality of the coatings. The G.A coating experience adhesive failure of the FM1000 epoxy. For the C.A coating, cohesive failure occurred until at the initial layers of deposition. This shows that the bond strength for G.A coatings could be greater than 70MPa and C.A coatings failed at 45 MPa tensile strength. The lack of deformation or cold work in the C.A coating observed from the monotonic hardness levels shows a poor mechanical anchoring reduced the bond strength of the C.A coating significantly.
Figure 13a shows the plot of the coefficient of friction across laps/cycles. The static coefficient of friction (COF) achieved for both the coatings was between 0.7 and 0.9 with the C.A coating exhibiting relatively lower COF values compared to G.A coating. Figure 13b represents the cross-sectional profile of the wear track (one profilometer reading of each coating). The depth and width of the wear track of the C.A coating was wider and deeper than G.A coating with a wear depth ranging from 100µm and 75µm respectively. The wear rate in cold sprayed coating in typically caused by poor bonding between particles causing them to flake and increase surface roughness. Wear would also occur when the sliding 316 stainless steel ball interacts with coating porosity causing a shoveling effect resulting in higher wear rate along with increase in COF. The COF depends on many factors such as the mechanical properties of material, the surface roughness, the mutual dissolution of materials, the contact time, the lubricant film properties, the elasticity of tribo-system. Given identical test conditions, material composition of the coating, similar COF values obtained indicates that both coatings presented similar surface roughness for the duration of the test. This shows that a more probable source for higher wear rate of the C.A coating could be its lower hardness levels. During the wear test, a softer coating would result in a combination of material removal and compaction causing minimal effect on surface roughness [52].
Discussion
Given that G.A and C.A yield similar size and shape particles, the initial observation of drastic difference in deposition efficiency (DE) between them spurred the interest for this study. Identical ‘on the shelf’ sized cuts of the powders were obtained with the intention of isolating the effect of internal structure of the powder on DE. The discrepancy is the particle diameters measured using LD and µCT later revealed that the G.A powder is smaller than the C.A powder. The effect of powder size on DE is well documented by the authors in their previous research [53]. The study was nevertheless continued in spirit of exploration to serve as a reference to the CS community.
Under identical deposition conditions, the C.A powder resulted in lower DE compared to coatings produced from G.A powder. The microhardness, bond, wear, and corrosion studies demonstrated that the extent of cold work and plastic deformation was inadequate in the C.A coating. This suggests that the C.A powder requires a higher particle velocity to produce coatings comparable to that from the G.A powder. An estimate of the particle velocities will be provided in further studies.
Centrifugal atomization is known [54] for producing powders with both high densities and solidification rates. µCT scan enabled the measurement of porosity of the powder and has not been reported in prior works. The scan shows that both C.A and G.A powders, porosities were similar. The effect of solidification rate was assessed with EBSD and nano hardness measurements. EBSD analysis carried on the powder shows differences in grain size distribution and misorientation angles. About 50 powder particles were scanned and a considerable fraction of the C.A powder particles were bicrystalline. As a result, these powders have larger grain diameters as shown in the Figure 8. Using QCGD simulations, Suresh et al [55] have shown that jetting and material ejection and nucleation of defects is enhanced by the presence for polycrystalline materials with fine grain boundaries. Single crystal and by that logic bi-crystal material with a lower fraction of grain boundaries would make it harder for defects to nucleate. Past research [53] done by the current authors have also observed a reduction in cold sprayed deposition ability with an increase in grain size during annealing of stainless steel 316 powders.
With respect to misorientation angles the C.A powder had a much higher fraction of the HAGBs This could be from the higher solidification rates and has been reported in literature [36]. At strain rates of 30,000 s-1 which is low compared to the extreme strain rates experienced in CS deposition, Guha et al [56] have shown through CPFEM that for fcc materials HAGB’s result in increased thermal softening leading to zones of localized plastic strain. For shock loading applications Nguyen et al [57] using mesoscale models have assessed the effect of misorientation angle on deformation and have concluded that misorientation angle alone is not sufficient descriptor. By decomposing the angle into tilt and twist grain boundaries and they have found that tilt angles are dominantly related to the apparent strength of a GB. The effect of CSL boundaries on CS ability has also been recently discussed [58].
Nano-indentation measurements showed a higher hardness value and stiffness for the C.A powder corresponding to its grain structure. Nano hardness, which reflects dislocation mobility has been associated with CS deposit ability and DE (Ref 16). The higher fraction of HAGB in the C.A 316 powder could limit the dislocation mobility resulting in higher nano-hardness. Thus, this increase in resistance could explain the lower DE of the C.A powder compared to the G.A powder. A higher stiffness value of the C.A powder can also be correlated to the HAGB fraction shown in Figure 8c, f and Figure 9a giving rise to the different deposition behavior.
Conclusions
The atomization techniques had a significant impact on the deforming mechanisms for a cold spray. Despite similar morphological characteristics C.A powders had a significantly lesser DE compared to G.A powders. Analysis of the C.A coatings revealed a lack of bonding between C.A particles and was evident from its lower bond-strength. Aside from the slightly larger powder size difference (which was identified much later in the investigation), EBSD and Nanoindentation measurements revealed some distinct differences between the powders. This study found powder nano-indentation to be a reliable technique for evaluation of cold-spray-ability of the material in terms of its deformability. Further evaluation of the analyze the EBSD data into tilt, twist and CSL boundaries in under review and will be reported in future studies. Further development in powder shape determination techniques using µCT could yield more insight into powder properties for cold spray. Low CS deposition efficiency C.A powders requires further validation in terms of other materials, manufacturers, and production lots. A detailed microstructure evaluation of the cold-sprayed coatings would provide further supplementary information.
The obtained results can be connected to the variability of the production route of the powders. The microstructure in the C.A powders corresponds to the higher cooling/solidification rates used during manufacturing. This in-turn impacted its mechanical properties, internal porosity, HAGB etc. Having powder atomization process parameters in hand (which are proprietary to the manufacturer) could go a long way towards understanding and optimization of powders for cold spray. This study thus provides a comprehensive information to the powder precursor assessment using state of the art characterization techniques. Such assessment can help better understand the impact on their respective coated materials for techniques like cold spray. This will also help analyze the commercial feasibility of cold spray using all available production routes for powder manufacturing.
Acknowledgments
This research did not receive any specific grant from funding agencies in the public, commercial, or not-for-profit sectors. We acknowledge the University of Michigan College of Engineering for financial support and the Michigan Center for Materials Characterization (MC)2 for use of the instruments and staff assistance. Folks from Microtrac MRB: Bernie Lucansky and James Pastore for assisting with the SYNC laser diffraction measurements. We thank the management at Somnio Global LLC, Novi Michigan for providing the resources to carry out the deposition and William Walker for assistance with metallographic preparation.
Conflicts of Interest
This research did not receive any specific grant from funding agencies in the public, commercial, or not-for-profit sectors. On behalf of all authors, the corresponding author states that there is no conflict of interest in any aspects of the manuscript.
References
- Champagne, V.K. Introduction. In Practical Cold Spray; Champagne Jr. Victor Kenneth and Ozdemir, O.C. and N.A., Ed.; Springer International Publishing: Cham, 2021; pp. 1–25. ISBN 978-3-030-70056-0. [Google Scholar]
- Champagne, V.K.; Papyrin, A.; Smith, M.F.; Karthikeyan, J.; Celotto, S.; Pattison, J.; Ho, J.S.; Johnson, A.N.; O’Neill, W.; Brodmann, F.J.; et al. The Cold Spray Materials Deposition Process; Woodhead Publishing, 2007.
- Papyrin, A.; Kosarev, V.; Klinkov, S.; Alkimov, A.; Fomin, V. Cold Spray Technoloigy; Elsevier, 2007.
- Hassani-Gangaraj, M.; Veysset, D.; Champagne, V.K.; Nelson, K.A.; Schuh, C.A. Adiabatic Shear Instability Is Not Necessary for Adhesion in Cold Spray. Acta Mater 2018, 158, 430–439. [Google Scholar] [CrossRef]
- Nikbakht, R.; Saadati, M.; Kim, T.-S.; Jahazi, M.; Kim, H.S.; Jodoin, B. Cold Spray Deposition Characteristic and Bonding of CrMnCoFeNi High Entropy Alloy. Surf Coat Technol 2021, 425, 127748. [Google Scholar] [CrossRef]
- Hussain, T.; McCartney, D.G.; Shipway, P.H.; Zhang, D. Bonding Mechanisms in Cold Spraying: The Contributions of Metallurgical and Mechanical Components. Journal of Thermal Spray Technology 2009, 18, 364–379. [Google Scholar] [CrossRef]
- Rahmati, S.; Ghaei, A. The Use of Particle/Substrate Material Models in Simulation of Cold-Gas Dynamic-Spray Process. Journal of Thermal Spray Technology 2014, 23, 530–540. [Google Scholar] [CrossRef]
- Rahmati, S.; Veiga, R.G.A.; Zúñiga, A.; Jodoin, B. A Numerical Approach to Study the Oxide Layer Effect on Adhesion in Cold Spray. Journal of Thermal Spray Technology 2021, 30, 1777–1791. [Google Scholar] [CrossRef]
- Zhao, Y.; Gao, Y. Investigation of Oxidation Behavior and Evolvement of Grain Morphology of Fe-Cr-AI Alloy at 1200°C and 1300°C. Proceedings of the International Thermal Spray Conference 2015, 2, 1060–1066. [Google Scholar]
- Li, C.-J.; Li, W.-Y.; Liao, H. Examination of the Critical Velocity for Deposition of Particles in Cold Spraying. Journal of Thermal Spray Technology 2006, 15, 212–222. [Google Scholar] [CrossRef]
- Yin, S.; Cizek, J.; Yan, X.; Lupoi, R. Annealing Strategies for Enhancing Mechanical Properties of Additively Manufactured 316L Stainless Steel Deposited by Cold Spray. Surf Coat Technol 2019, 370, 353–361. [Google Scholar] [CrossRef]
- Jodoin, B.; Ajdelsztajn, L.; Sansoucy, E.; Zúñiga, a.; Richer, P.; Lavernia, E.J.J. Effect of Particle Size, Morphology, and Hardness on Cold Gas Dynamic Sprayed Aluminum Alloy Coatings. Surf Coat Technol 2006, 201, 3422–3429. [Google Scholar] [CrossRef]
- Spencer, K.; Zhang, M.-X. Optimisation of Stainless Steel Cold Spray Coatings Using Mixed Particle Size Distributions. Surf Coat Technol 2011, 205, 5135–5140. [Google Scholar] [CrossRef]
- Birt, A.M.; Champagne, V.K.; Sisson, R.D.; Apelian, D. Microstructural Analysis of Ti-6Al-4V Powder for Cold Gas Dynamic Spray Applications. Advanced Powder Technology 2015, 26, 1335–1347. [Google Scholar] [CrossRef]
- Bhattiprolu, V.S.; Johnson, K.W.; Crawford, G.A. Influence of Powder Microstructure on the Microstructural Evolution of As-Sprayed and Heat Treated Cold-Sprayed Ti-6Al-4V Coatings. Journal of Thermal Spray Technology 2019, 28, 174–188. [Google Scholar] [CrossRef]
- Nastic, A.; MacDonald, D.; Jodoin, B. The Influence of Feedstock Powder; Springer Nature, 2020. [Google Scholar]
- Brewer, L.N.; Schiel, J.F.; Menon, E.S.K.; Woo, D.J. The Connections between Powder Variability and Coating Microstructures for Cold Spray Deposition of Austenitic Stainless Steel. Surf Coat Technol 2018, 334, 50–60. [Google Scholar] [CrossRef]
- Assadi, H.; Gärtner, F. Particle Compression Test: A Key Step towards Tailoring of Feedstock Powder for Cold Spraying. Coatings 2020, 10. [Google Scholar] [CrossRef]
- Hussain, T.; Yue, S.; Li, C.J. Characteristics of Feedstock Materials. In Modern Cold Spray: Materials, Process, and Applications; 2015 ISBN 9783319167725.
- Han, T.; Zhao, Z.; Gillispie, B. a.; Smith, J.R. Effects of Spray Conditions on Coating Formation by the Kinetic Spray Process. Journal of Thermal Spray Technology 2005, 14, 373–383. [Google Scholar] [CrossRef]
- Jeandin, M.; Rolland, G.; Descurninges, L.L.; Berger, M.H. Which Powders for Cold Spray? Surface Engineering 2014, 30, 291–298. [Google Scholar] [CrossRef]
- Varadaraajan, V.; Mohanty, P. Design and Optimization of Rectangular Cold Spray Nozzle: Radial Injection Angle, Expansion Ratio and Traverse Speed. Surf Coat Technol 2017, 316. [Google Scholar] [CrossRef]
- Chu, X.; Che, H.; Vo, P.; Chakrabarty, R.; Sun, B.; Song, J.; Yue, S. Understanding the Cold Spray Deposition Efficiencies of 316L/Fe Mixed Powders by Performing Splat Tests onto as-Polished Coatings. Surf Coat Technol 2017, 324, 353–360. [Google Scholar] [CrossRef]
- Varadaraajan, V. Coaxial Laser Assisted Cold Spray Technology. In Proceedings of the International Thermal Spray Conference and Exposition (ITSC); 2015.
- Fukanuma, H.; Ohno, N.; Sun, B.; Huang, R. 1830 A Study of Stainless Steel Deposits Sprayed by Cold Spray Process. The proceedings of the JSME annual meeting 2005, 2005.6, 257–258. [Google Scholar] [CrossRef]
- Erwin Industries Centrifugal Atomization Technology,.
- Valls Anglés ISAAC Centrifugal Atomization of Iron-Based Alloys 2019.
- Totten, G.E. Handbook of Residual Stress and Deformation of Steel; ASM international, 2002; ISBN 1615032274.
- Allmann, R.; Hinek, R. The Introduction of Structure Types into the Inorganic Crystal Structure Database ICSD. Acta Crystallogr A 2007, 63, 412–417. [Google Scholar] [CrossRef]
- Sousa, B.C.; Gleason, M.A.; Haddad, B.; Champagne, V.K.; Nardi, A.T.; Cote, D.L. Nanomechanical Characterization for Cold Spray: From Feedstock to Consolidated Material Properties. Metals (Basel) 2020, 10, 1195. [Google Scholar] [CrossRef]
- ASTM Standard Test Method for Adhesion or Cohesion Strength of Thermal Spray Coatings 2021.
- Wu, K.; Liu, G.; Hu, B.; Li, F.; Zhang, Y.; Tao, Y.; Liu, J. Solidification Characterization of a New Rapidly Solidified Ni–Cr–Co Based Superalloy. Mater Charact 2012, 73, 68–76. [Google Scholar] [CrossRef]
- Leicht, A. Aspects of Building Geometry and Powder Characteristics in Powder Bed Fusion, Gothenburg, 2018.
- Borchers, C.; Schmidt, T.; Gärtner, F.; Kreye, H. High Strain Rate Deformation Microstructures of Stainless Steel 316L by Cold Spraying and Explosive Powder Compaction. Applied Physics A 2008, 90, 517–526. [Google Scholar] [CrossRef]
- Rokni, M.R.; Nutt, S.R.; Widener, C.A.; Champagne, V.K.; Hrabe, R.H. Review of Relationship Between Particle Deformation, Coating Microstructure, and Properties in High-Pressure Cold Spray. Journal of Thermal Spray Technology 2017, 26, 1308–1355. [Google Scholar] [CrossRef]
- Das, A.; Sunil, S.; Kapoor, R. Effect of Cooling Rate on the Microstructure of a Pressure Vessel Steel. Metallography, Microstructure, and Analysis 2019, 8, 795–805. [Google Scholar] [CrossRef]
- Spencer, K.; Zhang, M.-X. Optimisation of Stainless Steel Cold Spray Coatings Using Mixed Particle Size Distributions. Surf Coat Technol 2011, 205, 5135–5140. [Google Scholar] [CrossRef]
- Burak, D. Topuz Mehmet Cold Spray Deposition of SS316L Powders on Al5052 Substrates and Their Potential Using for Biomedical Applications. International Journal of Materials and Metallurgical Engineering 2016, 10. [Google Scholar]
- Adachi, S.; Ueda, N. Effect of Cold-Spray Conditions Using a Nitrogen Propellant Gas on AISI 316L Stainless Steel-Coating Microstructures. Coatings 2017, 7, 87. [Google Scholar] [CrossRef]
- Spencer, K.; Fabijanic, D.M.; Zhang, M.-X. The Influence of Al2O3 Reinforcement on the Properties of Stainless Steel Cold Spray Coatings. Surf Coat Technol 2012, 206, 3275–3282. [Google Scholar] [CrossRef]
- Coddet, P.; Verdy, C.; Coddet, C.; Debray, F.; Lecouturier, F. Mechanical Properties of Thick 304L Stainless Steel Deposits Processed by He Cold Spray. Surf Coat Technol 2015, 277, 74–80. [Google Scholar] [CrossRef]
- Kotoban, D.; Grigoriev, S.; Okunkova, A.; Sova, A. Influence of a Shape of Single Track on Deposition Efficiency of 316L Stainless Steel Powder in Cold Spray. Surf Coat Technol 2017, 309, 951–958. [Google Scholar] [CrossRef]
- Roa, J.J.; Fargas, G.; Mateo, A.; Jiménez-Piqué, E. Dependence of Nanoindentation Hardness with Crystallographic Orientation of Austenite Grains in Metastable Stainless Steels. Materials Science and Engineering: A 2015, 645, 188–195. [Google Scholar] [CrossRef]
- Dosta, S.; Bolelli, G.; Candeli, A.; Lusvarghi, L.; Cano, I.G.; Guilemany, J.M. Plastic Deformation Phenomena during Cold Spray Impact of WC-Co Particles onto Metal Substrates. Acta Mater 2017, 124, 173–181. [Google Scholar] [CrossRef]
- Grujicic, M.; Saylor, J.R.; Beasley, D.E.; DeRosset, W.S.; Helfritch, D. Computational Analysis of the Interfacial Bonding between Feed-Powder Particles and the Substrate in the Cold-Gas Dynamic-Spray Process. Appl Surf Sci 2003, 219, 211–227. [Google Scholar] [CrossRef]
- Moridi, A. Powder Consolidation Using Cold Spray; Springer International Publishing: Cham, 2017; ISBN 978-3-319-29961-7. [Google Scholar]
- Jenkins, R.; Snyder, R.L. Introduction to X-Ray Powder Diffractometry; John Wiley & Sons, Inc.: Hoboken, NJ, USA, 1996; ISBN 9781118520994. [Google Scholar]
- Lima, R.S.; Karthikeyan, J.; Kay, C.M.; Lindemann, J.; Berndt, C.C. Microstructural Characteristics of Cold-Sprayed Nanostructured WC–Co Coatings. Thin Solid Films 2002, 416, 129–135. [Google Scholar] [CrossRef]
- Dabney, T.; Johnson, G.; Yeom, H.; Maier, B.; Walters, J.; Sridharan, K. Experimental Evaluation of Cold Spray FeCrAl Alloys Coated Zirconium-Alloy for Potential Accident Tolerant Fuel Cladding. Nuclear Materials and Energy 2019, 21, 100715. [Google Scholar] [CrossRef]
- SFC Koenig Hardness Conversion Table. Available online: http://www.sfckoenig.com/wp-content/uploads/2018/08/hardness-conversion-table_EN.pdf (accessed on 6 December 2021).
- Barnes, J.; Champagne, V.; Ballard, D.; Eden, T.J.; Shoffner, B.; Potter, J.K.; Wolfe, D.E. Mechanical and Microstructural Effects of Cold Spray Aluminum on Al 7075 Using Kinetic Metallization and Cold Spray Processes (Preprint); 2007.
- Jing, Z.; Dejun, K. Effect of Laser Remelting on Friction-Wear Behaviors of Cold Sprayed Al Coatings in 3.5% NaCl Solution. Materials 2018, 11, 283. [Google Scholar] [CrossRef] [PubMed]
- Varadaraajan, V.; Mohanty, P.S. Role of Precursor Properties in Cold Spray Coating Process 2015.
- Solomon, S. Additive Manufacturing Technology - 3D Printing & Design - The 4th Industrial Revolution: 3D Printing & Design; 2020; Vol. 1;
- Suresh, S.; Lee, S.-W.; Aindow, M.; Brody, H.D.; Champagne, V.K.; Dongare, A.M. Mesoscale Modeling of Jet Initiation Behavior and Microstructural Evolution during Cold Spray Single Particle Impact. Acta Mater 2020, 182, 197–206. [Google Scholar] [CrossRef]
- Guha, R.D.; Sharma, A.J.; Diwan, P.; Khanikar, P. Effect of Grain Orientation on High Strain-Rate Plastic Deformation. Procedia Eng 2017, 173, 1048–1055. [Google Scholar] [CrossRef]
- Nguyen, T.; Luscher, D.J.; Wilkerson, J.W. The Role of Elastic and Plastic Anisotropy in Intergranular Spall Failure. Acta Mater 2019, 168, 1–12. [Google Scholar] [CrossRef]
- Tam, J.; Li, W.; Yu, B.; Poirier, D.; Legoux, J.-G.; Lin, P.; Palumbo, G.; Giallonardo, J.D.; Erb, U. Reducing Complex Microstructural Heterogeneity in Electrodeposited and Cold Sprayed Copper Coating Junctions. Surf Coat Technol 2020, 404, 126479. [Google Scholar] [CrossRef]
Figure 1.
Parameters of powders affecting cold-spray quality (considered for this study).
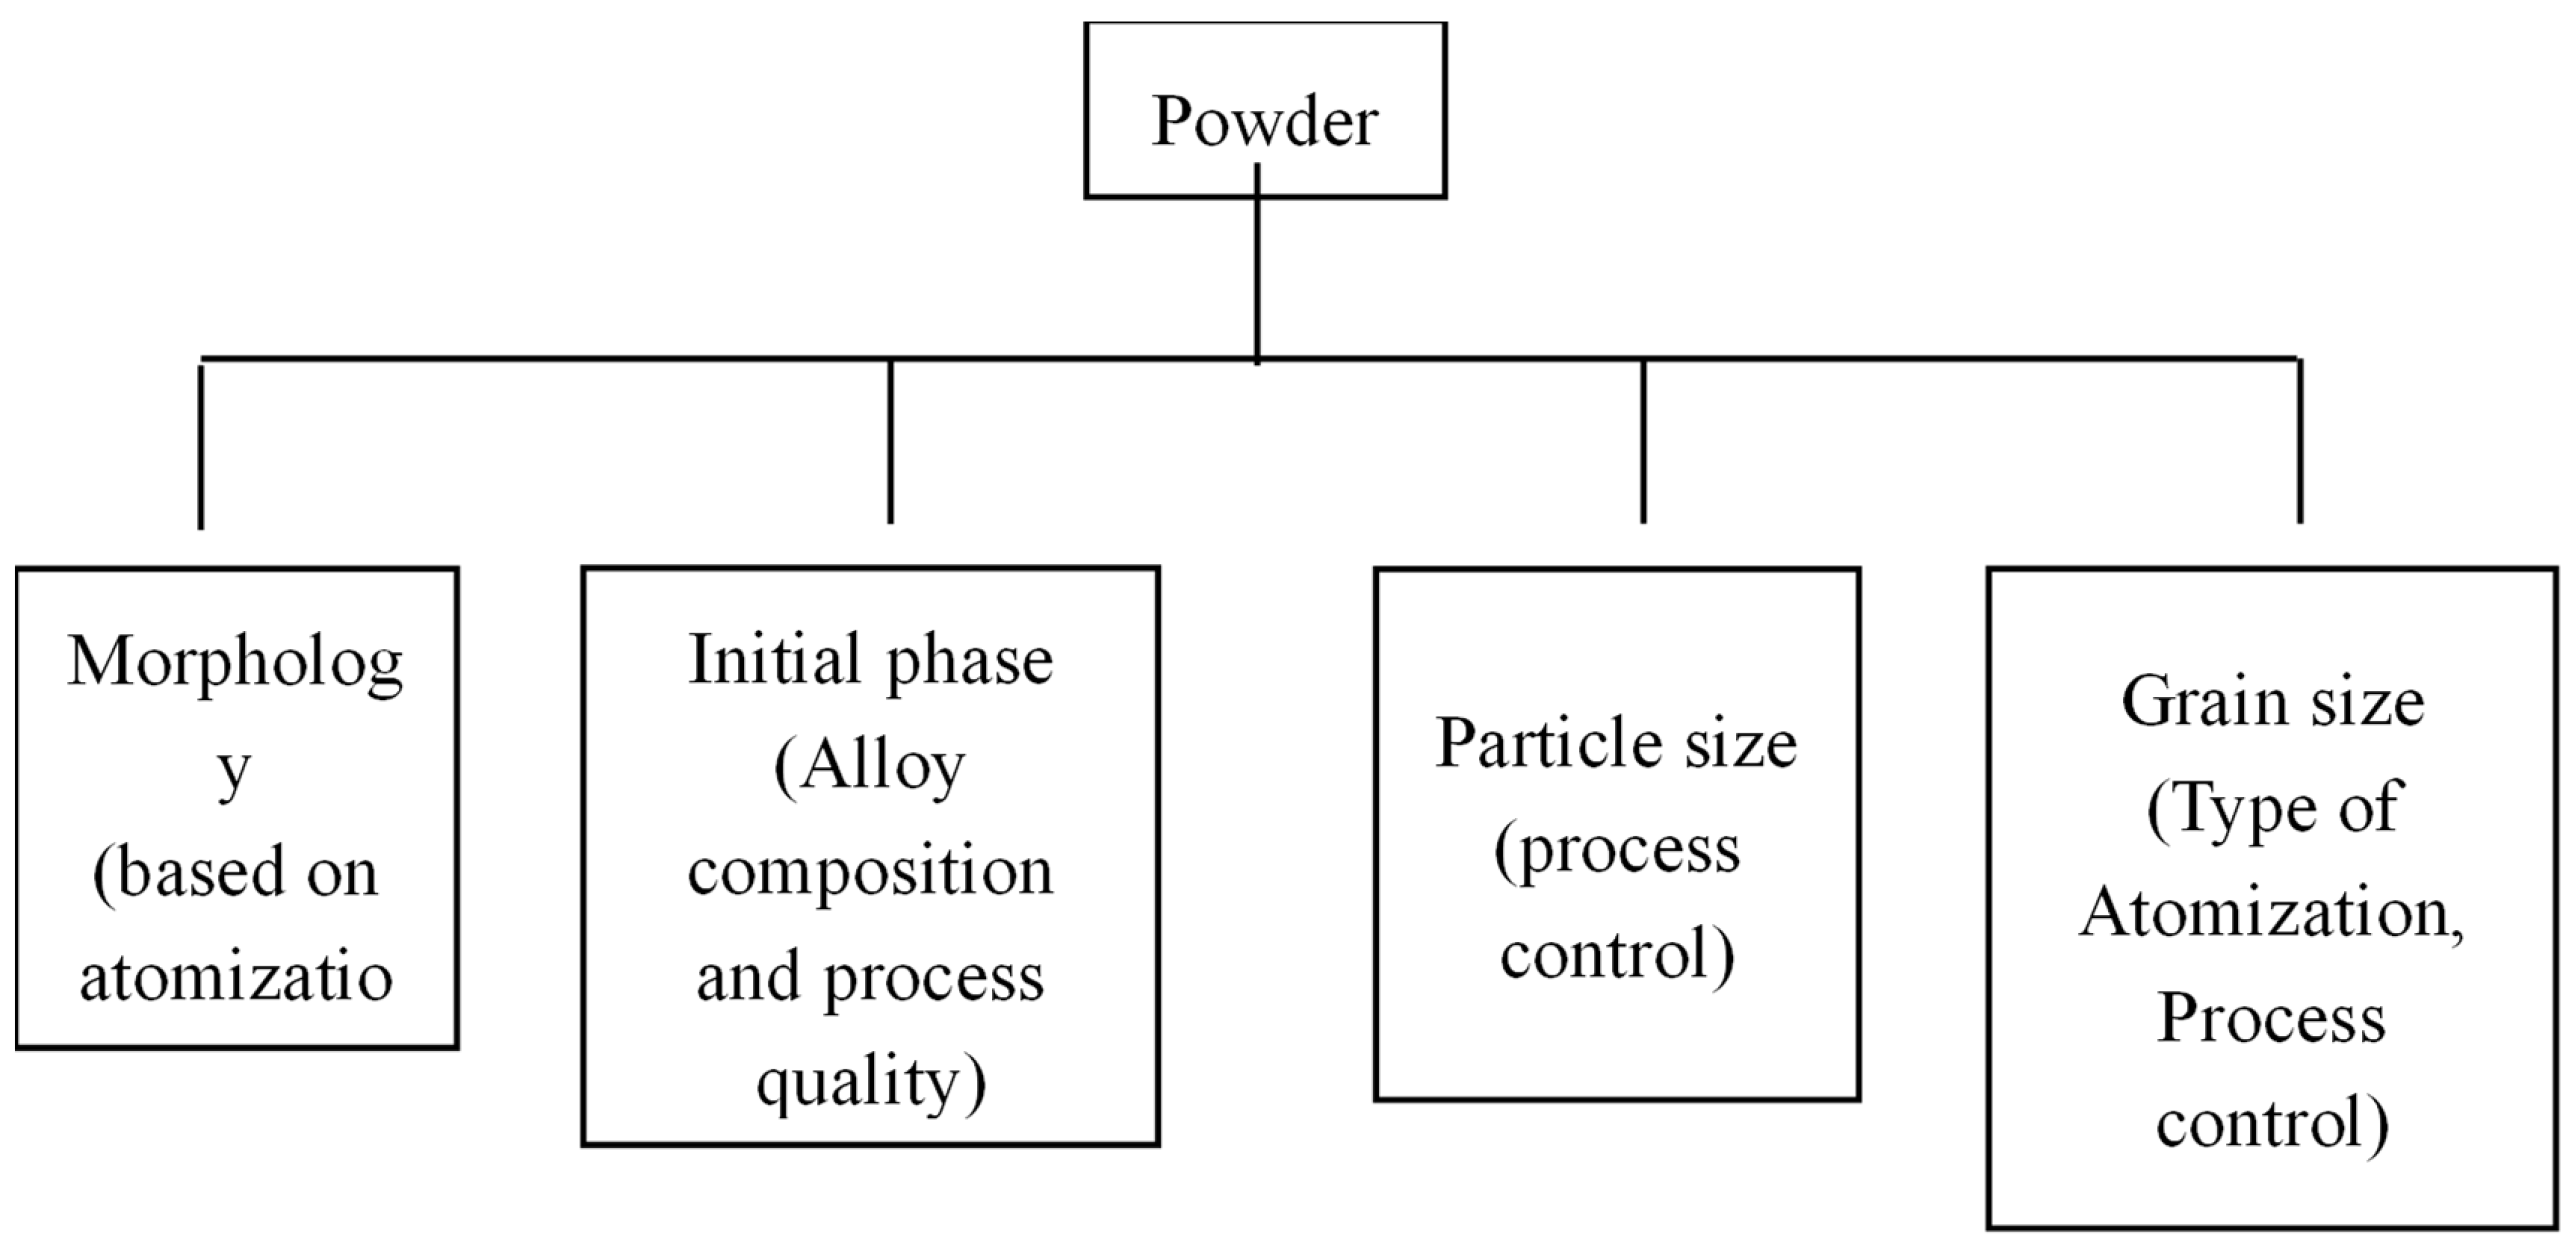
Figure 2.
BSE image and etched crossection at 500X, 2500X and 1000X magnification of G.A powder (a,b,c) and C.A powder (d,e,f).
Figure 2.
BSE image and etched crossection at 500X, 2500X and 1000X magnification of G.A powder (a,b,c) and C.A powder (d,e,f).
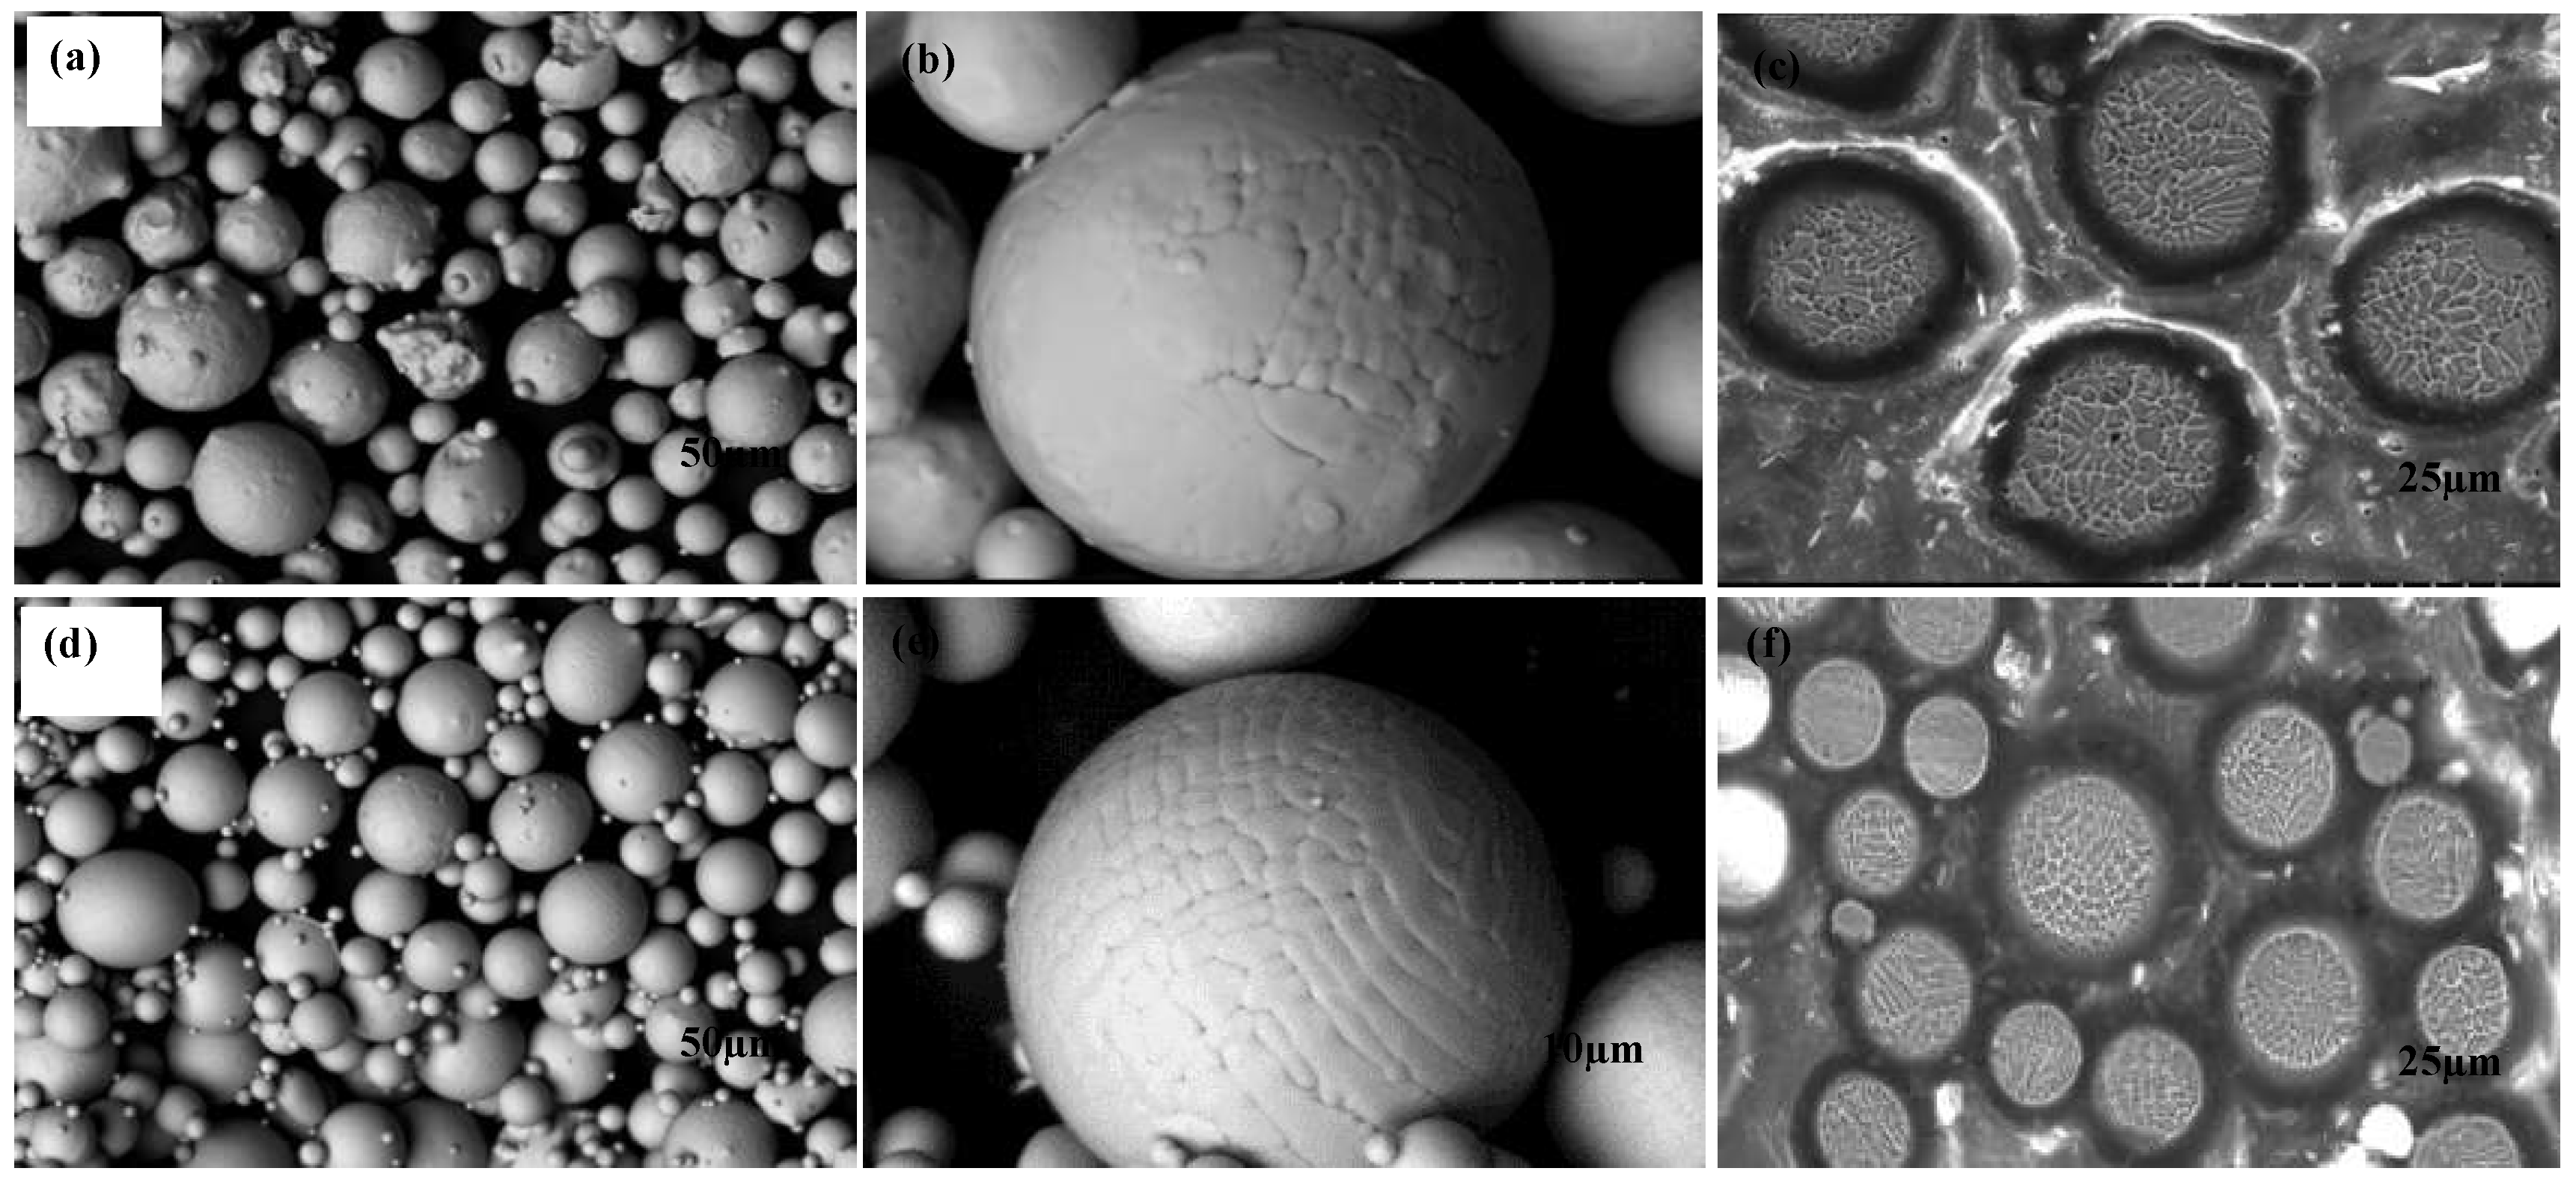
Figure 3.
Particle Size Distribution for both stainless steel powders obtained using laser diffraction and µCT techniques.
Figure 3.
Particle Size Distribution for both stainless steel powders obtained using laser diffraction and µCT techniques.
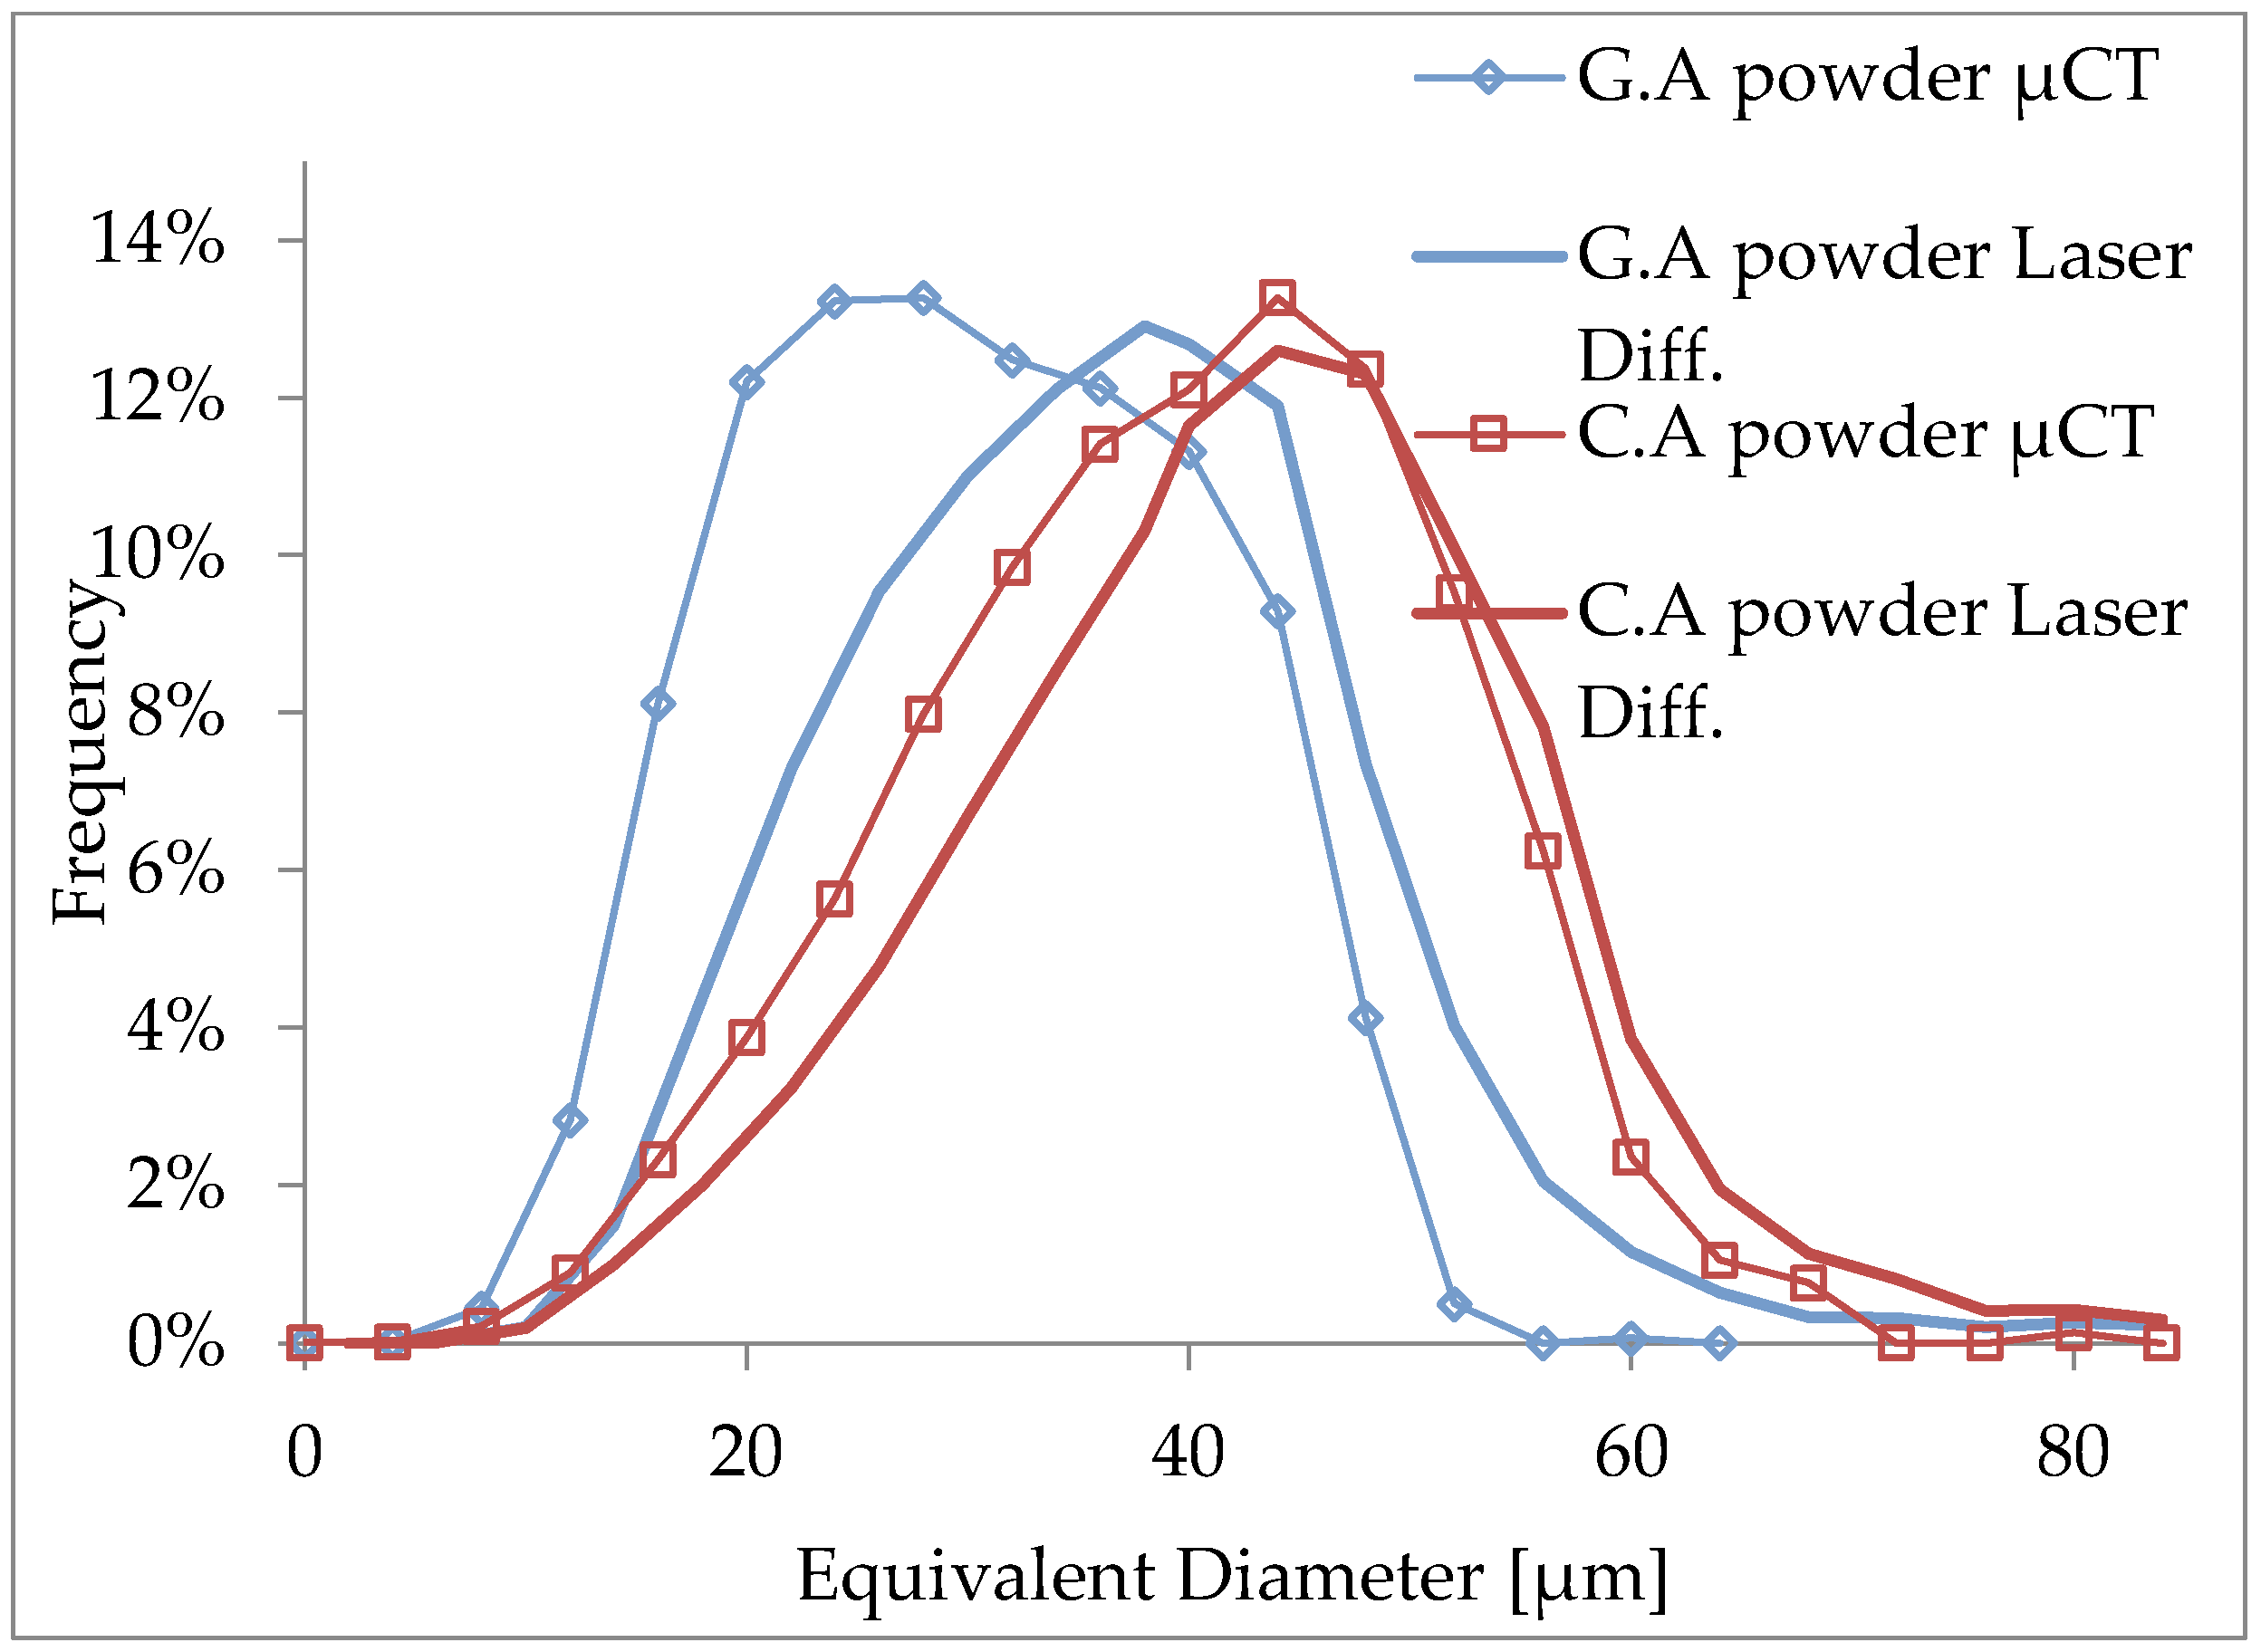
Figure 4.
Snapshot of the powder particles from the shape analyzer (a,b) roundness (c) and sphericity (d) distribution of both powders.
Figure 4.
Snapshot of the powder particles from the shape analyzer (a,b) roundness (c) and sphericity (d) distribution of both powders.
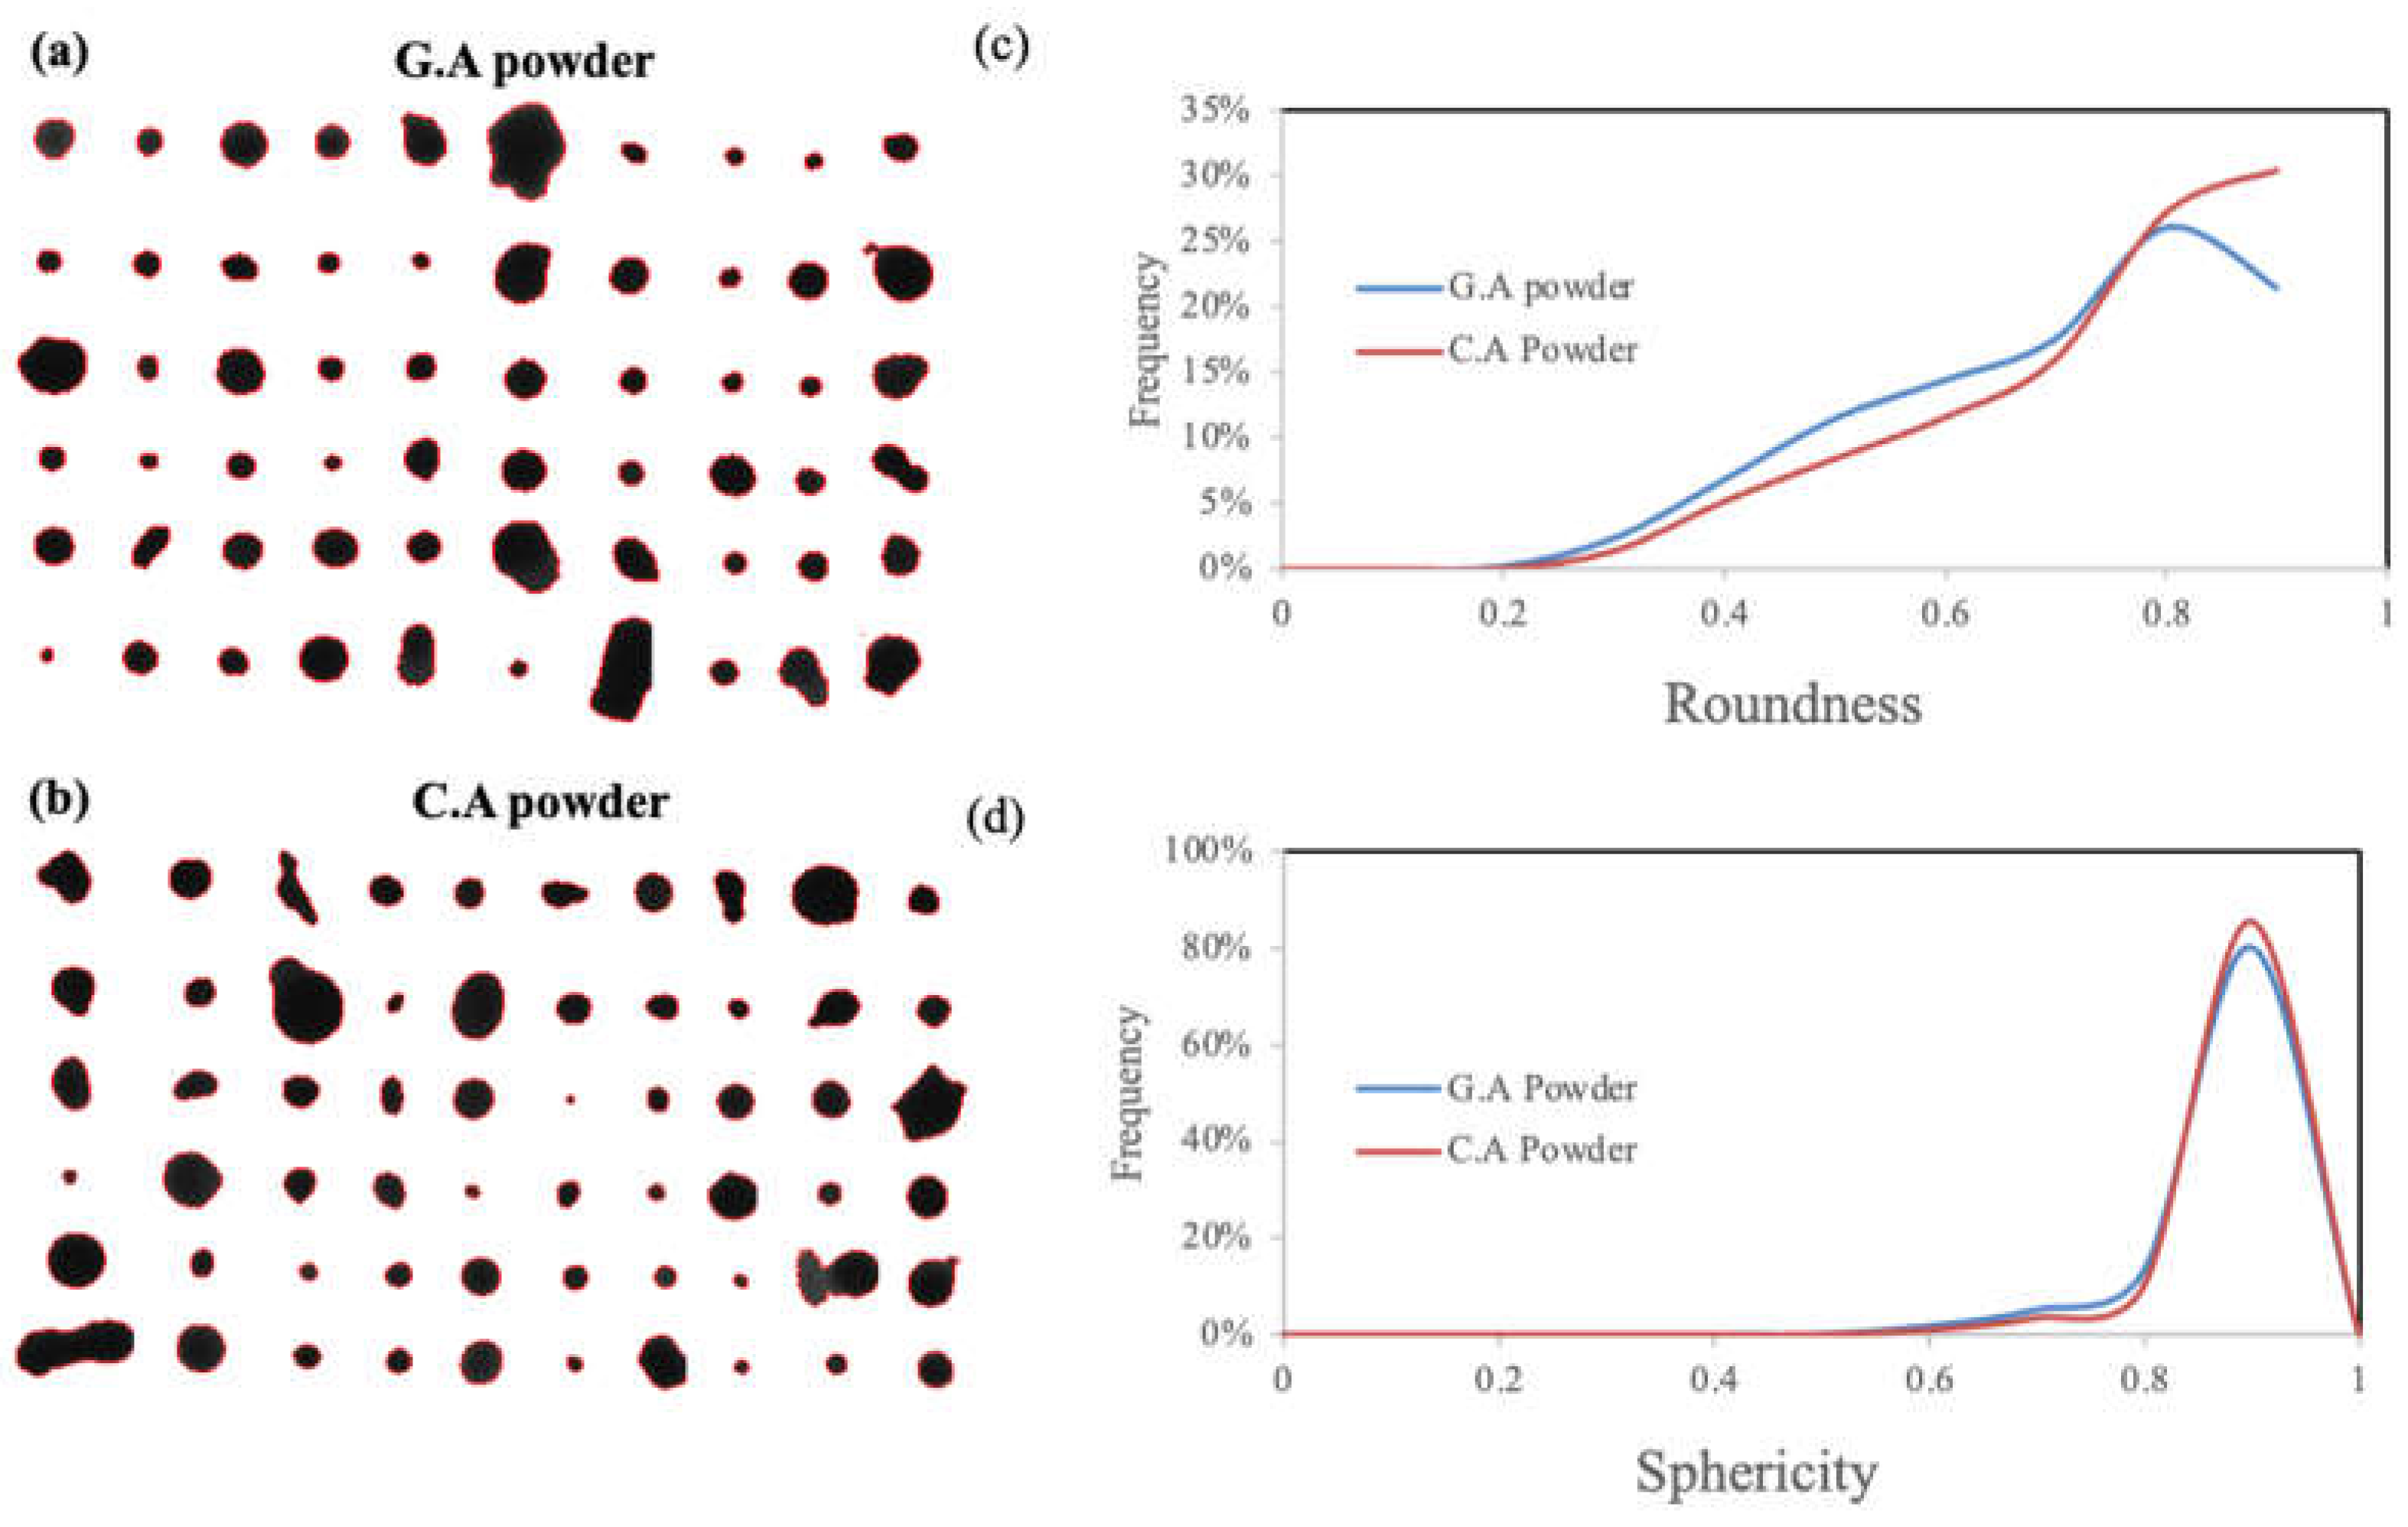
Figure 5.
Roundness and Sphericity distribution of the particles analyzed between 15-35um (a,b) and 35-60um (c,d).
Figure 5.
Roundness and Sphericity distribution of the particles analyzed between 15-35um (a,b) and 35-60um (c,d).
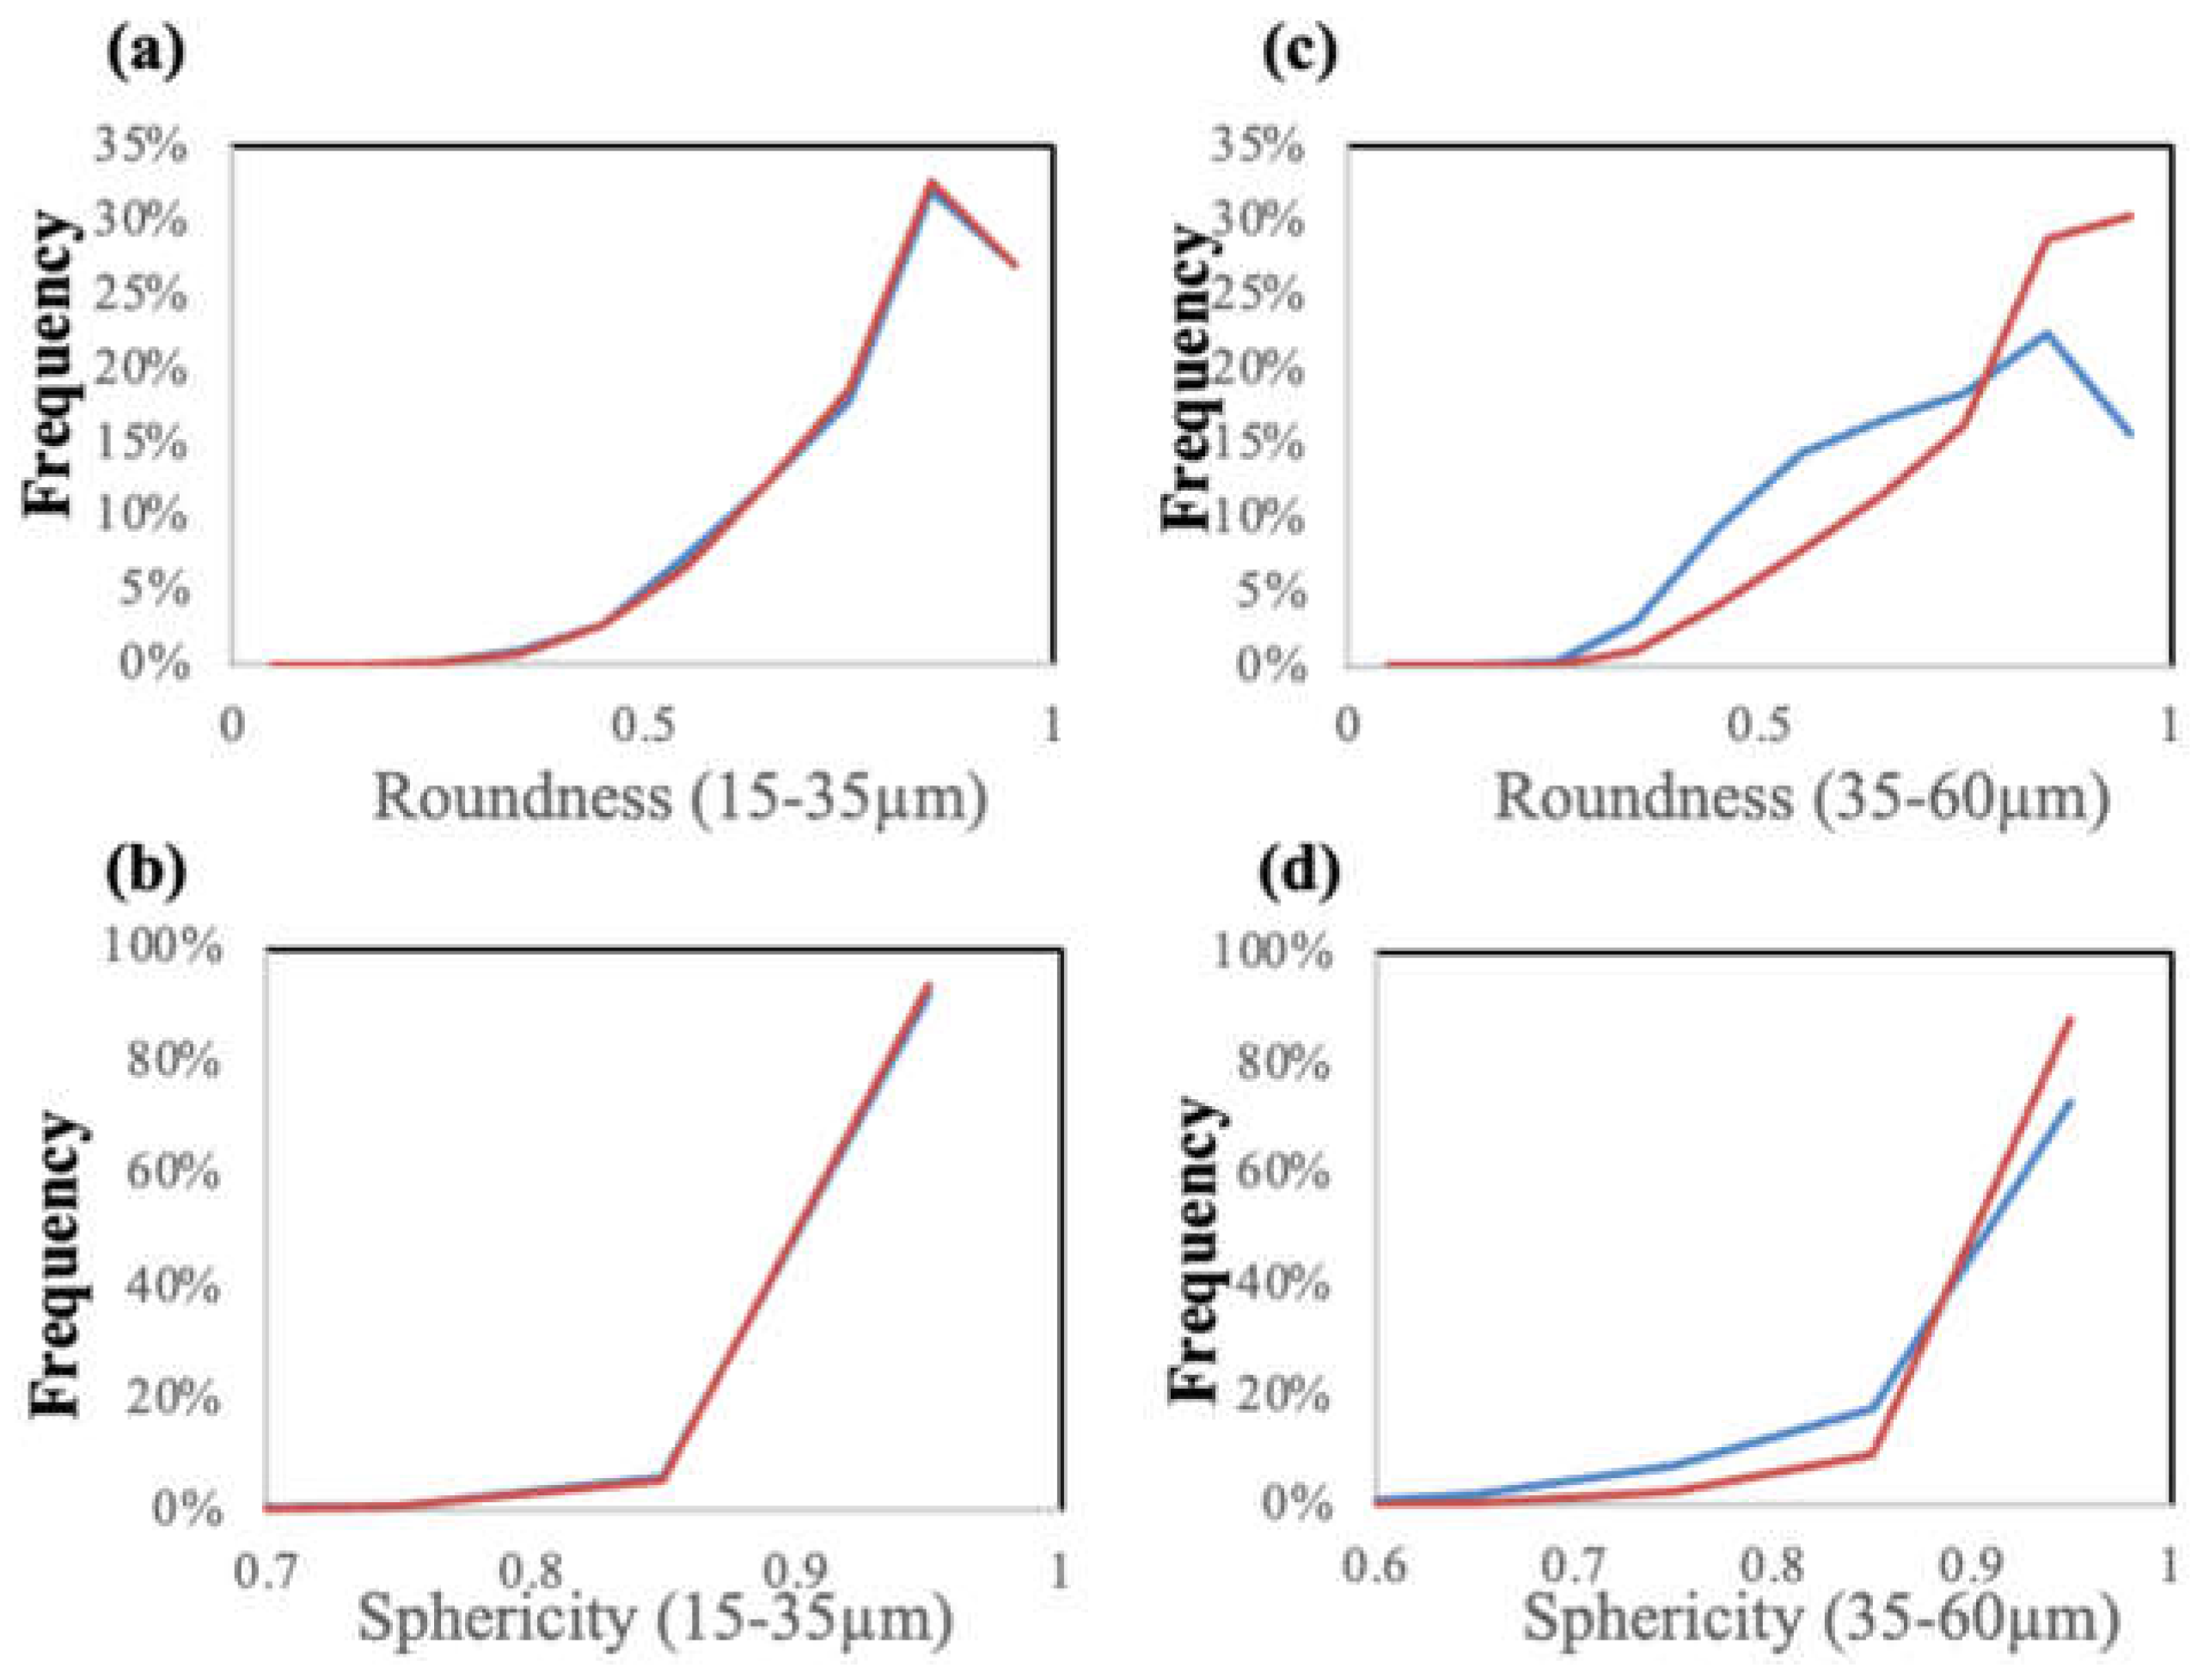
Figure 6.
µCT scan results – snapshot of the scan volume (a) G.A powder (b) C.A powder (c) Pore size distribution.
Figure 6.
µCT scan results – snapshot of the scan volume (a) G.A powder (b) C.A powder (c) Pore size distribution.
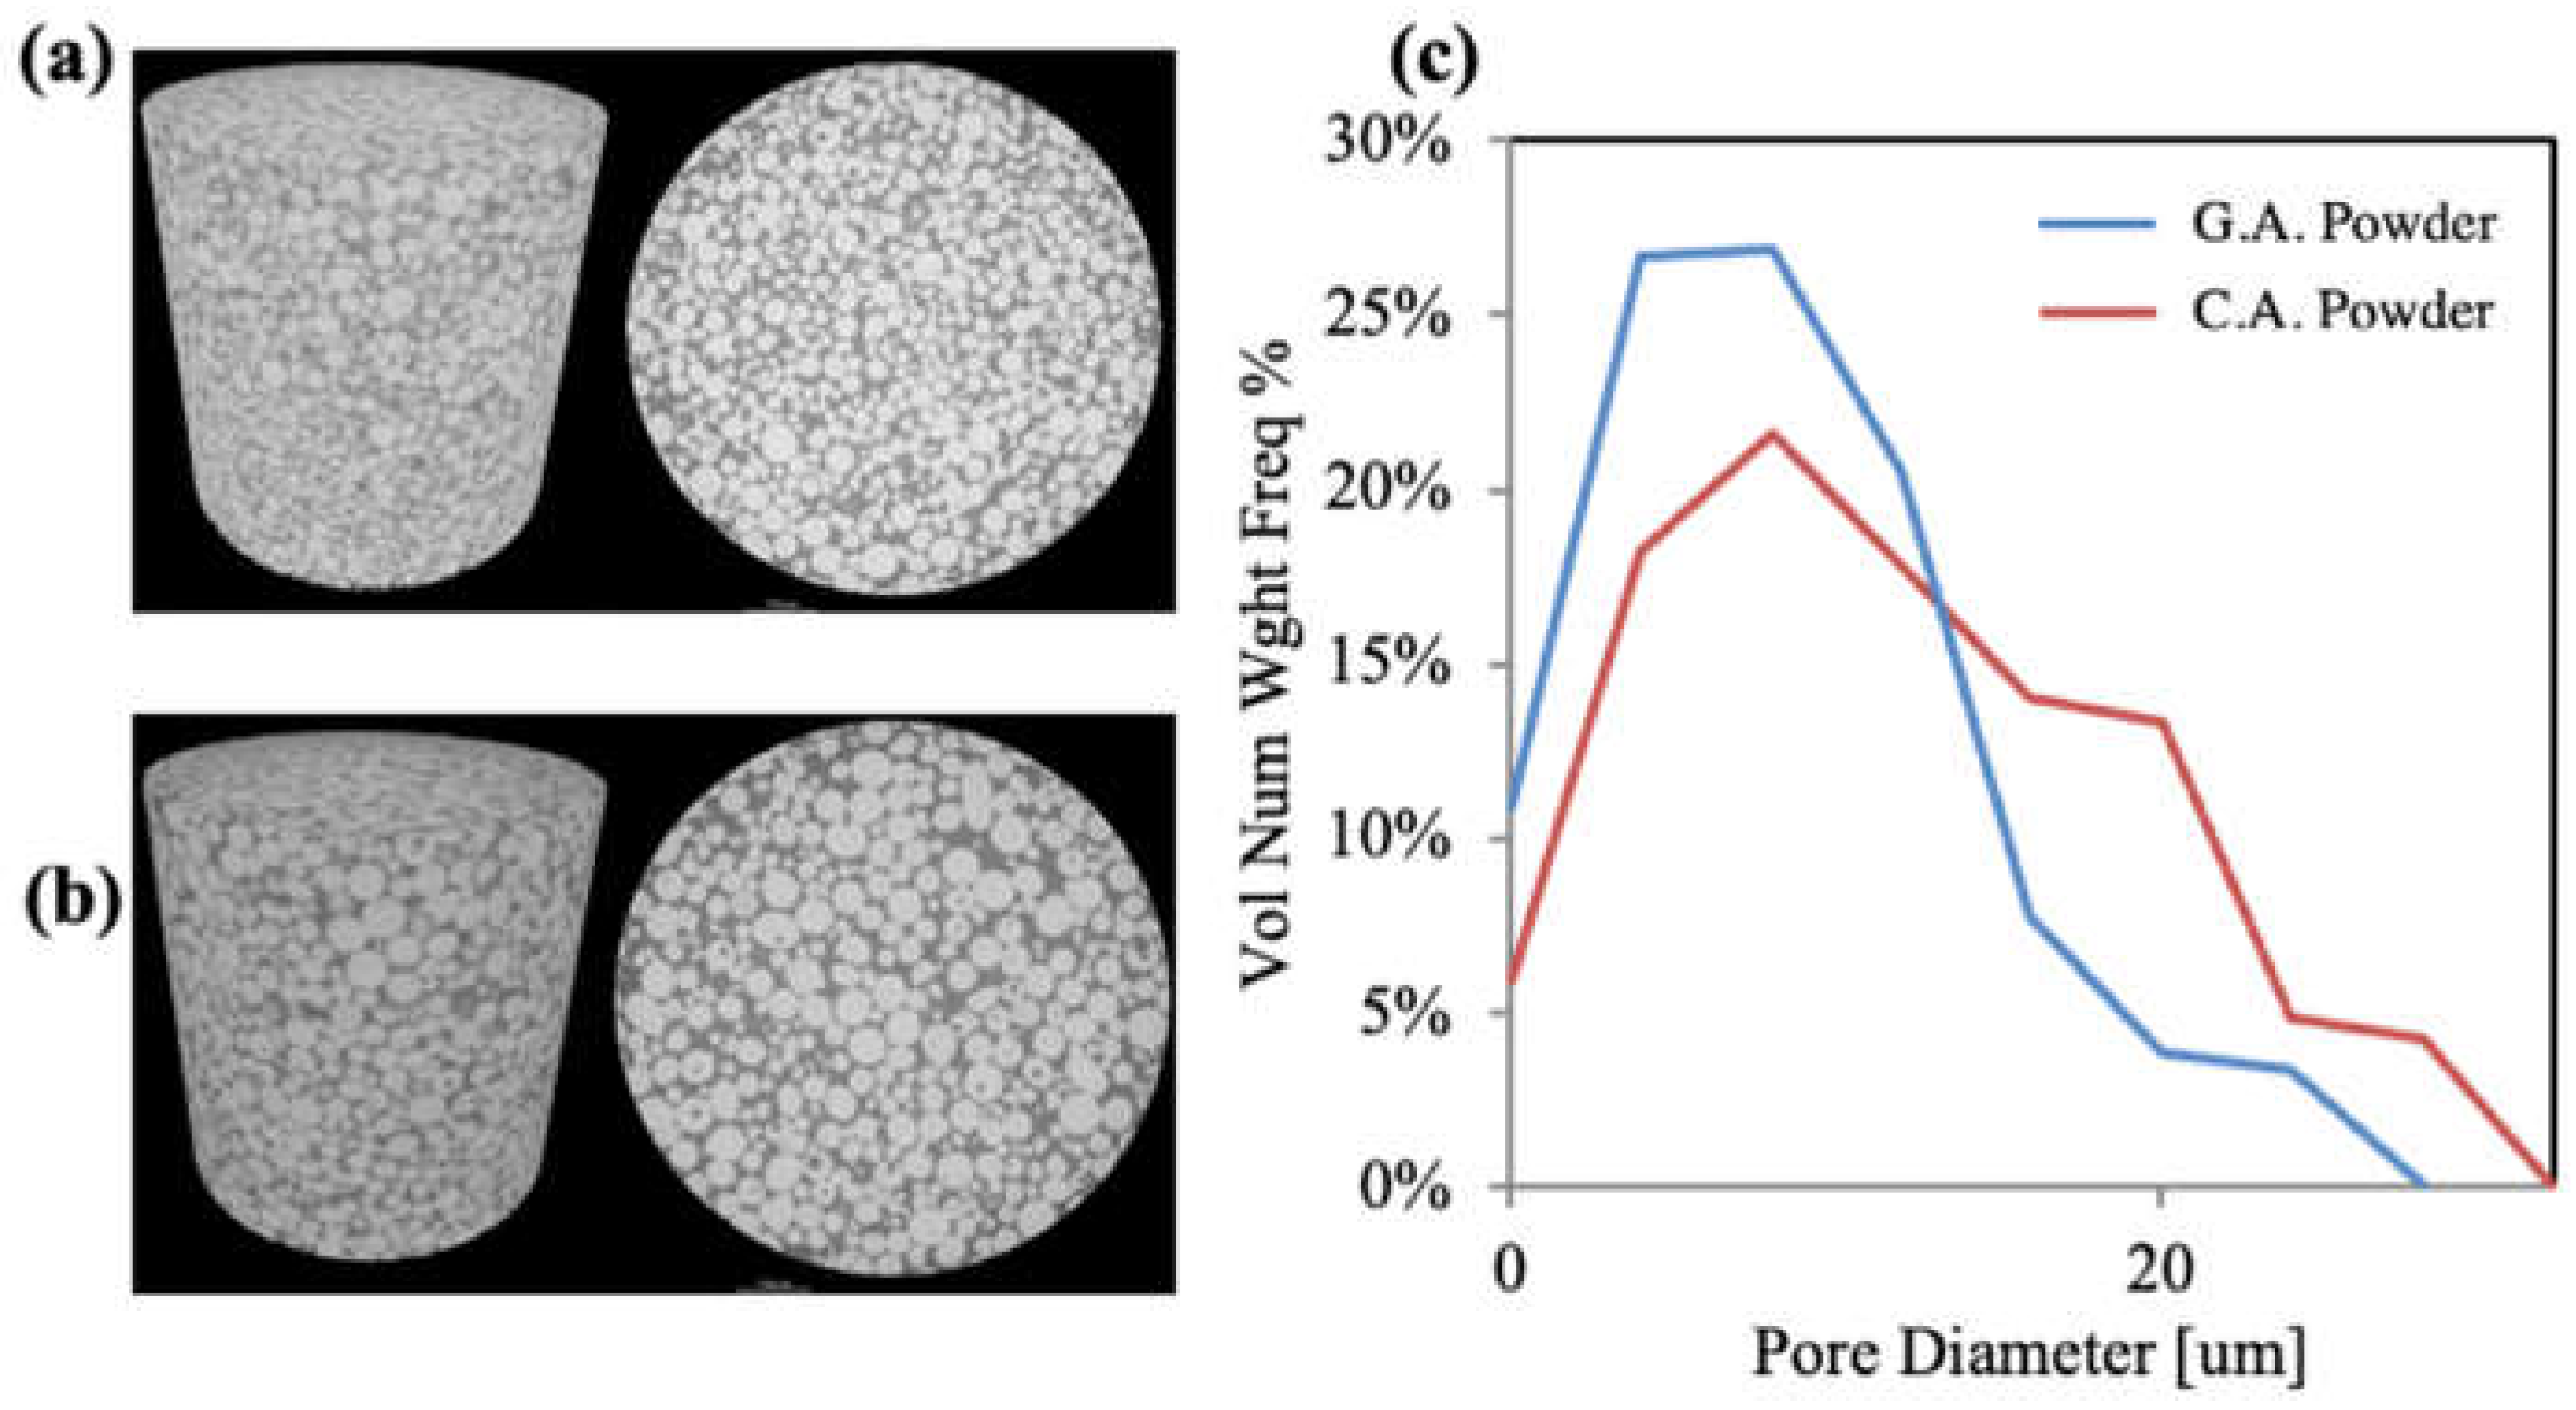
Figure 7.
XRD spectrum of as-received powders and their respective coatings.
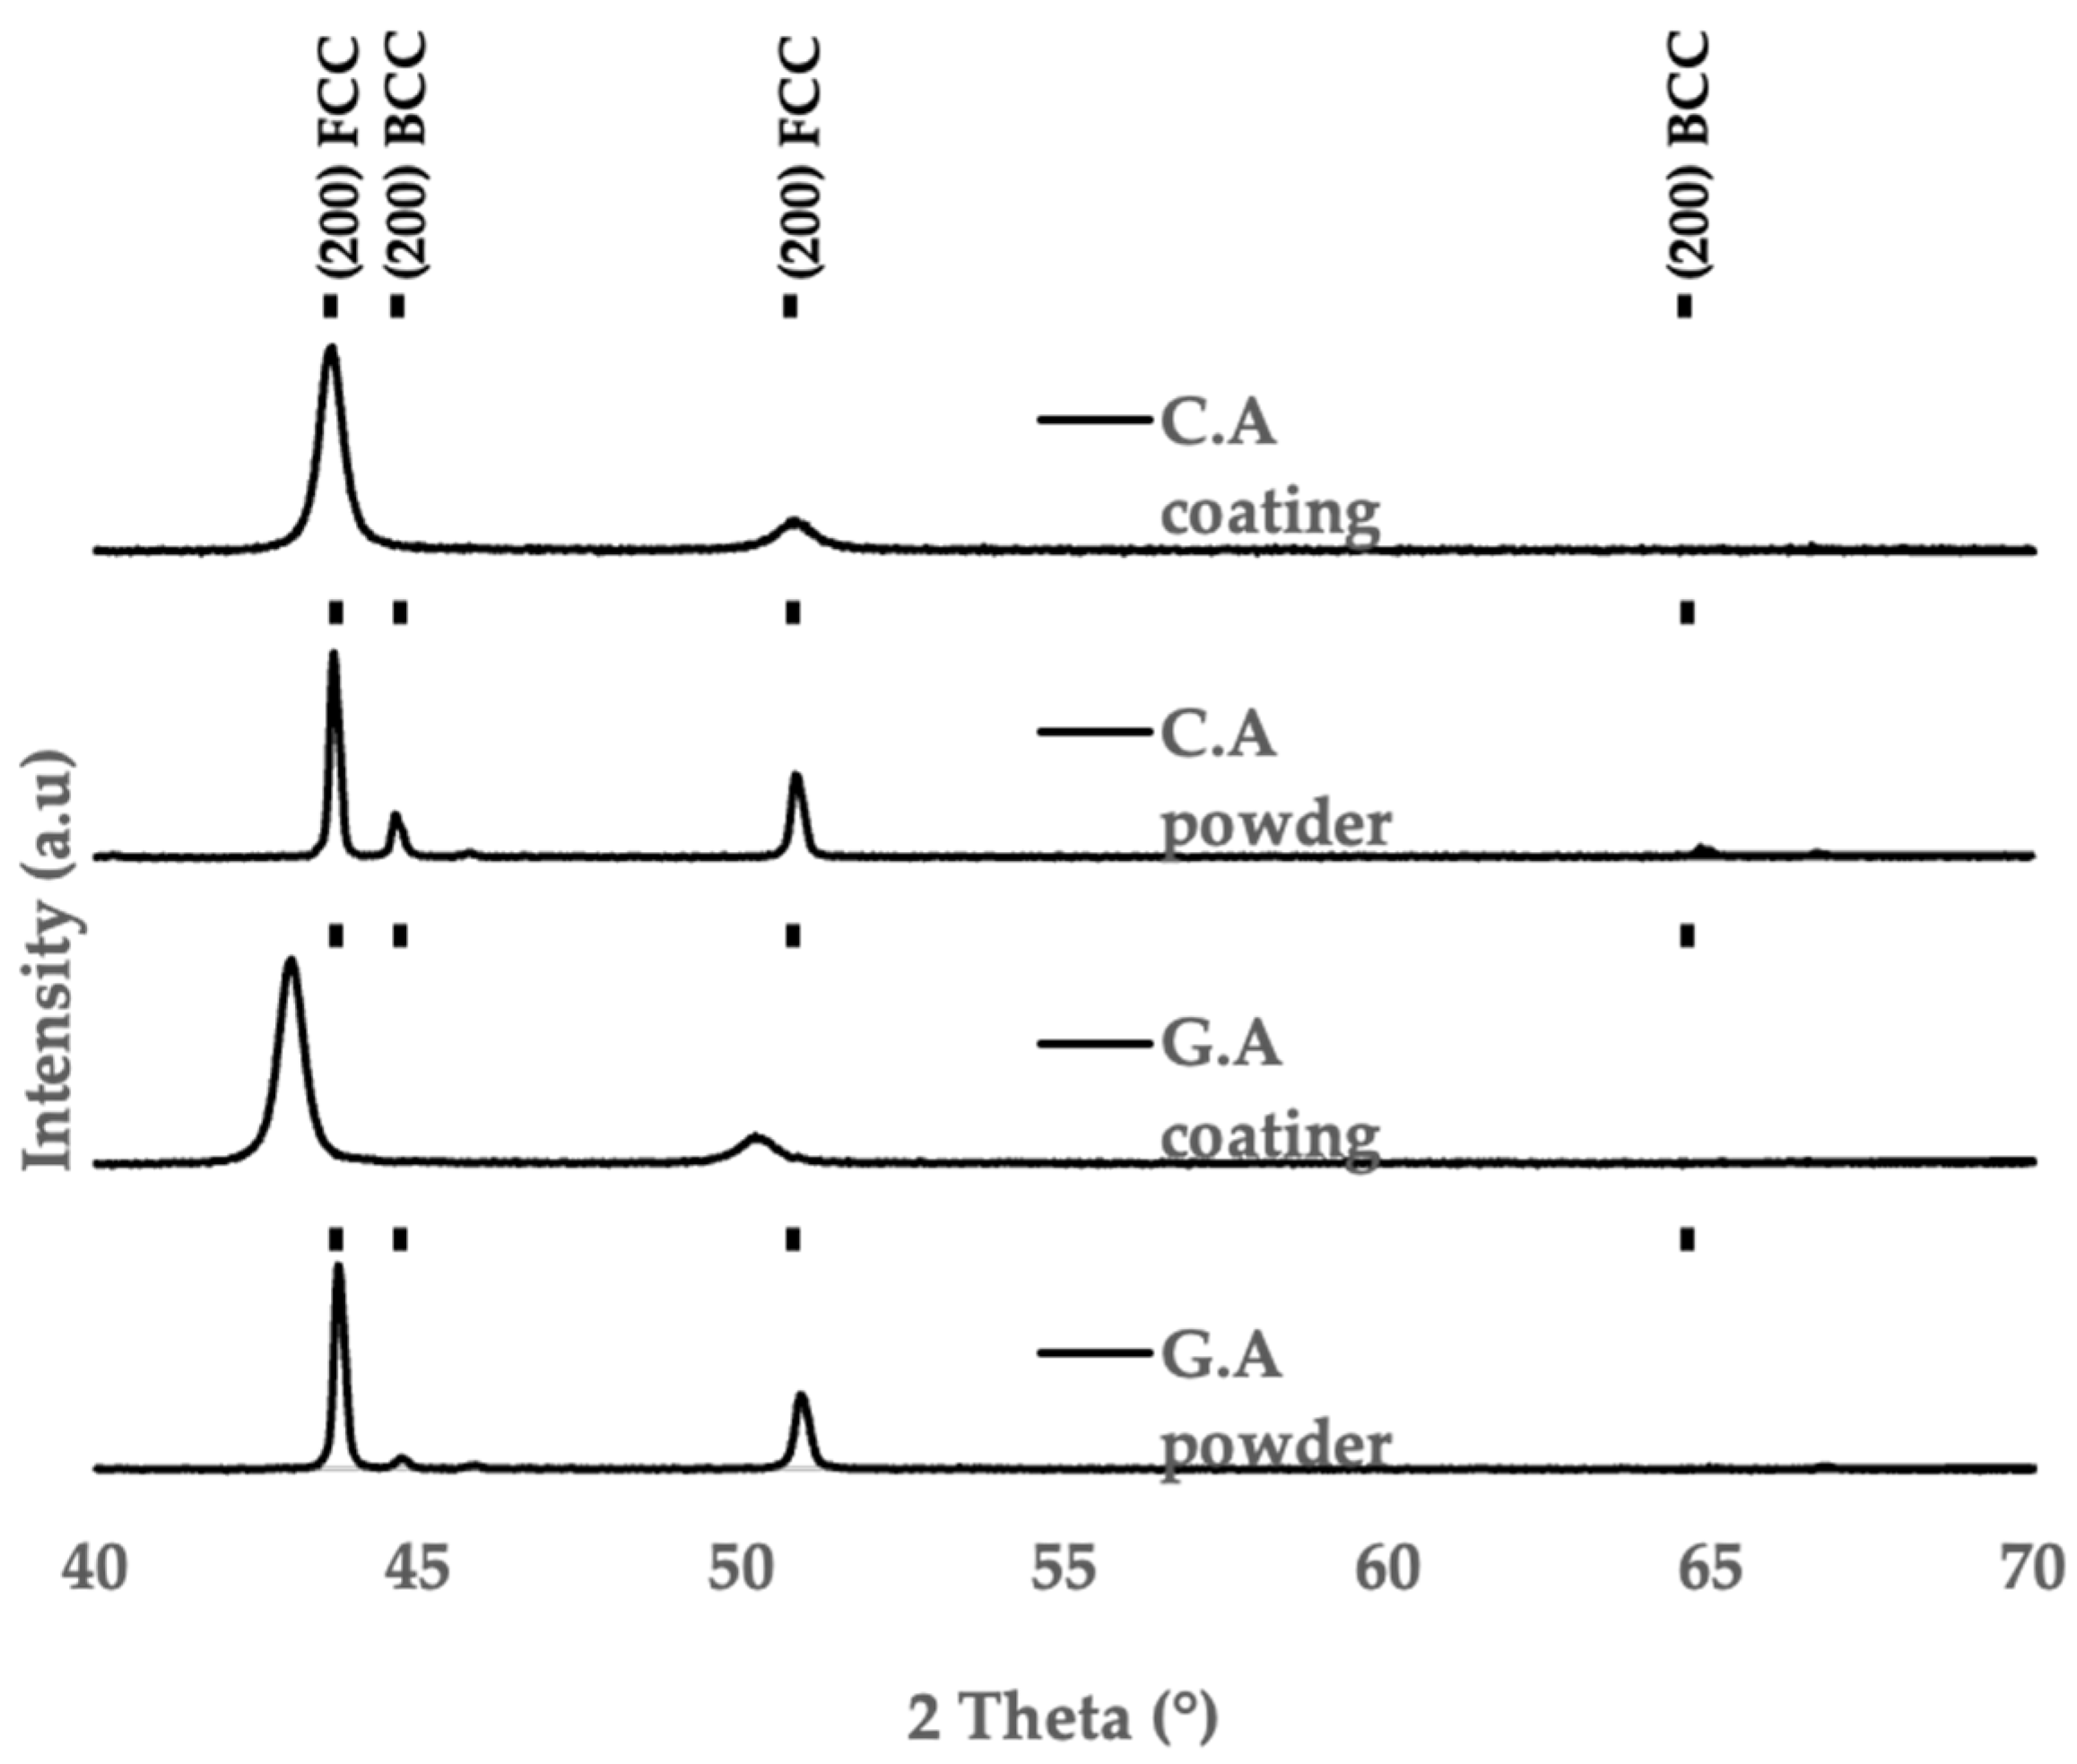
Figure 8.
EBSD data IPF (a,d) Phase map (b,e) IQ map with red (>2°,<15°) LAGB and blue HAGB (>15°) boundaries (c,f) for G.A and C.A powders respectively.
Figure 8.
EBSD data IPF (a,d) Phase map (b,e) IQ map with red (>2°,<15°) LAGB and blue HAGB (>15°) boundaries (c,f) for G.A and C.A powders respectively.
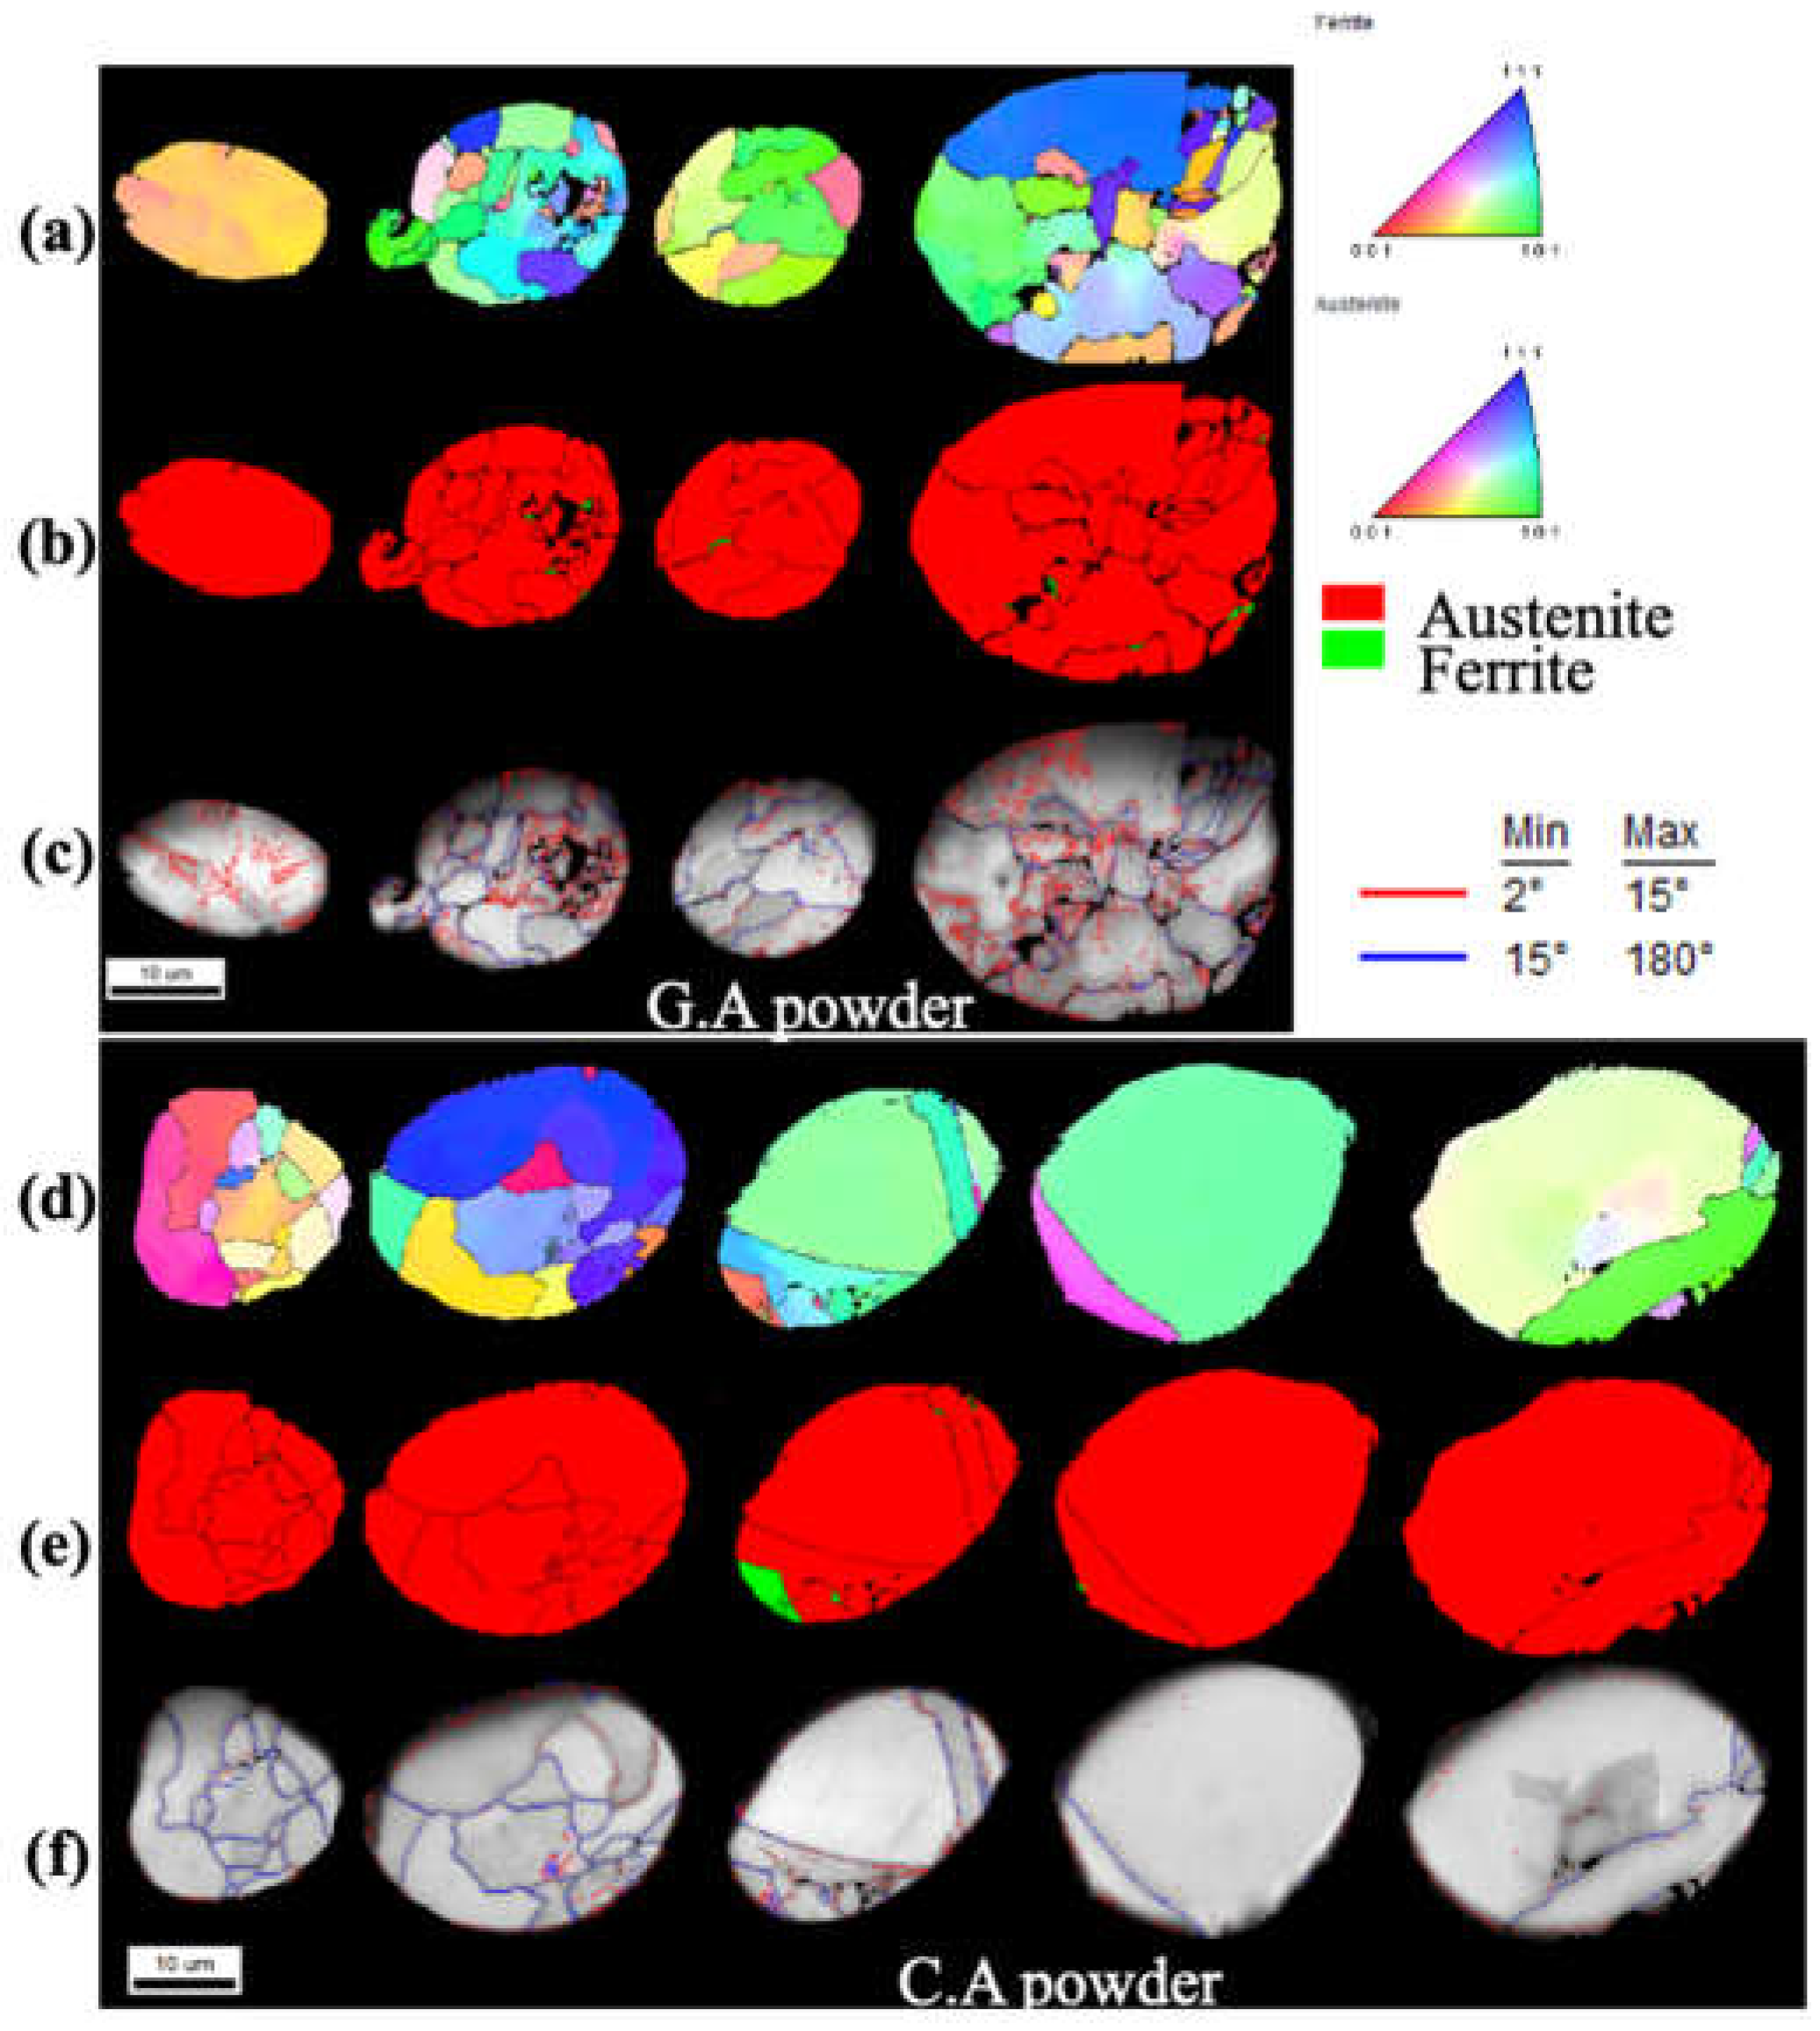
Figure 9.
Total misorientation (a) and grain size distribution (b) obtained from the G.A and C.A powder EBSD scans.
Figure 9.
Total misorientation (a) and grain size distribution (b) obtained from the G.A and C.A powder EBSD scans.
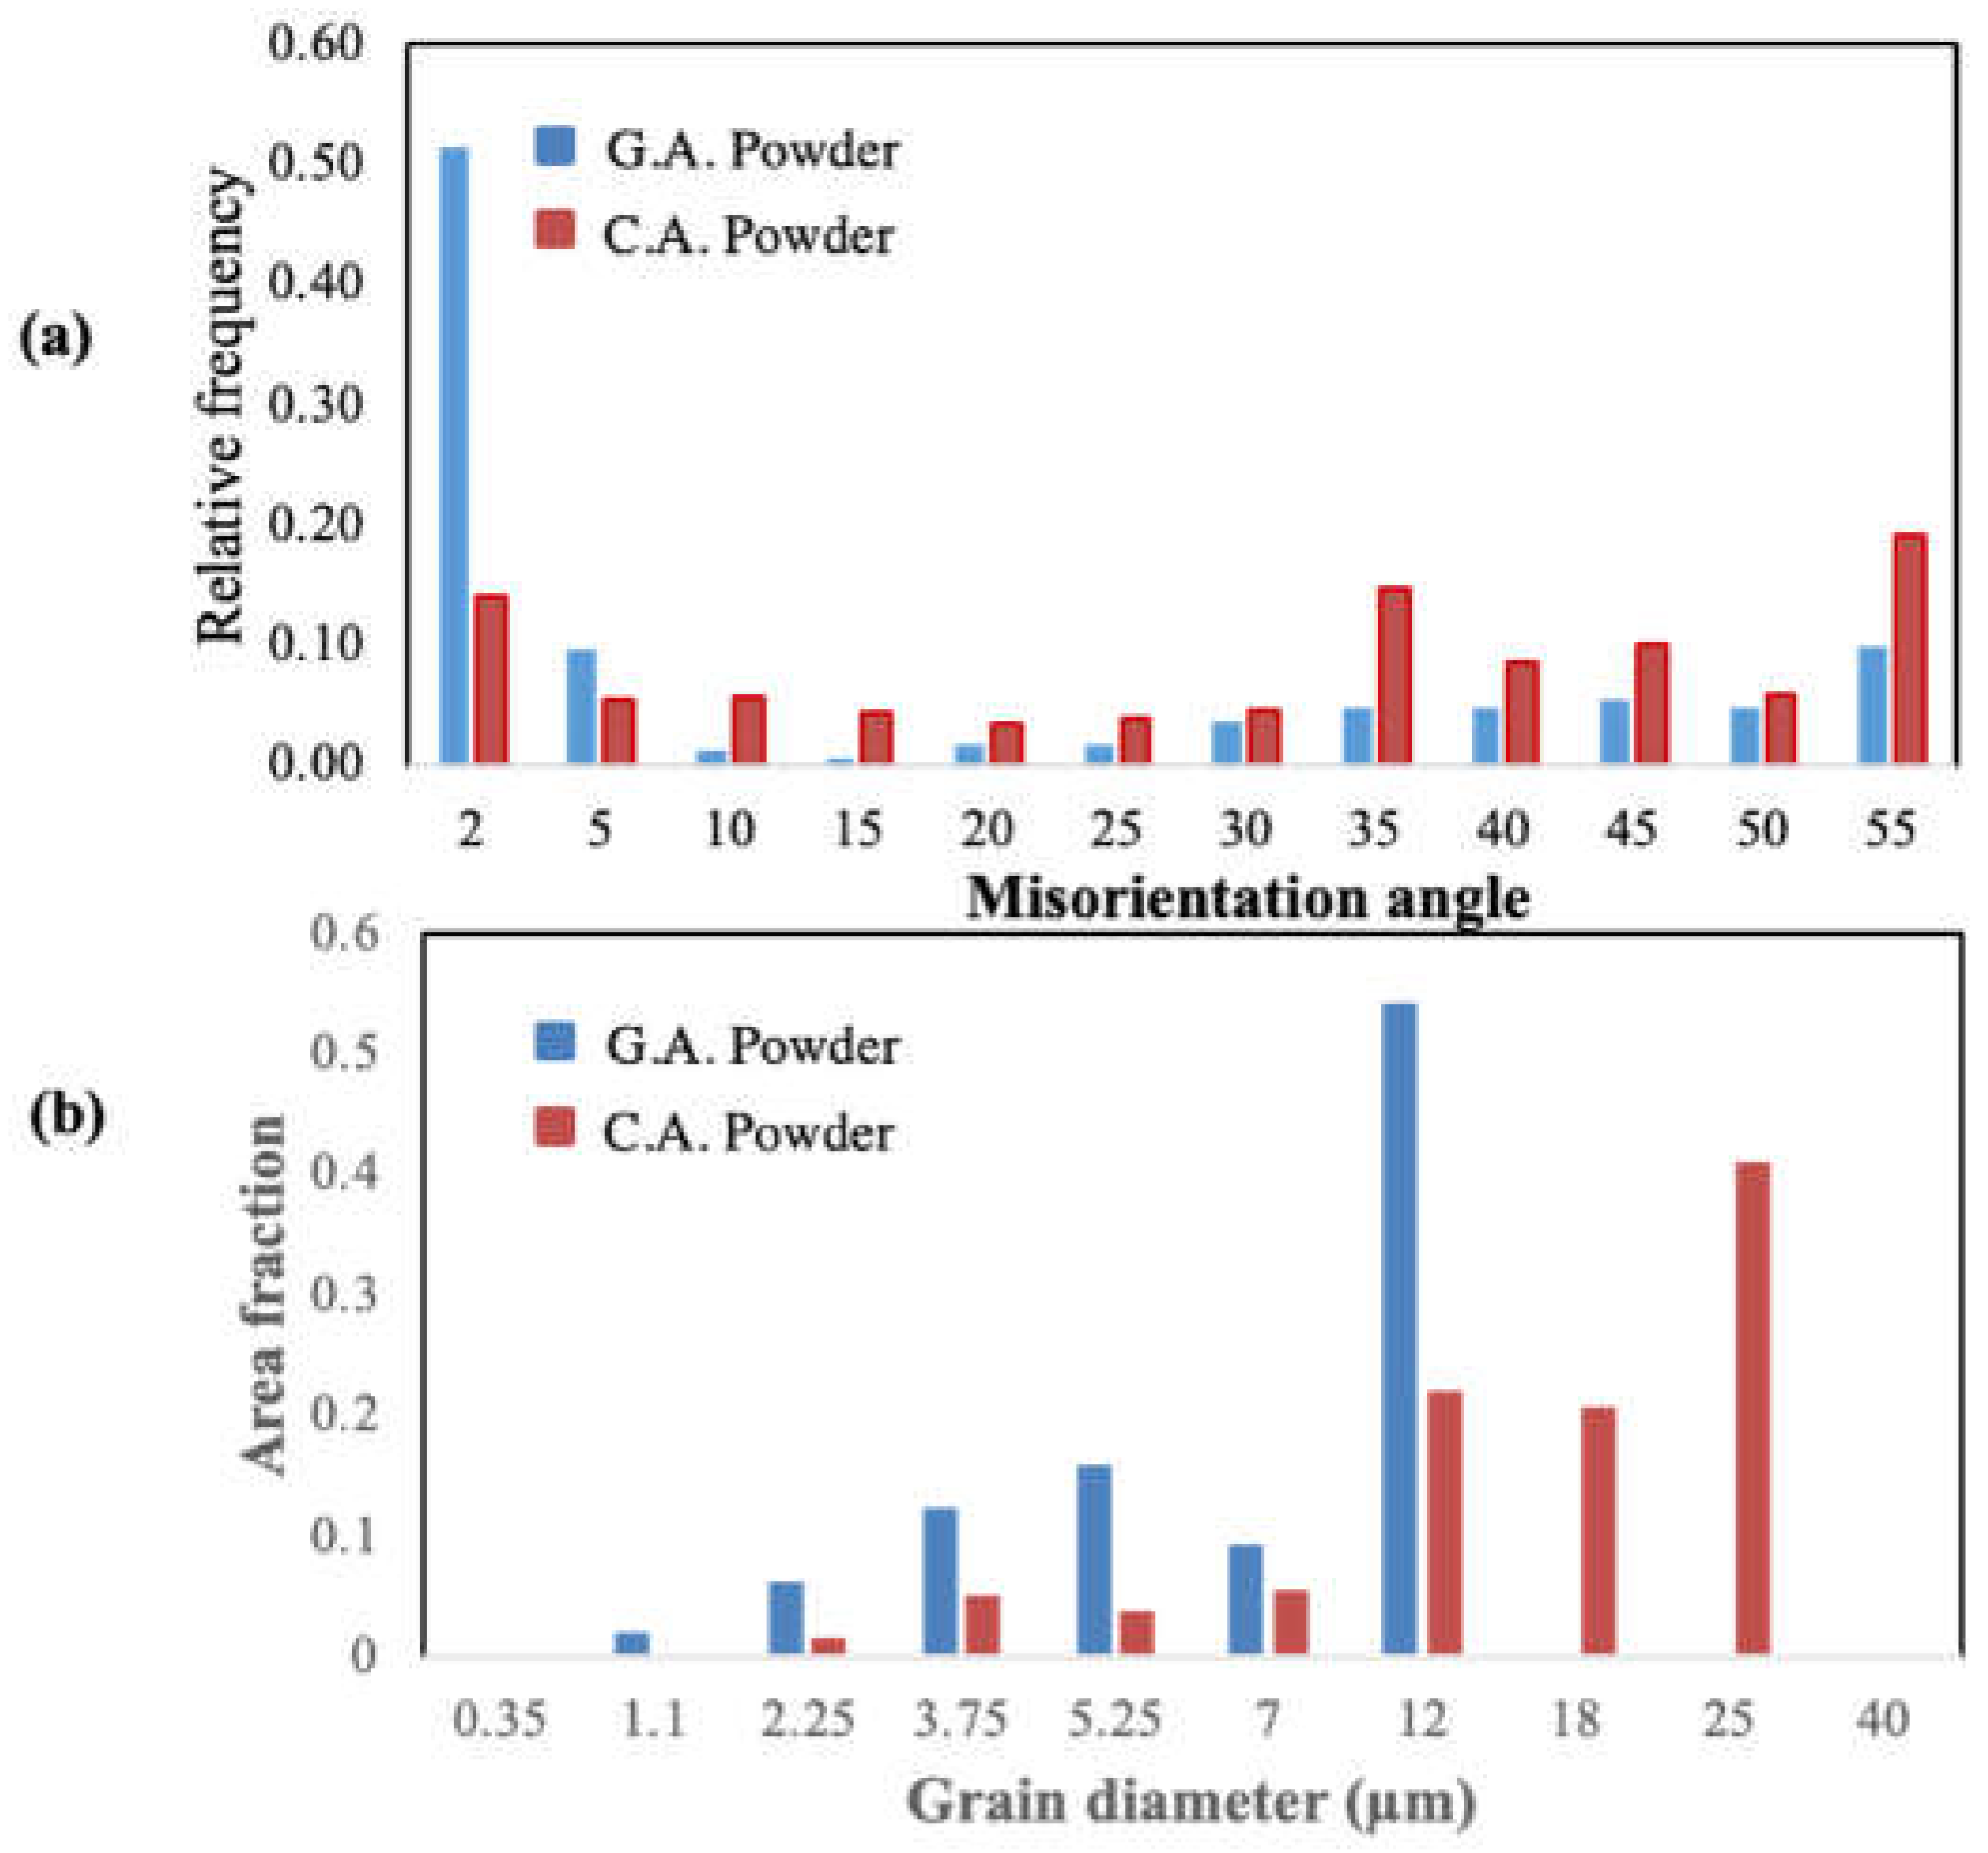
Figure 10.
Load-displacement response of nano-indentation test on C.A and G.A powders.
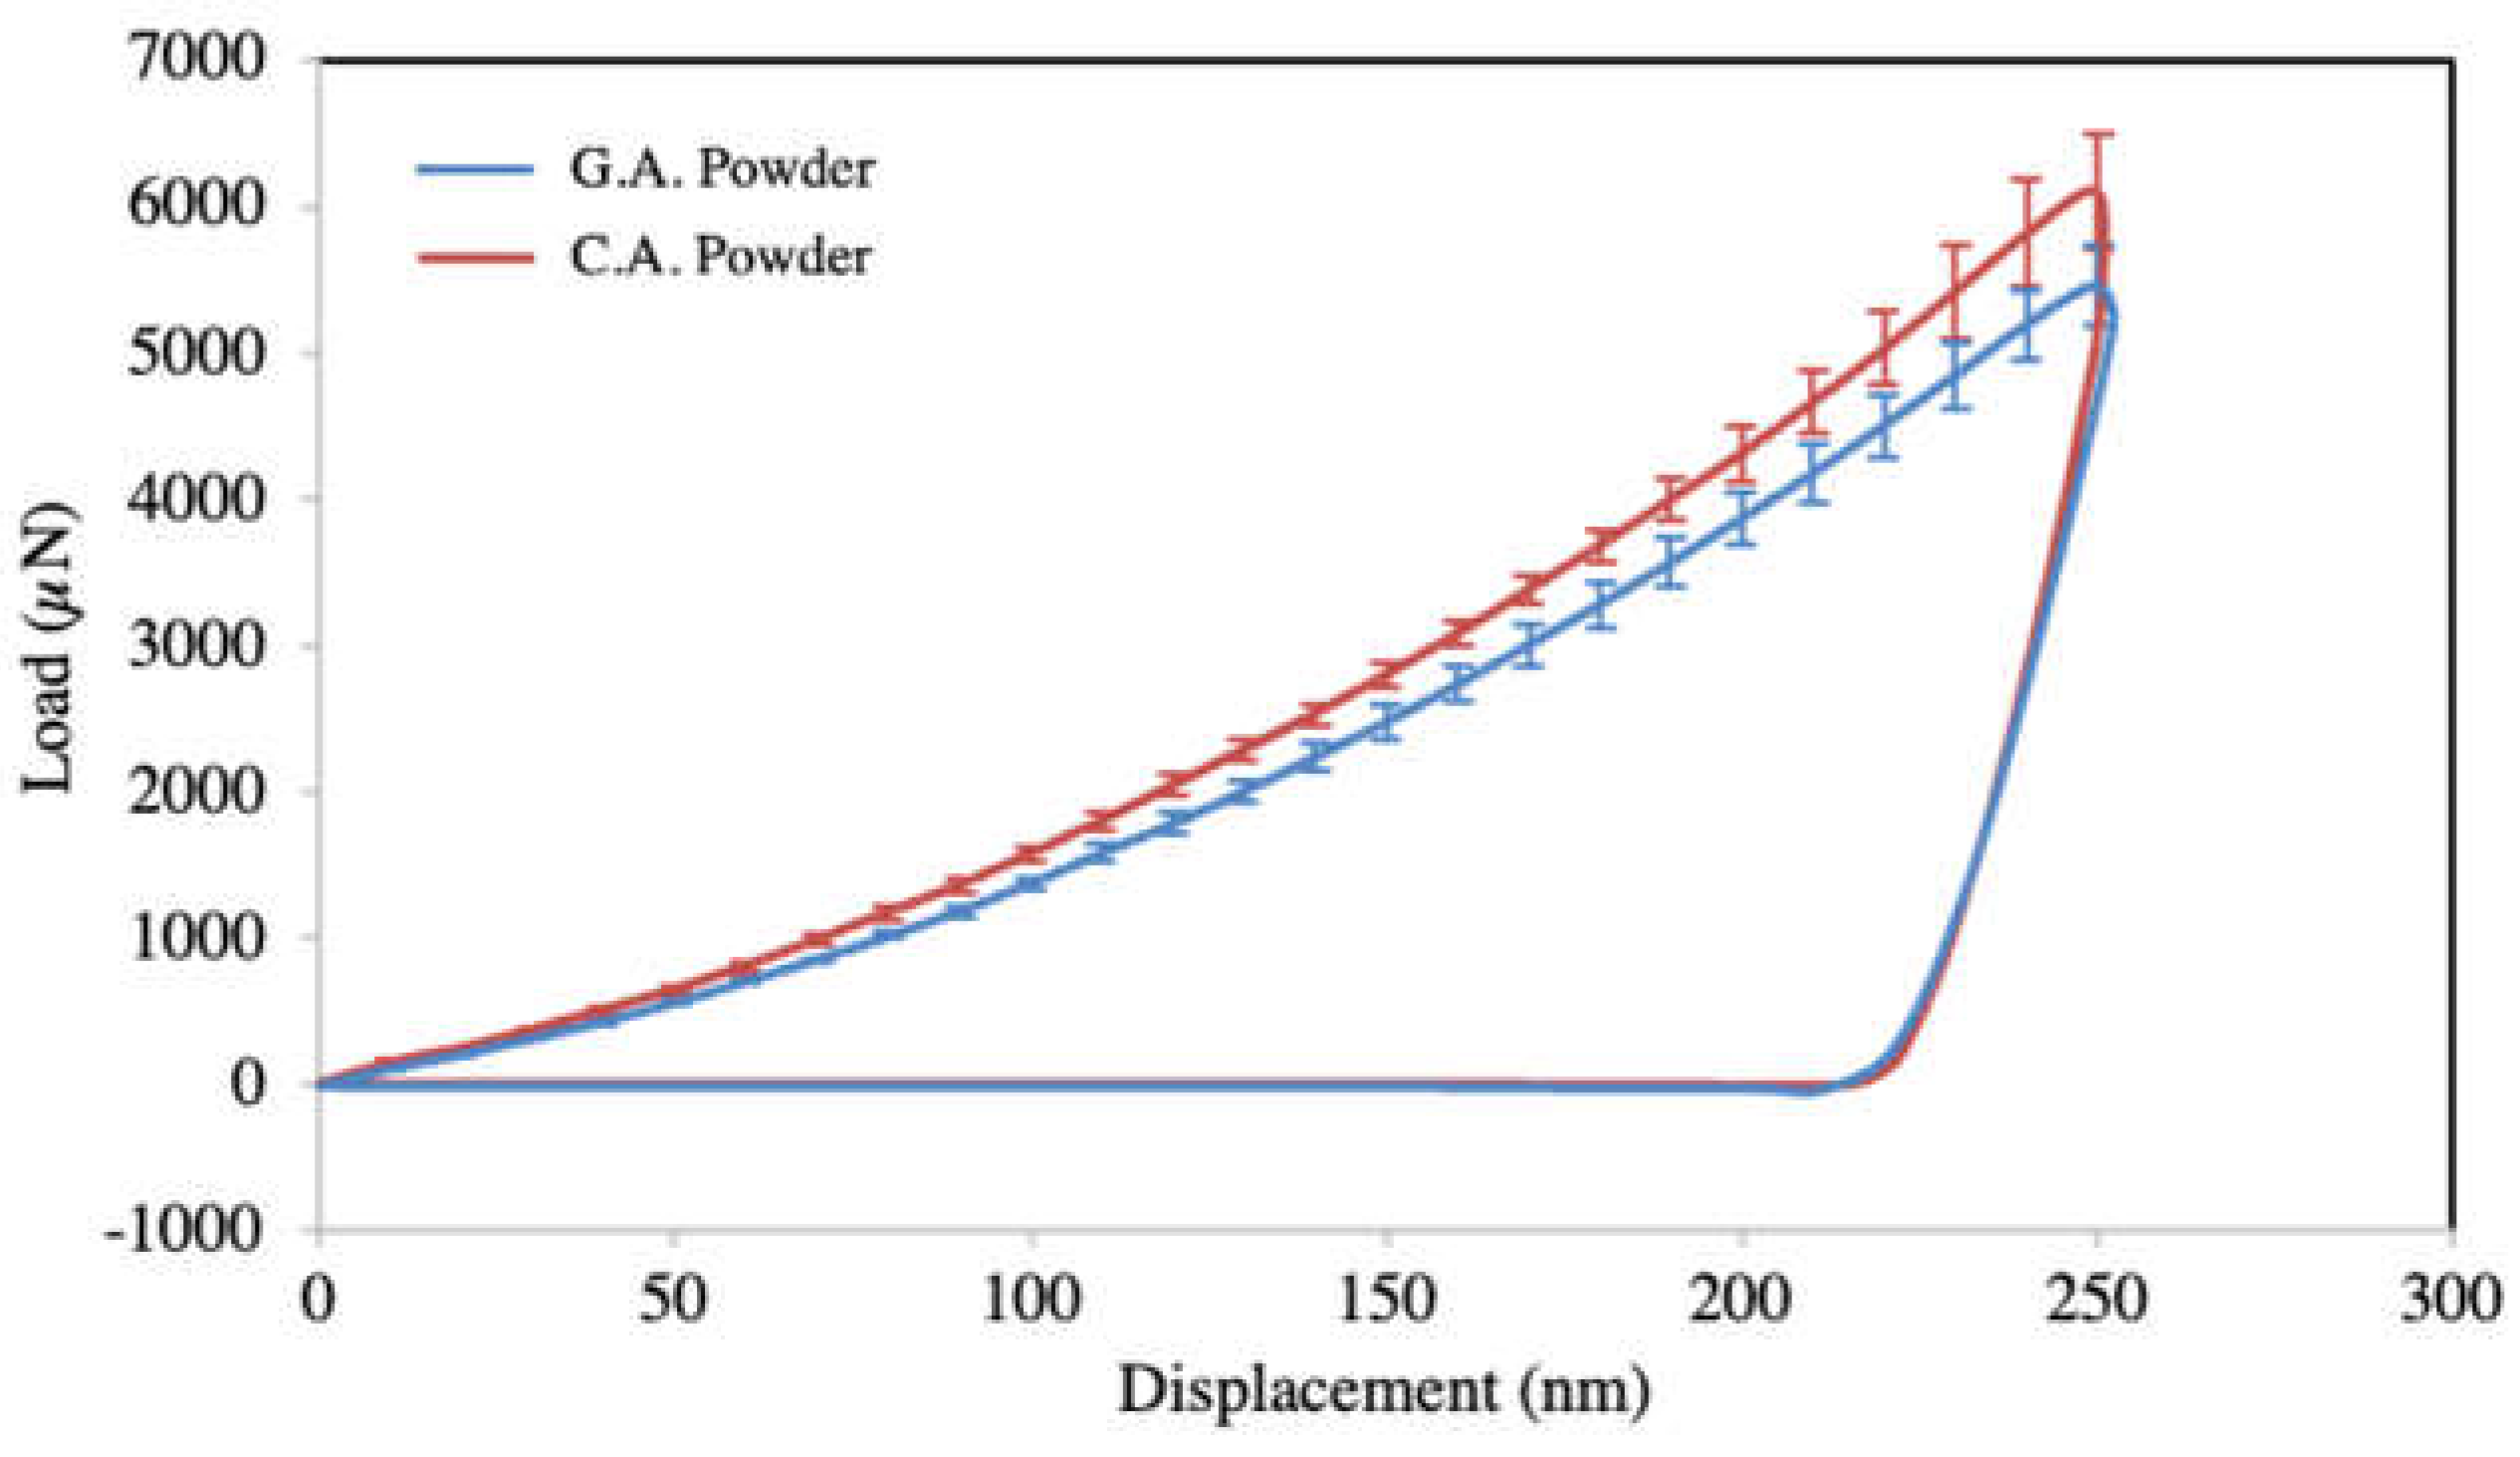
Figure 11.
a),b) BSE and SE images at 200µm c) BSE image at 100µm for GA316 coating ; d),e) BSE and SE images at 200µm f) BSE image at 100µm for CA316 coating.
Figure 11.
a),b) BSE and SE images at 200µm c) BSE image at 100µm for GA316 coating ; d),e) BSE and SE images at 200µm f) BSE image at 100µm for CA316 coating.
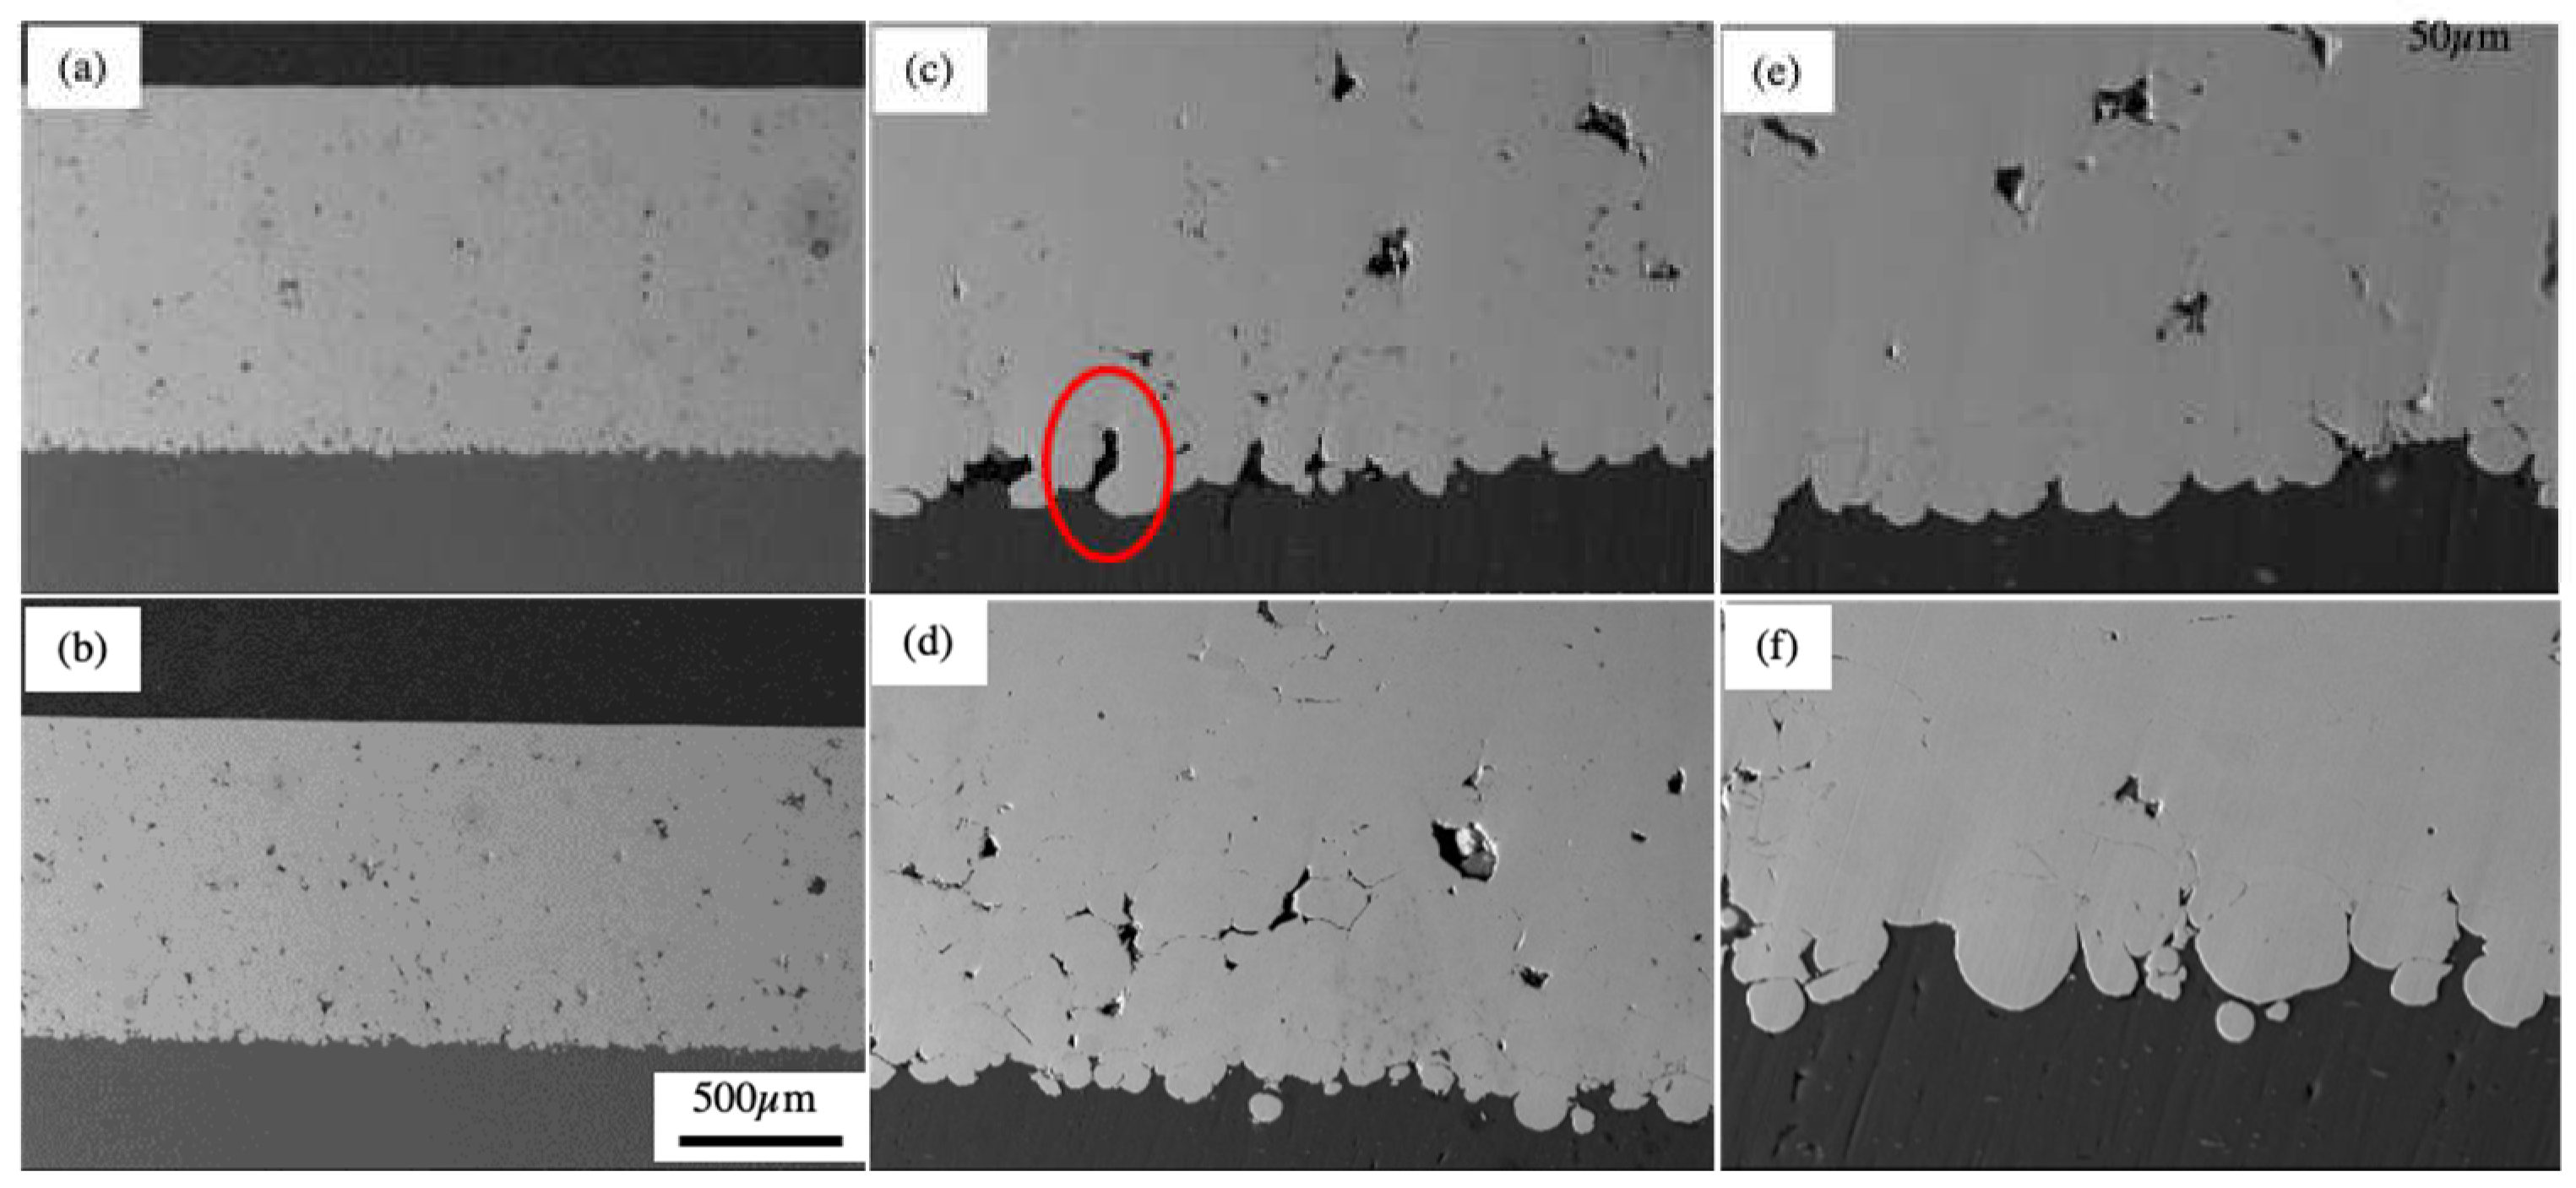
Figure 12.
Micro-Hardness of coatings across its thickness.
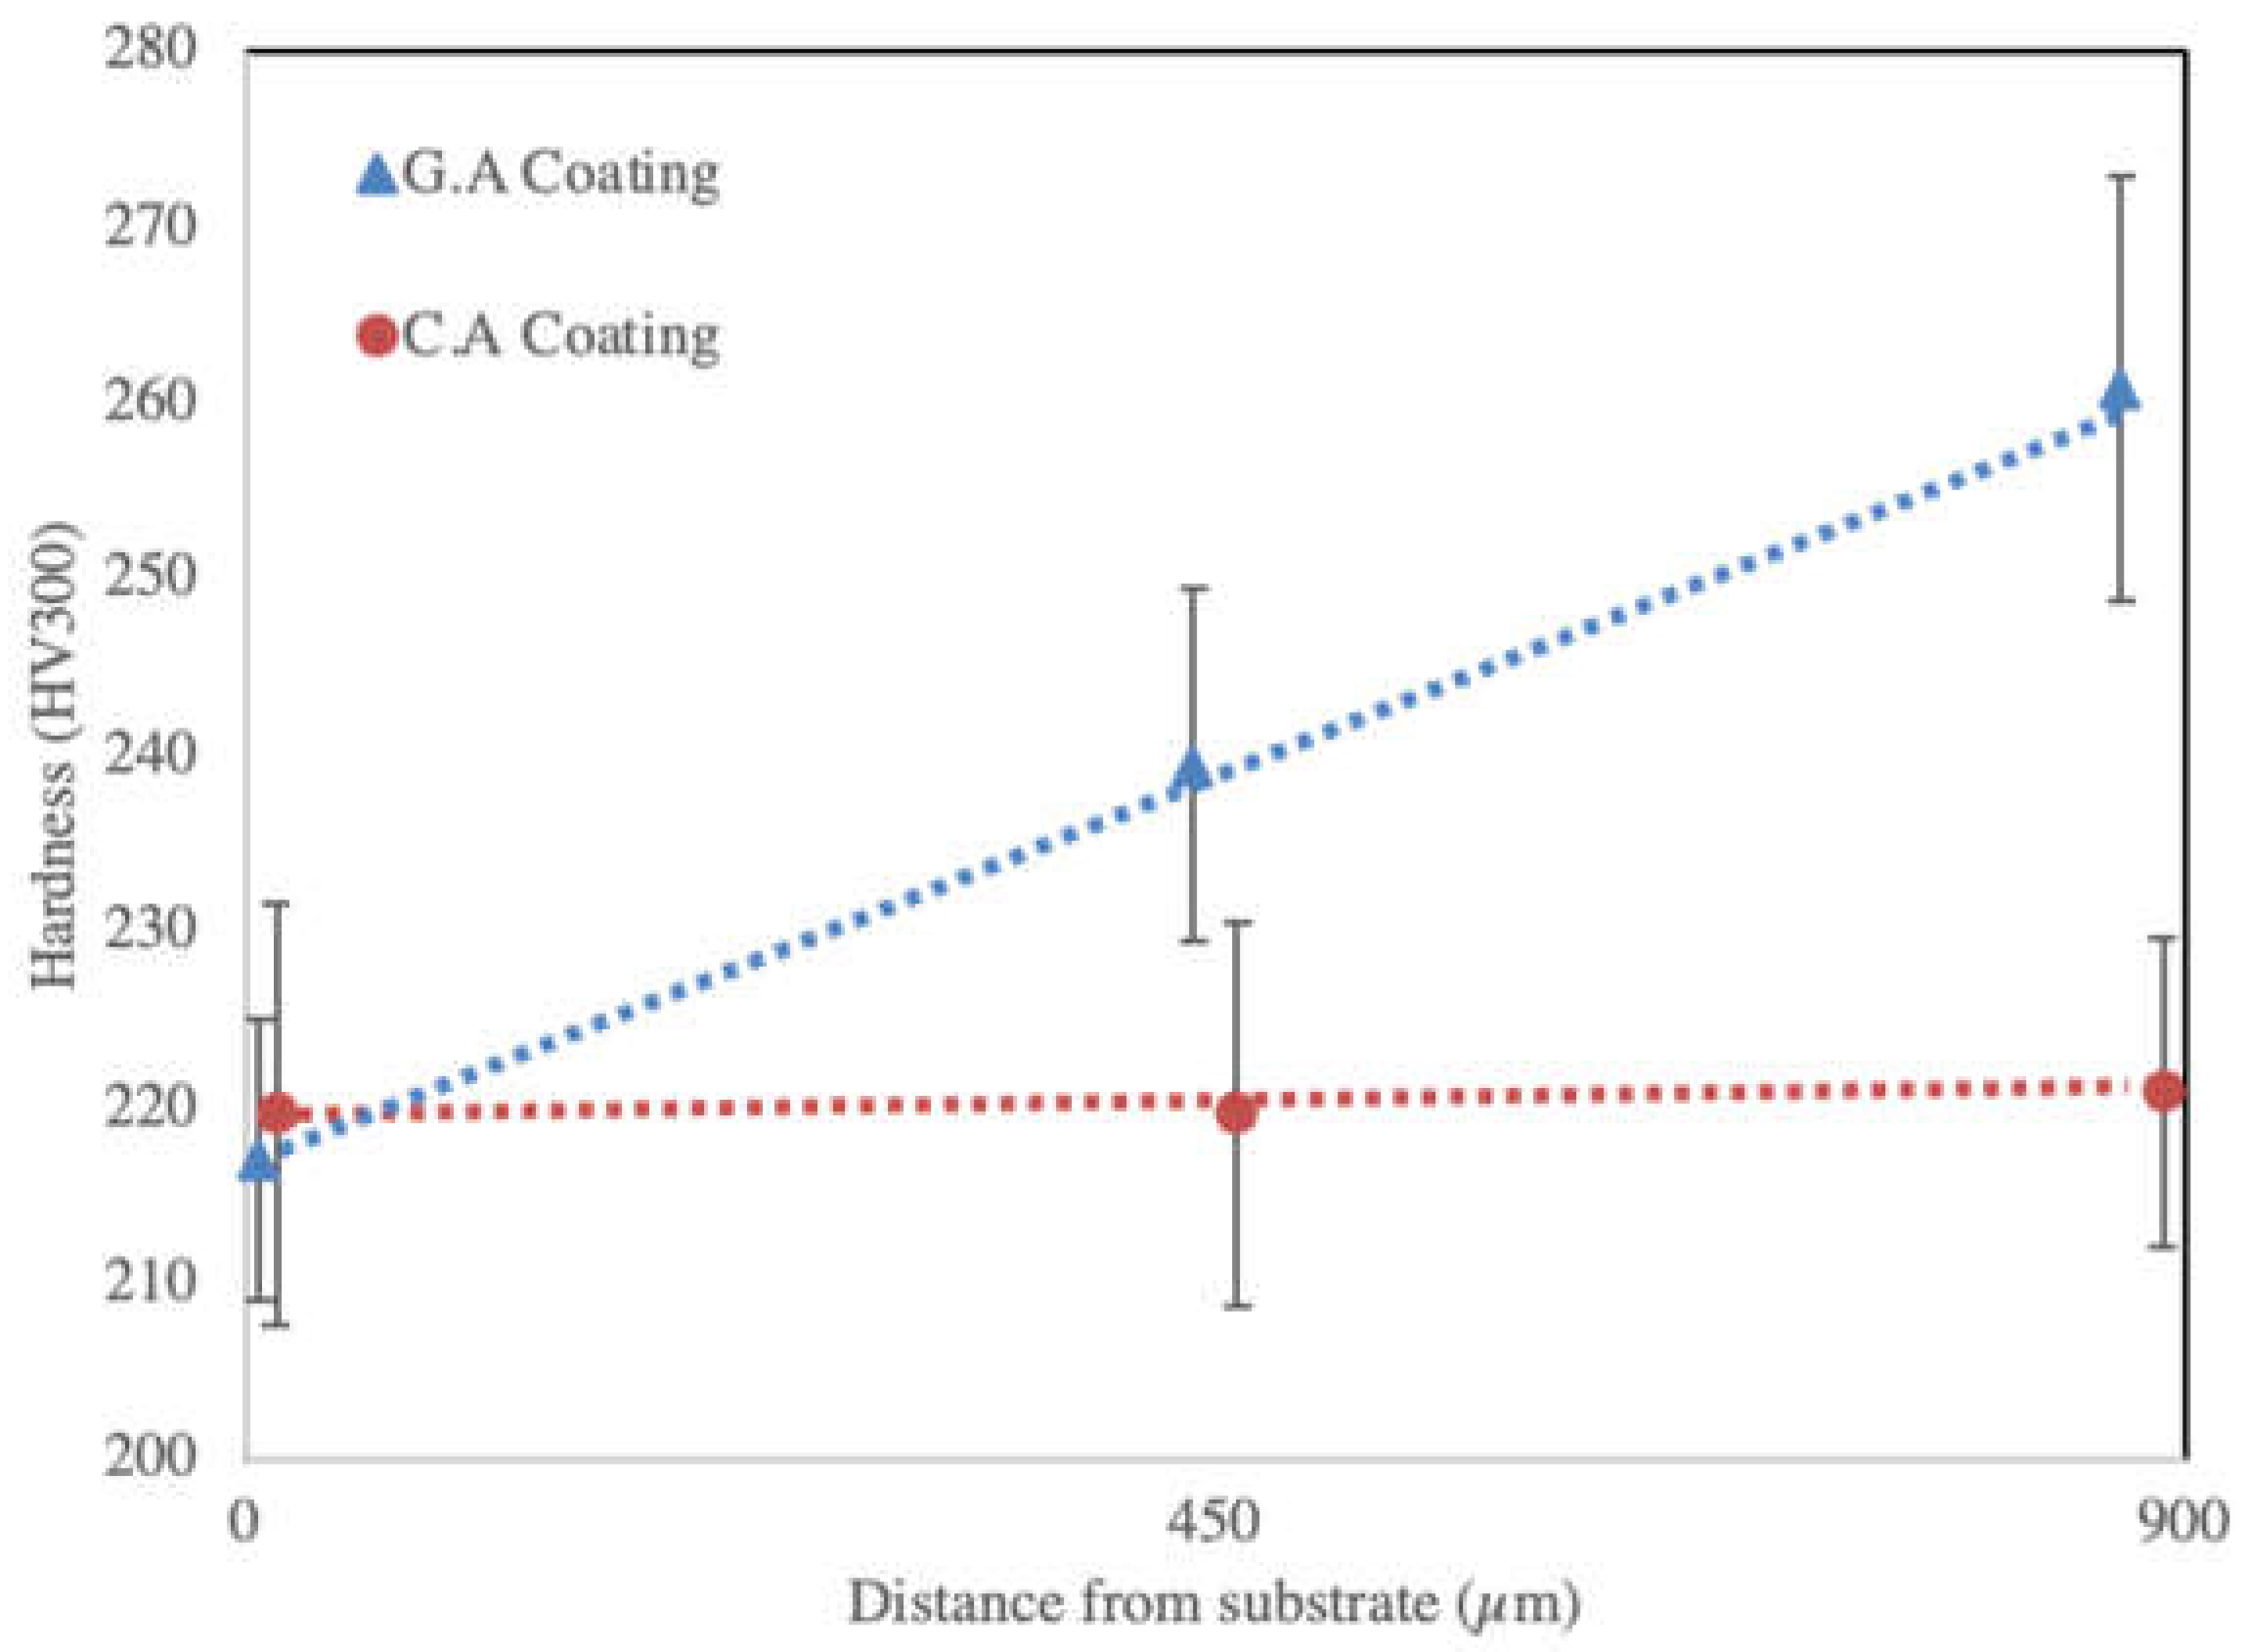
Figure 13.
(a) Friction coefficients from G.A and C.A coatings across 25,000 laps (b) measured wear track profile from after testing.
Figure 13.
(a) Friction coefficients from G.A and C.A coatings across 25,000 laps (b) measured wear track profile from after testing.
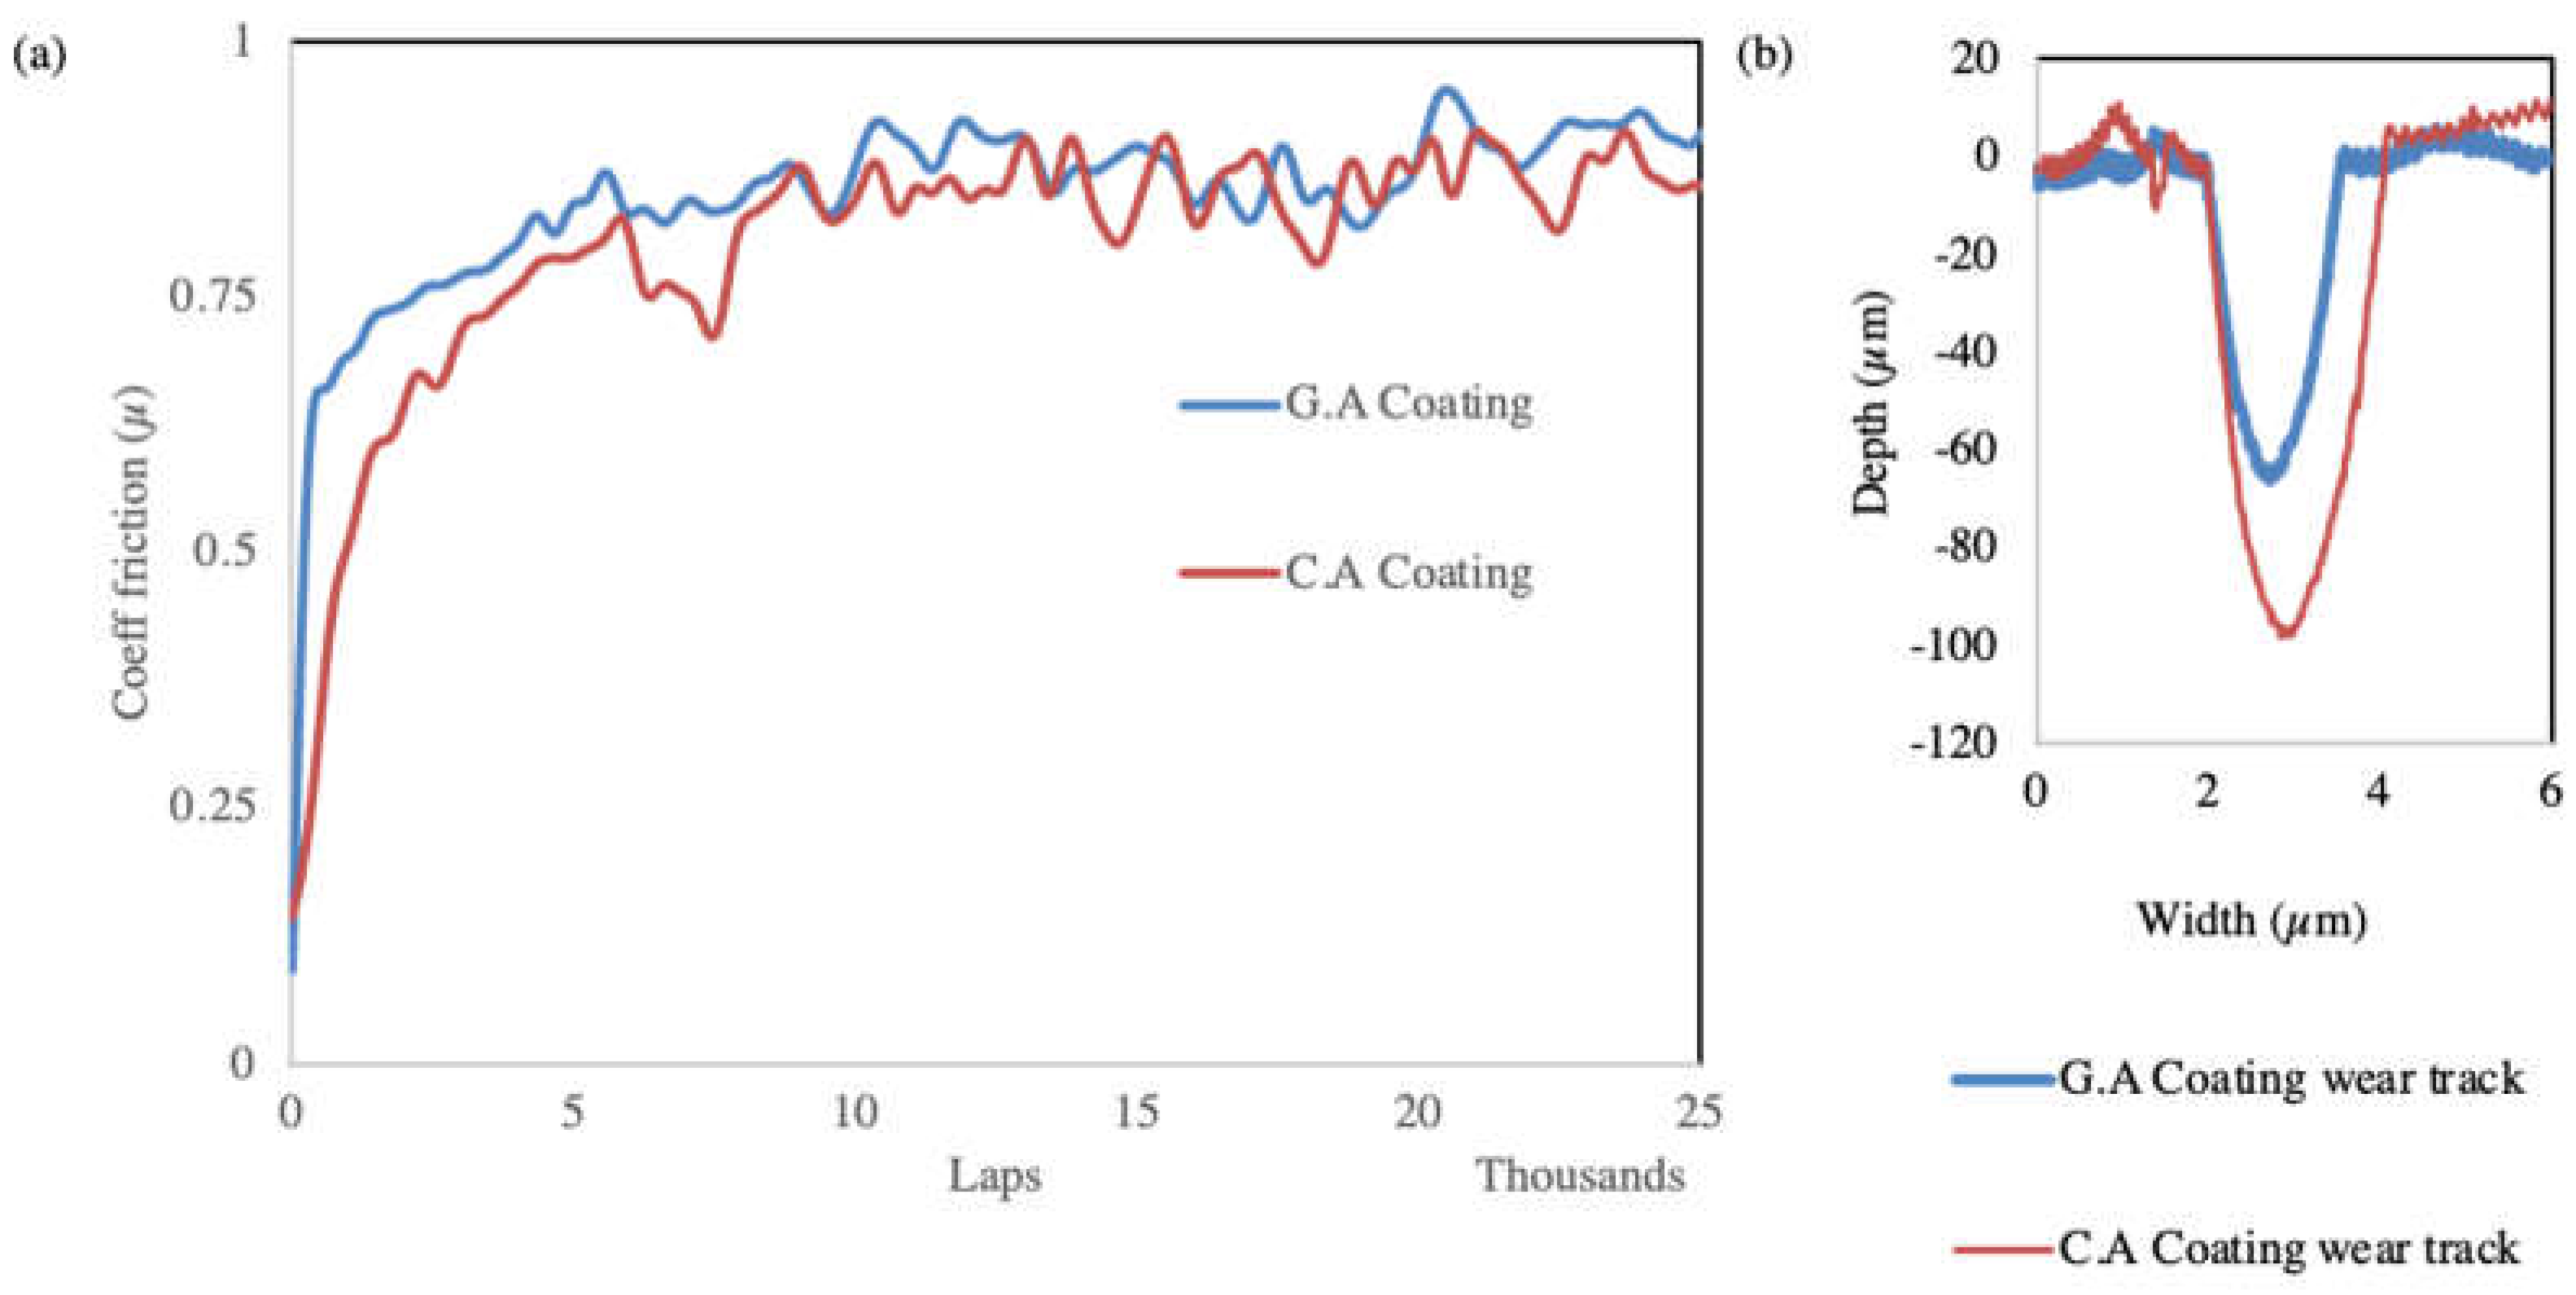

Table 1.
Chemical composition of powders used for cold spray.
| Composition | Fe | Cr | Ni | Mn | C | Mo | Si | P | O | N |
|---|---|---|---|---|---|---|---|---|---|---|
| G.A powder | Bal | 16.9 | 11.59 | 0.46 | 0.02 | 2.39 | 0.7 | 0.04 | .03 | .01 |
| C.A powder | Bal | 17 | 11.5 | 1.35 | 0.03 | 2.16 | 0.87 | 0.037 | .04 | .0588 |
Table 2.
Chemical composition of powders used for cold spray.
| (a) | Temperature (°C) | Pressure (MPa/psi) |
Standoff (mm) |
Carrier Gas (MPa/psi) |
Powder flow (g/min) |
|||
| 600 | 3.447/500 | 10 | 0.47/68 | 20 | ||||
| (b) | Powder |
Layers to achieve ~1.3mm coating thickness |
Deposition time |
Deposition Efficiency (%) |
||||
| G.A | 4 | 32mins 28sec | 70.26±0.3 | |||||
| C.A | 6 | 48mins 52sec | 41.33±0.92 | |||||
Table 3.
Crystallographic information for phases used for EBSD indexing.
| Phase | a(Å) | b(Å) | c(Å) | α | β | γ | Crystal system | Space group | ICSD # |
|---|---|---|---|---|---|---|---|---|---|
| Austenite | 3.66 | 3.66 | 3.66 | 90° | 90° | 90° | Cubic | Fm-3m (225) | 631733 |
| Ferrite | 2.87 | 2.87 | 2.87 | 90° | 90° | 90° | Cubic | Im-3m (229) | 180969 |
Table 4.
Physical properties of the powders used in this study (manufacturer specifications).
| Powder | D10 (µm) | D50(µm) | D90(µm) | Hall Flow (s) | Apparent density (g/cm3) |
|---|---|---|---|---|---|
| G.A | 20 | 31 | 46.9 | 16 | 4.10 |
| C.A | 18.4 | 30.4 | 48.4 | 13 | 4.29 |
Table 5.
Crystallite size of both powders and coatings calculated from the XRD data.
| Crystallite size (nm) Powder |
Crystallite size (nm) Coating |
|
|---|---|---|
| G.A | 50.39 | 16.36 |
| C.A | 61.78 | 18.30 |
Table 6.
Micro and nano hardness measurement data on the powders.
| Powder | Micro hardness (Vickers 10gF) |
Nano Hardness (GPa) | Stiffness (µN/nm) |
|---|---|---|---|
| G.A | 273.14 ± 23.39 | 2.65 ± 0.12 | 215.9 ± 16.1 |
| C.A | 279.4 ± 14.54 | 2.87 ± 0.11 | 248.88 ± 14.08 |
Table 7.
Bond strength of the coatings.
| Bond strength (MPa) | |
|---|---|
| G.A Coating | 68.125 ± 1.10 |
| C.A Coating | 47.5 ± 0.76 |
Disclaimer/Publisher’s Note: The statements, opinions and data contained in all publications are solely those of the individual author(s) and contributor(s) and not of MDPI and/or the editor(s). MDPI and/or the editor(s) disclaim responsibility for any injury to people or property resulting from any ideas, methods, instructions or products referred to in the content. |
© 2023 by the authors. Licensee MDPI, Basel, Switzerland. This article is an open access article distributed under the terms and conditions of the Creative Commons Attribution (CC BY) license (http://creativecommons.org/licenses/by/4.0/).
Copyright: This open access article is published under a Creative Commons CC BY 4.0 license, which permit the free download, distribution, and reuse, provided that the author and preprint are cited in any reuse.


