1. Introduction
Among the most prevalent malignancies, lung cancer is the primary cause of cancer-related mortality globally. Non-small cell lung cancer (NSCLC), which includes adenocarcinoma and squamous-cell carcinoma (80% of NSCLC cases), and large-cell carcinoma and small-cell lung cancer, which make up the remaining 20% of cases[
1]. The complex and dynamic immunological alterations taking place inside the tumor microenvironment are primarily responsible for the unsatisfactory clinical effectiveness in treating advanced non-small cell lung cancer (NSCLC) despite advances in immunotherapy. The release of extracellular vesicles, especially exosomes, which are known to alter immune cell function and accelerate tumor growth, is one such mechanism linked to immune evasion[
2,
3].
Small extracellular vesicles (sEV), or exosomes, range in size from 30 to 150 nm. They are found in all bodily fluids and are generated by all cell types through the endosome route[
4,
5,
6,
7,
8]. Exosomes are considered potential elements of "liquid biopsy" as their molecular and genetic payloadirrors that of their parent cells[
9]. Exosomes play a crucial mediating role in many facets of cell-to-cell communication, including those pertaining to causes of illness. Cancer cells produce and release cancer-derived exosomes, or TEXs in vast quantities [
10,
11,
12].
On the other hand, human plasmaas a diverse mixture of circulating sEVs from variousrgans, including immune cells[
13,
14]. In recent research, exosomes produced from cancer have been shown to have the ability to modify immunological responses, which might lead to immune suppression in the tumor setting. However, little is known about the precise function of exosomes from various NSCLC subtypes in modifying T-cell activity[
15,
16].
Successful cancer immunotherapy has long been thought to be hampered by tumors' capacity to evade the host immune system[
17]. Human tumors can suppress immune cell activity, particularly that of anti-tumor effector cells such as CD8+ and CD4+ T lymphocytes, NK cells, and DCs [
18]. It has been reported that after a short incubation time, the sera of cancer patients may inhibit the activities of normal activated T cells, but not the sera of normal control samples[
19]. Later, it was shown that exosomes, which resembled the parental tumor cells' cell-surface membranes in molecular makeup, were responsible for this suppressive impact[
19].
In this work, we examine the immunomodulatory effects on T cells of exosomes secreted from two different subtypes of lung cancer: lung squamous cell carcinoma (SCC) and lung adenocarcinoma (ADC). We hope to clarify the molecular processes behind the connection between tumor-derived exosomes and immune cells by isolating exosomes from lung cancer cell lines (A549 and SKMES1) and evaluating their effects on T-cell survival, gene expression, and proteomic profile. This study specifically aims to determine how exosome-mediated signaling modifies T-cell activity and adds to the immunomodulatory milieu that characterizes advanced lung cancer.
2. Materials and Methods
2.1. Adherent and Suspension Cell Culture
Human lung cancer cells A549 (CCL-185, lot no: 70047545) and SKMES1 (HTB-58, lot no: 70037644) were procured from ATCC, while Jurkat E6.1 was acquired from the National Centre for Cell Science (NCCS), Pune, India. Following verification of cell line purity using sort tandem repeat (STR), ATCC cell lines were procured following approval of the material transfer agreement (MTA) and biosafety level (BSL). Cell line procured from NCCS was identified for its identity using STR at NCCS. Applied Biosystems' AmpFISTR Identifier Plus PCR amplification kit was used to amplify STR loci. The Applied Biosystems 3500 Genetic Analyzer was used to process the cell line. Applied Biosystems' Gene Mapper ID-X v1.5 software was used to analyse the data and guarantee that the cell line purity fully matched with the ATCC STR profile database.
A549 cell line and SKMES1 were adherent cells that were cultured in F12K and EMEM medium, respectively. The media was supplemented with 10% (v/v) exosome-free serum and 1% pen strep, and the cultures were maintained at 37 °C with 5% CO2. RPMI medium mixed with 10% FBS and 1% penstrep was used to culture Jurkat E6.1 in suspension.
2.2. Isolation of Exosomes Using Precipitation Method
The cells were cultured in a medium containing serum devoid of exosomes for a minimum of 2.5–3 doublings until they reached 90% confluency. After collecting the conditioned media, it was centrifuged at 2000 rpm for 5 minutes to remove any cell debris. It was then centrifuged at 5000 rpm for 20 minutes and filtered using a 0.22 μm filter. Using the ExoEnrich high performance exosome isolation kit (PEC50), exosomes were precipitated. Two rounds of exosome washing were conducted using phosphate buffer solution (PBS).
2.3. Nanoparticle Tracking Analysis
Exosome samples were filtered through 0.22 μm filter membranes and diluted 10- to 100-fold in PBS to achieve a particle count of around 100 per frame for the measurement. The size distribution and concentration of isolated exosomes were determined using a Nanoparticle Tracking Analyser (Particle Metrix Zetaview-PMX 130-Mono laser). As advised by the manufacturer, the camera level (9–12) and detection threshold (2–6) were manually changed. Each identified particle's mean square displacement was calculated from the video that was captured. The program then calculated the sphere-equivalent hydrodynamic radius and diffusion coefficient using the Stokes-Einstein equation.
2.4. Transmission Electron Microscopy
The exosome suspension was fixed using 4% paraformaldehyde (final concentration of 2%). A sample of around 35 μL fixed exosomes was put onto copper mesh support film coated with carbon, and the film was sealed for two to five minutes. Then, remove the surplus solution from the edge and let it sit on the pointed filter paper for approximately ten minutes. Uranyl acetate dye solution was dropped and left to dye for ninety seconds after the support film had dried. After the surplus dye solution was absorbed, the support film was clamped onto the filter paper and allowed to dry for three hours in order to observe.
2.5. Resazurin Cell Viability Assay
The effect of exosomes on cell viability were measured using fluorescent cell viability assay. A549 and SKMES1 were seeded (0.3x10^5 cells per well) on adherent-treated 96 well plates and treated with 50μg|ml T cell-derived exosomes to a final volume of 200ul. Jurkat E6.1 was cultured in 96 well suspension plates, treated using A549 and SKMES1-derived exosomes, and made up to 200ul. The cells with exosomes were incubated at 37°C with 5% CO2 for 32 hours. Resazurin was added to each well with final concentration of 44uM and measured the relative fluorescence unit (RFU) using a series of 590 nm emission and 560 nm excitation filters using Tecan microplate reader Infinite 200 pro.
2.6. Exosome Quantification and Cross-Treatment
The Pierce BCA Protein Assay Kit (Catalog No. 23225) was used to measure the protein content of exosomes. Protein standards (BSA) were used to make a standard curve by serial dilution. Reagents A and B were combined in a 50:1 ratio to create the working reagent. To allow for colour development, exosome samples and standards were combined with 200 µL of the working reagent and incubated for 30 minutes at 37°C. A microplate reader was used to measure the absorbance at 562 nm once it had cooled to room temperature. The protein concentrations were determined by comparing the absorbance values of the exosome samples to the standard curve. Background absorbance was subtracted using a blank. For the cross-treatments, 50μg|ml exosome was used to cross treat cancer cell-derived (A549, SKMES1) exosomes on T cells (Jurkat E6.1) at the 70% confluency and vice versa.
2.7. Labelling of Cancer-Derived Exosomes
Isolated exosomes from A549 and SKMES1 were diluted to 50 µg/mL of protein in ultra-pure water. The staining process involved mixing diluent C with 1 mM PKH67 stock (green, origin, D0031) in the ratio 9:1. After that, PKH67 in diluent C was mixed with purified exosomes in the ratio of 1: 25. Incubate the exosomes at 2-8 °C for 15-30 minutes. Re-isolate the EVs using ExoEnrich kit so as to remove unbound PKH67 dye.
2.8. Exosome Uptake and Cell Labelling
The labelled exosomes were incubated with the T cells for 24 hours at 37°C and 5% CO2. The cells were fixed onto the coverslip using 3.75% paraformaldehyde in PBS for 15 minutes on ice. Followed by, three rounds of PBS wash. The cells were permeabilized using 0.5% Triton X-100 in PBS for 10 minutes at room temperature and three rounds of PBS wash. To stain the nucleus, Hoechst 33258, a blue dye dissolved in 200μM DMSO was incubated at 37 °C at room temperature for 10 minutes at the working concentration of 5:39 (Hoechst 33258: RPMI 1640 media).
For the cytoplasmic staining, the cells on the coverslip were incubated with SF680R phalloidin (origin, CA1650) at the ratio 5:39 (phalloidin: RPMI 1640 media) followed by the incubation at 37 °C at room temperature for 10 minutes, followed by three rounds of PBS wash.
2.9. Microscopy for Image Capture
The coverslips having fixed cells that are stained for exosomes, nucleus and cytoplasm were mounted onto the slides and captured using Zeiss fluorescent microscope (Axio, Scope.A1) using the Isis software, version 6.3.
2.10. Western Blot
A western blot was performed to characterize exosomes. Cells were obtained and lysed for 30 minutes using the whole proteinase inhibitor cocktail (Roche, Switzerland) in radio immunoprecipitation assay (RIPA) lysis bufer (50 mM Tris–HCl, pH 7.5, 150 mM NaCl, 0.25% sodium deoxycholate, 0.1% nonidet P-40, and 0.1% Triton X-100) at 4 °C for 30 minutes. The isolated exosomes were lysed using ExoLyseP (PEL-25P) at 95 °C for 15 minutes. The supernatant was collected and quantified following centrifugation at 14,000 g for 10 min. The proteins were quantified using BCA assay kit, and 20μg of protein was loaded for SDS-PAGE.
For the following SDS-PAGE, the cell lysates and exosome samples were denatured for 10 minutes at 100 °C after adding the loading buffer. The proteins were then transferred to the PVDF membrane for twenty minutes. Membranes were blocked for two hours at room temperature using 5% BSA in TBST, and then they were incubated with primary antibodies at 1:500 dilution (CD9 (OPR1919), CD63 (OPR4255), and calnexin (OPR1830); origin) for an overnight period at 4˚C. Following four 5-minute-long TBST (TBS, 0.05% Tween-20) washes, the membranes were then incubated for two hours at room temperature with the secondary antibody (1:3000) (peroxidase-conjugated goat anti-rabbit IgG). Lastly, TBST was used to wash the membranes five times for ten minutes each time. The antibody-reactive bands were exposed on radiographic film by using enhanced chemiluminescence (ECL plus, Bio-rad).
2.11. RNA Isolation, cDNA Preparation
Total RNA was isolated from T cells. T cells were treated with cancer-derived exosomes using TRI regent (Sigma Aldrich). subsequently cDNA was synthesized using High-Capacity cDNA Reverse Transcription Kit (Applied Biosystems).
2.12. Nucleic Acid Quality Control
In accordance with the manufacturer's instructions, the RNA and DNA concentrations were measured using NanoQuant. The Infinite200 NanoQuant plate reader was used to measure the absorbance ratios (260/280 and 260/230) in order to approximate the purity of the RNA and cDNA.
2.13. Real Time PCR
The expression of IL10, TGFB1, BAX, GZMB, IL2, IL6, KI67, BCL2, TNFA, and GAPDH was assessed in the T cells and T cells treated with cancer-derived exosomes using real time PCR (CFX Opus 96). The annealing temperatures for each target corresponding to the PCR conditions are given in
Table 1. SYBR Green (origin) was used as the fluorochrome to record the Cq value. The run conditions were: initial denaturation at 95°C for 5 minutes; PCR cycles (40 cycles), denaturation: 95°C for 15 seconds, annealing temperature:
Table 1; melt curve analysis, ramp from 65°C to 95°C.
2.14. Whole Protein Extraction Using Rapigest
The T cells and T cells treated with cancer-derived exosomes from culture flask were harvested using centrifugation at 1000 rpm 5 minutes. The cell pellets were washed two times using 50mM ammonium bicarbonate buffer by centrifugation at 1200 rpm 3 minutes. The washed pellets were treated with 0.5% Rapigest extraction buffer (1mg Rapigest detergent, add 200 ul of 50 mM NH4HCO3/DNAse/Protease inhibitor), resuspend vigorously and sonicate at room temperature for 10 minutes. Repeat the procedure for three times until the DNA is out. Apply two freeze-thaw cycles on liquid nitrogen, and remove the debris through ultracentrifugation at 14000 rpm 10 minutes. Collect the supernatant and store at -80°C.
2.15. Tryptic Digestion
The salt content in the protein extract was removed by Amicon Ultra 0.5ml centrifugal filters with 3000MWCO (Millipore, #UFC500324, 24 Pk). 50 mM ammonium bicarbonate (ABC) (pH 7.8) was the digestion buffer utilized in this investigation. Each sample included around 100 μg of protein that was trypsin digested in solution. Using 100 mM 1,4-dithiothreitol (DTT) in ammonium bicarbonate [Sigma Aldrich, CAS No: 3483-12-3], the samples were first decreased for 30 minutes at 60 °C. The samples were alkylated by incubating them for 30 minutes at room temperature in the dark with 200 mM iodoacetamide in ABC (starting concentration) [Sigma Aldrich, CAS No: 144-48-9]. MS-grade trypsin in ABC [Sigma Aldrich, Cat no: T6567] was used to digest the samples in a 1:25 trypsin (Sigma Aldrich, Cat no: T6567) to protein ratio, where the protein concentration was estimated by BCA assay. The samples were then incubated for 17 hours at room temperature, and the enzymatic process ceased with 1.0% formic acid after 20 minutes at room temperature. The supernatant was obtained after centrifuging the digested peptide solution for 12 minutes at 14,000 rpm.
2.16. Liquid Chromatography – Mass Spectrometry (nLC-MS)
LC gradient conditions include: solvent A: 0.1% formic acid (FA) in water and solvent B: 0.1% formic acid in acetonitrile (ACN). EASY-Spray PepMap RSLC C18 100A° 2um column was used at 40°C (Thermo Scientific) in the Orbitrap Eclipse Fusion Tribid MS connected with Ultimate 3000 RSLC nano UHPLC system (Thermo Scientific). Thermo Fisher Scientific's Easy nLC 1200 equipment was used for reverse phase chromatography to separate the peptides. In short, the C18 nano trap column was loaded with 1 µg of the peptide and allowed to equilibrate at a 5 µL/min flow rate. A 145-minute gradient in solvent B (80% ACN in 0.1% FA) was then used to resolve the peptides on an analytical column (EASY-spray PepMap RSLC C18 reversed-phase column, 2 μm, 75 μm × 500 mm) at a flow rate of 250 nL/min. Each sample received two injections, as duplicate.
The Orbitrap Eclipse Fusion Tribrid MS platform (Thermo Fisher Scientific) was used to measure the spectra when it was in the positive ion mode. At a resolution of 120000, a complete MS scan was conducted, with a range of 350-1650 m/z. The MS parameters include the run duration of 145 minutes in the peptide application mode with NSI ion source type. We employed the following MS parameters: Application Mode: Peptide; Method duration (min): 145;; Ion source type: NSI; Spray voltage: static; Positive ion (V): 1400; Negative ion (V): 600; Gas mode: Static; Sweep gas (Arb): 0; Ion transfer tube temp (°C): 275; Use ion source settings from tune: false; FAIMS Mode: not installed; MS global settings infusion mode: liquid chromatography; Expected LC peak width (s): 10; Advanced peak determination: false; Default charge state: 2; Internal mass calibration:off; Start time (min): 0; End time (min):145; Cycle time (sec):3; Master scan:MS; OT detector type: orbitrap; Orbitrap resolution:120000; Mass range: normal; Use quadrupole isolation: true; Scan range (m/z): 350-1650; RF lens (%): 50; AGC target: standard; Maximum injection time mode: auto; Microscans: 1; Data type: profile; Polarity: positive; Source fragmentation:disabled; Scan description: filters: MIPS; Monoisotopic peak determination:peptide; Intensity threshold:1.0e4; Charge state(s):2-7; Include undetermined charge states: false; Dynamic exclusion: exclude after n times: 1; Exclusion duration (s): 6; Mass tolerance: ppm, low: 10, high: 10 Exclude isotopes: true; Perform dependent scan on single charge state per precursor only: False; Cycle time (Time between Master Scans) (sec): 3; Scan event type 1:Scan:ddMS² IT HCD Isolation Mode: Quadrupole isolation window (m/z):1.6; Isolation offset: off; Activation type: HCD; Collision energy mode: fixed; HCD collision energy type: normalized; HCD collision energy (%): 28; Detector type: ion trap; Ion trap scan rate: rapid; Mass range: normal; Scan range mode: auto; AGC target: standard; Maximum injection time mode: auto; Microscans: 1.
Protein database: uniprotkb_homo_sapiens_and_reviewed_tru_2024_02_15.fasta was used for protein search. The Thermo Scientific™ Proteome Discoverer™ was used to quantify the protein levels. The software workflow is attached as the
supplementary file. By setting the downstream analysis of the peptide spectra matches (PSM) and false discovery rate (FDR) for both protein and peptide to a 1% (strict) and 5% (relaxed), only unique peptides with high confidence were chosen for the final protein group identification. Abundance was calculated by integrating the area under the peak curve. The total abundance of all detected peptides at mentioned FDR was used to normalize the abundance of each protein group. The label-free quantification approach was used to transfer the total median values for each distinct peptide ion abundance to the corresponding protein.
2.17. Bioinformatics and Pathway Enrichment Analysis
The bioinformatics analysis was performed for proteomics data obtained following LC-MS analysis of T cells and T cells treated with cancer-derived exosomes. All possible contaminants found during the MS analysis were eliminated before the differential expression analysis (DEA). An additional filtering criteria was used to examine the peptide data across the duplicate injections. FDR < 0.05 was used to evaluate the peptides that were differentially abundant.
2.18. Statistical Analysis
Two-way ANOVA was performed for the group comparison of RNA expression between T cells, T cells treated with ADC-derived exosomes, and SCC-derived exosomes. The analysis was performed using GraphPad prism 9.0, and the p < 0.05 was considered statistically significant. For the MS data, log2FC was calculated for individual proteins, and p value was calculated using student t-test. Fold change ≤ or ≥ 1 was considered decreased or increased abundance, respectively. The FDR<0.05 was considered statistically significant.
3. Results
3.1. Identification and Characterization of ADC and SCC-Derived Exosomes
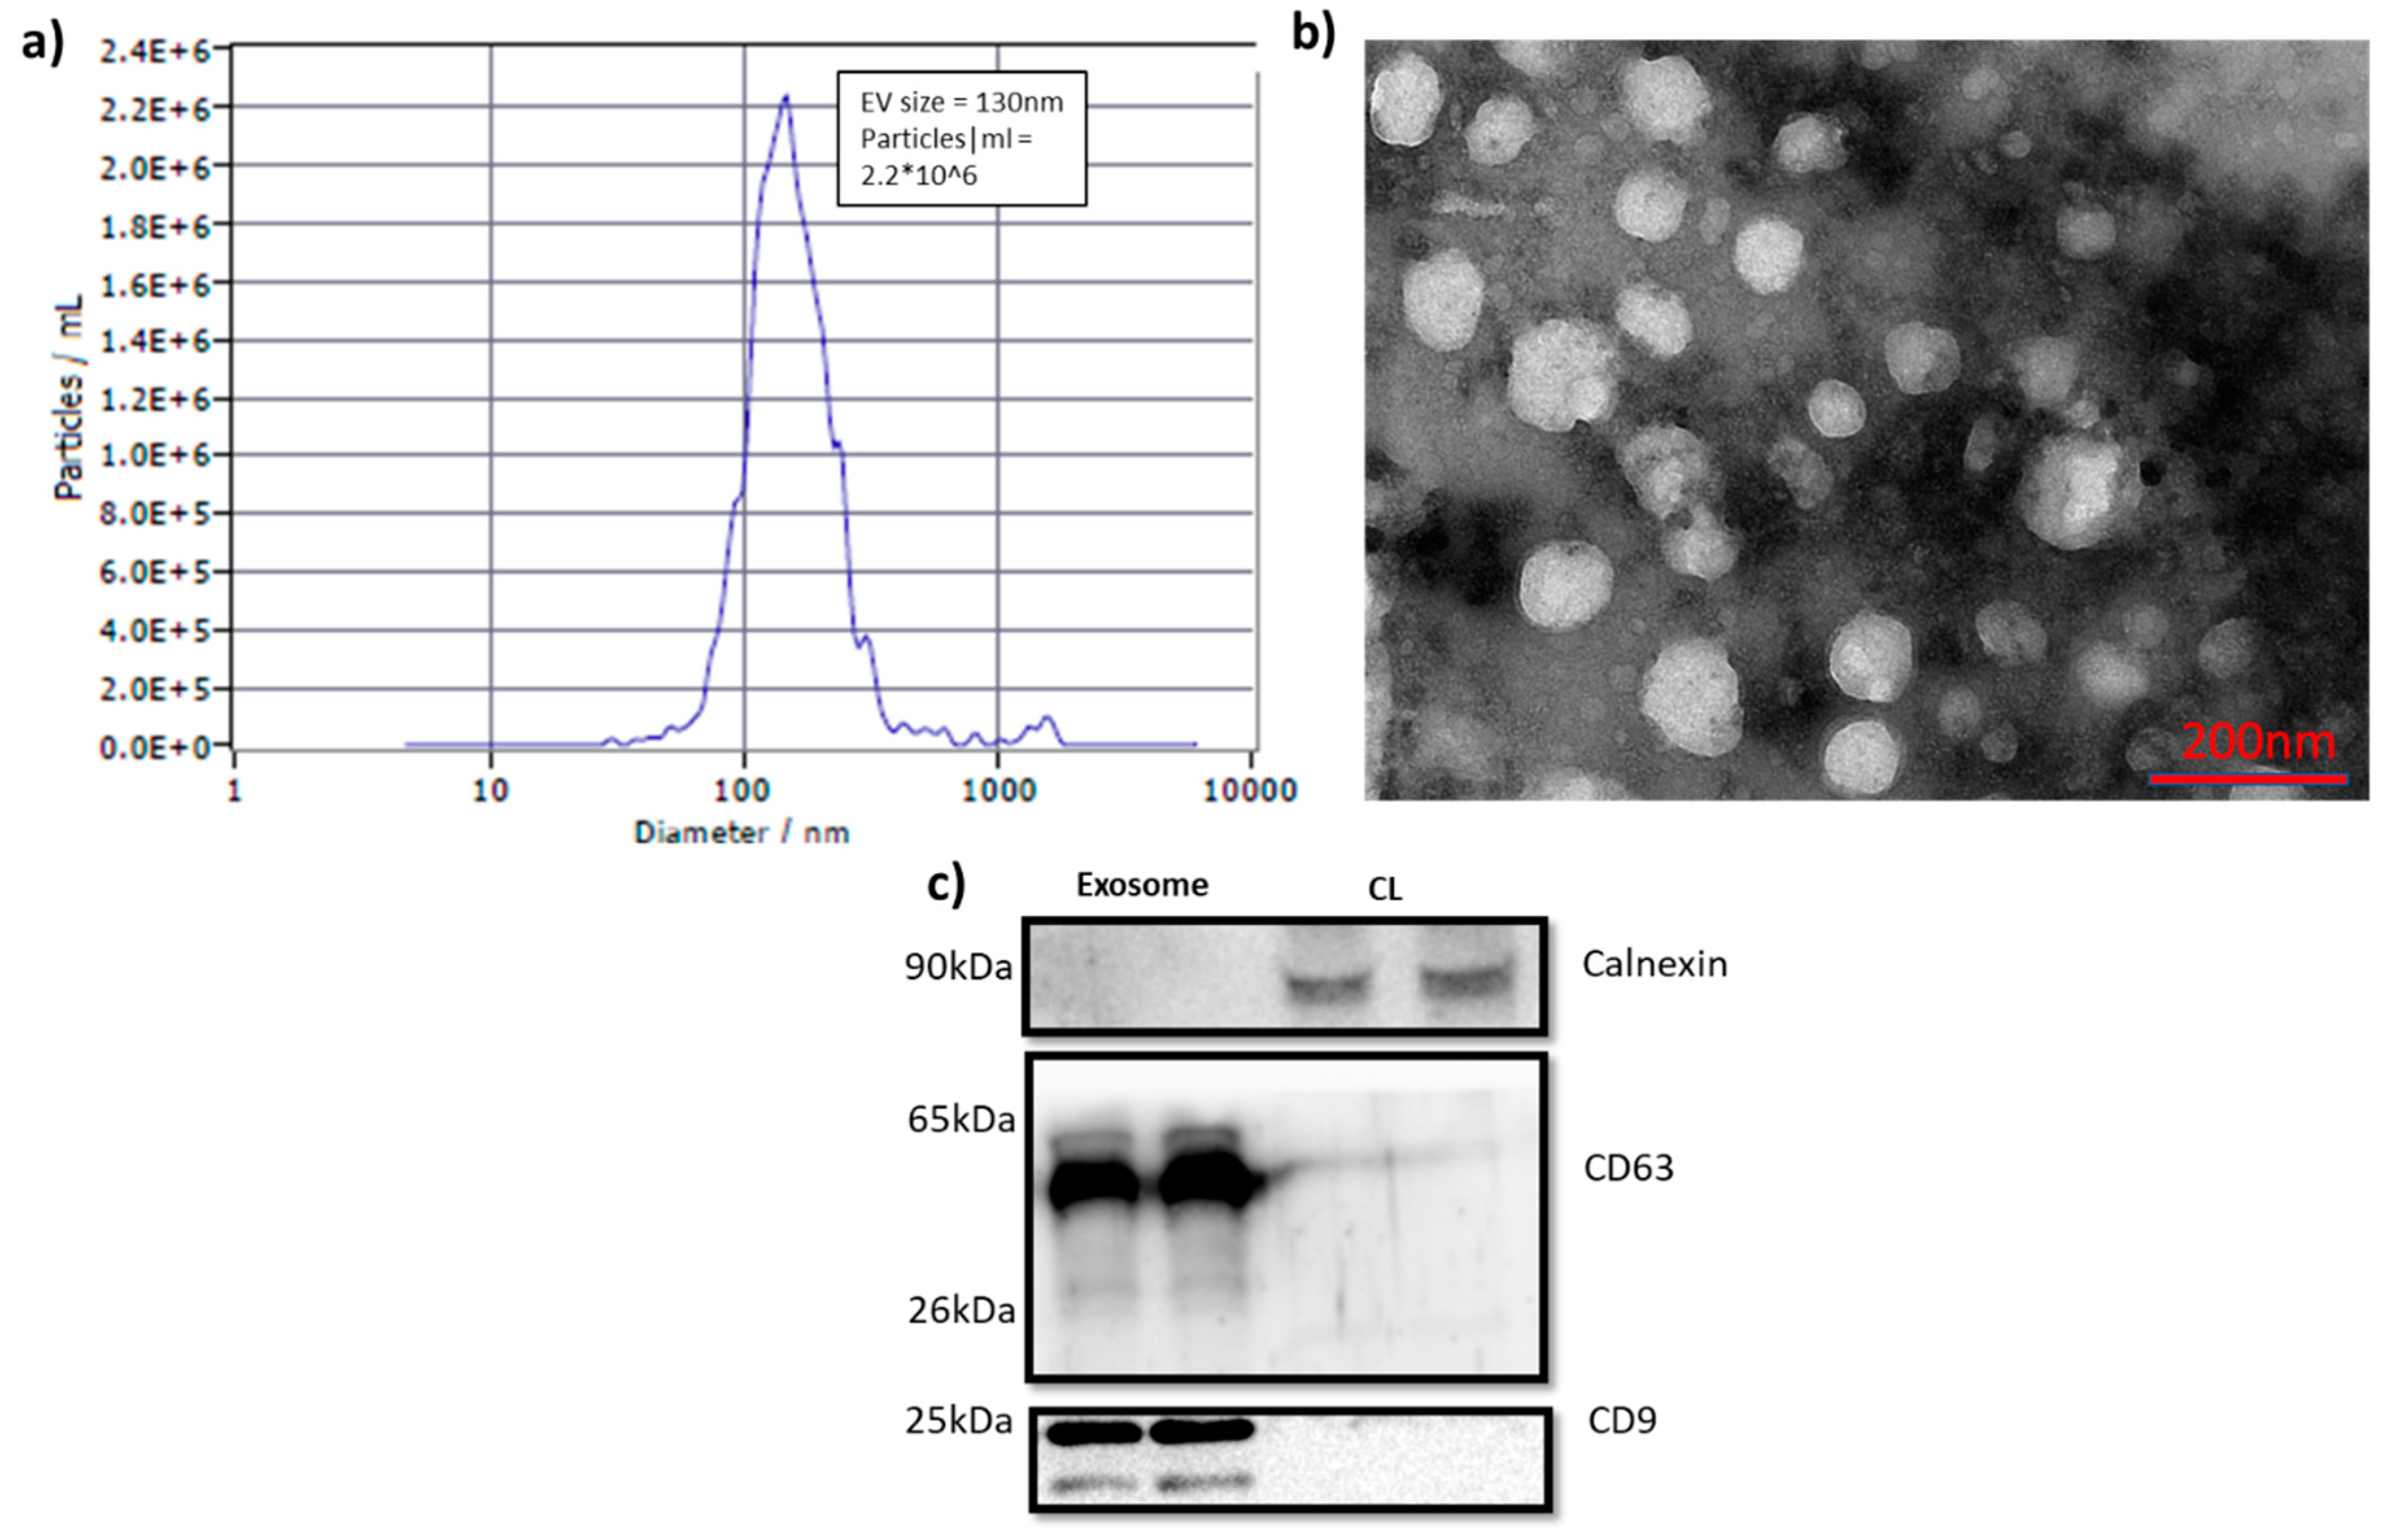
Exosomes were isolated from cell culture media of A549 and SKMES1 cells using precipitation method. NTA showed a particle concentration of 2.2*10^6 per ml of culture media (
Figure 1A) with a diameter range of 130nm ± 20nm. The structure of the isolate was characterized using TEM (
Figure 1B), and the spherical structure with a diameter ranged from 30 to 180nm was observed. The vesicles were blotted against tetraspanins CD9, and CD63 (
Figure 1C). The presence of CD9 and CD63 were unique to exosome samples, indicating the characteristic markers of exosomes. Calnexin was used to assess the cellular contamination, which was negligible in exosome samples. The observations from NTA, TEM and immune blotting indicated the presence of pure exosomes in the isolates.
3.2. Cancer-Derived Exosome Uptake by T Cells and Its Impact on Viability
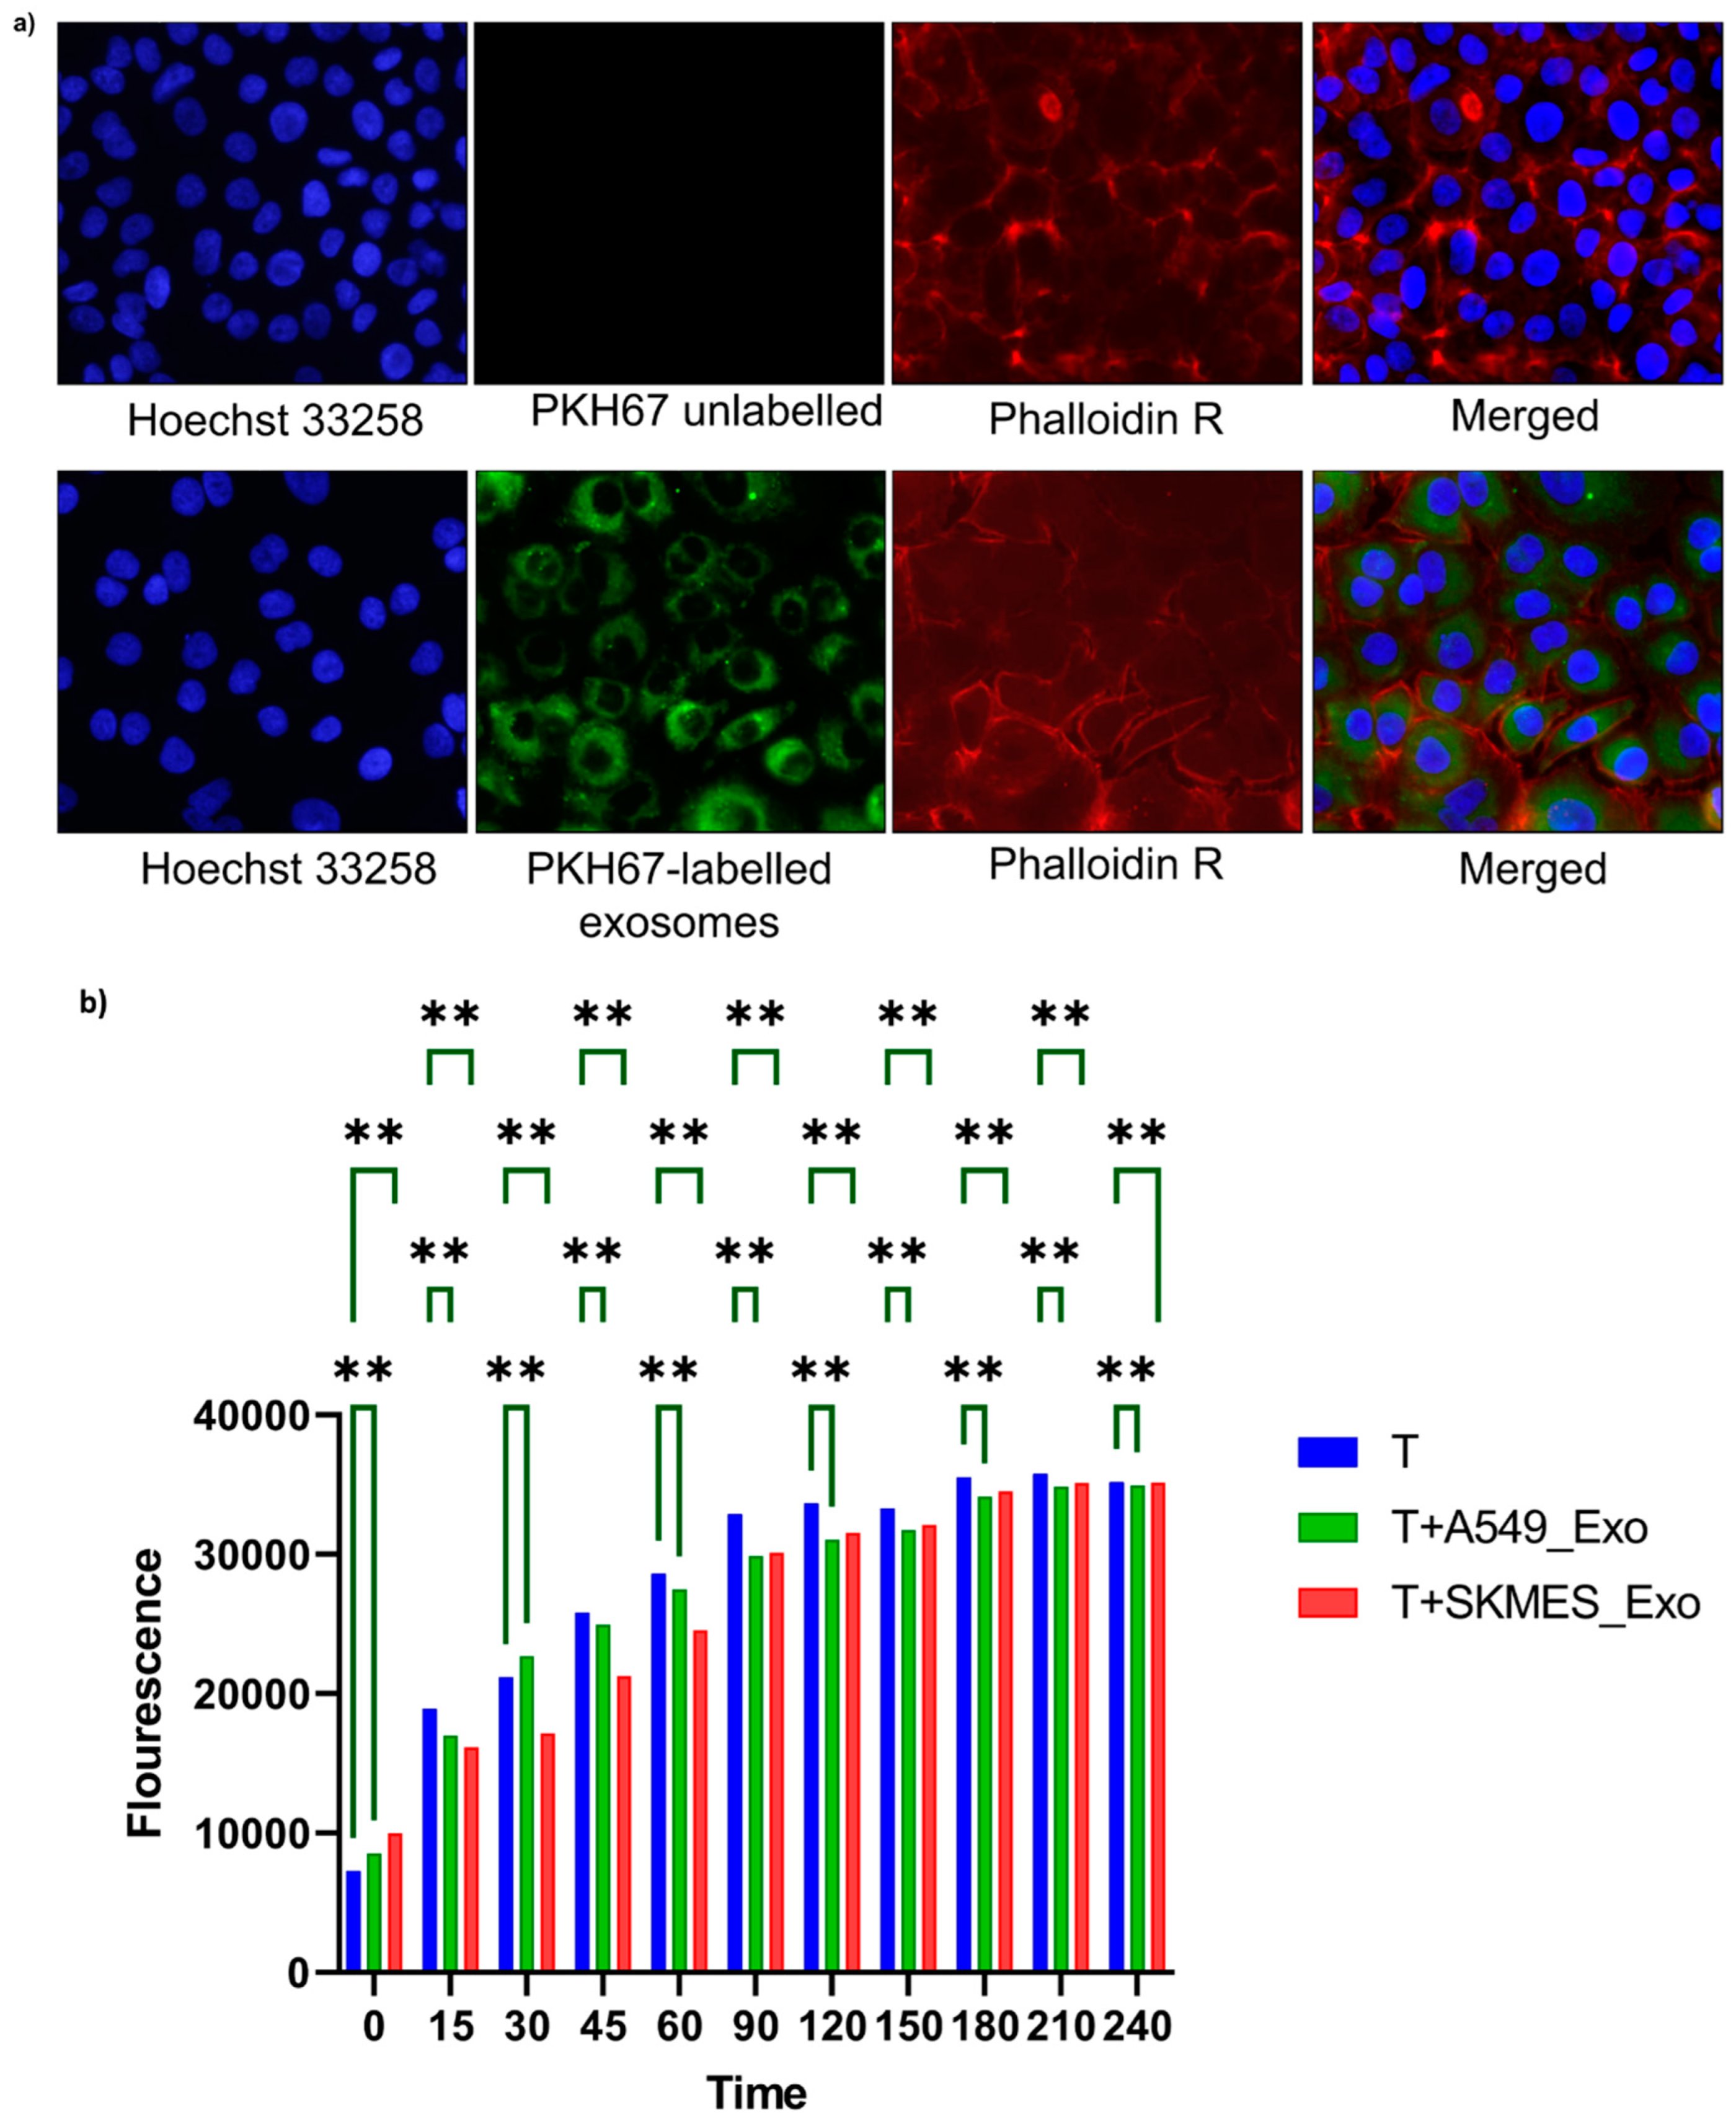
We then treated T cells with PKH67 labelled cancer-derived exosomes (50ug|ml) and kept for 24 hours at appropriate growth conditions. The immune cells post incubation were fixed and stained with Hoechst nuclear dye and captured under fluorescent microscope (
Figure 2A).
The resazurin viability assay was performed to assess the viability index of T cells upon A549 and SKEMS1-derived exosome treatment (
Figure 2B). For this, we set up three groups: T cells; T cells treated with A549-derived exosomes (T_Ax); and T cells treated with SKMES1-derived exosomes (T_Sx). Resazurin assay was performed after 24 hours of exosome incubation. The viability was high in the first two hours in the T cells relative to T_Ax and T_Sx treatment groups, but came to an equilibrium post two hours. This indicates a temporary restraining effect of cancer-derived exosomes on T cells.
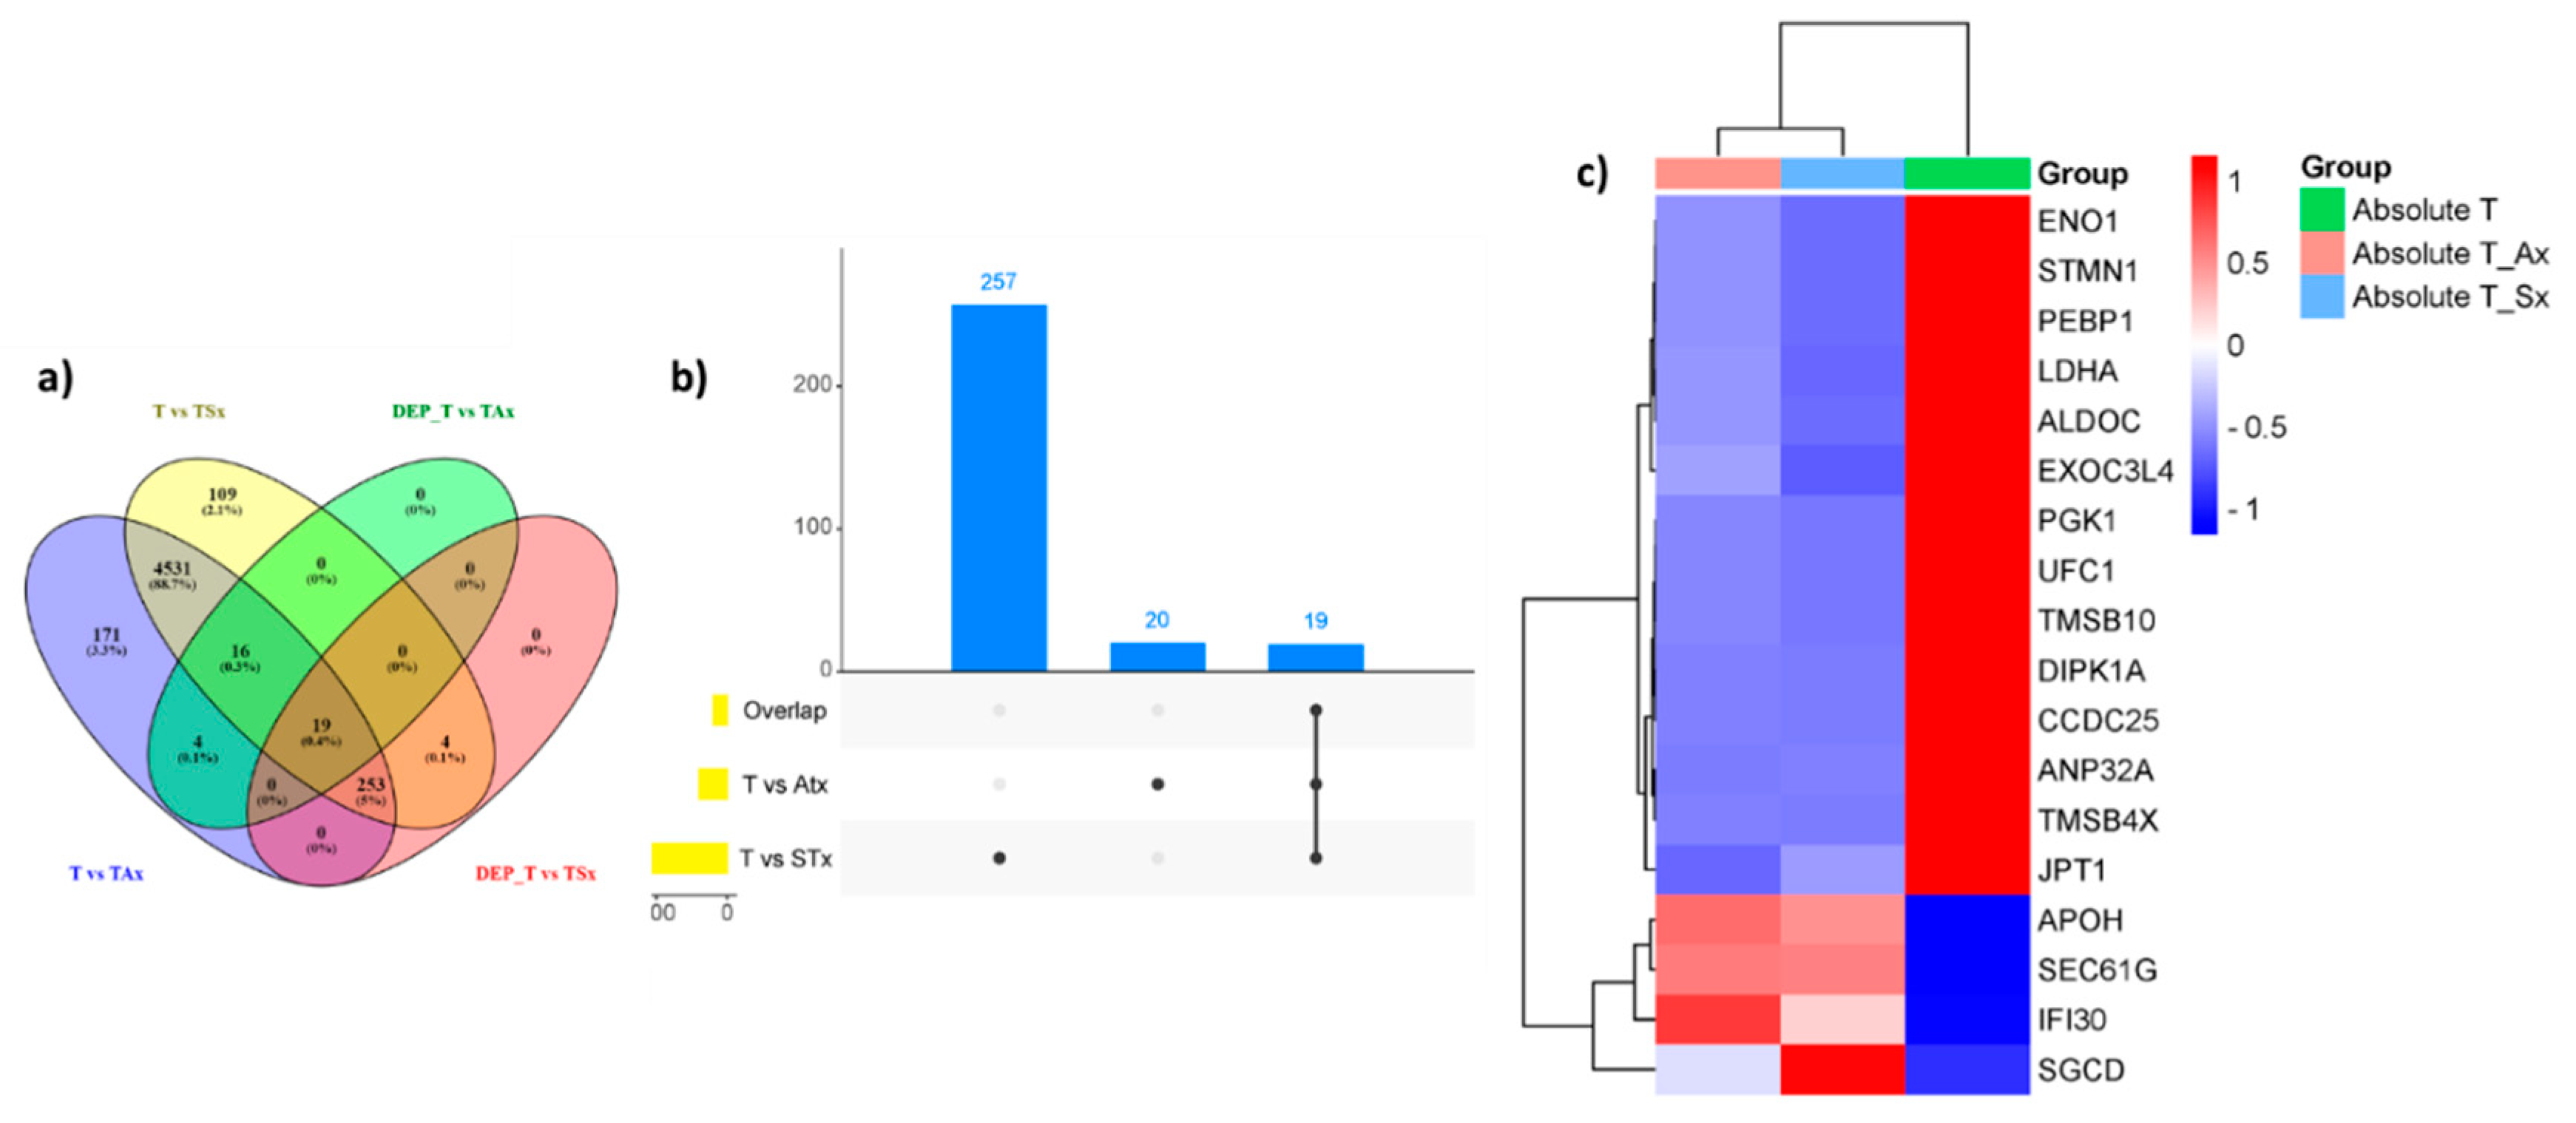
3.3. Comparative Analysis of Protein Abundance in T Cells Treated with ADC and SCC-Derived Exosomes
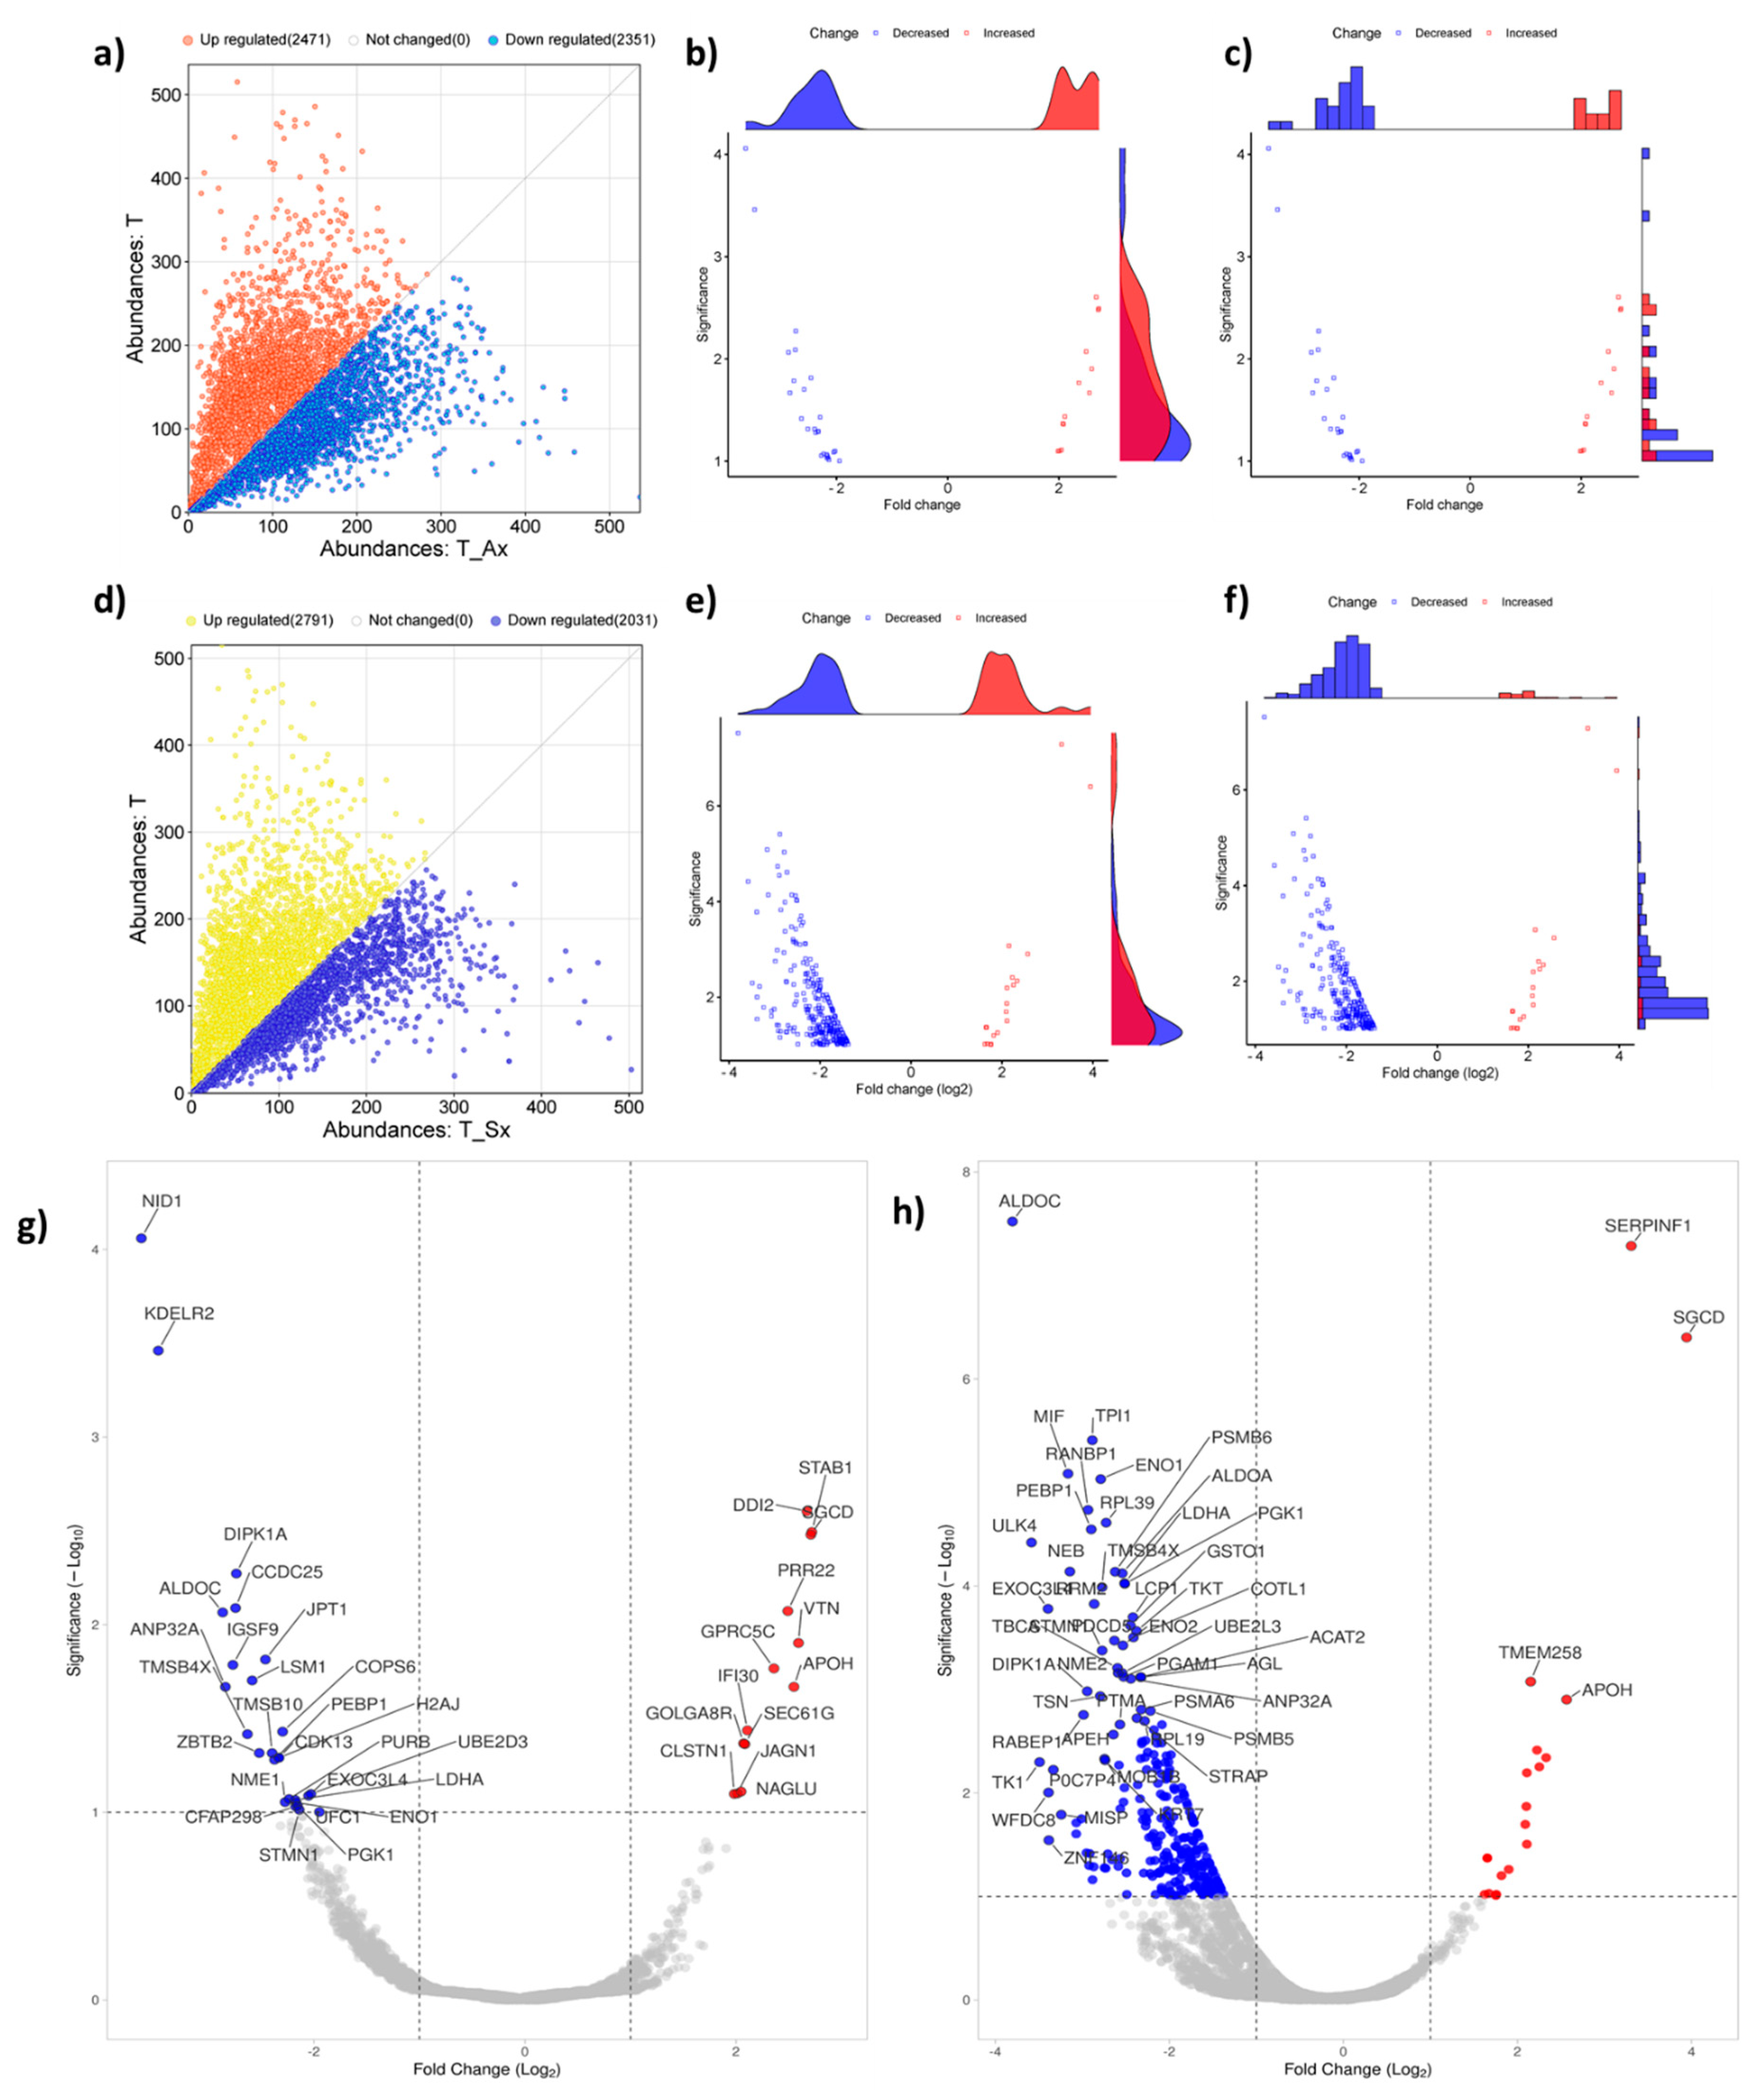
The quantitative proteomic analysis of T cells and T cells treated with exosomes derived from ADC (T_Ax) and SCC (T_Sx) was performed using LC-MS orbitrap. The initial comparison using absolute protein abundance between T cells and T_Ax showed 2471 highly abundant proteins and 2351 low abundant proteins (
Figure 3A), while the comparison between T cells and T_Sx showed 2791 highly abundant and 2031 low abundant proteins (
Figure 3D). Absolute values were converted into fold change (log2FC), and p values (log10p) were calculated using T test. Proteins with ±1 FC and FDR <0.05 were considered to trace out differentially abundant proteins (DAP) between the control and treatment groups.
Distribution of DAP between T cells and T_Ax (
Figure 3B, C), and T cells and T_Sx (
Figure 3E, F), and the best hit fifty proteins are labelled in
Figure 3G (T cell vs T_Ax) and
Figure 3H (T cell vs T_Sx). Total 39 DAP were traced in the T_Ax group (
Supplemetary Table S1), and 276 in T_Sx group (
Supplemetary Table S2). 20 proteins were common to both the treatment groups (Figure 6B), suggestive of a group of proteins altered by cancer-derived exosomes.
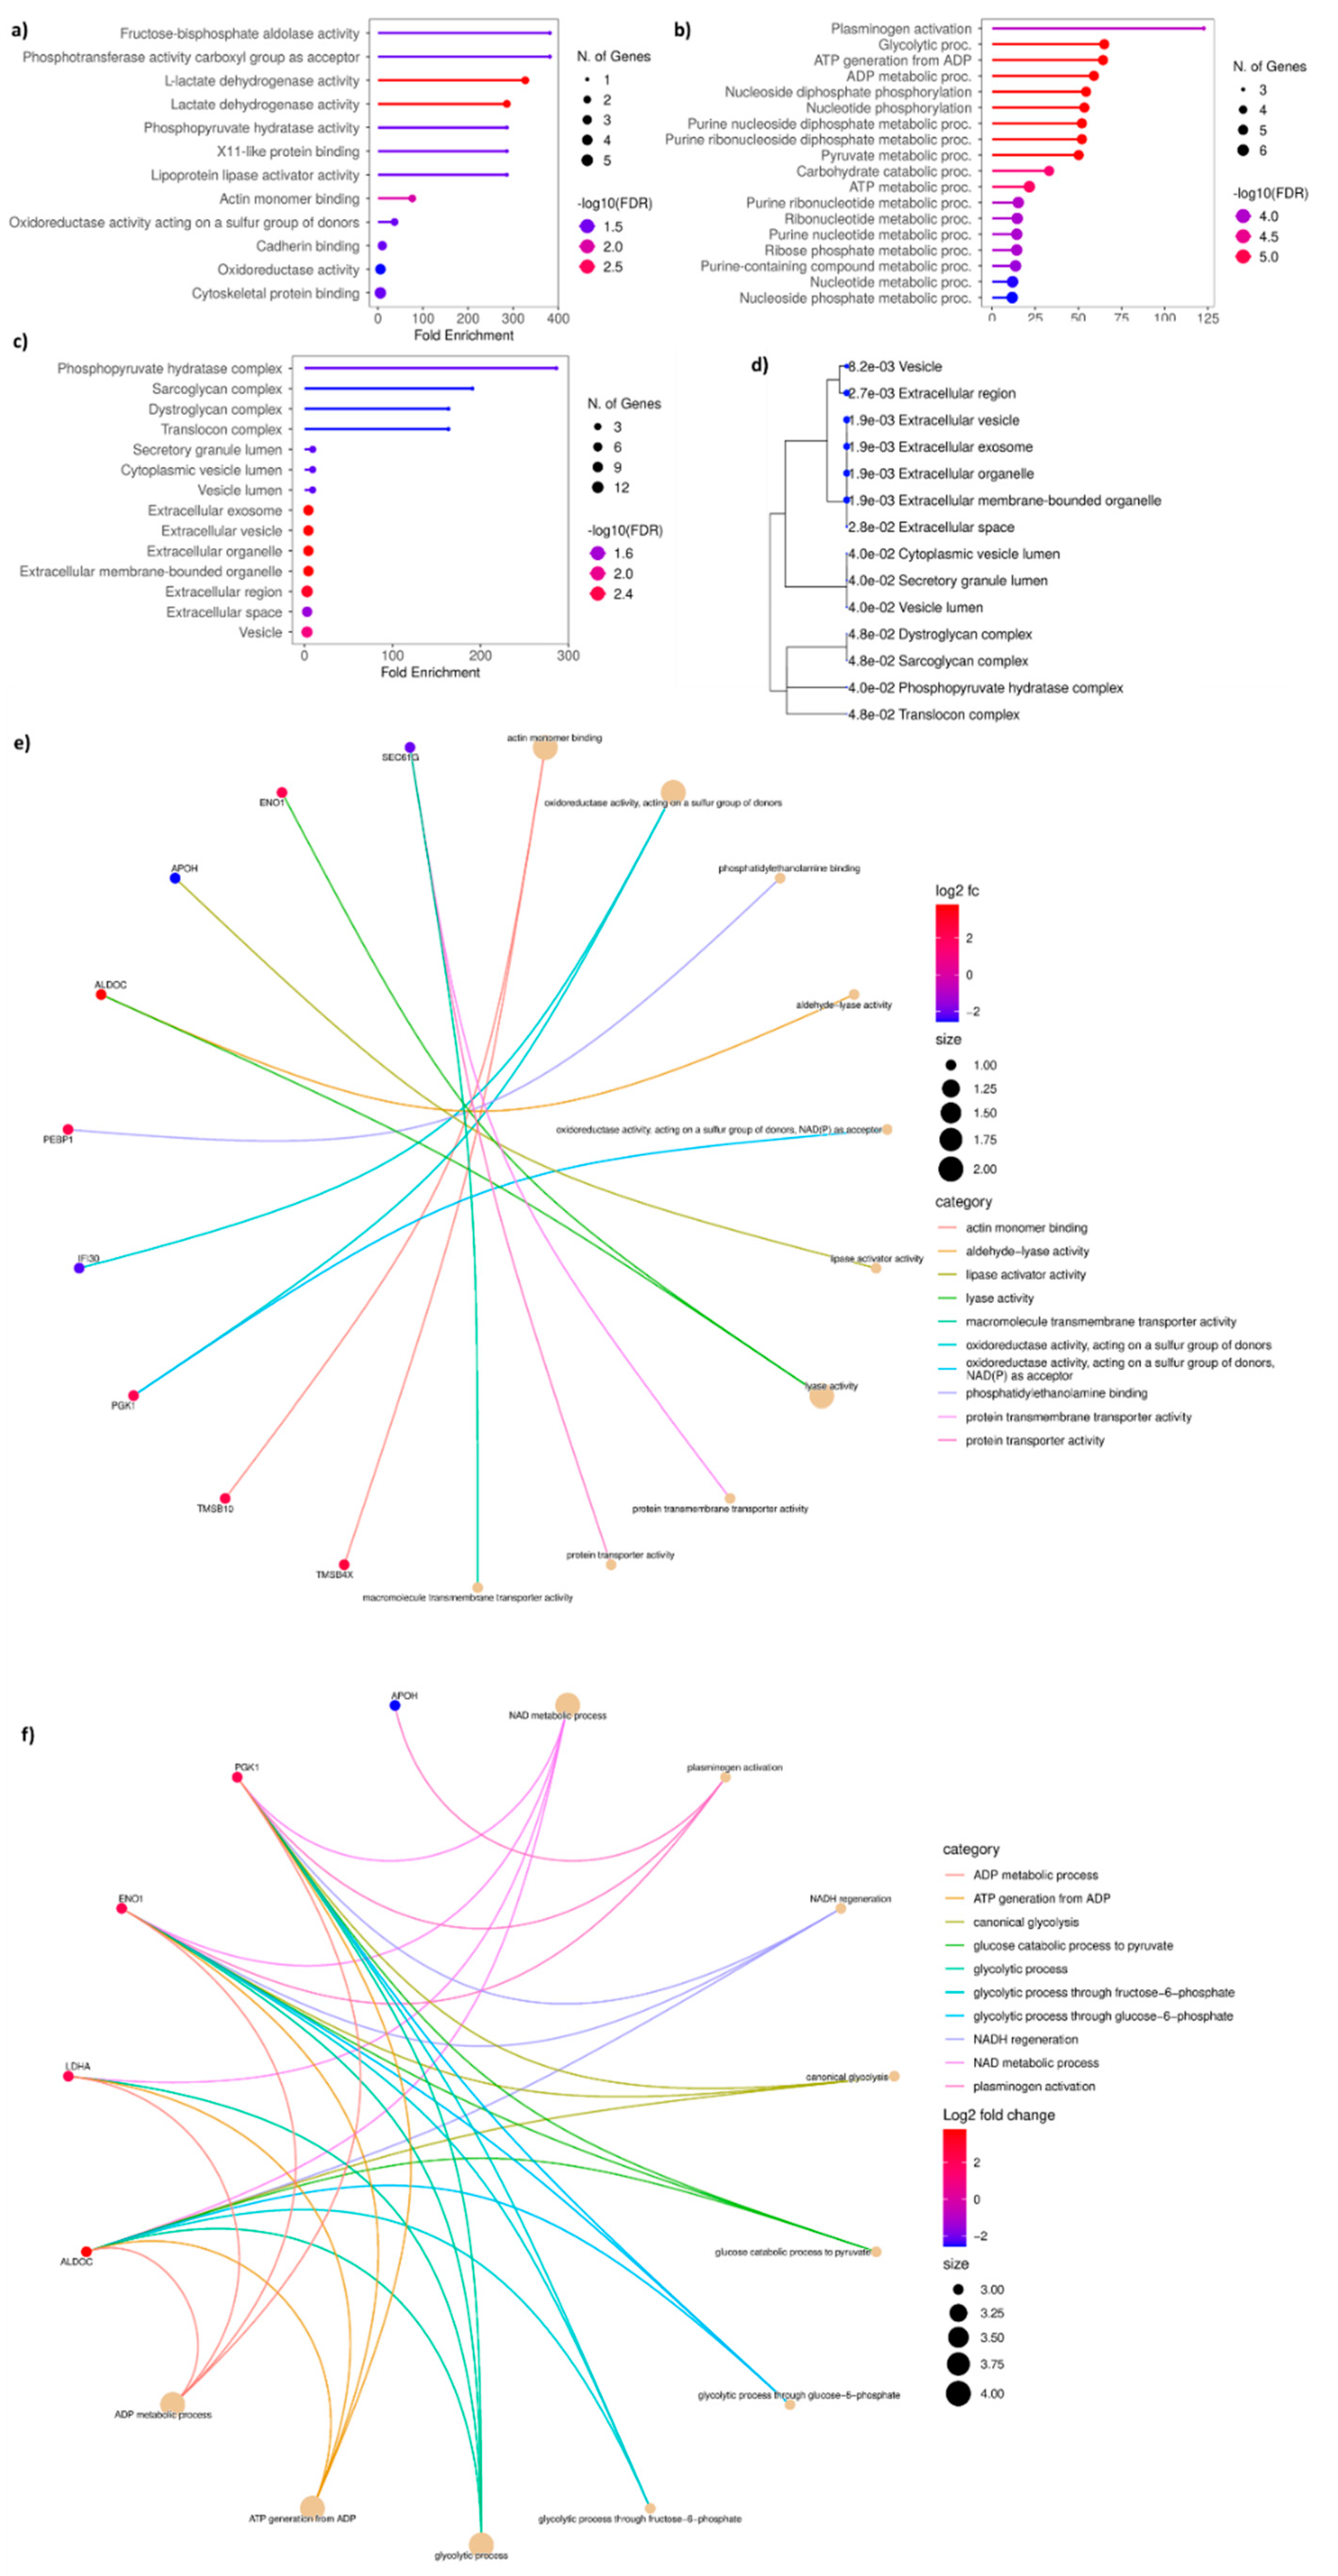
3.4. Gene Ontology of DAP Between T Cells and T Cells Treated with ADC Exosomes
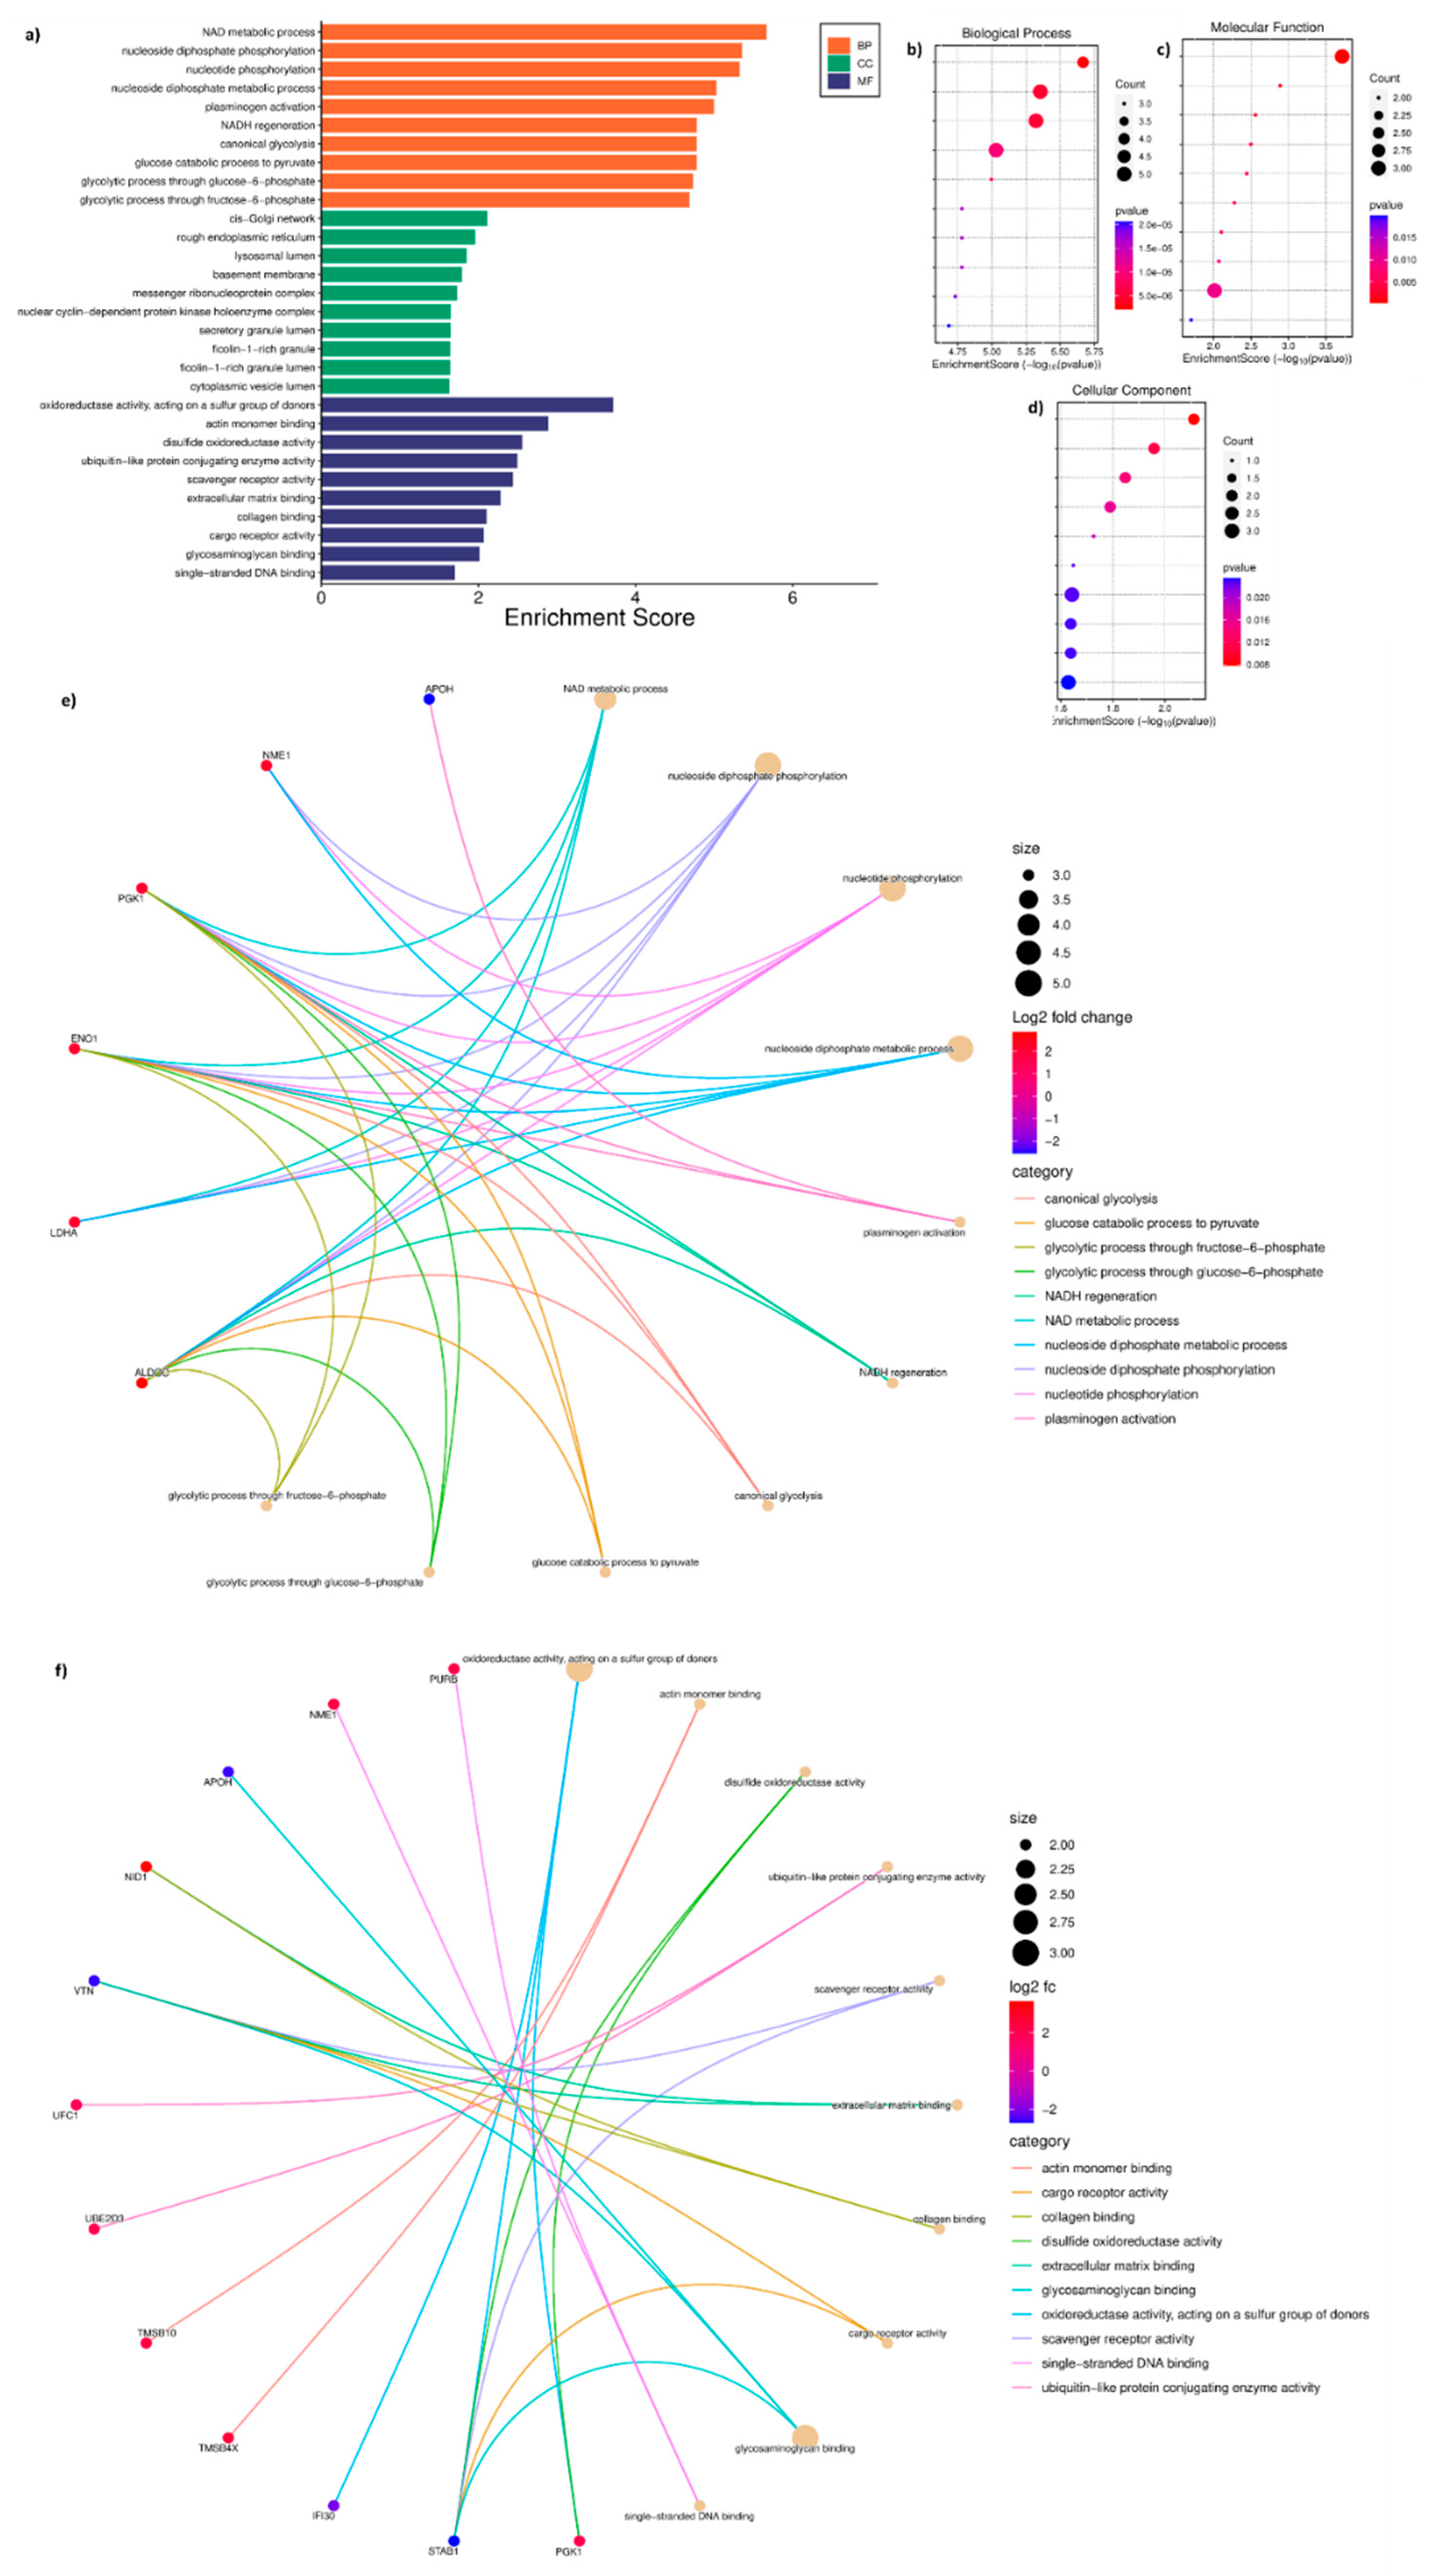
The GO analysis performed using 39 DAP between T cells and T_Ax group indicated the following under: biological process (BP), NAD metabolic process, nucleoside disphosphate phosphorylation and metabolism, nucleotide phosphorylation, plasminogen activation, NADH regeneration, and glycolysis (
Figure 4A, B); molecular function (MF), oxidoreductase activity, actin monomer binding, ubiquitin-like protein activity, scavenger receptor activity, extracellular matrix (ECM) binding, collagen binding, cargo receptor activity, glycosaminoglycan binding, and ssDNA binding(
Figure 4A, C); cytoplasmic compartmentalisation (CC), cis-golgi, rough endoplasmic reticulum, lysosomal lumen, basement membrane, messenger ribonucleoprotein, secretory granule lumen, ficolin-1-rich granule and lumen, and cytoplasmic vesicle lumen(
Figure 4A, D). The protein candidates involved in the corresponding GO mentioned above has been represented in the cnetplot in
Figure 4E and
Figure 4D.
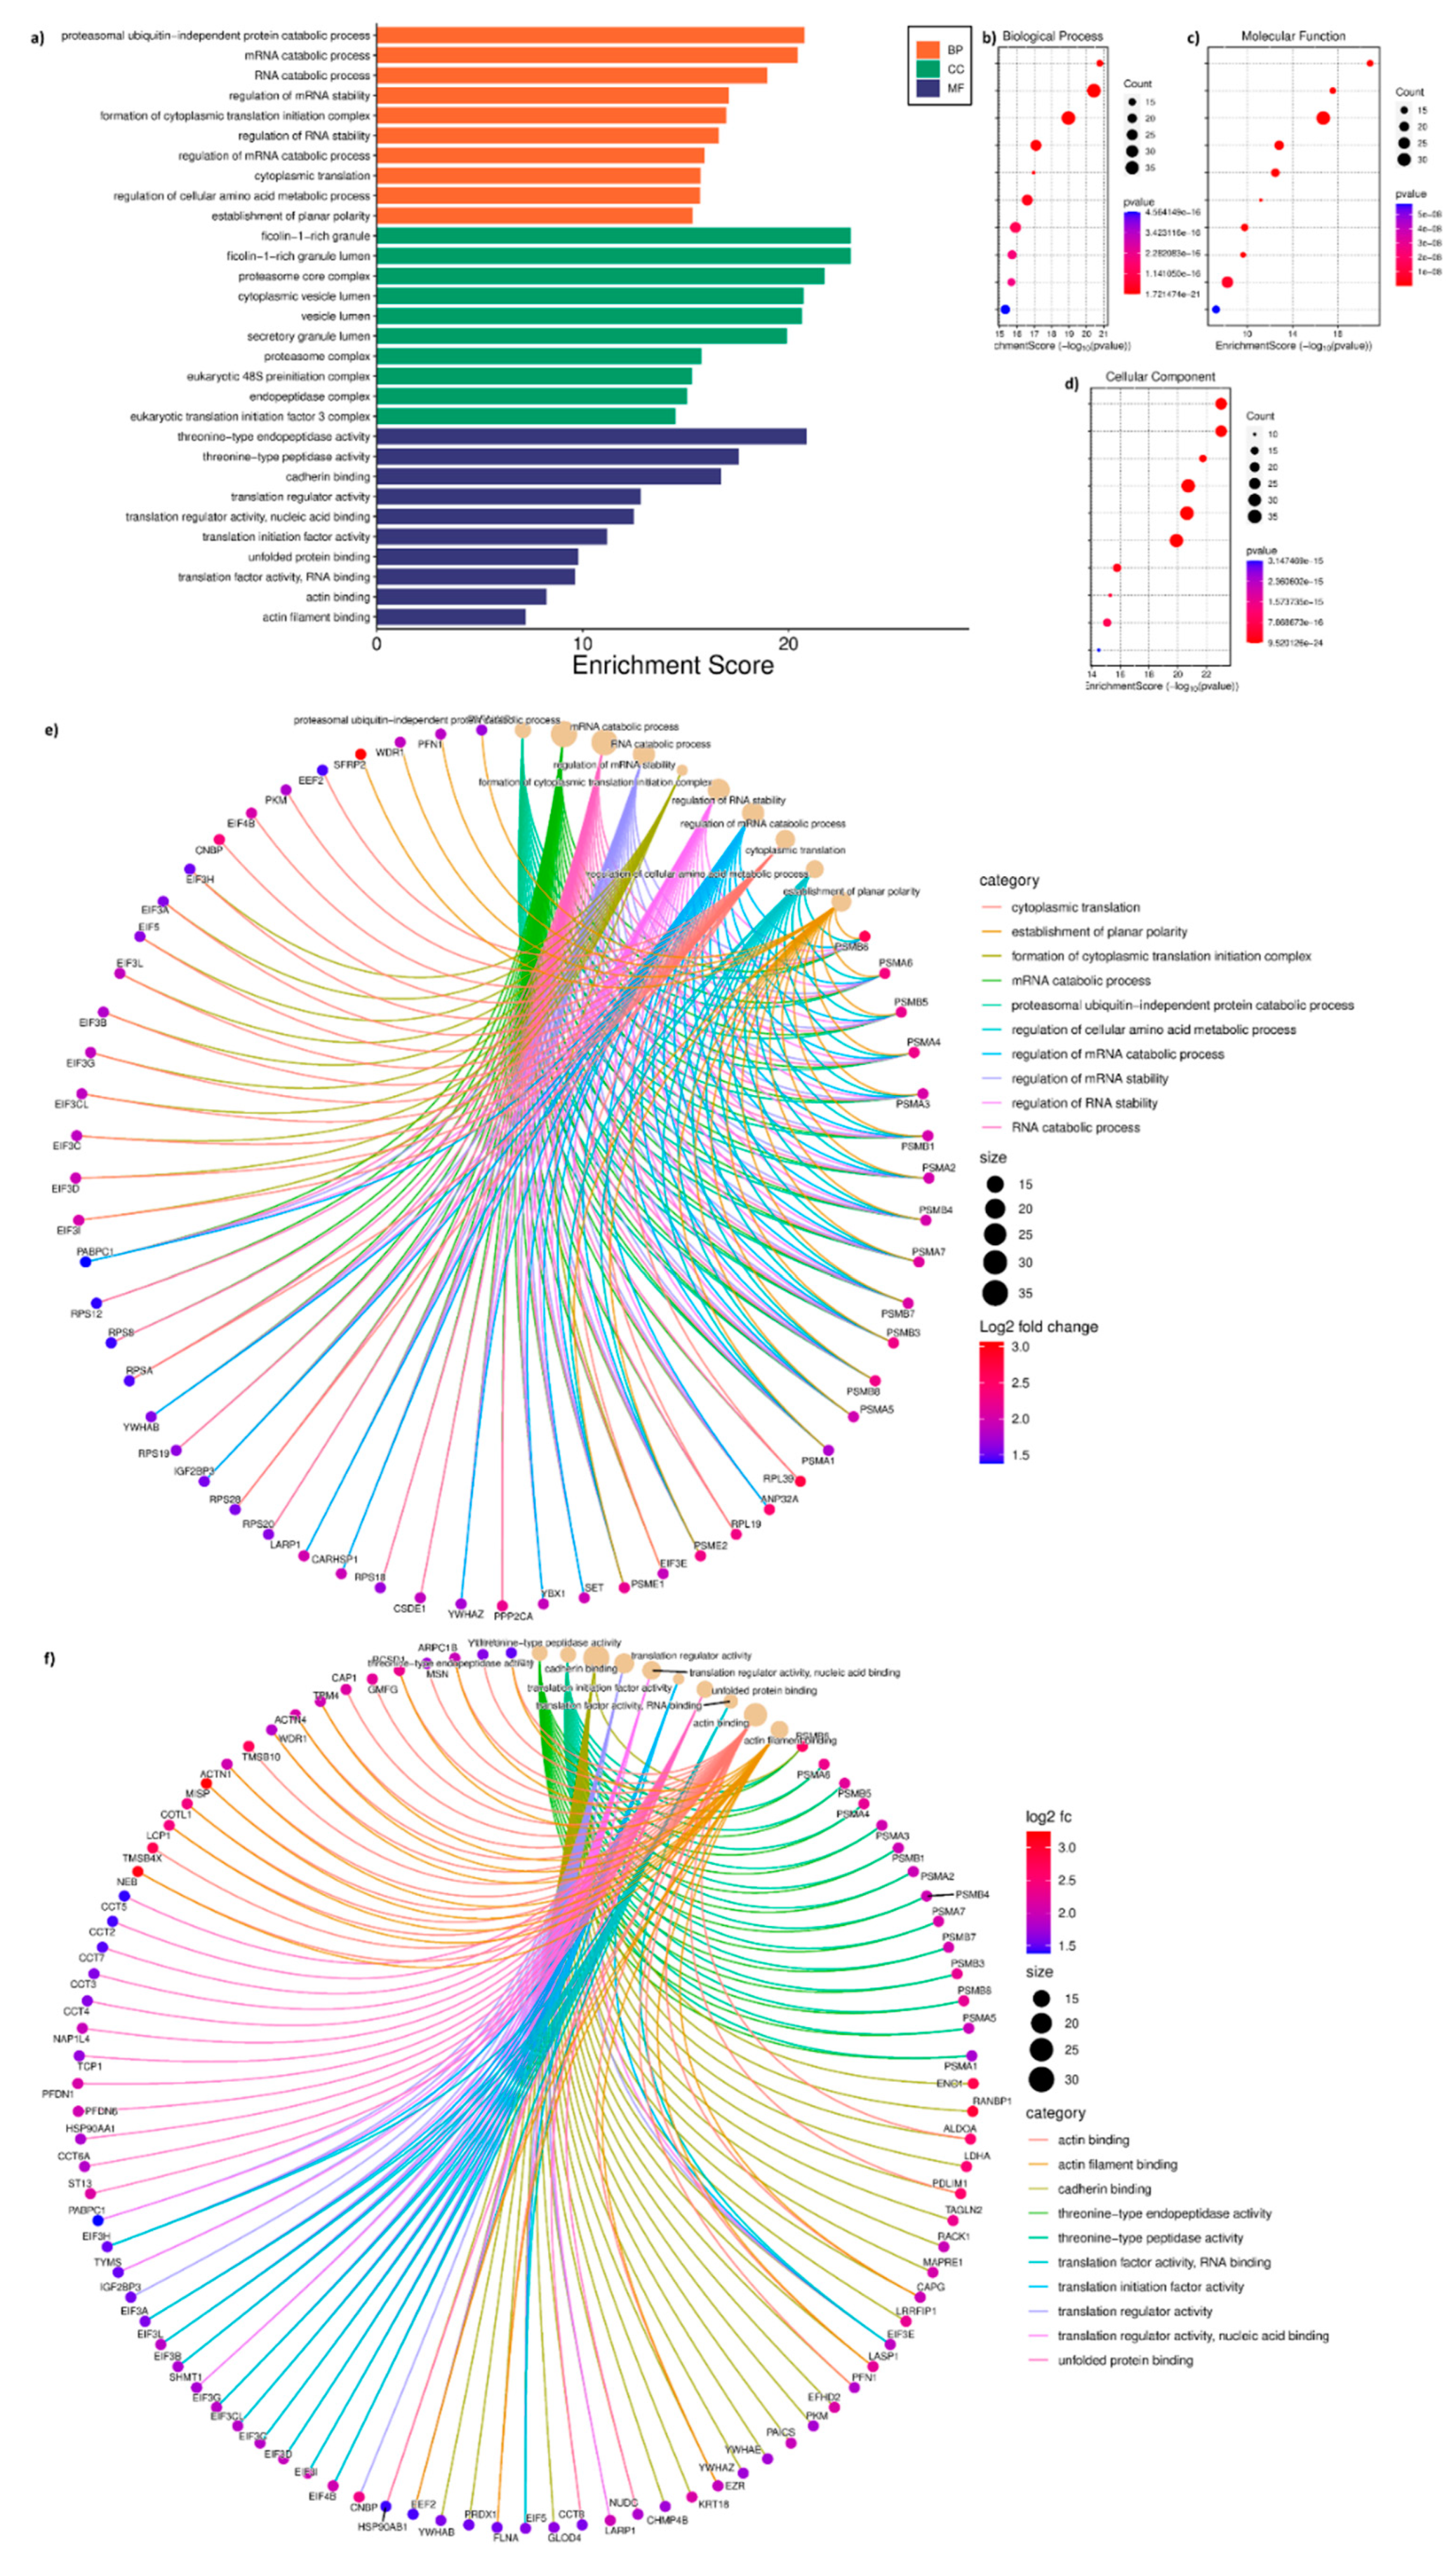
3.5. Gene Ontology of DAP of T Cells and T Cells Treated with SCC Exosomes
The GO analysis performed using 276 DAP between T cells and T_Sx group indicated the following under: biological process (BP), proteasomal protein catabolic process (ubiquitin independent), mRNA catabolic processes and stability regulation, formation of cytoplasmic translation initiation complex, cytoplasmic translation, amino acid metabolic process, and planar polarity establishment (
Figure 5A, B); molecular function (MF), threonine-type endopeptidase and peptidase activity, cadherin binding, translation regulation activity, unfolded protein binding, actin binding and actin filament binding (
Figure 5A, C); cytoplasmic compartmentalisation (CC), ficolin-1-rich granule and lumen, proteasome core complex, cytoplasmic vesicle lumen, secretory granule lumen, eukaryotic 48s preinitiation complex, endopeptidase complex, and translation initiation factor 3 complex (
Figure 5A, D). The protein candidates involved in the corresponding GO mentioned above has been represented in the cnetplot in
Figure 5E and
Figure 5D.
3.5. Commonly Expressed Proteins upon T Cell Treatment with ADC and SCC Derived Exosomes
Nineteen proteins were common to DAP in T_Ax and T_Sx (
Figure 6A-C). We then analysed this intersection set to find whether these proteins possess any specific action on T cells. Interestingly, the GO of CC suggested the presence of these proteins in the cellular and extracellular lumen, indicating further release of these proteins in the vesicles by recipient cells (
Figure 7C, D). The BP (
Figure 7A) and MF (
Figure 7B) of the intersection set was mostly linked to nucleic acid metabolism. The protein candidates involved in the corresponding GO mentioned above has been represented in the cnetplot in
Figure 7E and
Figure 7D.
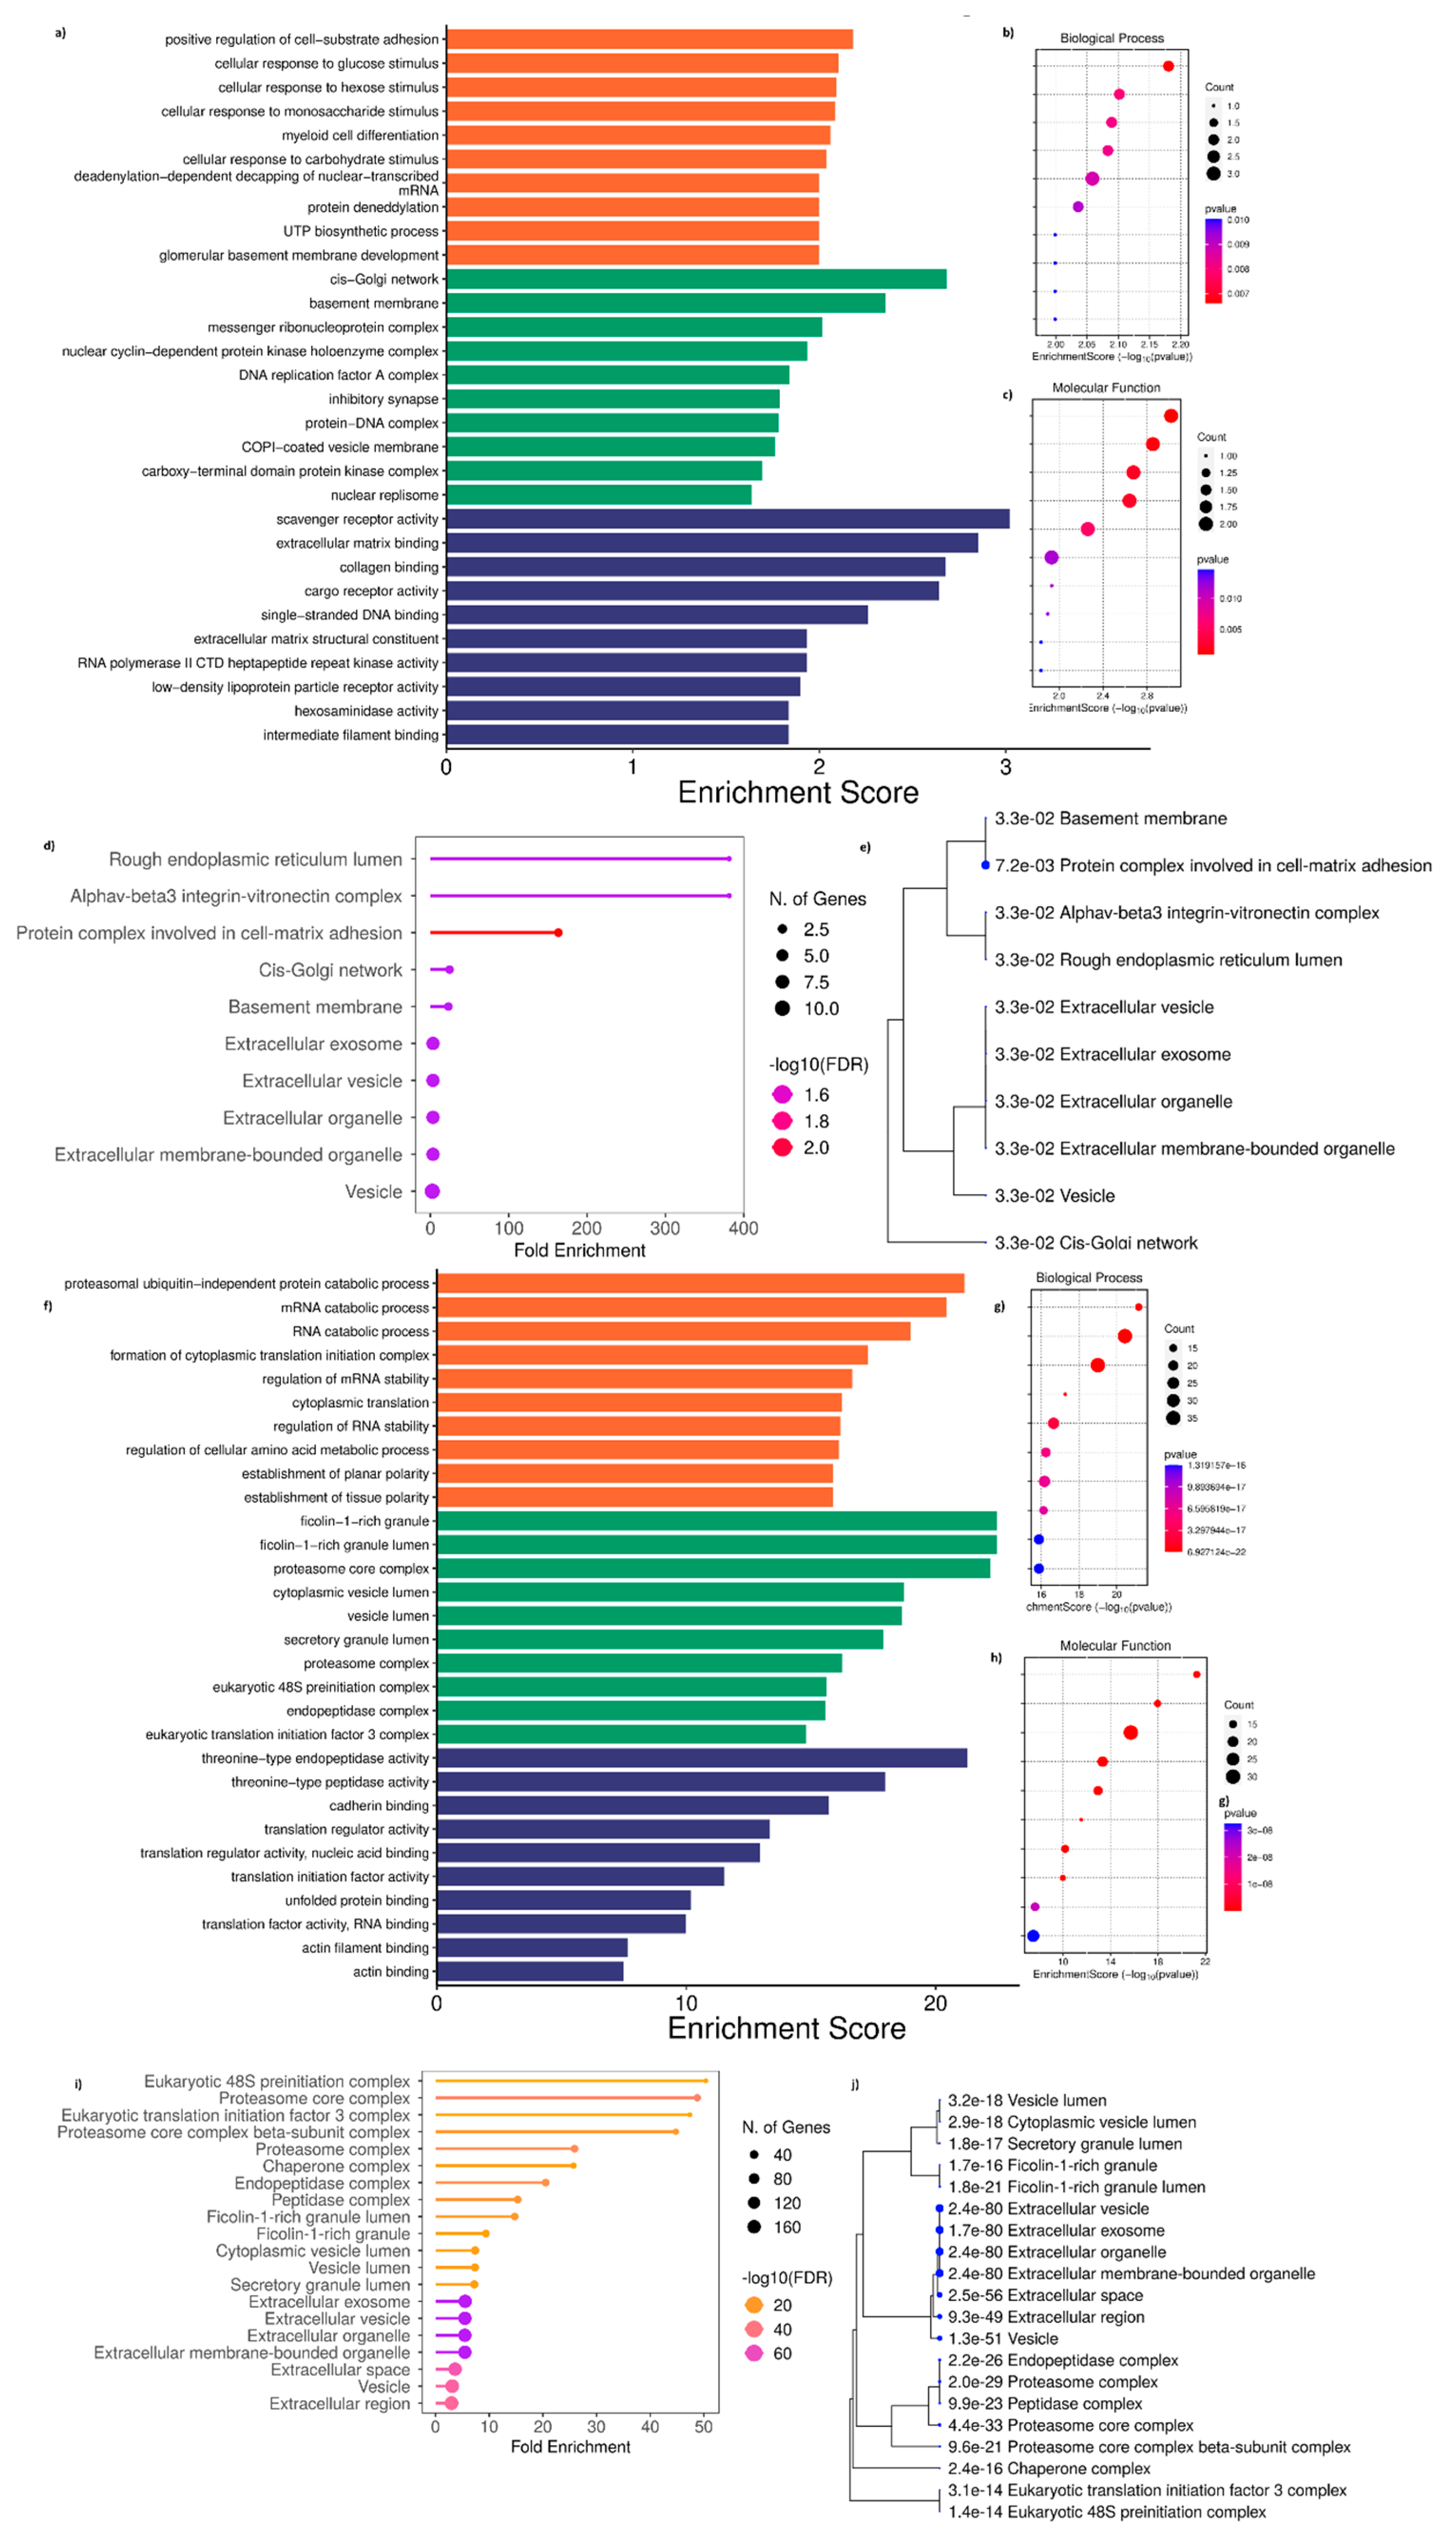
Interestingly, the GO performed using DAP unique to T cells treated with ADC-derived exosomes (complement set of T_Ax vs T_Ax Ո T_Sx) (
Figure 8D, E;
Supplementary Figure S1) and DAP unique to T cells treated with SCC derived exosomes (complement set of T_Sx vs T_Ax Ո T_Sx) (
Figure 8I, J;
Supplementary Figure S2) also showed CC in the extracellular and vesicle lumen. The complement set of T_Sx vs T_Ax Ո T_Sx also showed their presence in the ficolin-1-rich granule, cytoplasmic vesicle lumen, proteasome and chaperone complex, and in eukaryotic translation initiation complex. Otherthan the cytoplasmic and luminal presence, the complement set of T_Ax vs T_Ax Ո T_Sx was localized at cell-matrix adhesion, rough ER lumen, and cis-golgi network.
Moreover, the GO performed for DAP unique to T_Ax showed the involvement in cell substrate adhesion, cellular response to glucose and monosaccharide stimulus, myeloid cell differentiation, protein deneddylation, and UTP biosynthetic process (
Figure 8A, B) under BP. Scavenger receptor activity, ECM binding, collagen binding, cargo receptor activity, ssDNA binding, RNA polymerase II CTD kinase activity, LDLR activity, and intermediate filament binding under MF (
Figure 8A, C).
Additionally, the GO performed for DAP unique to T_Sx showed the involvement in proteasomal ubiquitin-independent catabolic activity, RNA catabolic process, cytoplasmic translational initiation complex, mRNA and RNA stability regulation, amino acid metabolic process regulation, and establishment of tissue planar polarity (
Figure 8F, G) under BP. Threonine type endopeptidase and peptidase activity, cadherin binding, translation regulator binding, translation initiation factor activity, unfolded protein binding, RNA binding, and actin filament binding under MF (
Figure 8F, H).
3.6. Cytokine Regulation in T Cells by Cancer-Derived Exosomes
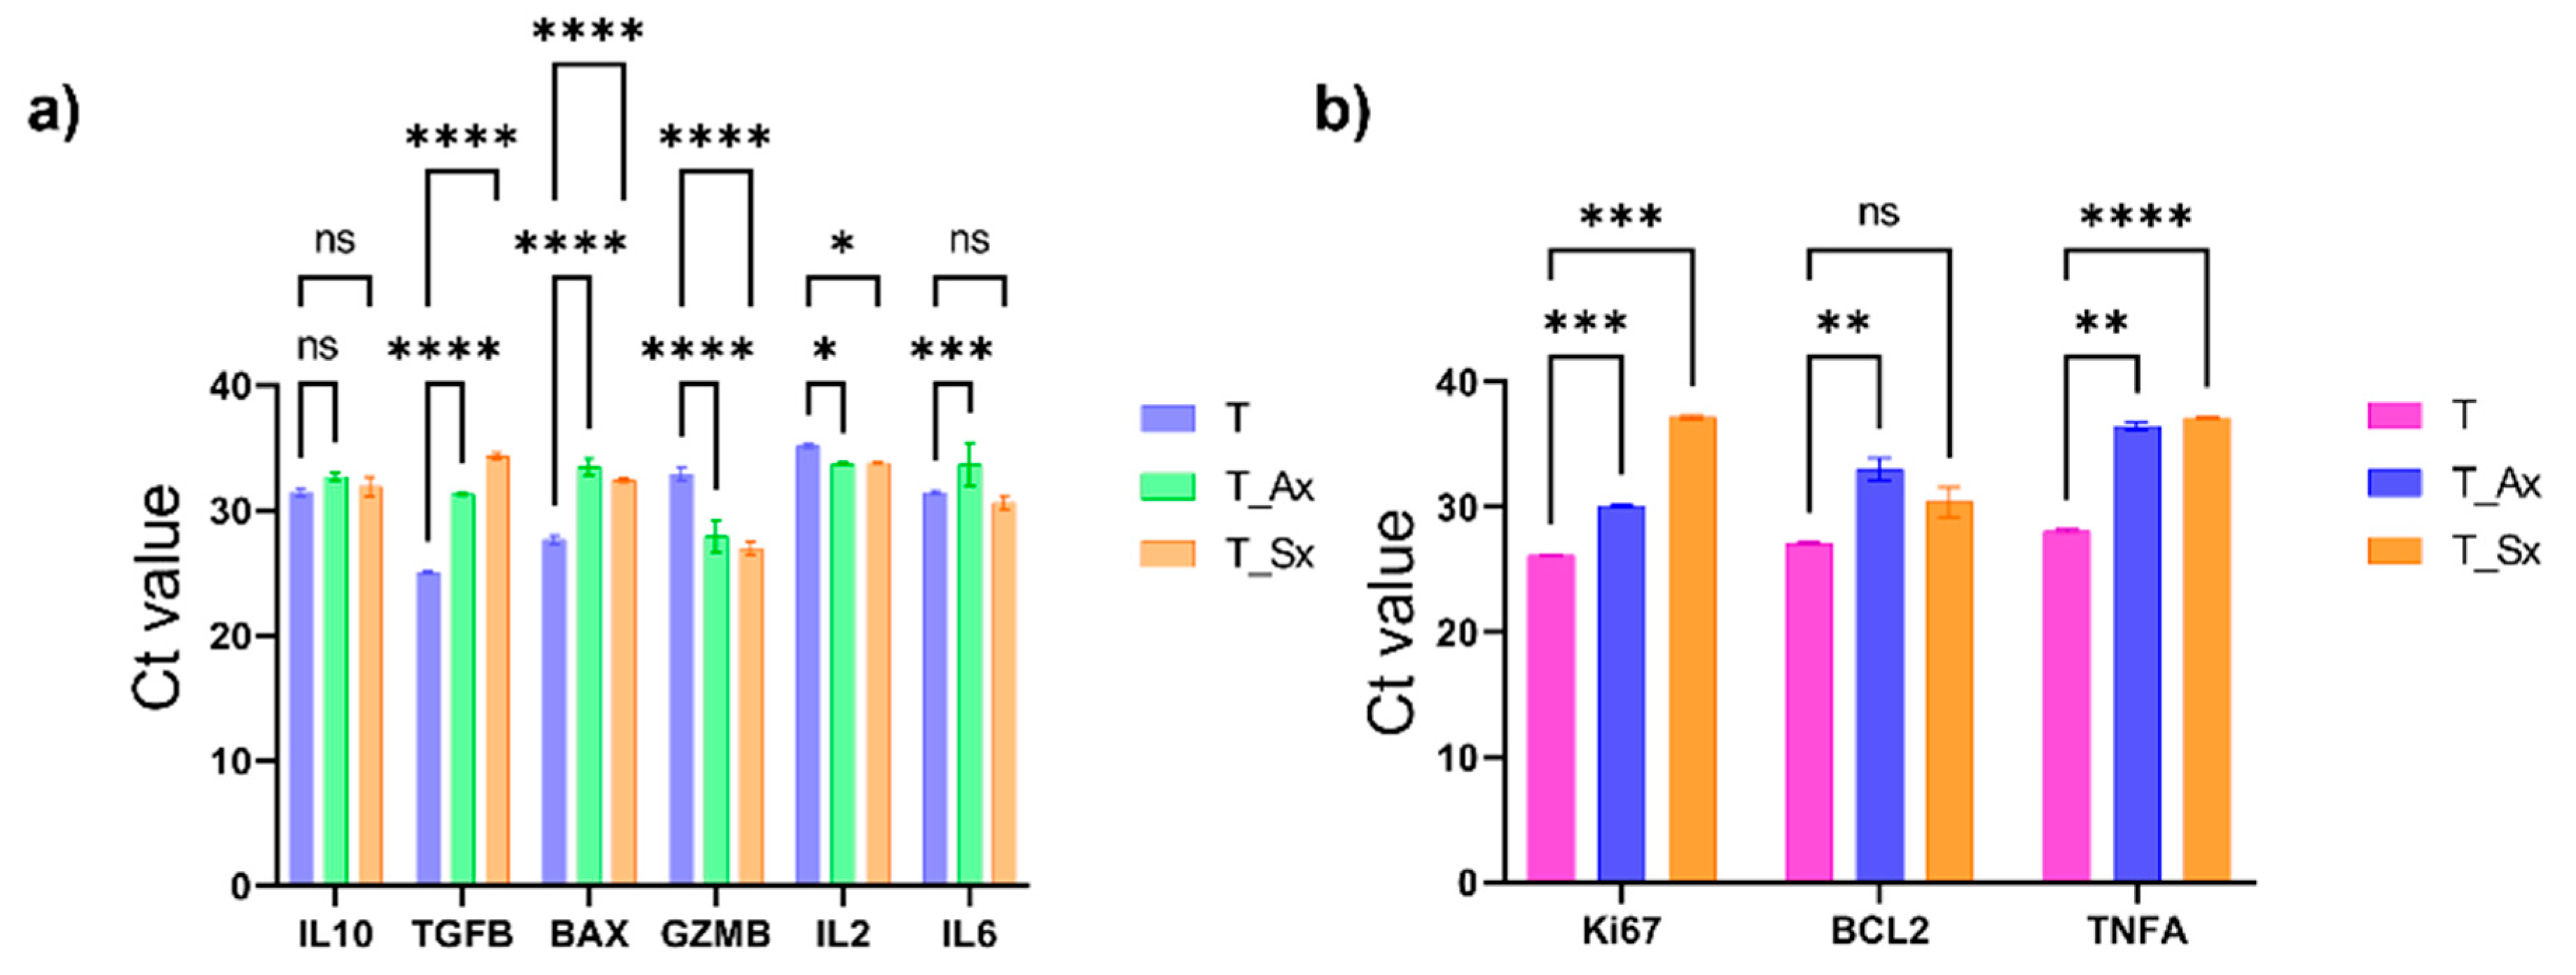
The A549 and SKMES1 cell derived exosome effects on T cell activity was analysed using real time PCR. The RNA expression of IL10, TGFB, BAX, GZMB, Ki67, BCL2, IL6, IL2, and TNFA were assessed. An increase in the expression of TGFB was observed in the treatment group (p<0.000001) suggestive of an immunosuppressive role by inhibiting T cell activation, which was in line with the reduced GZMB (t cell activation marker, p<0.000001) expression, and increased BAX (marker of apoptosis, p<0.000001) in the treatment group. IL2, the cytokine required for T cell activation was also reduced (T_Ax, p = 0.0105; T_Sx, p = 0.0030). Furthermore, IL10, an immunosuppressive marker, was slightly high in T_Ax group (p = 0.036) but non-significant in T_Sx group (
Figure 9A).
Interestingly, the proliferation marker Ki67 was high in the treatment group (T_Ax, p = 0.0001; T_Sx, p = 0.0002). TNFA, having both pro-inflammatory and anti-tumor effects, was also high (T_Ax, p = 0.0011; T_Sx, p < 0.0001). The anti-apoptotic marker, BCL2, was slightly high in T_Ax group (p = 0.0097) but non-significant in T_Sx group (p = 0.0644) (
Figure 9B).
4. Discussion
Although immunotherapeutic approaches have advanced significantly, there hasn't been much clinical success. This might be as a result of the severe immunological abnormalities discovered in people with advanced cancer. According to recent reports, tumor-derived exosomes cause T cells' impaired signaling responses by down-regulating Janus-activated kinase 3 and CD3, which triggers apoptosis[
20]. Moreover, tumor exosomes may be able to specifically reduce lymphocytes' responses to IL2[
21]. In light of these findings, we examined the function of lung cancer exosomes in immune evasion. The present study demonstrates that Jurkat T cells get immunomodulated due to lung ADC and SCC-derived exosomes.
The exosomes that were released by cancer cells were effectively up taken by immune cells. Cancer-derived exosomes have reduced T cell viability in the first two hours of resazurin treatment, but reached an equilibrium post-two hours. The observations were further confirmed by real time PCR data, wherein, the RNA expression of TGFB, GZMB, and BAX were high in the ADC and SCC exosome treatment groups, and a decrease in the IL2 activity, indicating the immunosuppressive activity of cancer derived exosomes. The IL10 was significantly higher in the ADC exosome treatment group than the SCC treatment group. Interestingly, an increase in the Ki67 and BCL2 was observed, suggestive of a compensatory mechanism in the T cells against the apoptotic or immunosuppressive activity.
The proteins distinguished between T cells and T cells treated with cancer-derived exosomes hints the role of cancer-derived exosomes on T cells. Our differential analysis on ADC and SCC-derived exosomes on T cells indicated 39 DAPs in ADC-derived exosome treated T cells, and 276 in SCC exosomes treated cells, in which, 19 proteins were common in both the groups, and 20 proteins were unique to ADC treated group and 257 proteins were unique to SCC treated groups. Interestingly, upon GO analysis, these DAP showed high potential to release as exosomes by the recipient cells (T cells in our scenario) due to their localization in the cellular and extracellular compartments which are involved in the exosome biogenesis pathway (cytoplasmic luminal compartments, cis-golgi network etc).
Crucially, the GO performed for DAP between T cells and T cells treated with ADC exosomes were predicted with NAD metabolic process, nucleotide phosphorylation, oxidoreductase activity, ECM binding, ssDNA binding, scavenger receptor activity etc. Furthermore, the GO performed for DAP between T cells and T cells treated with SCC exosomes were predicted with mRNA catabolic and stability regulation, translational regulation, amino-acid metabolic process, cellular polarity regulation, cadherin binding, unfolded protein binding etc. Moreover, the GO performed using DAP unique to T cells treated with ADC-derived exosomes and DAP unique to T cells treated with SCC derived exosomes also showed CC in the extracellular and vesicle lumen. As well, the DAP unique to squamous cell-derived exosome-treated T cells showed their presence in the ficolin-1-rich granule, cytoplasmic vesicle lumen, proteasome and chaperone complex, and in eukaryotic translation initiation complex. Other than the cytoplasmic and luminal presence, the DAP unique to ADC cell-derived exosome-treated T cells were localized at cell-matrix adhesion, rough ER lumen, and cis-golgi network. Altogether, the results indicated the potential of these proteins to be trafficked along the endosomal pathways in T cells so as to release them in the sEV form for the downstream cell-cell communication.
5. Conclusions
The current study found that lung cancer cells release exosomes to send immunoregulatory signals to T cells without requiring direct cell-to-cell interaction. These exosomes modulate cytokine level in the T cells and their activity. The lung cancer-derived exosome induces DAP in the T cells, which are common and specific to the ADC and SCC histotypes. These DAP further possess the potential to be released by the T cells in sEV form. Further knowledge of the molecular processes underlying the interaction of immune cells with exosomes is also anticipated to yield important new information on the mechanism of tumor immune regulation.
6. Limitations and Future Prospectives
Though we considered the protein abundance in the samples, but not the post-translational modifications (PTMs) for the present study, bottom-up proteomics has a number of drawbacks that may limit a thorough description of protein diversity. One major problem is that when proteins are broken down into peptides during digestion, important information about full-length proteins and the PTM that go along with them is lost. This restricts the capacity to completely capture proteoforms, which might include isoforms, PTMs, and alternative splicing. Furthermore, it is frequently challenging to differentiate between protein isoforms with similar peptide sequences since they may produce identical peptides when digested. Certain PTMs may be identified using bottom-up proteomics, however it can be difficult to determine the exact location and intricacy of PTM patterns, especially when they appear on several residues in the same peptide[
22,
23].
Here, we have examined Jurkat E6.1 cell lines to examine the impact of exosomes produced from cancer on T cells. Specific T cell subtypes (CD4+ or CD8+ T cells) derived from peripheral blood can be immune-sorted and experimentally examined for a more thorough examination of the immunological impact. Moreover, This study's reliance on in vitro model, which might not accurately mimic the complexity of entire biological systems, like those in vivo, is one of its shortcomings. Since cultured cells do not fully represent the physiological environment, it is still up for debate whether results from culture models can be applied to human biology.
Supplementary Materials
The following supporting information can be downloaded at the website of this paper posted on
Preprints.org.
Author Contributions
Conceptualization, Alex George and Hafiza Padinharayil; methodology, Hafiza Padinharayil; software, Hafiza Padinharayil; validation, Alex George; formal analysis, Alex George, Cornelia M Wilson, Jinsu Varghese, P.R. Varghese; investigation; Hafiza Padinharayil and Alex George; data curation, Hafiza Padinharayil; writing—original draft preparation, Hafiza Padinharayil; writing—review and editing, Alex George; visualization, Hafiza Padinharayil; supervision, Alex George.; project administration, Alex George and P.R. Varghese; funding acquisition, Cornelia M Wilson. All authors have read and agreed to the published version of the manuscript.
Funding
This research was funded by Council of Scientific and Industrial Research (08/528(0011)/2021-EMR-I) and Canterbury Christ Church University funded the APC.
Institutional Review Board Statement
The study was conducted after the approval by the Institutional Ethics Committee of Jubilee Mission Medical College and Research Institute (10/21/IEC/JMMC&RI, 22.01.2021).
Informed Consent Statement
Not applicable.
Data Availability Statement
The original contributions presented in this study are included in the article/
supplementary material. Further inquiries for the raw data can be directed to the corresponding author as the raw data are part of an ongoing study.
Acknowledgments
The proteomics core facility support provided by Dr Arun Surendran at the DBT-SAHAJ National Facility for Mass Spectrometry at the Rajiv Gandhi Centre for Biotechnology in Thiruvananthapuram, Kerala, is much appreciated and gratefully acknowledged by the authors (LC-MS), National Institute of Animal Biotechnology (TEM), Vellore Institute of Technology (NTA), and Jubilee Centre for Medical Research for providing equipment feasibility for the completion of this work.
Conflicts of Interest
The authors declare no conflicts of interest.
Abbreviations
The following abbreviations are used in this manuscript:
| NSCLC |
non-small cell lung carcinoma |
| ADC |
lung adenocarcinoma |
| SCC |
lung squamous cell carcinoma |
| DAP |
differentially abundant proteins |
| GO |
gene ontology |
| sEV |
small extracellular vesicles |
| LC-MS |
liquid chromatography-mass spectrometry |
| T_Sx |
SKMES1-derived exosomes |
| T_Ax |
A549-derived exosomes |
References
- Siegel, R.L.; Miller, K.D.; Fuchs, H.E.; Jemal, A. Cancer Statistics, 2021. CA Cancer J Clin 2021, 71, 7–33. [Google Scholar] [CrossRef] [PubMed]
- Oser, M.G.; Niederst, M.J.; Sequist, L. V.; Engelman, J.A. Transformation from Non-Small-Cell Lung Cancer to Small-Cell Lung Cancer: Molecular Drivers and Cells of Origin. Lancet Oncol 2015, 16, e165–e172. [Google Scholar] [CrossRef] [PubMed]
- Padinharayil, H.; Varghese, J.; John, M.C.; Rajanikant, G.K.; Wilson, C.M.; Al-Yozbaki, M.; Renu, K.; Dewanjee, S.; Sanyal, R.; Dey, A.; et al. Non-Small Cell Lung Carcinoma (NSCLC): Implications on Molecular Pathology and Advances in Early Diagnostics and Therapeutics. Genes Dis 2022. [Google Scholar] [CrossRef]
- Brinton, L.T.; Sloane, H.S.; Kester, M.; Kelly, K.A. Formation and Role of Exosomes in Cancer. Cellular and Molecular Life Sciences 2015, 72, 659–671. [Google Scholar] [CrossRef] [PubMed]
- Zebrowska, A.; Widlak, P.; Whiteside, T.; Pietrowska, M. Signaling of Tumor-Derived Sev Impacts Melanoma Progression. Int J Mol Sci 2020, 21, 1–21. [Google Scholar] [CrossRef] [PubMed]
- Zebrowska, A.; Skowronek, A.; Wojakowska, A.; Widlak, P.; Pietrowska, M. Metabolome of Exosomes: Focus on Vesicles Released by Cancer Cells and Present in Human Body Fluids. Int J Mol Sci 2019, 20, 3461. [Google Scholar] [CrossRef] [PubMed]
- Padinharayil, H.; George, A. Small Extracellular Vesicles: Multi-Functional Aspects in Non-Small Cell Lung Carcinoma. Crit Rev Oncol Hematol 2024, 198. [Google Scholar] [CrossRef] [PubMed]
- Padinharayil, H.; Varghese, J.; Wilson, C.; George, A. Mesenchymal Stem Cell-Derived Exosomes: Characteristics and Applications in Disease Pathology and Management. Life Sci 2024, 342. [Google Scholar] [CrossRef]
- Welsh, J.A.; Goberdhan, D.C.I.; O’Driscoll, L.; Buzas, E.I.; Blenkiron, C.; Bussolati, B.; Cai, H.; Di Vizio, D.; Driedonks, T.A.P.; Erdbrügger, U.; et al. Minimal Information for Studies of Extracellular Vesicles (MISEV2023): From Basic to Advanced Approaches. J Extracell Vesicles 2024, 13, e12404. [Google Scholar] [CrossRef] [PubMed]
- Whiteside, T.L. Tumor-Derived Exosomes and Their Role in Cancer Progression. Adv Clin Chem 2016, 74, 103–141. [Google Scholar] [CrossRef]
- Kok, V.C.; Yu, C.C. Cancer-Derived Exosomes: Their Role in Cancer Biology and Biomarker Development. Int J Nanomedicine 2020, 15, 8019–8036. [Google Scholar] [CrossRef] [PubMed]
- Théry, C.; Zitvogel, L.; Amigorena, S. Exosomes: Composition, Biogenesis and Function. Nature Reviews Immunology 2002 2:8 2002, 2, 569–579. [Google Scholar] [CrossRef] [PubMed]
- Whiteside, T.L. The Effect of Tumor-Derived Exosomes on Immune Regulation and Cancer Immunotherapy. Future Oncology 2017, 13, 2583–2592. [Google Scholar] [CrossRef] [PubMed]
- Azambuja, J.H.; Ludwig, N.; Yerneni, S.S.; Braganhol, E.; Whiteside, T.L. Arginase-1+ Exosomes from Reprogrammed Macrophages Promote Glioblastoma Progression. Int J Mol Sci 2020, 21, 3990. [Google Scholar] [CrossRef]
- Zhao, Y.; Liu, L.; Sun, R.; Cui, G.; Guo, S.; Han, S.; Li, Z.; Bai, T.; Teng, L. Exosomes in Cancer Immunoediting and Immunotherapy. Asian J Pharm Sci 2022, 17, 193–205. [Google Scholar] [CrossRef] [PubMed]
- Soltész, B.; Buglyó, G.; Németh, N.; Szilágyi, M.; Pös, O.; Szemes, T.; Balogh, I.; Nagy, B. The Role of Exosomes in Cancer Progression. Int J Mol Sci 2021, 23, 8. [Google Scholar] [CrossRef] [PubMed]
- Whiteside, T.L.; Mandapathil, M.; Szczepanski, M.; Szajnik, M. Mechanisms of Tumor Escape from the Immune System: Adenosine-Producing Treg, Exosomes and Tumor-Associated TLRs. Bull Cancer 2011, 98. [Google Scholar] [CrossRef]
- Whiteside, T.L. Immune Suppression in Cancer: Effects on Immune Cells, Mechanisms and Future Therapeutic Intervention. Semin Cancer Biol 2006, 16, 3–15. [Google Scholar] [CrossRef] [PubMed]
- Jeong, W.K.; Wieckowski, E.; Taylor, D.D.; Reichert, T.E.; Watkins, S.; Whiteside, T.L. Fas Ligand-Positive Membranous Vesicles Isolated from Sera of Patients with Oral Cancer Induce Apoptosis of Activated T Lymphocytes. Clinical Cancer Research 2005, 11, 1010–1020. [Google Scholar] [CrossRef]
- Taylor, D.D.; Gerçel-Taylor, C. Tumour-Derived Exosomes and Their Role in Cancer-Associated T-Cell Signalling Defects. Br J Cancer 2005, 92, 305–311. [Google Scholar] [CrossRef] [PubMed]
- Clayton, A.; Mitchell, J.P.; Court, J.; Mason, M.D.; Tabi, Z. Human Tumor-Derived Exosomes Selectively Impair Lymphocyte Responses to Interleukin-2. Cancer Res 2007, 67, 7458–7466. [Google Scholar] [CrossRef] [PubMed]
- Po, A.; Eyers, C.E. Top-Down Proteomics and the Challenges of True Proteoform Characterization. J Proteome Res 2023, 22, 3663–3675. [Google Scholar] [CrossRef]
- Schaffer, L. V.; Millikin, R.J.; Shortreed, M.R.; Scalf, M.; Smith, L.M. Improving Proteoform Identifications in Complex Systems Through Integration of Bottom-Up and Top-Down Data. J Proteome Res 2020, 19, 3510. [Google Scholar] [CrossRef]
Figure 1.
a) NTA showing the size and concentration of isolated exosomes. b) TEM analysis for the morphological characterization. Exosomes with diameter ranges between 50nm to180nm. c) Western blot imaging for exosome markers: CD9, 25kDa; CD63, 25, 35-65 kDa; calnexin, 90kDa. The first two lanes corresponds to exosomes samples and the next two belong to cell lysates. Abbreviations used: EV, extracellular vesicles; CL, cell lysate.
Figure 2.
a) Exosome uptake by the recipient cells (green, exosomes; blue, nucleus; red, plasma membrane. The green fluorescence present in the cytoplasm indicates the successful uptake of PKH-labelled exosomes b) Effect of cancer-derived exosomes on T cell viability. A549 and SKMES1-derived exosomes were treated with T cells for twenty-four hours, and their effect on viability was assessed using resazurin. Fluorescence was recorded for the first four hours of resazurin addition. Abbreviations: T, Jurkat E6.1 cells; T+A549_Exo; Jurkat E6.1 cells treated with A549-derived exosomes; T+SKMES_Exo; Jurkat E6.1 cells treated with SKMES1-derived exosomes (the asterisks correspond to the p value 0.0011).
Figure 3.
Comparison of T cells treated with ADC and SCC exosomes in terms of protein abundance a) difference in the absolute abundance of T cells and T_Ax b) marginal scatterplot with density diagram representing significantly expressed proteins between T cells and T_Ax treatment group c) marginal scatterplot with bar plot representing significantly expressed proteins between T cells and T_Ax treatment group d)Volcano plot representing highly abundant and lower abundant proteins (DAP, logFC ± 1 and FDR < 0.05) in the T_Ax group e) difference in the absolute abundance of T cells and T_Sx f) marginal scatterplot with density diagram representing significantly expressed proteins between T cells and T_Sx treatment group g) marginal scatterplot with bar plot representing significantly expressed proteins between T cells and T_Sx treatment group h)Volcano plot representing highly abundant and lower abundant proteins (DAP, logFC ± 1 and FDR < 0.05) in the T_Sx group.
Figure 4.
GO performed for DAP in the T cells treated with ADC-derived exosomes. a) GO performed against enrichment score for biological processes (BP), molecular function (MF), and cellular compartmentalisation (CC). b) Enrichment bubble chart with enrichment score along with number of gene count in GO-BP c) Enrichment score along with number of gene count in GO-MF d) Enrichment score along with number of gene count in GO-CC e) cnetplot of the proteins involved in BP f) cnetplot of the proteins involved in MF. The titles of BP and MF enrichment bubble chart are arranged accordingly to the GO bar chart.
Figure 5.
GO performed for DAP in the T cells treated with SCC-derived exosomes. a) GO performed against enrichment score for biological processes (BP), molecular function (MF), and cellular compartmentalisation (CC). b) Enrichment score along with number of gene count in GO-BP c) Enrichment score along with number of gene count in GO-MF d) Enrichment score along with number of gene count in GO-CC e) cnetplot of the proteins involved in BP f) cnetplot of the proteins involved in MF. BP and MF enrichment bubble chart titles are arranged according to the GO bar chart.
Figure 6.
list of commonly expressed proteins in the T cells treatment with ADC and SCC-derived exosomes. a) Venn diagram showing number of commonly expressed DAP in various treatment groups b) Upset plot showing commonly expressed DAPs in T cells treated with A549-derived exosomes (T vs ATx) and T cells treated with SKMES-derived exosomes (T vs STx) c) Heatmap showing absolute abundance of nineteen DAP in T cells vs T_Ax and T_Sx.
Figure 7.
GO performed for the commonly expressed proteins in the T cells treatment with ADC and SCC-derived exosomes a) GO performed against enrichment score for biological processes (BP) b) molecular function (MF) c) cellular compartmentalisation (CC) d) Tree map showing the cellular localisation of DAP e) cnetplot of the BP of commonly expressed DAP f) cnetplot of the MF of commonly expressed DAP.
Figure 8.
GO performed for DAP present uniquely to T_Ax and T_Sx. a) GO performed for DAP uniquely expressed to T cells treated with ADC-derived exosomes b) GO-BP c) GO-MF d) ShinyGO CC enrichment e) ShinyGO CC enrichment tree map f) GO performed for DAP uniquely expressed to T cells treated with SCC-derived exosomes g) GO-BP h) GO-MF i) ShinyGO CC enrichment j) ShinyGO CC enrichment tree map. The titles of BP and MF enrichment bubble chart are arranged accordingly to the GO bar chart.
Figure 9.
qPCR data showing the cytokine alteration and T cell activity upon ADC and SCC-derived exosome treatment a) Genes that are involved in hindering T cell activity b) Genes that are involved in the activation of T cells.
Figure 9.
qPCR data showing the cytokine alteration and T cell activity upon ADC and SCC-derived exosome treatment a) Genes that are involved in hindering T cell activity b) Genes that are involved in the activation of T cells.
Table 1.
Annealing temperatures against each cDNA targets.
Table 1.
Annealing temperatures against each cDNA targets.
| Sl No. |
Target mRNA |
Annealing Temperature |
Primer_Forward (5’-3’) |
Primer_Reverse (5’-3’) |
| 1 |
TGFB1 |
65 |
TACCTGAACCCGTGTTGCTCTC |
GTTGCTGAGGTATCGCCAGGAA |
| 2 |
BAX |
64.4 |
TCAGGATGCGTCCACCAAGAAG |
TGTGTCCACGGCGGCAATCATC |
| 3 |
TNFA |
64.4 |
CTCTTCTGCCTGCTGCACTTTG |
ATGGGCTACAGGCTTGTCACTC |
| 4 |
IL10 |
63 |
TCTCCGAGATGCCTTCAGCAGA |
TCAGACAAGGCTTGGCAACCCA |
| 5 |
IL6 |
63 |
AGACAGCCACTCACCTCTTCAG |
TTCTGCCAGTGCCTCTTTGCTG |
| 6 |
GZMB |
63 |
CGACAGTACCATTGAGTTGTGCG |
TTCGTCCATAGGAGACAATGCCC |
| 7 |
IL2 |
62.4 |
AGAACTCAAACCTCTGGAGGAAG |
GCTGTCTCATCAGCATATTCACAC |
| 8 |
GAPDH |
60 |
GTCTCCTCTGACTTCAACAGCG |
ACCACCCTGTTGCTGTAGCCAA |
| 9 |
BCL2 |
55.7 |
ATCGCCCTGTGGATGACTGAGT |
GCCAGGAGAAATCAAACAGAGGC |
| 10 |
KI67 |
53.9 |
GGGCCAATCCTGTCGCTTAAT |
GTTATGCGCTTGCGAACCT |
|
Disclaimer/Publisher’s Note: The statements, opinions and data contained in all publications are solely those of the individual author(s) and contributor(s) and not of MDPI and/or the editor(s). MDPI and/or the editor(s) disclaim responsibility for any injury to people or property resulting from any ideas, methods, instructions or products referred to in the content. |
© 2025 by the authors. Licensee MDPI, Basel, Switzerland. This article is an open access article distributed under the terms and conditions of the Creative Commons Attribution (CC BY) license (http://creativecommons.org/licenses/by/4.0/).