
Submitted:
28 January 2025
Posted:
29 January 2025
You are already at the latest version
Abstract
Myo-inositol-1,2,3,4,5,6-hexakisphosphate (IP6), commonly found in plant-derived foods, has important pharmacological properties against many pathological processes. One of them could be the neurodegeneration, stimulated by a dysregulated metal metabolism. Consequently, we explore here the role of IP6 in mitigating neurodegenerative processes catalyzed by dysregulated free iron. Using dopamine and ascorbic acid as models of neuronal redox systems, we demonstrate that IP6 effectively chelates Fe³⁺, inhibiting its ability to catalyse the oxidative degradation of DA and AA. Our findings reveal that IP6 prevents the formation of harmful intermediates such as neuromelanin and reactive oxygen species, which are associated with neuronal damage. Furthermore, we examined the effect of IP6 on Fe³⁺-induced protein aggregation, focusing on α-synuclein, a protein directly linked to Parkinson's disease. IP6 altered the aggregation mechanism of αS by accelerating the conversion of toxic oligomers into less harmful amyloid fibrils, thus reducing the potential for neuronal damage. Our results highlight the dual function of IP6 as potent Fe³⁺ chelator and modulator of protein aggregation pathways, thus emphasizing its potential as a neuroprotective agent. Consequently, IP6 offers promising therapeutic features for mitigating the progression of neurodegenerative disorders such as Parkinson’s and Alzheimer’s diseases.
Keywords:
Dopamine
; Ascorbic acid
; Phytic acid
; α-Synuclein
1. Introduction
Myo-inositol-1,2,3,4,5,6-hexakisphosphate, also known as phytic acid or phytate (IP6), is the main phosphorus reservoir in most legumes, oilseeds, and whole grains [1]. During germination, phytases hydrolyze IP6 to release phosphate, which is essential for plant growth and development. Consequently, the IP6 content in these seeds ranges from approximately 0.05% to 6.5% of their overall weight [2]. Therefore, the consumption of legumes and cereals accounts for 13% and 77%, respectively, of the overall human intake of IP6 (~0.2–1 g/day) [3,4]. Once ingested, IP6 is primarily absorbed in the stomach, upper intestine, and colon [4]. However, its bioavailability is relatively low due to the limited presence of phytases in the digestive tract and its highly negative charge, which makes it difficult to cross the cellular lipid bilayer [5]. Consequently, most ingested IP6 is excreted [4]. Nonetheless, a portion of the absorbed fraction may enter cells via pinocytosis [6].
The absorbed IP6 exhibits numerous physiological roles. IP6 and its lower inositol phosphates appear to play distinct roles in signal transduction processes by modulating enzymatic activity and interacting with specific proteins, particularly those involved in regulating intracellular calcium levels [7] and those associated with membrane trafficking events, such as synaptotagmin [8] or arrestins [9]. Additionally, IP6 and other inositol phosphates are implicated in DNA repair mechanisms through the activation of DNA-dependent protein kinases [10], as well as in the regulation of nuclear mRNA transport [11]. On the other hand, it has been suggested that IP6 might also influence digestion and nutrient absorption. Evidence indicates that IP6 inhibits enzymes such as amylase, pepsin, and trypsin, potentially reducing the digestibility of carbohydrates and proteins [12,13]. Furthermore, due to its strong negative charge, IP6 can chelate cations such as Zn²⁺, Ca²⁺, Mg²⁺, Mn²⁺, Cu²⁺, and Fe³⁺, thereby reducing the absorption of minerals and trace elements [14]. However, this anti-nutritional effect has only been observed in vitro, and data from in vivo experiments do not support mineral deficiencies associated with IP6 consumption [15,16].
Beyond its physiological role, IP6 is also regarded as a powerful nutraceutical, with significant potential to treat or prevent a wide range of disorders through various mechanisms of action. Its high affinity for the Ca²⁺ cation integrated into hydroxyapatite (HAP) seeds makes it a potent inhibitor of HAP growth and, consequently, in vivo calcifications. IP6 not only blocks the propagation of growth steps on the surface of HAP crystals but also prevents the agglomeration of HAP clusters into large entities that eventually form HAP concretions [17]. As a result, IP6 can prevent vascular calcification in patients undergoing hemodialysis [18], and its consumption is inversely associated with aortic calcification [19]. Since most kidney stones are composed of calcium oxalate, calcium phosphate, or a mixture of both, IP6 can also inhibit calcification in the kidneys and papillae [20]. In fact, a diet rich in IP6 prevents renal calculi [21], while an IP6-free diet leads to nephrocalcinosis [22]. Furthermore, IP6 can reduce calcified dental plaque [23]. The adsorption of IP6 to preformed crystal faces can also inhibit their dissolution, which explains why IP6 can prevent bone decalcification [24,25] and, consequently, osteoporosis [25,26].
The interaction of IP6 with Ca²⁺-based crystallizations is not the only mechanism through which IP6 exerts its beneficial effects. IP6 also appears to have positive effects on patients with type 2 diabetes. This may be related to the fact that alterations in inositol metabolism are associated with hyperglycemia and insulin resistance [27]. Furthermore, IP6 inhibits amylase, reducing the rate of carbohydrate hydrolysis and absorption [28,29]. It also decreases leptin levels (promoting satiety and energy utilization) while increasing adiponectin levels (stimulating the antioxidant response) [28,30,31]. In addition, IP6 reduces lipase activity, total cholesterol, LDL cholesterol, and hepatic total lipid levels, while increasing HDL cholesterol levels [27,32]. Moreover, IP6 can inhibit the formation of Fe³⁺-catalyzed advanced glycation end products [33], which seem to play a critical role in the development of diabetes-related complications. This aligns with evidence showing that a diet rich in legumes or whole grains reduces glycated hemoglobin (HbA1c) levels [34,35]. It is also well-established that IP6 possesses significant anticancer properties, as it can inhibit molecular pathways involved in tumor progression, including metastasis, angiogenesis, apoptosis, and differentiation [36]. Its potential against cancer progression has been demonstrated in cases of colon [37], lung [38], and breast [39] cancers. Additionally, IP6 exhibits antibacterial [40] and antiviral [41] properties.
Numerous experimental data indicate that IP6 plays a crucial role in the normal functioning of the central nervous system. Its concentration in the brain (~2 μg IP6/g) is approximately 10 times higher than that in the kidneys, liver, or bones [42,43], and it is evenly distributed across different brain regions [44]. Within the brain, it is involved in vesicle trafficking [45] and neurotransmitter release [46]. Additionally, it binds with high affinity to specific proteins, such as myelin proteolipid protein [47] and L-type Ca2+ channels [7]. Moreover, neuronal IP6-dependent protein kinases exist, including one that phosphorylates pacsin/syndapin I, which are involved in synaptic vesicle recycling [48].
Furthermore, IP6 may play a protective role against neurodegeneration. Diets rich in IP6 have been positively associated with better cognitive function in elderly individuals [49], a slower rate of cognitive decline [50], and improved academic performance in children [51]. Additionally, IP6 has been shown to protect rat dopaminergic cells (N27) from apoptosis [52,53] and to guard human dopaminergic cells (SH-SY5Y) against lipid peroxidation, reactive oxygen species (ROS) production, and the accumulation of α-synuclein, a hallmark of Parkinson’s disease [54]. Moreover, IP6 has demonstrated inhibitory activity against BACE1, potentially preventing the accumulation of amyloid-beta, a hallmark of Alzheimer’s disease [55,56].
Part of the protective effect of IP6 against neurodegeneration may be attributed to its ability to bind iron [57,58]. Many brain functions depend on iron, as this cation serves as a cofactor for enzymes involved in neurotransmission. However, dysregulated iron metabolism can trigger Fenton reactions, leading to the generation of ROS and a subsequent pro-inflammatory response. This often culminates in ferroptosis [59], a process linked to the development of Alzheimer’s [60] and Parkinson’s [61] diseases.
Abnormal accumulation of free iron can induce neurodegeneration through various molecular mechanisms. One of them is its catalytic role in the degradation of key molecules essential for normal brain function, such as dopamine (DA) [62] and ascorbic acid (AA) [63]. DA is a critical molecule for neurotransmission [64], while AA is one of the most important antioxidant compounds for neurons [65,66]. Given that IP6 can chelate Fe³⁺ [57,58], we have investigated here whether it could inhibit Fe³⁺-catalyzed degradation of DA and AA. Furthermore, we examined whether IP6 could also prevent Fe³⁺-catalyzed aggregation of proteins associated with neurodegenerative diseases, such as α-synuclein in Parkinson’s disease. The results we have obtained in this study demonstrate that IP6 may plays a protective role against neurodegeneration by inhibiting harmful molecular processes catalyzed by dysregulated free iron.
2. Materials and Methods
2.1. Materials
1,2-dioleoyl-sn-glycero-3-phosphocholine (DOPC) was purchased from Avanti Polar Lipids. All the other chemicals and reagents used in this study were analytical grade and they were purchased either from Merck or from Fisher Scientific. All of them were used as received without further purification. All solutions used in this study were prepared using milli-Q water.
2.2. UV-Vis Spectroscopy Study of the Degradation of DA.
A Shimadzu UV-2401-PC double beam spectrophotometer (Shimadzu Europa GmbH, Duisburg, Germany) was used to study the oxidation of DA under different experimental conditions. All the studies were carried at 37ºC using a 1 cm quart cell. The UV-Vis spectra were collected between 220 and 900 nm during 2 hours each 5 minutes. In addition, under certain experimental conditions, kinetic studies were carried out at a fixed wavelength, which was either 301 or 493 nm.
To study the effect of DA concentration on its degradation rate, the UV-Vis spectra of solutions containing 30, 50, 100, 500 or 1000 μM DA concentration were collected in a 10 mM phosphate (pH 7.4) containing 75 mM NaCl.
To study the effect of sodium phosphate concentration on the stability of DA, we acquired the UV-Vis spectra of solutions containing 100 μM DA prepared in mili-Q water; in 1 mM sodium phosphate; in 10 mM sodium phosphate; in 100 mM sodium phosphate; and in 500 mM sodium phosphate. The pH of all the solutions was 7.4 and all of them contained 75 mM NaCl.
To study the effect of NaCl concentration on the stability of DA, we acquired the UV-Vis spectra of solutions containing 100 μM DA prepared in 10 mM phosphate buffers (pH 7.4) that were prepared in the absence or in the presence of NaCl at 20, 75 or 300 mM concentrations.
To study the effect of the presence of oxidants or reductants on the stability of DA, we acquired the UV-Vis spectra of solutions containing 100 μM DA prepared in a 10 mM phosphate buffer (pH 7.4) containing 75 mM NaCl. The solutions were prepared in the presence of: i) H2O2 (50 μM); ii) KIO3 (50 μM); iii) ascorbic acid (AA) (50 μM); or iv) tris(2-carboxyethyl)phosphine (TCEP) (50 μM).
To study the effect of Fe3+ on the stability of DA, we collected the UV-Vis spectra of solutions containing 100 μM DA prepared in 10 mM phosphate buffer (pH 7.4) containing 75 mM NaCl. The solutions were prepared in the presence of: i) FeCl3 (5 μM); ii) FeCl3 (5 μM) and H2O2 (50μM); iii) FeCl3 (5 μM) and TCEP (50 μM); and iv) FeCl3 (5 μM) and EDTA (50 μM). In addition, we acquired the temporal variation of the absorbance at 301 and at 493 nm of the above-mentioned DA solution (100 μM) in the presence of Fe3+ at 1, 2, 5 and 10 μM concentration.
To study the effect of Ca2+, Al3+ and Zn2+ on the degradation rate of DA, we collected the UV-Vis spectra of solutions containing 100 μM DA prepared in 10 mM phosphate buffer (pH 7.4) containing 75 mM NaCl. The solutions were prepared in the presence of: i) CaCl2 (500 μM); ii) ZnCl2 (50 μM); and iv) AlCl3 (20 μM). In addition, we acquired the temporal variation of the absorbance at 301 and at 493nm of the above-mentioned DA solution (100 μM) in the presence absence and in the presence of: i) CaCl2 at 50, 300 and 500 μM concentration; ii) ZnCl2 at 2, 10, 20 and 50 μM concentration; and iii) AlCl3 at 2, 5, 10 and 20 μM concentration.
To study the effect of pH on the DA degradation rate, we recorded the UV-Vis spectra of solutions containing 100 μM DA prepared in 10 mM phosphate buffers containing 75 mM NaCl. Different phosphate buffers were prepared. One at pH 6.0, another at pH 6.5 and the third one at pH 7.4.
To study the effect of the buffer type on the Fe3+-catalyzed degradation rate of DA, we recorded the UV-Vis spectra of solutions containing DA (1 mM) and Fe3+ (10 μM) prepared in different buffers containing 75 mM NaCl. The pH of the buffers used in these studies was set at 7.4 and they were: i) 20 mM MOPS; ii) 20 mM TRIS; iii) 20 mM MES; iv) 20 mM; and v) 20 mM phosphate.
To study the effect of IP6 on the Fe3+-catalyzed degradation rate of DA, we collected the UV-Vis spectra of solutions containing 100 μM DA prepared in 20 mM MES buffer (pH 6.0) containing 75 mM NaCl. The spectra were collected in the absence and in the presence of Fe3+ (10 μM), but also in the presence of Fe3+ (10 μM) and IP6 (1 μM). In addition, we acquired the temporal variation of the absorbance at 301 and at 493 nm of the above-mentioned DA solution (100 μM) in the presence of Fe3+ (10 μM) with or without IP6 at different concentrations (i.e. 1, 2 and 10 μM).
2.3. Preparation and UV-Vis Spectroscopy Study of DA-Encapsulated DOPC Vesicles
The DOPC vesicles were always freshly prepared just before performing the experiments. Aliquots from the commercial stock solution of DOPC (25 mg/ml in CHCl3) were diluted in CHCl3 up to 1 mM concentration to a final volume of 2 mL. Later on, the CHCl3 was removed using a rotary evaporator that worked under reduced pressure (290 mbar) and at 30 °C. The obtained lipid films were then exposed to N2 gas during 10 min to ensure the complete dryness and afterwards, they were hydrated for 30 min with 2 mL of a degassed 20 mM MES buffer (pH 6.0) also containing 75 mM NaCl and DA (1 mM). The hydration process was additionally carried out using the same buffer but also containing FeCl3 (10 μM) or FeCl3 (10 μM) and IP6 (50 μM). In all cases, the lipid hydration was carried out in ice to prevent DA oxidation. The resulting solutions were used to prepare multilamellar vesicles (MLVs) by vortexing the lipid suspensions during 10 min. The MLVs were then used to prepare small unilamellar vesicles (SUVs) through 5 cycles of freezing (at -20ºC) and thawing (at room temperature). Then, they were extruded 15 times through a 50 nm-pore size polycarbonate filter using the Avanti Polar Lipids mini-extruder.
Afterwards, the 2 mL of DOPC-SUVs solution was dialyzed at 4ºC against 2 L of 20 mM MES buffer (pH 6.0) using a 1 KDa dialysis cassette. The dialysis was carried out at 4ºC in three different steps (using 650 mL of buffer in each step). We recorded the UV-spectrum of the buffer used in the last dialysis step to ensure that all the non-encapsulated DA was removed from the solution containing the DOPC-SUVs.
The presence of DA in the lumen of the DOPC-SUVs was assessed through the vesicle disaggregation (by adding 1% Triton X-100) and the subsequent measurement of the UV-spectra of the obtained solutions.
The degradation rate of the encapsulated DA in the absence and in the presence of Fe3+ and/or IP6 was monitored over time at 37ºC using UV-Vis spectroscopy. We simultaneously collected the absorbance increase at 301 nm (characteristic of the phenolic degradation byproducts [67,68]) and at 493 nm (typical of AC formation [67]). The measurements were carried out in duplicated using 100 μM DOPC-SUVs solutions.
2.4. Ascorbic Acid (AA) Oxidation Rate
The degradation rate of AA (70 μM) was followed using a UV spectrometer by measuring the temporal absorbance variation at 265 nm during 150 min. The studies were carried out at 25ºC using a 1 cm quart cell and a Shimadzu UV-2401-PC double beam spectrophotometer (Shimadzu Europa GmbH, Duisburg, Germany). The measurements were carried out in a 10 mM sodium phosphate buffer containing 150 mM NaCl (pH 7.4), which was also used as reference. The degradation rate of AA was recorded in the absence or in the presence of Fe3+ (2.5 μM) with or without the presence of IP6 at different concentrations (i.e. 1, 10, 50 and 100 μM). The reaction mixtures that contained Fe3+ included glycine (8 mM) to slow down the precipitation of insoluble hydroxyls when adding Fe3+ to the phosphate buffer [69]. Control experiments were carried out at different concentrations of IP6 in the absence of Fe3+ were also performed. All the experiments were carried out in triplicate to ensure reproducibility.
2.5. Study of the Total Free Radical Formation from Fe3+-Catalyzed AA Degradation
The formation of total reactive oxygen species (ROS) was indirectly studied from the temporal fluorescence emission intensity decrease of fluorescein, which was measured using a λem = 518 nm and at λexc = 490 nm [70]. A fluorescein stock solution (2 mM) was prepared in a 10 mM sodium phosphate buffer containing 150 mM NaCl (pH 7.4), and added to a final concentration of 10 μM to solutions containing AA (70 μM) alone or in the presence of 2.5 μM Fe3+ with or without IP6 (1 μM). The temporal variation of the fluorescence signal was followed during 150 min. All the experiments were run in duplicated at 25°C using a Varian Cary Eclipse fluorescence spectrophotometer and quartz cells of 1 cm path length.
2.6. Scavenging Capacity of IP6 Against HO· Radical
The cupric reducing antioxidant capacity (CUPRAC) method was applied to analyze the ability IP6 to scavenger the HO· radical [71]. CUPRAC method involves the formation of HO· as a result of the reaction between Fe2+ and H2O2. After this reaction is completed, the latter is degraded using catalase to avoid chemical interferences. HO· can hydroxylate salicylic acid, which further reduce neocuproine-Cu2+ to neocuproine-Cu+ (λabs_max 450 nm). If IP6 reacts with HO·, this would avoid the hydroxylation of salicylic acid and the formation of the UV-active neocuproine-Cu+ complex.
The day we performed the assay, different stock solutions were prepared and stored at 5°C until used: 3000 U of bovine catalase, 10 mM of ammonium acetate, 10 mM of CuCl2, 7.5 mM of neocuproine, 10 mM of salicylic acid, 20 mM of a FeCl2 solution prepared in 1 M HCl, 20 mM of EDTA, and 10 mM of H2O2. All of these solutions were prepared in milli-Q water except the neocuproine, that was dissolved in ethanol and the catalase, which was prepared in 10 mM phosphate buffer (pH 7.4).
Three different set of experiments were prepared: i) one of them did not include IP6; ii) one included 1 µM IP6; iii) and the other included 10 µM IP6. In addition, all the reaction mixtures contained salicylic acid (0.5 mM), Fe2+ (0.5 mM), EDTA (0.5 mM) and H2O2 (0.5 mM). Then, samples were incubated at 37 °C and shaken at 500 rpm for 10 min. Afterwards, catalase was added to a total amount of 7.5 U to eliminate the excess of H2O2. The mixture was incubated at room temperature during 30 min and meanwhile, it was prepared a new reaction mixture containing 1 mM Cu2+, 0.75 mM neocuproine, 0.2 M ammonium acetate and 100 µL of the reaction mixture. The samples were measured by UV-visible spectroscopy using as a blank the 100 µL of Milli-Q water instead of the reaction mixture. All the experiments were performed in triplicated to ensure reproducibility.
2.7. Fibril Formation from Human α-Synuclein (αS)
Recombinant human α-synuclein (αS) was produced and purified as we described before in many manuscripts published by our research group [72,73,74,75,76]. Afterwards, αS (120 μM) was incubated under conditions that are well-known to induce its fibrillization (i.e. at 37ºC in a 20 mM phosphate buffer (pH 7.4) containing 150 mM NaCl while shaking at 1000 rpm). The incubations were carried out on solutions containing: i) αS alone; ii) αS in the presence of Fe3+ (2 μM); iii) αS in the presence of IP6 (20 μM); and iv) αS in the presence of Fe3+ (2 μM) and IP6 (20 μM). Aliquots from each reaction mixture were taken at different incubation times and diluted up to 10 μM αS concentration. Then, the resulting solutions were supplied by 50 μM thioflavin T (Tht), used as fluorescent probe to monitor amyloid fibril formation [77], and the corresponding fluorescent spectra were collected between 490 and 600 nm using a λexc = 440 nm. The scan speed was 200 nm/min with an excitation and emission slit of 2.5 nm, while 5 scans were accumulated. For each reaction mixture, the fluorescent emission intensity obtained at 481 nm was plotted against the incubation time. Fluorescent measurements were carried out at 37 °C on a Cary Eclipse fluorescence spectrophotometer equipped with a Peltier temperature-controlled cell holder.
3. Results
3.1. Understanding the Environmental Factors Affecting the Degradation of DA
3.1.1. The Conversion of AC into NM is Dependent of the Initial Concentration of DA
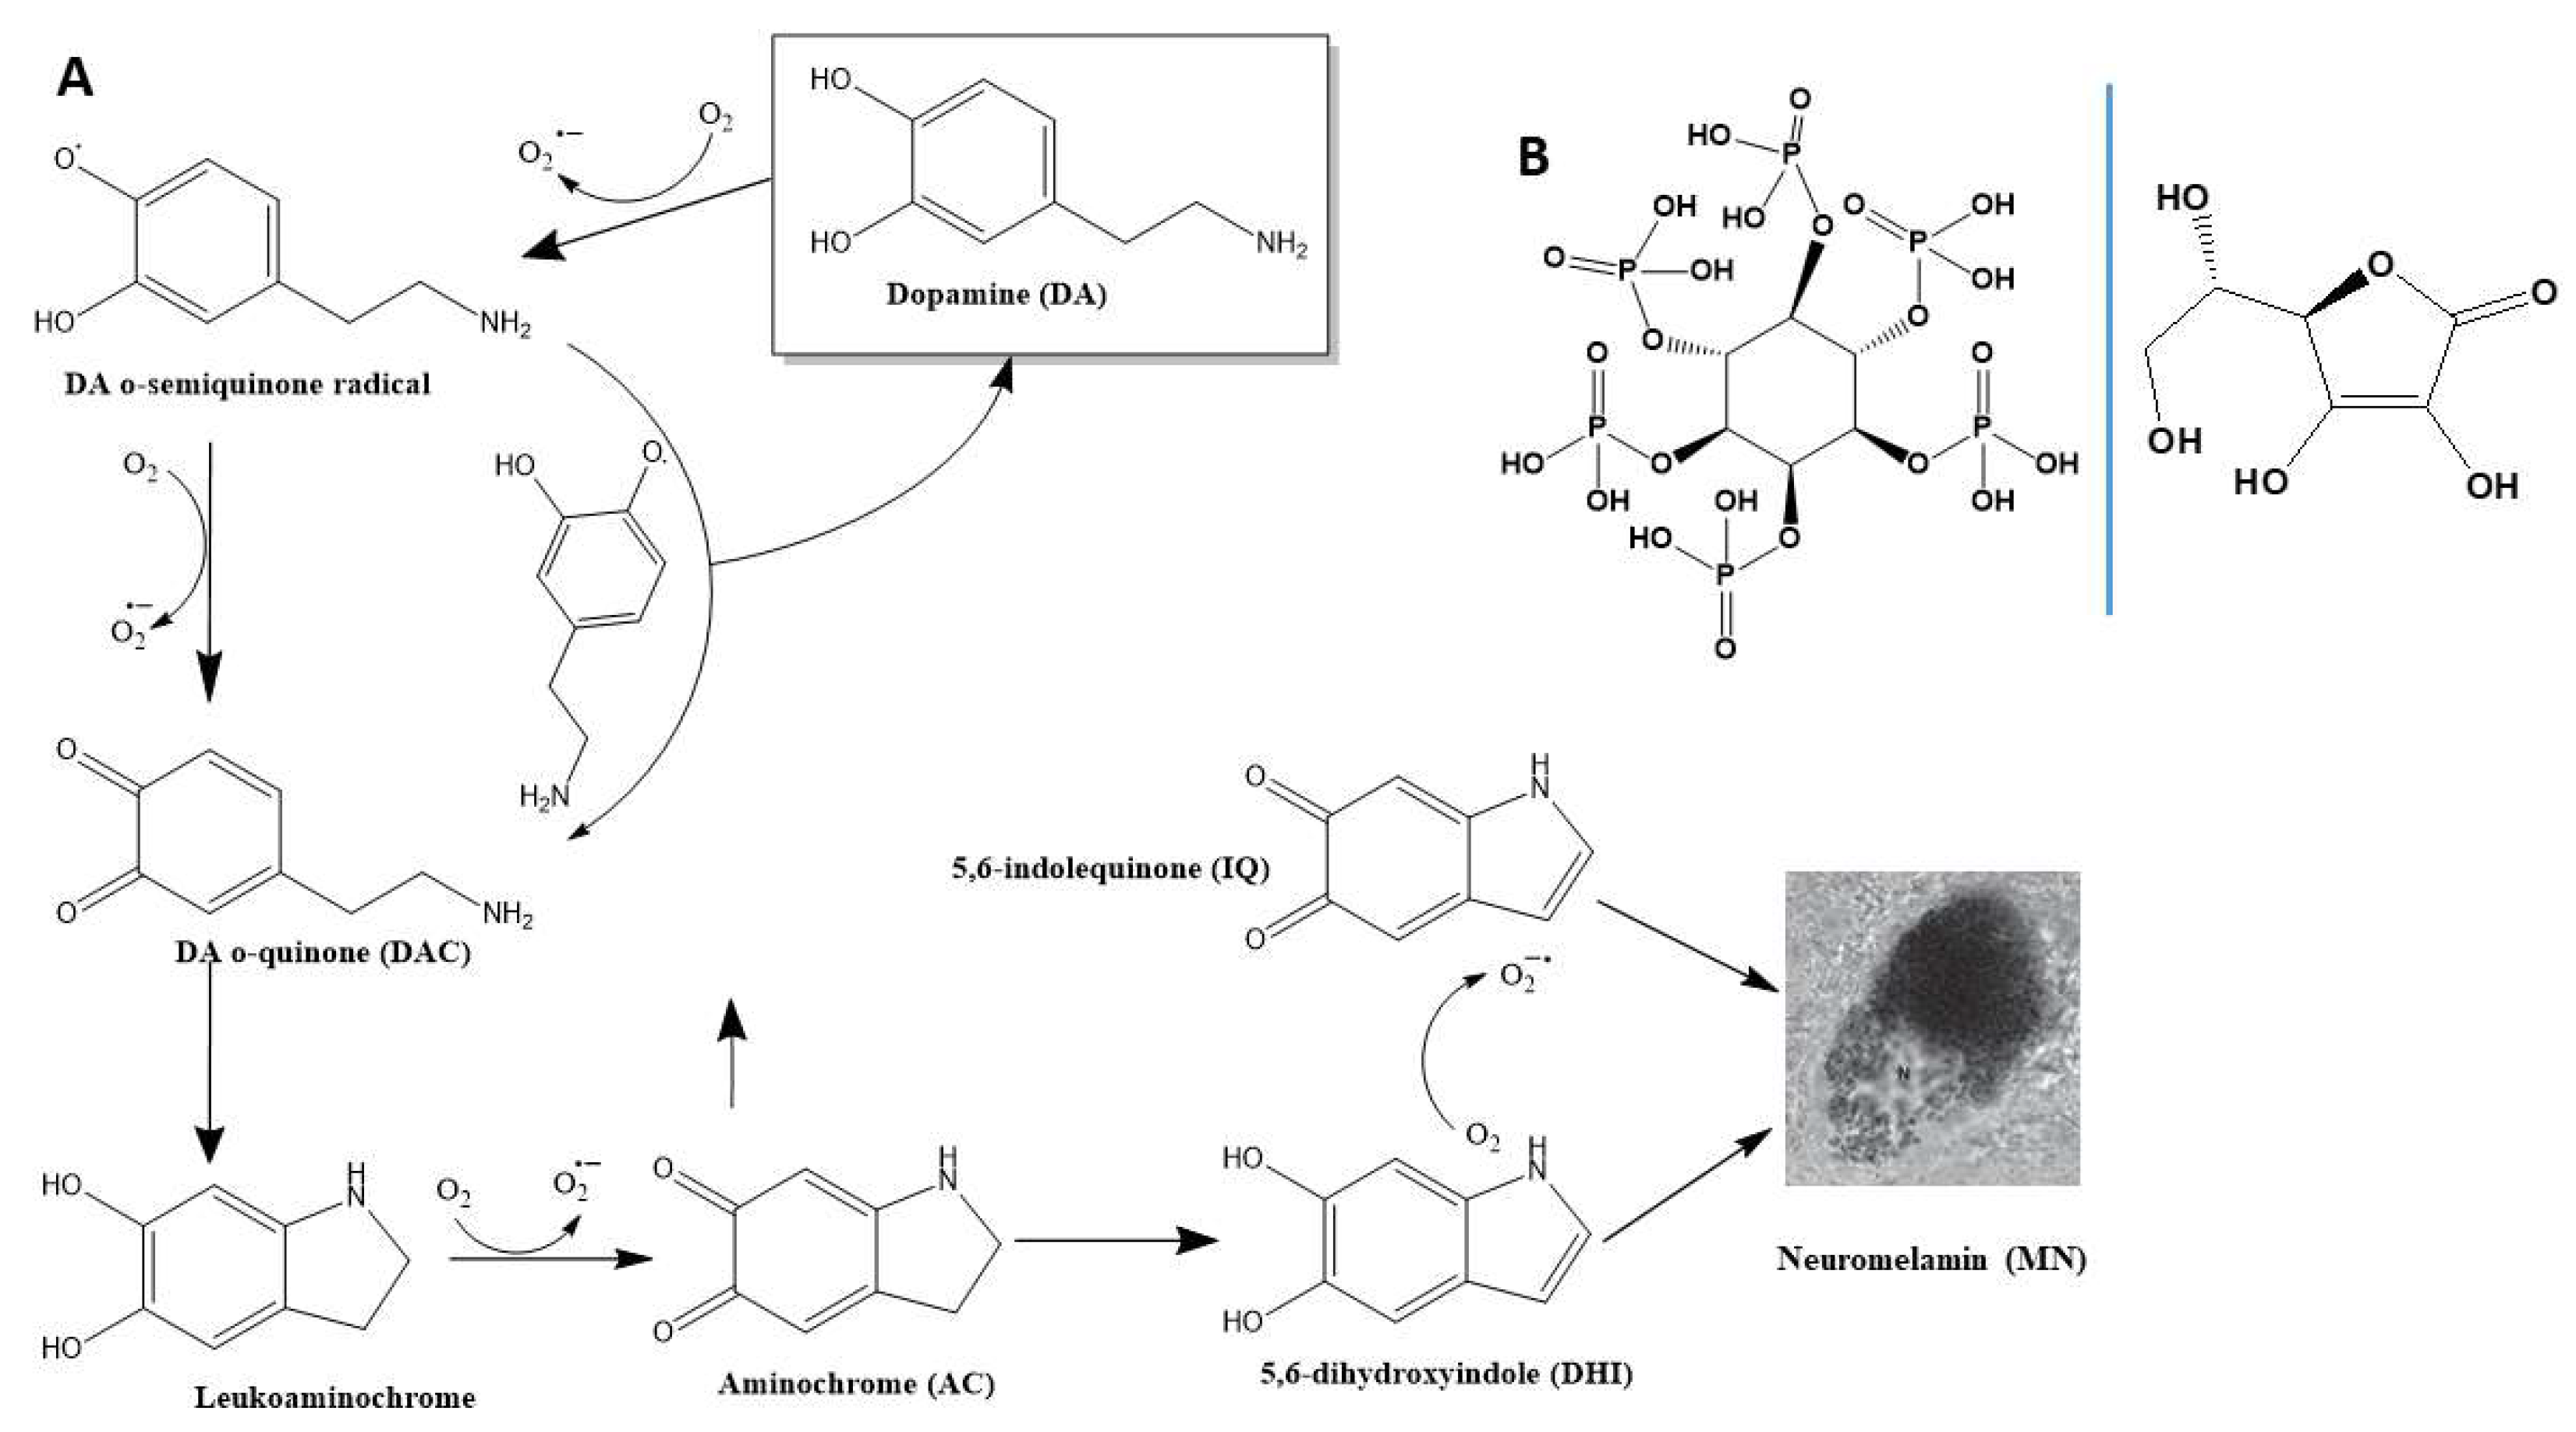
Dopamine (DA) that is not entrapped into dopaminergic vesicles undergoes spontaneous oxidation. This process begins with the loss of one electron, forming a DA o-semiquinone radical, accompanied by the reduction of one O₂ molecule to a superoxide radical (O₂·⁻). The reaction between two DA o-semiquinone radicals produces one molecule of DA and one molecule of DA o-quinone (DAQ). Alternatively, the DA o-semiquinone radical can reduce another O₂ molecule, also forming DAQ, which is stable only at pH<2. Under physiological conditions, DAQ rapidly cyclizes to leukoaminochrome, which subsequently oxidizes to aminochrome (AC). Finally, AC rearranges into 5,6-dihydroxyindole (DHI), which later oxidizes to 5,6-indolequinone (IQ). Both IQ and DHI co-polymerize through π-stacking interactions to generate neuromelanin (NM) (Figure 1A). The conversion of DA to NM can be monitored by measuring the increase in absorbance at 475 nm, attributed to AC formation (ε₄₇₅nm = 3,245 M⁻¹cm⁻¹; [67]), or at 650 nm, which serves as an index of NM polymerization while avoiding interference from other intermediates [78]. DA, DAQ, and DHI are unlikely to influence the measurement of AC, as most phenolic organics mainly absorb at ~290 nm [67,68].
Figure 1.
Oxidation pathway of DA to form NM and structural formulate of IP6 and AA. (A) Chemical structures of the products generated as a result of DA oxidation. The non-enzymatic degradation of DA produces superoxide radicals and quinones, which lately aggregate to form insoluble neuromelamin (NM). (B) Structural formulate of myo-inositol-1,2,3,4,5,6-hexakisphosphate or phytate (IP6; left) an ascorbic acid (AA; right).
To investigate how different environmental conditions influence the degradation of DA, we first used UV-Vis spectroscopy. The UV-Vis spectrum of DA exhibited temporal changes upon incubation, following a DA-concentration-dependent mechanism. At DA concentrations ranging from 30 to 100 μM, a gradual appearance of the characteristic band for AC at 475 nm was observed. Interestingly, once formed, AC appeared to remain relatively stable in solution, as its band did not disappear over time. This stability suggests that DA does not rapidly progress to DHI and/or IQ. However, the formation of small amounts of NM was evident, as indicated by the increased absorbance at 650 nm (Fig. S1A-C) and the visual detection of insoluble black particles (Fig. S2). Notably, at DA concentrations >500 μM, NM formation occurred at a significantly faster rate and in larger quantities. Under these high concentrations, AC appeared to rapidly progress towards NM polymerization, as evidenced by the rapid disappearance of the 475 nm band within 20 min of incubation (Fig. S1D,E).
These results prove that under aerobic conditions and at physiological pH, DA degrades to form AC, which subsequently initiates the polymerization of NM. However, the rate and yield of NM formation appear to be directly dependent on the concentration of DA.
3.1.2. Phosphate Catalyzes the Formation of NM from of AC
Next, we investigated the effect of phosphate, a component present under physiological conditions, on the degradation of DA. For this study, we used a 100 μM DA solution, which enabled the independent observation of AC and NM formation (Fig. S1C). In the absence of phosphate, AC was formed, along with other phenolic compounds as indicated by the appearance of a band at ~300 nm. However, none of these compounds progressed towards NM formation, as evidenced by the lack of change in absorbance at 650 nm over time (Fig. S3A). When 1 mM phosphate was present, NM formation was still not observed, but there was a slight increase in the amounts of AC and phenols after 120 min of incubation (Fig. S3B). At a phosphate concentration of 10 mM, AC formation was stimulated, which induced the formation of tinny amounts of NM (Fig. S3C). At phosphate concentrations >100 mM, DA rapidly polymerized to NM, as the characteristic spectroscopic bands of AC and phenols were no longer detectable (Fig. S3D,E).
These findings demonstrate that phosphate accelerates the degradation of DA into AC and other polyphenols and further confirm that phosphate is essential for the polymerization of NM.
3.1.3. NaCl Slightly Affects the Degradation Rate of DA
Given that NaCl is the most abundant salt in the intracellular space, we investigated its potential effects on the degradation of DA. We monitored the temporal variation of UV-Vis spectra for a 100 μM DA solution prepared in 10 mM phosphate buffer, both in the absence and presence of 20, 75, and 300 mM NaCl. The addition of 20 mM NaCl slightly increased the formation of AC and NM. However, increasing the NaCl concentration from 20 to 75 mM had minimal impact on the formation of AC or NM. A clear catalytic effect of NaCl on AC and NM formation was observed only when its concentration was increased to 300 mM (Fig. S4). These results indicate that under physiological-like NaCl concentrations, the salt has a negligible catalytic effect on DA degradation. Significant catalysis of NM polymerization by NaCl occurs only at higher concentrations.
3.1.4. On the Effect of Oxidants and Reductants on the Degradation of DA
Under oxidizing conditions, DA rapidly degrades, forming the products shown in Figure 1A. While NM is formed through π-stacking interactions between IQ and DHI, most other degradation products of DA result directly from its oxidation. To explore this further, we investigated whether the addition of strong oxidants, such as H₂O₂ or KIO₃, accelerates the oxidation rate of DA and/or increases the production of its degradation products.
The temporal variation of the UV-Vis spectra of DA showed no significant changes following the addition of H₂O₂ or KIO₃. The only notable difference was a slight increase in absorbance at ~650 nm, indicating a modest enhancement in NM production (Fig. S5A-C). This suggests that the oxidizing abilities of H₂O₂ or KIO₃ (at 50 μM concentrations) are negligible compared to that of O₂. This is likely due to their similar standard redox potentials (Er⁰: H₂O₂/H₂O ~ 1.7V; IO₃⁻/I⁻ ~ 1.2V; O₂/H₂O ~ 1.2V) and the much higher concentration of dissolved O₂ in the phosphate buffer (~250 μM) [79].
Since the degradation of DA occurs via a redox process, it is expected that the addition of reductants would inhibit DA oxidation. Indeed, the presence of 50 μM ascorbic acid (AA) or TCEP completely suppressed any temporal changes in the UV-Vis spectra of DA (Fig. S5D-E), confirming that these reductants effectively inhibit DA oxidation. Consequently, the high concentration of AA in neurons (~10 mM) [65] is likely a critical component of the neuronal antioxidant machinery, playing a key role in preventing the oxidation of cytoplasmic free DA.
Our findings demonstrate that under aerobic conditions, the presence of oxidants does not significantly enhance the oxidation rate of DA. However, the presence of reducing agents, such as AA, completely inhibits DA degradation.
3.1.5. Fe3+ Enhances the Degradation Rate of DA
Next, we investigated the effect of Fe³⁺ on the degradation of DA. The catechol group in DA (Figure 1A) can readily coordinate with Fe³⁺ [80], and the formation of this complex could influence its degradation rate. Hedges et al. demonstrated that Fe³⁺ increases the rate of NM formation, with Fe³⁺ subsequently binding to NM deposits. This finding indicates that Fe³⁺ does not act as a catalyst in NM formation but instead becomes part of the final product [62]. Here, we explored whether Fe³⁺ also accelerates DA degradation. The addition of Fe³⁺ led to an increased accumulation of insoluble brownish particles corresponding to NM, as confirmed by a temporal increase in UV absorbance at 650 nm (Figure 2A). Furthermore, Fe³⁺ exhibited a concentration-dependent catalytic effect on the formation rate of phenolic organic compounds (likely DAQ and/or DHI) (Figure 2B) and AC (Figure 2C). These findings demonstrate that Fe³⁺ not only enhances the formation of NM but also significantly accelerates the degradation rate of DA.
Figure 2.
Studying the effect of Fe3+ on the degradation of DA. (A) Temporal variation of the UV-Vis absorbance spectra of a solution containing DA (100 μM) in the presence of Fe3+ (5 μM). (B-C) Temporal variation of the absorbance (at 301 nm (B); and at 493nm (C)) of a solution containing DA (100 μM) in the absence (yellow dots) and in the presence of different concentrations of Fe3+ (black dots (1 μM); red dots (2 μM); green dots (5 μM); and blue dots (10 μM)). (D) Temporal variation of the UV-Vis absorbance spectra of a solution containing DA (100 μM) in the presence of Fe3+ (5 μM) and 50 μM of H2O2. (E) Temporal variation of the UV-Vis absorbance spectra of a solution containing DA (100 μM) in the presence of Fe3+ (5 μM) and 50 μM of tris(2-carboxyethyl)phosphine (TCEP). (F) Temporal variation of the UV-Vis absorbance spectra of a solution containing DA (100 μM) in the presence of Fe3+ (5 μM) and 50 μM of EDTA. All solutions were prepared using a 10 mM phosphate (pH 7.4) containing 75 mM NaCl and all the spectra were recorded at 37ºC.
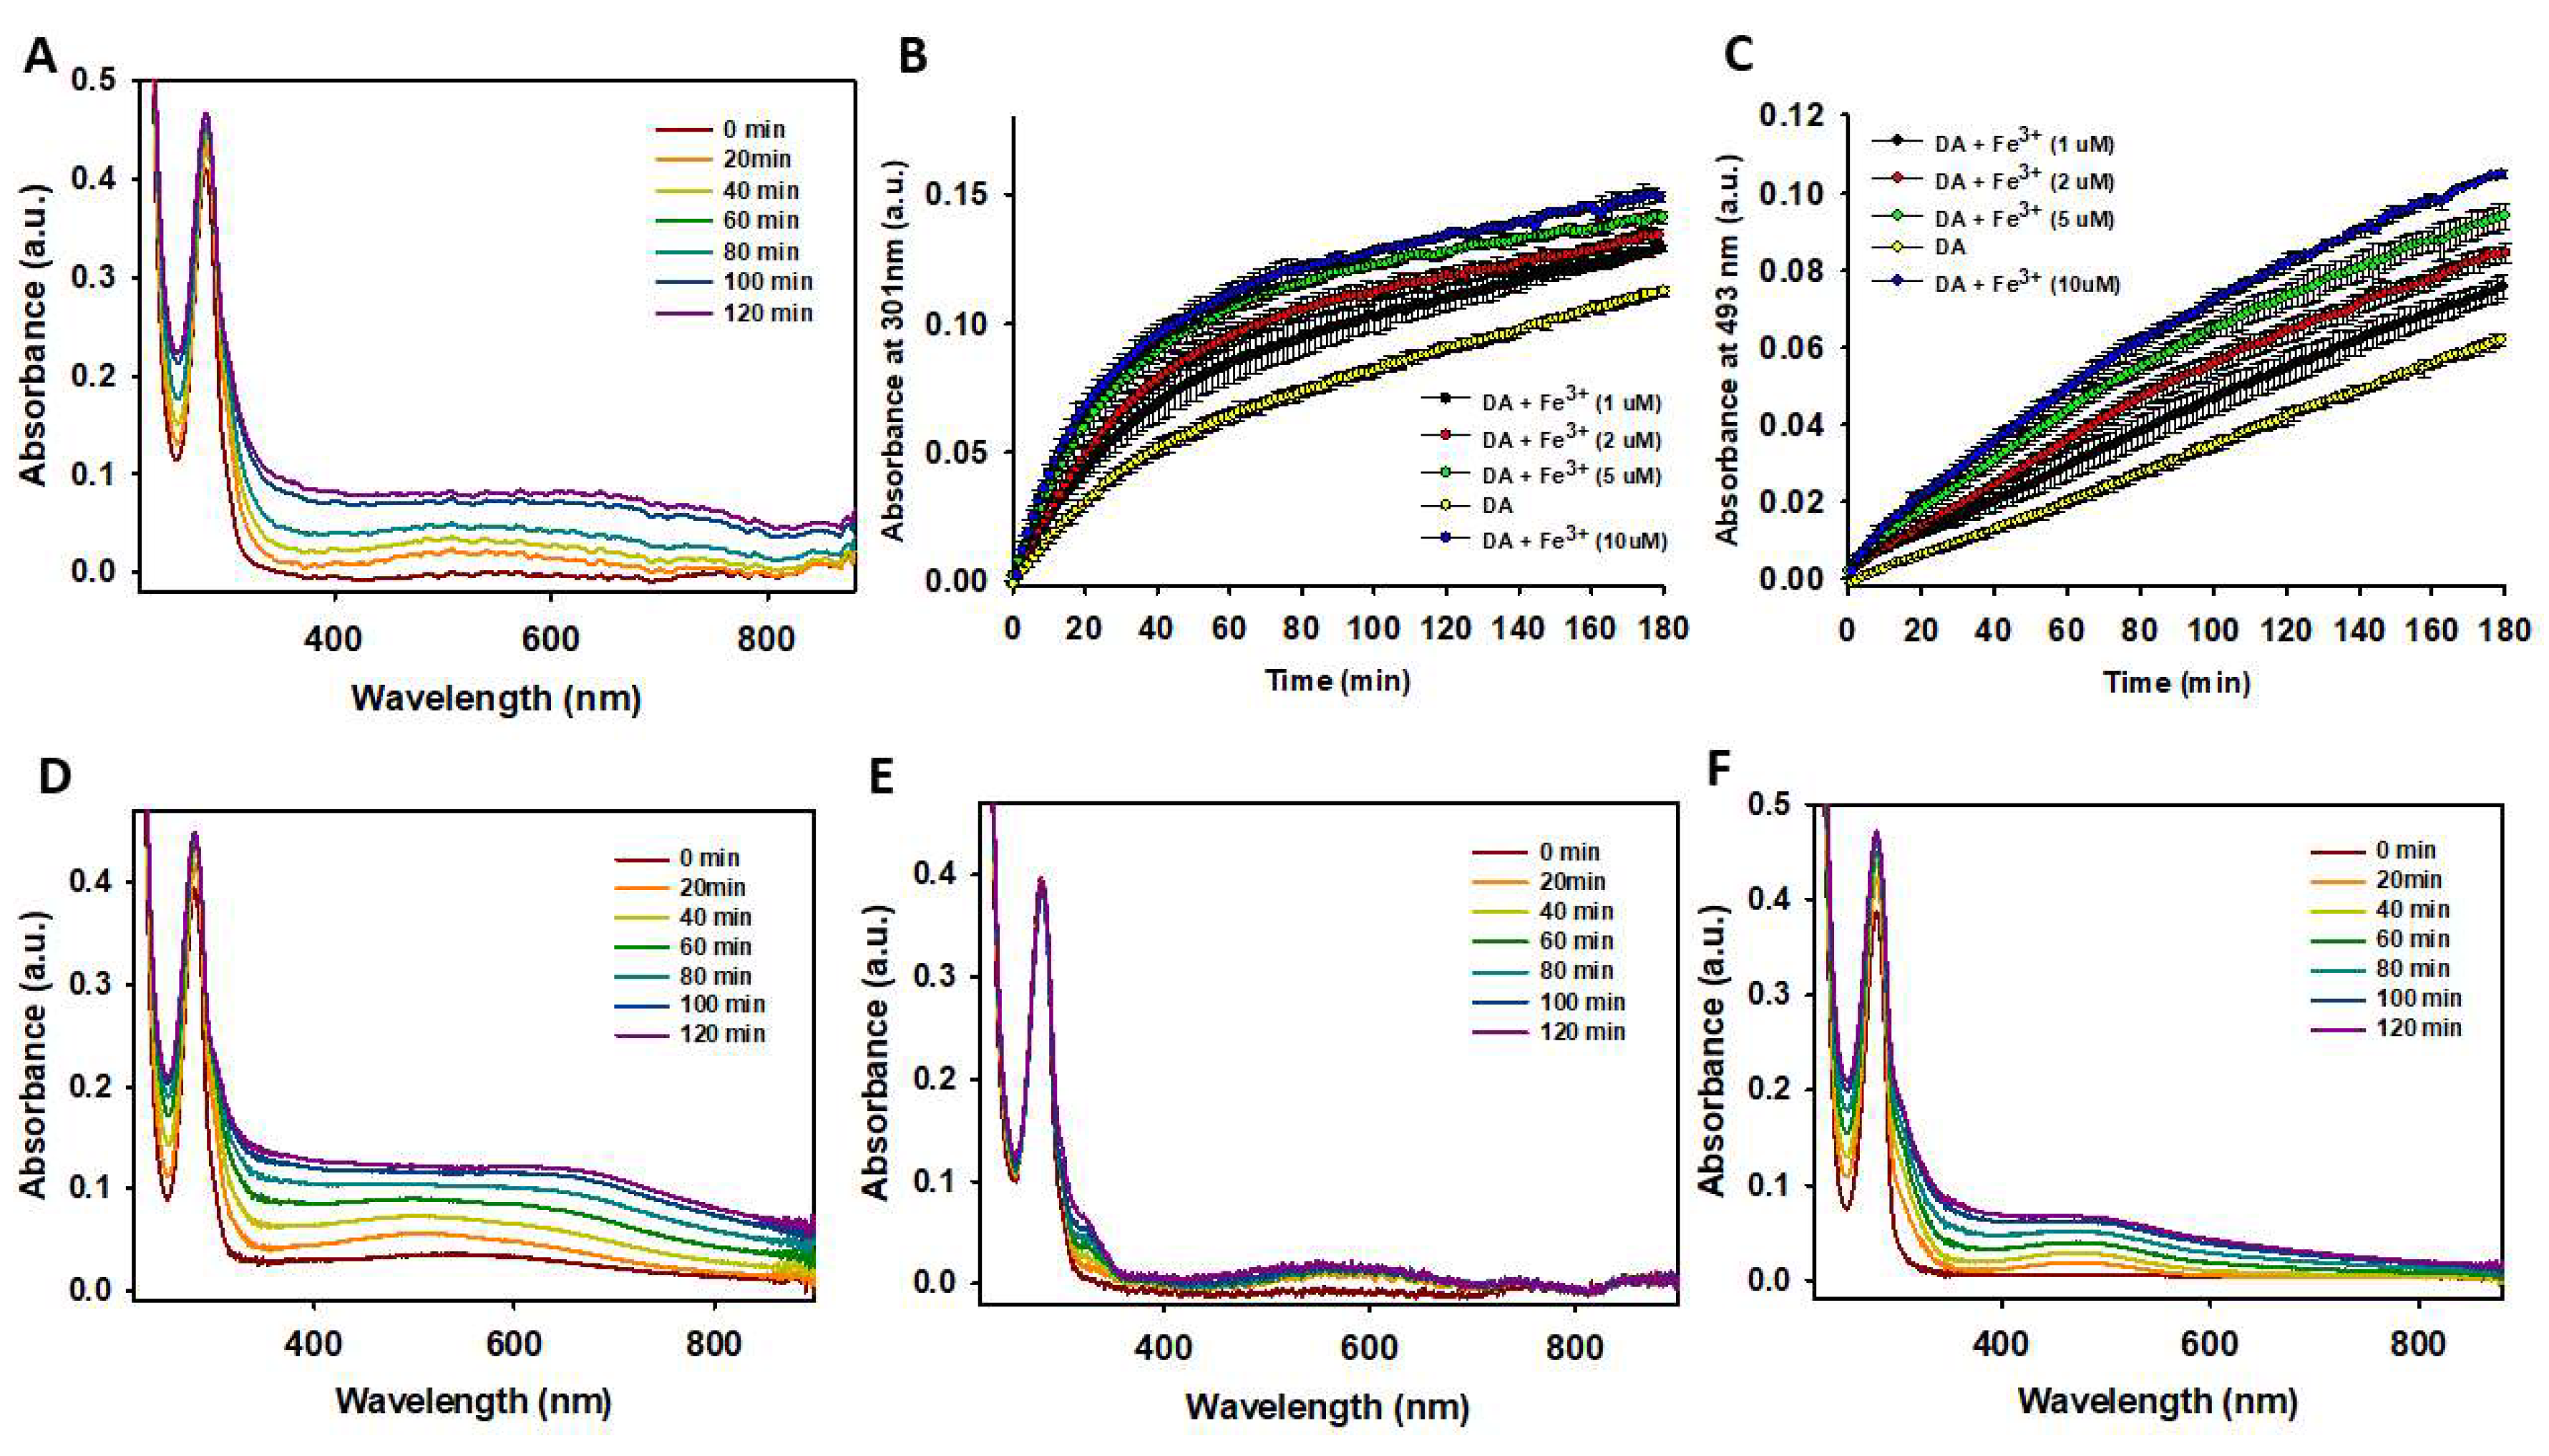
We then studied whether the presence of oxidants, reductants, and chelators influenced the catalytic effect of Fe³⁺ on DA degradation. The combined presence of Fe³⁺ and H₂O₂ significantly increased the formation rates of DAQ, DHI, AC, and NM (Figure 2D) to a much greater extent than when either Fe³⁺ (Figure 2A) or H₂O₂ (Fig. S5B) were present alone. This demonstrates that the co-presence of Fe³⁺ and pro-oxidants has a severe impact on free DA, accelerating its degradation. In contrast, the addition of a reductant, such as TCEP, completely inhibited the catalytic effect of Fe³⁺ on DA degradation. Only a slight increase was observed in the band corresponding to phenolic compounds (~290 nm) and the appearance of a broad band at ~580 nm, which could not be assigned (Figure 2E). These features were absent in the spectra of DA in the presence of TCEP alone (Fig. S5E), suggesting that Fe³⁺, even in the presence of reductants, can still contribute to DA degradation, albeit minimally. Finally, we attempted to inhibit the catalytic effect of Fe³⁺ by adding a strong Fe³⁺ chelator, such as EDTA. Chelation of Fe³⁺ significantly reduced its catalytic activity on AC formation and decreased NM production. The temporal variation of the UV-Vis spectra for DA in the presence of EDTA (Figure 2F) closely resembled that of DA incubated alone (Fig. S5A), indicating that chelating Fe³⁺ effectively neutralizes its impact on DA degradation.
Our findings demonstrate that free Fe³⁺ cations significantly accelerate the degradation of DA and the formation of NM. The mechanism of action likely involves the reduction of Fe³⁺ to Fe²⁺, coupled with the oxidation of DA. However, this effect can be effectively counteracted by the addition of chelating agents that sequester free Fe³⁺.
3.1.6. On the effect of Ca2+, Zn2+ and Al3+ on the degradation of DA
In addition to Fe³⁺, other cations may also stimulate DA degradation. Ca²⁺, which is abundant in the striatum, can coordinate with catechols [81]. However, while it cannot induce melanogenesis per se, it can do so in the presence of oxidants [62]. Al³⁺ binds to catechols and catalyzes the conversion of AC to DHI [82], whereas the co-presence of DA and Zn²⁺ has been shown to synergistically enhance cell death and dopamine depletion in the striatum [83]. To investigate whether Ca²⁺, Al³⁺, or Zn²⁺ could accelerate DA degradation, we examined their effects on the temporal UV-Vis spectral changes of DA. Unlike Fe³⁺, none of these cations influenced the temporal changes in the UV-Vis spectrum of DA when incubated alone (Fig. S6A-C). Specifically, these cations exhibited no concentration-dependent catalytic effects on the formation rates of phenolic organic compounds (Fig. S6D-F) or AC (data not shown). Thus, our results indicate that other cations implicated in neurodegeneration, such as Ca²⁺, Al³⁺, or Zn²⁺, have a significantly lower capacity to induce DA degradation compared to Fe³⁺.
3.1.7. Effect of pH and Buffer-Type on the Degradation of DA
We finally studied the effects of pH and buffer type on the degradation rate of DA. Temporal variations in the UV-Vis spectra of DA were recorded using a 10 mM phosphate buffer supplemented with 75 mM NaCl at pH 6.0, 6.5 and 7.4 (Fig. S7A-C). The results demonstrate that both the degradation rate and the yield of DA oxidation products are strongly pH-dependent. At pH 7.4, the formation of polyphenols (as proves the band at ~300 nm), AC (see the band at ~475 nm), and NM (evidenced by the band at ~650 nm and confirmed through visual inspection) was clearly observed. In contrast, NM formation was completely abolished at pH 6.0 and 6.5. Under these pHs, only small amounts of polyphenols and AC were detected, with their concentrations being significantly lower at pH 6.0 than at pH 6.5.
We then studied the effect of buffer type on the Fe³⁺-catalyzed degradation rate of DA. Four buffers with varying chemical compositions and buffering capacities were tested: MES (pH 5.5–7.0), HEPES (pH 6.8–8.2), TRIS (pH 7.0–9.2), MOPS (pH 6.5–7.9), and phosphate (pH 5.8–8.0) (Fig. S8). The obtained data demonstrate that the chemical nature of the buffer significantly impacts the Fe³⁺-catalyzed degradation rate of DA. Among the buffers tested, phosphate exhibited the highest capacity to promote Fe³⁺-catalyzed degradation of DA and the subsequent formation of AC and NM. This effect was concentration-dependent (Fig. S3), indicating that both Fe³⁺ and phosphate can catalyze DA degradation. In contrast, the degradation of DA and NM formation were markedly slower in TRIS compared to the other buffers. This can be attributed to the moderate ability of TRIS to chelate iron cations [84,85], while other buffers like HEPES or MOPS have a really low affinity for iron [86].
All these results prove that the degradation of DA and the formation of AC and NM are highly sensitive to small variations in pH. Furthermore, our results confirm that buffer composition significantly influences the Fe³⁺-catalyzed degradation of DA and the formation of AC and NM. This effect may be attributed to the iron-chelating properties of the buffer and/or its capacity to catalyze specific molecular pathways involved in DA oxidation.
3.2. IP6 Inhibits the Fe3+-Catalyzed Degradation of DA
Understanding the influence of different environmental factors on the degradation rate of DA is of crucial, given its critical role in neurotransmission [64]. DA is synthesised in dopaminergic neurons from the initial conversion of L-Phe to L-Tyr, which is further transformed to L-levodopa and finally to DA. Afterwards, DA is stored in synaptic vesicles (SVs) and then released into the synaptic cleft, where it binds to DA receptors. Then, DA may either be reabsorbed by DA transporters and repackaged into SVs, or degraded via one of two main enzymatic pathways: i) the monoamine oxidase pathway, which converts DA to 3,4-dihydroxyphenylacetaldehyde (DOPAL) and then to 3,4-dihydroxyphenylacetic acid (DOPAC); and ii) the catechol-o-methyltransferase pathway, that transforms DA to 3-methoxytyramine. Both pathways end with the formation of homovanillic acid, which is excreted in the urine [87].
Typical DA concentrations in the cytoplasm of the substantia nigra range between 2 and 5 μM [88]. These levels are needed for the correct neurotransmission, but are very sensitive to dysregulated Fe3+ metabolism, which profoundly affects DA homeostasis. Excess of Fe3+ disrupts enzymatic functions leading to imbalances in DA production; accelerates the degradation of DA (Figure 2) by forming NM; increases de production of DOPAL and ROS; and impairs the activity of DA transporters responsible for DA reuptake from the synaptic cleft [62,89,90]. All these pathological processes are particularly significant in the context of neurodegeneration, a condition that both results from and exacerbates elevated Fe³⁺ levels in the brain [91,92,93]. Consequently, Fe3+-chelating pharmacological interventions may help mitigate these detrimental effects and restore DA balance.
Given the proven ability of IP6 (Figure 1B) to effectively chelate Fe3+ [57,58] and its presence in neurons at μM levels [94], we propose that IP6 could serve as a protective agent against Fe³⁺-induced degradation of DA.
3.2.1. IP6 Inhibits the Fe3+-Catalyzed Degradation of Free DA
Most DA is stored in the SVs, where their lumen maintains a slightly acidic pH (5.5–6.0) [95]. This acidic environment is crucial for the proper function of vesicular transporters and the integrity of the vesicle proteins. This low pH is maintained by vacuolar-type H+-ATPases, which actively pump protons into the vesicles. The resulting H+ gradient drives the exchange of H+ for DA vesicular transporters, ensuring the efficient DA storage [87]. Consequently, we studied whether IP6 could protect DA from Fe3+-catalysed degradation at pH 6.0, using MES buffer to simulate the vesicle pH.
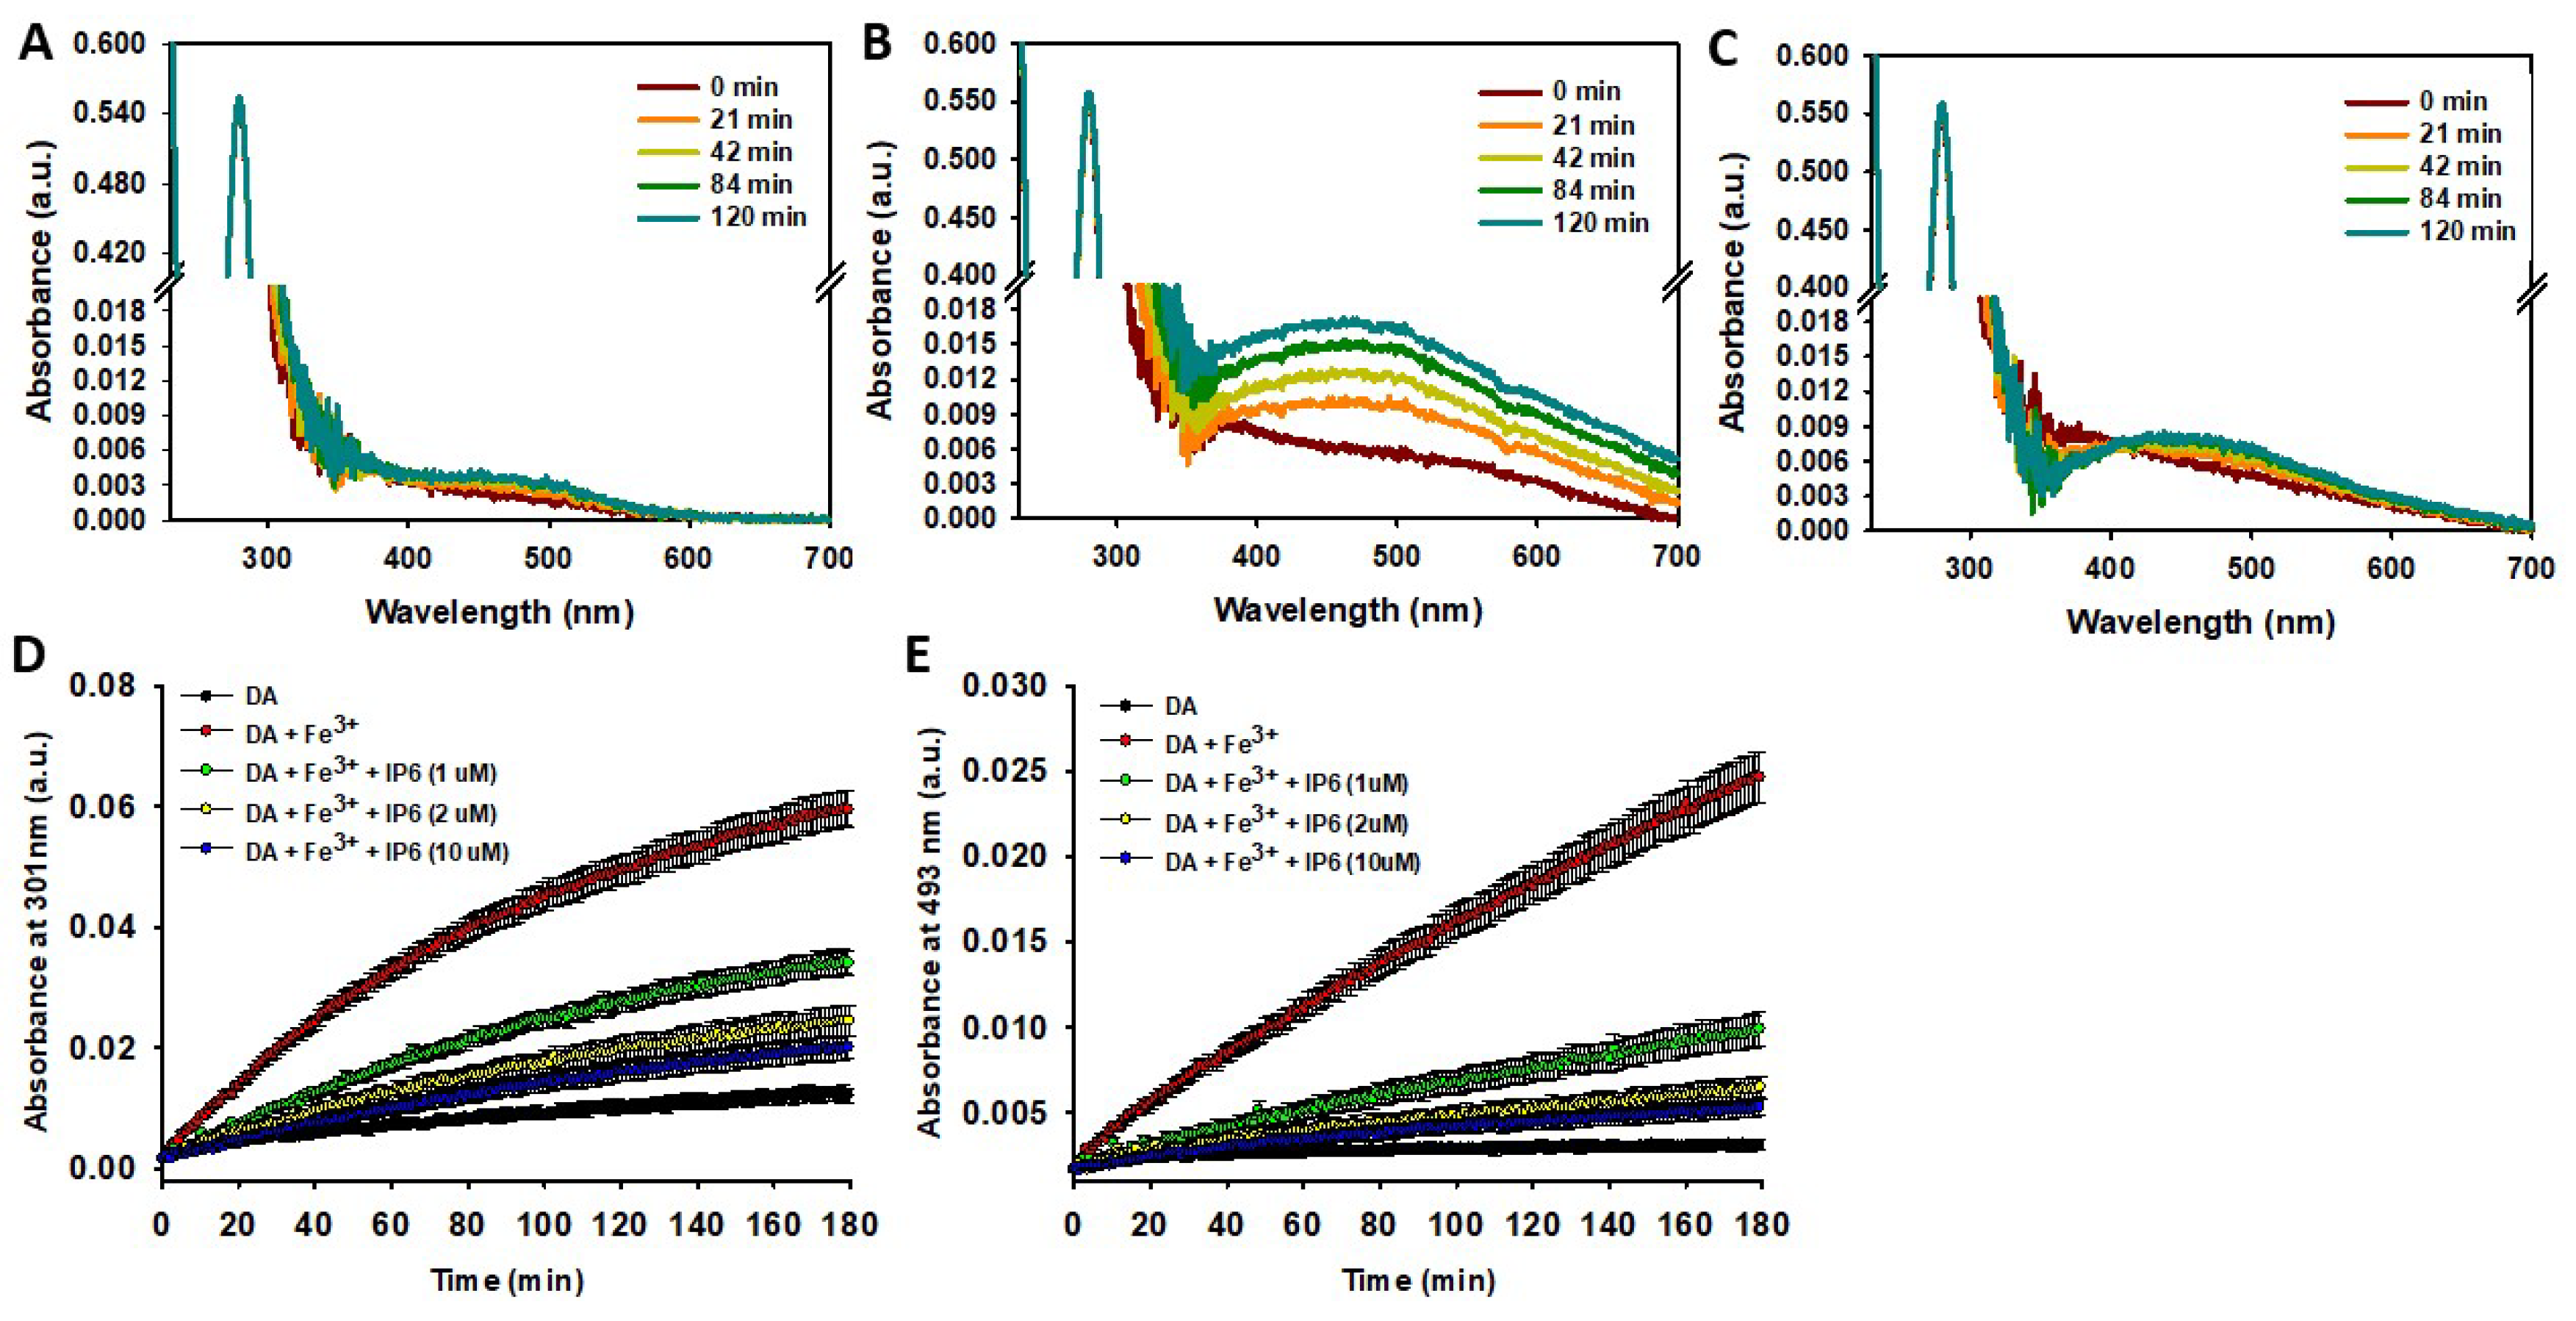
Unlike the results obtained when DA was incubated in phosphate at pH 7.4 (Fig. S3C), its incubation in MES at pH 6.0 did not significantly alter its UV spectrum profile. This suggests that the replacement of phosphate with MES and/or the decrease in pH (from 7.4 to 6.0) effectively inhibited DA autoxidation (Figure 3A,D,E). The addition of Fe3+ (10 μM) stimulated the formation of polyphenols (indicated by the band appearing at ~301 nm), NM (evidenced by the absorbance increase at ~600 nm), and notably AC (indicated by the band at ~490nm) (Figure 3B,D,E). Hence, Fe3+ is capable of catalysing DA degradation even at pH 6.0. However, the catalytic effect of Fe3+ was completely neutralized when IP6 was added. In fact, after 120 minutes of incubation with Fe³⁺ and IP6, the UV-Vis spectrum of DA was nearly identical to that observed prior to incubation. Only a slight increase in the band at ~493 nm was detected, suggesting minimal formation of AC (Figure 3C). The IC50 of IP6 was ~1 μM, a concentration 10 times lower than that of Fe³⁺ (10 μM). Increasing the concentration of IP6 to 2 μM slightly enhanced its inhibitory effect, but further increases to 10 μM had a negligible impact (Figure 3D, E). This behavior can be attributed to the high affinity of IP6 for Fe³⁺ and its ability to chelate one to four Fe³⁺ ions under physiological conditions [96].
Consequently, our data reveal that IP6 exhibits remarkable protective properties against Fe3+-catalysed DA oxidation.
Figure 3.
Effect of IP6 on the Fe3+-catalyzed degradation of DA. (A-C) Temporal variation of the UV-Vis spectra of a solution containing DA (100 μ M) incubated at 37ºC in a 20mM MES buffer (pH 6.0) containing 75 mM NaCl in the absence (A) and in the presence of Fe3+ (10 μM) (B) or in the presence of Fe3+ (10 μM) and IP6 (1 μM) (C). (D) Temporal variation of the absorbance at 301 nm of a solution containing DA (100 μM) in the absence (black dots) and in the presence of Fe3+ (10 μM) with or without IP6 at different concentrations (i.e. 1, 2 and 10 μM). (E) Temporal variation of the absorbance at 493 nm of a solution containing DA (100 μM) in the absence (black dots) and in the presence of Fe3+ (10 μM) with or without IP6 at different concentrations (i.e. 1, 2 and 10 μM).
3.2.2. IP6 Inhibits the Fe3+-Catalyzed Degradation of Liposome-Encapsulated DA
Since intraneuronal DA is mainly encapsulated within SVs, we further investigated whether IP6 could also inhibits the degradation of DA encapsulated in small unilamellar vesicles (SUVs), which mimic SVs. The SUVs were assembled using the cationic lipid DOPC (Figure 4A) in a 20 mM MES buffer (pH 6.0) containing 1 mM DA. The efficiency of DA encapsulation into the DOPC-SUVs, as achieved through the described protocol, was confirmed by collecting the UV-Vis spectra of Triton X-100-disaggregated SUVs, both in the presence and absence of Fe³⁺ (10 μM) and/or IP6 (50 μM) (Figure 4B). The resulting spectra did not reveal UV-Vis bands characteristic of polyphenols, AC, or NM formation, thus indicating that the vesicle encapsulation and low pH (~6.0) effectively protects DA from autoxidation.
Figure 4.
Studying the ability of IP6 to inhibit the Fe3+-catalyzed degradation of DA inside of SUVs. (A) Structural formulae of 1,2-dioleoyl-sn-glycero-3-phosphocholine (DOPC) and graphical representation of the SUVs when containing encapsulated DA, IP6 and Fe3+. (B) UV-Vis spectra of disaggregated DOPC- SUVs (using 1% Triton X-100) that where assembled using a 20 mM MES buffer (pH 6.0) that contained 75 mM NaCl and 1 mM DA (black), 1 mM DA and Fe3+ (10 μM) (red), or 1 mM DA, 10 μM Fe3+, and 50 μM IP6 (green). (C) Temporal variation of the absorbance at 493 nm of a solution containing DA (1 mM) in 20 mM MES buffer (pH 6.0) and 75 mM NaCl, collected in the absence (black dots) and in the presence of Fe3+ (10 μM) with or without IP6 (50 μM). In this study, DA, Fe3+ and IP6 were encapsulated in DOPC-SUVs. (D) Temporal variation of the absorbance at 301 nm of a solution containing DA (1 mM) in 20 mM MES buffer (pH 6.0) and 75 mM NaCl, collected in the absence (black dots) and in the presence of Fe3+ (10 μM) with or without IP6 (50 μM). In this study, DA, Fe3+ and IP6 were encapsulated in DOPC-SUVs.
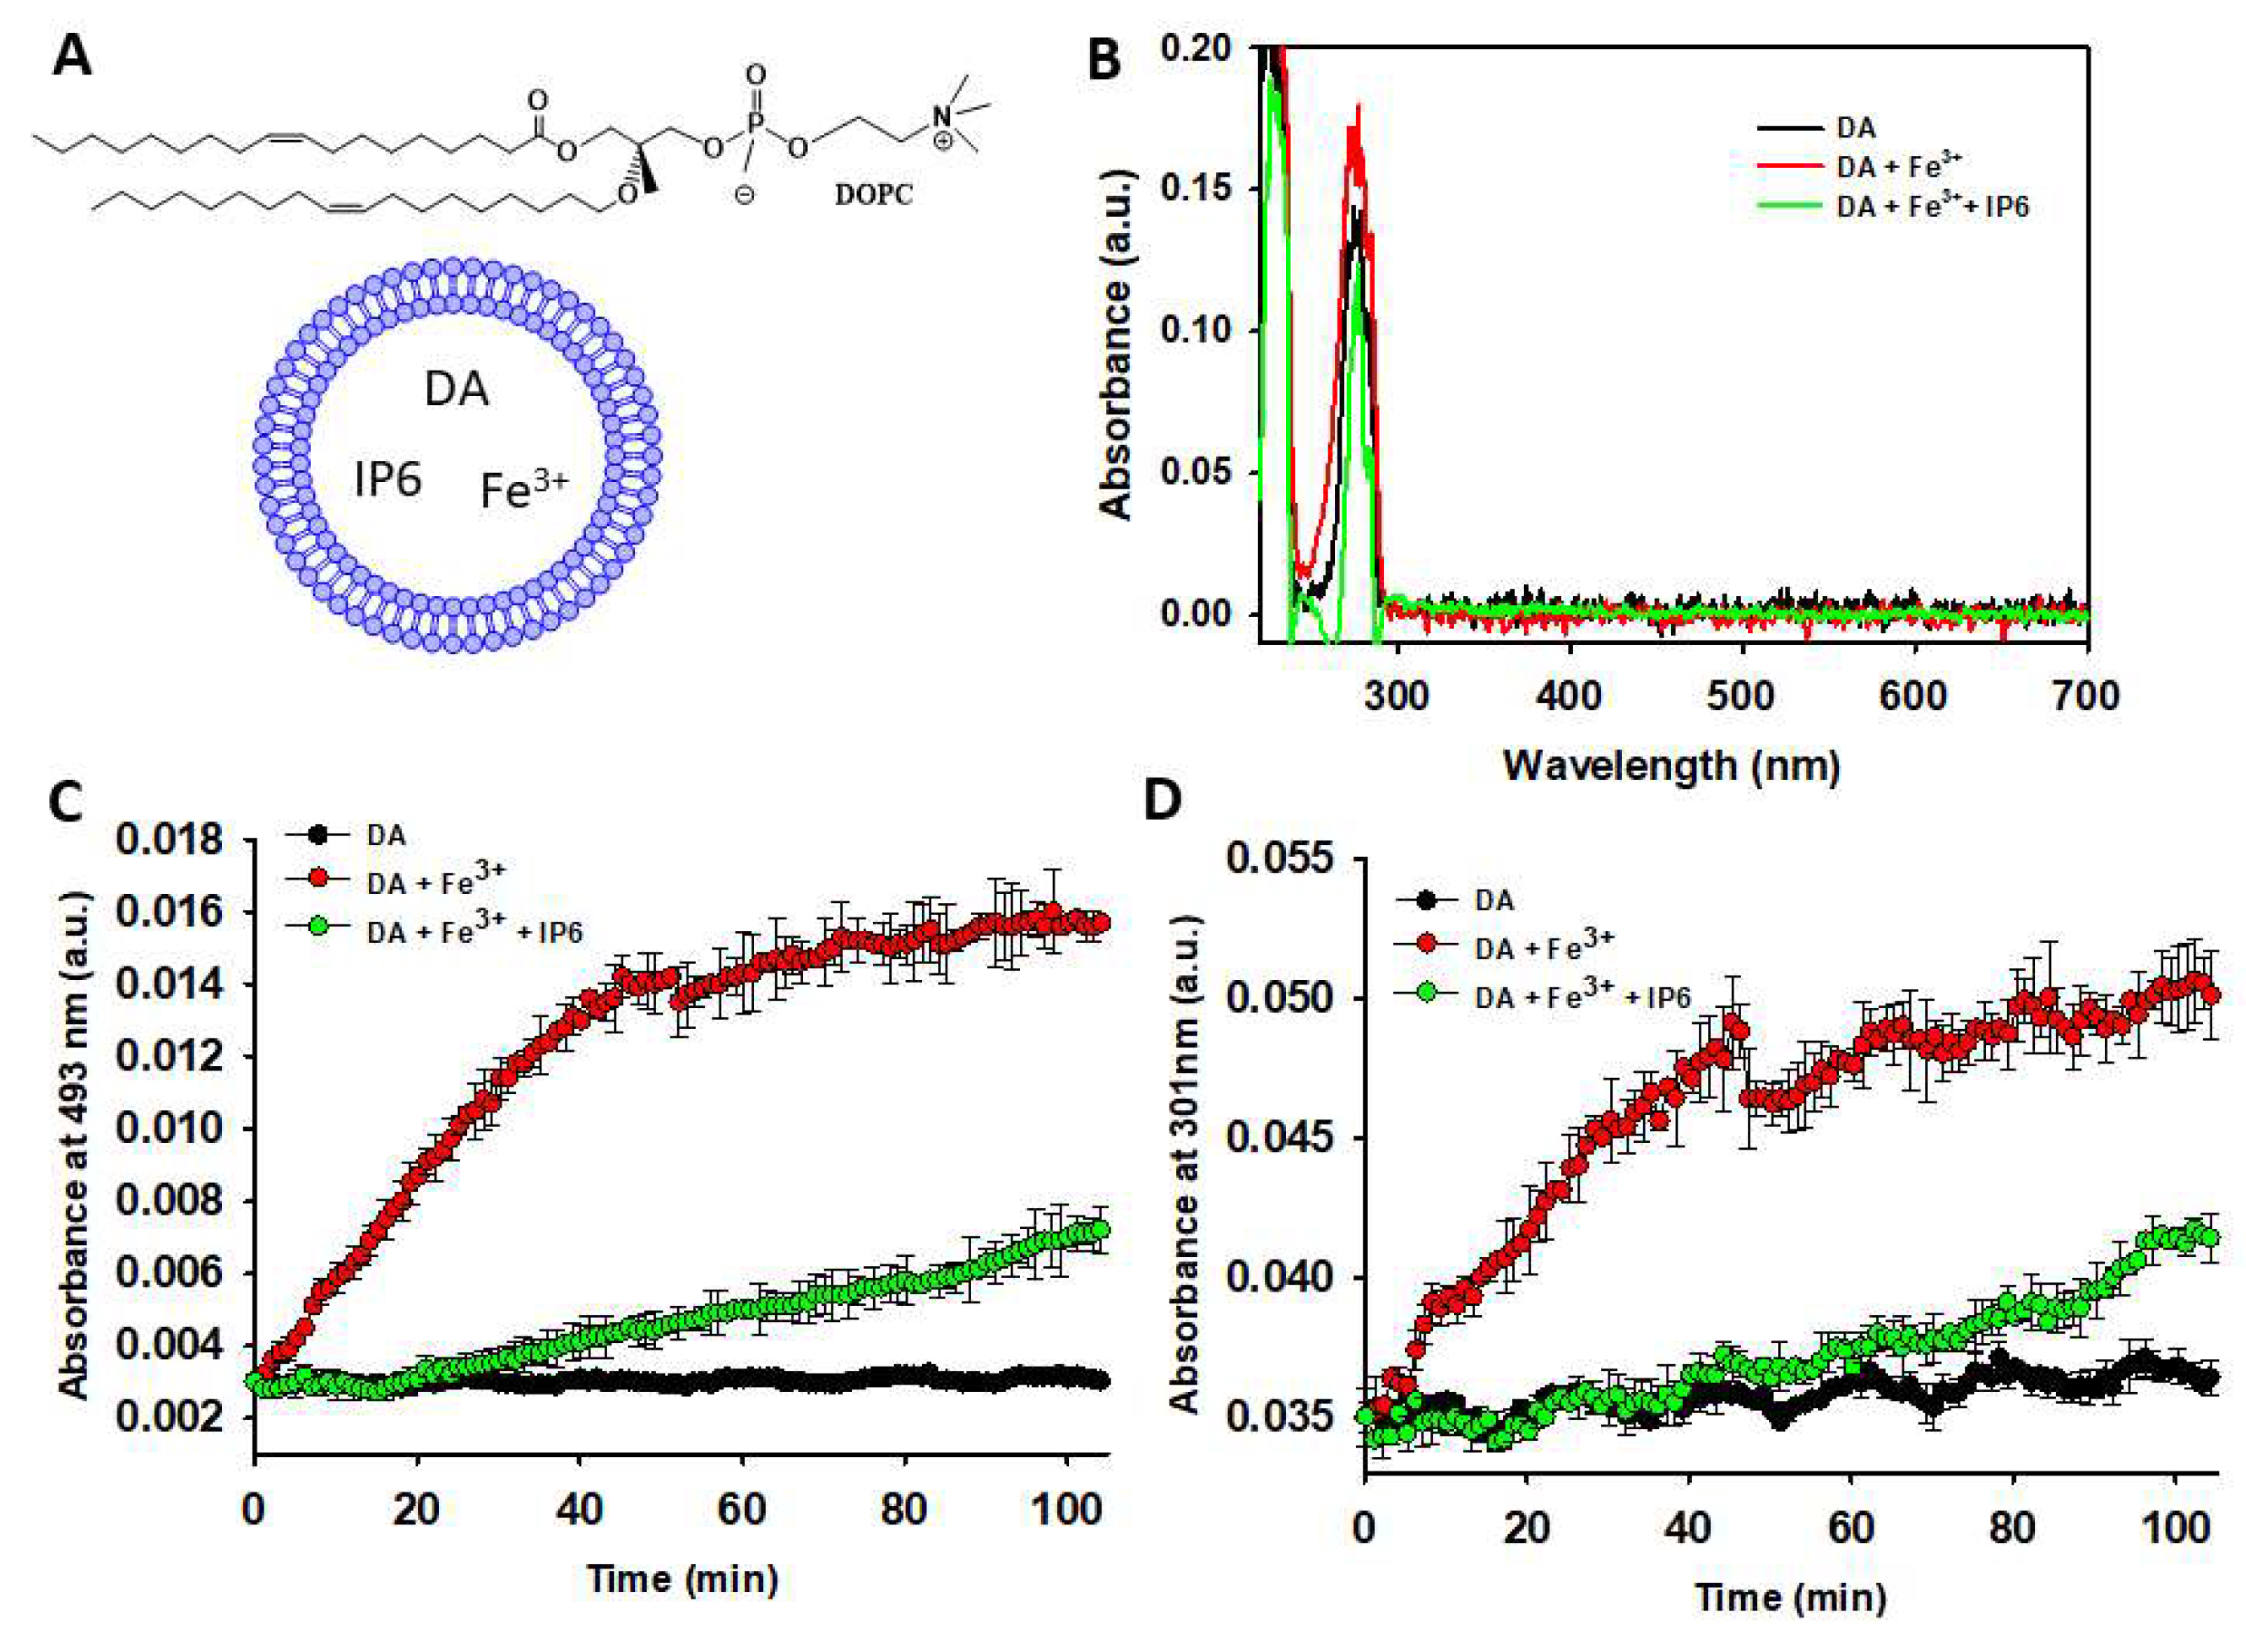
Even the incubation of DA-containing vesicles at 37°C did not lead to the formation of polyphenols or AC, as proved by the negligible changes in UV-Vis absorbance at 301 and 493 nm (Figure 4C,D). Consequently, vesicle encapsulation completely prevented DA from progressing to NM formation, as no blackish insoluble particles, characteristic of NM (Fig. S2), were observed in the incubated DA-containing vesicles. In contrast, UV-Vis data clearly demonstrate that the addition of Fe³⁺ to encapsulated DA stimulates its autoxidation, leading to the formation of AC and polyphenols. However, this Fe³⁺-induced oxidation was significantly inhibited by the presence of IP6 (Figure 4C, D).
Hence, this data prove that vesicle encapsulation protects DA from autoxidation. However, autoxidation is enhanced if encapsulation occurs in the presence of free Fe³⁺. Notably, this metal-induced catalytic effect is inhibited by the presence of encapsulated IP6. These findings suggest that IP6 may provide protection against DA autoxidation even within the lumen of SVs.
3.3. IP6 Inhibits the Fe3+-Catalyzed Degradation of AA and the Formation of ROS.
In addition to DA, neurons contain other small molecules essential for the correct neurotransmission and maintaining neuronal redox balance. One of these molecules is ascorbic acid (AA) (Figure 1B), which is highly concentrated in neurons and therefore, it plays crucial roles in their function [65,66]. However, an excess of free Fe3+ stimulates AA degradation and leads to the concomitant production of ROS, thereby disrupting the normal neuronal function [97,98]. Given these effects, we decided to study whether IP6 could also inhibits the Fe³⁺-catalyzed AA degradation and prevents the formation of ROS.
We previously demonstrated that the degradation rate of AA is accelerated by increasing phosphate concentrations but is slowed when rising NaCl concentration [72], likely due to the inhibitory effect of NaCl on the AA-O2 interaction [99]. To achieve the lowest non-catalyzed degradation rate of AA, we studied its time-dependent degradation in a 10 mM phosphate buffer (pH 7.4) containing 150 mM NaCl. Under these conditions, only ~8% of AA degraded after 150 min of incubation. However, the presence of a small concentration of Fe3+ (i.e. 2.5 μM) notably accelerated its oxidation rate, with ~42% of AA degraded over the same incubation period. Interestingly, the addition of tinny amounts of IP6 (i.e. ~1 μM) almost completely abolished the pro-oxidant effect of Fe3+. Increasing the IP6 concentration (from 1 μM to 100 μM) did not significantly enhance its inhibitory effect, indicating that: i) Fe³⁺ chelated by IP6 cannot catalyse the oxidation of AA; and ii) an IP6:Fe³⁺ ratio of 1:2.5 is sufficient to sequester most free Fe³⁺ (Figure 5A). Consequently, IP6 effectively protects neurons from Fe³⁺-catalysed degradation of AA.
Figure 5.
Effect of Fe3+ and IP6 on the degradation of AA and the formation and scavenging of ROS. (A) UV-Vis study of the time-dependent AA (70 μM) degradation at 25 °C measured by the decrease in its absorbance at 265 nm when AA was alone (black), in presence of Fe3+ (2.5 μM) (red), in the presence of Fe3+ (2.5 μM) and IP6 (1 μM) (green), in the presence of Fe3+ (2.5 μM) and IP6 (10 μM) (yellow), in the presence of Fe3+ (2.5 μM) and IP6 (50 μM) (blue), in the presence of Fe3+ (2.5 μM) and IP6 (100 μM) (purple). (B) Time-dependent overall free radical formation monitored by the decrease in the fluorescence intensity of fluorescein (10 μM; λexc 490 nm) of a solution prepared in a 10 mM sodium phosphate buffer containing 150 mM NaCl (pH 7.4) and: (i) AA (70 μM) alone (black); (ii) AA (70 μM) and Fe3+ (2.5 μM) (green); (iii) AA (70 μM) and IP6 (50 μM) (red); and (iv) AA (70 μM), Fe3+ (2.5 μM) and IP6 (50 μM) (yellow). In both panels, the data points are the mean from all the replicas, and the error bars represent standard deviation from the different independent measurements. (C) UV–vis spectra of the neocuproine-Cu+ complex formed from the hydroxylation of salicylic acid by HO· in the absence (black), or in the presence either of 1 μM IP6 (red) or 10 μM IP6 (green). All the experiments were carried out in triplicate.
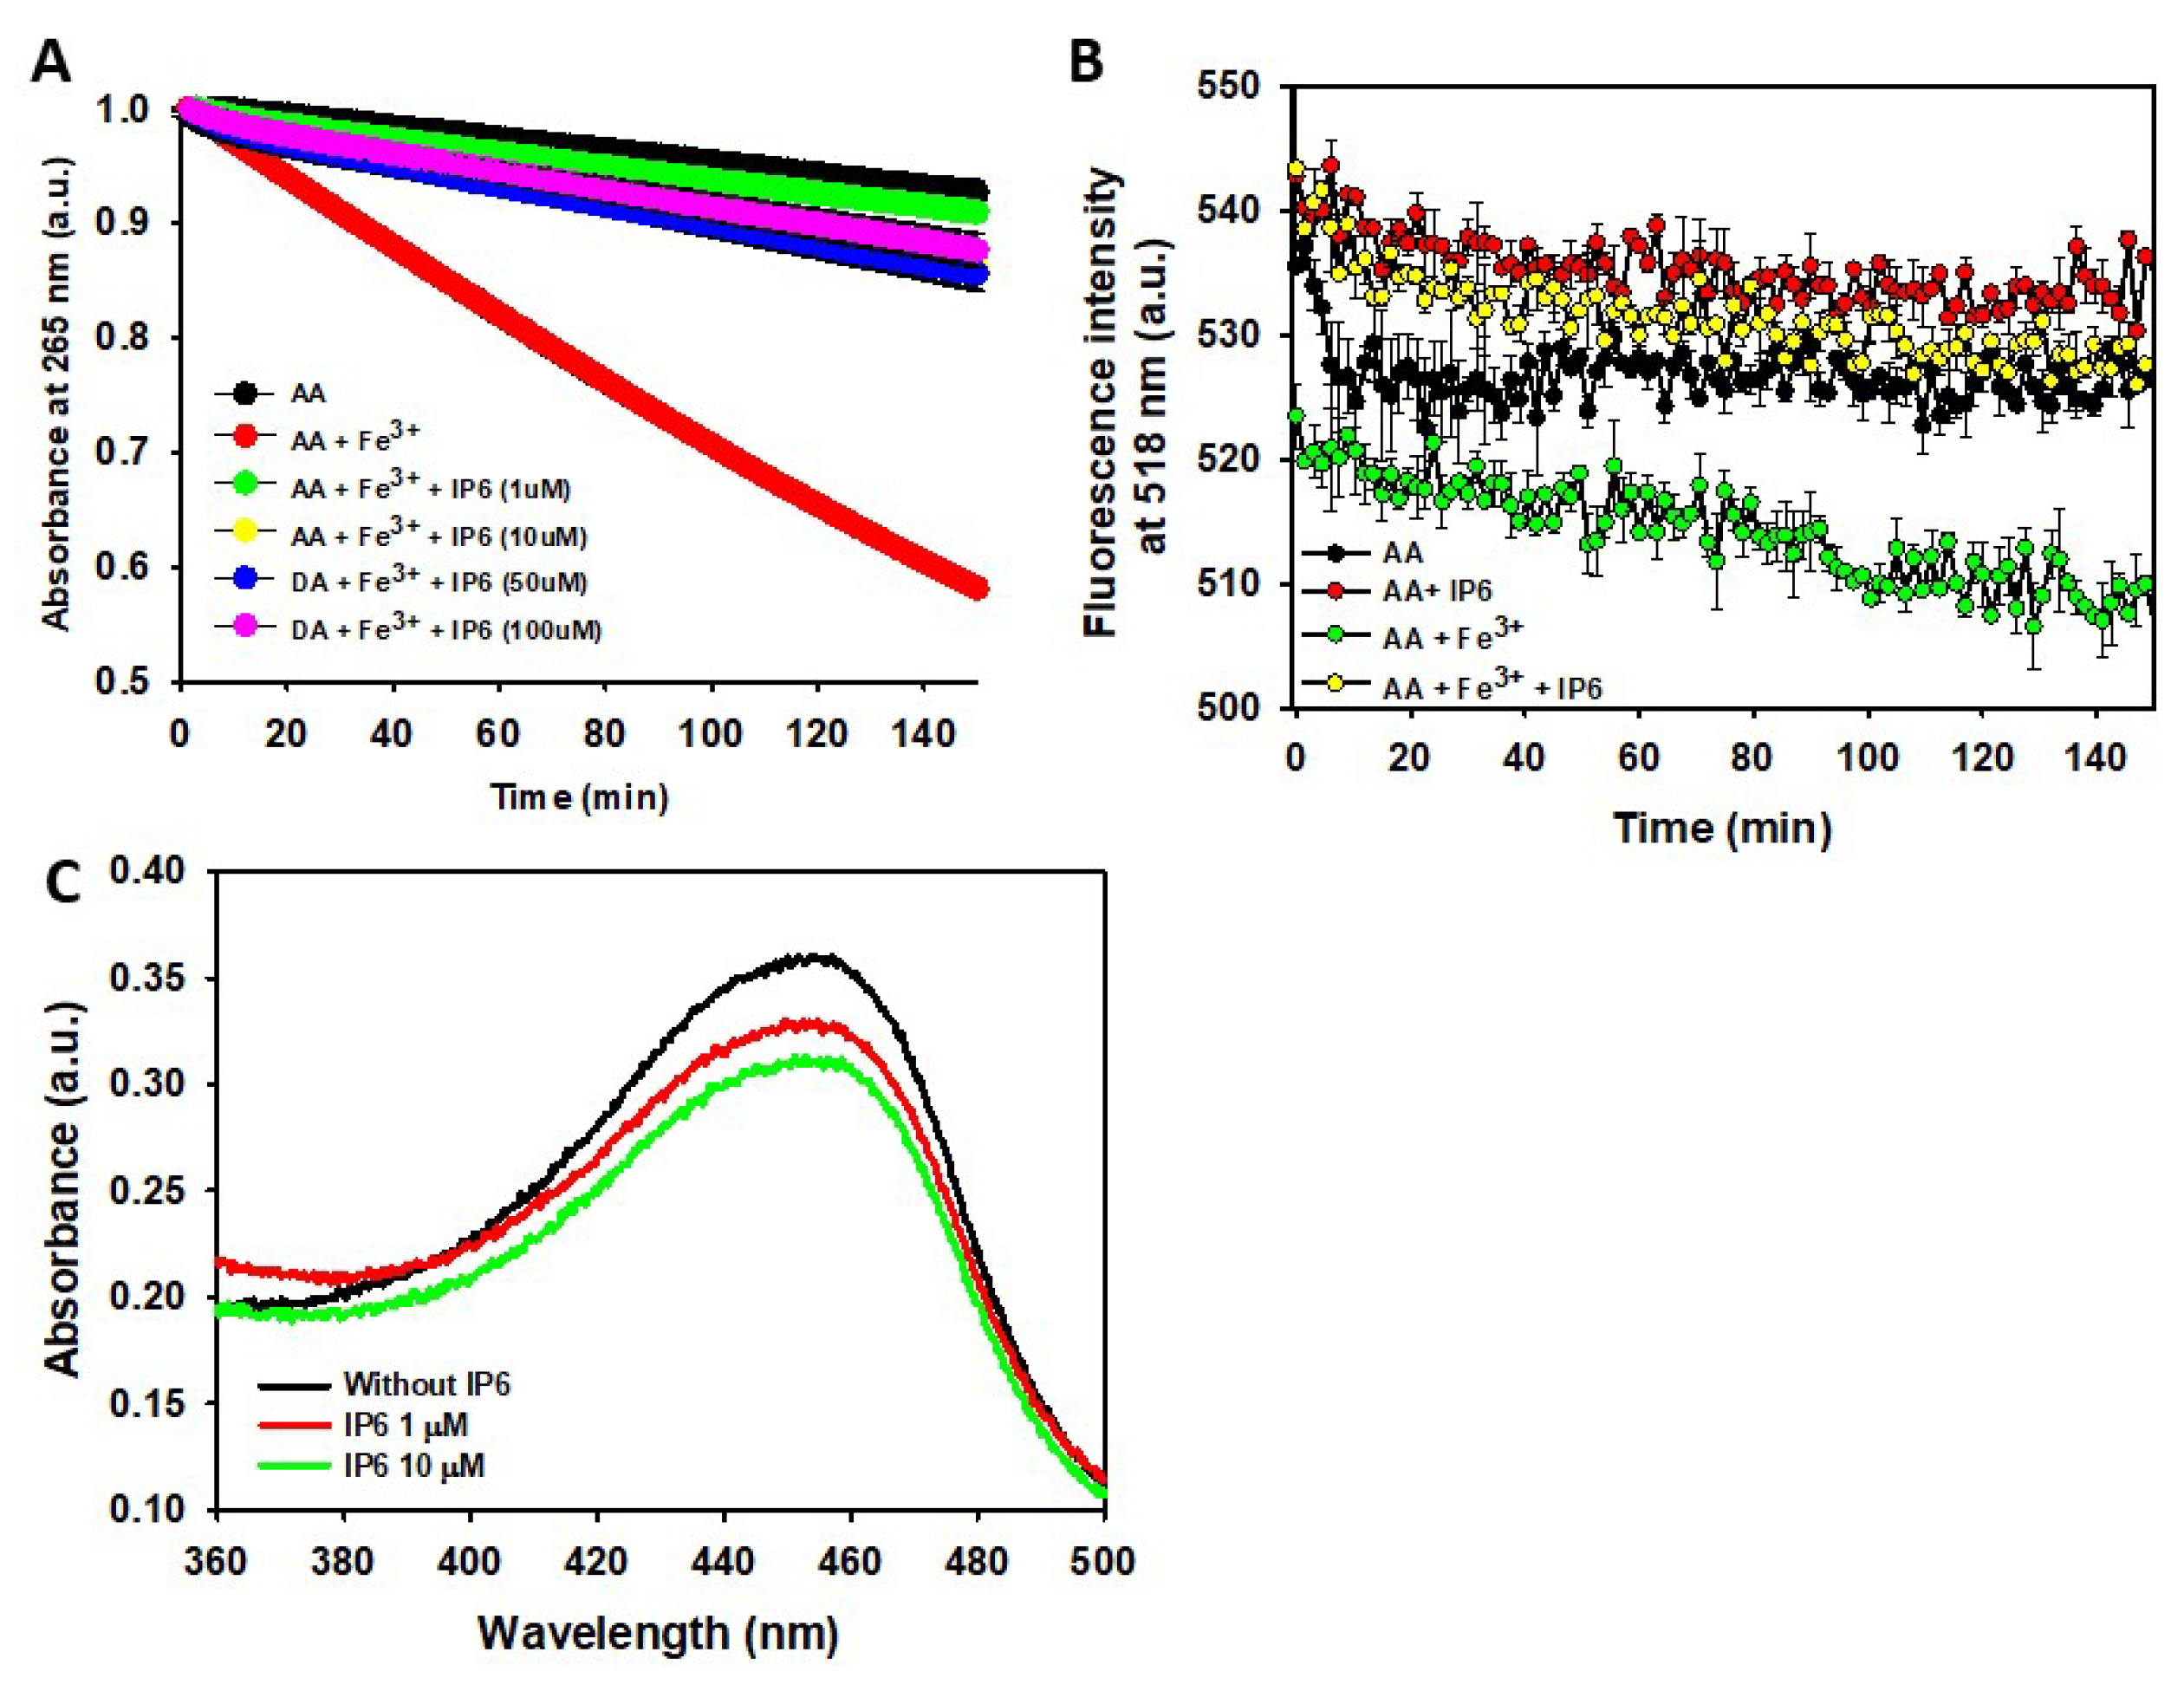
The metal-catalysed degradation of AA is not harmless to neurons, as it produces ROS [97,98]. Their formation can be monitored using fluorescein, whose fluorescence emission signal diminishes upon reaction with ROS [70,72]. Although the yield of ROS from the Fe3+-catalysed degradation of AA is lower compared to other metal cations (e.g., Cu2+)[72], Fe3+ induces a more rapid fluorescence decrease than in its absence. Hence, Fe3+ directs part of the AA autoxidation pathway toward ROS formation. As expected, the addition of IP6 to the AA-Fe³⁺ reaction mixture completely prevented this fluorescence decay, demonstrating that IP6 can also indirectly reduce neuronal ROS formation stemming from Fe³⁺-catalyzed reactions (Figure 5B).
Another intriguing question is whether IP6 can directly scavenge preformed ROS. To explore this, we assessed the ability of IP6 to sequester HO· radicals generated through the CUPRAC method. The addition of 1μM IP6 to the reaction mixture decreased the UV-Vis absorbance associated with the formation of the neocuproine-Cu+ complex, thereby scavenging HO· and preventing its reaction with the neocuproine-Cu2+ complex (Figure 5C). Using a 10-fold higher IP6 concentration (10 μM) did not really enhance the effect displayed by 1 μM IP6 on the reduction of the neocuproine-Cu+ complex. This indicate that tinny amounts of IP6 are sufficient to neutralize HO· radicals effectively.
Hence, we prove that IP6 can prevent AA from undergoing Fe3+-catalyzed degradation, thereby reducing the formation of intraneuronal ROS. Additionally, IP6 shows potential to neutralize preformed ROS, such as HO· radicals.
3.4. Effect of IP6 on the Fibrillization of α-Synuclein
In addition to its catalytic effect on the oxidation of DA and AA, Fe³⁺ can promote neurodegeneration through other molecular mechanisms. One such mechanism is its ability to stimulate the aggregation of proteins implicated in neurodegenerative disorders, such as tau [100] or Aβ1-42 peptides [101]. As a result, elevated levels of Fe³⁺ have been detected in neuronal protein aggregate deposits [102]. Among these aggregates are Lewy bodies (LBs), which are mainly formed by α-synuclein (αS), a small presynaptic and intrinsically disordered protein. LBs containing iron deposits are located in the cytosol of dopaminergic neurons in the substantia nigra [103], and their accumulation represents a key hallmark of Parkinson’s disease.
Given the ability of IP6 to chelate Fe³⁺, we hypothesized that IP6 could also inhibit Fe³⁺-induced protein aggregation, thereby providing additional protection against neurodegeneration. To test this, we incubated human αS under conditions known to promote its fibrillization (i.e., at 37°C in 20 mM phosphate buffer (pH 7.4) while shaking at 1000 rpm). Incubations were performed in the absence and presence of Fe³⁺ and/or IP6. Aliquots from each reaction mixture were collected at different incubation times, diluted, and analyzed for amyloid fibril formation by measuring the corresponding Tht fluorescence spectra.
As expected, the incubation of αS resulted in the time-dependent formation of Tht-active aggregates, following the characteristic profile of a nucleation-dependent mechanism. This process involves an initial lag-phase, during which nucleation occurs, followed by a rapid increase in fluorescence that finishes in a plateau phase (Figure 6A). The αS aggregates exhibits a linear and unbranched morphology, characteristic of amyloid fibrils [75]. The addition of Fe³⁺ shortened the lag-phase observed when αS was incubated alone, thereby accelerating the formation of amyloid fibrils. Furthermore, Fe³⁺ seems to enhance the yield of amyloid fibrils, as evidenced by a ~1.5-fold higher maximum Thy fluorescence intensity at the plateau compared to the signal observed when αS was incubated without Fe³⁺.
Figure 6.
Effect of IP6 on the kinetics of α-synuclein amyloid fibrils. (A) Time-dependent variation in the emission fluorescent signal at 481 nm (λexc 440 nm) of solutions containing 120 μM αS prepared in a 20 mM phosphate buffer (pH 7.4) containing 150 mM NaCl, without (black line) or with Fe3+ (2 μM) (red line). Solutions were incubated at 37ºC while shaking, and aliquots were taken at different incubation times and diluted up to an αS concentration of 10 μM before fluorescence measurement. (B) Time-dependent variation in the emission fluorescent signal at 481 nm (λexc 440 nm) of solutions containing 120 μM αS prepared in a 20 mM phosphate buffer (pH 7.4) containing 150 mM NaCl and IP6 (20 μM), without (black line) or with Fe3+ (2 μM) (red line). Solutions were incubated at 37ºC while shaking, and aliquots were taken at different incubation times and diluted up to an αS concentration of 10 μM before fluorescence measurement.
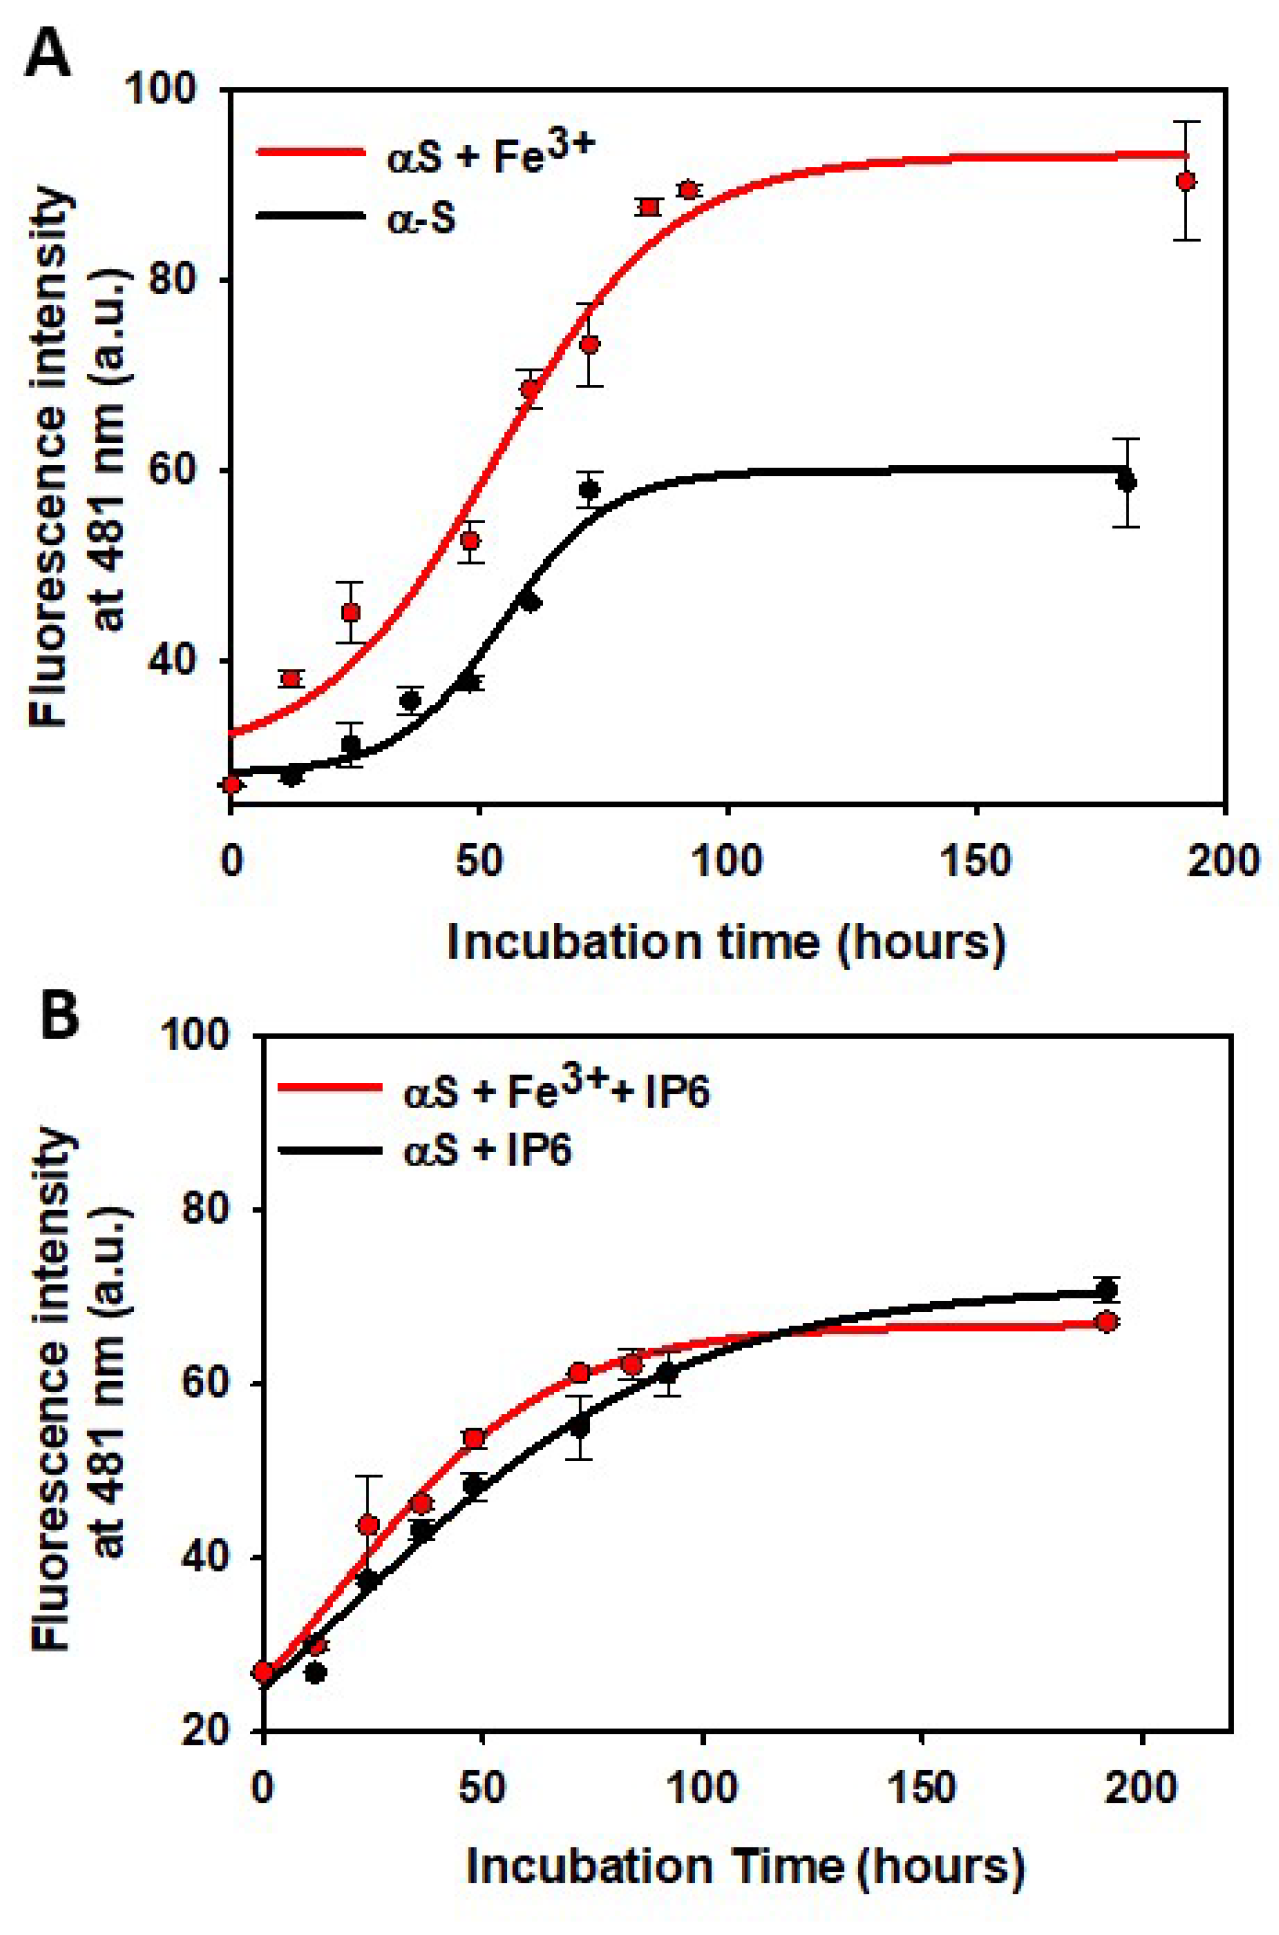
The aggregation mechanism of αS completely changed in the presence of IP6. IP6 abolished the nucleation lag-phase, and the aggregation process followed an exponential growth profile to the maximum fluorescence intensity (Figure 6B). Moreover, the maximum Tht fluorescence intensity at the plateau was significantly lower than that observed when αS was incubated without IP6. This suggests that while IP6 accelerates the aggregation of αS, it also reduces the number of amyloid fibrils formed. Interestingly, the presence of Fe³⁺ did not modify the aggregation mechanism of αS in the presence of IP6 (Figure 6). This further confirms that the chelating ability of IP6 can neutralize the stimulating effect of Fe³⁺ on the quantity of αS amyloid fibrils.
During aggregation, the lag-phase represents the time required for monomers to assemble into soluble oligomers and its further evolution into amyloid fibrils [104]. The ability of IP6 to rapidly accelerate the conversion of soluble oligomers into Tht-active amyloid fibrils could have significant neuroprotective implications. It is well-established that soluble oligomers are the most toxic species formed during the aggregation process due to their hydrophobic nature, which enables them to interact with lipid membranes, causing their disruption and cell death [105,106]. Therefore, the ability of IP6 to eliminate the lag-phase can be interpreted as a remarkable capacity to rapidly direct oligomers toward the formation of less harmful amyloid fibrils, thereby reducing the lifetime of these oligomers and their potential to induce cellular damage.
Our data do not provide insights into the mechanism by which IP6 exerts this beneficial effect, yet several hypotheses can be proposed. One possibility is that IP6 binds to αS and catalyzes its clustering and fibril formation. Alternatively, IP6 may interacts with soluble oligomers, inducing their rapid fibrillization. Further investigations will be necessary to fully elucidate the mechanism through which IP6 modifies the aggregation pathway of αS.
Our data conclusively demonstrate that IP6 modifies the aggregation mechanism of αS. Specifically, it appears to destabilize the toxic soluble oligomers by accelerating their conversion into αS amyloid fibrils. Moreover, IP6 completely neutralizes the enhancing effect of Fe³⁺ on the fibrillization yield. Taken together, these findings suggest that IP6 could play a neuroprotective role by intervening in one or more protein aggregation pathways, thus potentially preventing neurodegeneration.
4. Discussion
Our study explorers the neuroprotective role of IP6, especially its ability to mitigate the Fe3+-catalyzed oxidative processes and aggregation pathways. Our findings provide indications that IP6 not only protects DA and AA from Fe3+-induced degradation but also inhibits the Fe3+-induced aggregation of αS, a key protein associated with the pathogenesis of Parkinson’s disease. Hence, we discuss these findings in the context of the current scientific knowledge on neurodegeneration, emphasizing the dual function of IP6 as a chelator, and an inhibitor of protein aggregation.
4.1. IP6 is a Protective Agent Against Fe3+-Catalysed Degradation of DA
Free cytosolic DA plays an important role in neurotransmission, but it is also highly sensitive to oxidative degradation, especially in the presence of Fe3+. We prove that Fe3+ accelerates DA degradation by catalysing its oxidation to AC and subsequent polymerization to NM. This mechanism is consistent with previous studies showing that Fe3+ promotes DA quinone formation and increases oxidative stress in dopaminergic neurons, which is a hallmark of neurodegenerative diseases [107].
IP6 significantly reduces the catalytic effect of Fe3+ on DA degradation, even at substoichiometric concentrations. This protective effect may be due to the strong chelating ability of IP6, which sequesters Fe3+ and prevents redox cycling. Notably, the inhibition of DA degradation by IP6 occurred at an IC50 of ~1 μM, revealing its high efficiency. Our data suggest that IP6 blocks the pro-oxidant environment created by Fe3+, thereby maintaining DA integrity. This is particularly relevant given the fragility of the neurons of the substantia nigra, where DA and Fe3+ concentrations are physiologically high.
Moreover, this effect has broader implications for preventing early dopaminergic neurodegeneration. The interaction of Fe3+ with DA generate oxidation by-products, which can amplify cell damage and inflammatory responses in the surrounding neuronal tissue. The ability of IP6 to neutralize these effects through chelation and oxidative prevention strengthens its potential as a therapeutic agent.
4.2. Vesicle Encapsulation and the Role of IP6 in DA Stability
The study of encapsulated DA within SVs-mimicking SUVs, further underscores the protective potential of IP6. Although vesicle encapsulation itself limits DA autoxidation, the addition of Fe3+ increases DA degradation even within this protective microenvironment. Remarkably, IP6 was able to counteract this Fe³⁺-induced destabilization, indicating that IP6 can display its protective effect efficiently even under acidic intravesicular conditions (pH 6.0). This finding complements earlier studies indicating that IP6 interacts with Fe³⁺ at physiological and subcellular pH levels [96].
The dual role of IP6 as a vesicular DA stabilizer and as a modulator of Fe³⁺-induced oxidative pathways, further positions it as an innovative approach to safeguarding neurotransmitter systems. This function could be instrumental in addressing the progression of disorders characterized by vesicular dysfunction and oxidative stress, potentially bridging gaps in therapeutic approaches for diseases where DA imbalance plays a role.
4.3. Inhibition of Fe3+-Catalyzed AA Degradation and ROS Formation
AA is another important molecule for the normal neuronal function, since it acts as a primary antioxidant and cofactor in neurotransmitter synthesis. However, it is highly susceptible to Fe³⁺-catalyzed degradation, which leads to ROS production, thus exacerbating oxidative damage. Our data prove that IP6 not only inhibits Fe³⁺-catalyzed AA degradation but also significantly reduces the formation of ROS, as evidenced by decreased fluorescein fluorescence.
Interestingly, the protective effect of IP6 on AA degradation was almost totally achieved at low concentrations (~1 μM), consistent with its high Fe³⁺-binding affinity. These findings agree with previous data showing that IP6 prevents metal-catalyzed oxidation processes by forming stable complexes with Fe³⁺ [58]. Additionally, IP6 displayed certain ability to directly scavenge HO· through mechanisms different than its Fe³⁺-chelating ability, which suggests a broad antioxidant role.
Since the Fe³⁺-catalyzed AA degradation contributes to neuronal oxidative stress and ROS formation, the dual role of IP6 (as chelator and ROS scavenger) reinforces its potential as a neuroprotective agent. ROS not only trigger widespread cellular damage but also exacerbate neuroinflammatory cascades that further harm neuronal viability. By attenuating these processes, IP6 emerges as a promising candidate in strategies aimed at reducing oxidative and inflammatory stressors in neurodegenerative contexts.
4.4. Modulation of α-Synuclein Aggregation by IP6
The aggregation of αS has a key role in the pathology of Parkinson’s disease. Fe³⁺ not only accelerates the aggregation of αS but also increases the yield of amyloid fibrils, as we prove in this work. This agrees with previous studies showing that Fe³⁺ facilitates αS aggregation and contributes to the formation of toxic Lewy body [100,103].
In the presence of IP6, the aggregation mechanism of αS was notably altered. IP6 abolished the nucleation lag-phase and directed the aggregation process toward the rapid formation of amyloid fibrils. Notably, the maximum Tht fluorescence intensity (an indicator of fibril quantity) was significantly lower in the presence of IP6, thus suggesting that it reduces the overall yield of fibrils.
This shift in aggregation dynamics has critical implications for neuroprotection. Soluble oligomers, rather than mature fibrils, are considered the most neurotoxic intermediates during αS aggregation. These oligomers interact with cellular membranes, causing lipid disruption and subsequent cell death [105,106]. By accelerating the conversion of toxic oligomers into less harmful fibrils, IP6 effectively reduces the lifetime and toxicity of these intermediates. This mechanism aligns with the emerging therapeutic paradigm of modulating aggregation pathways to minimize oligomer toxicity in neurodegenerative diseases.
4.5. Implications for Neurodegeneration Prevention
Our findings suggest that IP6 offers protection against some of the molecular mechanisms associated with neurodegeneration. By chelating Fe³⁺, IP6 prevents oxidative degradation of DA and AA, both critical for neuronal function. Furthermore, IP6 can modulate αS aggregation pathways, which underscores its potential to mitigate protein aggregation-driven toxicity.
The relevance of these findings is amplified in the context of neurodegenerative diseases such as Parkinson’s and Alzheimer’s, where dysregulated iron metabolism, oxidative stress, and toxic protein aggregates converge. Elevated Fe³⁺ levels in the substantia nigra and hippocampus are strongly associated with neuronal death and the progression of these diseases [60,92]. Therapeutic strategies targeting iron dysregulation are promising, but the high specificity and low toxicity of IP6 towards Fe3+ offers a distinct advantage over traditional and synthetic iron chelators.
In addition, the interplay between oxidative stress and protein aggregation constitutes a vicious cycle in neurodegeneration. The ability of IP6 to intervene in both pathways highlights its utility as a multi-targeted therapeutic approach. These dual functions could serve as a foundation for novel drug development strategies aimed at mitigating multiple hallmarks of neurodegeneration.
4.6. Future Directions
Our study clearly evidences that IP6 holds neuroprotective properties. However, our findings might not be fully replicable the complex biochemical environment of the human brain. Future studies should be addressed on validating these findings in vivo, using animal models of neurodegeneration. In addition, the precise molecular mechanisms underlying the effect of IP6 on αS aggregation remains unclear. Further studied are required to elucidate whether IP6 directly interacts with αS monomers, oligomers, or fibrils. Additional computational modeling approaches could provide valuable insights into these interactions, identifying key binding motifs and energy landscapes involved in aggregation modulation. Finally, we are also aware that the therapeutic potential of IP6 in clinical settings depends on its bioavailability and ability to cross the blood-brain barrier. Strategies to enhance IP6 delivery to the central nervous system, such as nanoparticle encapsulation or chemical modification, could be explored in the future.
Author Contributions
Conceptualization: M.A.; data curation: S.-R.G. and B.V.; formal analysis: B.V., J.F. and M.A.; investigation: S.-R.G. and M.A.; methodology: S.-R.G., B.V. and J.F.; software: J.F.; supervision: M.A.; visualization: S.-R.G., J.F.; writing—original draft: M.A.; writing—review and editing: M.A., P.S. and B.V.; funding acquisition: P.S. All authors have read and agreed to the published version of the manuscript.
Funding
The authors gratefully acknowledge the funding of this research by the Instituto de Salud Carlos III through the project “PI20/0471“ (co-funded by European Regional Development Fund/European Social Fund “A way to make Europe”/”Investing in your future”).
Institutional Review Board Statement
Not applicable.
Informed Consent Statement
Not applicable.
Data Availability Statement
The data presented in this study are available on reasonable request from the corresponding author.
Conflicts of Interest
The authors declare no conflicts of interest.
References
- Feizollahi, E.; Mirmahdi, R.S.; Zoghi, A.; Zijlstra, R.T.; Roopesh, M.S.; Vasanthan, T. Review of the beneficial and anti-nutritional qualities of phytic acid, and procedures for removing it from food products. Food Res. Int. 2021, 143, 110284. [Google Scholar] [CrossRef]
- Chen, Y.; Yuan, W.; Xu, Q.; Reddy, M.B. Neuroprotection of phytic acid in Parkinson’s and Alzheimer’s disease. J. Functional Foods 2023, 110, 105856. [Google Scholar] [CrossRef]
- Silva, V.M.; Putti, F.F.; White, P.J.; Reis, A.R.D. Phytic acid accumulation in plants: Biosynthesis pathway regulation and role in human diet. Plant Physiol. Biochem. 2021, 164, 132–146. [Google Scholar] [CrossRef]
- Schlemmer, U.; Frølich, W.; Prieto, R.M.; Grases, F. Phytate in foods and significance for humans: food sources, intake, processing, bioavailability, protective role and analysis. Mol. Nutr. Food Res. 2009, 53, S330–S375. [Google Scholar] [CrossRef]
- Kumar, A.; Singh, B.; Raigond, P.; Sahu, C.; Mishra, U.N.; Sharma, S.; Lal, M.K. Phytic acid: Blessing in disguise, a prime compound required for both plant and human nutrition. Food Res. Int. 2021, 142, 110193. [Google Scholar] [CrossRef] [PubMed]
- Ferry, S.; Matsuda, M.; Yoshida, H.; Hirata, M. Inositol hexakisphosphate blocks tumor cell growth by activating apoptotic machinery as well as by inhibiting the Akt/NFκB-mediated cell survival pathway. Carcinogenesis 2002, 23, 2031–2041. [Google Scholar] [CrossRef] [PubMed]
- Maffucci, T.; Falasca, M. Signalling properties of inositol polyphosphates. Molecules 2020, 25, 5281. [Google Scholar] [CrossRef]
- Fukuda, M.; Aruga, J.; Niinobe, M.; Aimoto, S.; Mikoshiba, K. Inositol-1,3,4,5-tetrakisphosphate binding to C2B domain of IP4BP/synaptotagmin II. J. Biol. Chem. 1994, 269, 29206–29211. [Google Scholar] [CrossRef]
- Gaidarov, I.; Krupnick, J.G.; Falck, J.R.; Benovic, J.L.; Keen, J.H. Arrestin function in G protein-coupled receptor endocytosis requires phosphoinositide binding. EMBO J. 1999, 18, 871–881. [Google Scholar] [CrossRef]
- Hanakahi, L.A.; Bartlet-Jones, M.; Chappell, C.; Pappin, D.; West, S.C. Binding of inositol phosphate to DNA-PK and stimulation of double-strand break repair. Cell 2000, 102, 721–729. [Google Scholar] [CrossRef]
- York, J.D.; Odom, A.R.; Murphy, R.; Ives, E.B.; Wente, S.R. A phospholipase C-dependent inositol polyphosphate kinase pathway required for efficient messenger RNA export. Science 1999, 285, 96–100. [Google Scholar] [CrossRef] [PubMed]
- Deshpande, S.S.; Cheryan, M. Effects of phytic acid, divalent cations, and their interactions on α-amylase activity. J. Food Sci. 1984, 49, 516–519. [Google Scholar] [CrossRef]
- Deshpande, S.S.; Damodaran, S. Effect of phytate on solubility, activity and conformation of trypsin and shymotrypsin. J. Food Sci. 1989, 54, 695–699. [Google Scholar] [CrossRef]
- Brouns, F. Phytic acid and whole grains for health controversy. Nutrients 2021, 14, 25. [Google Scholar] [CrossRef] [PubMed]
- Grases, F.; Simonet, B.M.; Prieto, R.M.; March, J.G. Dietary phytate and mineral bioavailability. J. Trace Elem. Med. Biol. 2001, 15, 221–228. [Google Scholar] [CrossRef]
- Grases, F.; Simonet, B.M.; Perelló, J.; Costa-Bauzá, A.; Prieto, R.M. Effect of phytate on element bioavailability in the second generation of rats. J. Trace Elem. Med. Biol. 2004, 17, 229–234. [Google Scholar] [CrossRef] [PubMed]
- Grases, F.; Söhnel, O.; Zelenková, M.; Rodriguez, A. Phytate effects on biological hydroxyapatite development. Urolithiasis 2015, 43, 571–572. [Google Scholar] [CrossRef]
- Raggi, P.; Bellasi, A.; Bushinsky, D.; Bover, J.; Rodriguez, M.; Ketteler, M.; Sinha, S.; Salcedo, C.; Gillotti, K.; Padgett, C.; Garg, R.; Gold, A.; Perelló, J.; Chertow, G.M. Slowing progression of cardiovascular calcification with SNF472 in patients on hemodialysis: results of a randomized phase 2b study. Circulation 2020, 141, 728–739. [Google Scholar] [CrossRef]
- Sanchis, P.; Buades, J.M.; Berga, F.; Gelabert, M.M.; Molina, M.; Íñigo, M.V.; García, S.; Gonzalez, J.; Bernabeu, M.R.; Costa-Bauzá, A.; Grases, F. Protective effect of myo-inositol hexaphosphate (phytate) on abdominal aortic calcification in patients with chronic kidney disease. J. Ren. Nutr. 2016, 26, 226–236. [Google Scholar] [CrossRef]
- Grases, F.; Sanchis, P.; Perelló, J.; Isern, B.; Prieto, R.M.; Fernández-Palomeque, C.; Torres, J.J. Effect of crystallization inhibitors on vascular calcifications induced by vitamin D: a pilot study in Sprague-Dawley rats. Circ. J. 2007, 71, 1152–1156. [Google Scholar] [CrossRef]
- Lin, B.-B.; Lin, M.-E.; Huang, R.-H.; Hong, Y.-K.; Lin, B.-L.; He, X.-J. Dietary and lifestyle factors for primary prevention of nephrolithiasis: a systematic review and meta-analysis. BMC Nephrol. 2020, 21, 267. [Google Scholar] [CrossRef] [PubMed]
- Kim, O.H.; Booth, C.J.; Choi, H.S.; Lee, J.; Kang, J.; Hur, J.; Jung, W.J.; Jung, Y.S.; Choi, H.J.; Kim, H.; Auh, J.H.; Kim, J.W.; Cha, J.Y.; Lee, Y.J.; Lee, C.S.; Choi, C.; Jung, Y.J.; Yang, J.Y.; Im, S.S.; Lee, D.H.; Cho, S.W.; Kim, Y.B.; Park, K.S.; Park, Y.J.; Oh, B.C. High-phytate/low-calcium diet is a risk factor for crystal nephropathies, renal phosphate wasting, and bone loss. Elife 2020, 9, e52709. [Google Scholar] [CrossRef]
- Grases, F.; Perelló, J.; Sanchis, P.; Isern, B.; Prieto, R.M.; Costa-Bauzá, A.; Santiago, C.; Ferragut, M.L.; Frontera, G. Anticalculus effect of a triclosan mouthwash containing phytate: a double-blind, randomized, three-period crossover trial. J. Periodontal Res. 2009, 44, 616–621. [Google Scholar] [CrossRef] [PubMed]
- Sanchis, P.; López-González, Á.A.; Costa-Bauzá, A.; Busquets-Cortés, C.; Riutord, P.; Calvo, P.; Grases, F. Understanding the protective effect of phytate in bone decalcification related-diseases. Nutrients 2021, 13, 2859. [Google Scholar] [CrossRef] [PubMed]
- Grases, F.; Sanchis, P.; Prieto, R.M.; Perelló, J.; López-González, Á.A. Effect of tetracalcium dimagnesium phytate on bone characteristics in ovariectomized rats. J. Med. Food 2010, 13, 1301–1306. [Google Scholar] [CrossRef]
- Guimerà, J.; Martínez, A.; Bauza, J.L.; Sanchís, P.; Pieras, E.; Grases, F. Effect of phytate on hypercalciuria secondary to bone resorption in patients with urinary stones: pilot study. Urolithiasis 2022, 50, 685–690. [Google Scholar] [CrossRef]
- Dilworth, L.L.; Omoruyi, F.O.; Simon, O.R.; Morrison, E.Y.; Asemota, H.N. The effect of phytic acid on the levels of blood glucose and some enzymes of carbohydrate and lipid metabolism. West Indian Med. J. 2005, 54, 102–106. [Google Scholar] [CrossRef]
- Omoruyi, F.O.; Budiaman, A.; Eng, Y.; Olumese, F.E.; Hoesel, J.L.; Ejilemele, A.; Okorodudu, A.O. The potential benefits and adverse effects of phytic acid supplement in streptozotocin-induced diabetic rats. Adv. Pharmacol. Sci. 2013, 2013, 172494. [Google Scholar] [CrossRef]
- Omoruyi, F.O.; Stennett, D.; Foster, S.; Dilworth, L. New frontiers for the use of IP6 and inositol combination in treating diabetes mellitus: a review. Molecules 2020, 25, 1720. [Google Scholar] [CrossRef]
- Mirmiran, P.; Hosseini, S.; Hosseinpour-Niazi, S.; Azizi, F. Legume consumption increases adiponectin concentrations among type 2 diabetic patients: a randomized crossover clinical trial. Endocrinol. Diabetes Nutr. (Engl. Ed.) 2019, 66, 49–55. [Google Scholar]
- Berridge, M.J.; Irvine, R.F. Inositol trisphosphate, a novel second messenger in cellular signal transduction. Nature 1984, 312, 315–321. [Google Scholar] [CrossRef]
- Onomi, S.; Okazaki, Y.; Katayama, T. Effect of dietary level of phytic acid on hepatic and serum lipid status in rats fed a high-sucrose diet. Biosci. Biotechnol. Biochem. 2004, 68, 1379–1381. [Google Scholar] [CrossRef]
- Sanchis, P.; Rivera, R.; Berga, F.; Fortuny, R.; Adrover, M.; Costa-Bauzá, A.; Grases, F.; Masmiquel, L. Phytate decreases formation of advanced glycation end-products in patients with type II diabetes: randomized crossover trial. Sci. Rep. 2018, 8, 9619. [Google Scholar] [CrossRef]
- Venn, B.J.; Mann, J.I. Cereal grains, legumes and diabetes. Eur. J. Clin. Nutr. 2004, 58, 1443–1461. [Google Scholar] [CrossRef] [PubMed]
- Martín-Peláez, S.; Fito, M.; Castaner, O. Mediterranean diet effects on type 2 diabetes prevention, disease progression, and related mechanisms: a review. Nutrients 2020, 12, 2236. [Google Scholar] [CrossRef]
- Vucenik, I.; Shamsuddin, A.M. Protection against cancer by dietary IP6 and inositol. Nutr. Cancer 2006, 55, 109–125. [Google Scholar] [CrossRef] [PubMed]
- Wiśniewski, K.; Jozwik, M.; Wojtkiewicz, J. Cancer prevention by natural products introduced into the diet—selected cyclitols. Int. J. Mol. Sci. 2020, 21, 8988. [Google Scholar] [CrossRef] [PubMed]
- Wattenberg, L. Chalcones, myo-inositol and other novel inhibitors of pulmonary carcinogenesis. J. Cell. Biochem. Suppl. 1995, 22, 162–168. [Google Scholar] [CrossRef]
- Bacić, I.; Druzijanić, N.; Karlo, R.; Skifić, I.; Jagić, S. Efficacy of IP6 + inositol in the treatment of breast cancer patients receiving chemotherapy: prospective, randomized, pilot clinical study. J. Exp. Clin. Cancer Res. 2010, 29, 12. [Google Scholar] [CrossRef]
- Nassar, R.; Nassar, M.; Vianna, M.E.; Naidoo, N.; Alqutami, F.; Kaklamanos, E.G.; Senok, A.; Williams, D. Antimicrobial activity of phytic acid: an emerging agent in endodontics. Front. Cell. Infect. Microbiol. 2021, 11, 753649. [Google Scholar] [CrossRef]
- Otake, T.; Shimonaka, H.; Kanai, M.; Miyano, K.; Ueba, N.; Kunita, N.; Kurimura, T. Inhibitory effect of inositol hexasulfate and inositol hexaphosphoric acid (phytic acid) on the proliferation of the human immunodeficiency virus (HIV) in vitro. Kansenshogaku Zasshi 1989, 63, 676–683. [Google Scholar] [CrossRef] [PubMed]
- Grases, F.; Simonet, B.M.; Prieto, R.M.; March, J.G. Variation of InsP4, InsP5 and InsP6 levels in tissues and biological fluids depending on dietary phytate. J. Nutr. Biochem. 2001, 12, 595–601. [Google Scholar] [CrossRef] [PubMed]
- Grases, F.; Simonet, B.M.; Prieto, R.M.; March, J.G. Phytate levels in diverse rat tissues: influence of dietary phytate. Br. J. Nutr. 2001, 86, 225–231. [Google Scholar] [CrossRef] [PubMed]
- Yang, S.N.; Yu, J.; Mayr, G.W.; Hofmann, F.; Larsson, O.; Berggren, P.O. Inositol hexakisphosphate increases L-type Ca2+ channel activity by stimulation of adenylyl cyclase. FASEB J. 2001, 15, 1753–1763. [Google Scholar] [CrossRef]
- Gaidarov, I.; Chen, Q.; Falck, J.R.; Reddy, K.K.; Keen, J.H. A functional phosphatidylinositol 3,4,5-trisphosphate/phosphoinositide binding domain in the clathrin adaptor AP-2 alpha subunit. Implications for the endocytic pathway. J. Biol. Chem. 1996, 271, 20922–20929. [Google Scholar] [CrossRef]
- Llinàs, R.; Sugimori, M.; Lang, E.J.; Morita, M.; Fukuda, M.; Niinobe, M.; Mikoshiba, K. The inositol high-polyphosphate series blocks synaptic transmission by preventing vesicular fusion: a squid giant synapse study. Proc. Natl. Acad. Sci. U.S.A. 1994, 91, 12990–12993. [Google Scholar] [CrossRef]
- Yamaguchi, Y.; Ikenaka, K.; Niinobe, M.; Yamada, H.; Mikoshiba, K. Myelin proteolipid protein (PLP), but not DM-20, is an inositol hexakisphosphate-binding protein. J. Biol. Chem. 1996, 271, 27838–27846. [Google Scholar] [CrossRef]
- Hilton, J.M.; Plomann, M.; Ritter, B.; Modregger, J.; Freeman, H.N.; Falck, J.R.; Krishna, U.M.; Tobin, A.B. Phosphorylation of a synaptic vesicle-associated protein by an inositol hexakisphosphate-regulated protein kinase. J. Biol. Chem. 2001, 276, 16341–16347. [Google Scholar] [CrossRef]
- Larvie, D.Y.; Armah, S.M. Estimated phytate intake is associated with improved cognitive function in the elderly, NHANES 2013–2014. Antioxidants (Basel) 2021, 10, 1104. [Google Scholar] [CrossRef]
- Cherian, L.; Wang, Y.; Fakuda, K.; Leurgans, S.; Aggarwal, N.; Morris, M. Mediterranean-Dash intervention for neurodegenerative delay (MIND) diet slows cognitive decline after stroke. J. Prev. Alzheimers Dis. 2019, 6, 267–273. [Google Scholar] [CrossRef]
- McCormick, B.; Caulfield, L.; Richard, S.; Pendergast, L.; Murray-Kolb, L.; Mald-Ed Network investigators. Nurturing environments and nutrient-rich diets may improve cognitive development: analysis of cognitive trajectories from six to sixty months from the MAL-ED study. Curr. Dev. Nutr. 2019, 3, nzz034.OR10-01-19. [Google Scholar] [CrossRef]
- Xu, Q.; Kanthasamy, A.G.; Reddy, M.B. Neuroprotective effect of the natural iron chelator, phytic acid in a cell culture model of Parkinson’s disease. Toxicology 2008, 245, 101–108. [Google Scholar] [CrossRef] [PubMed]
- Xu, Q.; Kanthasamy, A.G.; Reddy, M.B. Phytic acid protects against 6-hydroxydopamine-induced dopaminergic neuron apoptosis in normal and iron excess conditions in a cell culture model. Parkinsons Dis. 2011, 2011, 431068. [Google Scholar] [CrossRef] [PubMed]
- Zhang, Z.; Hou, L.; Li, X.; Ju, C.; Zhang, J.; Li, X.; Wang, X.; Liu, C.; Lv, Y.; Wang, Y. Neuroprotection of inositol hexaphosphate and changes of mitochondrion mediated apoptotic pathway and α-synuclein aggregation in 6-OHDA induced Parkinson’s disease cell model. Brain Res. 2016, 1633, 87–95. [Google Scholar] [CrossRef]
- Abe, T.K.; Taniguchi, M. Identification of myo-inositol hexakisphosphate (IP6) as a β-secretase 1 (BACE1) inhibitory molecule in rice grain extract and digest. FEBS Open Bio. 2014, 4, 162–167. [Google Scholar] [CrossRef]
- Kim, H.J.; Jung, Y.S.; Jung, Y.J.; Kim, O.H.; Oh, B.C. High-phytate diets increase amyloid β deposition and apoptotic neuronal cell death in a rat model. Nutrients 2021, 13, 4370. [Google Scholar] [CrossRef] [PubMed]
- Marolt, G.; Sala, M.; Pihlar, B. Voltammetric investigation of iron (III) interactions with phytate. Electrochim. Acta 2015, 176, 1116–1125. [Google Scholar] [CrossRef]
- Crea, F.; De Stefano, C.; Milea, D.; Sammartano, S. Formation and stability of phytate complexes in solution. Coord. Chem. Rev. 2008, 252, 1108–1120. [Google Scholar] [CrossRef]
- Dusek, P.; Hofer, T.; Alexander, J.; Roos, P.M.; Aaseth, J.O. Cerebral iron deposition in neurodegeneration. Biomolecules 2022, 12, 714. [Google Scholar] [CrossRef]
- Jakaria, M.; Belaidi, A.A.; Bush, A.I.; Ayton, S. Ferroptosis as a mechanism of neurodegeneration in Alzheimer’s disease. J. Neurochem. 2021, 159, 804–825. [Google Scholar] [CrossRef]
- Mahoney-Sánchez, L.; Bouchaoui, H.; Ayton, S.; Devos, D.; Duce, J.A.; Devedjian, J.C. Ferroptosis and its potential role in the physiopathology of Parkinson’s disease. Prog. Neurobiol. 2021, 196, 101890. [Google Scholar] [CrossRef] [PubMed]
- Hedges, D.M.; Yorgason, J.T.; Perez, A.W.; Schilaty, N.D.; Williams, B.M.; Watt, R.K.; Steffensen, S.C. Spontaneous formation of melanin from dopamine in the presence of iron. Antioxidants (Basel) 2020, 9, 1285. [Google Scholar] [CrossRef] [PubMed]
- Khan, M.M.; Martell, A.E. Metal ion and metal chelate catalyzed oxidation of ascorbic acid by molecular oxygen. II. Cupric and ferric chelate catalyzed oxidation. J. Am. Chem. Soc. 1967, 89, 7104–7111. [Google Scholar] [CrossRef]
- Juárez-Olguín, H.; Calderón-Guzmán, D.; Hernández-García, E.; Barragán-Mejía, G. The role of dopamine and its dysfunction as a consequence of oxidative stress. Oxid. Med. Cell. Longev. 2016, 2016, 9730467. [Google Scholar] [CrossRef] [PubMed]
- Covarrubias-Pinto, A.; Acuña, A.I.; Beltrán, F.A.; Torres-Díaz, L.; Castro, M.A. Old things new view: ascorbic acid protects the brain in neurodegenerative disorders. Int. J. Mol. Sci. 2015, 16, 28194–28217. [Google Scholar] [CrossRef]
- Moretti, M.; Fraga, D.B.; Rodrigues, A.L.S. Preventive and therapeutic potential of ascorbic acid in neurodegenerative diseases. CNS Neurosci. Ther. 2017, 23, 921–929. [Google Scholar] [CrossRef]
- Sun, Y.; Pham, A.N.; Hare, D.J.; Waite, T.D. Kinetic modeling of pH-dependent oxidation of dopamine by iron and its relevance to Parkinson’s disease. Front. Neurosci. 2018, 12, 859. [Google Scholar] [CrossRef]
- Il’ichev, Y.V.; Simon, J.D. Building blocks of eumelanin: relative stability and excitation energies of tautomers of 5, 6-dihydroxyindole and 5, 6-indolequinone. J. Phys. Chem. B 2003, 107, 7162–7171. [Google Scholar] [CrossRef]
- Ranganathan, S.; Lakshmi, K.V.; Reddy, V. Trial of ferrous glycine sulphate in the fortification of common salt with iron. Food Chem. 1996, 57, 311–315. [Google Scholar] [CrossRef]
- Ou, B.; Hampsch-Woodill, M.; Flanagan, J.; Deemer, E.K.; Prior, R.L.; Huang, D. Novel fluorometric assay for hydroxyl radical prevention capacity using fluorescein as the probe. J. Agric. Food Chem. 2002, 50, 2772–2777. [Google Scholar] [CrossRef]
- Özyürek, M.; Bektaşoğlu, B.; Güçlü, K.; Apak, R. Hydroxyl radical scavenging assay of phenolics and flavonoids with a modified cupric reducing antioxidant capacity (CUPRAC) method using catalase for hydrogen peroxide degradation. Anal. Chim. Acta 2008, 616, 196–206. [Google Scholar] [CrossRef]
- Uceda, A.B.; Donoso, J.; Frau, J.; Vilanova, B.; Adrover, M. Frataxins emerge as new players of the intracellular antioxidant machinery. Antioxidants (Basel) 2021, 10, 315. [Google Scholar] [CrossRef]
- Uceda, A.B.; Frau, J.; Vilanova, B.; Adrover, M. Glycation of α-synuclein hampers its binding to synaptic-like vesicles and its driving effect on their fusion. Cell. Mol. Life Sci. 2022, 79, 342. [Google Scholar] [CrossRef]
- Uceda, A.B.; Frau, J.; Vilanova, B.; Adrover, M. Tyrosine nitroxidation does not affect the ability of α-synuclein to bind anionic micelles, but it diminishes its ability to bind and assemble synaptic-like vesicles. Antioxidants (Basel) 2023, 12, 1310. [Google Scholar] [CrossRef] [PubMed]
- Mariño, L.; Ramis, R.; Casasnovas, R.; Ortega-Castro, J.; Vilanova, B.; Frau, J.; Adrover, M. Unravelling the effect of N(ε)-(carboxyethyl)lysine on the conformation, dynamics and aggregation propensity of α-synuclein. Chem. Sci. 2020, 11, 3332–3344. [Google Scholar] [CrossRef] [PubMed]
- Mariño, L.; Uceda, A.B.; Leal, F.; Adrover, M. Insight into the effect of methylglyoxal on the conformation, function, and aggregation propensity of α-synuclein. Chem. Eur. J. 2024, 30, e202400890. [Google Scholar] [CrossRef] [PubMed]
- Biancalana, M.; Koide, S. Molecular mechanism of Thioflavin-T binding to amyloid fibrils. Biochim. Biophys. Acta 2010, 1804, 1405–1412. [Google Scholar] [CrossRef]
- Di, J.; Bi, S. Aluminum facilitation of the iron-mediated oxidation of DOPA to melanin. Anal. Sci. 2004, 20, 629–634. [Google Scholar] [CrossRef]
- Weiss, R.F. The solubility of nitrogen, oxygen and argon in water and seawater. Deep-Sea Res. Oceanogr. Abstr. 1970, 17, 721–735. [Google Scholar] [CrossRef]
- Hider, R.C.; Howlin, B.J.; Miller, J.R.; Mohd-Nor, A.; Silver, J. Model compounds for microbial iron-transport compounds. Part IV. Further solution chemistry and Mössbauer studies on iron(II) and iron(III) catechol complexes. Inorg. Chim. Acta 1983, 80, 51–56. [Google Scholar] [CrossRef]
- Butler, M.; Mañez, P.A.; Cabrera, G.M.; Maître, P. Gas phase structure and reactivity of doubly charged microhydrated calcium(II)–catechol complexes probed by infrared spectroscopy. J. Phys. Chem. A 2014, 118, 4942–4954. [Google Scholar] [CrossRef]
- Di, J.; Bi, S. Aluminum facilitation of the iron-mediated oxidation of DOPA to melanin. Anal. Sci. 2004, 20, 629–634. [Google Scholar] [CrossRef] [PubMed]
- Lo, H.S.; Chiang, H.C.; Lin, A.M.; Chiang, H.Y.; Chu, Y.C.; Kao, L.S. Synergistic effects of dopamine and Zn2+ on the induction of PC12 cell death and dopamine depletion in the striatum: possible implication in the pathogenesis of Parkinson’s disease. Neurobiol. Dis. 2004, 17, 54–61. [Google Scholar] [CrossRef] [PubMed]
- Yoshimura, Y.; Matsuzaki, Y.; Watanabe, T.; Uchiyama, K.; Ohsawa, K.; Imaeda, K. Effects of buffer solutions and chelators on the generation of hydroxyl radical and the lipid peroxidation in the Fenton reaction system. J. Clin. Biochem. Nutr. 1992, 13, 147–154. [Google Scholar] [CrossRef]
- Minotti, G.; Aust, S.D. The role of iron in the initiation of lipid peroxidation. Chem. Phys. Lipids 1987, 44, 191–208. [Google Scholar] [CrossRef] [PubMed]
- Tadolini, B. Iron autoxidation in Mops and Hepes buffers. Free Radic. Res. Commun. 1987, 4, 149–160. [Google Scholar] [CrossRef]
- Tai, M.D.S.; Gamiz-Arco, G.; Martinez, A. Dopamine synthesis and transport: current and novel therapeutics for parkinsonisms. Biochem. Soc. Trans. 2024, 52, 1275–1291. [Google Scholar] [CrossRef]
- Matt, S.M.; Gaskill, P.J. Where is dopamine and how do immune cells see it?: dopamine-mediated immune cell function in health and disease. J. Neuroimmune Pharmacol. 2020, 15, 114–164. [Google Scholar]
- Napolitano, A.; Pezzella, A.; Prota, G. New reaction pathways of dopamine under oxidative stress conditions: nonenzymatic iron-assisted conversion to norepinephrine and the neurotoxins 6-hydroxydopamine and 6,7-dihydroxytetrahydroisoquinoline. Chem. Res. Toxicol. 1999, 12, 1090–1097. [Google Scholar] [CrossRef]
- Paris, I.; Martinez-Alvarado, P.; Perez-Pastene, C.; Vieira, M.N.; Olea-Azar, C.; Raisman-Vozari, R.; Cardenas, S.; Graumann, R.; Caviedes, P.; Segura-Aguilar, J. Monoamine transporter inhibitors and norepinephrine reduce dopamine-dependent iron toxicity in cells derived from the substantia nigra. J. Neurochem. 2005, 92, 1021–1032. [Google Scholar] [CrossRef]
- Sofic, E.; Riederer, P.; Heinsen, H.; Beckmann, H.; Reynolds, G.P.; Hebenstreit, G.; Youdim, M.B. Increased iron (III) and total iron content in post mortem substantia nigra of parkinsonian brain. J. Neural Transm. 1988, 74, 199–205. [Google Scholar] [CrossRef] [PubMed]
- Batista-Nascimento, L.; Pimentel, C.; Menezes, R.A.; Rodrigues-Pousada, C. Iron and neurodegeneration: from cellular homeostasis to disease. Oxid. Med. Cell. Longev. 2012, 2012, 128647. [Google Scholar] [CrossRef] [PubMed]
- Mohorovic, L.; Lavezzi, A.; Stifter, S.; Perry, G.; Malatestinic, D.; Micovic, V.; Materljan, E. Ferric iron brain deposition as the cause, source and originator of chronic neurodegenerative diseases. J. Environ. Anal. Chem. 2015, 2, 169. [Google Scholar] [CrossRef]
- Fisher, S.K.; Novak, J.E.; Agranoff, B.W. Inositol and higher inositol phosphates in neural tissues: homeostasis, metabolism and functional significance. J. Neurochem. 2002, 82, 736–754. [Google Scholar] [CrossRef]
- Tabb, J.S.; Kish, P.E.; Van Dyke, R.; Ueda, T. Glutamate transport into synaptic vesicles: roles of membrane potential, pH gradient, and intravesicular pH. J. Biol. Chem. 1992, 267, 15412–15418. [Google Scholar] [CrossRef]
- Bretti, C.; Cigala, R.M.; Lando, G.; Milea, D.; Sammartano, S. Sequestering ability of phytate toward biologically and environmentally relevant trivalent metal cations. J. Agric. Food Chem. 2012, 60, 8075–8082. [Google Scholar] [CrossRef]
- Ritacca, A.G.; Malacaria, L.; Sicilia, E.; Furia, E.; Mazzone, G. Experimental and theoretical study of the complexation of Fe3+ and Cu2+ by L-ascorbic acid in aqueous solution. J. Mol. Liq. 2022, 355, 118973. [Google Scholar] [CrossRef]
- Timoshnikov, V.A.; Kobzeva, T.V.; Polyakov, N.E.; Kontoghiorghes, G.J. Redox interactions of vitamin C and iron: inhibition of the pro-oxidant activity by deferiprone. Int. J. Mol. Sci. 2020, 21, 3967. [Google Scholar] [CrossRef]
- Harel, S. Oxidation of ascorbic acid and metal ions as affected by NaCl. J. Agric. Food Chem. 1994, 42, 2402–2406. [Google Scholar] [CrossRef]
- Mukherjee, S.; Panda, D. Contrasting effects of ferric and ferrous ions on oligomerization and droplet formation of tau: implications in tauopathies and neurodegeneration. ACS Chem. Neurosci. 2021, 12, 4393–4405. [Google Scholar] [CrossRef]
- Nishizaki, T. Fe3+ facilitates endocytic internalization of extracellular Aβ1–42 and enhances Aβ1–42-induced caspase-3/caspase-4 activation and neuronal cell death. Mol. Neurobiol. 2019, 56, 4812–4819. [Google Scholar]
- Joppe, K.; Roser, A.E.; Maass, F.; Lingor, P. The contribution of iron to protein aggregation disorders in the central nervous system. Front. Neurosci. 2019, 13, 15. [Google Scholar] [CrossRef] [PubMed]
- Straumann, N. Iron deposition and α-synuclein in Parkinson’s disease. Brain Pathol. 2024, 34, 12–20. [Google Scholar] [CrossRef] [PubMed]
- Arosio, P.; Knowles, T.P.; Linse, S. On the lag phase in amyloid fibril formation. Phys. Chem. Chem. Phys. 2015, 17, 7606–7618. [Google Scholar] [CrossRef] [PubMed]
- Salahuddin, P.; Fatima, M.T.; Abdelhameed, A.S.; Nusrat, S.; Khan, R.H. Structure of amyloid oligomers and their mechanisms of toxicities: targeting amyloid oligomers using novel therapeutic approaches. Eur. J. Med. Chem. 2016, 114, 41–58. [Google Scholar] [CrossRef]
- Kayed, R.; Head, E.; Thompson, J.L.; McIntire, T.M.; Milton, S.C.; Cotman, C.W.; Glabe, C.G. Common structure of soluble amyloid oligomers implies common mechanism of pathogenesis. Science 2003, 300, 486–489. [Google Scholar] [CrossRef]
- Hare, D.; Double, K. Iron and dopamine metabolism in Parkinson’s disease. Neurobiol. Aging 2016, 39, 1–10. [Google Scholar]
Disclaimer/Publisher’s Note: The statements, opinions and data contained in all publications are solely those of the individual author(s) and contributor(s) and not of MDPI and/or the editor(s). MDPI and/or the editor(s) disclaim responsibility for any injury to people or property resulting from any ideas, methods, instructions or products referred to in the content. |
© 2025 by the authors. Licensee MDPI, Basel, Switzerland. This article is an open access article distributed under the terms and conditions of the Creative Commons Attribution (CC BY) license (http://creativecommons.org/licenses/by/4.0/).
Copyright: This open access article is published under a Creative Commons CC BY 4.0 license, which permit the free download, distribution, and reuse, provided that the author and preprint are cited in any reuse.


