
Submitted:
28 January 2025
Posted:
29 January 2025
You are already at the latest version
Abstract
Due to major shifts in consumer behavior, instant food products—like canned fish products—are currently becoming widespread and consumed by a large number of people. Inevitably, this makes competition fiercer in this sector. Therefore, companies must focus on customer satisfaction and fulfillment to shape their purchasing decisions. This study aimed to examine the factors influencing consumers' decision to choose canned fish products. Eight independent variables—brand image, product quality, product price, product taste, product availability, product packaging, brand trust, and consumer satisfaction—were hypothesized to influence consumers' purchasing decisions in canned fish products as dependent variables. Primary data was collected through an online survey using pre-designed questionnaires to achieve the study objective. Then, the binary logistic regression was employed to analyze the data. The results of this study indicated that brand image, product quality, product taste, product availability, brand trust, and customer satisfaction significantly affected purchasing decisions for canned fish products. These findings serve as important indicators and valuable insights in promoting the canned fish product. These facts and findings indicate that company should recognize that improving product quality through innovation, competitive advantage strategies, and technology adoption are important advantages for the sustainable growth of canned fish products.
Keywords:
canned fish
; consumer behavior
; purchasing factors
; binary logistic regression
; Makassar City
1. Introduction
The world is constantly changing, and nothing has been stagnant. Computers and the digital revolution are expanding worldwide, changing people's relationships [1] and their habits. Competition has become more difficult as the world has become more globalized and technologically advanced. The consumer can readily buy a product made in any part of the world [2]. Consumer purchasing behavior is currently undergoing significant transformation. Consumer views regarding traditionalism and retail innovation are crucial for long-term consumer behavior evolution [3]. One of the most prominent changes in consumer behavior today is the pattern or way of choosing food. In recent years, people have shifted their eating habits from eating freshly produced food to eating food that is already prepared [4, 5]. Montero et al. [6] and Yu et al. [7] define ready-to-eat (RTE) meals as meals that have been pre-cooked, packaged, and prepared for immediate consumption. These meals necessitate no additional preparation or cooking beyond conventional heating. The removal or substantial alleviation of meal preparation-related stress is a notable advantage for clients whose busy schedules are partly attributable to the fast tempo of life. The pressures of their busy lives led them to naturally favor simple cooking methods that did not need much time and goods that could be prepared quickly [8]. According to Azman et al. [4] and Pane [9], consumers' preferences have shifted away from freshly prepared meals and toward ready-to-eat foods due to lifestyle changes. Current consumer behavior that leads to various practical things is undoubtedly an opportunity for business actors. This makes traded packaged products increasingly widespread [10], including canned foods.
The canning technique makes it possible for food to be delivered, preserved, and consumed over an extended time on a worldwide scale securely [11]. Canned foods are an essential part of the diets of most people in both developed and developing nations because they provide a broader selection of healthy and high-quality foods, and they are available in a form that is convenient throughout the year [12]. Canned fish is a sort of canned food that is in high demand among customers all over the world. This is partly because it can be stored for an extended time, is ready for eating, and is inexpensive [13]. Consequently, it becomes a reliable option when you are in a hurry to eat but do not have much time to prepare meals on your own [14]. Fish that has been canned is a handy dietary alternative rich in essential nutrients, protein, vitamins, and minerals, all of which contribute to enhancing the health benefits associated with eating fish [15, 16, 17]. Although it is practical, canned fish is a convenient food choice. Fish such as sardines, tuna, mackerel, salmon, and herring are typically the types of fish that are processed into canned fish. In response to the market's demands, the canning business uses a variety of filler mediums and other additives. According to Sathsarani et al. [18], the filling medium enhances the final product's taste, texture, and flavor. With changes in consumer behavior and tastes for canned fish products, this industry is seen as a potential business, causing this industry to increase rapidly.
Over time, consumer needs for canned fish are also increasingly diverse, leading to the development of producers' brands and types of canned fish products [14]. Some choices of canned fish brands offered on the Indonesian market are ABC, Botan, Gaga, Maya, Pronas, and so on. Based on brand index data reported by the Top Brand Award (2023), it is known that the ABC canned fish brand is the most well-known brand in the community and is the most popular brand in the market, attracting a lot of public buying interest. Consumers are encouraged to discriminate more when selecting canned fish products that meet their requirements and wishes due to the competition between the many brands of canned fish products that are now available on the market [19, 20]. This competition results in consumers having a variety of options to choose from. Therefore, to keep their businesses afloat in the face of intense competition, business actors need to create plans.
Brands perform a wide range of important functions. At their most fundamental level, brands act as markers for the products and services a company offers its customers. According to Cuong [21], brands can simplify selection, ensure quality, reduce risk, and establish product confidence. This is all from the perspective of the consumer. If a brand can captivate its audience, then that audience is more likely to purchase the products and services offered by that brand. A brand can be compared to life in terms of the success of a product in terms of meeting sales targets [22]. This is because a brand is a representation of a person's life. According to Pambhudi [20], the brand of a thing is a reflection of the features or attributes of the product in the market. The company's dedication to building a strong and competitive brand from a consumer perspective has become one of the top priority factors in the business environment. This is due to the important role of brands in consumer decision-making [23]. According to Zeren and Kara's [24] research, branding is an essential component of marketing strategy. When executed correctly, it can increase consumer loyalty, increase intentions to purchase, and enhance business success rates. To be successful in the highly competitive business field, a person must be able to provide clients with a positive impression of their product [25].
To summarize, individuals are more likely to purchase a product that has, in the past, garnered recognition and is already present in their cognition. This, as stated by Sutrisno [26], has the potential to help consumers feel more confident when making choices about their purchases. It is a common misconception among consumers that brands already well-known in the market are superior to other brands and of higher quality. The general public has the presumption that well-known brands in the market will provide more comprehensive information than other brands of products. When consumers have access to a brand, they can better differentiate between the various products available on the market [20].
A purchase decision is the consumer's final action before purchasing and choosing a brand [27, 28]. This choice is comprised of various stages [29]. A buy decision is an individual's decision to select the best option from many available options. Schiffman and Kanuk described this decision. To determine the attitude of the subsequent purchase, a genuine follow-up accompanies this decision, and an appraisal of the decision made [30, 31]. The purchase decisions of an individual are determined by their attitude toward adopting a product or service that they believe will satisfy them, as well as their readiness to incur whatever risks are necessary to achieve this satisfaction [32]. Customers are more inclined to remain loyal to a product and make additional purchases if they have previously bought and are pleased with the product they have purchased. Therefore, customer satisfaction must be maintained by canned fish producers to compete with other canned fish products and other processed products [14]. Businesses take many different approaches to augment their sales and fulfill the requirements of their clientele. The realization of this fact makes it abundantly evident that marketing is one of the primary activities businesses engage in to ensure their continued existence, grow and generate profits, and increase their position compared to other businesses that compete with them [33]. The right marketing strategy will certainly affect the sales of canned fish companies. Thus, canned fish producers need to know the factors that can increase purchases and satisfaction for canned fish consumers. Hence, this study aimed to examine the factors influencing consumers' choice of canned fish products.
2. Literature Review and Conceptual Framework
The extreme level of competition in the business world is a direct result of the numerous brands of canned fish that are currently accessible on the market. Developing marketing strategies is a requirement for businesses, as it is a given that they are required to do so to capture customers' attention and urge them to make purchases. Consumers are subject to being misled by various reasons when they select a brand from the category of canned fish items to ingest. Some factors responsible for these factors include the brand's image, quality, pricing, flavor, availability, packaging, consumer satisfaction, and brand trust among consumers. Next, we will discuss building a conceptual framework and the impact of each independent variable on the customer's decision to purchase the canned fish product. Both of these topics will be covered in the following sub-section.
2.1. Brand Image
Several researchers have concluded that brand image can be described as the perceptions of a brand that are represented in the brand associations that are kept in users' memory [34, 35, 36, 37, 39]. According to Agmeka et al. [39], brand image is considered one of the most significant intangible assets that affect how customers view a company. This is because customers perceive a company based on its brand image. The research conducted by the writers is the source of this information. Consequently, the firm's brand image affects the prospective purchasers of the product or service. Mursandi et al. [40] noted that customers can develop this perception of the brand based on the knowledge or experience they have with the brand. It is necessary to consider this. There is a possibility that customers will encounter this particular issue. According to the findings of an investigation by Benhardy et al. [41], individuals are more likely to remember and respect businesses with a favorable and positive image. Furthermore, according to Temaja and Yasa [42], consumers can distinguish certain items, determine the quality of such products, reduce the likelihood of purchasing a product, and experience complete pleasure and delight due to the differentiation of the product through the utilization of brand image.
As a consequence of having a reputation and credibility [43], the process of creating a brand is substantially influenced by the brand image that is associated with the brand. This is because the brand image is associated with the brand. This is because it can drive the decisions that customers make concerning a particular brand, which in turn influences the purchasing behavior of consumers [44, 45]. To be more specific, this is because, as stated by Rahayu et al. [46], consumers will be more enthusiastic about purchasing a product if the image of the product is more favorable. Furthermore, according to the outcomes of research by Fatimah and Nurtantiono [47], a brand image's presence affects a consumer’s decision whether or not to acquire a product or service. When it comes to persuading customers to make decisions regarding their purchases, the fact that this is the case illustrates that the image of a company is a crucial component to consider. When companies targeted toward consumers connect with their customers, their messages may include information about the product's quality and the promise the company has made, potentially affecting consumers' decisions.
2.2. Product Quality
Purba et al. [48] and Wantara & Tambrin [49] have both stated that product quality is comprised of all of the attributes and features of a product or service and that it is determined by the product's capacity to fulfill the demands of the consumer, regardless of whether those demands are stated or inferred. As a result, product quality is defined by the product's ability to fulfill the consumer's demands. Before making a purchase decision, buyers will consider various aspects, including the quality of the goods or services offered. As a consequence of this, the organization is obligated to continuously pay attention to and ensure that the quality of its goods is maintained [50]. When deciding to purchase something, one of the most important aspects is the quality of the goods offered. One of the techniques that marketers use to determine the placement of their products in the market is the quality of the product, also referred to as "product quality." This is one of the instruments that marketers use. When a company wants to aid or support efforts to improve or maintain the product placement in its target market, it must choose the degree of product quality it produces [51, 35]. This is because the company is the one responsible for the product. This means that the company must choose the level of product quality that it produces.
According to Girsang et al. [52], businesses can boost their revenues by retaining their existing customers and attracting new customers by utilizing high-quality items offered by the firm. According to Barreto et al. [53], customers will make decisions to acquire a product consistently if they believe that the product is compatible with them and, in addition, if the product can fulfill the needs they established for themselves. Following a study by Pratama et al. [54], it is general information that the impact of a product’s quality on a consumer's decision regarding whether or not to acquire that product is a significant factor. In light of this, one might conclude that the possibility of a customer making a purchase increases in direct correlates to the quality of the goods being available for purchase. Consequently, there will be an increased likelihood that they will settle on a conclusion concerning their purchase. The fact that purchases are impacted by product quality is evidenced by the fact that product quality is a factor that is considered during the decision-making process when purchasing a product. This fact reveals that product quality is a factor that is considered.
2.3. Product Price
Benhardy et al. [41] stated that "price" comes from the money the client must trade to purchase an item or service. The quantity of money the customer must pay is sometimes called the price. When referring to a product or service, the term "price" refers to the total amount of money required to be paid to receive the item or service. In their 2019 study, Wantara and Tambrin [49] found that the price of goods considerably affects both individual satisfaction and product loyalty. This is because a consumer carefully considers whether or not he is getting the most value out of the goods concerning the amount of money he is paying for them. To arrive at an acceptable value, it is necessary to consider the fairness procedure in pricing. A comparison of the price to other qualities associated with the standard, procedure, value, reference, and norm is required to determine whether the price is fair. This is how they determine whether or not the prices are reasonable. When choosing the products or services they will use, the price is the key factor buyers consider. Customers will be dissuaded from making purchases of items or services if the price is set too high, and vice versa. If the price is too low, customers will frequently regard the goods or services offered as inferior quality [55].
Prices that are set excessively high. The research findings that Siregar and his colleagues carried out in 2022 support this assertion. As a result of the fact that customers frequently analyze the price of a product before making a purchase [56], it is clear that the price element is a crucial concern for customers when it comes to making a purchase choice and influencing the degree to which they are satisfied with the product. According to the outcomes of research by Rahmatullah [57], it is common knowledge that price variables positively and considerably influence decisions about acquiring products and services. This is evidenced by the fact that the research findings were not surprising. This means that the better affordability of the pricing supplied to customers will increase the number of purchases made by those customers purchasing the product or service. Considering this, the corporation must ensure that its products' prices either remain unchanged or increase after the advantages provided to clients.
2.4. Product Taste
Taste is the outcome of the exertion of taste buds, which are found on the tongue, cheeks, esophagus, and roof of the mouth, according to Drummond and Brefere [58]. flavor buds are responsible for the sensation of flavor. The experience of flavor is produced by the taste buds in the mouth. The five kinds of human senses that combine to generate taste are hearing, smell, touch, sight, and taste. Taste is the sixth sense. Among these five senses, taste is a form of collaboration that occurs. An examination of a food item's scent, flavor, and the degree to which it has developed over time can be used to determine the flavor of the food item. This is an important issue because the product's flavor plays a significant influence in determining whether or not consumers would accept a particular food product.
Additionally, the flavor of a food product is an essential aspect that affects customers' satisfaction with the food product in question for several reasons. According to Siregar et al. [55], tastes that follow consumer wants substantially impact customer satisfaction and decisions regarding whether or not another consumer will repurchase food products. Customers have a distinct preference for the flavor of each food product, and tastes that follow consumers' desires will significantly influence the level of satisfaction that consumers experience. The quality of the flavor and the consistency with which the taste is delivered are two aspects that significantly affect individuals' purchasing decisions, as stated by Fauzi et al. [59]. Both of these factors are of great importance. In a study that Melda and colleagues [60] conducted, they concluded that taste is a factor that has a statistically significant and beneficial effect on consumer decisions about what to buy. This was the result that they reached. In light of this, it is possible to conclude that the ratio of the number of decisions to purchase will increase in direct proportion to the degree to which the flavor is enhanced under the customers' expectations.
2.5. Product Availability
As Situngkir et al. [61] point out, product availability may be understood as a factor closely connected to the ease with which one can get a particularly sought-after product. The availability of products makes it simpler for customers to acquire the products they anticipate purchasing. When a product is readily available or easy to acquire, it might satisfy customers. The corporation must, therefore, ensure that the product is disseminated appropriately to make it simple for customers to acquire the goods. According to Apriando et al. [62], knowing what consumers want and anticipate in an easily acceptable manner can be accomplished through the availability of products quickly and exactly. A corporation can establish a robust distribution channel system and achieve market dominance [63]. According to Conlon and Mortimer [64], businesses operating in these markets may maximize product availability strategies to impact consumer decisions. It will be one of the primary attractions for consumers who like a brand's products and will continue to follow the development of the brand without any hesitation to continue making purchasing decisions [65]. Product availability in a particular product will be sufficient for this to be the case. The availability of a product significantly influences individuals' choices concerning their purchases, as demonstrated by the investigation conducted by Akbar et al. [65]. Consequently, the availability of a product brand that is evenly distributed has the potential to increase one's interest in acquiring the products associated with that brand. To increase the number of customers who complete purchases, it is evident from these data that the availability of products sold in a range of retail establishments is of significant value.
2.6. Product Packaging
The product packaging serves as the identifying characteristic and signature of a product being marketed by the company [66]. Packaging serves as a container for wrapping food or beverage goods to protect them from dirt, dust, air, impact, and sunlight, but it also serves as a marketing tool to attract customers interested in purchasing the product. Rambabu and Porika [67] found that the visual characteristics of the packaging play a significant role in representing the product to many users. The packaging of a product is frequently the basis for the customer's impression regarding the quality of the product. With the ability to provide impressions that can convince customers that the product contained within the package is the most suitable for their requirements, packaging plays a vital part in supporting customers in making decisions regarding which product to purchase [68]. Consumers can discern between items with the help of packaging, which has been offered as an ultimate selling proposition. Products that consumers are already familiar with or have piqued their curiosity are also options they choose. According to Waheed et al. [69], visually appealing packaging is essential in encouraging consumer purchase. Research conducted by Suprapto and Azizi [70] has shown that packaging significantly affects consumers’ purchase decisions. The findings of the research investigation proved this. The findings of this research were both positive and substantial. As a result, the quality of the product packaging, including aspects like color, material size, logo, and writing, will improve the likelihood that consumers will decide to buy a product. According to Rambabu and Porika's research [67], the significance of packaging design as a communication and branding strategy lies in the fact that it is essential for achieving success in the product market.
2.7. Brand Trust
Based on the description supplied by Benhardy et al. [41], "brand trust" may be described as the willingness of a consumer to believe in a brand when they are confronted with a risk and have the hope that they will achieve a favorable outcome. This term can be used to describe "brand trust." According to Dam [71], trust can be described as individuals' faith in the dependability and quality of the products being delivered by the vendor they are purchasing from. Creating long-term connections between businesses and their customers requires establishing trust and commitment, which are two of the most important components [72]. This transpires as a consequence of the fact that the company's success is contingent upon the customers' confidence in the company [41]. Because trust is the basis upon which clients base their purchasing decisions, it is of utmost importance in marketing [35, 73]. According to Kumar et al. [74], it has been shown that trust in a brand is responsible for producing a good response and positive purchasing intentions towards the brand. This was determined via their research. This statement implies that a high level of confidence in a brand is likely to boost the perception of the benefits of any product, which in turn leads to higher intentions to purchase the product. This is the implication of the statement. Consumers who have a significant amount of trust in a particular brand are exceptionally devoted to purchasing the same products again [75]. Additionally, these customers seek ways to connect with something and share their ideas with others [76]. In 2022, Pradana and colleagues [77] conducted research that found that consumers' final purchasing decisions are affected by their level of brand trust. This was one of the findings of the study. In light of the data, it may be stated that confidence in a particular brand is an additional factor that plays a role in the decision-making process regarding purchases. As a result, the degree to which the brand's value is high is directly tied to the degree to which the influence of brand trust on purchase decisions for a product is effective. This is because the brand's value is increased when the trust in the brand is increased.
2.8. Customer Satisfaction
Customer satisfaction is the emotions of joy or disappointment that arise when an individual evaluates the actual performance of a product against the anticipated performance [78, 79]. To put it succinctly, customer satisfaction may be said to be the value-adding gap between customer expectations and their experience. In other words, customers are satisfied when the goods or services they purchase meet or exceed their expectations [80, 81]. According to Khatoon et al. [82], the goal of every successful firm is to have a client who is content and joyful with the services they receive. Customer satisfaction is a basic determinant of quality, productivity, and repurchase intent, which explains its significance [83]. Maffett and Brusa [84] argue that establishing customer satisfaction can lead to various advantages for the organization. Some of these advantages include the following: the relationship between consumers and agencies may become more amicable; it may give a good base for repeat purchasers (usage); it may develop customer loyalty; and it may result in word-of-mouth referrals and recommendations from other customers. Consequently, consumer satisfaction plays a crucial influence on activities that aim to increase purchasing decisions. The outcomes of an investigation by Wibisono [85] indicate that the happiness customers perceive their purchases to provide has a favorable and significant effect on purchasing decisions. When this is considered, it is feasible to conclude that the value of customer happiness plays a part in the choice to purchase
2.9. Purchase Decision
The first phase in making a buying decision is for consumers to identify an issue, gather information about a particular product or brand, and determine how successfully each of these possibilities may solve the problem. The consumer finally decides whether or not to purchase the product due to this evaluation. Purchase choice can also be described as customers' actions regarding whether or not they would purchase a product [86]. Suppose consumers acquire relevant information from several sources. In that case, they will investigate and assess various products to choose the products and services that are the most suitable for them. This will allow them to make appropriate decisions. To arrive at the outcomes of the evaluation and comparison, the customers' utility value was considered. Consumers will develop their preferences or intentions regarding acquiring a specific commodity [87]. It includes various factors, such as what to buy, when, where to buy it, which brand or model to buy, what payment methods will be employed, and how much money to spend. It is composed of some variables. It is quite possible that customers' perceptions regarding the company’s goods and services and the organization's brand name will play a function in generating their purchasing choices. The purchasing behavior of consumers is often the result of their previous experiences with the products and services given by a firm, as well as the capacity of the product they have purchased to satisfy their particular criteria [88]. This is to provide a more precise explanation.
2.10. Conceptual Framework
A conceptual framework of study is an ensemble of concepts, presumptions, expectations, beliefs, and theories that underpin and guide your research, according to Maxwell (1996) in Tamene [89]. It is primarily a conception or model of what is out there that you plan to study, what is going on with these things, and why; it is a tentative theory of the phenomena that one is interested in investigating. His theory serves as a guide for the remainder of your design, assisting you in evaluating and improving your objectives, creating pertinent and realistic research questions, choosing suitable techniques, and spotting any risks to the validity of your findings. alternatively, a conceptual framework could represent a structure the researcher believes best explains how the phenomenon under study naturally develops [90]. Therefore, referring to the literature in the previous section, in this study, there were nine latent variables (LVs) in total, including eight independent LVs, namely, the LV of Brand Image (BIM), Product Quality (PQU), Product Price (PPR), Product Taste (PTS), Product Availability (PAV), Brand Trust (BTS) and Customer Satisfaction (CST), and one dependent LVs of Purchase Decision (PD). Figure 1 displays the model of the conceptual framework applied in this study.
3. Research Methods
This section presented the study's methodology. This section included a summary of the research site, sampling scheme, respondent selection, sample data sources, and data gathering and analysis procedures. This study employed primary data from pre-tested questionnaires delivered to selected respondents.
3.1. Research Location, Data Gathering Method and Sample
This research was conducted in Makassar City, located in South Sulawesi Province. Administratively, Makassar City is divided into 15 sub-districts and 153 villages. The largest sub-district in Makassar City is the Biringkanaya Sub-district, with an area of 48.22 square kilometers, or covering 27.43 percent of the total area of Makassar City. Meanwhile, the smallest sub-district is the Kepulauan Sangkarrang Sub-district, which has an area of 1.54 square kilometers or only 0.88 percent of the area of Makassar City. The visualization of the research location map can be seen in Figure 2.
Considering that Makassar City is the most prospective area for canned fish consumption, with an average of 0.021% per capita per week, compared to other cities or districts in South Sulawesi Province based on data from Badan Pusat Statistik (2023) presented in Figure 3, this location was chosen intentionally.
This research was conducted in April and May 2024. Researchers collected quantitative data through an online survey. In collecting primary data, a questionnaire was distributed online using Google Forms to the canned fish consumers. The method of sampling utilized in this study was purposive sampling. The purposive sampling technique, also called judgment sampling, is the deliberate choice of a participant due to the qualities the participant possesses. Etikan et al. (2016) stated that it is a nonrandom technique that does not need underlying theories or a set number of participants. Because the number of populations employed in this study cannot be specified, the number of samples was determined by adopting Roscoe’s theory (1982). Referring to Roscoe's theory (1982) in Sugiyono [91], several ways to determine samples in research are: (1) A suitable sample size in research is 30-500 samples, (2) If the sample is divided into categories (male/female, junior/senior, and so on), then the number of sample members in each category is at least 30, (3) If the research analyzes with multivariate (correlation or multiple regression), then the number of samples should be 10 times larger than the number of variables studied. Based on this reference, the number of samples for this study was set at 200 respondents, which is adjusted to the first point of Roscoe's theory where the number 200 is in the middle of the sample range of 30-500 and more than 10 times the number of variables studied. This number of samples is also supported by the statement of Crocker & Algina (1986) in Alwi [92] that for the stability of a study, a minimum of 200 respondents are needed in the study. Respondents in this study were people living in Makassar City, spread across 14 sub-districts (Figure 4). Respondents were selected randomly without considering their location of residence. The large number of respondents from certain sub-districts indicates the large number of consumers of canned fish products in that area.
3.2. Binary Logistic Regression Analysis
3.2.1. The General Model of Binary Logistic Regression
According to Tampil et al. [93], the regression model is a statistical technique used to ascertain the impact of independent variables on what is regarded as a dependent variable. The link between the two variables is ascertained using this method. This objective can be successfully achieved by using the regression model. Regression models come in a variety of forms. Nonetheless, the model that is thought to be the most fundamental of all is the linear regression model, represented by Equation (1).
where: Y = Dependent Variable; X1-n = Independent Variables; βo = Constant; β1-n = Regression Coefficient.
Y = βo + β1X1 + β2X2 +…+ βnXn
The binary logistic regression model was identified as the most appropriate analytical method to achieve the research objective. Binary logistic is a regression analysis technique where the response variable is binary or categorical, specifically consisting of two categories: 0 and 1 [93]. This model is employed to ascertain the relationship between independent variables and one categorical dependent variable, which aims to determine the significance of the influence of the independent variables simultaneously and partially on the dependent variable [94]. The form of the logistic regression model is represented by Equation (2).
Then, the model is transformed with a logit transformation to obtain a linear logit function in its parameters. The logit transformation model is shown in Equation (3).
3.2.2. Empirical Model
To investigate the impact of eight independent variables and their relationship to the dependent variable, Purchase Decision (PD), as shown in Equation (4), an empirical model was developed based on Equations (2) and (3).
where:
g(PD) = Consumer purchasing canned fish with the ABC brand within the past year (1 = Consumer Purchasing, 0 = Otherwise); βo = Constant; β1 – β8 = Coefficient Regression; BIM = Brand Image; PQU = Product Quality; PPR = Product Price; PTS = Product Taste; PAV = Product Availability; PPG = Product Packaging; BTR = Brand Trust; CSF = Customer Satisfaction; μ = Confounding error.
3.2.3. Research Statements, Hypothesis Development, and Measurement Unit
Variable is a concept that can have a variety of quantitative values. Analyzing the variables' functional relationships is the primary goal of the scientific investigation. It is any feature or aspect of an event, function, or process that affects another event or process being studied by its presence and nature. In this study, eight independent variables are suspected of influencing customer purchasing decisions for canned fish products in Makassar City, which are the dependent variables. A hypothesis is an educated assumption about a subject. Rather than focusing on finding a solution to the issue at hand, most researchers who engage in quantitative research intend to examine the hypothesis that has been established initially. With this in mind, a researcher needs to have a solid comprehension of the significance and character of the hypothesis developed at the first stage of a research endeavor. In developing a research hypothesis, one of the objectives is to either derive and evaluate the logical consequences of causal relationships or make predictions about the causal ties between observable variables. The characteristics of the independent and dependent variables, including research statements used as indicators, units of measurement, and hypotheses developed, are presented in Table 1.
3.2.4. Model Fit Test
The purpose of the model fit test is to ascertain whether or not the logistic regression model is appropriate for the circumstances that have been determined. To carry out this test, you will be required to make a comparison between the estimated values and the observed values. Using Hosmer and Lemeshow's test, which is quantified by the chi-square value, this analysis aims to determine whether the regression model matches the data. Equation (5) displays the results of the Hosmer-Lemeshow statistical test [109].
where:
X2 = The Chi-Square Statistic's Value; Ei =Expected Frequency in Group i Based on The Regression Model; Oi =Observed Frequency in Group i.
To see the fit model, there are two hypotheses as follows:
- H0 is rejected if the significance value (0.05) is lower than the probability value (P-value), indicating a significant discrepancy between the model and the observation value. As a result, the value of the observations cannot be predicted by the Goodness of Fit Test.
- H0 is accepted, indicating that the model matches the observation value if the probability value (P-value) exceeds 0.05 (significance value). Consequently, the value of the observations can be predicted using the Goodness of Fit Test
3.2.5. Coefficient of Determination (Nagelkerke R-Square)
The Nagelkerke R-Square and the Cox and Snell coefficient are meant to assure that the value will fluctuate between 0 (zero) and 1 (one). Both of these coefficients are designed to calculate the value. This technique ensures that the value will oscillate between these two values. It is possible to conclude that the independent variables' ability to explain the dependent variable is either severely constrained or can be defined as being weak. This is because the Nagelkerke R-Square value is near zero (zero), which supports this inference. This suggests that the independent variables can provide all of the information required to anticipate the variability of the dependent variable or that it can be considered strong [110]. A Nagelkerke R-Square number near one (1.0) indicates this is the case. In the meantime, a number relatively close to one (1.0) indicates the dependability of the dependent variable under consideration.
3.2.6. Simultaneous Test (Omnibus Tests of Model Coefficients)
The simultaneous test aims to determine whether or not the predictor variables affect the response variable jointly. This is accomplished by carrying out the test simultaneously. To establish whether or not the model is significant at the same time, the Chi-square model is utilized in the test being conducted. It is feasible to conclude that at least one of the independent variables substantially affects the variable being tested if the value of the statistical test is higher than the value of the Chi-square table. This happens when the value of the Chi-square table is higher than the value of the statistical test. The following are the factors that should be considered while making decisions, taking into consideration the fact that the significance level is 5%:
- If f-count > f-table and (sig.) < 0.05, then H0 is rejected, and H1 is accepted, meaning that the independent variable simultaneously affects the dependent variable.
- If f-count < f-tabel and (sig.) > 0.05, then H0 is accepted, and H1 is rejected, meaning that the independent variables simultaneously do not affect the dependent variable.
Steenbergen and Jones [109] state that it can be assumed that at least one independent variable in Equation (6) significantly impacts the dependent variable if the test value of the G statistic exceeds the value of the Chi-square table.
where: P = The number of model predictor variables; Lp =Likelihood value with predictor variables; L0 =Likelihood value without predictor variables.
3.2.7. Partial Test (Wald Test)
After completing a simultaneous test, the final stage will establish the relevance of each parameter incorporated within the model. This examination will take place after the test has been carried out. To ascertain the significance of every parameter, this evaluation will be carried out by squaring the quotient of the parameter estimate βj with the standard error. This will be done to determine the relevance of each parameter. For this particular test, the significance level is established at α = 0.05. The decision rule H0 is rejected at a significant level of α if the value of W exceeds X2 (α, db) or if the significance value is lower than α value. In other words, if neither of these conditions is met, the decision rule H0 is rejected. This test is being conducted to ascertain whether the hypothesis accurately describes the situation. The Wald test formula is presented in Equation (7).
where:
SE(βi) = coefficient’s standard error estimate; βi = The expected amount of the parameter (βi).
3.2.8. Interpretation of Odds Ratio (Parameter Coefficient)
The parameter coefficients are interpreted to ascertain the tendency or functional link between the predictor variable and the response variable and demonstrate the influence that changes in the value of the variable in question have. This is carried out to achieve a deeper comprehension of the connection that exists between the two variables. By comparing the likelihood of an event occurring with Y = 1 to the probability of an event occurring with Y = 0, the odds ratio is the ratio that is determined by this comparison. This comparison is to be carried out to ascertain the odds ratio. One definition of the odds ratio value is the exponent of the regression coefficient. This value is usually abbreviated as Exp(B), the odds ratio value. This value is employed in the independent variable that exerts a significant effect on the dependent variable to ascertain a percentage of the population that belongs to a particular category in contrast to a portion of the population that belongs to a different collection of categories. There is a significant relationship between the two categories. Santoso [111] states that the odds ratio value represents the ratio of instances where the incidence rate has drastically increased or reduced. The computation of the odds ratio is only carried out for those elements regarded as influential. The odds Ratio formula is provided in Equation (8) [112].
where:
β = The regression model's logistic regression coefficient; e =Euler’s number, approximately 2.71828.
4. Results and Discussion
Based on research tests that were carried out using the Binary Logistic Regression method, the results regarding the influence created by the variables of brand image, product quality, product price, product taste, product availability, product packaging, consumer trust, and consumer satisfaction on consumer purchasing decisions on ABC canned fish products in Makassar City have been obtained. These results were obtained. It was necessary to gather these findings to ascertain how the aforementioned factors impacted consumers' purchasing decisions.
4.1. The Goodness of Fit Test
The model's fit to the data is assessed using the model fit test, determining if the observed values meet or closely resemble the model's predicted values. The chi-square and significance values (Sig.) in binary logistic regression can be used to gauge the approach taken to test the model fit. Based on the data shown in Table 2, the result of the Chi-square Table calculation is 15.507 with a significance level = 0.05 and df = 8. Table 3.2 shows that the calculated Chi-square value obtained is 0.485 with a significance value 1.000. It is known that the calculated Chi-square value is smaller than the Chi-square Table value (0.485 < 15.507). The significance value is greater than the α value (1.000 > 0.05), so it can be concluded that H0 is accepted, which means there is no difference between observed probabilities (observed classification) and predicted probabilities (predicted classification). Stated otherwise, the model is appropriate or suited for application.
4.2. Coefficient of Determination (Nagelkerke R-Square)
The dependent variable in this study is purchasing decisions, and the Nagelkerke R-Square, a statistical approach, measures the independent factors. This allows us to find out how much the dependent variable can be explained by the independent variables, which are the following: brand image, product quality, product price, product taste, product availability, product packaging, brand trust, and consumer satisfaction. In Table 3, we can see that the Nagelkerke R Square indicator has a value of 0.886. Several independent variables, such as brand image, product quality, product price, product taste, product availability, product packaging, brand trust, and consumer satisfaction, can shed light on the dependent variable—the choice to buy canned fish products— by 88.6% in this study. Another way of stating this is that the independent variables can explain the dependent variable and 11.4% is explained by other independent variables outside the observation.
4.3. Simultaneous Test (Omnibus Tests of Model Coefficient)
The purpose of the simultaneous test is to ascertain if the independent variables collectively affect the dependent variable. A comparison of the produced Chi-square value with the Chi-square table and the significance value with a significance threshold of 5% or 0.05 is utilized to evaluate the model's relevance all at once. We can tell if the model is statistically significant by comparing the two. For this specific test, the omnibus test table is relevant. It was found that the Chi-square value was 129.543, and the Chi-square table was 15.507, according to the results of the simultaneous test shown in Table 4. Because of this, it has been proven that the Chi-square value is higher than the Chi-square table. Additionally, the table's significance value of 0.000 is lower than the threshold of 0.05, so it's evident that the null hypothesis (H0) is rejected. It can be concluded that there is at least one independent variable that has a simultaneous effect on the dependent variable or the independent variables of brand image, product quality, product price, product taste, product availability, product packaging, brand trust, and consumer satisfaction simultaneously have a significant effect on the consumer decision to purchase canned fish.
4.4. Partial Test (Wald Test)
The statistical test used to assess the significance of each parameter in the model is the Partial Test, also called the Wald Test. This test can be conducted by calculating the square root of the quotient of the parameter estimate β and its standard error. In this examination, the significance level is set at α = 0.05, and the null hypothesis (H0) is rejected if the significance value is less than α. Table 5 illustrates that six independent variables significantly and positively influence the dependent variable. Examples of these variables include brand image (BIM), product quality (PQU), product taste (PTS), product availability (PAV), consumer satisfaction (CSF), and brand trust (BTR). The significance values of these variables are below 0.05, indicating that the null hypothesis (H0) is not supported, lending credence to the alternative hypothesis (H1). During this period, the other independent variables, the product price (PPR) and product packaging (PPG), demonstrate no significant impact on the purchasing decision for canned fish. The null hypothesis (H0) is accepted, while the alternative hypothesis (H1) is rejected. This occurs because the significance value is either greater than or equal to 0.05. Figure 5 summarizes the research findings, organized for clarity and ease of understanding for the audience. The analysis proceeds with interpreting each variable presented in Table 5, which significantly influences the purchase of canned fish products.
4.5. Interpretation of Odds Ratio and Discussion
Table 5 displays the odds ratio, a statistic that can be used to ascertain the extent to which the dependent variable influences the independent variable. The table's Exp (B) value is the same as this measurement. Within the context of this experiment, the choice to buy canned fish acts as the determined variable. For this specific study, six out of the eight independent variables significantly affect the dependent variable. All of the independent elements must be significant for this to be true. The odds ratio (Exp(B)) measures the relative importance of the independent and dependent variables; it increases as the value does. A one-unit increase or decrease in the independent variable causes a corresponding change in the odds ratio value. This transformation could have beneficial or detrimental effects. The meaning of this change could be good or bad. The following explains the odds ratio (Exp(B)) for each independent variable based on the results shown in Table 5, which include these ratios. Table 5's results form the basis of this view.
4.5.1. The Effect of Brand Image (BIM) on Canned Fish Purchasing Decision (PD)
The research data test findings reveal that the brand image (BIM) obtained a significance value of 0.030, which is less than the threshold of 0.05. This demonstrates that the brand's image significantly affects individuals' decisions about the purchase of canned fish with the brand ABC (PD) in the vicinity of the city of Makassar. Meanwhile, the value of the odds ratio (OR) for the brand image variable was 10.365, with a coefficient value (B) of 2.338 throughout the entirety of the period that this was taking place. As a result, it is possible to conclude that if the brand image of ABC canned fish (BIM) is improved, there will be a 10.365 greater likelihood that customers will likely choose to purchase ABC canned fish (PD). Considering all of this, one may conclude that the preference for ABC canned fish is growing in direct proportion to the credibility of the brand image (BIM). The inference that can be drawn from this is that this is the conclusion. As a consequence, the findings of this investigation suggest that the initial hypothesis (H1) that was investigated is accurate.
As a further point of interest, the results of this research reveal that the vast majority of customers have a favorable impression or view of the ABC canned fish product brand. Based on the investigation's conclusions, this is the current state of affairs. Consequently, due to this favorable image perception, individuals are more likely to purchase canned fish items from ABC than purchase products from other brands. This is because People have a favorable perception of ABC canned fish. This result aligns with Yusuf's [113] and Rivai & Zulfitri’s [114] findings, which state that brand image significantly influences consumer purchasing decisions. In their study, Adhitama and Laily [96] found that how customers perceive a brand has a major influence on their purchase decisions. A favorable brand image can affect the formulation of consumer decisions that are favorable to the brand. Hastoko and Wati [95] state that the outcomes of their study show that the degree to which customers make purchase decisions would grow in proportion to the quality of the brand image that a company portrays. This is the conclusion that they draw from the findings of their research. More specifically, this is because a positive brand image has the potential to leave a favorable impression on the minds of consumers, which in turn influences the decision-making process that consumers go through when it comes to making purchases.
4.5.2. The Effect of Product Quality (PQU) on Canned Fish Purchasing Decision (PD)
The product quality (PQU) was found to have a significance value of 0.026, lower than the threshold of 0.05. This was established through the process of statistical analysis. This is evidence that the product's quality significantly affects the customer’s decisions about purchasing canned fish with the ABC brand (PD). This is clear from the fact that this is the case. Meanwhile, the odds ratio value (OR) for the product quality (PQU) variable is 19.222, with a coefficient value (B) of 2.956. Therefore, this indicates that the possibility of customers making decisions to purchase ABC canned fish (PD) will increase by 19.222 times if the quality of ABC canned fish (PQU) is higher than it now is. This is due to the reality that ABC canned fish is more likely to be chosen by customers. As a result, the hypothesis (H1) applied in this investigation has been demonstrated to be accurate.
The findings of this study indicate that the vast majority of consumers assume that the ABC canned fish product brand offers items of a quality that cannot be compared to other brands in the industry. Because ABC canned fish goods are of such high quality, consumers are more likely to place their trust in them and choose to purchase them. This is because ABC products are available to them. According to the findings of Hasanah et al. [19], which revealed that the quality of a product impacts the decision a consumer makes regarding their purchase, these findings agree with the findings discovered by the previously mentioned researchers. As a result of the association between the product's quality and the customer's health, the findings of his research suggest that consumers consider the product's quality when acquiring fundamental item components. Regarding customers' preferences when it comes to purchasing a product, Ardini et al. [97] indicate that the quality of a product influences those preferences and that high purchase decisions may be made through high product quality. This is stated in the findings of their study. According to the results of the research, this is something that should be considered and recommended
4.5.3. The Effect of Product Taste (PTS) on Canned Fish Purchasing Decision (PD)
According to the findings of the research data test that was carried out, the variable of product taste (PTS) had a significant value of 0.048, which is lower than the threshold of 0.05. This was discovered as a result of the fact that the threshold was set at 0.05. When consumers are confronted with the difficult option of whether or not to purchase canned fish with the ABC brand. The product's taste (PTS) plays a significant role in specifying whether or not they will complete their purchase. Meanwhile, the odds ratio value (OR) for the product taste variable (PTS) is 6.994 with a coefficient value (B) of 1.945, which indicates that if the taste of ABC canned fish is improved (PTS), the chances of customers making decisions to purchase ABC canned fish (PD) will increase by a factor of 6.994 times. This is because the odds ratio value measures the likelihood of purchasing a product. The odds ratio number measures the possibility that ABC canned fish would be purchased, which is why this is the case. Because this discovery was made, the hypothesis (H1) being investigated is now accepted.
The outcomes of this study indicate that most consumers agree with the statement that they adore the taste of ABC canned fish products. Consumers who purchase ABC canned fish goods, even occasionally, always consider the product's delicious taste. This is true even when the buyer makes a purchase repeatedly. According to the research findings by Sari and Mulyani [100], buyers consider taste when making decisions about their purchases. This is one of the factors that customers take into consideration. These findings are in agreement with the conclusions of the study that was conducted. The value of taste, which includes the appearance of color, the appropriate quantity of food, and the quality of the components used in food, will have a significant influence on the decisions that consumers make regarding their purchases, as stated by Salsabila et al. [101] in their research. This is an additional point of interest.
4.5.4. The Effect of Product Availability (PAV) on Canned Fish Purchasing Decision (PD)
The variable of product availability (PAV) has a significance value of 0.033, which is lower than 0.05 in terms of percentage, according to the findings of the research data tests that have been carried out. As a result of this, based on the fact that the percentage significance value is lower than 0.05, it is evident that the availability of the product (PAV) plays a significant part in deciding the decisions that consumers in Makassar City make concerning the purchase of canned fish with the ABC brand (PD). The odds ratio value (OR) for the product quality variable (PAV) is 34.311, with a coefficient value (B) of 3.535. It suggests that the likelihood of making a purchase decision for ABC canned fish (PD) will increase by 34.311 times if there is an increase in the availability of ABC canned fish items (PAV). This is implied by the fact that the odds ratio value is 34.311. This is because the odds ratio number affects the chance of taking advantage of a purchasing option. The hypothesis (H1) investigated throughout this investigation is accurate as a consequence of this investigation.
There is a potential that the majority of customers who took part in this research believe that these canned fish items manufactured by ABC are not difficult to locate in any region. It is possible to arrive at this conclusion based on the findings that were presented before. Due to the availability of numerous and evenly spread items over some different shopping areas, the ABC canned fish brand has the potential to increase customer buying interest compared to other brands. This is because the products are available in a greater number of locations. This is because an ABC brand product can be purchased from every one of these websites. A favorable and considerable impact on the consumer’s decisions concerning their purchases is indicated by the findings of this study, which are comparable to the findings obtained by Juliany [102]. These findings demonstrate that the availability of a product has an impact on the decisions that consumers make about their purchases. It was found that the findings of Akbar et al. [65] agreed with one another, specifically that the availability of a product in a manner that is evenly dispersed can boost the desire of customers to acquire the things.
4.5.5. The Effect of Brand Trust (BTR) on Canned Fish Purchasing Decision (PD)
A significant value for brand trust (BTR) was found to be 0.035, which is lower than the threshold of 0.05. These findings are based on the outcomes of the research data test that has been carried out. According to the findings of this study, the degree of trust that customers have in the ABC brand of canned fish (BTR) significantly influences their choices regarding whether or not they would ultimately purchase the product. Meanwhile, the odds ratio value (OR) for the brand trust variable (BTR) was shown to be 18.427 with a coefficient value (B) of 2.914, as indicated by the findings of the analysis. Consequently, this demonstrates that if there is an increase in the degree of trust that consumers have in the ABC canned fish brand (BTR), there will be an increase in the possibility that customers will make purchasing decisions for ABC canned fish (PD) that is 18.427 times higher than the level that was encountered previously. The fact that individuals have a higher level of trust in the brand due to the information shown earlier suggests that they are more likely to purchase canned fish from ABC. To confirm the hypothesis (H1) that was applied in this investigation, the objective of this investigation is to ensure that.
The consumers who participated in this study indicated confidence in the quality of the canned fish items manufactured under the ABC brand. A considerable proportion of the consumers voiced this confidence. Customers are more likely to have a higher level of confidence in their ability to rely on a particular brand of product if the brand is following their expectations and if they do not experience any feelings of disappointment when using the specified brand of product. There is no doubt that this will undoubtedly affect the consumer’s decisions concerning the acquisitions they want to make. The results of the investigation by Rahayu [106] indicate that confidence in a brand is a factor that plays a role in the decision-making process regarding purchases. This observation is consistent with the findings that were discussed earlier. The ability of a firm to convince customers that its products are of good quality is a decisive factor in achieving higher levels of brand trust, according to the results of the investigation by Ghofur and Supriyono [105]. This was one of the variables that ultimately improved consumers' confidence levels in the brand. Consumers who have faith in a brand will be able to build a positive relationship with that brand, which will ultimately lead to a commitment, and this will impact the degree to which consumers continue to be loyal to the brand throughout their lifetime.
4.5.6. The Effect of Customer Satisfaction (CSF) on Canned Fish Purchasing Decision (PD)
The significant value assessed to be important for customer satisfaction (CSF) was recorded as 0.024. This finding is considered significant since it is less than the 0.05 percent threshold. The results of the data test conducted for the study serve as the foundation for the conclusions provided throughout this article. This demonstrates that the level of satisfaction the purchaser derives from the product (CSF) is a significant component in choosing whether they will purchase canned fish with the ABC brand in Makassar City. Meanwhile, the value of the odds ratio (OR) for the variable that represents the level of satisfaction experienced by customers (CSF) was 64.200, with a value of the coefficient (B) discovered to be 4.162. As a result, it is possible to conclude that if customers are more pleased with the outcomes of ABC canned fish, then the likelihood of them selecting ABC canned fish as their product of choice (PD) will increase by 64.200 times. Another way of putting this is that the amount of money a customer is willing to pay for ABC canned fish is proportional to the customer's happiness with the product. This inquiry was carried out to establish whether or not the hypothesis (H1) presented was correct.
The findings of this research have led to the conclusion that most customers in the market are satisfied with the quality and flavor of the canned fish products that ABC produces. This conclusion was reached based on the findings of the research. A consumer expresses the degree to which they are satisfied with a product by assessing it based on their purchases and experiences while using the product. This evaluation is taken into consideration when the consumer is reviewing the product. According to a study by Mukuan et al. [107], the level of pleasure that customers experience has a considerable and favorable effect on the decisions made regarding purchases made by those customers. According to that research's findings, the conclusions agree with this finding, which is a promising indicator. Based on his findings, it appears that consumers will feel a sense of contentment with the outcomes they get if the product is of high quality and has a flavor tailored to their preferences. Researchers Marpaung and Mekaniwati [108] found that customer satisfaction is directly linked to the number of consumers who make a purchase decision in a favorable direction. This was proved by the outcomes of the research that they performed. This was shown to be the case from a perspective that was more hopeful and was taken into consideration.
5. Conclusions
This study examined the factors influencing consumers' choice of canned fish products. Eight independent variables—brand image, product quality, product price, product taste, product availability, product packaging, brand trust, and consumer satisfaction—were hypothesized to influence consumers' purchasing decisions in canned fish products as dependent variables. Primary data was collected through an online survey using pre-designed questionnaires to achieve the study objective. Then, the binary logistic regression was employed to analyze the data. The results of this study indicated that the independent variables of brand image, product quality, product taste, product availability, brand trust, and customer satisfaction significantly affected purchasing decisions for canned fish products. In contrast, product price and packaging did not significantly affect consumers' purchasing decisions.
Furthermore, based on the research results obtained, the suggestions that can be recommended are as follows: First, canned fish companies are expected to be able to maintain and improve consumers' positive perceptions of their product brand image. This can be done through massive promotional activities through both online and offline platforms so that purchasing decisions for canned fish products can continue to increase in the future. Second, canned fish companies should maintain quality well so that consumers are interested in continuing to make repeat purchases. Besides maintaining quality, companies can develop product innovations to attract consumer interest. Third, the price of canned fish products offered by the company is expected to be adjusted to the product quality. In addition, companies should pay attention to affordability and price competitiveness with competitors so that consumers tend to buy canned fish products over similar products. Fourth, the taste of canned fish products, which is currently widely favored by consumers, should be able to be maintained by the company so that consumers can continue to be loyal. In addition, companies can also carry out product development by creating new flavor variations that have not been found in other competing products to attract more consumer interest. Fifth, the company must maintain product availability by distributing canned fish products evenly in various shops, minimarkets, and supermarkets regularly and continuously so consumers can easily find products. Sixth, since canned fish products are food products that tend to be sensitive, canned fish companies must be able to maintain their quality through the use of sturdy packaging. In addition, companies are also expected to be able to innovate packaging, ranging from design to size variations. Seventh, the consumer trust in the existing canned fish product brand is expected to be maintained by the company by producing products with consistent quality from time to time. Eighth, the company must maintain and improve the quality and advantages of canned fish products to meet consumer expectations, provide satisfaction, and impact repeat purchasing decisions. Ninth, further research is expected to see other factors not examined in this study to be comparative and complement this research. Further research needs to be carried out on a broader area and a larger number of respondents to obtain more information and varied consumer perceptions.
Author Contributions
Conceptualization, F.N.S.A, M.S., and M.H.J.; Software, F.N.S.A.; methodology, F.N.S.A., M.S., A.A.S., M.H.J., A.A.A., A.R.M., and R.; formal analysis, F.N.S.A., M.S., and M.H.J.; validation, F.N.S.A., M.S., and M.H.J.; investigation, F.N.S.A., M.S., and M.H.J.; resources, F.N.S.A., M.S., and M.H.J.; data curation, F.N.S.A., M.S., and M.H.J.; writing-original draft preparation, F.N.S.A., M.S., and M.H.J.; writing-review and editing, F.N.S.A., M.S., A.A.S., M.H.J., A.A.A., A.R.M., R., L.F., H., A.I.M.; visualization, F.N.S.A., M.S., A.A.S., M.H.J., A.A.A., A.R.M., R., L.F., H., and A.I.M.; project administration, F.N.S.A. and M.S.; funding acquisition, F.N.S.A., A.A.S., R., L.F., H., and A.I.M.; supervision, M.S., M.H.J., A.A.A., A.R.M., R., L.F., and H. All authors have read and agreed to the published version of the manuscript.
Funding
This research did not receive any funding from outside sources.
Institutional Review Board Statement
The study was conducted following the Declaration of Helsinki, and the protocol was approved by the Ethical Committee of the Faculty of Public Health of Hasanuddin University, Makassar, Indonesia, via Ethical Recommendation Letter No. 146/UN4.14.1/TP.01.02/2024, /dated April 2, 2024.
Informed Consent Statement
Informed consent was obtained from all individual participants included in the study.
Data Availability Statement
The research data will be made available upon request.
Conflicts of Interest
The authors declare no conflicts of interest.
References
- Winthrop R.; McGivney E. Skills for a Changing World: Advancing Quality Learning for Vibrant Societies, 2016, Brookings Institution, Center for Universal Education.
- Mammadbayov, E.; Hurriyati R.; Hendrayati, H. Modern Marketing Management and New Trends in Marketing, Advances in Economic, Business and Management Research, 2020, 187, 459-462. [CrossRef]
- Šálková, D.; Hes, A.; Kucera, P. Sustainable Consumer Behavior: The Driving Force of Innovation in Retail, Sustainability, 2023, 15, 16648. [CrossRef]
- Azman, A. B.; Mazlan, B.; Ghani, F. A.; Ramli, N.; Yusoff, N. M. Consumer Behaviour: Ready-To-Eat Food in Peninsular Malaysia Based on Food-Related Lifestyle, Journal of Islamic, Social, Economics and Development, 2023, 8 (53): 15-24.
- Fernandez-Gonzalez, R.; Pereira, Z.G.T.; Ricoy-Casas, R.M. Governance of the Circular Economy in the Canned Fish Industry: A Case Study from Spain, Environmental Technology and Innovation, 2024, 34, 103618. [CrossRef]
- Montero, M. L.; Garrido, D.; Gallardo, R.K; Tang, J.; Ross, C.F. Consumer Acceptance of a Ready-to-Eat Meal during Storage as Evaluated with a Home-Use Test, foods, 2021, 10 (7), 1623. [CrossRef]
- Yu, S.; Yu, P.; Wang, J.m.; Li, C.; Guo, H.; Liu, C.; Kong, L.; Yu, L.; Wu, S.; Lei, T.; Chen, M.; Zeng, H.; Pang, R.; Zhang, Y.; Wei, X.; Zhang, J.; Wu, Q.; Ding, Y. A Study on Prevalence and Characterization of Bacillus cereus in Ready-to-Eat Foods in China, Frontiers in Microbiology, 2020, 10, 3043. [CrossRef]
- Temgire, S.; Borah, A.; Kumthekar, S.; Idate, A. Recent trends in ready to eat/cook food products: A review, The Pharma Innovation Journal, 2021, 10 (5): 211-217. [CrossRef]
- Pane, S. Pengaruh Citra Merek Terhadap Keputusan Pembelian Ikan Sarden ABC Di Lingkungan I Kelurahan Sadabuan Kecamatan Padangsidimpuan Utara. Undergraduate thesis, IAIN Padangsidimpuan, Indonesia, 2019.
- Abdurrahman.; Andriani, W. Faktor-Faktor yang Mempengaruhi Keputusan Pembelian Air Mineral dalam Kemasan Merek Dharma (Studi Kasus pada Konsumen CV. Bahana Tirta Alam Maritim di Kabupaten Sumbawa Besar), Jurnal Manajemen dan Bisnis, 2019, 1 (2). [CrossRef]
- Peycheva, K.; Panayotova, V.; Hristova, T.; Merdzhanova.; Dobreva, D.; Stoycheva, T.; Stancheva, R.; Licata, P.; Fazio, F. Metal Content, Fatty Acid and Vitamins in Commercially Available Canned Fish on the Bulgarian Market: Benefit–Risk Ratio Intake, foods, 2024, 13 (6), 936. [CrossRef]
- Rajput, H.; Goswami, D.; Arya, M.; Randhawa, A. Technology for Canning, Global Hi-Tech Horticulture, 2022, 6.
- Handayani, D.I.; Masudin, I.; Rusdiansyah, A.; Suharsono, J. Production-Distribution Model Considering Traceability and Carbon Emission: A Case Study of the Indonesian Canned Fish Food Industry, Logistics, 2021, 5 (3), 59. [CrossRef]
- Noventy, B.D.; Prasmatiwi, F.E.; Situmorang, S. Pola Konsumsi dan Kepuasan Konsumen Ikan Kaleng pada Tingkat Rumah Tangga di Pasar Tradisional Bandar Lampung, Jurnal Ilmiah Mahasiswa Agroinfo Galuh, 2023, 10 (2), 1455-1466.
- Benjamin, B.; Kenneth, A.B.; Yao, G.V.P. Levels of Heavy Metals in Selected Canned Fish on Cape Coast Market, Central Region, Ghana, International Journal of Environment, Agriculture and Biotechnology, 2023, 8 (5), 149-152.
- De Lima, N.V.; Granja Arakaki, D.; Melo, E.S.P.; Machate, D.J.; Nascimento, V.A. Assessment of Trace Elements Supply in Canned Tuna Fish Commercialized for Human Consumption in Brazil, International Journal of Environmental Research and Public Health, 2021, 18 (22), 12002. [CrossRef]
- Pawlaczyk, A.; Przerywacz, A.; Gajek, M.; Szynkowska-Jozwik, M.I. Risk of Mercury Ingestion from Canned Fish in Poland, Molecules, 2020, 25(24), 5884. [CrossRef]
- Sathsarani, D.W.N.; Bandara, T.; Udayathilaka, K.E.; Abeyrathne, E.D.N.S. Development of ready-to-eat canned fish using rainbow runner (Elagatis bipinnulata) with different filling materials, Journal of Agriculture and Value Addition, 2021, 4 (2): 1–12.
- Hasanah, N.; Widodo, J.; Zulianto, M. Pengaruh Kualitas Produk terhadap Keputusan Pembelian Ikan Kalengan Abc (Studi Kasus Ibu Rumah Tangga di Dusun Kalimati Muncar, Banyuwangi), Jurnal Ilmiah Ilmu Pendidikan, Ilmu Ekonomi, dan Ilmu Sosial, 2022, 16 (1), 21-26. [CrossRef]
- Pambudhi, A.B. Analisis Pengaruh Kualitas Produk, Citra Merek, dan Iklan terhadap Keputusan Pembelian Sepatu di Sports Station Rita Supermall Purwokerto. Thesis, IAIN Purwokerto, Indonesia, 2020.
- Cuong, D.T. The Role of Brand Trust as A Mediator In The Relationship Between Brand Satisfaction And Purchase Intention, International Journal of Psychosocial Rehabilitation, 2020, 24 (6).
- Hereyah, Y.; Andriani, R. Gojek Re-Branding Menyasar Pangsa Pasar Milenial (Studi Kasus Rebranding Gojek). Ganaya: Jurnal Ilmu Sosial Dan Humaniora, 2020, 2(2-3), 9–20.
- Azzari, V.; Pelissari, A. Does Brand Awareness Influences Purchase Intention? The Mediation Role of Brand Equity Dimensions, Brazilian Business Review, 2020, 17 (6). [CrossRef]
- Zeren, D.; Kara, A. Effects of Brand Heritage on Intentions to Buy of Airline Services: The Mediating Roles of Brand Trust and Brand Loyalty, Sustainability, 2020, 13, 303. [CrossRef]
- Hien, N.; Phuong, N.; Tran, V.T.; Thang, L.D. The Effect of Country-of-Origin Image on Purchase Intention: The Mediating Role of Brand Image and Brand Evaluation, Management Science Letters, 2020, 10: 1205-1212. [CrossRef]
- Sutrisno.; Jodi, I.W.G.A.S.; Putra, S.A.; Bakhar, M.; Hanafiah, A. Analisis Pengaruh brand image dan Brand Awareness terhadap Keputusan Pembelian Produk Minuman Street Boba, Management Studies and Entrepreneurship Journal, 2023, 4 (1): 571-578. [CrossRef]
- Djaelani, M.; Darmawan, D. Dulux Wall Paint Purchase Decision: The Role of Brand Image, Price, and Product Quality on Consumer Behavior of Paint Products, Jurnal Simki Economic, 2021, 4 (2), 150-160. [CrossRef]
- Kuncoro, H.A.D.P.; Kusumawati, N. A Study of Customer Preference, Customer Perceived Value, Sales Promotion, and Social Media Marketing towards Purchase Decision of Sleeping Product in Generation Z, Advanced International Journal of Business, Entrepreneurship and SME’s, 2021, 3 (9): 265-276.
- Mukaromah, A.L.; Teja, I.G.N.A.E.; Anggraini, N.P.N. The Effect of Green Marketing, Brand Awareness and Price Perception on Purchase Decision, International Journal of Applied Business and International Management, 2019, 4 (3), 75-83.
- Hidayat, A.; Wijaya, T.; Ishak, A.; Catyanadika, P.E. Consumer Trust as the Antecedent of Online Consumer Purchase Decision, Information, 2021, 12, 145. [CrossRef]
- Al-Azzam, A.F.; Al-Mizeed, K. The Effect of Digital Marketing on Purchasing Decisions: A Case Study in Jordan, Journal of Asian Finance, Economics and Business, 2021, 8 (5), 0455–0463. [CrossRef]
- Tyas, Y.R.N.; Mursito, B.; Marwati, F.S. The Purchase Decision of Samsung by Generation Z in Laweyan District Viewed from Lifestyle, Brand Image and Brand Awareness, International Journal of Economics, Business and Accounting Research, 2023, 7 (1).
- Anwar, S.; Mujito. Faktor-Faktor yang Mempengaruhi Keputusan Pembelian Motor Merek Yamaha di Kota Bogor, Jurnal Ilmiah Manajemen Kesatuan, 2021, 9 (1), 189-202. [CrossRef]
- Rahayu, S. The Effect of Brand Image and Promotion on the Purchase Decision of Tony Jack Jeans Product at DNA Store South of Tangerang, International Journal of Science, Technology and Management, 2022, 3 (1), 256-264. [CrossRef]
- Ayu, D.; Ketut, G. The Role of Brand Trust Mediates the Effect of Product Quality and Brand Image on Purchase Decision: A Study on I-Phone Consumers in Denpasar City, Eurasia: Economics and Business, 2021, 6 (48), 95-104. [CrossRef]
- Ihzaturrahma, N.; Kusumawati, N. Influence of Integrated Marketing Communication to Brand Awareness and Brand Image toward Purchase Intention of Local Fashion Product, International Journal of Entrepreneurship and Management Practices (IJEMP), 2021, 4 (15). [CrossRef]
- Mao, Y.; Lai, Y.; Luo, Y.; Liu, S.; Du, Y.; Zhou, J.; Ma, J.; Bonaiuto, F. Bonaiuto, M. Apple or Huawei: Understanding Flow, Brand Image, Brand Identity, Brand Personality and Purchase Intention of Smartphone, Sustainability, 2020, 12 (8), 3391. [CrossRef]
- Febriati, I.; Respati, N.N.R. The Effect of Celebrity Endorser Credibility and Product Quality Mediated by Brand Image on Purchase Intention, American Journal of Humanities and Social Sciences Research (AJHSSR), 2020, 4 (3), 464-470.
- Agmeka, F.; Wathoni, R.; Santoso, A. The Influence of Discount Framing towards Brand Reputation and Brand Image on Purchase Intention and Actual Behaviour in E-commerce, Procedia Computer Science, 2019, 161, 851-858.
- Mursandi, D.; Sudirman, H.; Militina, T. The Impact of Green Marketing and Corporate Social Responsibility on Brand Image, Purchase Intention, and Purchase Decision (Study on The Body Shop in Samarinda), International Journal of Economics, Business and Accounting Research, 2020, 4 (4), 987-999.
- Benhardy, K.A.; Hardiansyah.; Putranto, A.; Ronadi, M. Brand image and price perceptions impact on purchase intentions: mediating brand trust, Management Science Letters, 2020, 10 (14), 3425-3432. [CrossRef]
- Temaja, G.A.; Yasa, N.N.K. The Influence of Word of Mouth on Brand Image and Purchase Intention (A study on the potential customers of Kakiang Garden Cafe Ubud), International Journal of Business Management and Economic Research (IJBMER), 2019, 10 (1), 1552-156.
- Abin, D.; Mandagi, D.; Pasuhuk, L. Influence of Brand Image on Customer Attitude, Intention to Purchase and Satisfaction: The Case of Start-up Brand Pomie Bakery, Enrichment: Journal of Management, 2022, 12 (5), 3907-3917. [CrossRef]
- Alrwashdeh, M.; Emeagwali, O.; Aljuhmani, H. The effect of electronic word of mouth communication on purchase intention and brand image: An applicant smartphone brands in North Cyprus, Management Science Letters, 2019, 9 (4), 505-518.
- Ahmad, A.; Idris, I.; Mason, C.; Chow, S. The Impact of Young Celebrity Endorsements in Social Media Advertisements and Brand Image Towards the Purchase Intention of Young Consumers, International Journal of Financial Research, 2019, 10 (5), 54-65.
- Rahayu, B.; Putri, R.L.; Sutrisno, J. Product Quality Price and Image Brands against Purchase Decisions, Journal of Industrial Engineering and Management, 2023, 1 (1), 21-30.
- Fatimah, H.N.; Nurtantiono, A. Pengaruh Citra Merek, Promosi, Harga, dan Kualitas Pelayanan Terhadap Keputusan Pembelian (Pengguna Aplikasi Shopee), Jurnal Sinar Manajemen, 2022, 9 (1), 106-113. [CrossRef]
- Purba, M.; Harahap, R.A.; Ambarwati, G.; Simbolon, L.G.T. Brand image, price, and product quality on the purchasing decisions of swallow products PT. Garuda Mas Perkasa, International Journal of Economic, Technology and Social Sciences, 2022, 3 (1), 44–54. [CrossRef]
- Wantara, P.; Tambrin, M. The Effect of Price and Product Quality towards Customer Satisfaction and Customer Loyalty on Madura Batik, International Tourism and Hospitality Journal, 2019, 2 (1), 1-9.
- Mappesona, H.; Ikhsani, K.; Ali, H. Customer Purchase Decision Model, Supply Chain Management and Customer Satisfaction: Product Quality and Promotion Analysis, International Journal of Supply Chain Management, 2020, 9 (1), 592-600.
- Fadila, D.; Wahab, Z.; Isnurhadi; Widiyanti, M. The Effect of Brand Image, Brand Ambassador, and Product Quality on the Purchase Decision of Mustika Ratu Products (Study on Sriwijaya University Students), International Journal of Social Sciences, 2021, 4 (1), 182-189. [CrossRef]
- Girsang, N.M.; Rini, E.S.; Gultom, P. The Effect of Brand Image and Product Quality on Re-Purchase Intention with Customer Satisfaction as Intervening Variables in Consumers of Skincare Oriflame Users – A Study on Students of North Sumatra University, Faculty of Economics and Business, European Journal of Management and Marketing Studies, 2020, 5 (1), 40-57. [CrossRef]
- Barreto, J.S.; Dewi, L.K.C.; Ximenes, L. The Influence of Brand Image and Product Quality on Purchase Decisions of Packaged Drinking Water in Liquiça District, DILi – Timor Leste, International Journal of Multicultural and Multireligious Understanding, 2023, 10 (1), 332-340. [CrossRef]
- Pratama, Y.D.; Yunanda, B.D.; Sulaehasari. Faktor-faktor yang Mempengaruhi Keputusan Pembelian Kopi Kopitalisme di Masa Pandemi, Jurnal Revenue Akuntansi, 2022, 2 (2). [CrossRef]
- Siregar, A.P.; Nofirman.; Yusuf, M.; Jayanto, I.; Rahayu, S. The Influence of Taste and Price on Consumer Satisfaction. Quantitative Economics and Management Studies, 2022, 3 (6), 998-1007. [CrossRef]
- Chong, M.H.; Chow, W.Y.; Chow, X.Q.; Lim, C.C.H. Consumer Satisfaction in E-shopping: Shopee Malaysia Case, Asia Pasific Journal of Management and Education (APJME), 2023, 6 (1), 94-107. [CrossRef]
- Rahmatullah, M. Pengaruh Harga, Cita Rasa, Distribusi, dan Kualitas Produk terhadap Keputusan Pembelian Teh Pucuk Harum (Studi pada Generasi Y dan Z di Kota Surabaya). Thesis, Universitas Narotama, Indonesia, 2021.
- Drummond, K.E.; Brefere, L.M. Nutrition for Foodservice and Culinary Professionals. Jhon Wiley and Sons, Publisher: New Jersey, 2021.
- Fauzi, R.U.A.; Permata, Z.I.D.; Setiawan, H. The Influence of Taste and Product Variance on Purchase Decision of Mie Gacoan Madiun, Asian Journal of Management Entrepreneurship and Social Science, 2023, 3 (3), 1072-1088.
- Melda, M.; Arini, E.; Yulinda, A.T. Pengaruh Keragaman Produk, Cita Rasa dan Citra Merek terhadap Keputusan Pembelian, Jurnal Etrepreneur dan Manajemen Sains, 2020, 1 (2).
- Situngkir, M.B.; Rahayu, Y.I.; Zulkifli. Pengaruh Store Atmosphere, Ketersediaan Produk dan Kualitas Pelayanan terhadap Keputusan Pembelian Konsumen, Widyagama National Conference on Economics and Business, 2021, 2 (1).
- Apriando, J. P.; Soesanto, H.; Indriani, F. Pengaruh Kualitas Produk dan Ketersediaan Produk terhadap Keputusan Pembelian dengan Citra Merek Sebagai Variabel Intervening (Studi Pada Konsumen Minuman Energi M-150 di Kota Semarang, Jurnal Sains Pemasaran Indonesia, 2019, 18 (2), 166-183.
- Purnama, I.; Ericca, S.; Hafni, L.; Purba, J.O.; Tjahjana, D.J.S. Promotion Strategies, Distribution, and Product Variations on Offline and Online Purchase Decisions at Aneka Salim Group Pekanbaru, Interconnection: An Economic Perspective Horizon, 2023, 1 (1), 51-58.
- Conlon, C.T.; Mortimer, J.H. Effects of Product Availability: Experimental Evidence, National Bureau of Economic Research, 2010, 16506.
- Akbar, M.; Junaida, E.; Bulan, T. Pengaruh Gaya Hidup dan Ketersediaan Produk terhadap Keputusan Pembelian Sepatu Merek Vans di Kota Langsa, Jurnal Manajemen Akuntansi, 2023, 2 (1), 212-220.
- Rajkumar, A.; Jain, V. A Literature Study on the Product Packaging Influences on the Customers Behavior, The Journal of Contemporary Issues in Business and Government, 2021, 27 (3), 779-785.
- Rambabu, L.; Porika, R. Packaging strategies: knowledge outlook on consumer buying behaviour. journal of industry- university collaboration, 2020, 2(2), 67-78. [CrossRef]
- Gil-Pérez, I.; Rebollar, R.; Lidon, I. Without Words: The Effects of Packaging Imagery on Consumer Perception and Response, Current Opinion in Food Science, 2020, 33, 69-77. [CrossRef]
- Waheed, S.; Khan, M.M.; Ahmad, N. Product Packaging and Consumer Purchase Intentions, Market Forces Research Journal, 2018, 13 (2).
- Suprapto, R.; Azizi, Z.W. Pengaruh Kemasan, Label Halal, Label Izin P-IRT terhadap Keputusan Pembelian Konsumen UMKM Kerupuk Ikan, Jurnal REKOMEN (Riset Ekonomi Manajemen), 2020, 3 (2). [CrossRef]
- Dam, T.C. (2020). Influence of Brand Trust, Perceived Value on Brand Preference and Purchase Intention, Journal of Asian Finance, Economics and Business, 7 (10), 939–947. [CrossRef]
- Salhab, H. A.; Al-Amarneh, A.; Aljabaly, S.M.; Al Zoubi, M.M.; Othman, M. D. The impact of social media marketing on purchase intention: The mediating role of brand trust and image, International Journal of Data and Network Science, 2023, 7 (2), 591–600. [CrossRef]
- Lazaroiu, G.; Negurita, O.; Grecu, L.; Grecu, G.; Mitran, P.C. Consumers' Decision-Making Process on Social Commerce Platforms: Online Trust, Perceived Risk, and Purchase Intentions, Frontiers in Psychology, 2020, 11 (890). [CrossRef]
- Kumar, S.; Talwar, S.; Krishnan, S.; Kaur, P.; Dhir, A. Purchasing natural personal care products in the era of fake news? The moderation effect of brand trust, Journal of Retailing and Consumer Services, 2021, 63, 102668. [CrossRef]
- Sanny, L.; Arina, A.; Maulidya, R. T.; Pertiwi, R.P. Purchase Intention on Indonesia Male's Skincare by Social Media Marketing Effect Towards Brand Image and Brand Trust, Management Science Letters, 2020, 10, 2139-2146. [CrossRef]
- Huo, C.; Hameed, J.; Zhang, M.; Bin Mohd Ali, A.F. Modeling the impact of corporate social responsibility on sustainable purchase intentions: insights into brand trust and brand loyalty, Economic Research-Ekonomska Istraživanja, 2022, 35 (1), 4710-4739. [CrossRef]
- Pradana, F.A.; Sudaryanti, D.; Hidayati, N. The Influence of Brand Image and Brand Trust on Customer Satisfaction through Purchase Decisions as Intervening Variables in Fried Chicken Sabana in Malang City, Budapest International Research and Critics Institute-Journal, 2022, 5 (2), 15323-15334. [CrossRef]
- Suwarno, B. An Analysis of Purchase Decisions on Customer Satisfaction through Customer-Based Brand Equity and Product Innovation: Consequences for Air Conditioner Panasonic in Medan, International Journal of Science, Technology and Management, 2022. [CrossRef]
- Prianggoro, N.F.; Sitio, A. Effect of Service Quality and Promotion on Purchase Decisions and Their Implications on Customer Satisfaction, International Journal of Engineering Technologies and Management Research, 2019, 6 (6), 51-62. [CrossRef]
- Chaeruddin, S.M.; Syafarudin, A. The Effect of Product Quality, Service Quality, Price on Product Purchasing Decisions on Consumer Satisfaction, Illomata International Journal of Tax and Accounting, 2021, 2 (1), 61-70. [CrossRef]
- Lee, V.; Park, S.; Lee, D.H. The Effect of E-commerce Servi ce Quali ty Factors on Customer Satisfaction, Purchase Intention, and Actual Purchase in Uzbekistan, Global Business and Finance Review, 2022, 27 (3), 56-74. [CrossRef]
- Khatoon, S.; Zhengliang, X.; Hussain, H. The Mediating Effect of Customer Satisfaction on the Relationship Between Electronic Banking Service Quality and Customer Purchase Intention: Evidence from the Qatar Banking Sector, SAGE Journals, 2020, 10 (2). [CrossRef]
- Mirza, F.; Younus, S.; Waheed, N.; Javaid, A. Investigating the Impact of Product-Related and Service Quality Attributes on Re-Purchase Intention: Role of Customer Characteristics and Customer Satisfaction, International Journal of Research in Business And Social Science, 2021, 10 (3), 24-35. [CrossRef]
- Maffett, M.G.; Brusa, J.O. The Effect of Online Advertising on Consumer Buying Interest in Online Selling Applications with Customer Satisfaction as an Intervening Variable (Case Study of Medical Doctor And Nurses In Chicago), MEDALION JOURNAL: Medical Research, Nursing, Health and Midwife Participation, 2022, 3 (4). [CrossRef]
- Wibisono, E.S. Pengaruh Kualitas Produk, Harga, dan Kepuasan Konsumen terhadap Keputusan Pembelian Konsumen UD. Rizky Barokah di Balongbendo. Thesis, Universitas Bhayangkara, Indonesia, 2019.
- Arif, M.; Siregar, I.K. Purchase Decision Affects, Price, Product Quality and Word of Mouth, International Journal of Economic, Technology and Social Sciences, 2021, 2 (1), 260 – 273. [CrossRef]
- Han, W. Purchasing Decision-Making Process of Online Consumers Based on the Five-Stage Model of the Consumer Buying Process, Advances in Social Science, Education and Humanities Research, 2021, 586. [CrossRef]
- Hanaysha, J.R. Impact of Social Media Marketing Features on Consumer's Purchase Decision in the Fast- Food Industry: Brand Trust as a Mediator, International Journal of Information Management Data Insights, 2022, 2 (2). [CrossRef]
- Tamene, E.H. Theorizing Conceptual Framework, Asian Journal of Educational Research, 2016, 4 (2), 50-56.
- Mensah, R.O.; Agyemang, F.; Acquah, A.; Babah, P.A.; Dontoh, J. Discourses on conceptual and theoretical frameworks in research: Meaning and implications for researchers. J. Afr. Interdiscip. Stud. 2020, 4, 53–64.
- Sugiyono. Metode Penelitian Pendidikan Pendekatan Kuantitatif, Kualitatif dan R&D. Alfabeta: Bandung, 2013.
- Alwi, I. Kriteria Empirik Dalam Menentukan Ukuran Sampel Pada Pengujian Hipotesis Statistika dan Analisis Butir, Jurnal Formatif, 2012, 2 (2), 140-148.
- Tampil, Y.; Komaliq, H.; Langi, Y. Analisis Regresi Logistik Untuk Menentukan Faktor-Faktor yang Mempengaruhi Indeks Prestasi Kumulatif (IPK) Mahasiswa FMIPA Universitas Sam Ratulangi Manado. Jurnal Matematika dan Aplikasi, 2017, 6(2), 56-65. [CrossRef]
- Roflin, E.; Riana, F.; Munarsih, E.; Pariyana; Liberty, I. A. Regresi Logistik Biner dan Multinomial. PT Nasya Expanding Management: Pekalongan, 2023.
- Hastoko, Y.P.; Wati, W.R. Pengaruh Kualitas Produk, Citra Merek, dan Kepercayaan Merek terhadap Keputusan Pembelian di Burger King Trans Studio Mall Cibubur, Jurnal Ilmiah Multi Disiplin Indonesia, 2022, 2 (1), 188-203. [CrossRef]
- Adhitama, B. W.; Laily, N. Pengaruh Citra Merek, Kualitas Produk, Harga, dan Gaya Hidup terhadap Keputusan Pembelian Sarden Bantan Dibanyuwangi, Jurnal Ilmu dan Riset Manajemen, 2021, 10 (5), 1-16.
- Ardini, M.; Gustiana, C.; Anzitha, S. Analisis Pengaruh Preferensi Konsumen terhadap Keputusan Pembelian Ikan Bandeng (Chanos Chanos) di Kecamatan Seruway Kabupaten Aceh Tamiang, Jurnal Inovasi Penelitian, 2022, 2 (11). [CrossRef]
- Anwar, M.; Andrean, D. The Effect of Perceived Quality, Brand Image, and Price of Perception on Purchase Decision, Advances in Economics, Business and Management Research, 2020, 176.
- Pratiwi, A.; Junaedi, D.; Prasetyo, A. Pengaruh Harga terhadap Keputusan Pembelian Konsumen: Studi Kasus 212 Mark Cikaret, Jurnal Kajian Ekonomi & Bisnis Islam, 2020, 2 (2), 150-160. [CrossRef]
- Sari, F.N.; Mulyani, I.D. Pengaruh Cita Rasa dan Harga terhadap Keputusan Pembelian Kerupuk Udang Sinar Jaya Kaligangsa Brebes, Journal Economics and Management (JECMA), 2021, 2 (1), 19-27. [CrossRef]
- Salsabila, N.A.; Firmansyah. H.; Ferrianta, Y. Analisis Pengaruh Cita Rasa, Word of Mouth dan Promosi Melalui Media Sosial terhadap Keputusan Pembelian (Studi Kasus Rumah Makan Ngikan Skip Lama Kota Banjarmasin), Frontier Agribusiness, 2021, 5 (2), 85-92. [CrossRef]
- Juliany, E. Analisis Pengaruh Ketersediaan Produk, Fasilitas, Kualitas Pelayanan dan Lokasi terhadap Keputusan Pembelian Konsumen dalam Pembelian Bahan Bakar Minyak Jenis Pertalite di Rantauprapat (Studi Kasus SPBU PT. Kusuma Jaya Makmur 14.214.225), Ekonomi Bisnis Manajemen dan Akuntansi (EBMA), 2021, 2 (1), 162-173.
- Putri, M.; Firmansyah, D. Pengaruh Variasi Produk dan Kemasan terhadap Keputusan Pembelian (Study Kasus pada Home Industry Bintang Bakery Kabupaten Bireuen, Artikel Penelitian, 2022, 14 (3). [CrossRef]
- Sampara, N. Pengaruh Kemasan, Harga dan Promosi terhadap Keputusan Pembelian pada Produk Roti Mantao (Sinar Terang), Kota Madya Parepare, Indonesian Journal of Intellectual Publication, 2022, 12 (3). [CrossRef]
- Ghofur, A.; Supriyono. Pengaruh Citra Merek dan Kepercayaan Merek terhadap Loyalitas Merek Sego Njamoer (Studi pada Gerai Sego Njamoer Foodcourt Royal Plaza Surabaya, Jurnal E-Bis (Ekonomi-Bisnis), 2021, 5 (2): 380-394. [CrossRef]
- Rahayu, T. Pengaruh Kepercayaan Merek dan Persepsi Kualitas terhadap Keputusan Pembelian Ikan Kaleng Mackarel ABC pada Perumahan Mustamindo Permai Kecamatan Tambang Kabupaten Kampar. Thesis, Universitas Islam Negeri Sultan Syarif Kasim Riau, Indonesia, 2020.
- Mukuan, K.; Mandey, S.L.; Tampenawas, J.L.A. Pengaruh Kepuasan dan Kepercayaan Pelanggan terhadap Keputusan Pembelian Makanan di Rumah Makan Maji Ayam Geprek Cabang Jalan Bethesda Sario, Jurnal EMBA, 2023, 11 (4), 642-652. [CrossRef]
- Marpaung, B.; Mekaniwati, A. Pengaruh Kualitas Produk, Harga, Promosi dan Pelayanan terhadap Kepuasan Konsumen serta Dampaknya pada Keputusan Pembelian Studi pada Konsumen Alat Mesin Pengolah Kopi di PT. Karya Mitra Usaha, Jurnal Ilmiah Manajemen Kesatuan, 2020, 8 (1), 29-38. [CrossRef]
- Steenbergen, M.R.; Jones, B.S. Modeling multilevel data structures. Am. J. Political Sci, 2002, 46, 1.
- Ghozali, I. Aplikasi Analisis Multivariate Dengan Program IBM SPSS 25 Ed. 9. Badan Penerbit Universitas Diponegoro: Semarang, 2018.
- Santoso, A. B. Tutorial & Solusi Pengolahan Data Regresi. Indonesia, 2018.
- Ospina, P.A.; Nydam, D.V.; DiCiccio, T.J. Technical note: the risk ratio, an alternative to the odds ratio for estimating the association between multiple risk factors and a dichotomous outcome, J. Dairy Sci., 2012, 95, 5. [CrossRef]
- Yusuf, A. The Influence of Product Innovation and Brand Image on Customer Purchase Decision on Oppo Smartphone Products in South Tangerang City, Budapest international research and critics institute-journal, 2021, 4 (1), 472-481. [CrossRef]
- Rivai, J.; Zulfitri. The Role of Purchasing Decisions Mediating Product Quality, Price Perception, and Brand Image on Customer Satisfaction of Kopi Janji Jiwa. Journal of Business and Management Studies, 2021, 3 (2), 31-42. [CrossRef]
- Etikan, I.; Musa, S. A.; Alkassim, R. S. Comparison of Convenience Sampling and Purposive Sampling, American Journal of Theoretical and Applied Statistics, 2016, 5 (1), 1-4. [CrossRef]
Figure 1.
The conceptual framework of this research.
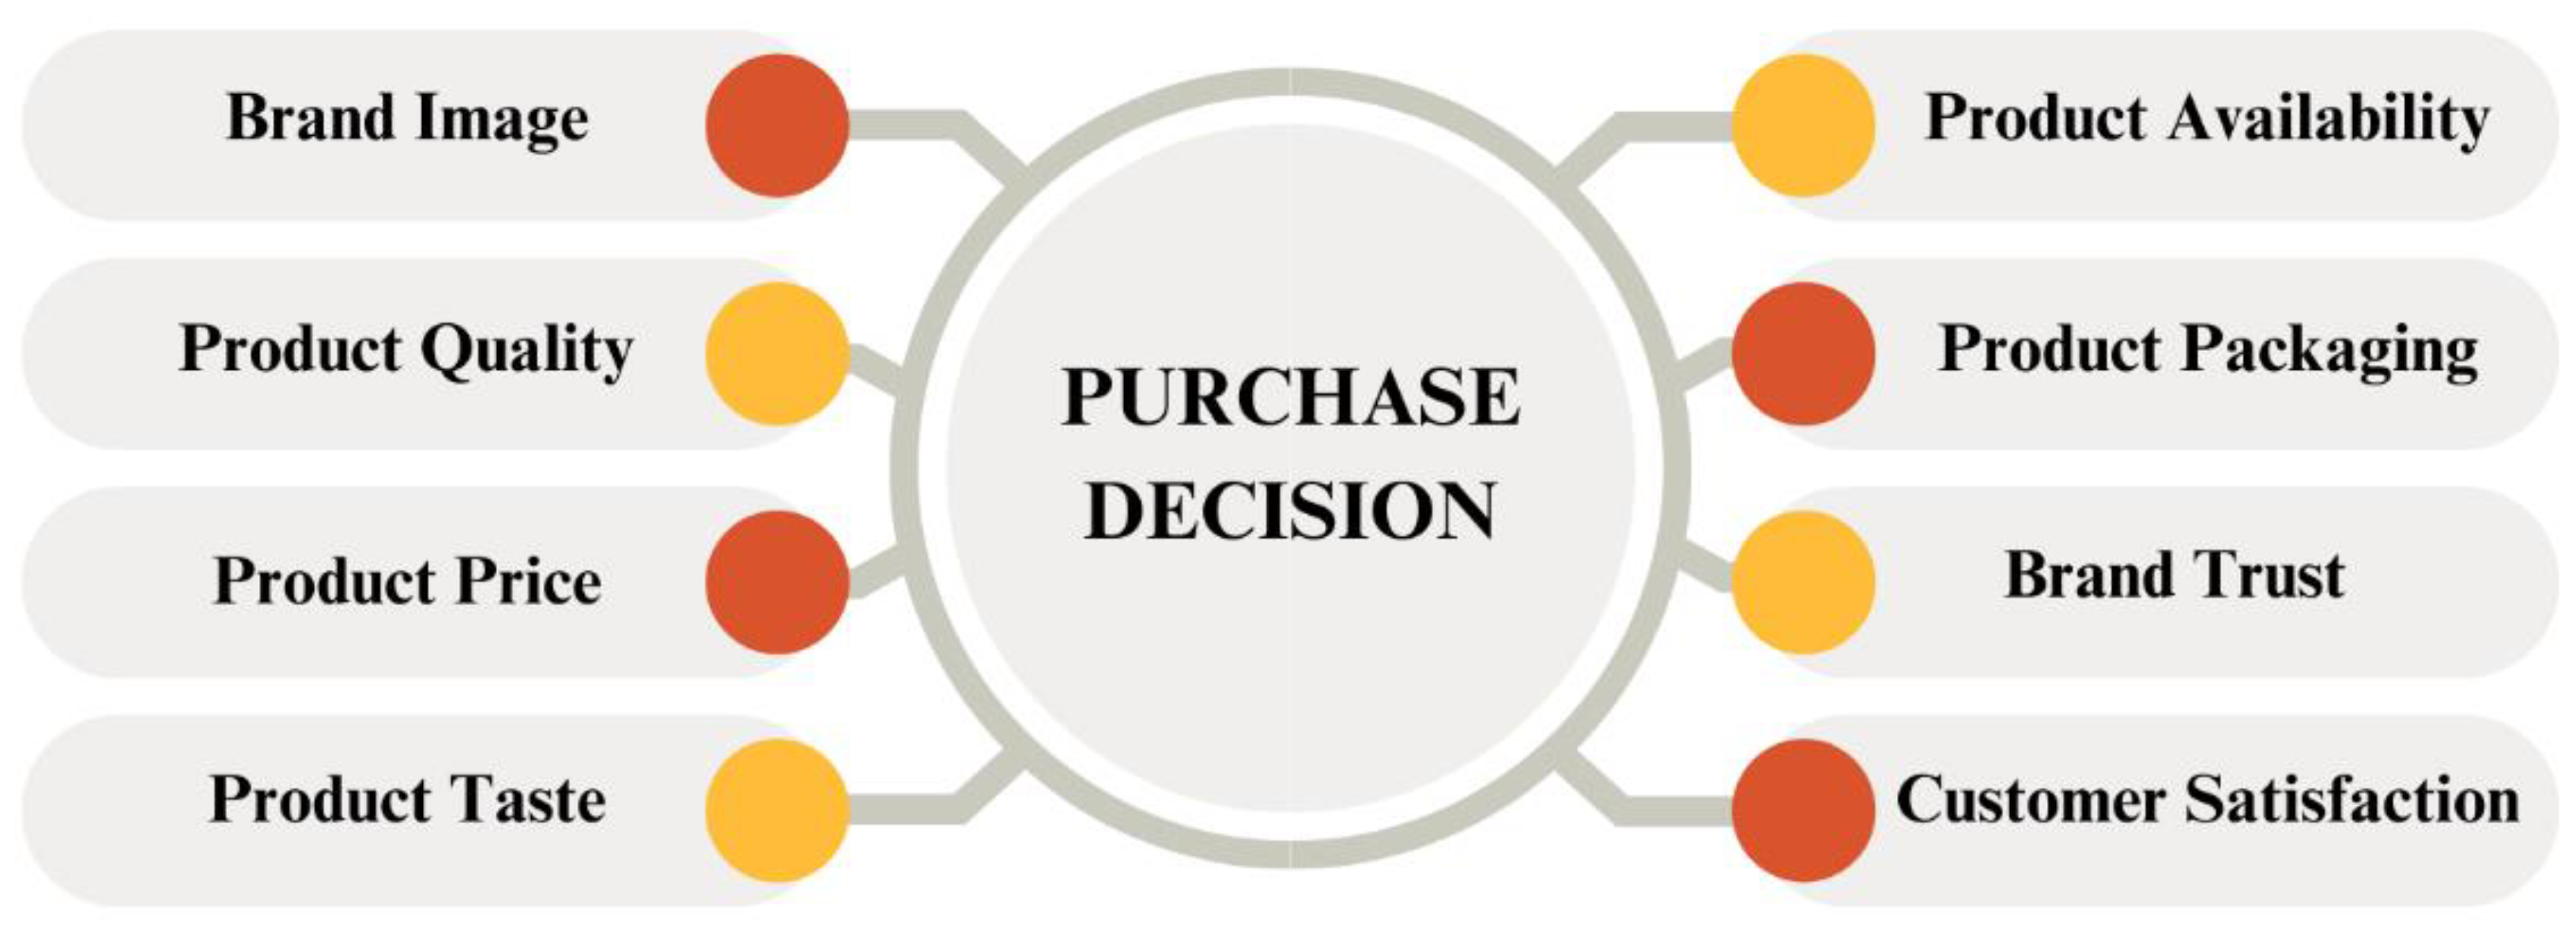
Figure 2.
Research Location Map.
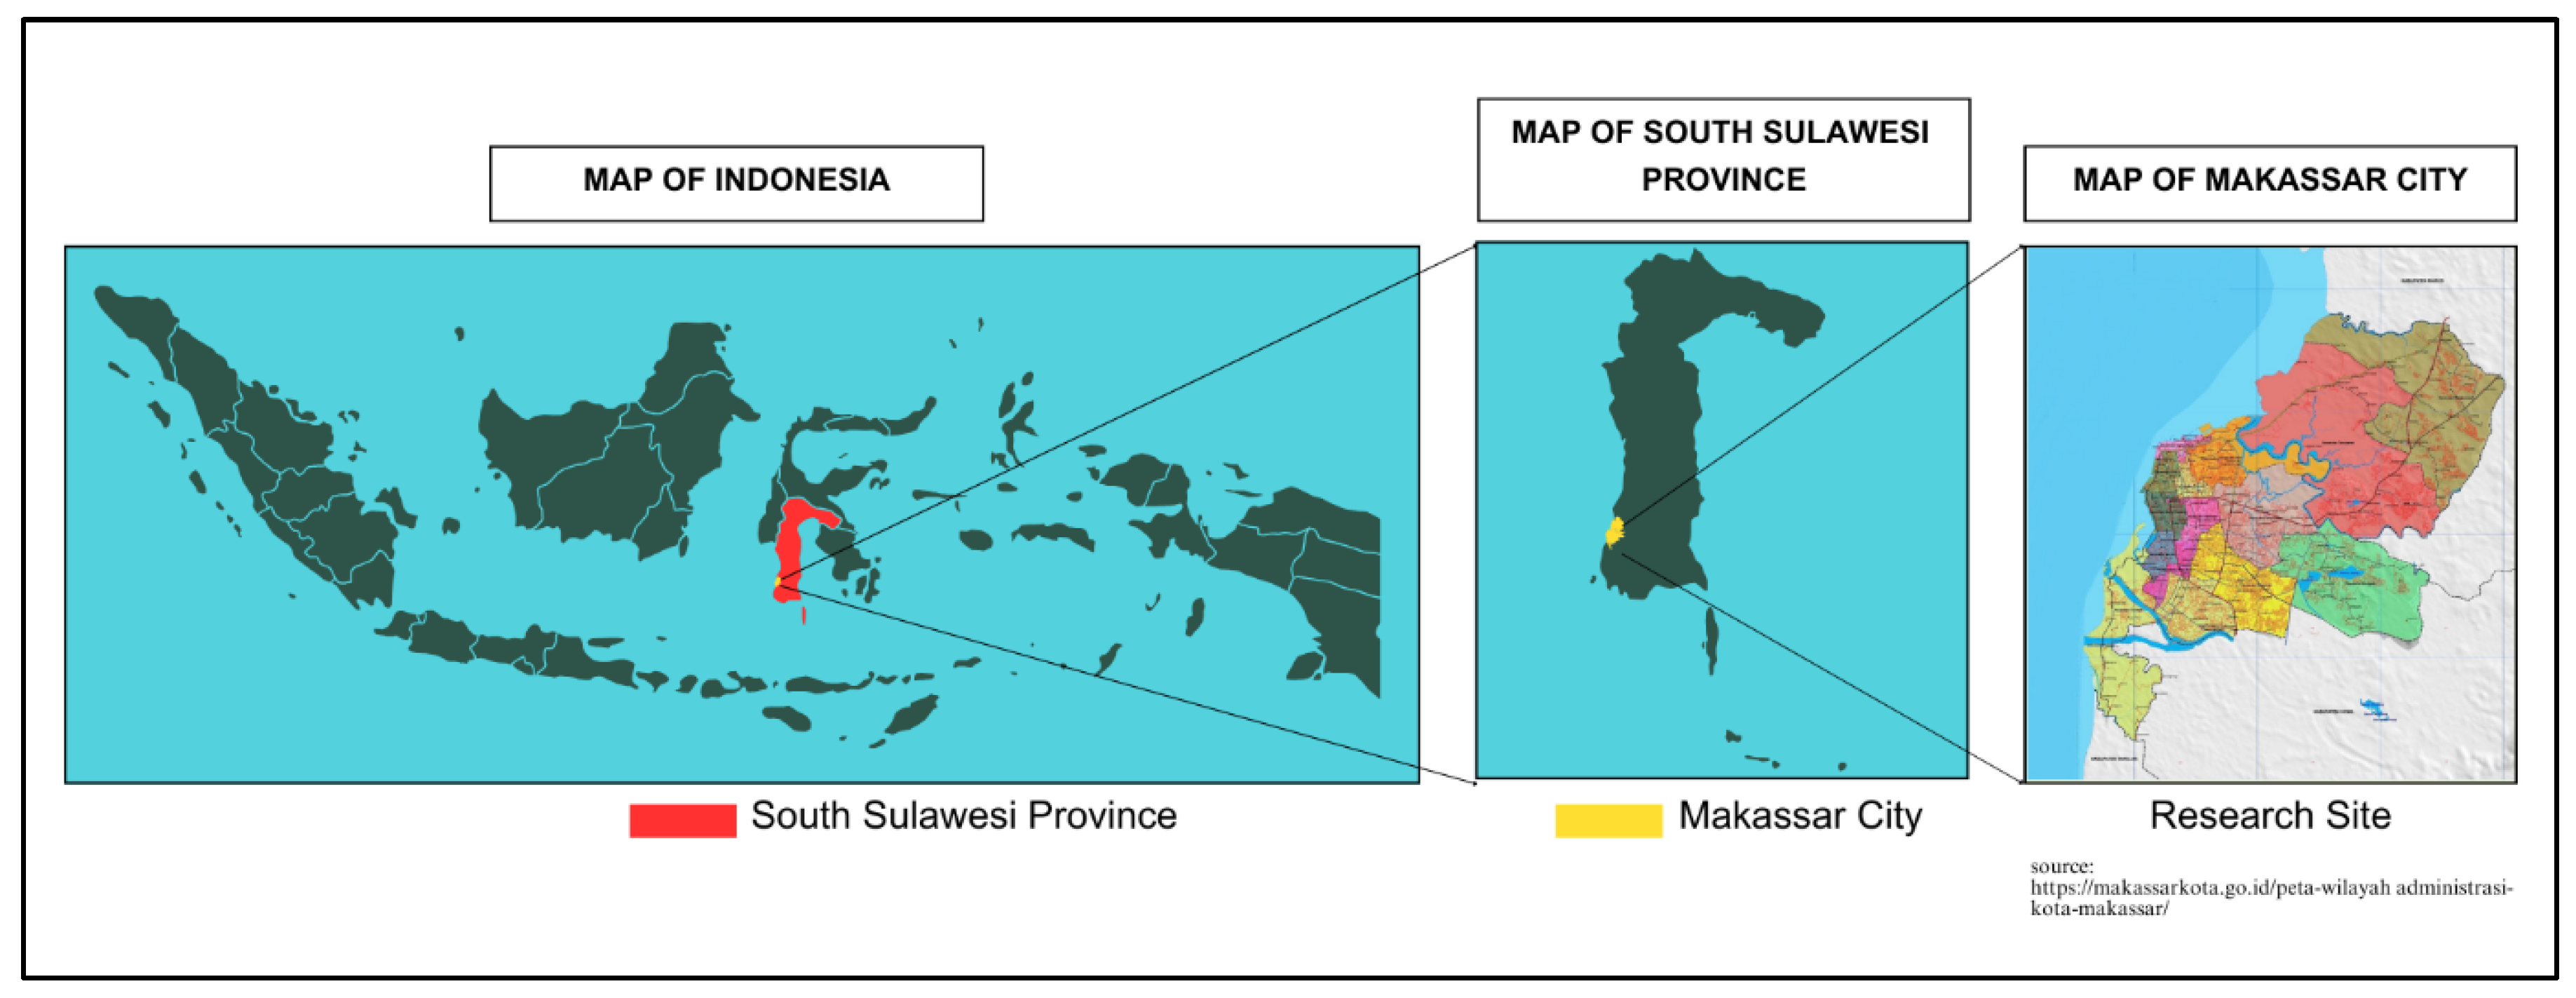
Figure 3.
Average/Capita Consumption/Week According to Canned Fish Groups in Each Regency/City in South Sulawesi Province (2022).
Figure 3.
Average/Capita Consumption/Week According to Canned Fish Groups in Each Regency/City in South Sulawesi Province (2022).
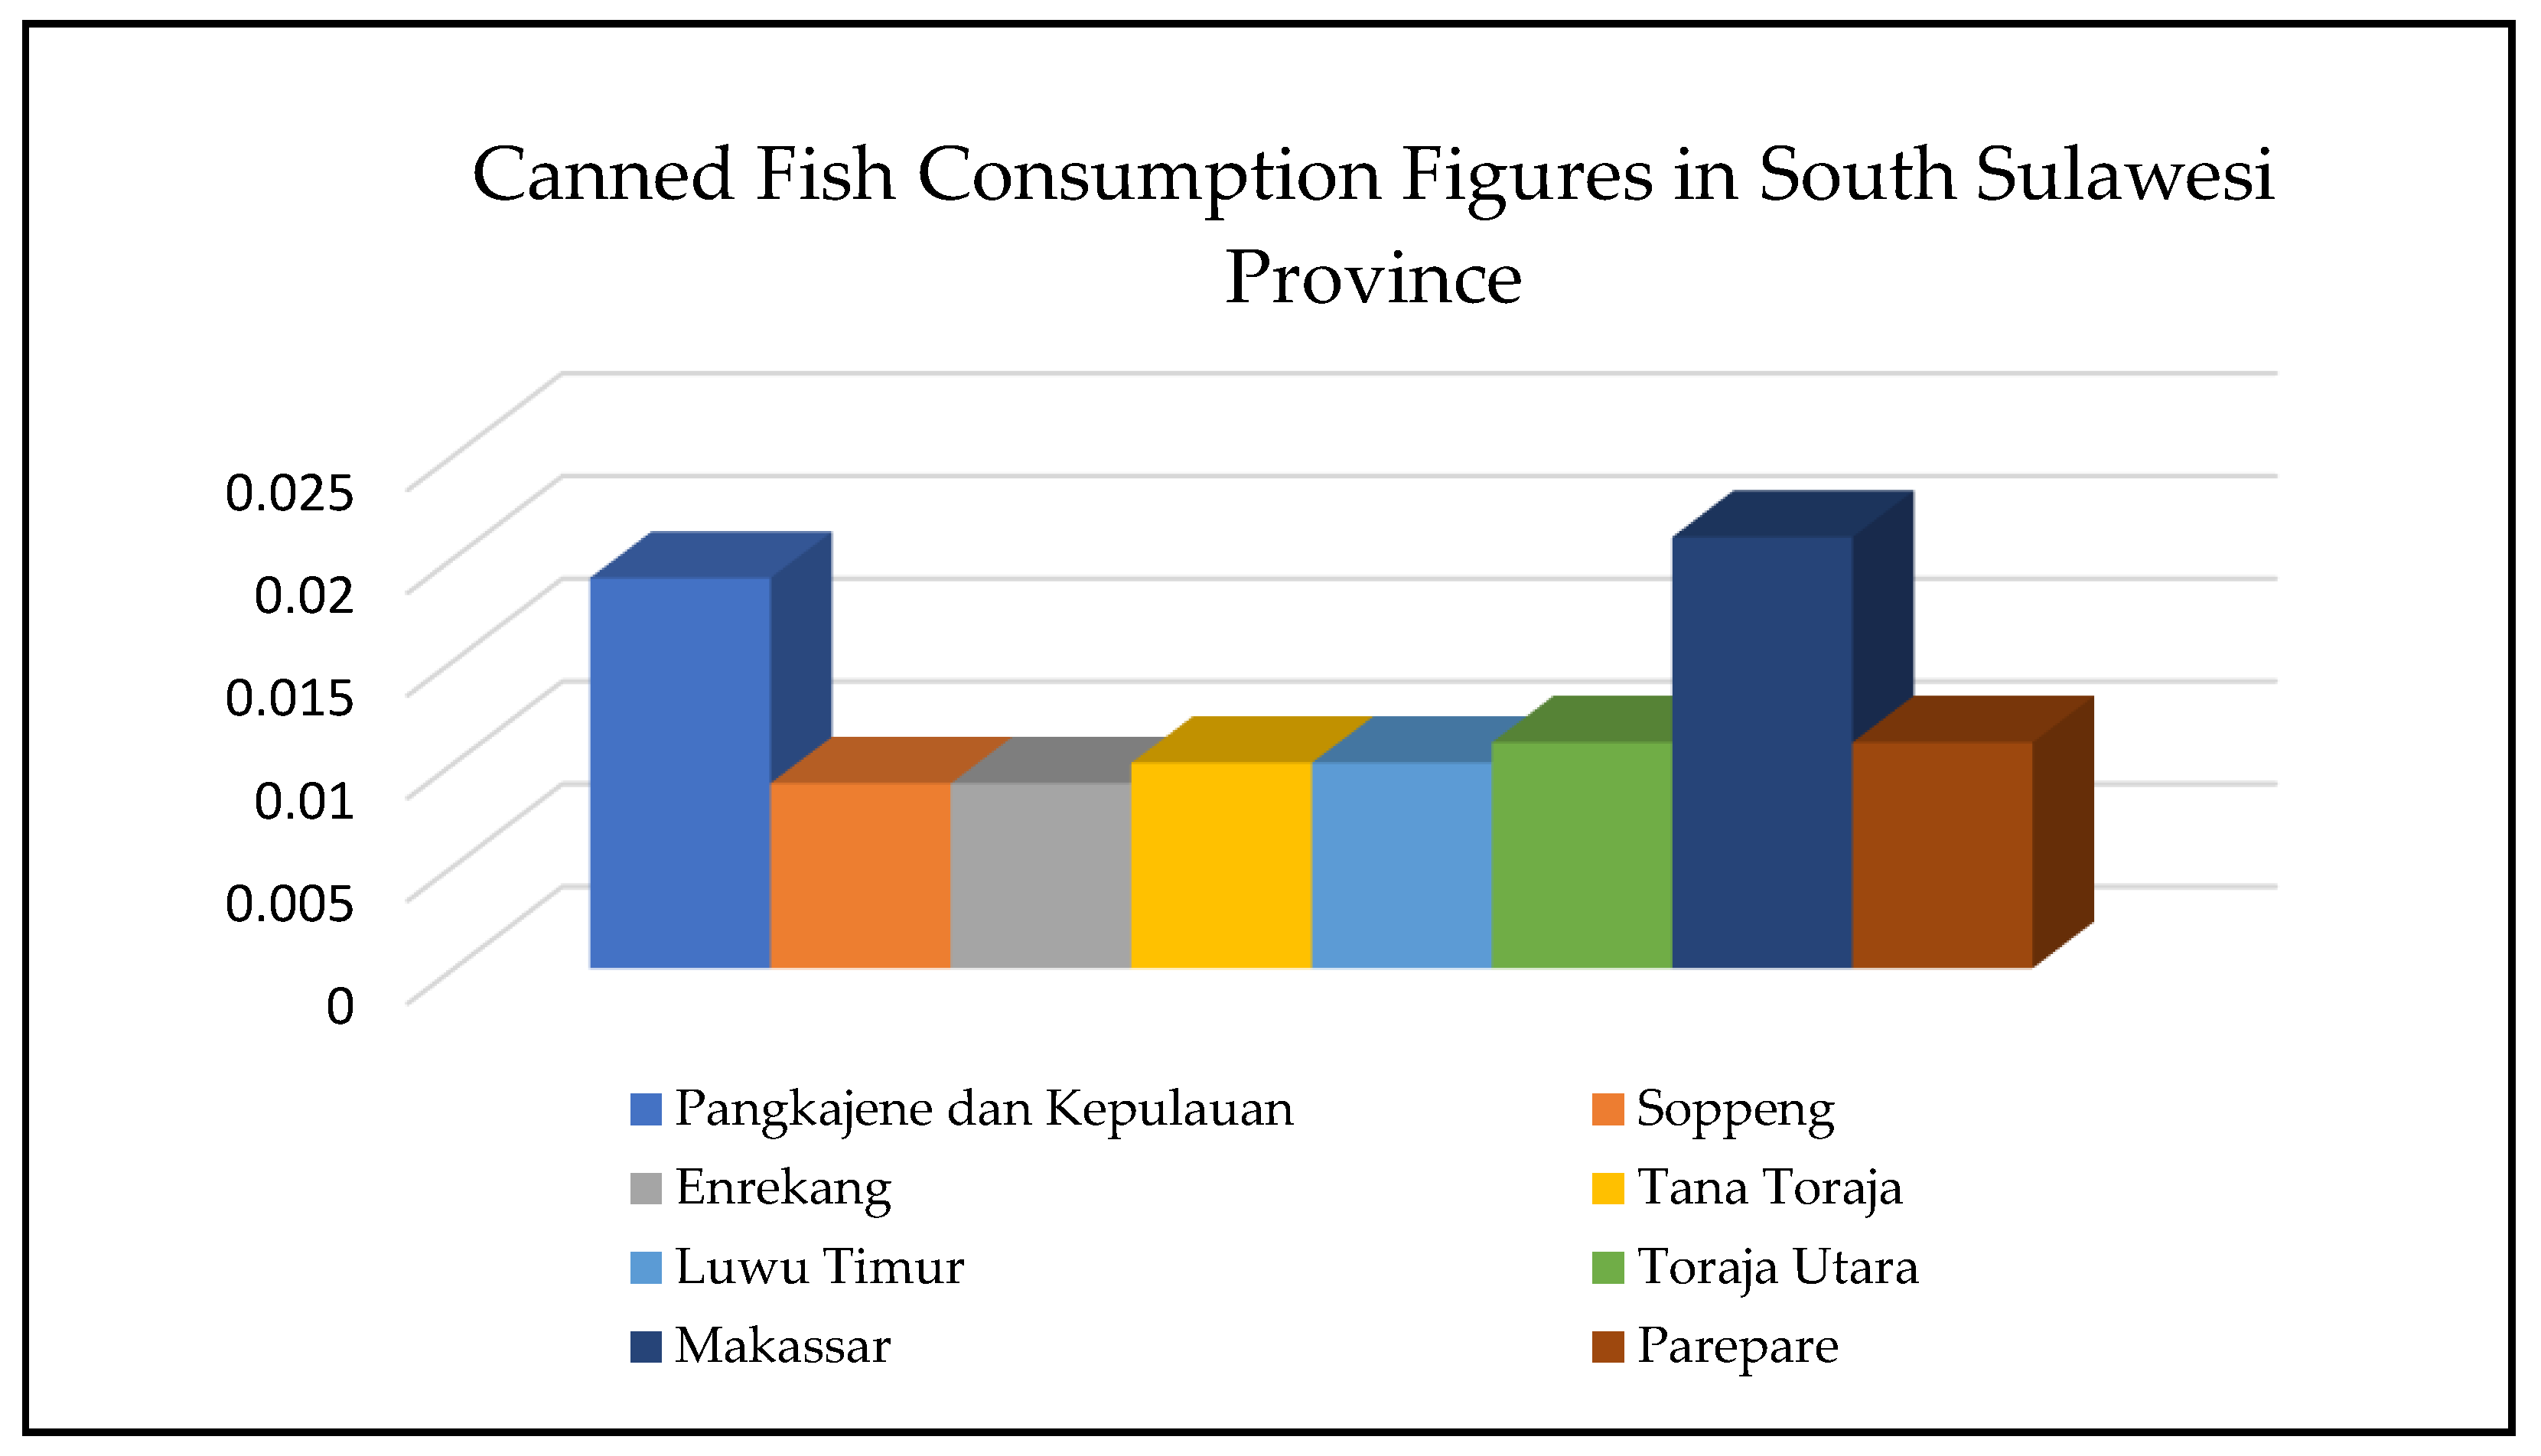
Figure 4.
Distribution of Respondents in Various Sub-Districts in Makassar City.
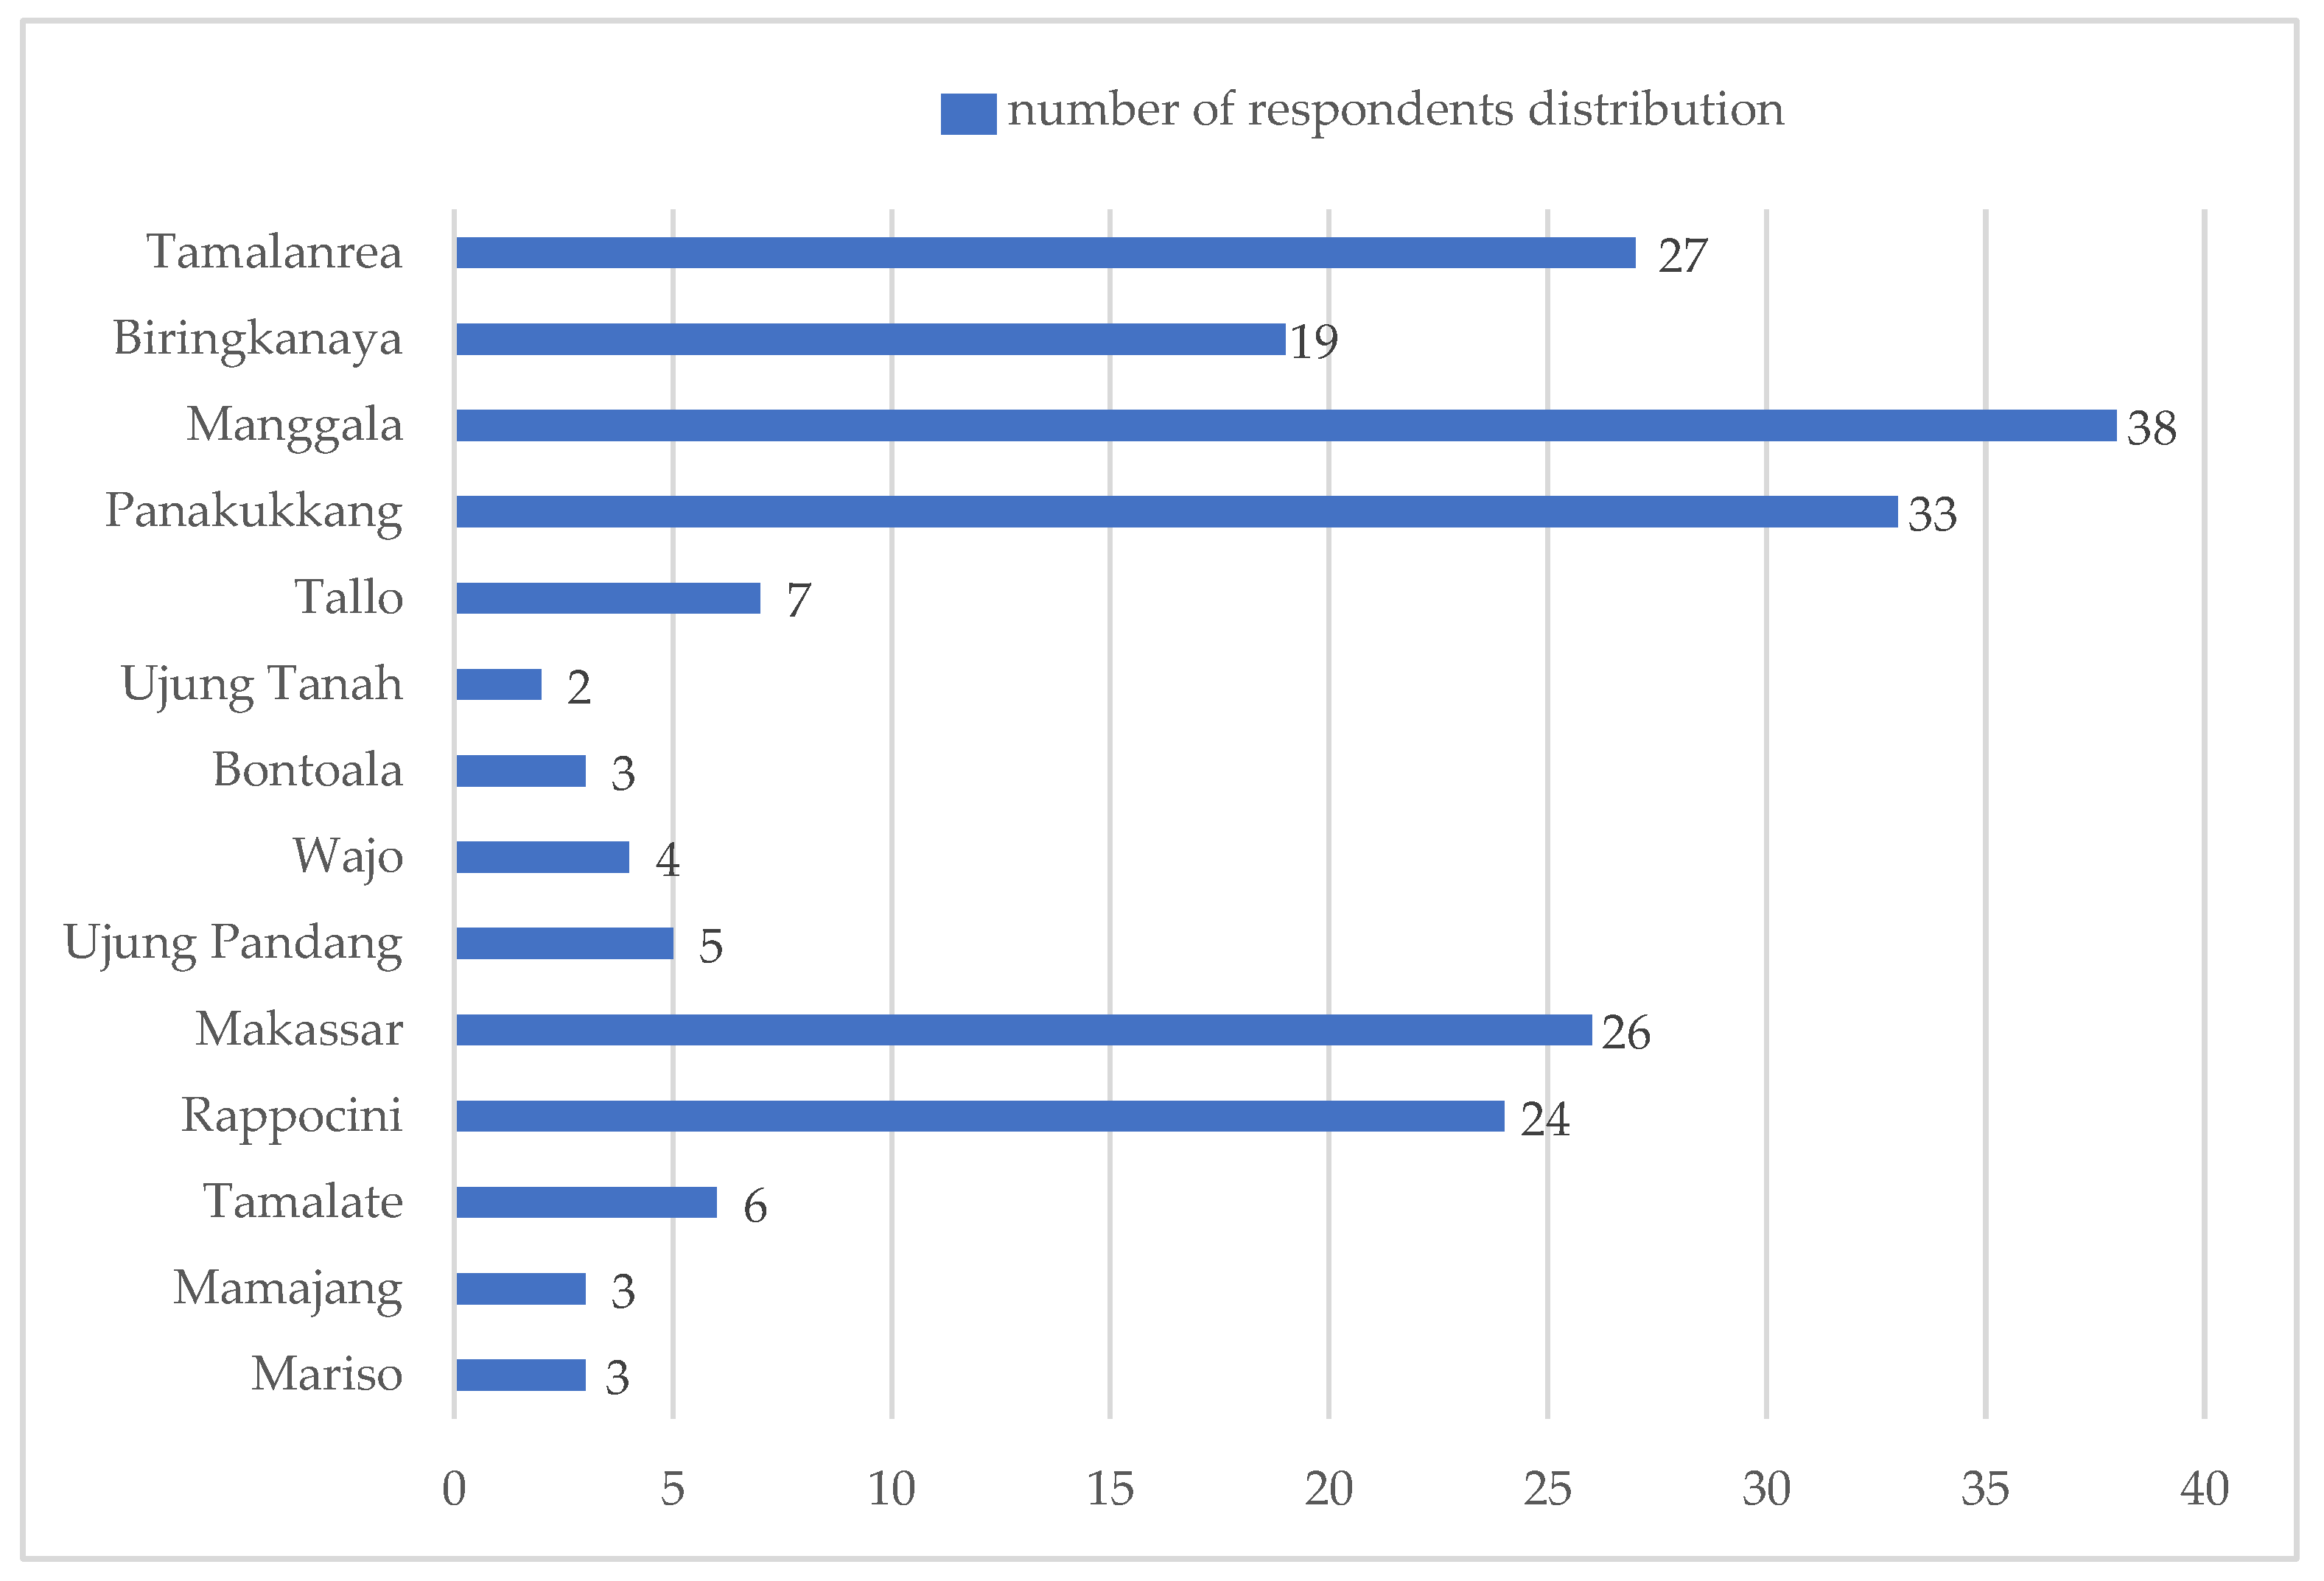
Figure 5.
Graphical Summary.
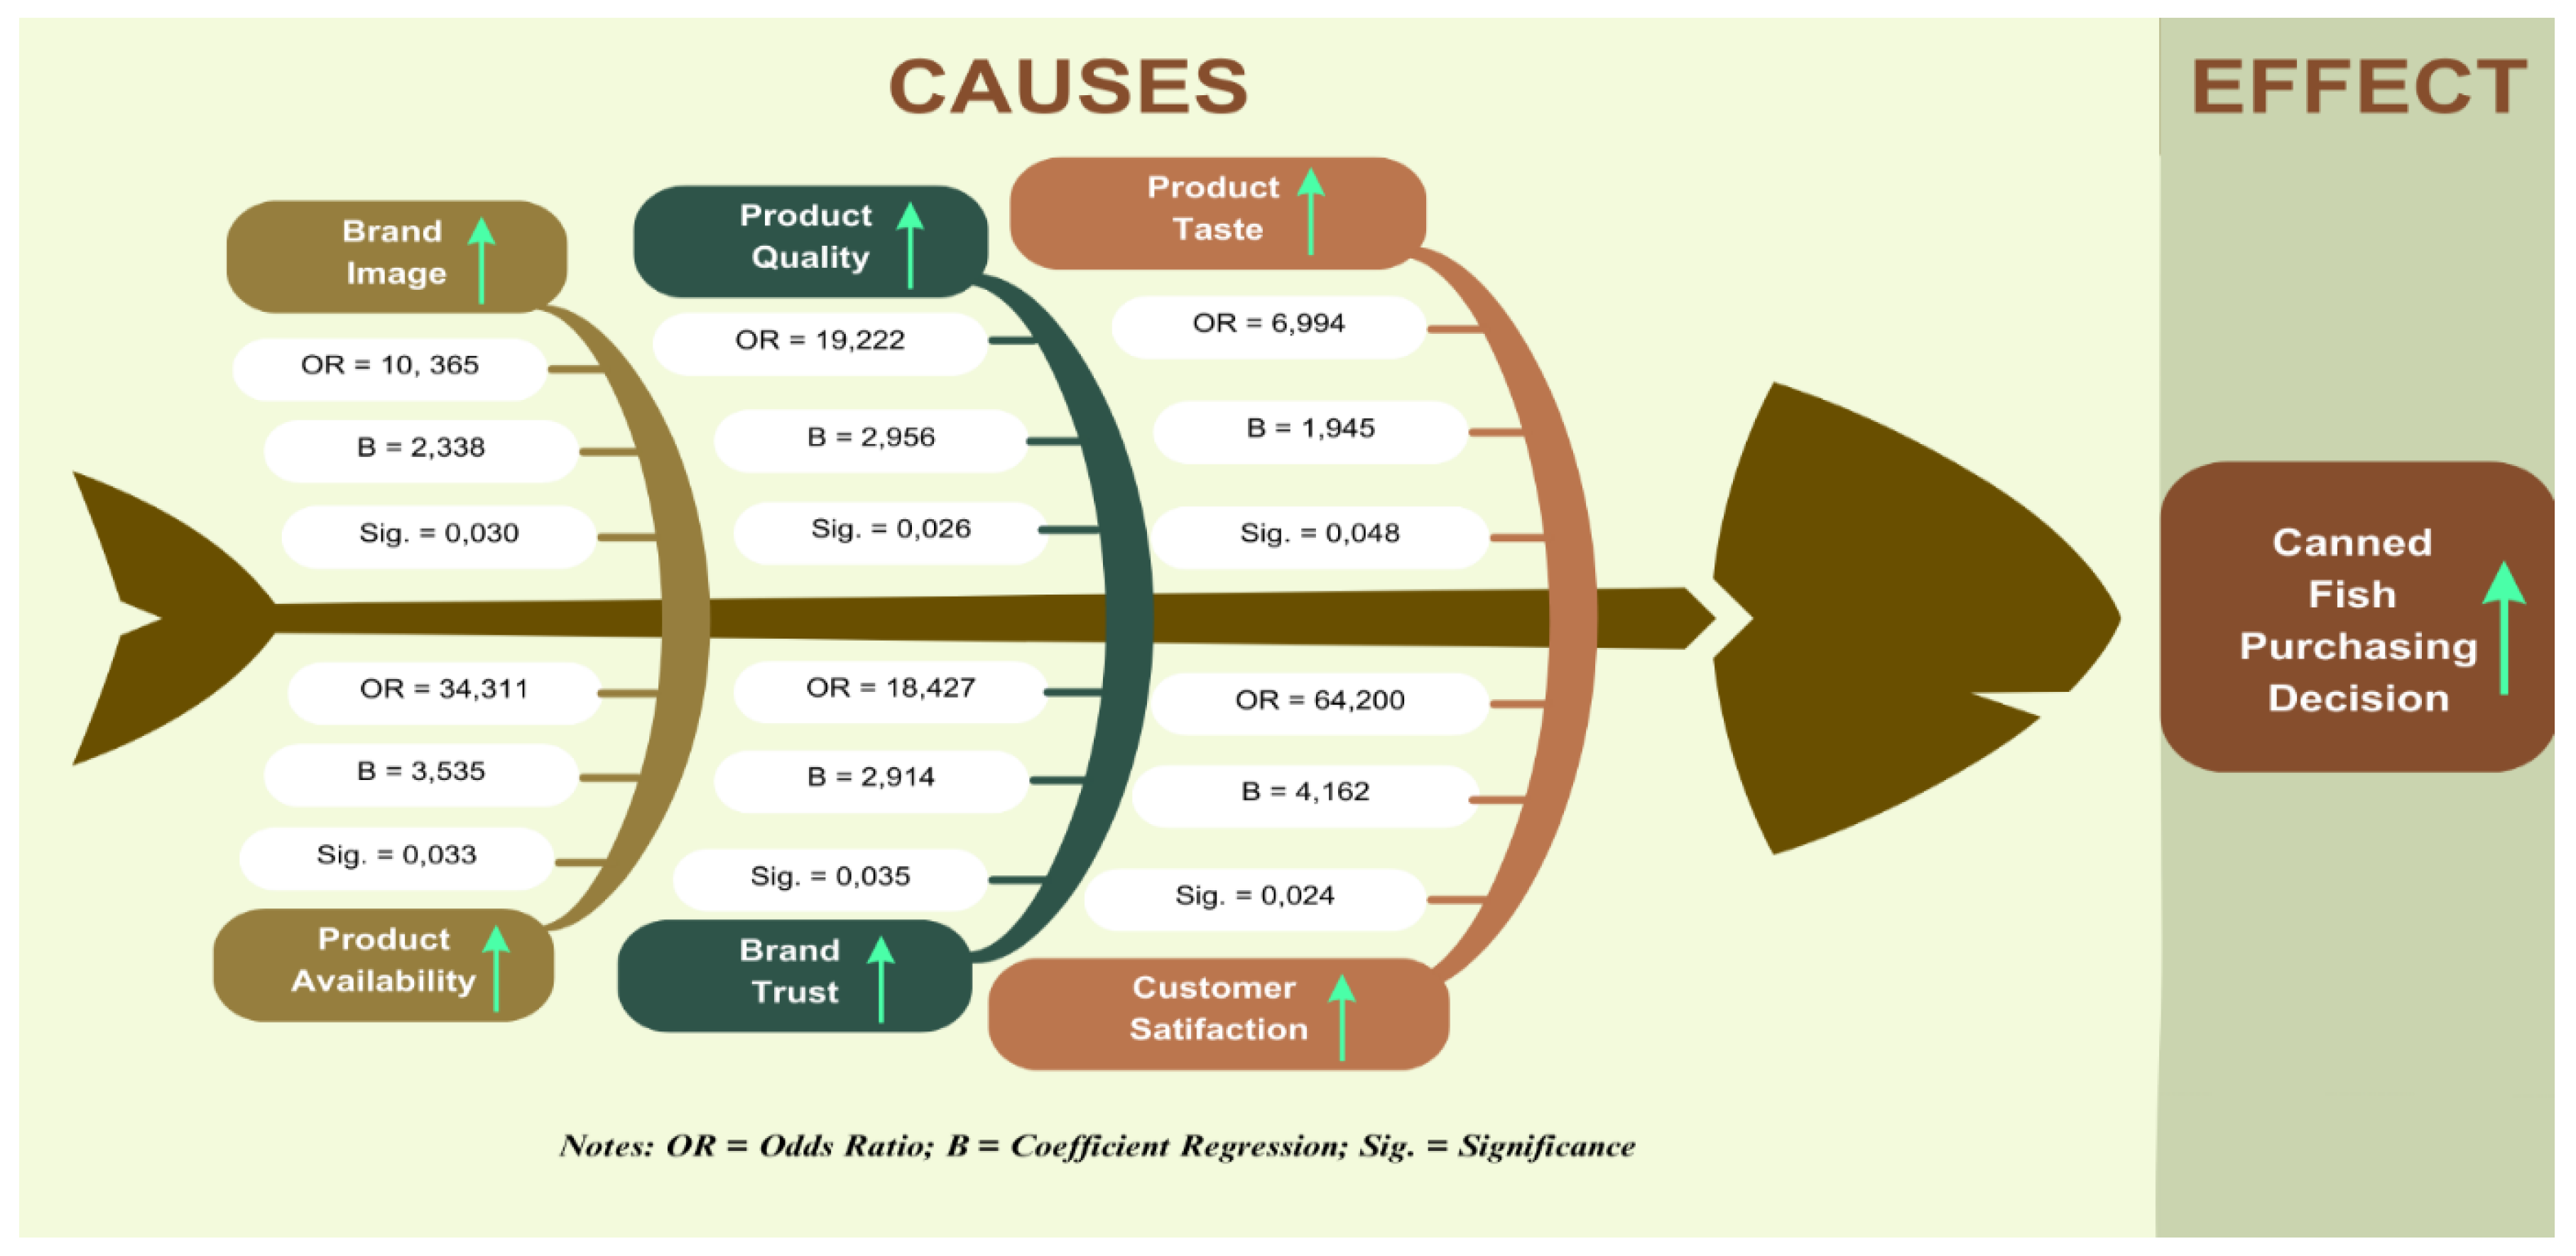

Table 1.
Research Statement, Hypothesis Development, and Measurement Unit.
| Hypothesis Development | |||||
|
Variables (symbol) |
Research statement |
Expected results | Hypothesis statement | Measurement unit |
Hypothesis rationale references |
| |||||
|
Purchase Decision (PD) |
Consumers purchasing canned fish with the ABC brand within the past year. (1 = if consumer purchasing; 0 = otherwise | ||||
| B. Independent variables | |||||
| Brand Image (BIM) | Consumers recognize the canned fish product brand as a brand with an image that is positive | +/SIG. | H0: There is no significant effect of the brand image of canned fish purchasing decision H1: there is a positive and statically significant effect on the brand image on canned fish purchasing decision |
5PLS | [95, 96, 47] |
| Product Quality (PQU) | Canned Fish products' brand quality follows the specifications set. | +/SIG. | H0: There is no significant effect of the brand image of canned fish purchasing decision H1: there is a positive and statically significant effect on the brand image on canned fish purchasing decision |
5PLS | [97, 54, 19] |
| Product Price (PPR) | Canned fish products have a good price and are affordable. | +/SIG. | H0: There is no significant effect of the brand image of canned fish purchasing decision H1: there is a positive and statically significant effect on the brand image on canned fish purchasing decision |
5PLS | [98, 99, 57] |
| Product Taste (PTS) | canned fish product brand has a good taste and is delicious. | +/SIG. | H0: There is no significant effect of the brand image of canned fish purchasing decision H1: there is a positive and statically significant effect on the brand image on canned fish purchasing decision |
5PLS | [100, 101, 60] |
| Product Availability (PAV) | Canned fish products is easily found in various stores/supermarkets | +/SIG. | H0: There is no significant effect of the brand image of canned fish purchasing decision H1: there is a positive and statically significant effect on the brand image on canned fish purchasing decision |
5PLS | [102, 65] |
| Product Packaging (PPG) | Canned fish products has attractive packaging | +/SIG. | H0: There is no significant effect of the brand image of canned fish purchasing decision H1: there is a positive and statically significant effect on the brand image on canned fish purchasing decision |
5PLS | [103, 104, 70] |
| Brand Trust (BTR) | Consumers believe that canned fish products are guaranteed to be of high quality. | +/SIG. | H0: There is no significant effect of the brand image of canned fish purchasing decision H1: there is a positive and statically significant effect on the brand image on canned fish purchasing decision |
5PLS | [105, 106, 77] |
| Customer Satisfaction (CSF) | Consumers were satisfied after consuming canned fish products. | +/SIG. | H0: There is no significant effect of the brand image of canned fish purchasing decision H1: there is a positive and statically significant effect on the brand image on canned fish purchasing decision |
5PLS | [107, 108, 85] |
| Notes: +/SIG = Positive and Significant; 5PLS = 5 Point Likert Scale (5 = strongly agree; 4 = agree; 3 = neutral; 2 = disagree; 1 = strongly disagree | |||||
Table 2.
Goodness of Fit Test Results.
| Hosmer and Lemeshow Test | |||
| Step | Chi-square | df | Sig. |
| 1 | 0.485 | 8 | 1.000 |
Table 3.
Nagelkerke R-square Test Results.
| Hosmer and Lemeshow Test | |||
| Step | -2 Log likelihood | Cox and Snell R Square | Nagelkerke R Square |
| 1 | 25.011a | 0,477 | 0,886 |
Table 4.
Omnibus Tests of Model Coefficients Results.
| Omnibus Tests of Model Coefficients | ||||
| Chi-square | df | Sig. | ||
| Step 1 | Step | 129,543 | 8 | 0,000 |
| Block | 129,543 | 8 | 0,000 | |
| Model | 129,543 | 8 | 0,000 | |
Table 5.
Wald Test Results.
| Dependent Variables: Canned Fish Purchasing Decision (PD) | |||||||
| Symbol | Independent Variables | B | S.E. | Wald | df | Sig. | Exp(B) |
| BIM | Brand Image | 2.338 | 1.079 | 4.699 | 1 | .030** | 10.365 |
| PQU | Product Quality | 2.956 | 1.324 | 4.983 | 1 | .026** | 19.222 |
| PPR | Product Price | 0.616 | .842 | 0.536 | 1 | .464 | 1.852 |
| PTS | Product Taste | 1.945 | .985 | 3.899 | 1 | .048** | 6.994 |
| PAV | Product Availability | 3.535 | 1.658 | 4.548 | 1 | .033** | 34.311 |
| PPG | Product Packaging | -0.714 | .943 | 0.573 | 1 | .449 | .490 |
| BTR | Brand Trust | 2.914 | 1.384 | 4.430 | 1 | .035** | 18.427 |
| CSF | Consumer Satisfaction | 4.162 | 1.841 | 5.111 | 1 | .024** | 64.200 |
| Constant | -63.235 | 21.716 | 8.479 | 1 | .004 | .000 | |
| Note: **Significance at the confidence level of 95% (α = 0.05) | |||||||
Disclaimer/Publisher’s Note: The statements, opinions and data contained in all publications are solely those of the individual author(s) and contributor(s) and not of MDPI and/or the editor(s). MDPI and/or the editor(s) disclaim responsibility for any injury to people or property resulting from any ideas, methods, instructions or products referred to in the content. |
© 2025 by the authors. Licensee MDPI, Basel, Switzerland. This article is an open access article distributed under the terms and conditions of the Creative Commons Attribution (CC BY) license (http://creativecommons.org/licenses/by/4.0/).
Copyright: This open access article is published under a Creative Commons CC BY 4.0 license, which permit the free download, distribution, and reuse, provided that the author and preprint are cited in any reuse.


