
Submitted:
27 January 2025
Posted:
28 January 2025
You are already at the latest version
Abstract
Oxidative stress is a significant factor affecting reproductive efficiency in dairy cows, contributing to conditions such as endometritis that impair fertility and milk production. This study investigates the molecular mechanisms by which bta-let-7d modulates oxidative stress responses induced by potassium permanganate (KMnO₄) in bovine endometrial epithelial cells (BEECs). Using KMnO₄ to induce oxidative stress, we observed significant increases in reactive oxygen species (ROS) and malondialdehyde (MDA) levels, accompanied by decreased activities of antioxidant enzymes glutathione peroxidase (GPx) and superoxide dismutase (SOD). Quantitative PCR and Western blot analyses indicated a negative correlation between IGF1R and bta-let-7d expression in oxidative stress-affected tissues, suggesting opposing roles in managing stress responses. Following KMnO₄ treatment, there was marked downregulation of anti-apoptotic genes and upregulation of pro-apoptotic markers, alongside diminished antioxidant capacity. Mechanistically, bta-let-7d targets IGF1R, leading to suppression of the PI3K/AKT signaling pathway and exacerbating oxidative damage. In vivo experiments further confirmed the impact of KMnO₄ exposure on IGF1R expression. These findings provide novel insights into the mechanisms by which KMnO₄ induces oxidative stress and apoptosis in the bovine uterus. They highlight the potential for therapeutic strategies targeting the bta-let-7d/IGF1R axis to enhance reproductive health management in dairy cows, offering a promising avenue for mitigating oxidative stress-related reproductive disorders.
Keywords:
Potassium permanganate
; bta-let-7d
; IGF1R
; Oxidative stress
; dairy cows
1. Introduction
Oxidative stress plays a crucial role in the pathophysiology of various reproductive disorders in dairy cows, particularly in cases of postpartum uterine infections, such as endometritis. These infections are primarily caused by bacterial contaminants such as Escherichia coli and Staphylococcus aureus, which disrupt the normal function of the endometrium and create an unsuitable environment for embryo implantation, ultimately reducing the reproductive performance[1,2] The accumulation of reactive oxygen species(ROS) can lead to cellular damage and impaired lipid peroxidation health; therefore, studying the effects of oxidative stress on the health of the dairy cow endometrium is meaningful. [3].
Acute endometritis in dairy cows may be treated with potassium permanganate (KMnO4), recognized for its antibacterial and anti-inflammatory properties. However, KMnO4 is a strong oxidizing agent, and incomplete uterine washing can result in residual potassium permanganate within the body, potentially creating a prolonged oxidative environment that may lead to oxidative damage of the endometrium[4,5,6,7,8]. In the context of postpartum infections in dairy cows, KMnO4 is utilized to cleanse the uterus, disinfect wounds, and treat hoof conditions. Additionally, it is employed in other animal species for wound debridement and the management of uterine adenomyosis in canines and felines. Nonetheless, potassium permanganate's potent oxidative properties raise concerns, as it has been shown to exhibit acute toxicity in rodent models. This study aims to investigate the potential for potassium permanganate to induce oxidative stress in the endometrium during therapeutic application[9,10,11].
IGF1R (Insulin-like Growth Factor 1 Receptor) is essential in oxidative stress [12]. It belongs to the receptor tyrosine kinase family. It can be activated by IGF1 or IGF2 [13], activating its downstream PI3K/AKT signaling pathway, which regulates cell growth, differentiation, and responses to oxidative stress[14]. IGF1R is significantly related to oxidative stress responses, particularly in the context of ischemia/reperfusion injury and mental disorders. Studies have shown that low concentrations of H2O2 during myocardial ischemia-reperfusion activate the IGF1R/PI3K/AKT signaling pathway to resist oxidative stress damage and prevent apoptosis.
MicroRNAs (miRNAs) are a class of small non-coding RNAs that regulate gene expression by binding to the 3' untranslated regions of mRNAs, leading to mRNA degradation or inhibition of translation[15]. The let-7 family is a group of conserved microRNAs that play roles in various biological processes, including cell proliferation, differentiation, and apoptosis. The let-7 family is highly expressed in mitochondria and acts by regulating antioxidant-related genes [16]. For example, let-7b and let-7c can indirectly regulate HMOX1 to alleviate oxidative damage in human hepatocytes [17]. Studies have shown that let-7 family member let-7a inhibits oxidative stress and cellular damage by targeting arginase 2 (ARG2)[18]. The let-7 family also plays a significant role in regulating cancer stem cells, participating in the maintenance of stem cell properties, promoting the proliferation of cancer cells, and resisting apoptosis [19].
This research aims to investigate the implications of potassium permanganate treatment on oxidative stress in the endometrium of dairy cows. By examining the interactions between oxidative stress, IGF1R signaling, and miRNA regulation in the context of reproductive health, this study seeks to provide insights into potential therapeutic strategies for managing oxidative stress-related reproductive disorders in dairy cows. Understanding these mechanisms may pave the way for improved reproductive outcomes and economic viability in the dairy industry.
2. Material and methods
2.1. Collection of Bovine Uterine Samples and SD Rat Model
Bovine uterine tissue samples were obtained from a slaughterhouse in Wuhan, China. Following collection, the tissues were immediately immersed in liquid nitrogen and transported to the laboratory within 30 minutes. All animal procedures adhered to protocols approved by the Hubei Province Laboratory Animal Research Center and the Animal Research Ethics Committee of Huazhong Agricultural University (HZAUMO-2015-12). Additionally, 4 to 6-week-old Sprague-Dawley (SD) rats were procured from the Experimental Animal Center. Both uterine horns of the rats were exposed and flushed with varying concentrations of potassium permanganate (KMnO₄) (C1: 0.01%, C2: 0.025%, C3: 0.05%, C4: 0.1%), while the control group received an equivalent volume of phosphate-buffered saline (PBS).
2.2. Histological Analysis
Tissue samples were fixed in 10% formalin, followed by washing with buffer (e.g., PBS), dehydration through a graded ethanol series, clearing with xylene, and embedding in molten paraffin. The embedded tissues were placed in molds and allowed to solidify at room temperature or in cold storage. The solidified blocks were sectioned into thin slices (4-6 μm) using a microtome, deparaffinized with xylene, and stained with hematoxylin for nuclei and eosin for cytoplasmic visualization.
2.3. Bovine Endometrial Epithelial Cell Culture
Bovine endometrial epithelial cells (BEECs) were cultured in a medium supplemented with 10% fetal bovine serum (from the United States) and 1% penicillin-streptomycin (Biosharp). The incubation environment was maintained at 5% CO₂ and 37°C, with medium changes every 6 hours. Upon reaching approximately 80% confluence, the cells were digested with trypsin, subcultured, and stored at -80°C or in liquid nitrogen. To investigate the role of let-7d and IGF1R in oxidative stress within the bovine endometrium, an in vitro oxidative stress model was established by treating the cells with 0.01% KMnO₄.
2.4. bEECs Cell Transfection
When cell cultures reached approximately 60% confluence, transfections were performed using the jetPRIME reagent with bta-let-7d mimics (5’-3': S: AGAGGUAGUAGGUUGCAUAGUU, AS: CUAUGCAACCUACUACCUCUUU), bta-let-7d inhibitor (5’-3': S: AACUAUGCAACCUACUACCUCU), and IGF1R siRNA (si-IGF1R, 5’-3': S: GCACAACUACUGCUCCAAATT, AS: UUUGGAGCAGUAGUUGUGCTT). RNA and protein were extracted 24 hours post-transfection.
2.5. RNA Extraction and RT-qPCR Analysis
Total RNA from tissues or cells was extracted using Trizol reagent according to the manufacturer's instructions. Complementary DNA (cDNA) synthesis was conducted using the Yeasen one-step reverse transcription kit, with miRNA reverse transcription achieved through tailing. Gene expression was quantified via real-time PCR, employing β-actin and U6 as reference genes. The relative gene expression levels were analyzed using the 2^(-ΔΔCT) method. Primer sequences are provided in Table 1.
2.6. Western Blot Analysis
Following protein extraction from tissues and cells using RIPA buffer, protein concentrations in each group were quantified using a BCA assay. Samples underwent SDS-PAGE under constant voltage, followed by transfer to PVDF membranes using constant current. Membranes were blocked with ECL rapid blocking buffer for one hour and incubated overnight with primary antibodies at 4°C (16–18 hours). After three washes with TBST, membranes were incubated with secondary antibodies for two hours, rewashed thrice with TBST, and visualized. Results were analyzed using ImageJ software, with β-actin serving as an internal control.
2.7. miRNA Target Prediction
Potential miRNA targets for IGF1R were predicted using the TargetScan website, focusing on the top five candidates. These miRNAs were further assessed based on their expression in bovine endometrial tissue and previous studies regarding their functions. Ultimately, let-7d was selected due to its high expression in endometrial tissue and its significant role in mitochondrial function. Additional target predictions were conducted using miRDB (http://mirdb.org/), PicTar (https://pictar.mdc-berlin.de/), and miRcode (http://www.mircode.org/).
2.8. Dual-Luciferase Reporter Assay
Wild-type and mutant plasmids for IGF1R were constructed using the primGLO backbone based on predicted binding sites. These plasmids, along with bta-let-7d mimics, were co-transfected into 293T cells. Fluorescence intensity was measured using the Yeasen Dual-Luciferase Assay Kit (Cat. No. 11402ES60).
2.9. Detection of MDA, ROS, T-AOC, GPx, and SOD
After stimulation, cells from each group were washed with PBS and collected using a scraper in 500 μL PBS. Supernatants were obtained following centrifugation for 20 minutes, and protein concentrations were determined via BCA assay. Assays for MDA (Cat. No. S0131S), ROS (Cat. No. S0033S), total antioxidant capacity (T-AOC) (Cat. No. S0119), glutathione peroxidase (GPx) (Cat. No. S0056) from Beyotime, and total superoxide dismutase (T-SOD) (Cat. No. A001-1-2) from Nanjing Jiancheng were performed according to the respective kit instructions.
2.10. Immunofluorescence Staining
Following stimulation, cells were washed twice with PBS and fixed with 4% paraformaldehyde for 20 minutes. Cells were then permeabilized with Triton for 15 minutes, washed three times, and blocked with blocking buffer at room temperature for three hours. Primary antibodies were added and incubated overnight at 4°C in the dark. After three additional washes with PBS, secondary antibodies were added and incubated at room temperature for three hours. Nuclei were stained with DAPI at room temperature for 15 minutes. Cells were rewashed three times and visualized using a fluorescence microscope.
2.11. Statistical Analysis
All data were processed using GraphPad 9.4, with each experiment performed in triplicate. Data are presented as mean ± standard error of the mean (SEM). T-tests were employed for comparisons between two groups, while one-way ANOVA was utilized for comparisons among multiple groups. Statistical significance was defined as P < 0.05, with highly significant values indicated at P < 0.01.
3. Result
3.1. Differential Expression of IGF1R and bta-let-7d in Normal and Oxidative Stress-Affected Tissues
Analysis of normal versus oxidative stress-affected tissues revealed a significant reduction in both mRNA and protein levels of IGF1R in the oxidative stress group, alongside a marked increase in bta-let-7d expression. Histological examination of the oxidative stress group demonstrated considerable cellular damage and necrosis, correlating with the downregulation of IGF1R. In contrast, IGF1R levels were maintained in normal tissues, which exhibited preserved cellular architecture (Table 1, Figure 1A). Assays measuring malondialdehyde (MDA) and glutathione peroxidase (GPx) levels in normal and inflamed bovine uterine tissues indicated elevated MDA and reduced GPx levels in the oxidative stress group compared to normal tissues (Figure 1B, C). Quantitative PCR analysis further confirmed the significant reduction of IGF1R expression and the notable increase of bta-let-7d expression in oxidative stress tissues versus normal tissues (Figure 1D, E). Immunohistochemical staining illustrated nuclear localization (blue) and IGF1R expression in both normal and inflamed bovine uterine tissues (33) (Figure 1F). These findings suggest that oxidative stress markedly alters the expression of IGF1R and bta-let-7d in bovine uterine tissues.
3.2. Establishing a KMnO₄-Induced Oxidative Stress Model in Bovine Endometrial Epithelial Cells
To assess the oxidative stress induction by potassium permanganate (KMnO₄) in bovine endometrial epithelial cells, we analyzed oxidative and antioxidant marker changes across five KMnO₄ concentrations. Reactive oxygen species (ROS) intensity (Figure 2A, C) exhibited a concentration-dependent increase, indicating a positive correlation between ROS levels and KMnO₄ concentration. Cell viability, evaluated via the CCK-8 assay (Figure 2B), exhibited a decline in a concentration-dependent manner after 12 hours of exposure, reflecting the cytotoxic effects of elevated KMnO₄ concentrations. Lipid peroxidation, as indicated by MDA levels (Figure 2D), also significantly increased with rising KMnO₄ concentrations, further supporting oxidative stress induction. Levels of antioxidant enzymes, including total superoxide dismutase (SOD) (Figure 2E) and total antioxidant capacity (T-AOC) (Figure 2F), decreased significantly following KMnO₄ exposure, highlighting a compromised antioxidant defense against oxidative damage. Additionally, GPx levels (Figure 2G) similarly diminished with increasing KMnO₄ concentrations, indicating reduced cellular antioxidant capacity. These results confirm that KMnO₄ induces oxidative stress in bovine endometrial epithelial cells in a concentration-dependent manner.
3.3. Response Patterns of IGF1R and bta-let-7d in the Cell Model
Subsequent evaluation of the PI3K/AKT signaling pathway protein expression under KMnO₄ treatment revealed significantly reduced levels of phosphorylated PI3K and AKT with increasing KMnO₄ concentrations (Figs. A-G), suggesting that oxidative stress may impair cell survival by inhibiting the PI3K/AKT pathway. The expression of apoptosis-related proteins Bcl-2 and Bax was assessed, revealing an increase in Bax and a decrease in Bcl-2 expression with higher KMnO₄ concentrations. Western blot analyses confirmed the decline of IGF1R expression following KMnO₄ stimulation. Quantitative PCR data indicated significant reductions in GPx1 and CAT expression at KMnO₄ concentrations C1, C3, and C5, while SOD and Nrf2 levels were downregulated across all tested KMnO₄ concentrations. Pro-apoptotic proteins Bax, Caspase-8, and Caspase-3 were upregulated, whereas the expression of the anti-apoptotic protein Bcl-2 decreased. Immunofluorescence results demonstrated diminished IGF1R expression and phosphorylated mTOR levels under KMnO₄ stimulation. These findings suggest that KMnO₄-induced oxidative stress promotes apoptosis in bovine endometrial epithelial cells through the PI3K/AKT signaling pathway, with significant involvement from IGF1R and bta-let-7d.
3.4. Regulatory Role of bta-let-7d on Oxidative Stress Marker Expression
To elucidate the impact of bta-let-7d on oxidative stress markers, cells were transfected with bta-let-7d mimics and inhibitors, followed by measurement of SOD, GPx, MDA, and total antioxidant capacity. Results indicated that overexpression of bta-let-7d significantly elevated MDA levels while decreasing SOD, GPx, and total antioxidant capacity. Conversely, inhibition of bta-let-7d resulted in significantly reduced MDA levels and increased SOD, GPx, and total antioxidant capacity (Figure 4A-D). Further quantitative PCR analysis demonstrated that overexpression of bta-let-7d downregulated Bcl-2 and Caspase-6 while upregulating Bax; inhibition of bta-let-7d elicited the opposite effects. Additionally, bta-let-7d overexpression led to increased expression of oxidative stress-related genes CAT, NOS2, and PTGS2, while GPx1 levels remained unchanged. In contrast, bta-let-7d inhibition resulted in upregulation of GPx1 and NOS2 (Figure 4E-L). These results indicate that bta-let-7d upregulation exacerbates oxidative stress and apoptotic responses in bovine endometrial epithelial cells.
3.5. Interaction Between IGF1R and bta-let-7d in the Signaling Pathway
Western blot analysis showed that bta-let-7d negatively regulates IGF1R expression, thus inhibiting the PI3K/AKT signalling pathway. In cells overexpressing bta-let-7d, the levels of PI3K and phosphorylated AKT (p-AKT) were significantly reduced (Figure 5A-C), with downregulated IGF1R expression positively correlated with PI3K/AKT pathway inhibition. In contrast, IGF1R expression was upregulated upon bta-let-7d inhibition, enhancing PI3K/AKT pathway activation (Figure 5B, D). These results suggest that bta-let-7d suppresses the PI3K/AKT signalling pathway by targeting IGF1R, thereby weakening cell survival and antioxidant capacity.
Further analysis indicates that inhibition of the PI3K/AKT pathway correlates with an enhanced cellular stress response under oxidative conditions. Upregulation of IGF1R can activate the PI3K/AKT pathway, increasing cellular tolerance to oxidative stress, while overexpression of bta-let-7d weakens this protective mechanism, rendering cells more susceptible to oxidative damage.
3.6. IGF1R as a Target Gene of bta-let-7d
Bioinformatic analysis identified IGF1R as a potential target gene of bta-let-7d (Figure 6A-C). This conclusion was further validated by a dual-luciferase reporter assay (Figure 6D): the bta-let-7d mimic significantly inhibited luciferase activity of the IGF1R 3'UTR, with no significant change observed in the mutant vector (Figure 6I). Additionally, qPCR results demonstrated that IGF1R and bta-let-7d mRNA expression levels showed opposing trends under varying KMnO₄ concentrations (Figure 6E, F). These findings indicate that bta-let-7d directly regulates IGF1R expression by targeting its 3'UTR, playing a role in the oxidative stress response.
3.7. Negative Regulatory Role of IGF1R in the Oxidative Stress Response
To further investigate the role of IGF1R in the oxidative stress response, siRNA knockdown was performed at various IGF1R sites, with si-IGF1R-2009 demonstrating the most significant effect (Figure 7B). Knockdown of IGF1R resulted in a marked increase in MDA levels and a notable reduction in SOD, GPx, and total antioxidant capacity (Figure 7G). Furthermore, IGF1R knockdown inhibited the PI3K/AKT pathway (Figure 7A, F, G). Quantitative PCR analyses revealed downregulation of antioxidant marker genes GPx1, CAT, SOD, and Nrf2, reflecting diminished cellular antioxidant capacity (Figure 7H). Western blot results indicate an upregulation of pro-apoptotic proteins and a downregulation of anti-apoptotic proteins (Figure 7A, D, E). Concurrently, qPCR analysis showed increased expression of pro-apoptotic genes Bax, Caspase-8, and Caspase-3, and decreased expression of the anti-apoptotic gene Bcl-2 (Figure 7I). These findings suggest that IGF1R plays a critical negative regulatory role in the oxidative stress response, where its downregulation exacerbates oxidative stress and apoptotic responses.
3.8. Potassium Permanganate-Induced Uterine Damage and IGF1R Expression
Following uterine lavage in rats with varying concentrations of potassium permanganate, histological assessments indicated that the control group's endometrial structures remained intact, exhibiting no visible damage or inflammation, with normal basal layer arrangement. At concentrations of 0.025% and 0.01% potassium permanganate, slight edema and mild epithelial damage were observed, accompanied by localized inflammatory cell infiltration (Figure A). At a concentration of 0.05%, severe tissue damage, edema, and leukocyte infiltration were evident, indicating a pronounced inflammatory response at higher potassium permanganate concentrations. Histopathological scoring (Table 2) showed increased MDA levels correlating with potassium permanganate concentration, with groups C2 and C3 exhibiting significantly higher MDA levels than the control group (***, P < 0.0001), suggesting that elevated potassium permanganate concentrations induce severe oxidative stress. Immunofluorescence analyses revealed reduced IGF1R expression in endometrial epithelial cells following potassium permanganate exposure compared to controls (Figure 8B). These results indicate that potassium permanganate exposure leads to significant uterine damage and downregulation of IGF1R expression.
3.9. Schematic of IGF1R/PI3K/AKT Pathway Inhibition in Potassium Permanganate-Induced Endometrial Oxidative Stress
Figure 9.
Schematic of IGF1R/PI3K/AKT Pathway Inhibition in Potassium Permanganate-Induced Endometrial Oxidative Stress.
Figure 9.
Schematic of IGF1R/PI3K/AKT Pathway Inhibition in Potassium Permanganate-Induced Endometrial Oxidative Stress.
4. Discussion
The health status of the endometrium in dairy cows is crucial for embryo implantation and pregnancy maintenance[20,21] . The endometrium serves as a vital site for embryo implantation and development, and its health directly impacts successful implantation and pregnancy maintenance [22]. Oxidative stress is widely recognized as a key factor affecting endometrial function, where excessive reactive oxygen species (ROS) can lead to cellular damage, thereby impairing reproductive performance [23]. This study is the first to elucidate the mechanism by which bta-let-7d regulates oxidative stress in the bovine endometrium through targeting IGF1R, providing new insights into reproductive health.
In this study, potassium permanganate (KMnO₄) was utilized to induce oxidative stress in bovine endometrial epithelial cells (BEECs) [24]. The findings showed significant increases in ROS and MDA levels, while the activities of GPX and SOD decreased, alongside a decline in total antioxidant capacity. These results indicate that oxidative stress inhibits antioxidant enzyme activity, leading to ROS accumulation and increased lipid peroxidation, contributing to cellular damage. This underscores the importance of maintaining intracellular ROS balance and highlights the protective role of antioxidant enzymes during oxidative stress. Given the critical importance of endometrial health for embryo implantation and pregnancy maintenance in dairy cows, understanding and regulating the oxidative stress response is vital for enhancing reproductive performance[22]. Future investigations may explore modulating antioxidant enzyme activities to mitigate oxidative stress and improve reproductive efficiency in dairy herds.
Our study identified that the upregulation of bta-let-7d led to a significant decrease in IGF1R expression. IGF1R, a key receptor in the PI3K/AKT signaling pathway, is essential for regulating cellular proliferation, survival, and metabolism [25]. Previous research has associated abnormal IGF1R expression with various reproductive disorders[26,27]. This receptor plays a significant role in preparing the uterus for embryo implantation. Studies indicate that stromal IGF1 and embryonic IGF2 activate IGF1R, which is vital for epithelial differentiation and receptivity during implantation [28]. Therefore, by suppressing IGF1R expression, bta-let-7d may influence these physiological processes. IGF1R activation promotes cell proliferation and survival, while bta-let-7d inhibits this pathway, exacerbating oxidative stress-induced damage in endometrial cells.
Increased oxidative stress correlates with various diseases, including reproductive disorders[29] [30]. Our results demonstrated that ROS levels in endometrial cells significantly decreased following the downregulation of bta-let-7d, likely due to the subsequent increase in IGF1R levels. IGF1R activation can enhance the PI3K/AKT pathway, promoting the expression of antioxidant enzymes such as SOD and GPX. SOD scavenges superoxide radicals, and GPX removes hydrogen peroxide, working together to reduce MDA formation and alleviate oxidative stress while enhancing overall antioxidant capacity.
As understanding of miRNA functions in biology deepens, the potential of bta-let-7d as a regulatory factor becomes increasingly apparent[31]. Studies show that the let-7 family plays critical roles in various biological processes, including cell cycle regulation and stress response[32]. Thus, the regulatory mechanisms of bta-let-7d may extend beyond IGF1R to include other signaling pathways, such as MAPK and Wnt. influence endometrial cell responses to oxidative stress by regulating these pathways.
Thus, the Mechanism by which bta-let-7d regulates oxidative stress through IGF1R could provide a new strategy for enhancing reproductive efficiency in dairy cows. This finding provides a novel perspective on using molecular biology approaches to intervene in the reproductive health of dairy cows. Although this study provides new insights into the role of bta-let-7d and IGF1R in oxidative stress regulation, further research is needed on the following aspects: Mechanisms of bta-let-7d: Future studies could explore whether bta-let-7d influences oxidative stress through other target genes or pathways. Clinical application: Evaluating the practical application of bta-let-7d as a biomarker or therapeutic target in dairy cow reproductive management.
Overall, these findings provide valuable insights into the molecular mechanisms underlying oxidative stress in bovine endometrial tissues. The interplay between bta-let-7d and IGF1R is critical, and further exploration of these pathways may lead to novel strategies for improving reproductive health in dairy cows. Future research should investigate potential interventions to restore IGF1R levels and assess the therapeutic potential of modulating bta-let-7d expression to combat oxidative stress.
Funding
This study was supported by the National Natural Science Foundation of China (NO. 31972744).
Institutional Review Board Statement
All experimental procedures were performed using the protocols approved by the Laboratory Animal Research Center of Hubei Province and authorized by the Ethical Committee on Animal Research at Huazhong Agricultural University (HZAURA-2024-0036).
Informed Consent Statement
Not applicable.
Data Availability Statement
The datasets generated and analyzed during the current study are available from the corresponding author upon reasonable request. All data materials and software applications support their published claims and comply with field standards.
Acknowledgments
We would like to express our heartfelt gratitude to Dr. Saqib Umar from the University of Agriculture Faisalabad, Pakistan, for his assistance in reviewing the English of our article.
Conflicts of Interest
The authors declare no conflict of interest.
References
- Amin, A.; Gad, A.; Salilew-Wondim, D.; Prastowo, S.; Held, E.; Hoelker, M.; Rings, F.; Tholen, E.; Neuhoff, C.; Looft, C.; et al. Bovine embryo survival under oxidative-stress conditions is associated with activity of the NRF2-mediated oxidative-stress-response pathway. Mol Reprod Dev 2014, 81, 497–513. [Google Scholar] [CrossRef] [PubMed]
- Ciampi, F.; Sordillo, L.M.; Gandy, J.C.; Caroprese, M.; Sevi, A.; Albenzio, M.; Santillo, A. Evaluation of natural plant extracts as antioxidants in a bovine in vitro model of oxidative stress. J Dairy Sci 2020, 103, 8938–8947. [Google Scholar] [CrossRef] [PubMed]
- Song, P.; Liu, C.; Sun, M.; Liu, J.; Lin, P.; Wang, A.; Jin, Y. Oxidative Stress Induces Bovine Endometrial Epithelial Cell Damage through Mitochondria-Dependent Pathways. Animals (Basel) 2022, 12. [Google Scholar] [CrossRef] [PubMed]
- Abinaya, P.; Thangarasu, S. Testing the Efficacy of Potassium Permanganate as Antiseptic Agent for the Control of Bovine Mastitis. International Journal of Current Microbiology and Applied Sciences 2017, 6, 609–611. [Google Scholar] [CrossRef]
- Wang, X.; Yang, J.; Li, H.; Mu, H.; Zeng, L.; Cai, S.; Su, P.; Li, H.; Zhang, L.; Xiang, W. miR-484 mediates oxidative stress-induced ovarian dysfunction and promotes granulosa cell apoptosis via SESN2 downregulation. Redox Biol 2023, 62, 102684. [Google Scholar] [CrossRef]
- Delgado-Enciso, I.; Madrigal-Perez, V.M.; Lara-Esqueda, A.; Diaz-Sanchez, M.G.; Guzman-Esquivel, J.; Rosas-Vizcaino, L.E.; Virgen-Jimenez, O.O.; Kleiman-Trujillo, J.; Lagarda-Canales, M.R.; Ceja-Espiritu, G.; et al. Topical 5% potassium permanganate solution accelerates the healing process in chronic diabetic foot ulcers. Biomed Rep 2018, 8, 156–159. [Google Scholar] [CrossRef]
- Barik, C.; Jindal, A. Potassium permanganate toxicity: A rare case with difficult airway management and hepatic damage. Indian J Crit Care Med 2015, 19, 129. [Google Scholar] [CrossRef]
- Chin, G.; Nicholson, H.; Demirel, S.; Affleck, A. Topical potassium permanganate solution use in dermatology: Comparison of guidelines and clinical practice. Clin Exp Dermatol 2022, 47, 966–967. [Google Scholar] [CrossRef]
- Karthik, R.; Veerendranath, H.P.; Wali, S.; Mohan, M.N.; Kumar, P.A.; Trimurty, G. Suicidal ingestion of potassium permanganate crystals: A rare encounter. Toxicol Int 2014, 21, 331–334. [Google Scholar] [CrossRef]
- Li, X.; Zeng, J.; Yu, X. Potassium permanganate as a promising pre-oxidant to treat low-viability cyanobacteria and associated removal of cyanotoxins and extracellular organic matters. Water Res 2021, 202, 117353. [Google Scholar] [CrossRef]
- Saganuwan, S.; Ahur, V.; Yohanna, C. Acute toxicity studies of potassium permanganate in Swiss albino mice. Nigerian Journal of Physiological Sciences 2008, 23. [Google Scholar] [CrossRef] [PubMed]
- Liu, S.; Zhou, Y.; Zhou, Y.; Wang, J.; Ji, R. Mechanism of miR-98 inhibiting tumor proliferation and invasion by targeting IGF1R in diabetic patients combined with colon cancer. Oncol Lett 2020, 20, 1719–1726. [Google Scholar] [CrossRef] [PubMed]
- Griffiths, C.D.; Bilawchuk, L.M.; McDonough, J.E.; Jamieson, K.C.; Elawar, F.; Cen, Y.; Duan, W.; Lin, C.; Song, H.; Casanova, J.L.; et al. IGF1R is an entry receptor for respiratory syncytial virus. Nature 2020, 583, 615–619. [Google Scholar] [CrossRef] [PubMed]
- Li, R.L.; Zhang, Q.; Liu, J.; Sun, J.Y.; He, L.Y.; Duan, H.X.; Peng, W.; Wu, C.J. Hydroxy-alpha-sanshool Possesses Protective Potentials on H(2)O(2)-Stimulated PC12 Cells by Suppression of Oxidative Stress-Induced Apoptosis through Regulation of PI3K/Akt Signal Pathway. Oxid Med Cell Longev 2020, 2020, 3481758. [Google Scholar] [CrossRef] [PubMed]
- Shu, S.; Liu, X.; Xu, M.; Gao, X.; Fan, J.; Liu, H.; Li, R. MicroRNA-424 regulates epithelial-mesenchymal transition of endometrial carcinoma by directly targeting insulin-like growth factor 1 receptor. J Cell Biochem 2019, 120, 2171–2179. [Google Scholar] [CrossRef]
- Esen, N.; Vejalla, A.; Sharma, R.; Treuttner, J.S.; Dore-Duffy, P. Hypoxia-Induced Let-7d Has a Role in Pericyte Differentiation. Adv Exp Med Biol 2016, 923, 37–42. [Google Scholar] [CrossRef]
- Hou, W.; Tian, Q.; Steuerwald, N.M.; Schrum, L.W.; Bonkovsky, H.L. The let-7 microRNA enhances heme oxygenase-1 by suppressing Bach1 and attenuates oxidant injury in human hepatocytes. Biochim Biophys Acta 2012, 1819, 1113–1122. [Google Scholar] [CrossRef]
- Song, L.; Li, D.; Gu, Y.; Li, X.; Peng, L. Let-7a modulates particulate matter (≤ 2.5 μm)-induced oxidative stress and injury in human airway epithelial cells by targeting arginase 2. J Appl Toxicol 2016, 36, 1302–1310. [Google Scholar] [CrossRef]
- Balzeau, J.; Menezes, M.R.; Cao, S.; Hagan, J.P. The LIN28/let-7 Pathway in Cancer. Front Genet 2017, 8, 31. [Google Scholar] [CrossRef]
- Rizk, B.; Badr, M.; Talerico, C. Oxidative Stress and The Endometrium. In Studies on Women's Health, 2013; pp. 61-74. [CrossRef]
- Ayemele, A.G.; Tilahun, M.; Lingling, S.; Elsaadawy, S.A.; Guo, Z.; Zhao, G.; Xu, J.; Bu, D. Oxidative Stress in Dairy Cows: Insights into the Mechanistic Mode of Actions and Mitigating Strategies. Antioxidants (Basel) 2021, 10. [Google Scholar] [CrossRef]
- Powers, S.K.; Nelson, W.B.; Hudson, M.B. Exercise-induced oxidative stress in humans: Cause and consequences. Free Radic Biol Med 2011, 51, 942–950. [Google Scholar] [CrossRef] [PubMed]
- A Nomogram Prediction Model for Mycobacterium avium subspecies paratuberculosis based on Individual Dairy Herd Improvement Information for Dairy Cows. The Pakistan Veterinary Journal 2024. [CrossRef]
- Tan, Y.; Cheng, H.; Su, C.; Chen, P.; Yang, X. PI3K/Akt Signaling Pathway Ameliorates Oxidative Stress-Induced Apoptosis upon Manganese Exposure in PC12 Cells. Biol Trace Elem Res 2022, 200, 749–760. [Google Scholar] [CrossRef] [PubMed]
- Okawa, E.R.; Gupta, M.K.; Kahraman, S.; Goli, P.; Sakaguchi, M.; Hu, J.; Duan, K.; Slipp, B.; Lennerz, J.K.; Kulkarni, R.N. Essential roles of insulin and IGF-1 receptors during embryonic lineage development. Mol Metab 2021, 47, 101164. [Google Scholar] [CrossRef]
- Higashi, Y.; Sukhanov, S.; Anwar, A.; Shai, S.Y.; Delafontaine, P. IGF-1, oxidative stress and atheroprotection. Trends Endocrinol Metab 2010, 21, 245–254. [Google Scholar] [CrossRef]
- Determination of Subclinical Mastitis Prevalence in Dairy Cows in Türkiye through Meta-Analysis and Production Loss Calculation. The Pakistan Veterinary Journal 2024. [CrossRef]
- Zhou, C.; Lv, M.; Wang, P.; Guo, C.; Ni, Z.; Bao, H.; Tang, Y.; Cai, H.; Lu, J.; Deng, W.; et al. Sequential activation of uterine epithelial IGF1R by stromal IGF1 and embryonic IGF2 directs normal uterine preparation for embryo implantation. J Mol Cell Biol 2021, 13, 646–661. [Google Scholar] [CrossRef]
- Mehta, B.N.; Chimote, N.M.; Chimote, M.N.; Chimote, N.N.; Nath, N.M. Follicular fluid insulin like growth factor-1 (FF IGF-1) is a biochemical marker of embryo quality and implantation rates in in vitro fertilization cycles. J Hum Reprod Sci 2013, 6, 140–146. [Google Scholar] [CrossRef]
- Leitao, B.; Jones, M.C.; Fusi, L.; Higham, J.; Lee, Y.; Takano, M.; Goto, T.; Christian, M.; Lam, E.W.; Brosens, J.J. Silencing of the JNK pathway maintains progesterone receptor activity in decidualizing human endometrial stromal cells exposed to oxidative stress signals. FASEB J 2010, 24, 1541–1551. [Google Scholar] [CrossRef]
- Yang, N.; Kaur, S.; Volinia, S.; Greshock, J.; Lassus, H.; Hasegawa, K.; Liang, S.; Leminen, A.; Deng, S.; Smith, L.; et al. MicroRNA microarray identifies Let-7i as a novel biomarker and therapeutic target in human epithelial ovarian cancer. Cancer Res 2008, 68, 10307–10314. [Google Scholar] [CrossRef]
- Johnson, C.D.; Esquela-Kerscher, A.; Stefani, G.; Byrom, M.; Kelnar, K.; Ovcharenko, D.; Wilson, M.; Wang, X.; Shelton, J.; Shingara, J.; et al. The let-7 microRNA represses cell proliferation pathways in human cells. Cancer Res 2007, 67, 7713–7722. [Google Scholar] [CrossRef]
Figure 1.
Differential Expression of IGF1R and let-7d in Normal and Oxidative Stress-Affected Tissues. (A) Histopathological analysis of bovine uterine tissues stained with H&E, scale bar = 100 μm. (B) The malondialdehyde (MDA) levels in normal and inflammatory bovine uterine tissues were detected using a commercial kit. (C) Glutathione peroxidase (GPx) levels in normal and inflammatory bovine uterine tissues were detected using a commercial kit. (D) qPCR was used to measure the expression levels of IGF1R mRNA in the tissues. (E) qPCR was used to detect the expression levels of bta-let-7d in the tissues. (F) Immunohistochemical staining showing nuclear localization (blue) and IGF1R expression in normal and inflammatory bovine uterine tissues. Data are expressed as the mean ± SEM of three independent experiments. *p < 0.05, **p < 0.01.
Figure 2.
Determination of potassium permanganate for modelling oxidative stress in BEECs. Fluorescence intensity of ROS in BEECs under different concentrations of potassium permanganate. (B) CCK-8 assay detecting cell viability in BEECs exposed to five different concentrations of potassium permanganate for 12 hours. (D) Lipid peroxidation (MDA) levels in BEECs under five concentrations of potassium permanganate. (E) Total superoxide dismutase (SOD) levels in BEECs under five concentrations of potassium permanganate. (F) Total antioxidant capacity (T-AOC) in BEECs under five concentrations of potassium permanganate. (G) Glutathione peroxidase (GPx) levels in BEECs under five concentrations of potassium permanganate. Data are expressed as the mean ± SEM of three independent experiments. *p < 0.05, **p < 0.01.
Figure 3.
Response Patterns of IGF1R and let-7d in Cellular Models. (A-G) BEECs were subjected to the same conditions as the previous step. Western blotting was used to detect the protein levels of IGF1R, Bcl-2, Bax, phosphorylated AKT, total AKT, phosphorylated PI3K, and total PI3K, with β-actin as an internal control. The protein bands were quantified using ImageJ software. (H-I) RT-qPCR was used to measure the relative expression levels of GPx1, CAT, SOD, Nrf2, Caspase-6, Caspase-3, Bax, and Bcl-2, with β-actin as an internal control. (J-K) IGF1R and p-mTOR fluorescence intensities were detected in BEECs stimulated by C1. Gray values of the indicated protein were detected using Image J gel analysis software. Data are presented as the mean ± SEM of three independent experiments. *P < 0.05; **P < 0.01,***P < 0.001,****P < 0.0001.
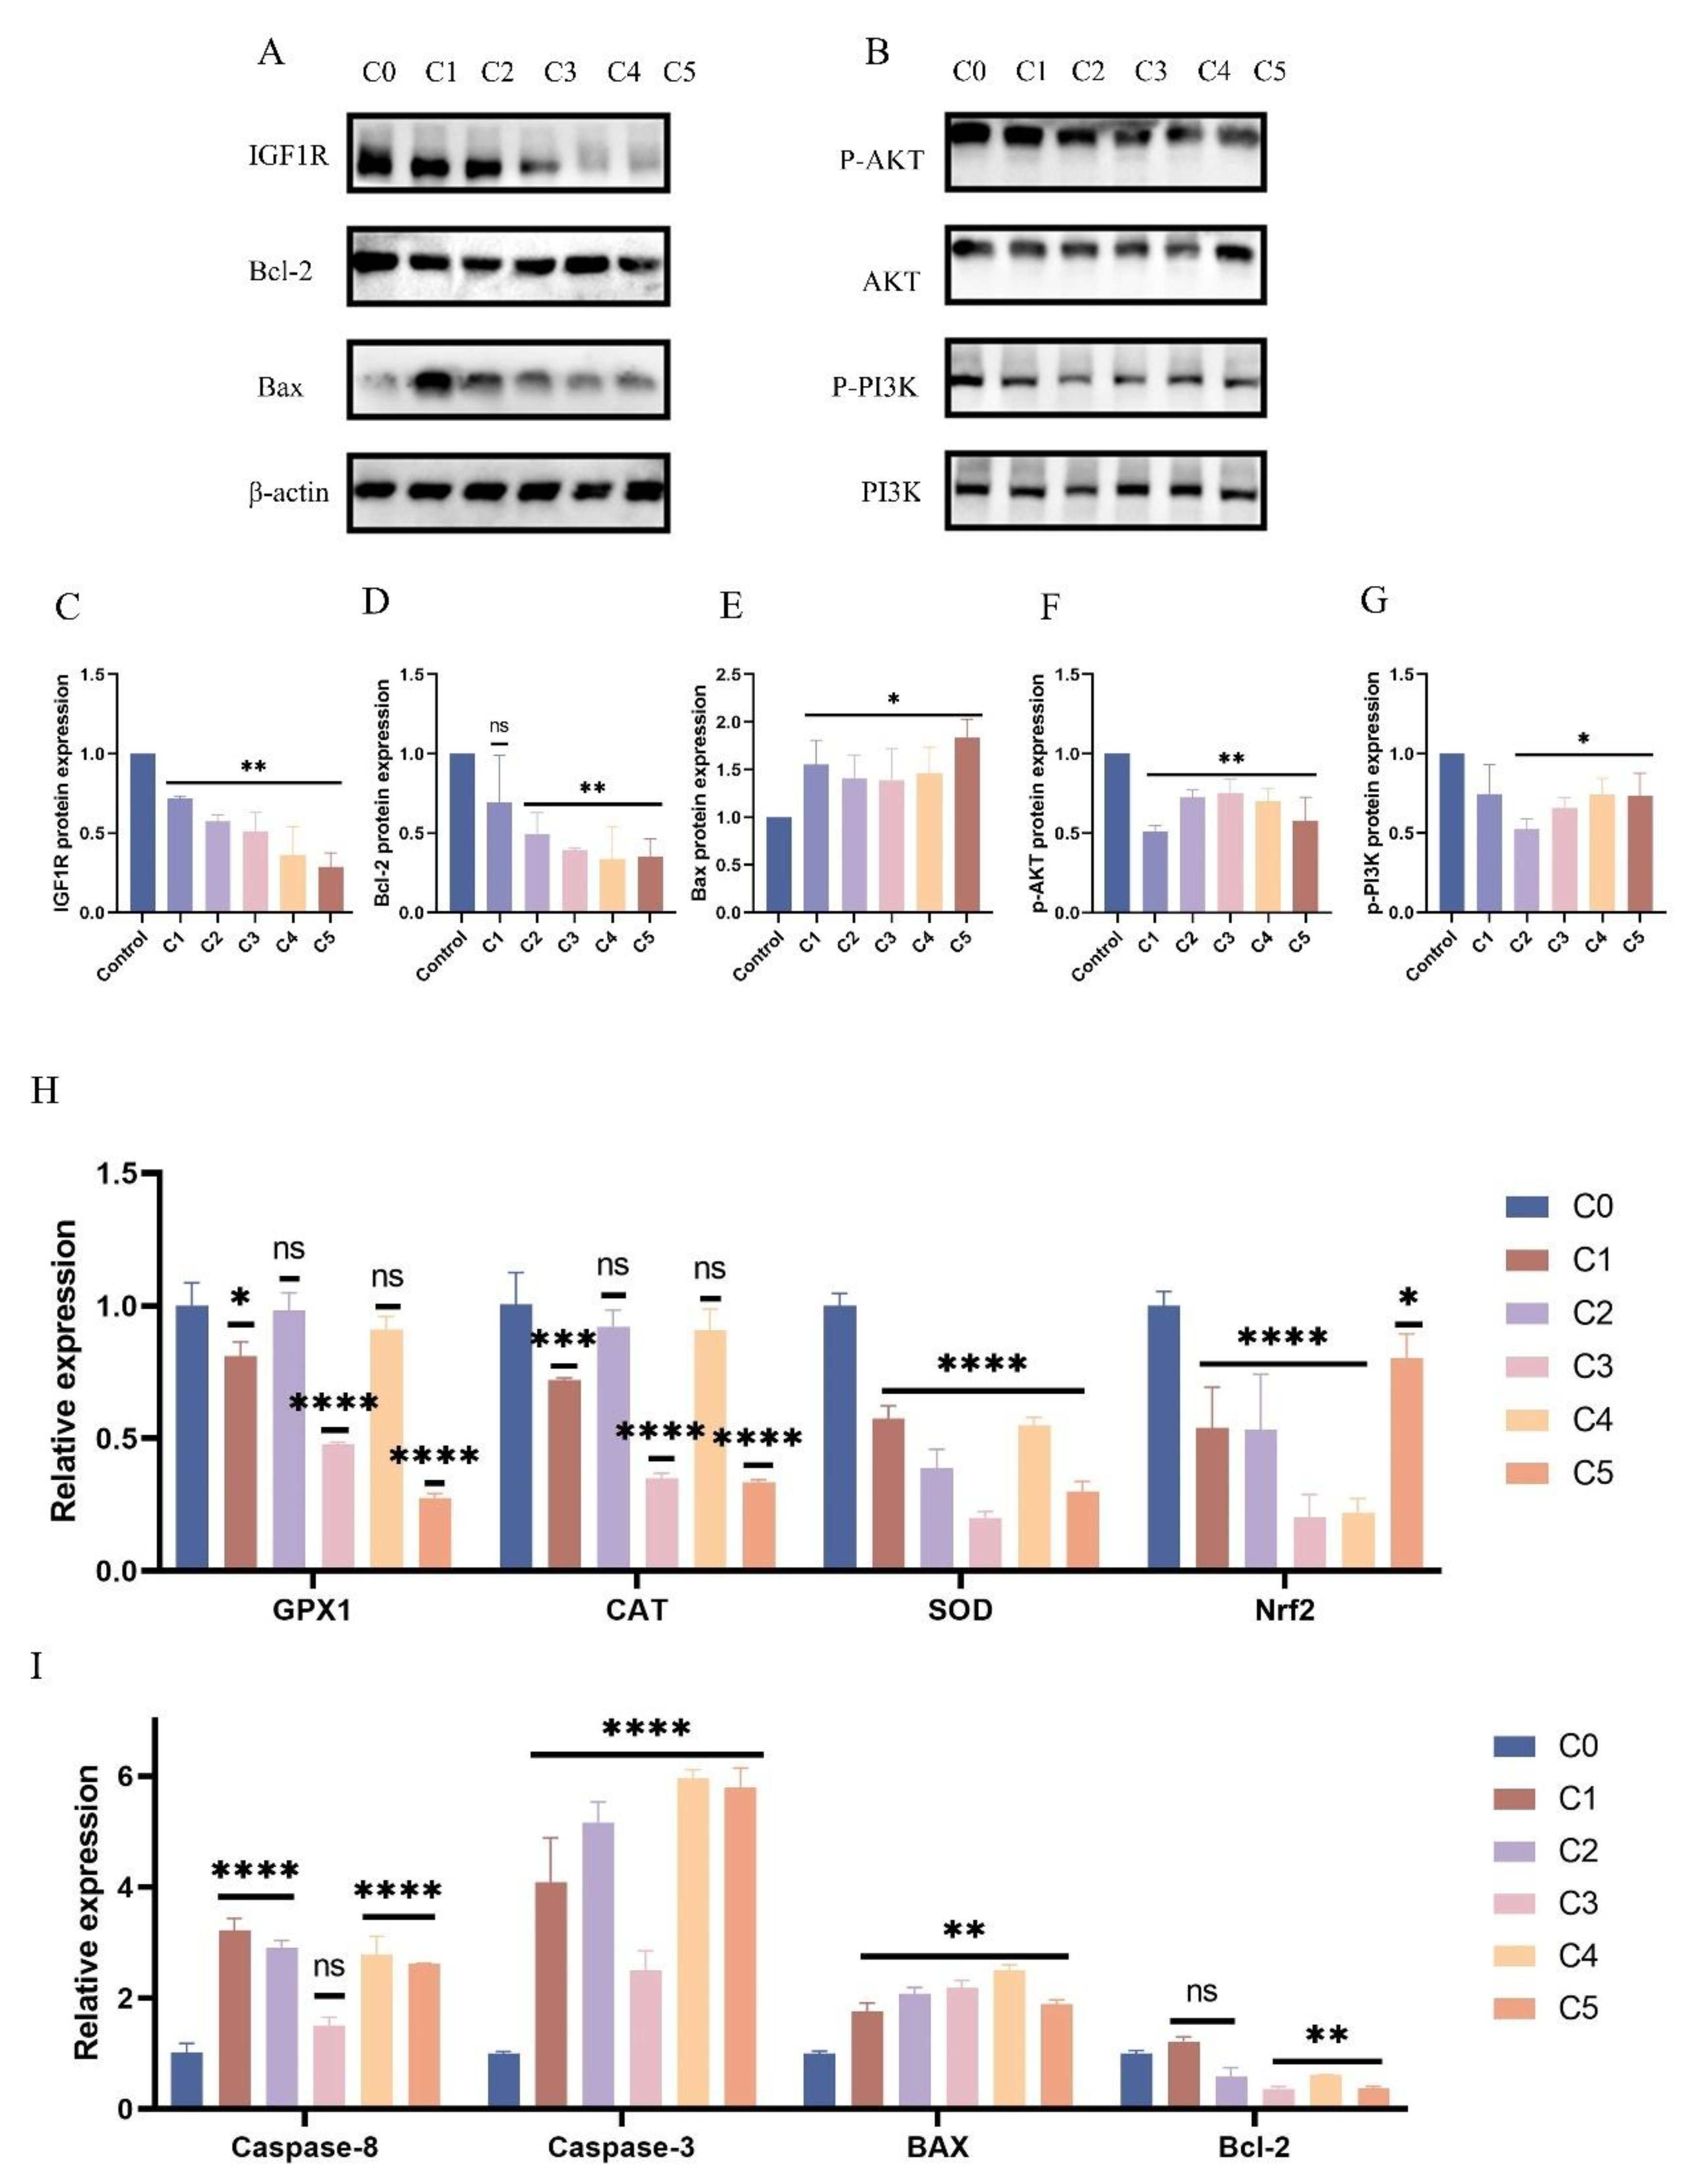
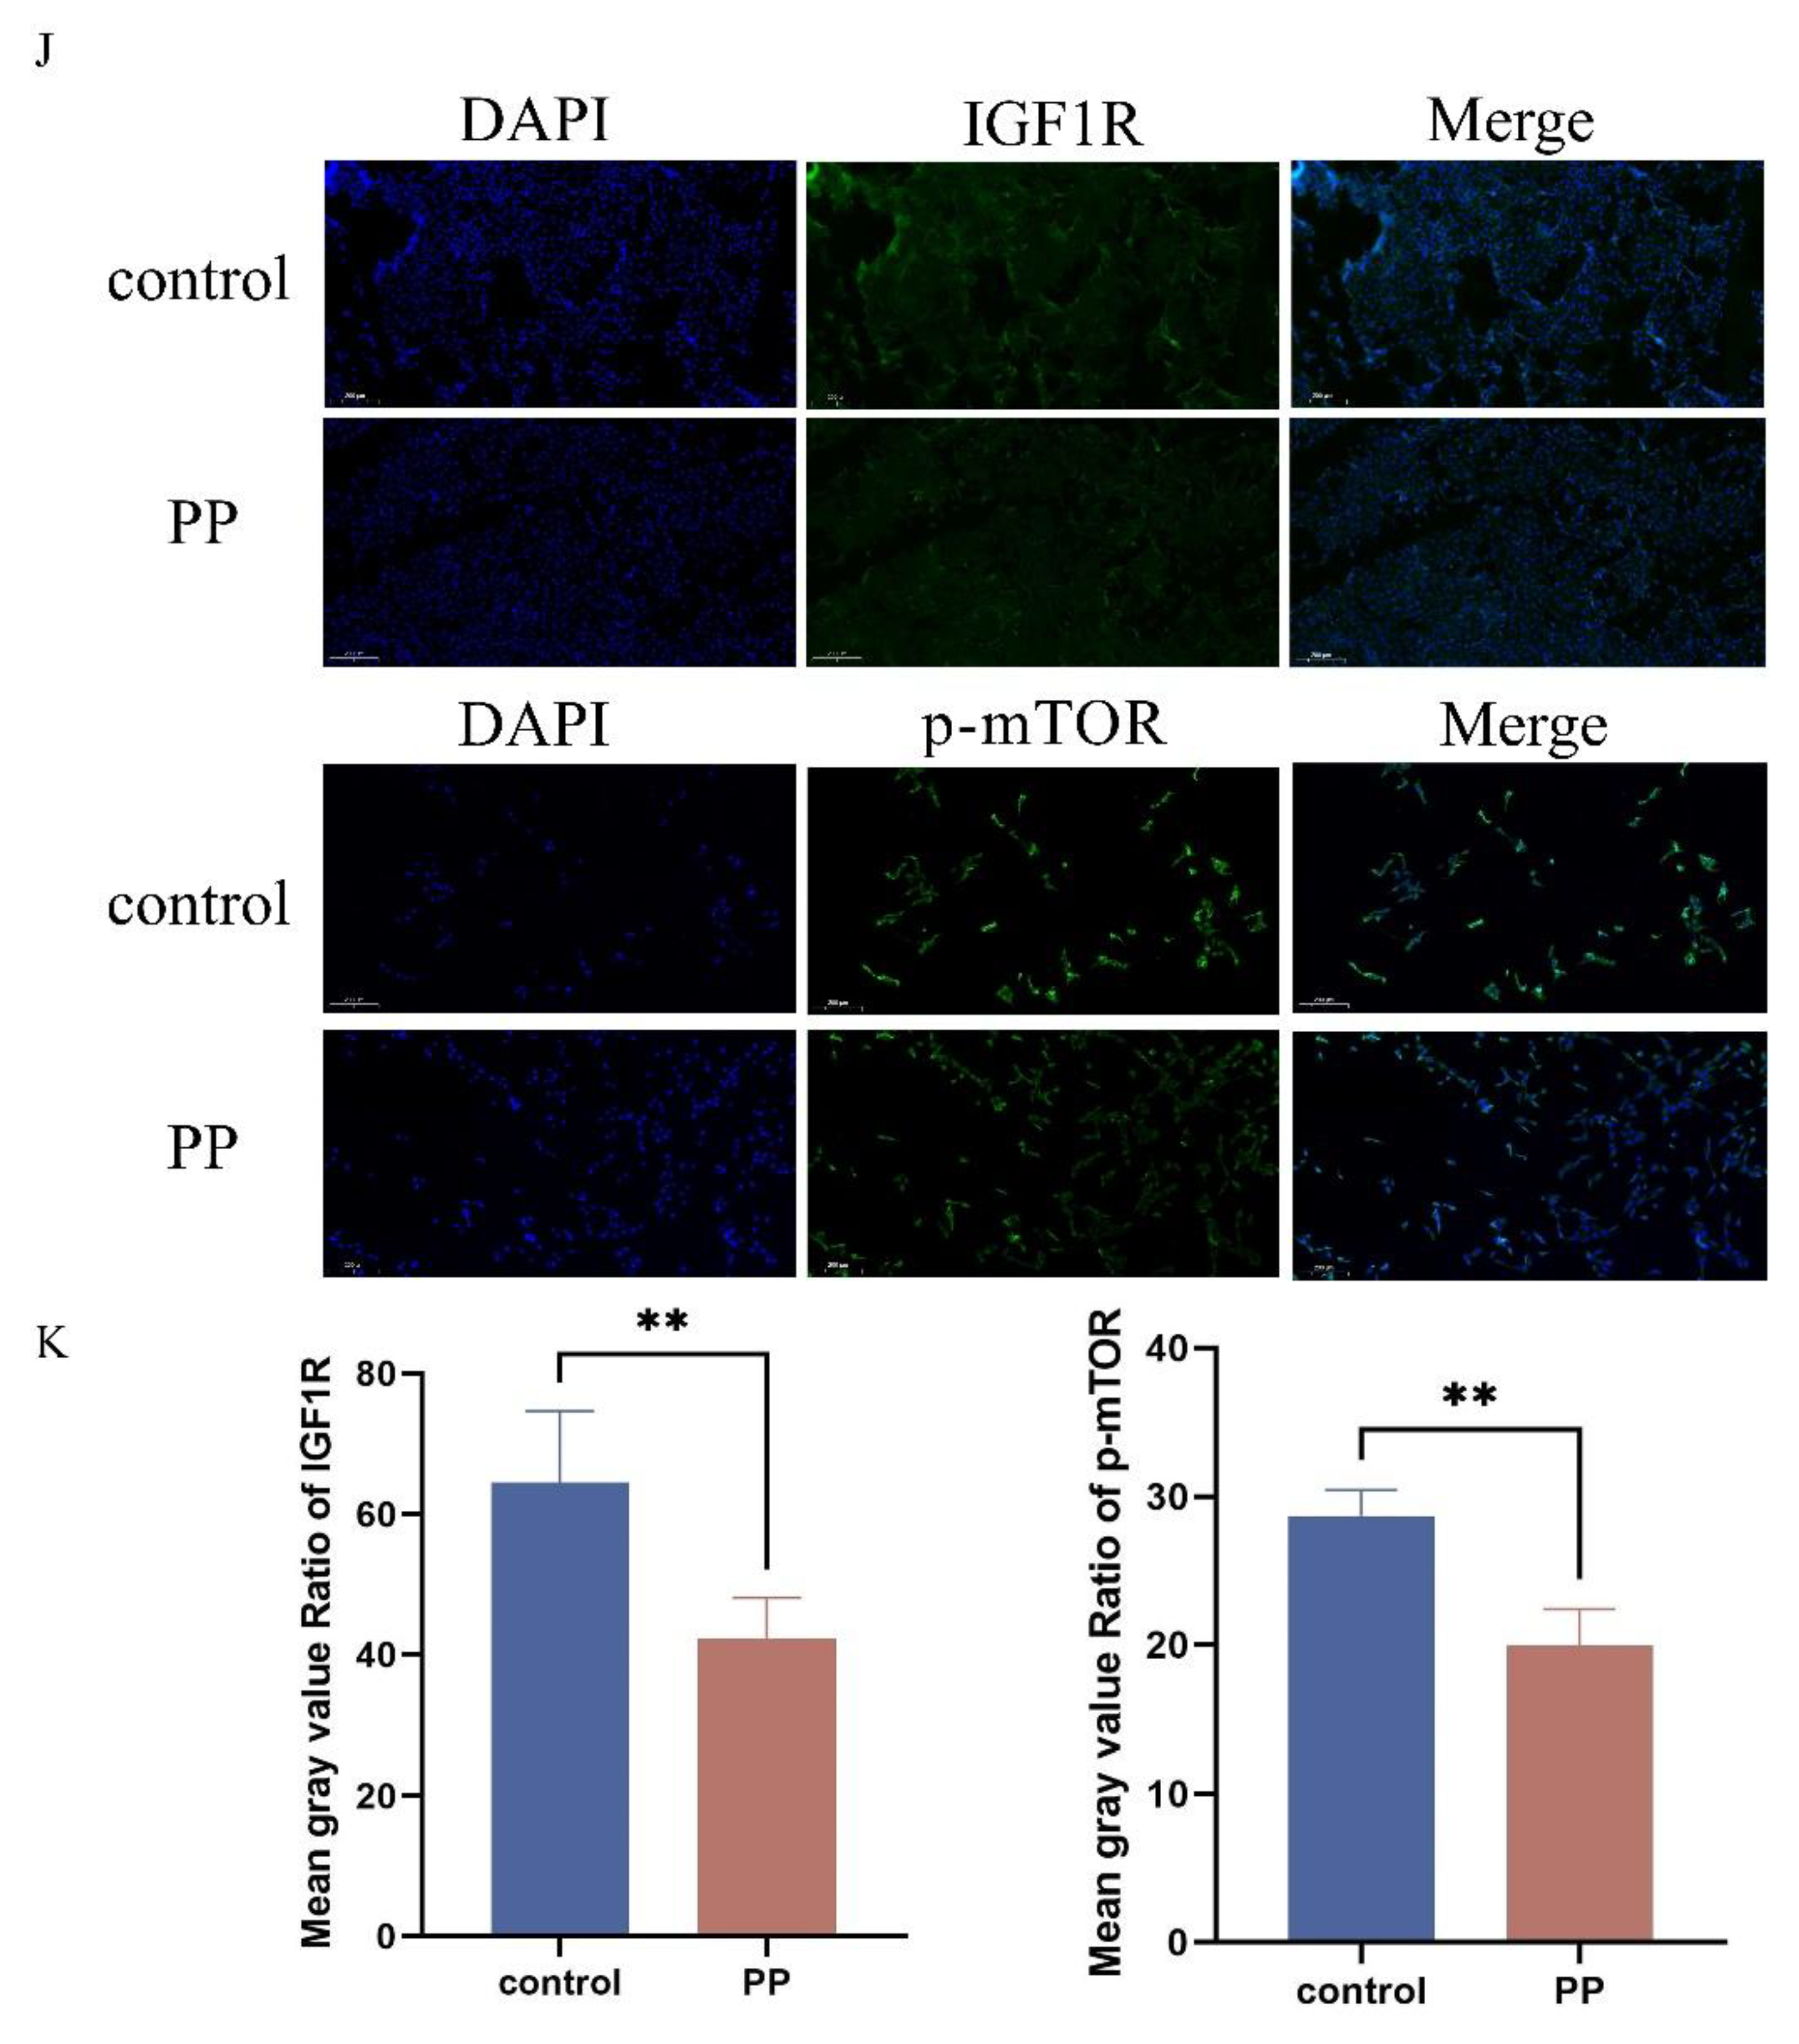
Figure 4.
Regulatory Role of let-7d on the Expression of Oxidative Stress Markers. BEECs were transfected with bta-let-7d mimics, inhibitors, and their respective negative controls. The expression levels of total superoxide dismutase (SOD), total antioxidant capacity (T-AOC), lipid peroxidation (MDA), and glutathione peroxidase (GPx) were measured using commercial kits. (E) RT-qPCR was used to measure the relative expression levels of IGF1R in BEECs treated with 0.01% potassium permanganate and transfected with bta-let-7d mimics, inhibitors, and si-IGF1R. (F-L) RT-qPCR was used to measure the relative expression levels of Bax, Bcl-2, Caspase-6, CAT, GPx1, PTGS2, and NOS2, with β-actin as an internal control. Data are presented as the mean ± SEM of three independent experiments. *P < 0.05; **P < 0.01,***P < 0.001,****P < 0.0001.
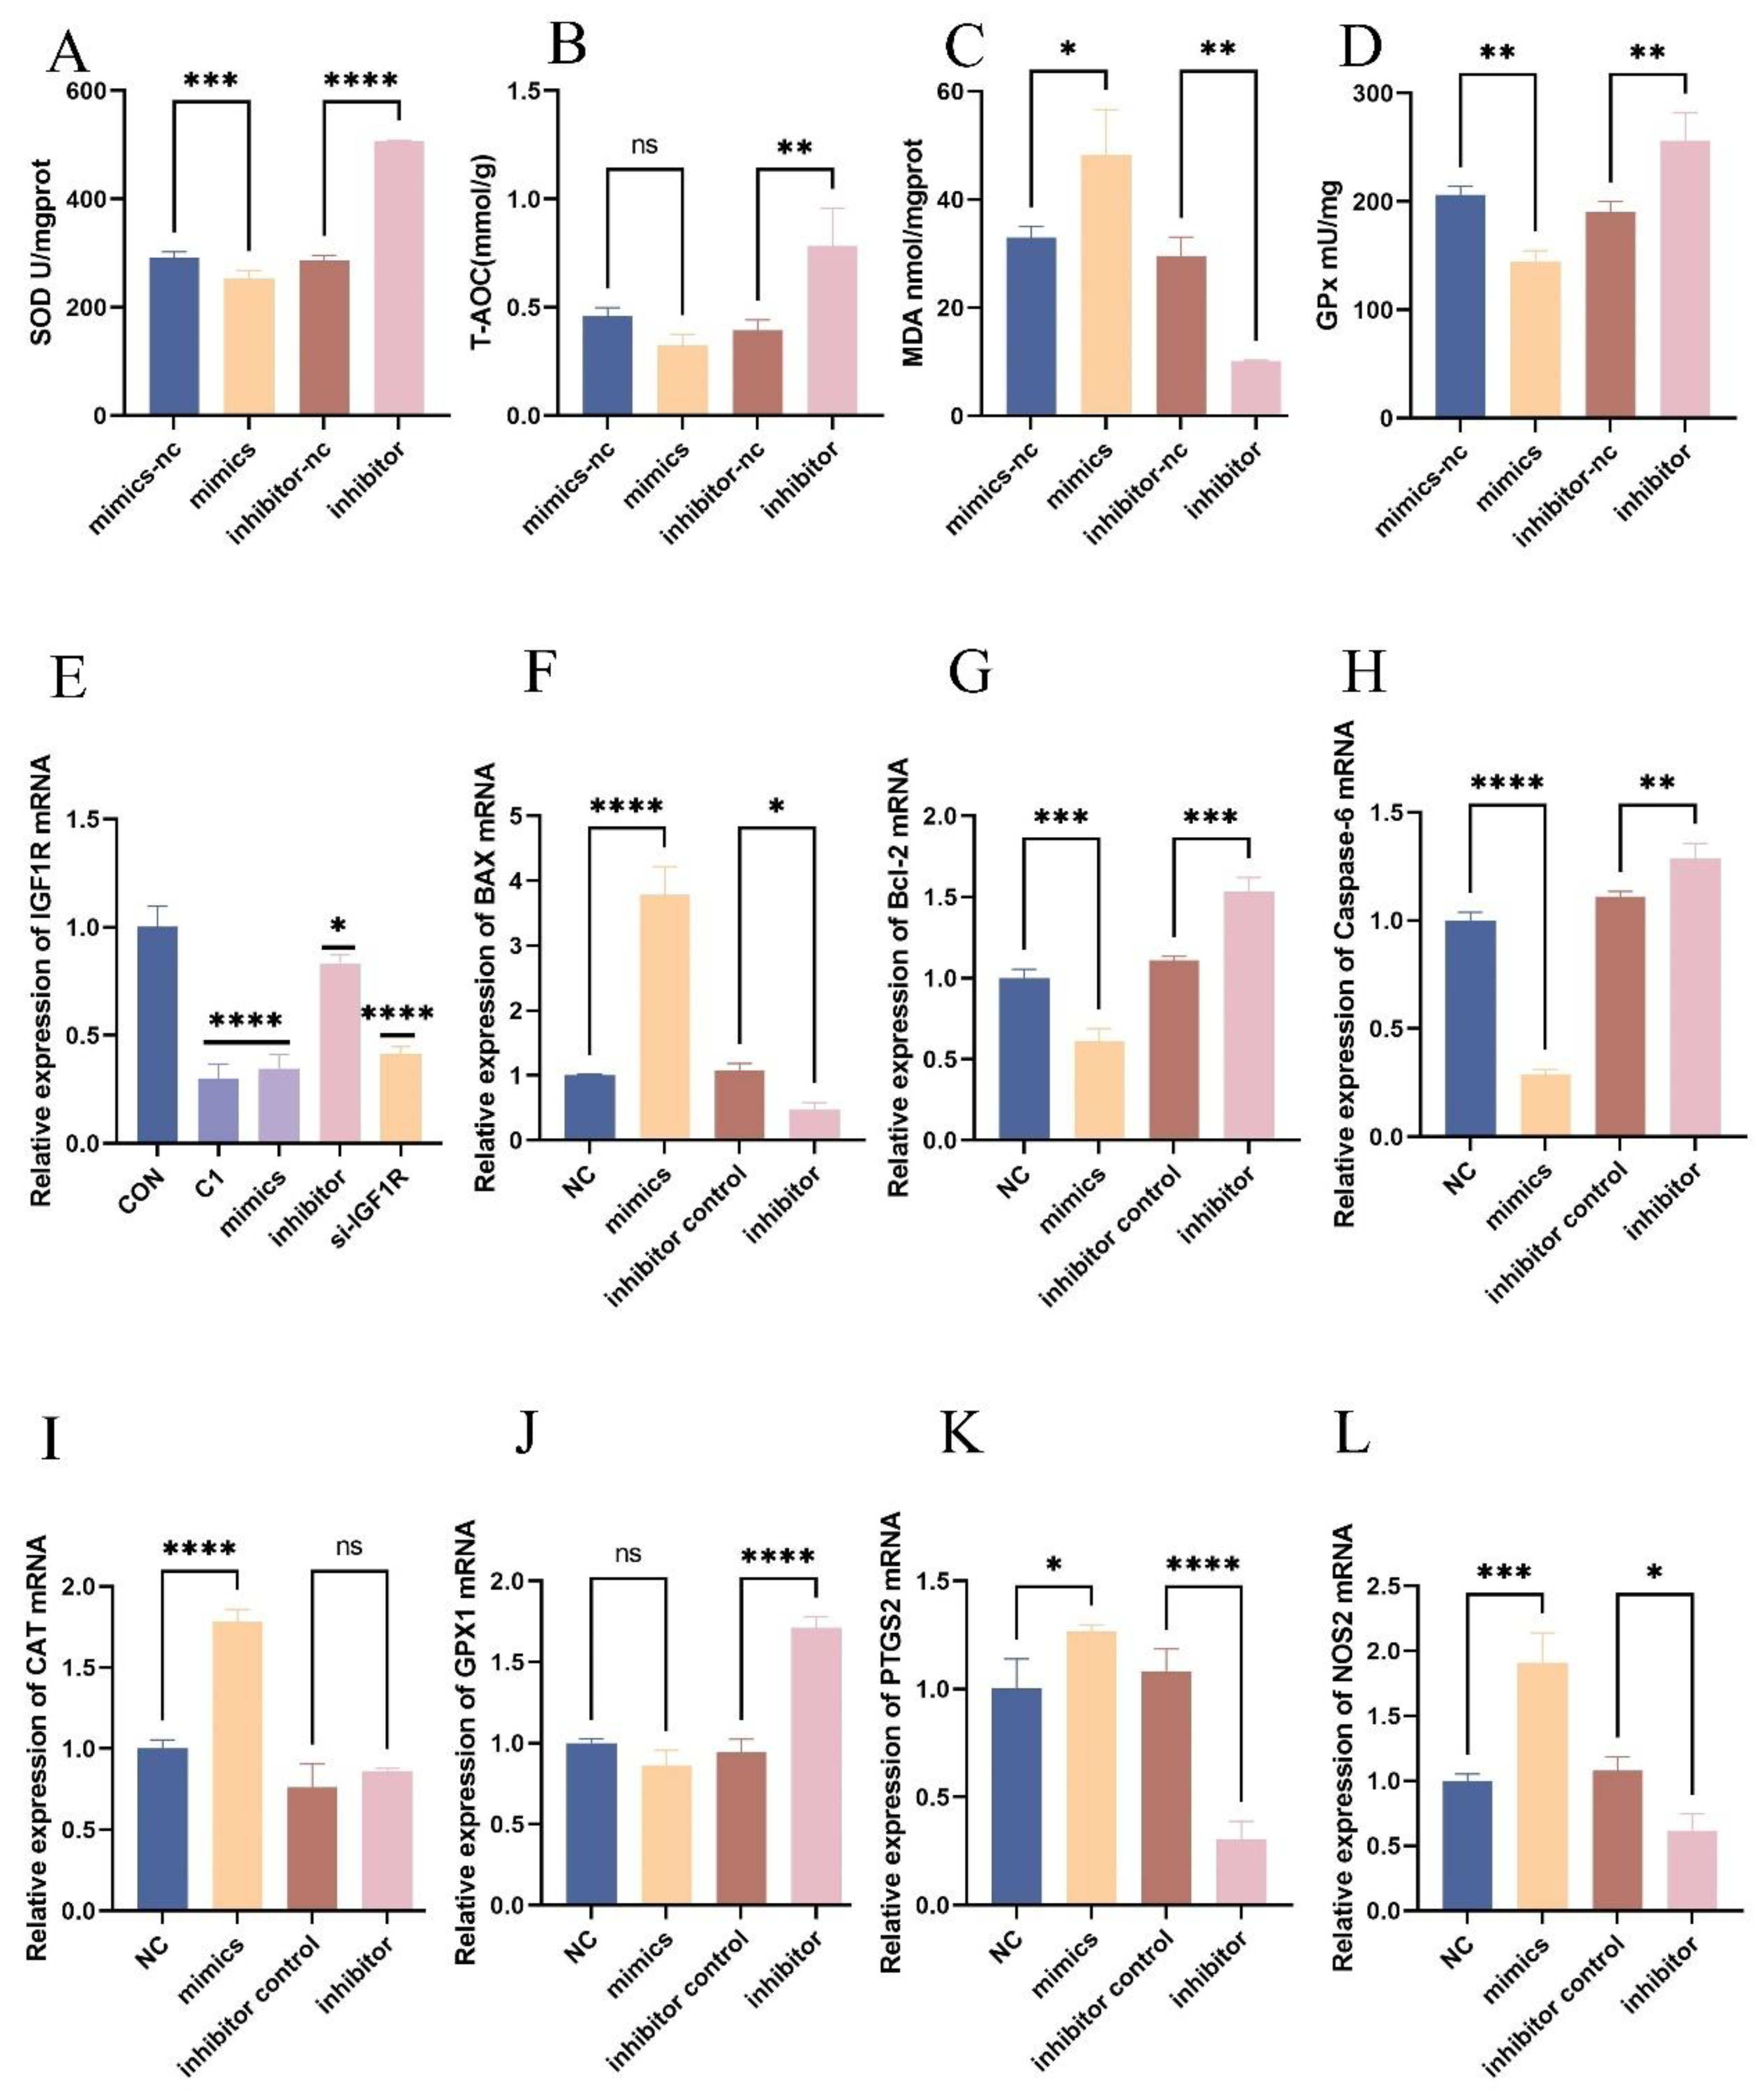
Figure 5.
Interaction between IGF1R and let-7d in the Signaling Pathway. (I) BEECs were transfected with bta-let-7d mimics and negative controls, and the expression levels of PI3K pathway-related proteins were detected using Western blotting. (K) The grey values of the specified proteins were quantified using ImageJ gel analysis software. (C) BEECs were transfected with bta-let-7d inhibitors and their negative controls, and PI3K pathway-related proteins were detected by Western blotting. (L) The grey values of the specified proteins were quantified using ImageJ software. Data are presented as the mean ± SEM of three independent experiments. *P < 0.05; **P < 0.01,***P < 0.001,****P < 0.0001.
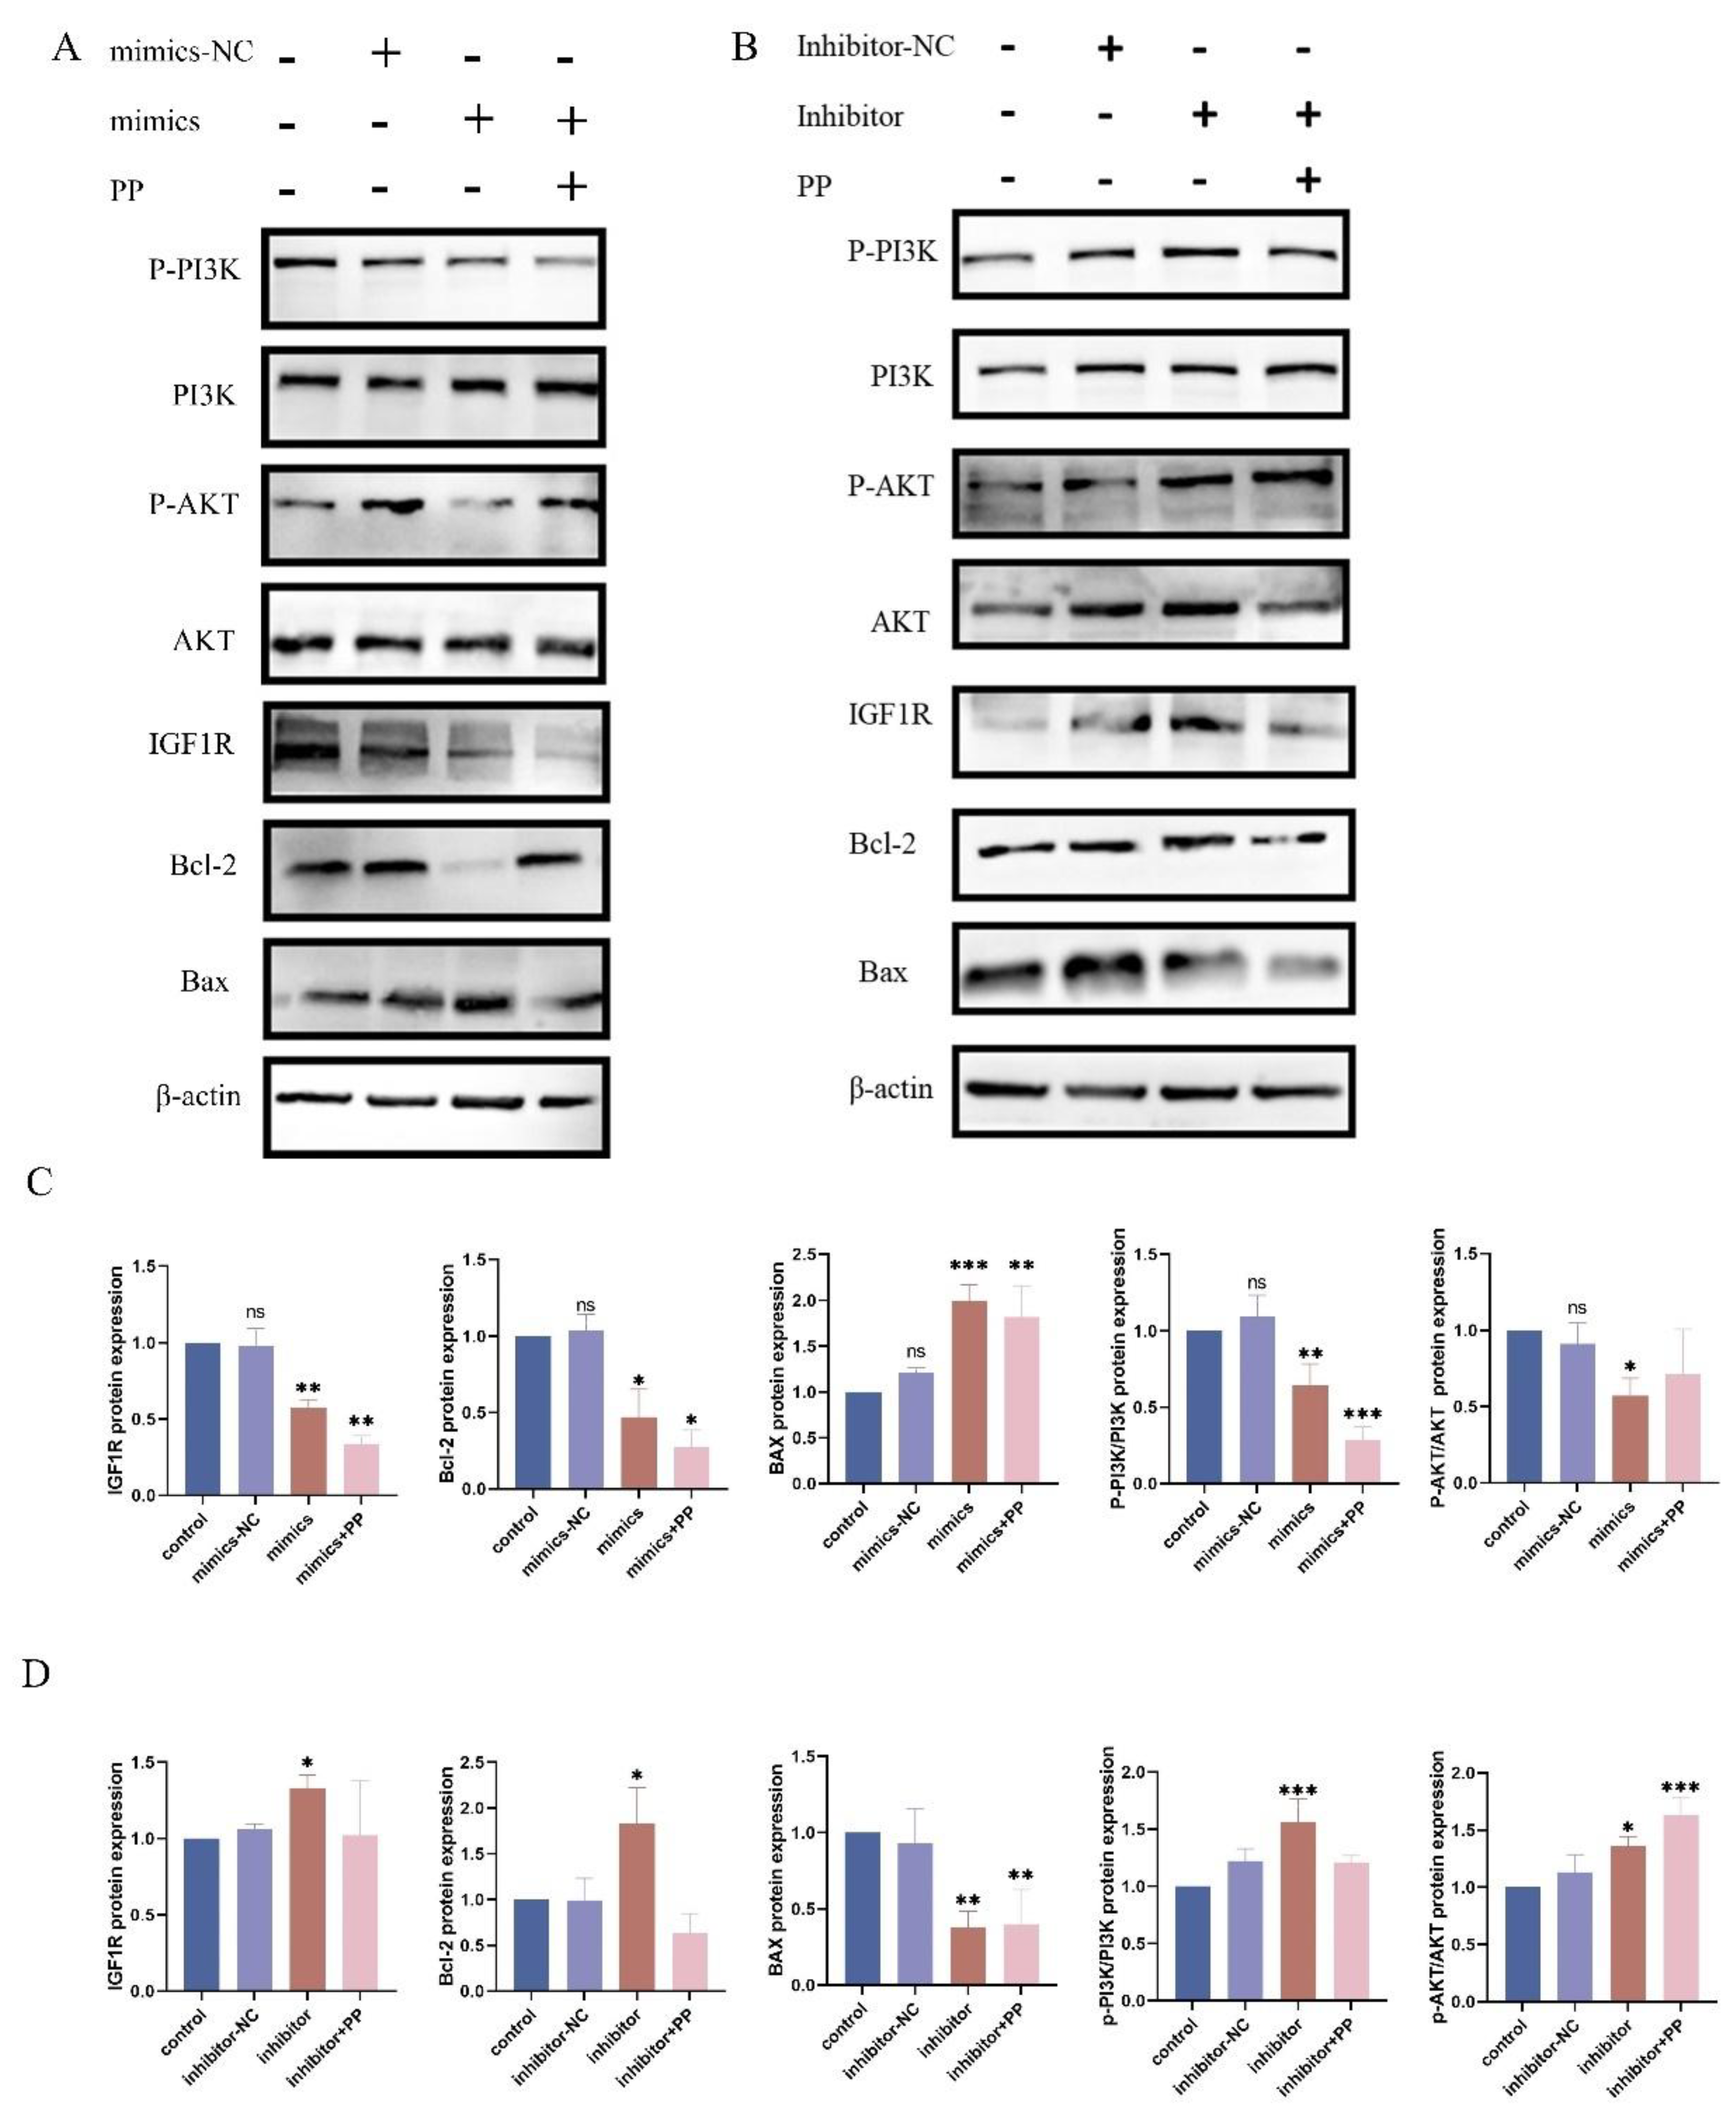
Figure 6.
IGF1R is a Target Gene of let-7d. (A) Conservation of the let-7d target sequence in IGF1R across different species and the predicted alignment between bta-let-7d and IGF1R 3’-UTR calculated by TargetScan and miRDB (bottom). (B-C) Schematic showing the construction of wild-type and mutant plasmids containing the 3’-UTR of IGF1R with or without the predicted bta-let-7d binding site for dual-luciferase reporter assays. (D) 293T cells were transfected with bta-let-7d mimics and their negative controls, and luciferase activity was measured using a dual-luciferase reporter assay. Luciferase activity is expressed as the ratio of firefly to Renilla luciferase activity. (E-F) RT-qPCR was used to detect the relative expression levels of IGF1R and bta-let-7d, with β-actin and U6 as internal controls, respectively. Data are presented as the mean ± SEM of three independent experiments. *P < 0.05; **P < 0.01,***P < 0.001,****P < 0.0001.
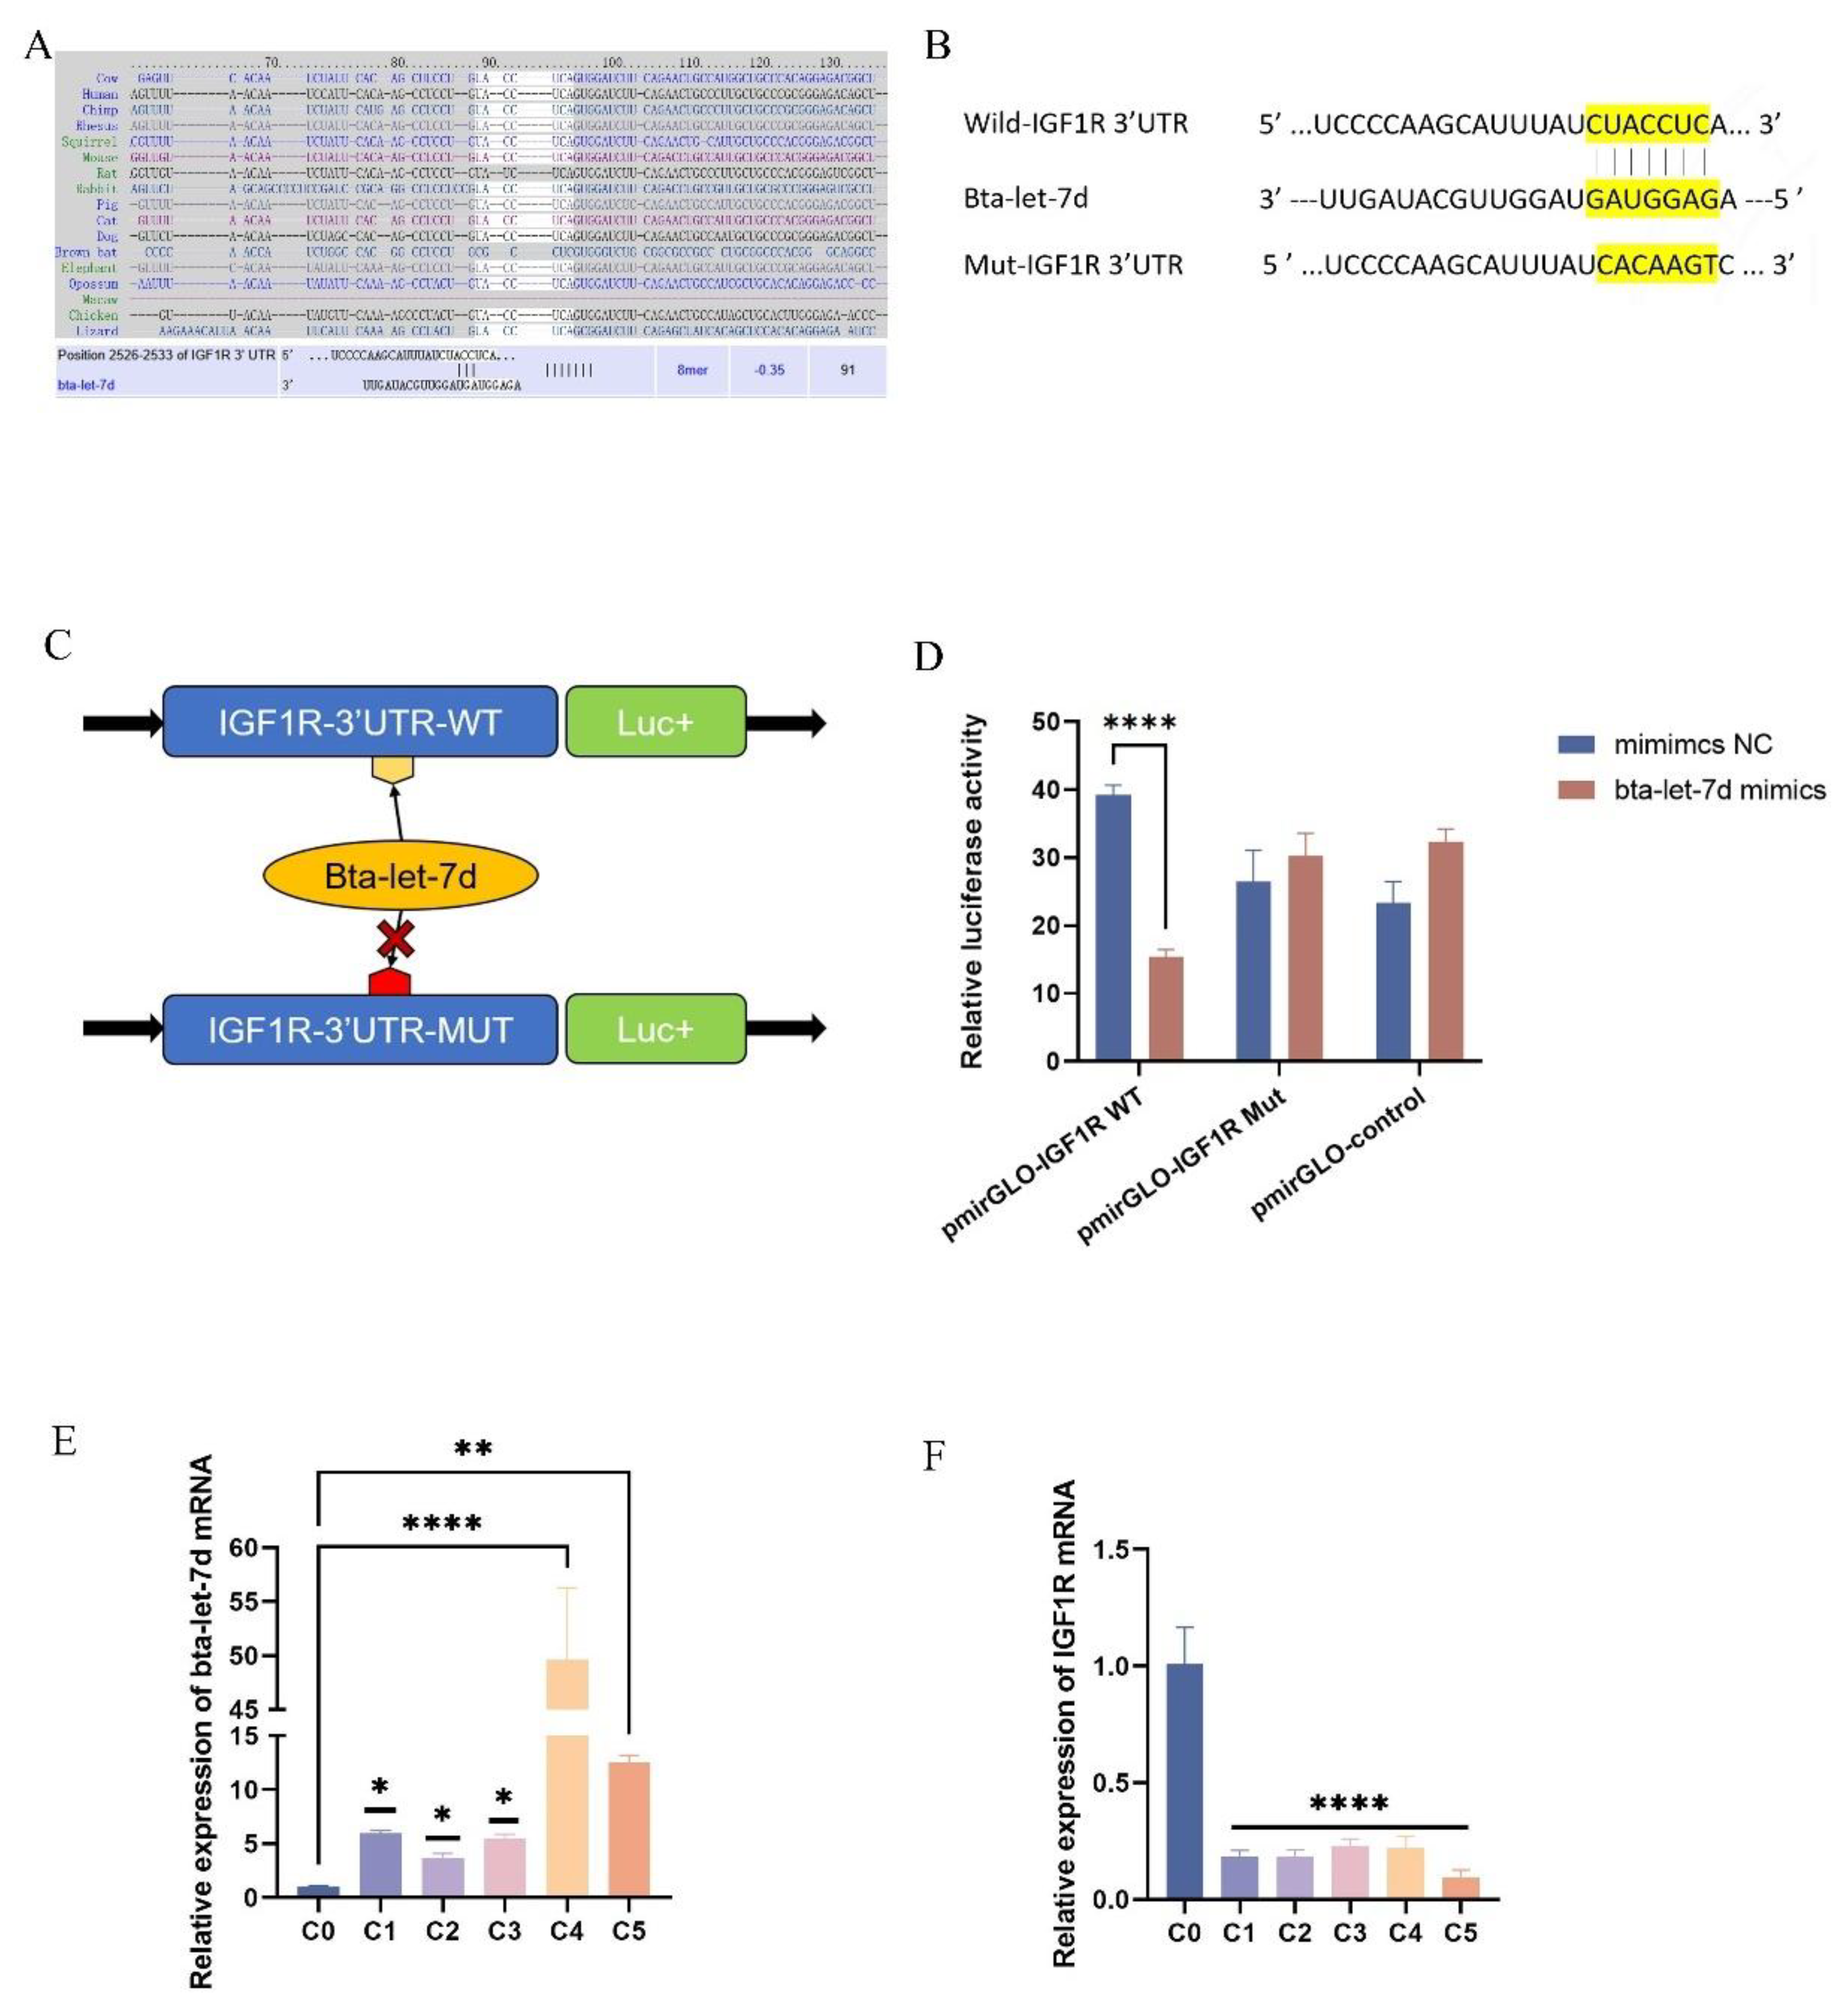
Figure 7.
Negative Regulation of Oxidative Stress by IGF1R. (A, C-F) Western blotting was used to detect the protein expression levels of IGF1R, PI3K, phosphorylated PI3K, AKT, and phosphorylated AKT after IGF1R knockdown, with β-actin as an internal control. The grey values of the specified proteins were quantified using ImageJ software. (B) RT-qPCR measured IGF1R mRNA levels in BEECs transfected with si-NC or si-IGF1R. (G) Total superoxide dismutase (SOD), total antioxidant capacity (T-AOC), lipid peroxidation (MDA), and glutathione peroxidase (GPx) levels were measured in BEECs 24 hours after transfection with si-NC or si-IGF1R. (H) RT-qPCR was used to measure the relative expression levels of GPx1, CAT, SOD, and Nrf2 in BEECs 24 hours after transfection with si-NC or si-IGF1R, with β-actin as an internal control. (I) RT-qPCR was used to measure the relative expression levels of Bax, Bcl-2, Caspase-3, and Caspase-8 in BEECs 24 hours after transfection with si-NC or si-IGF1R, with β-actin as an internal control. (G-J) BEECs were subjected to the same conditions as the previous step. Protein levels were measured using Western blotting, with β-actin as an internal control. The protein bands were quantified using ImageJ. Data are presented as the mean ± SEM of three independent experiments. *P < 0.05; **P < 0.01,***P < 0.001,****P < 0.0001.
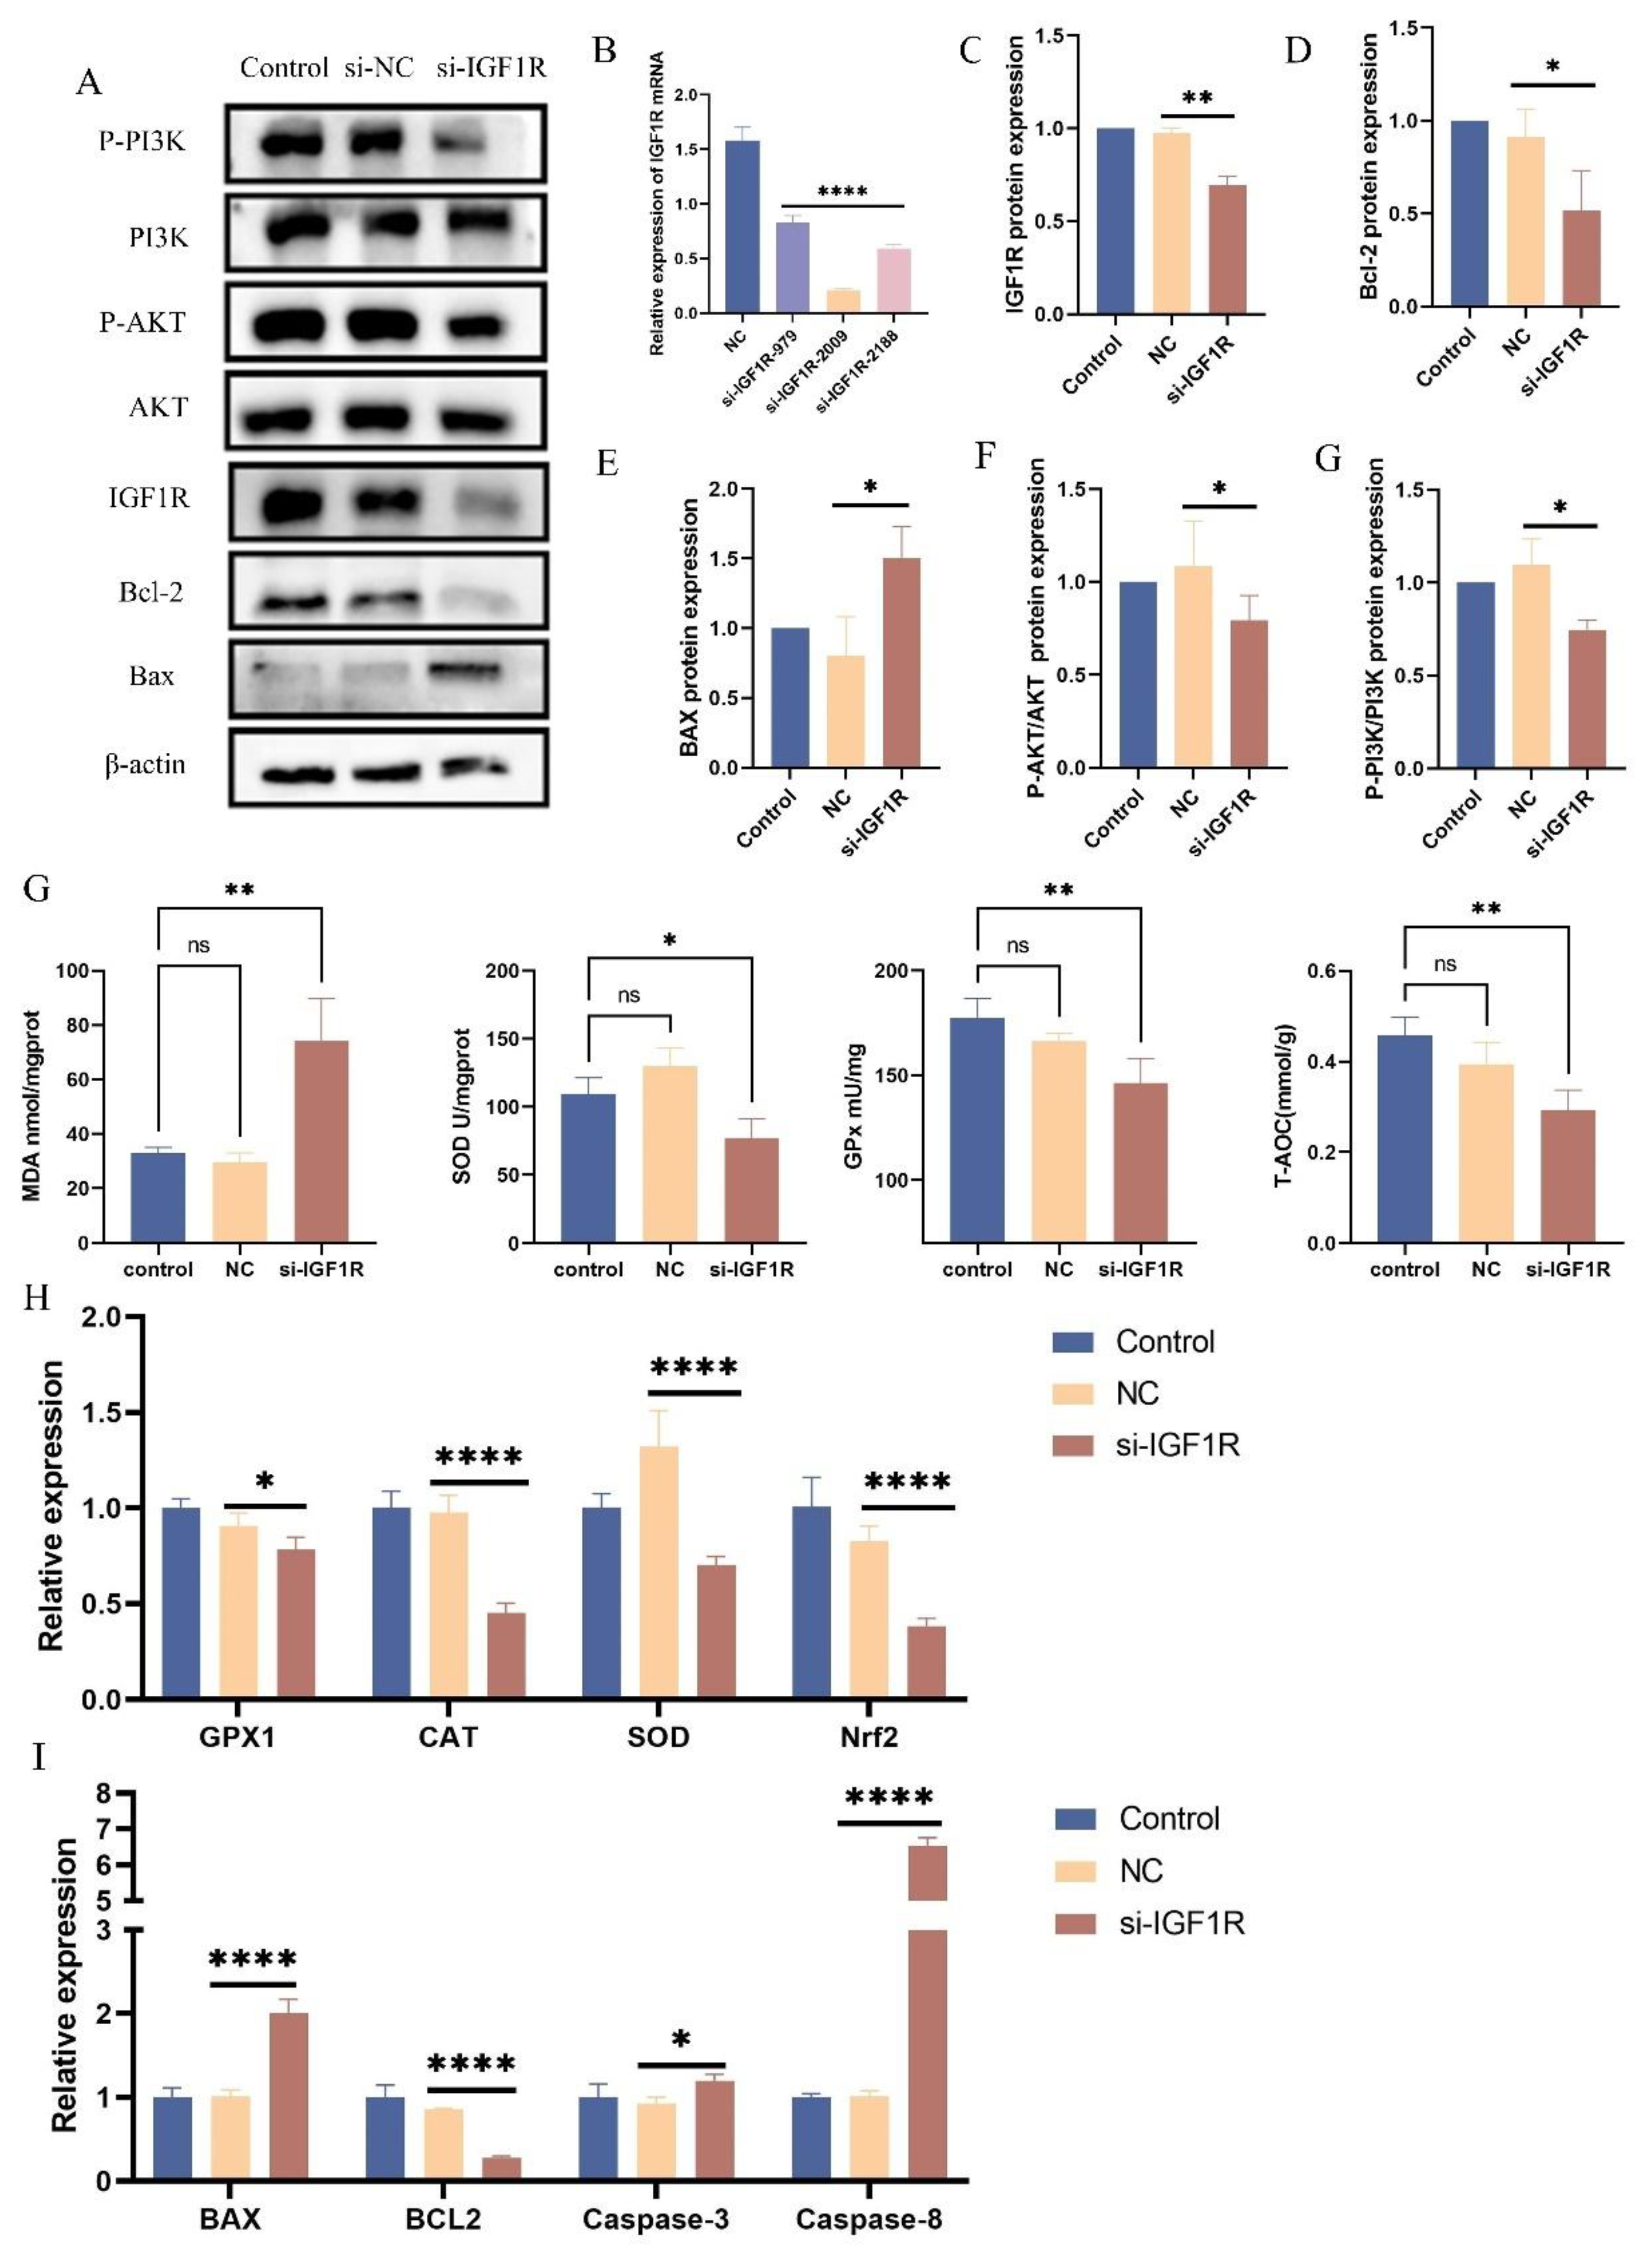
Figure 8.
Potassium Permanganate-Induced Uterine Injury is Associated with IGF1R Expression. (A) Histopathological analysis of rat uterine tissues stained with H&E after potassium permanganate lavage for 12 hours (HE, ×100), scale bar = 100 μm. (B) Quantifying IGF1R protein levels and immunofluorescence staining of IGF1R expression in the tissues, scale bar = 100 μm. Blue indicates nuclei, and red indicates IGF1R-positive staining. (C) Lipid peroxidation (MDA) levels in the tissues above were measured using a commercial kit. Data are presented as the mean ± SEM of three independent experiments. *P < 0.05; **P < 0.01,***P < 0.001,****P < 0.0001.
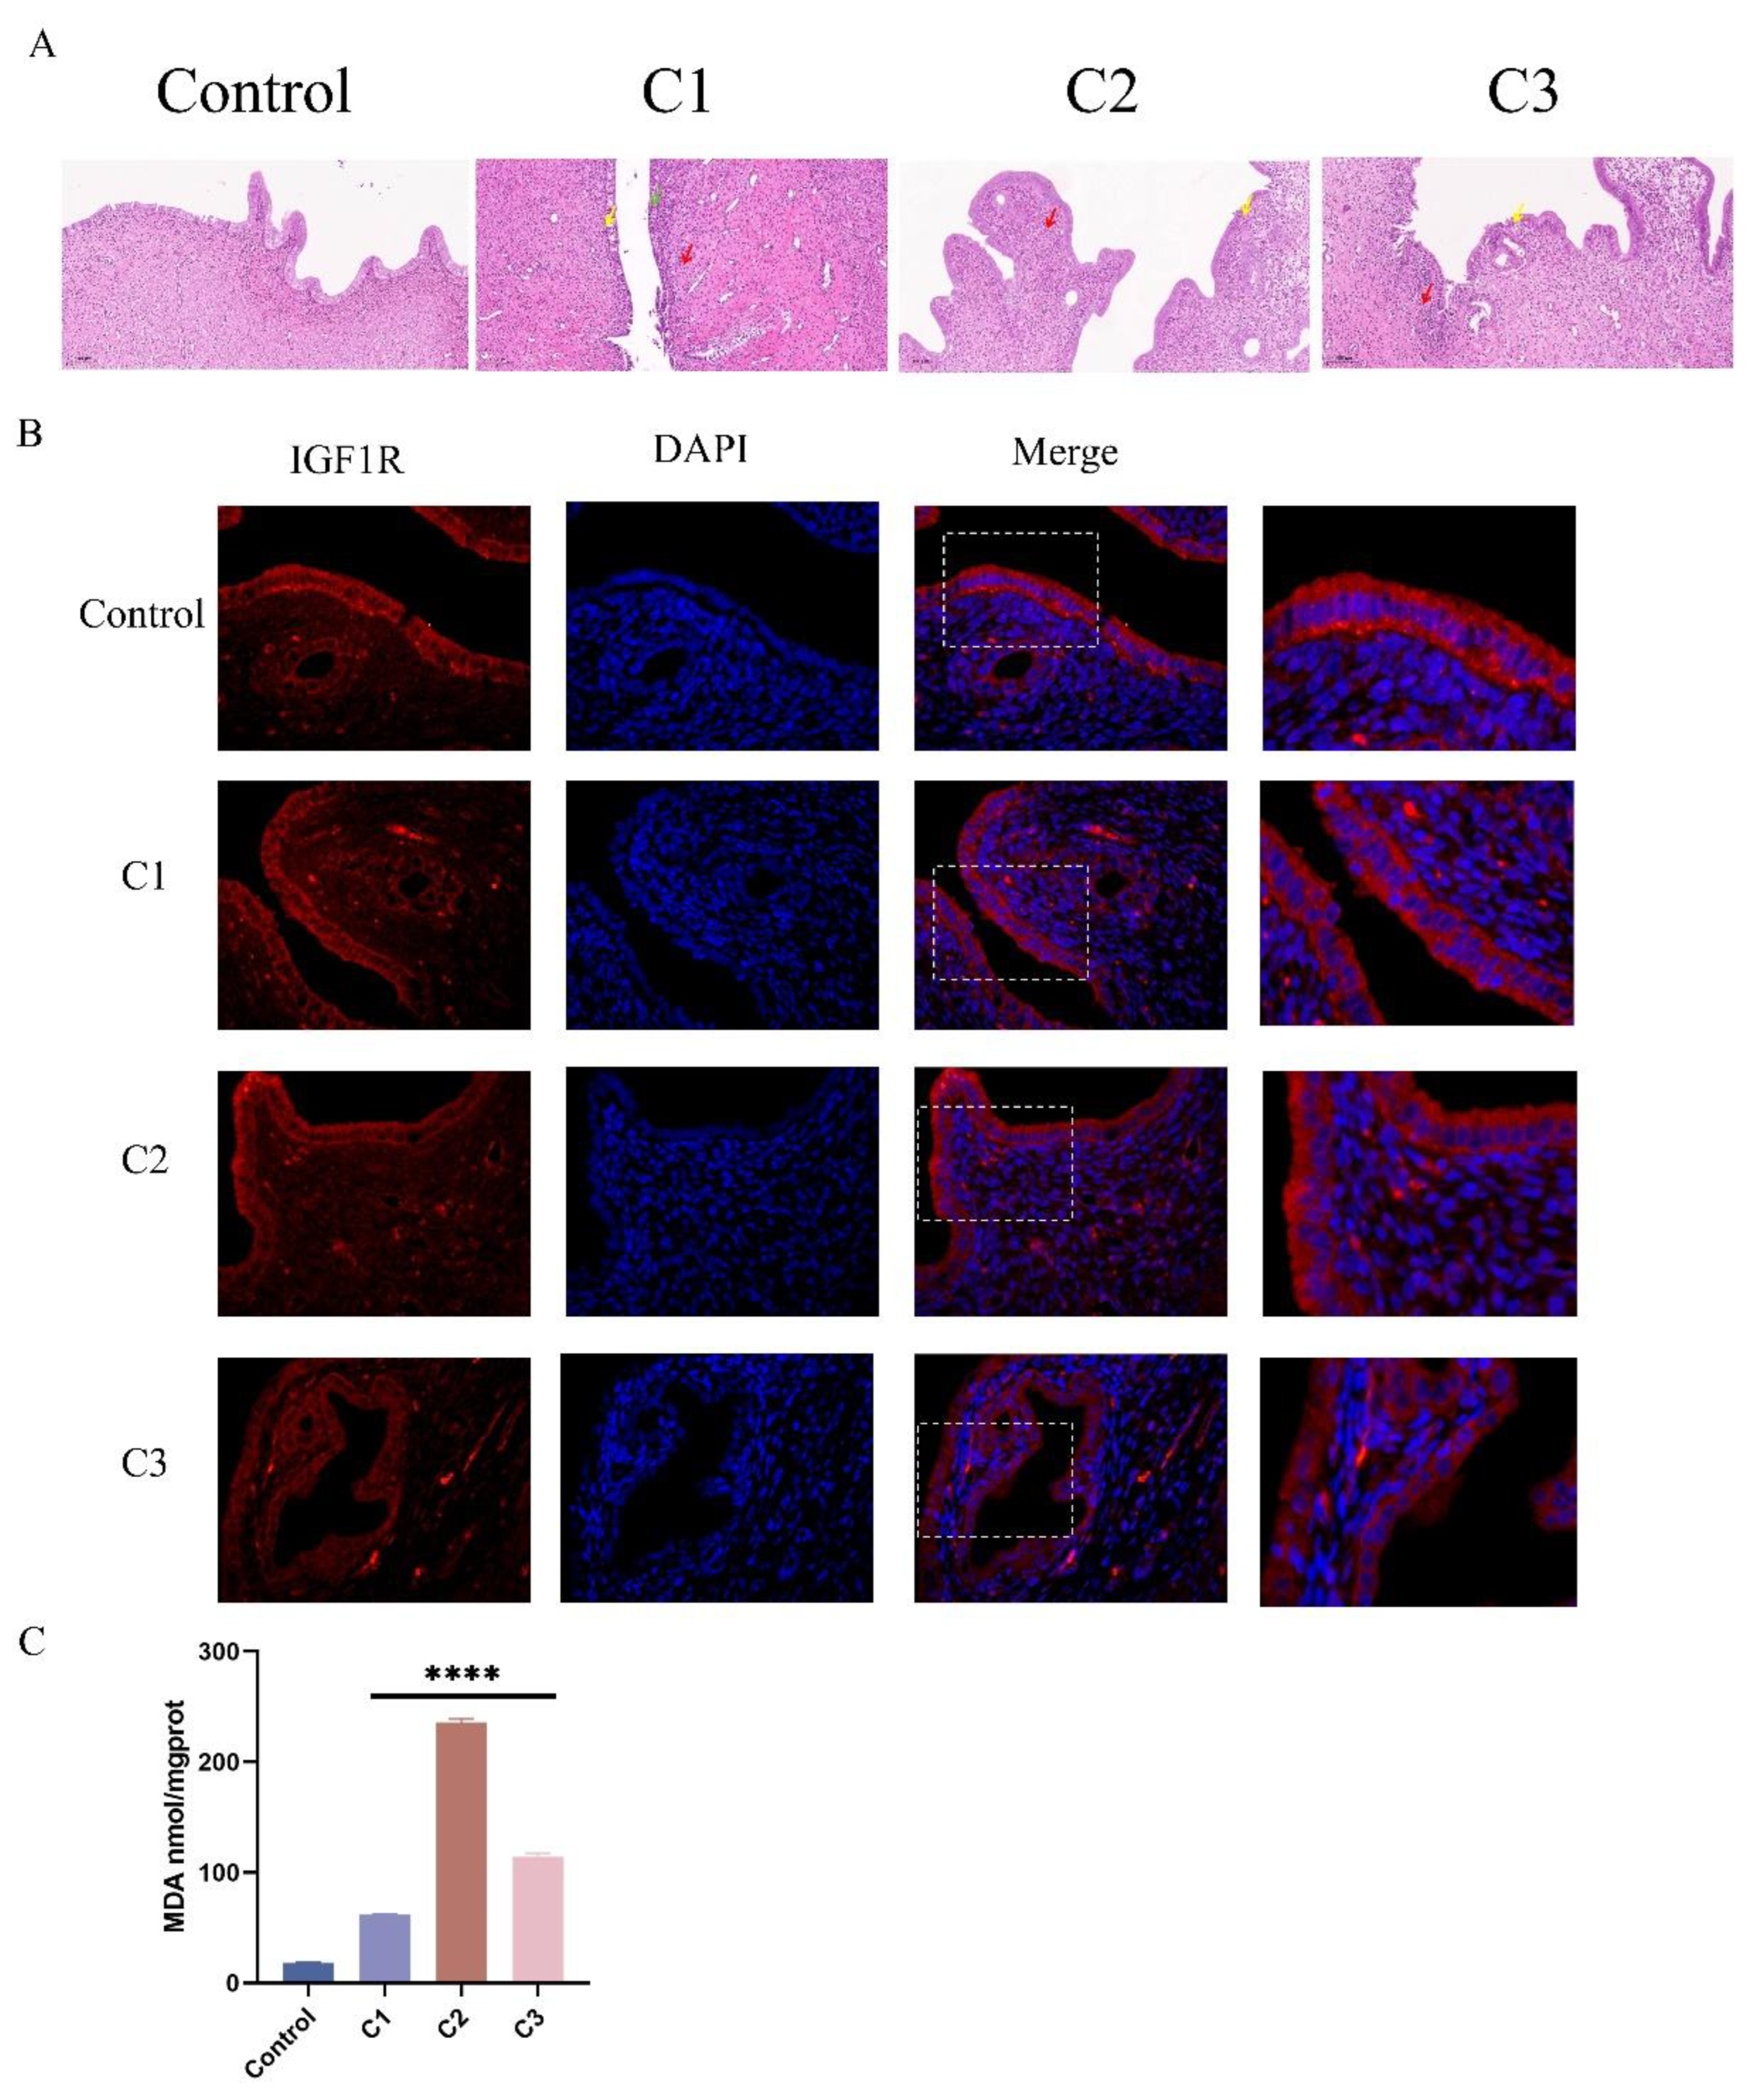

Table 1.
Primers used for qPCR.
| Species | Gene name | Primer sequence (5'–3') | GenBank accession number | Product size (bp) |
|---|---|---|---|---|
| Bos taurus | IGF1R | Forward: CCAAAACCGAAGCTGAGAAG | XM_054377836.1 | 199 |
| Reverse: TCCGGGTCTGTGATGTTGTA | ||||
| GPx1 | Forward: CTTGCTGCTTGGCGGTCA | NM_174076.3 | 139 | |
| Reverse: AGGGGAGGCTGGGATGGAT | ||||
| SOD3 | Forward: CTTCTTCCACCTTGAGGGCTTC | NM_001428313.1 | 125 | |
| Reverse: CGGACATCGGGTTGTAGTGC | ||||
| CAT | Forward: CTGGGACCCAACTATCTCCA | NM_001035386.2 | 148 | |
| Reverse: GATGCTCGGGAGCACTAAAG | ||||
| Nrf2 | Forward: GGTTGCCCACATTCCCAAATC | XM_005202314.5 | 119 | |
| Reverse: CAAGTGACTGAAACGTAGCCG | ||||
| NOS2 | Forward: ACCTACCAGCTGACGGGAGAT | XM_024979646.2 | 316 | |
| Reverse: TGGCAGGGTCCCCTCTGATG | ||||
| Ptgs2 | Forward: TCCTGAAACCCACTCCCAACA | NM_174445.2 | 242 | |
| Reverse: TGGGCAGTCAGGCACAG | ||||
| Bax | Forward: CAGATCATGAAGACAGGGGC | NM_173894.1 | 389 | |
| Reverse: CGCTCTCGAAGGAAGTCCAA | ||||
| Bcl-2 | Forward: ATGTGTGTGGAGAGCGTCAA | NM_001166486.1 | 143 | |
| Reverse: GGGCCATACAGCTCCACAAA | ||||
| Caspase-3 | Forward: AAGCCATGGTGAAGAAGGAA | XM_010820245.4 | 134 | |
| Reverse: GGCAGGCCTGAATAATGAAA | ||||
| Caspase-9 | Forward: CGCCACCATCTTCTCCCTG | XM_024999238.2 | 83 | |
| Reverse: CCAACGTCTCCTTCTCCTCC | ||||
| β-actin | Forward: CATCACCATCGGCAATGAGC | NM_173979.3 | 156 | |
| Reverse: AGCACCGTGTTGGCGTAGAG |
Table 2.
Histological score for Figure A.
| Name | Edema | Necrosis | Hemorrhages | Endothelium Damage | Leukocyte Infiltration | Total |
|---|---|---|---|---|---|---|
| C0 | 0 | 0 | 0 | 0 | 0 | 0 |
| C1 | 0 | 0 | 0 | 2 | 1 | 3 |
| C2 | 1 | 0 | 0 | 2 | 1 | 4 |
| C3 | 0 | 0 | 0 | 2 | 1 | 3 |
Disclaimer/Publisher’s Note: The statements, opinions and data contained in all publications are solely those of the individual author(s) and contributor(s) and not of MDPI and/or the editor(s). MDPI and/or the editor(s) disclaim responsibility for any injury to people or property resulting from any ideas, methods, instructions or products referred to in the content. |
© 2025 by the authors. Licensee MDPI, Basel, Switzerland. This article is an open access article distributed under the terms and conditions of the Creative Commons Attribution (CC BY) license (http://creativecommons.org/licenses/by/4.0/).
Copyright: This open access article is published under a Creative Commons CC BY 4.0 license, which permit the free download, distribution, and reuse, provided that the author and preprint are cited in any reuse.


