
Submitted:
27 January 2025
Posted:
28 January 2025
You are already at the latest version
Abstract
The capacity to treat synthetic and real wastewater of a small-scale pilot wastewater treatment plant (WWTP) using the Selective Ion Flow Cells (SIFC) technology (SIC patent title 37239) was evaluated, for this purpose, a one-factorial experimental design was carried out with samples of synthetic wastewater prepared in the laboratory. The relevant factor used was the flow of the sample and the response variables were hydrogen production (clean energy) and different physicochemical parameters: COD, fats and oils, color, pH, conductivity and total solids. The results obtained show that the best flow to treat wastewater was 50 mL/min with a hydraulic retention time (HRT) of 5.33 hours, reducing synthetic wastewater quality parameters such as COD by 90.54 wt %, fats and oils by 93.8 wt %, apparent color by 90.7 %, true color by 85.4 %, conductivity by 80.9 % and total solids by 83.7 wt % which comply with resolution No. 0631 of 2015 for discharges in Colombia.
Keywords:
1. Introduction
2. Materials and Methods
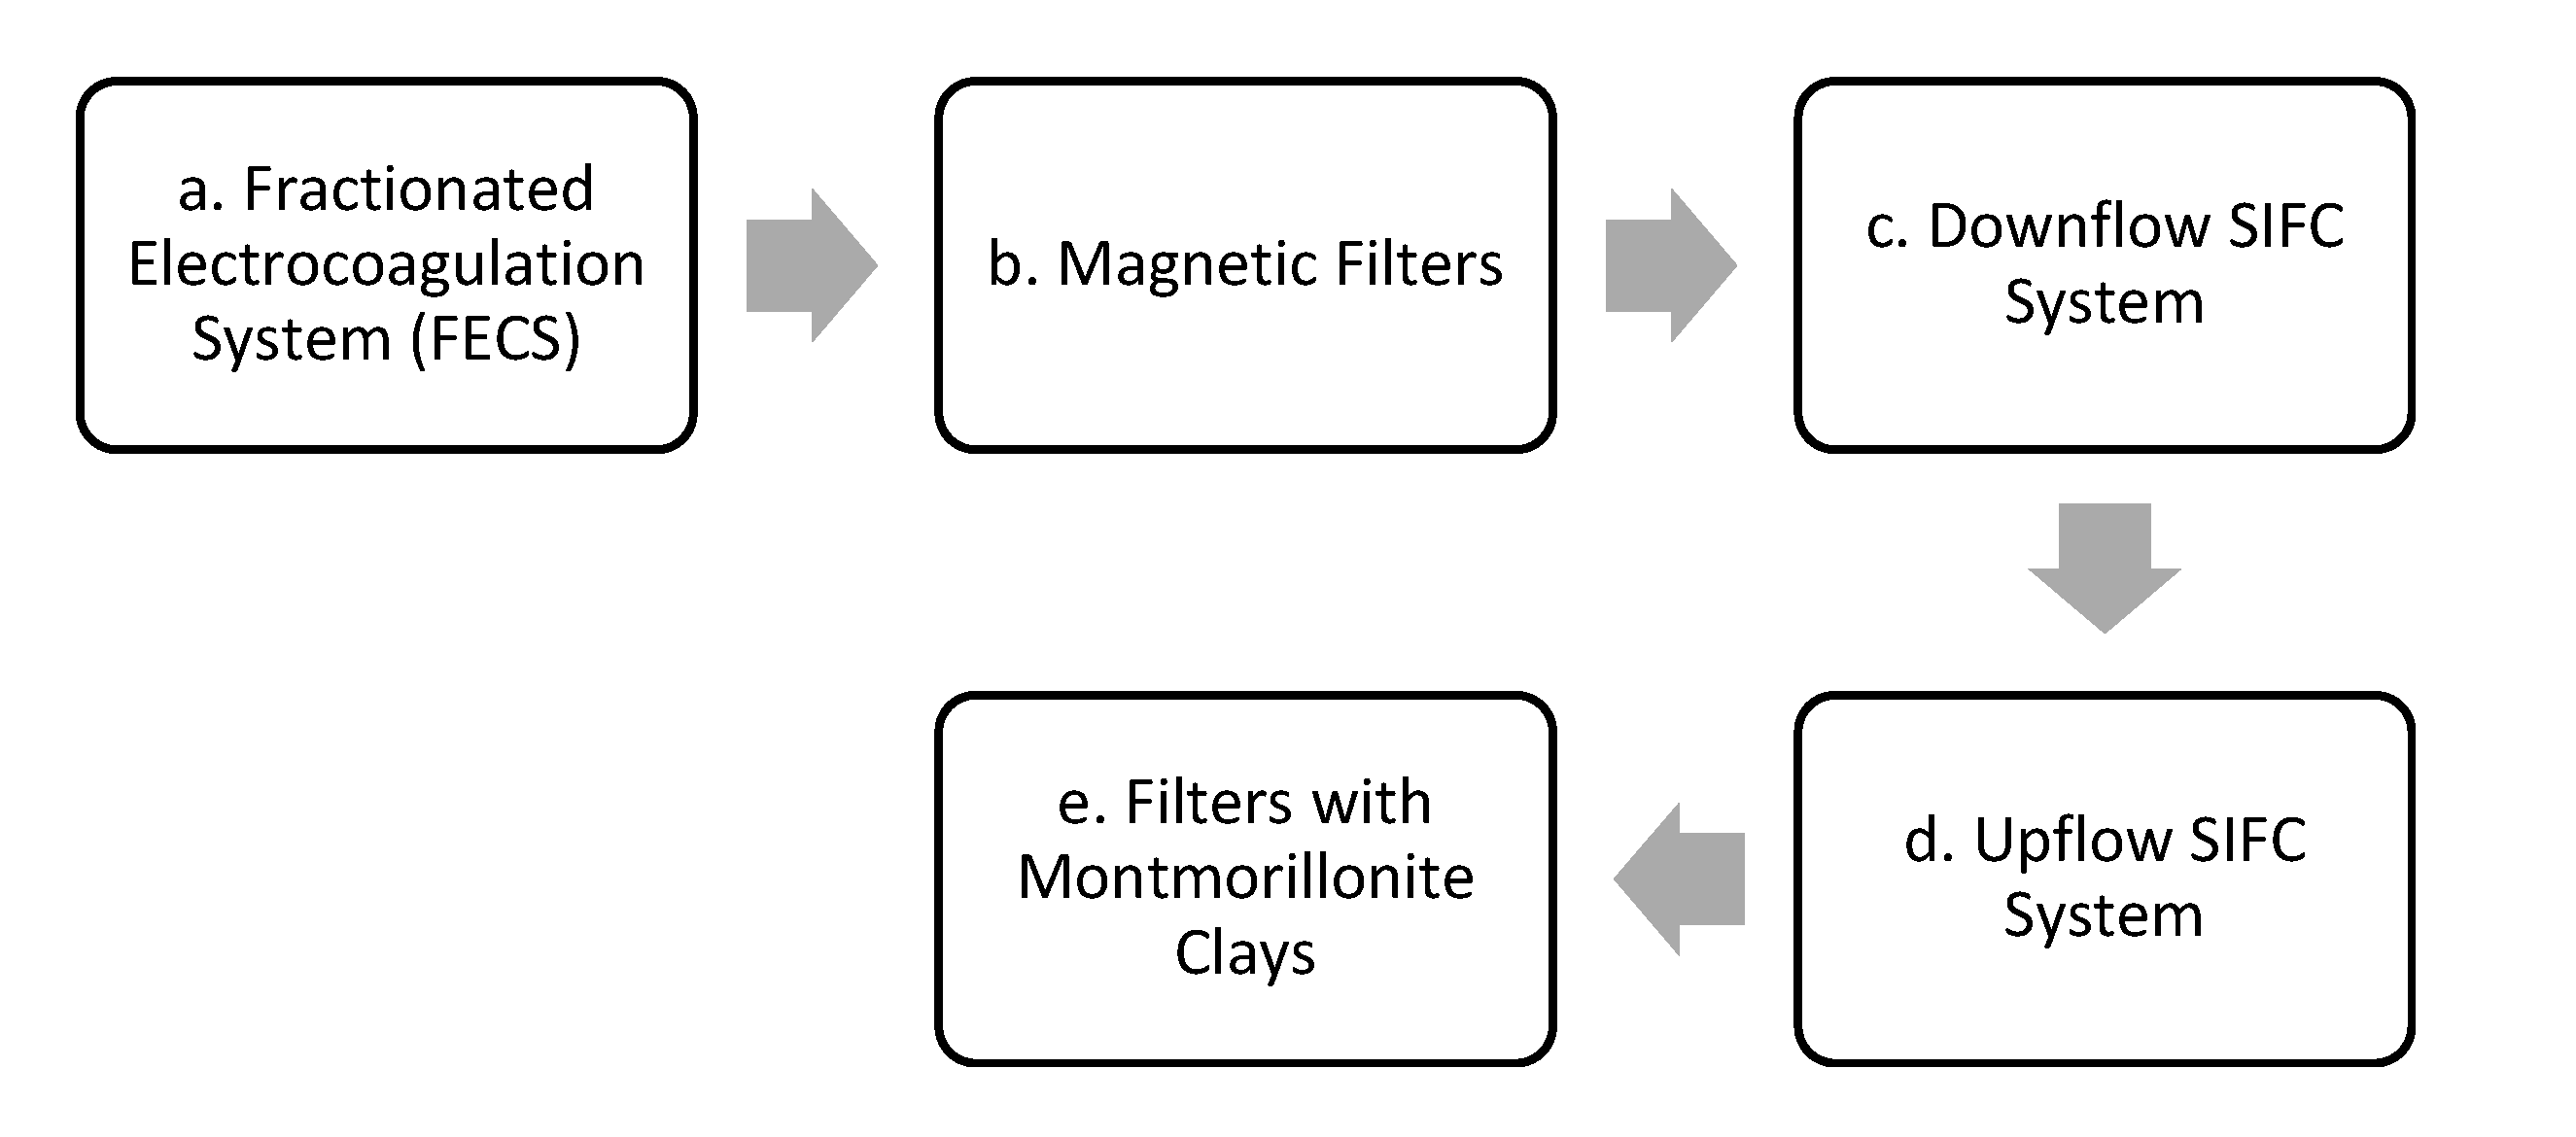
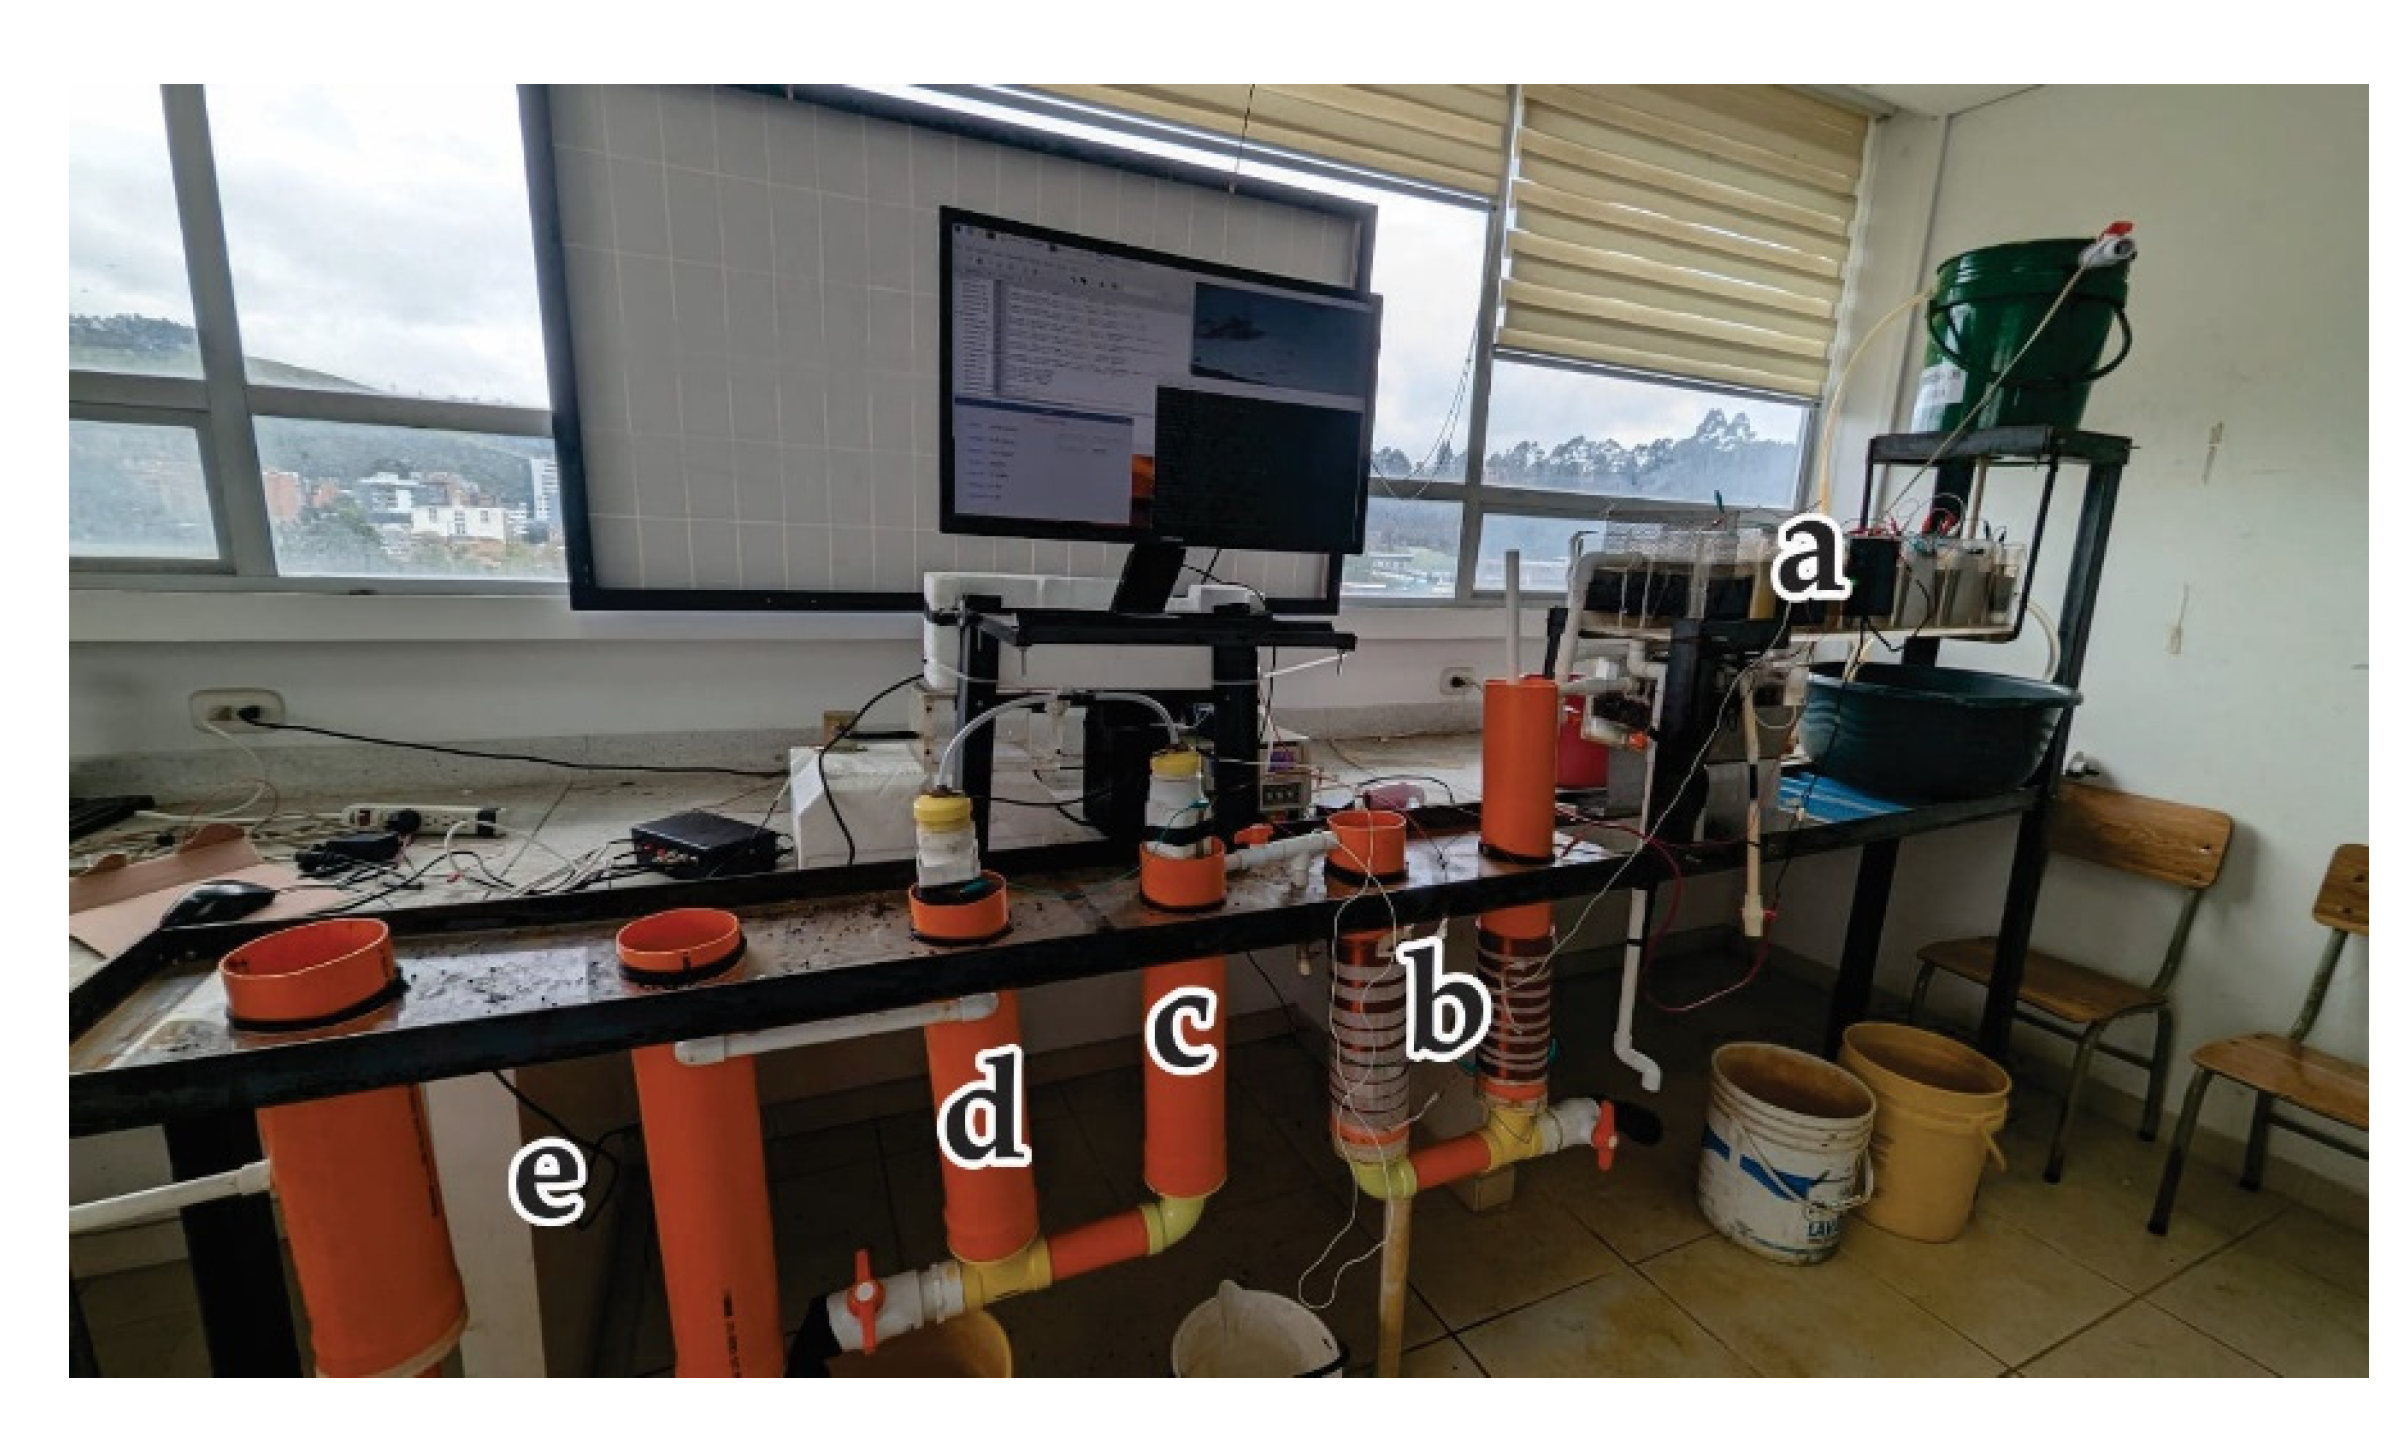
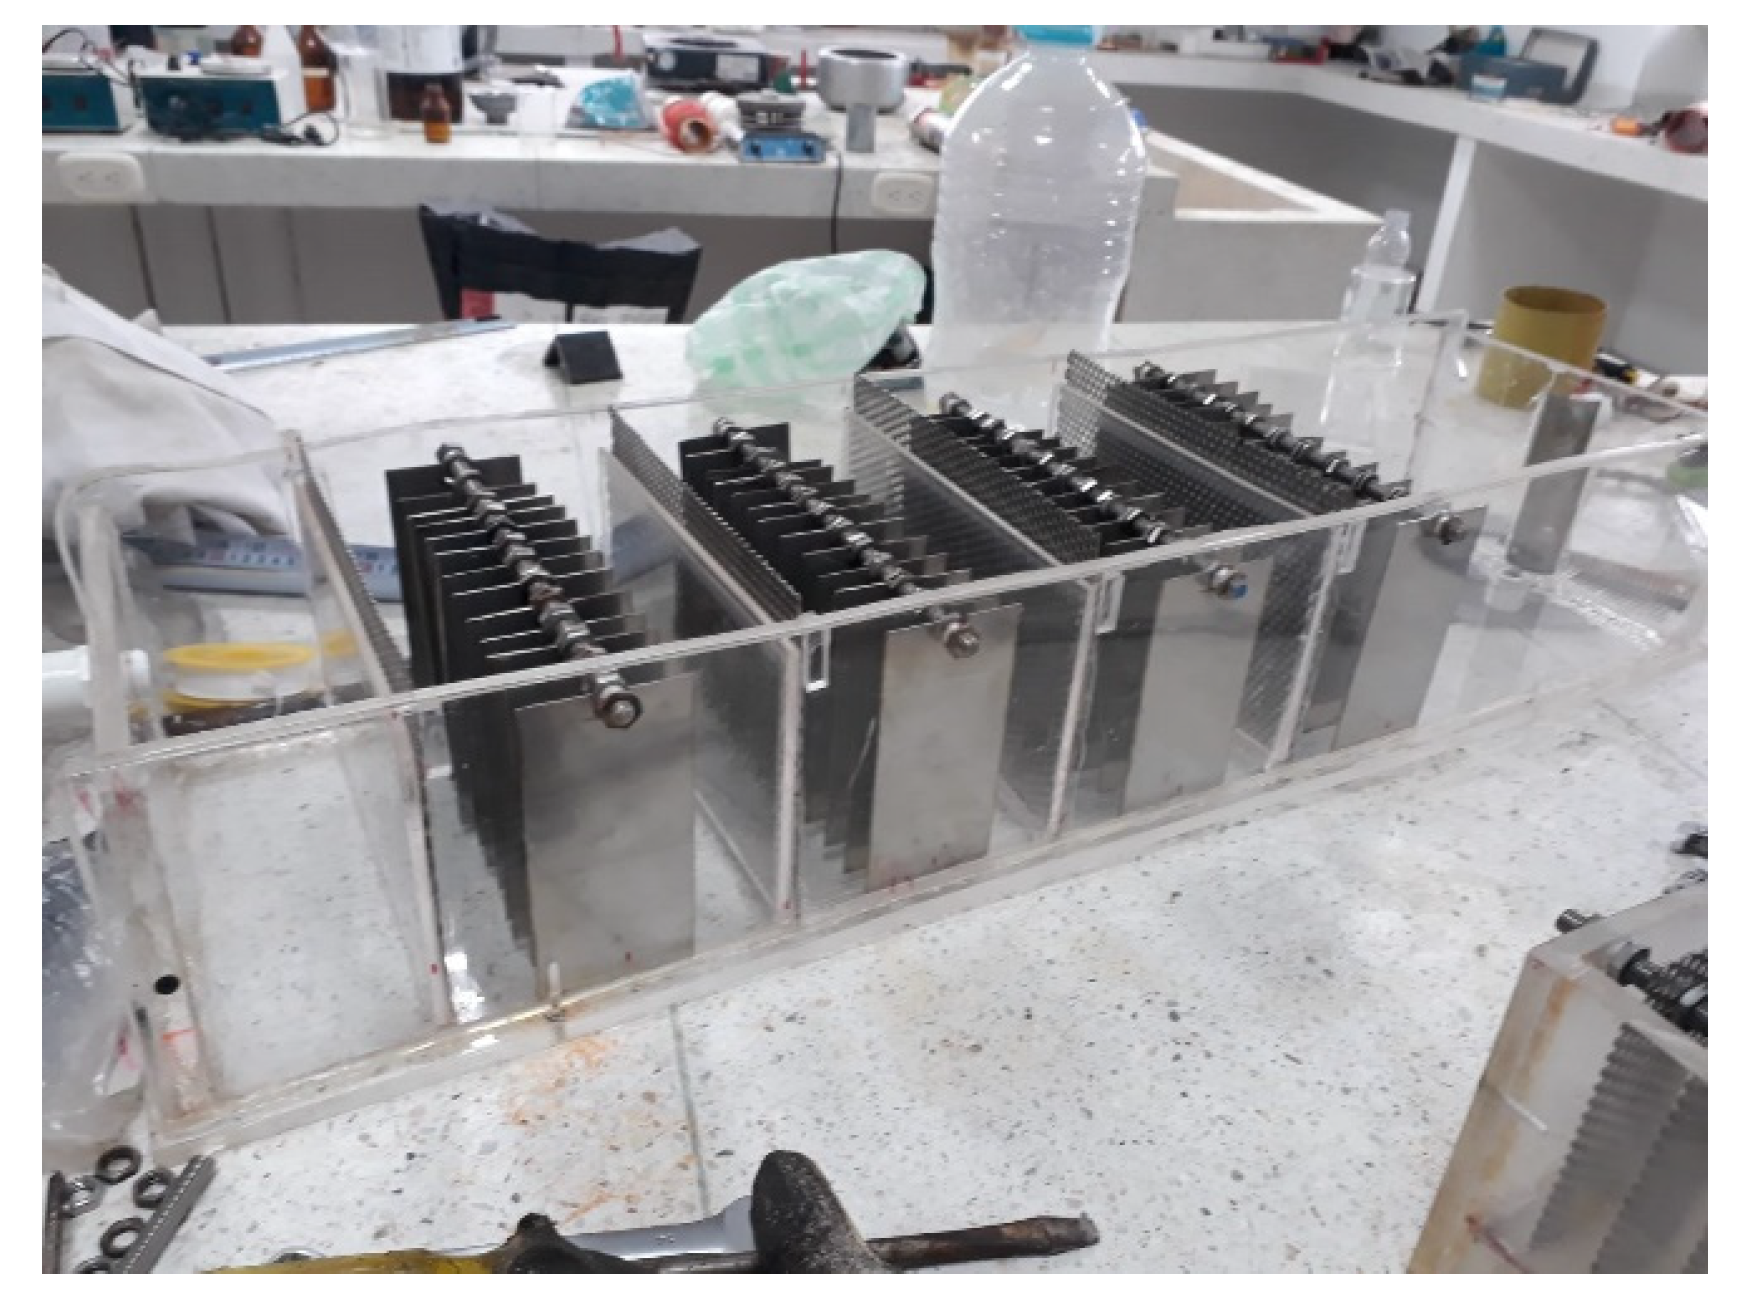
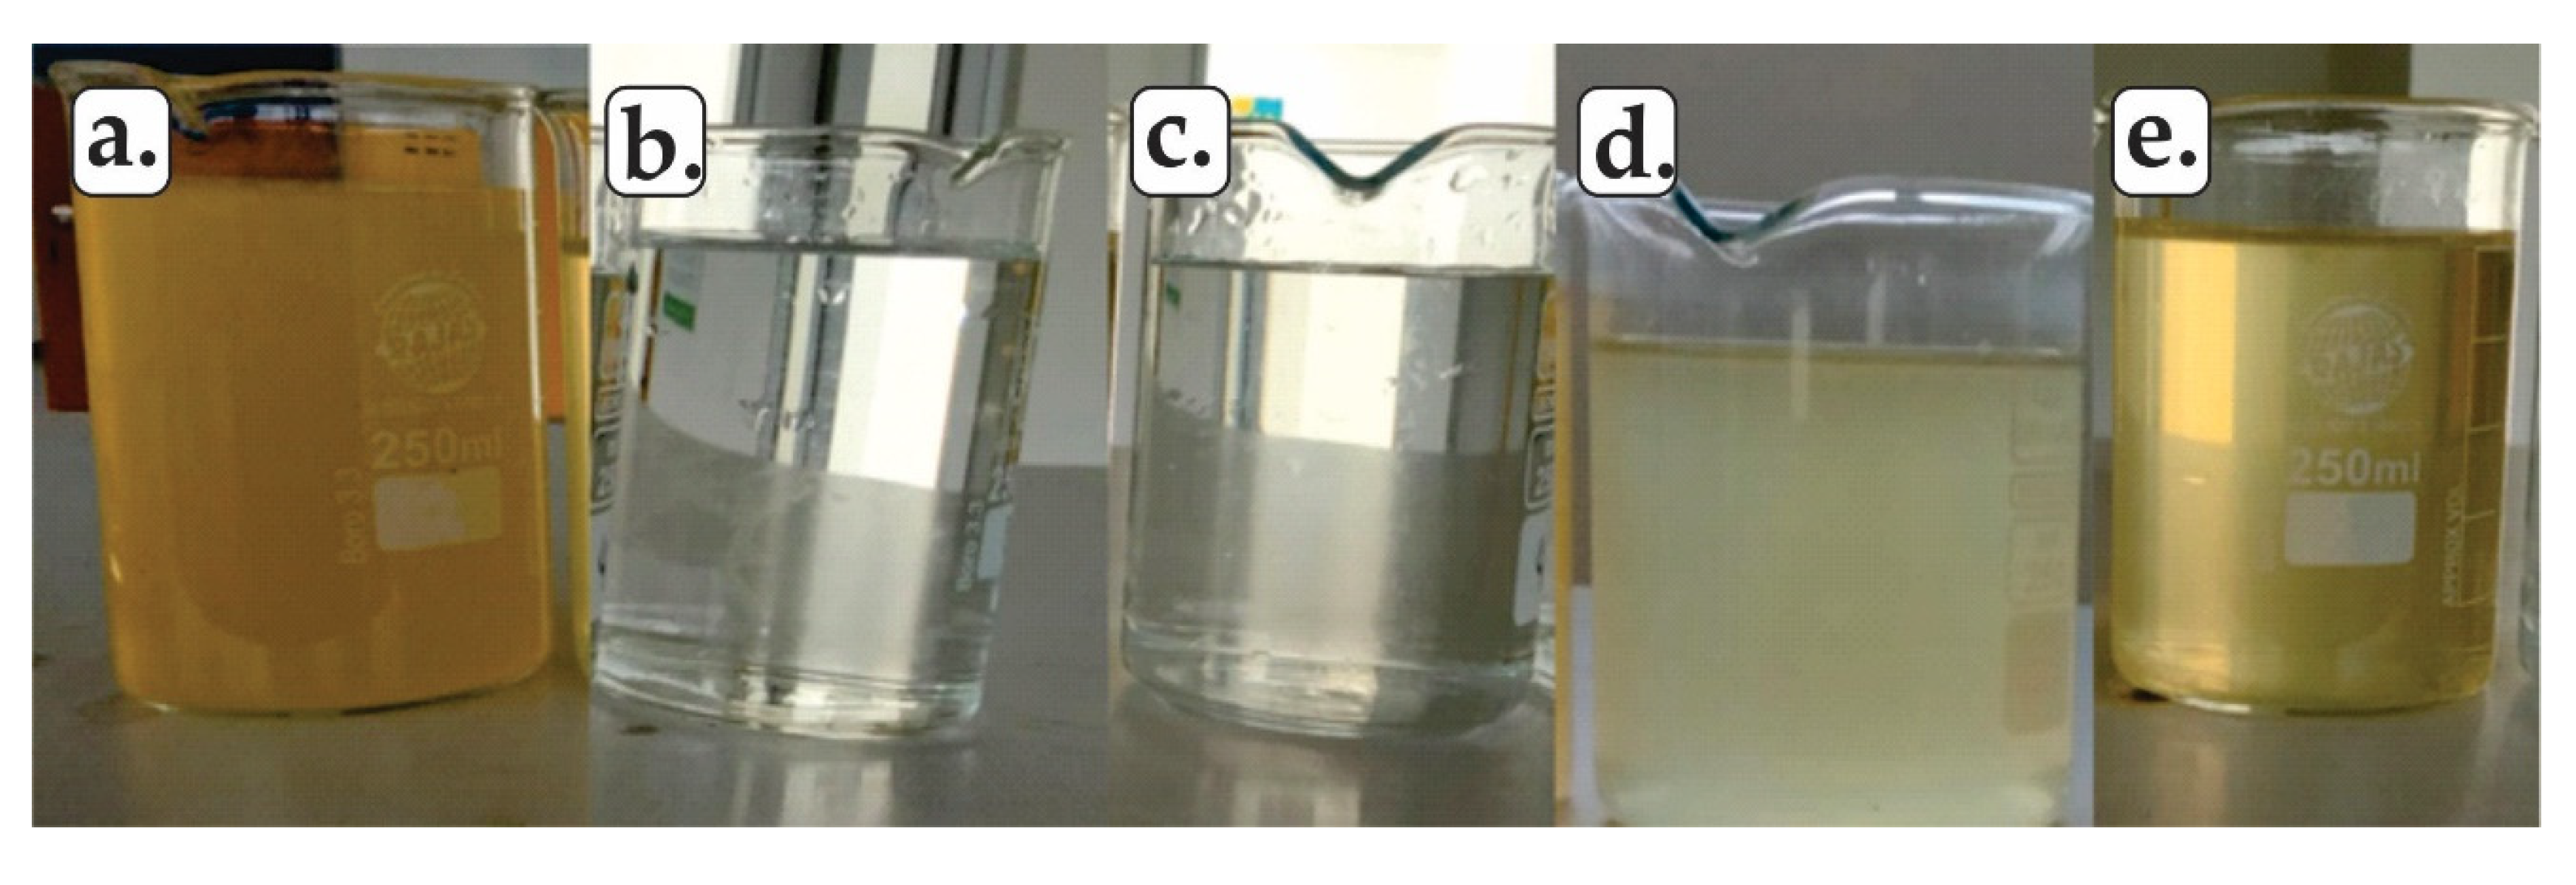
2.1. Fractionated Electrocoagulation System (FECS)—a
2.2. Magnetic Filters—b
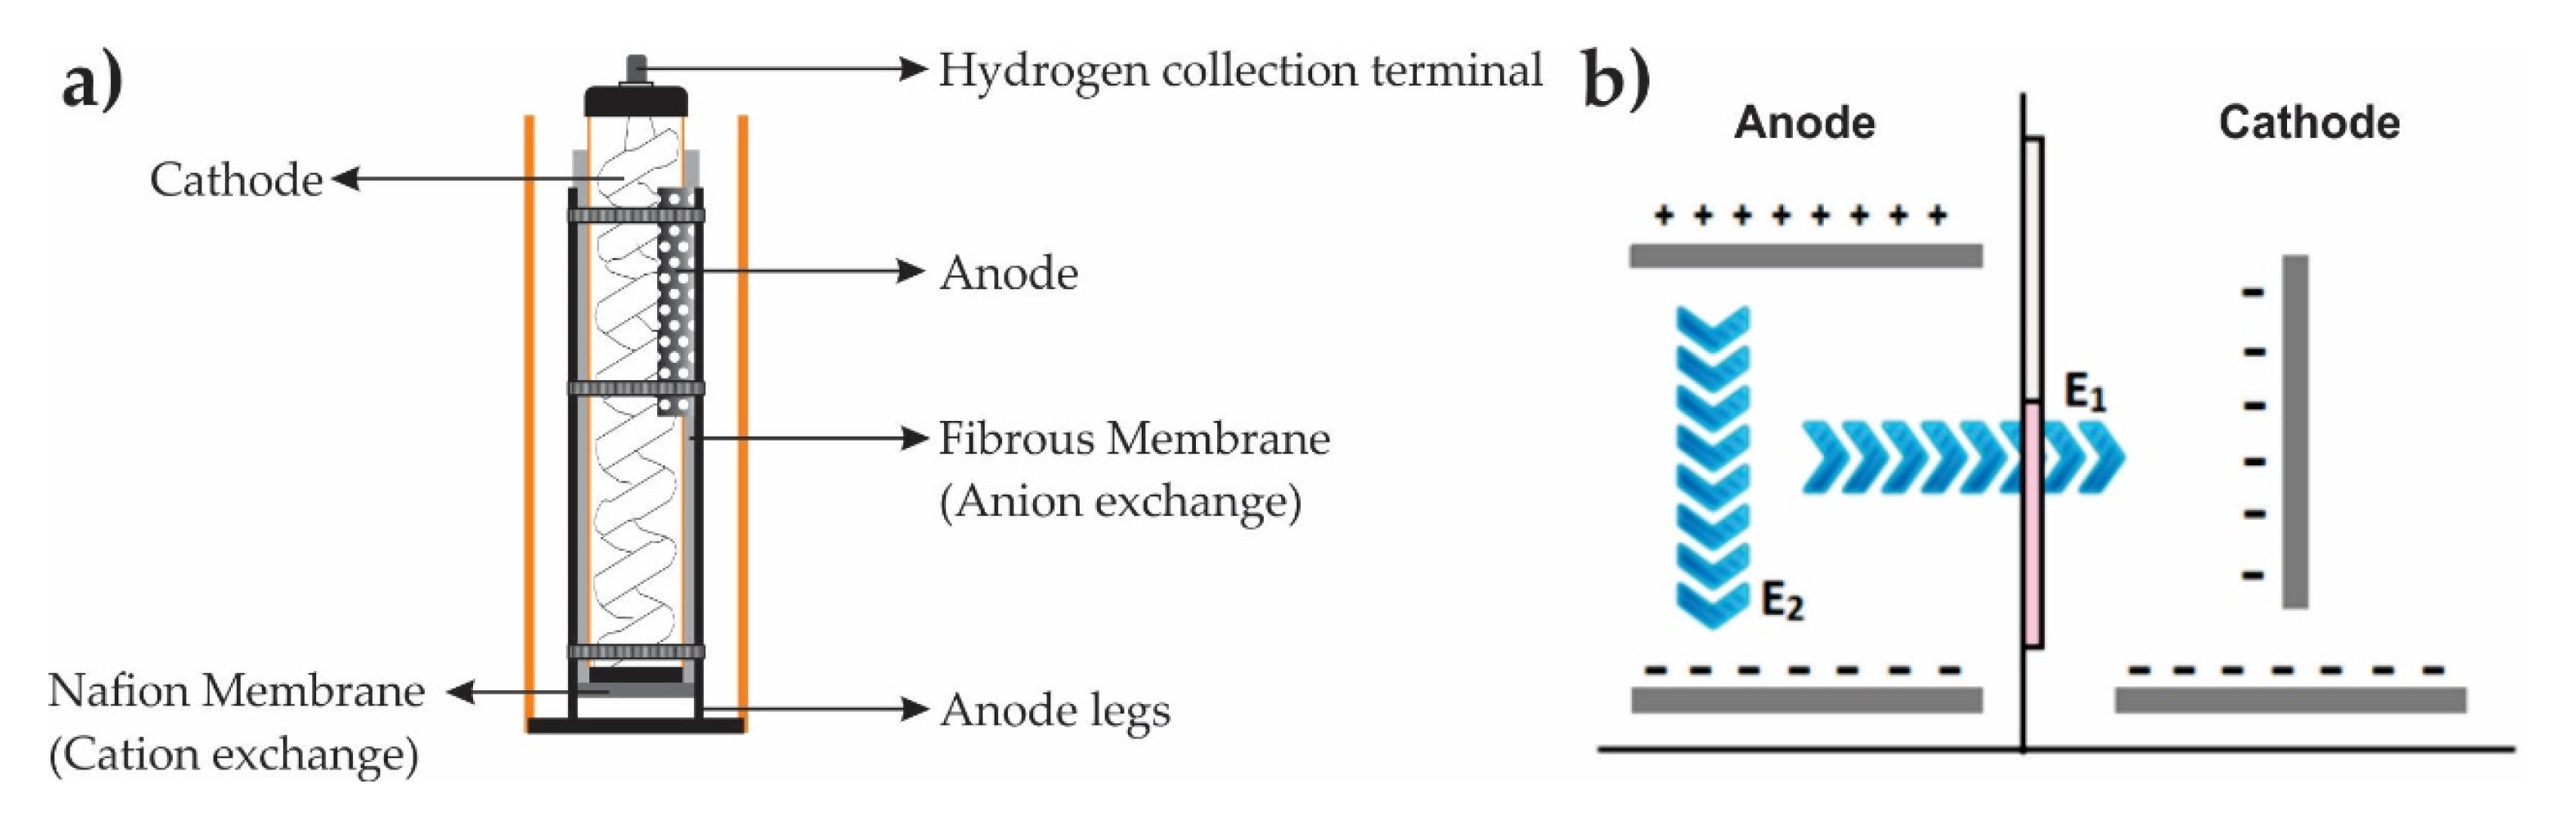
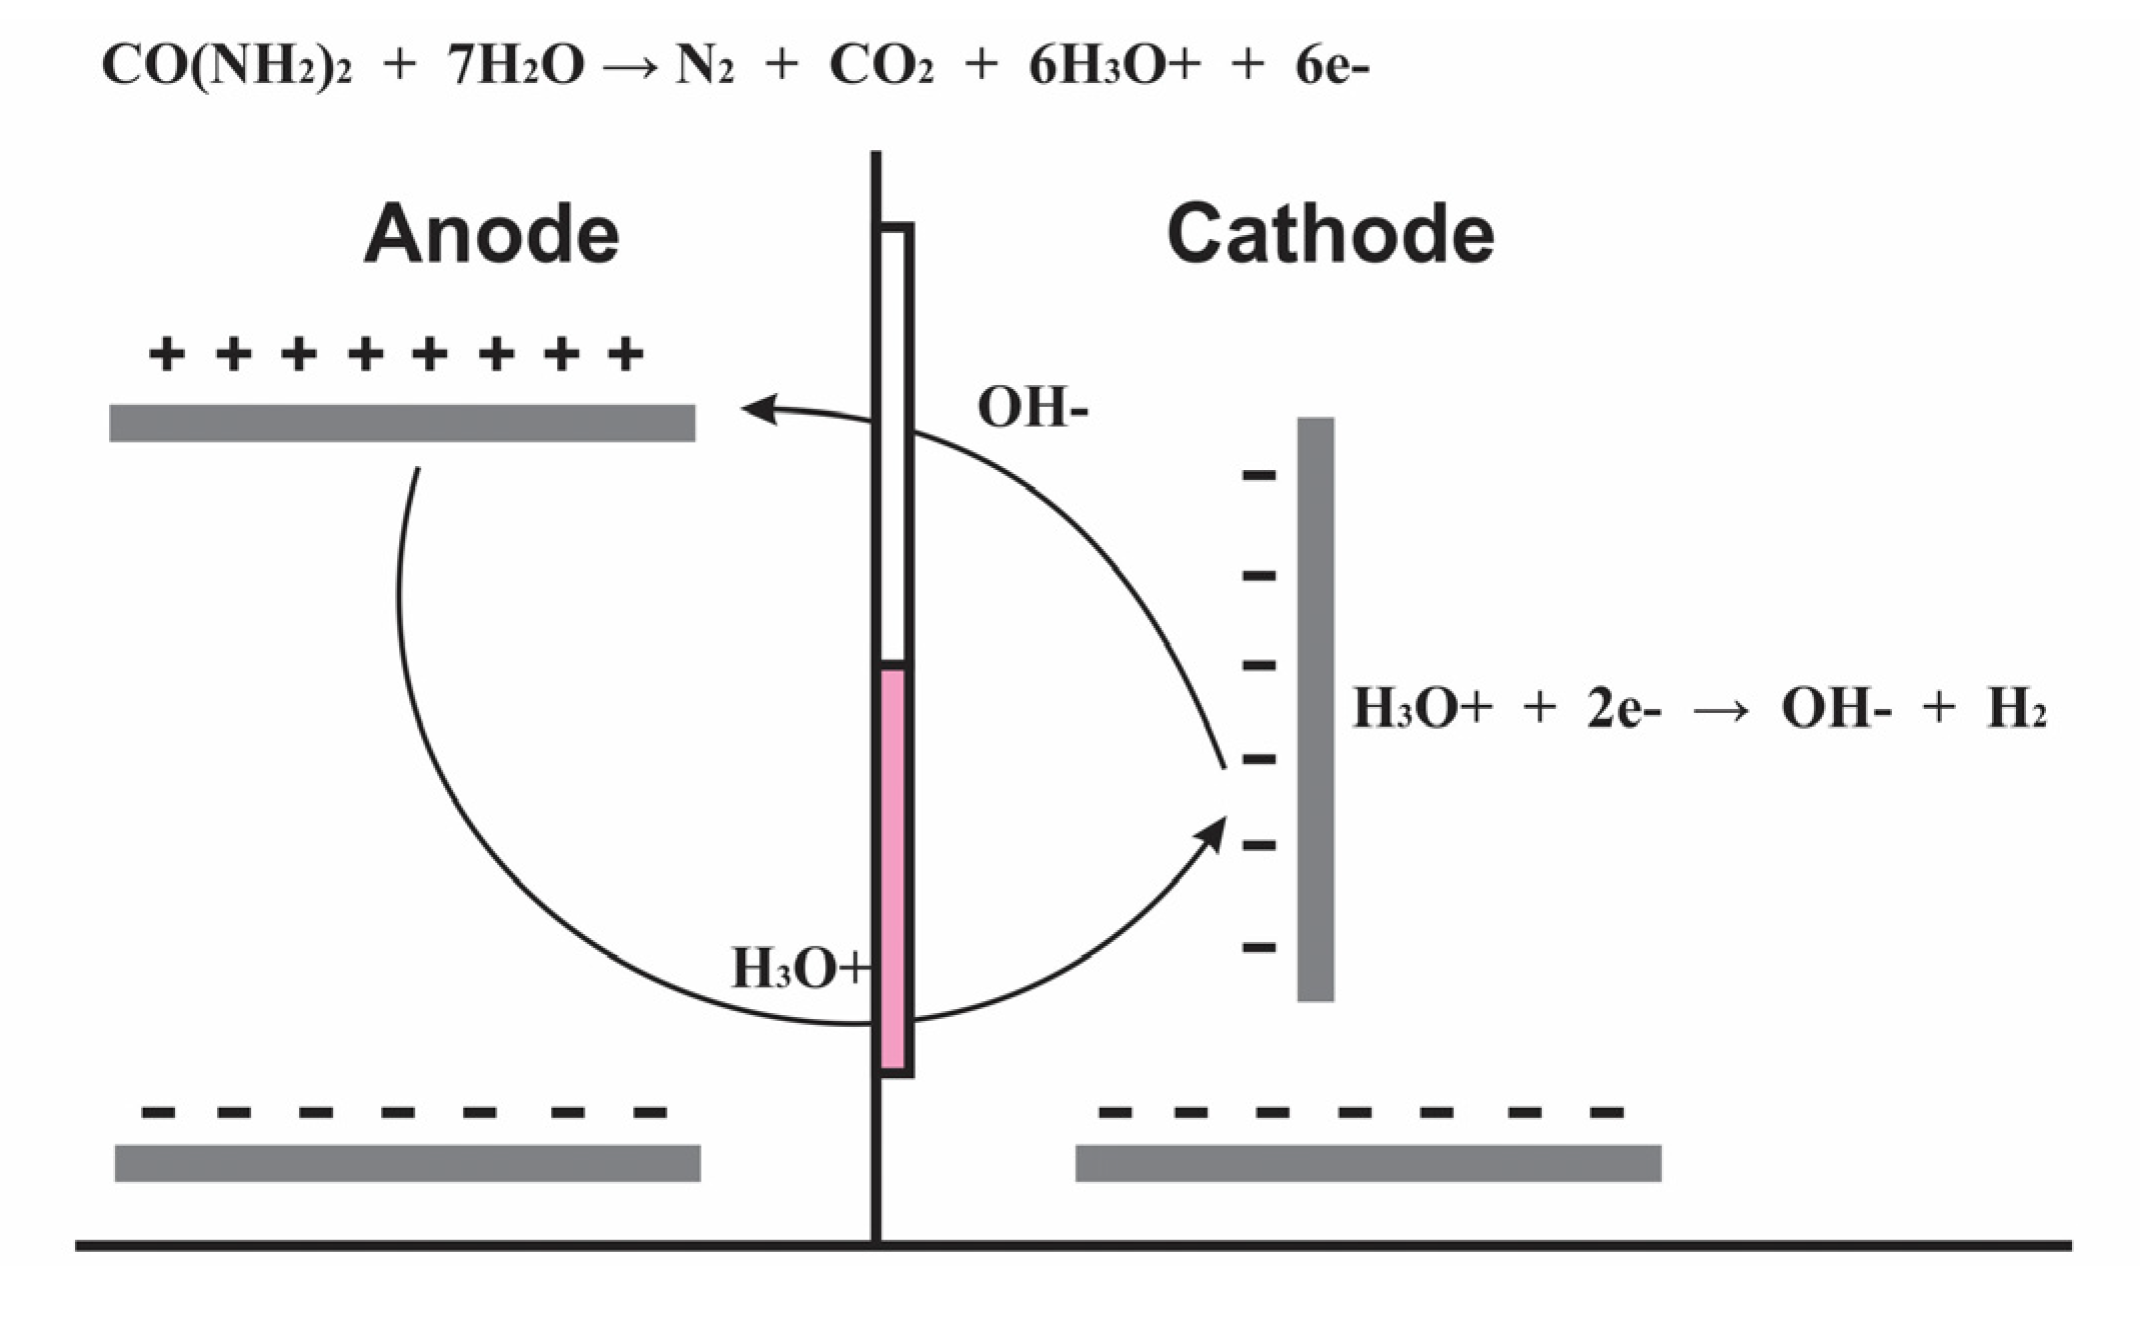
2.3. SIFC—c, d
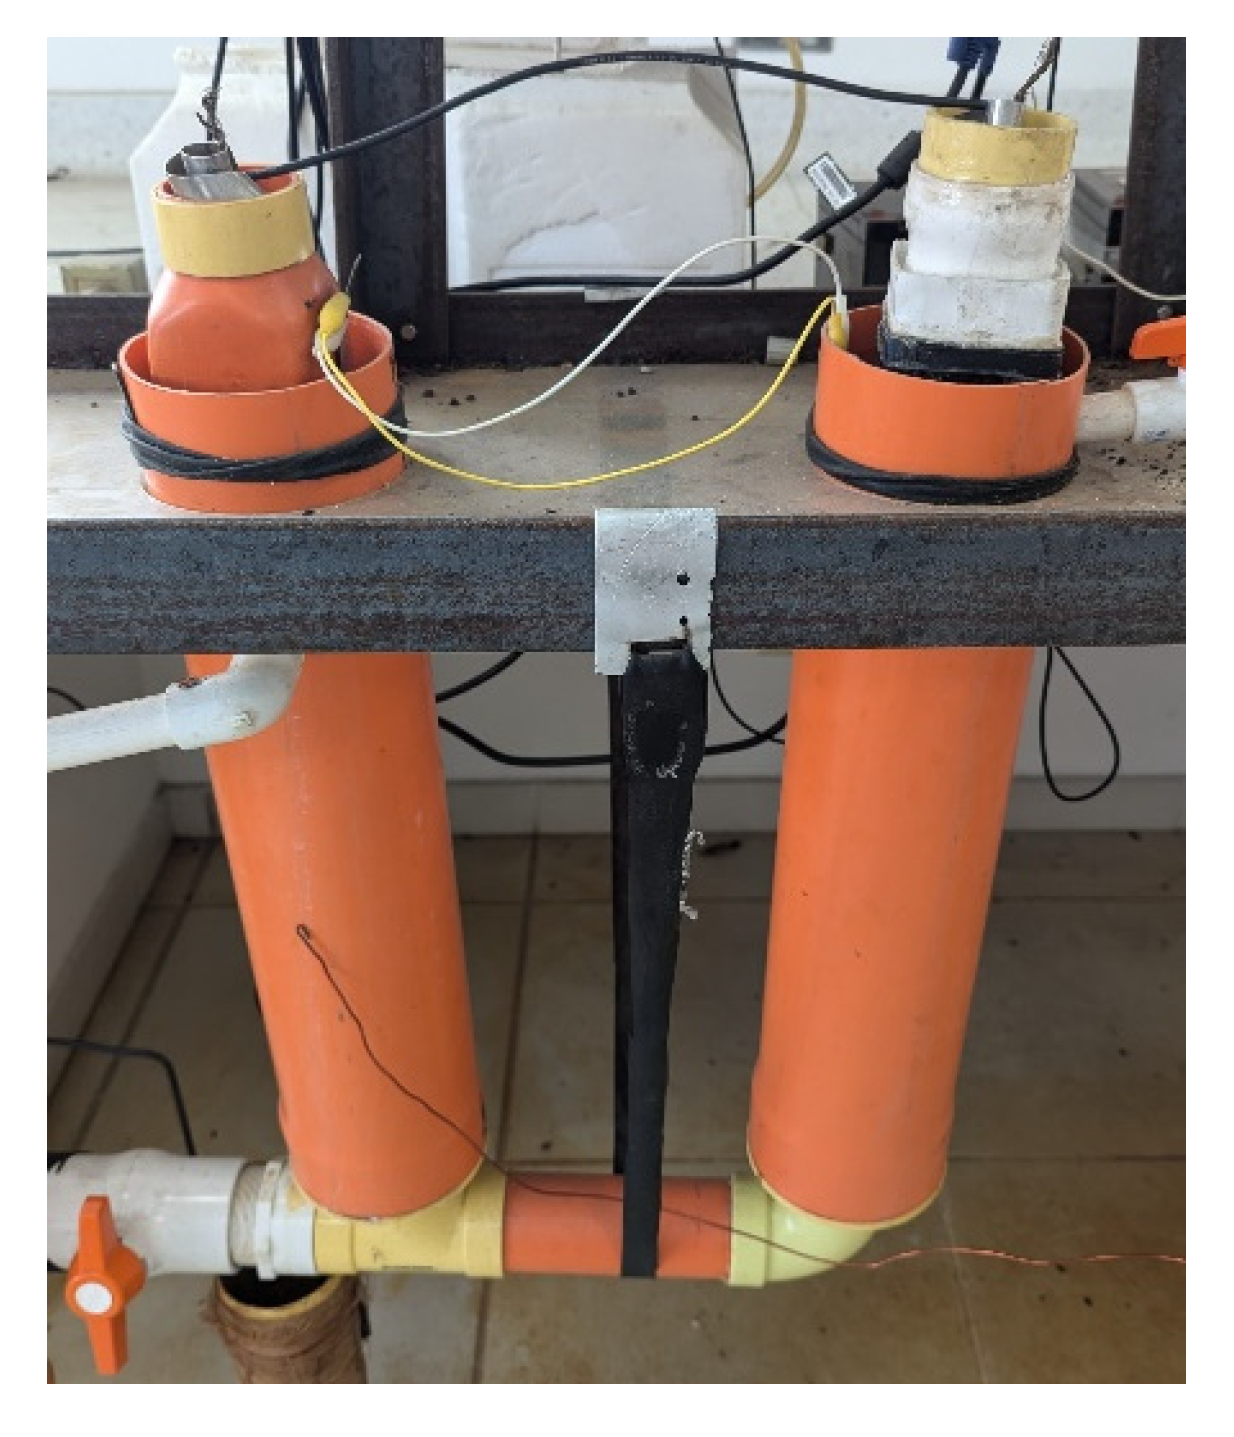
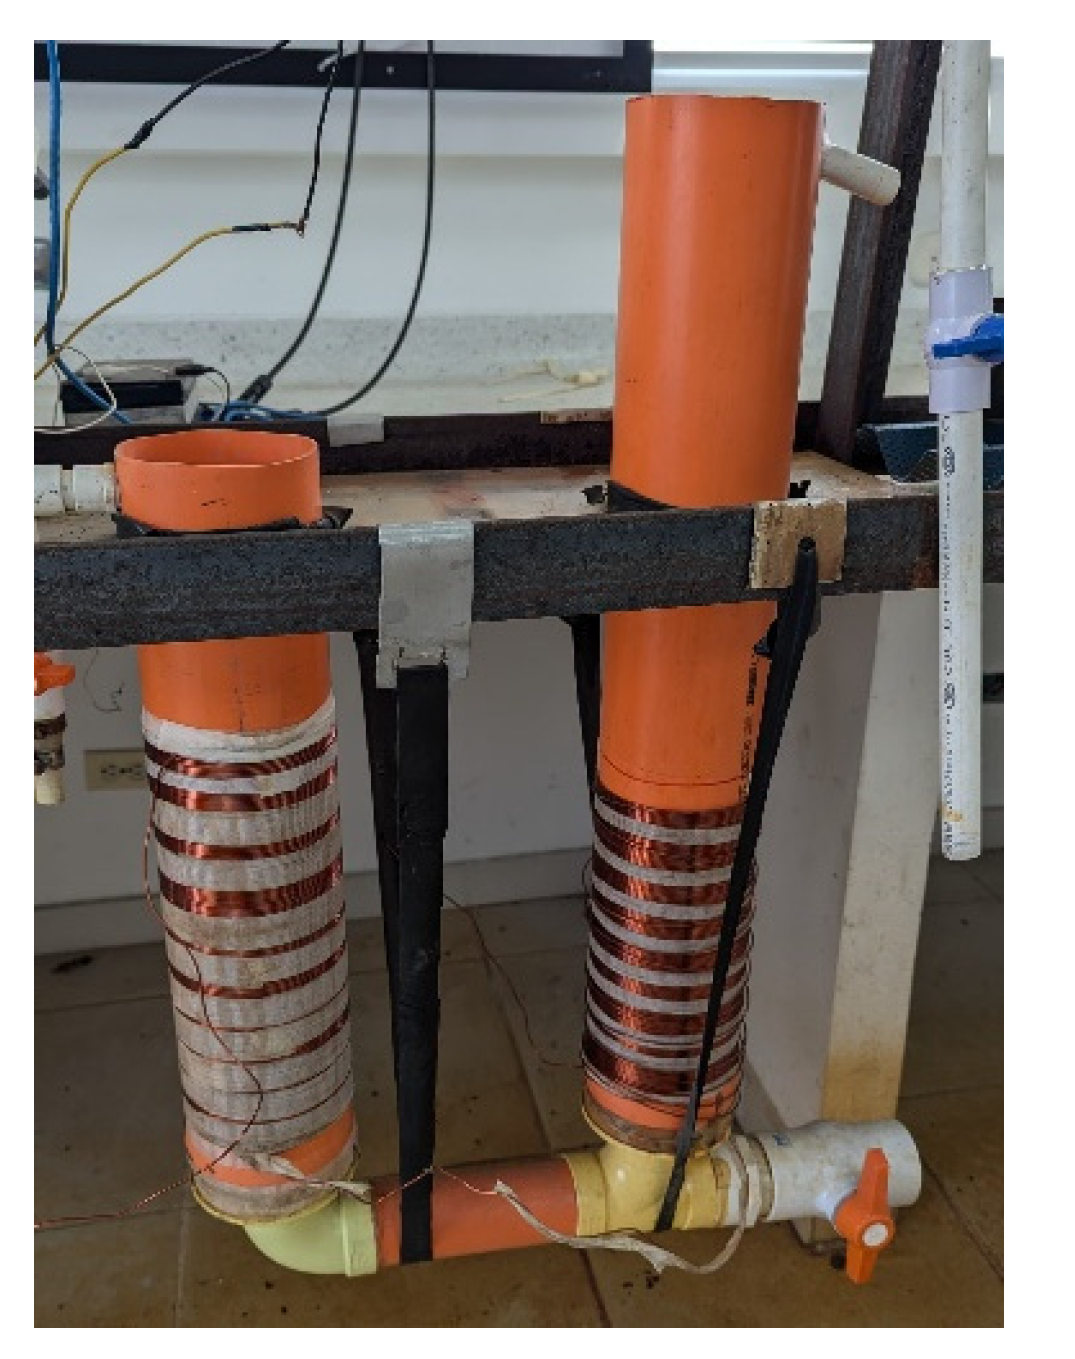
2.4. Clay Filters—e
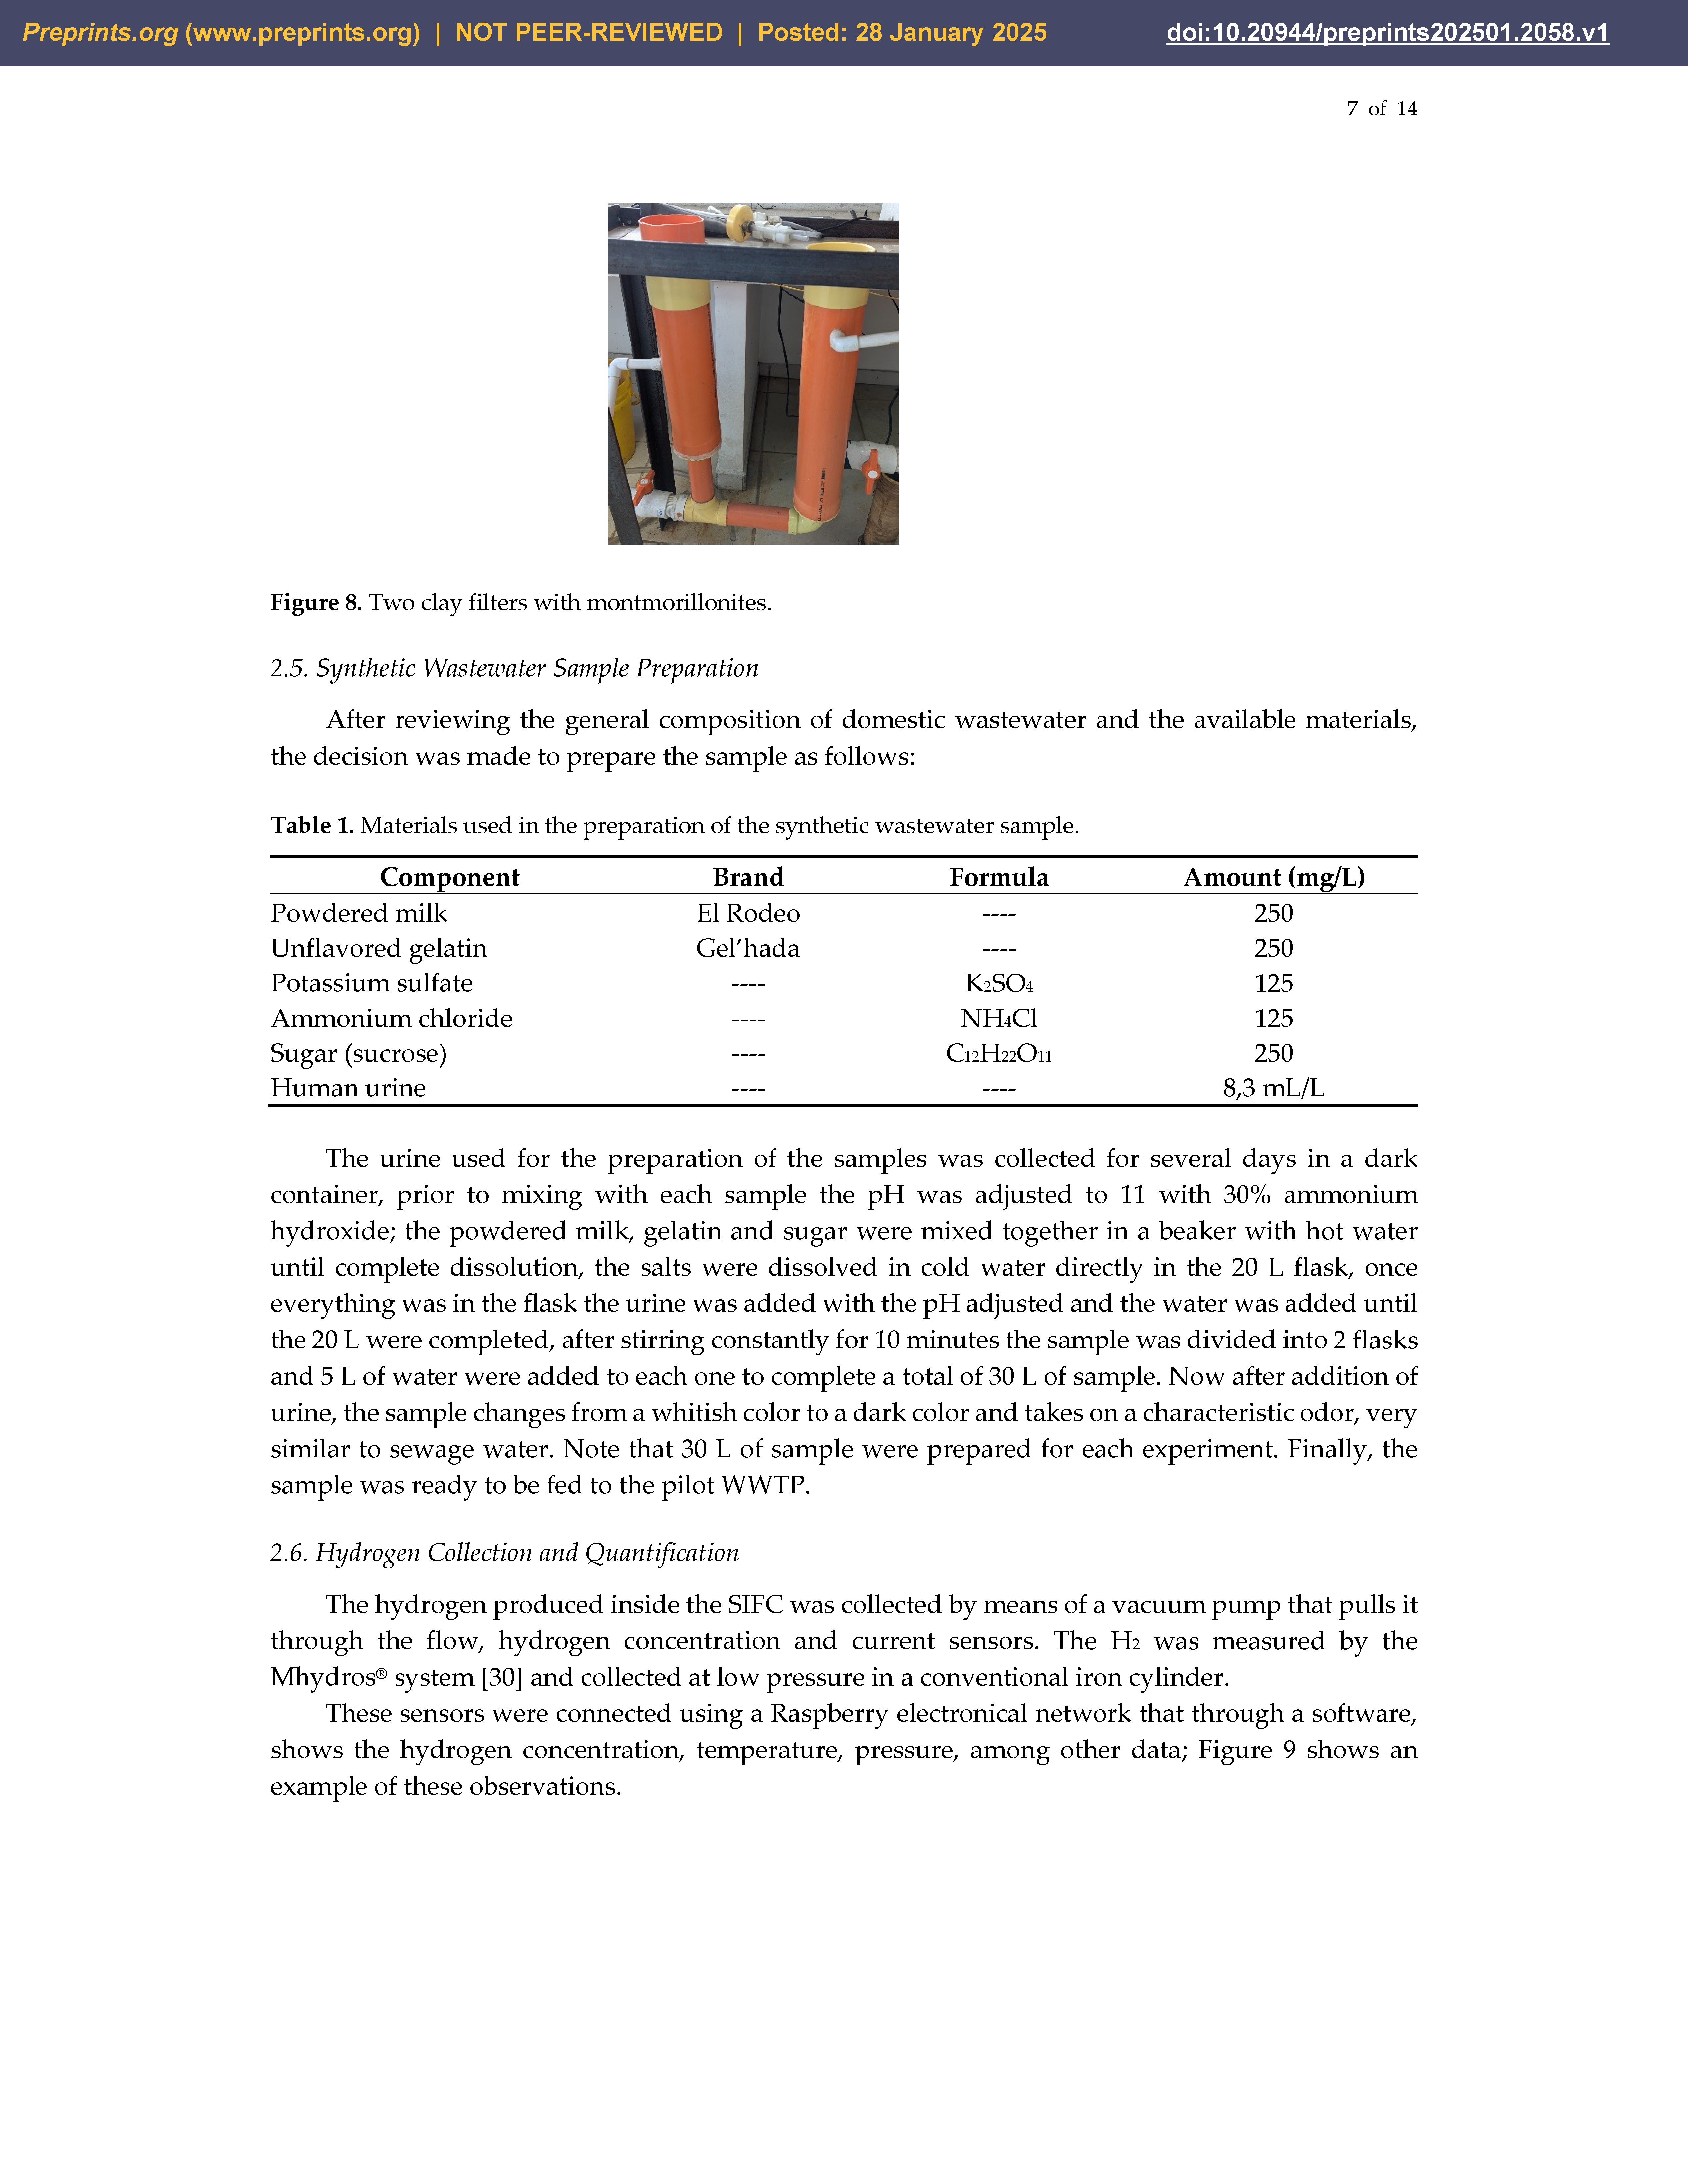
2.5. Synthetic Wastewater Sample Preparation
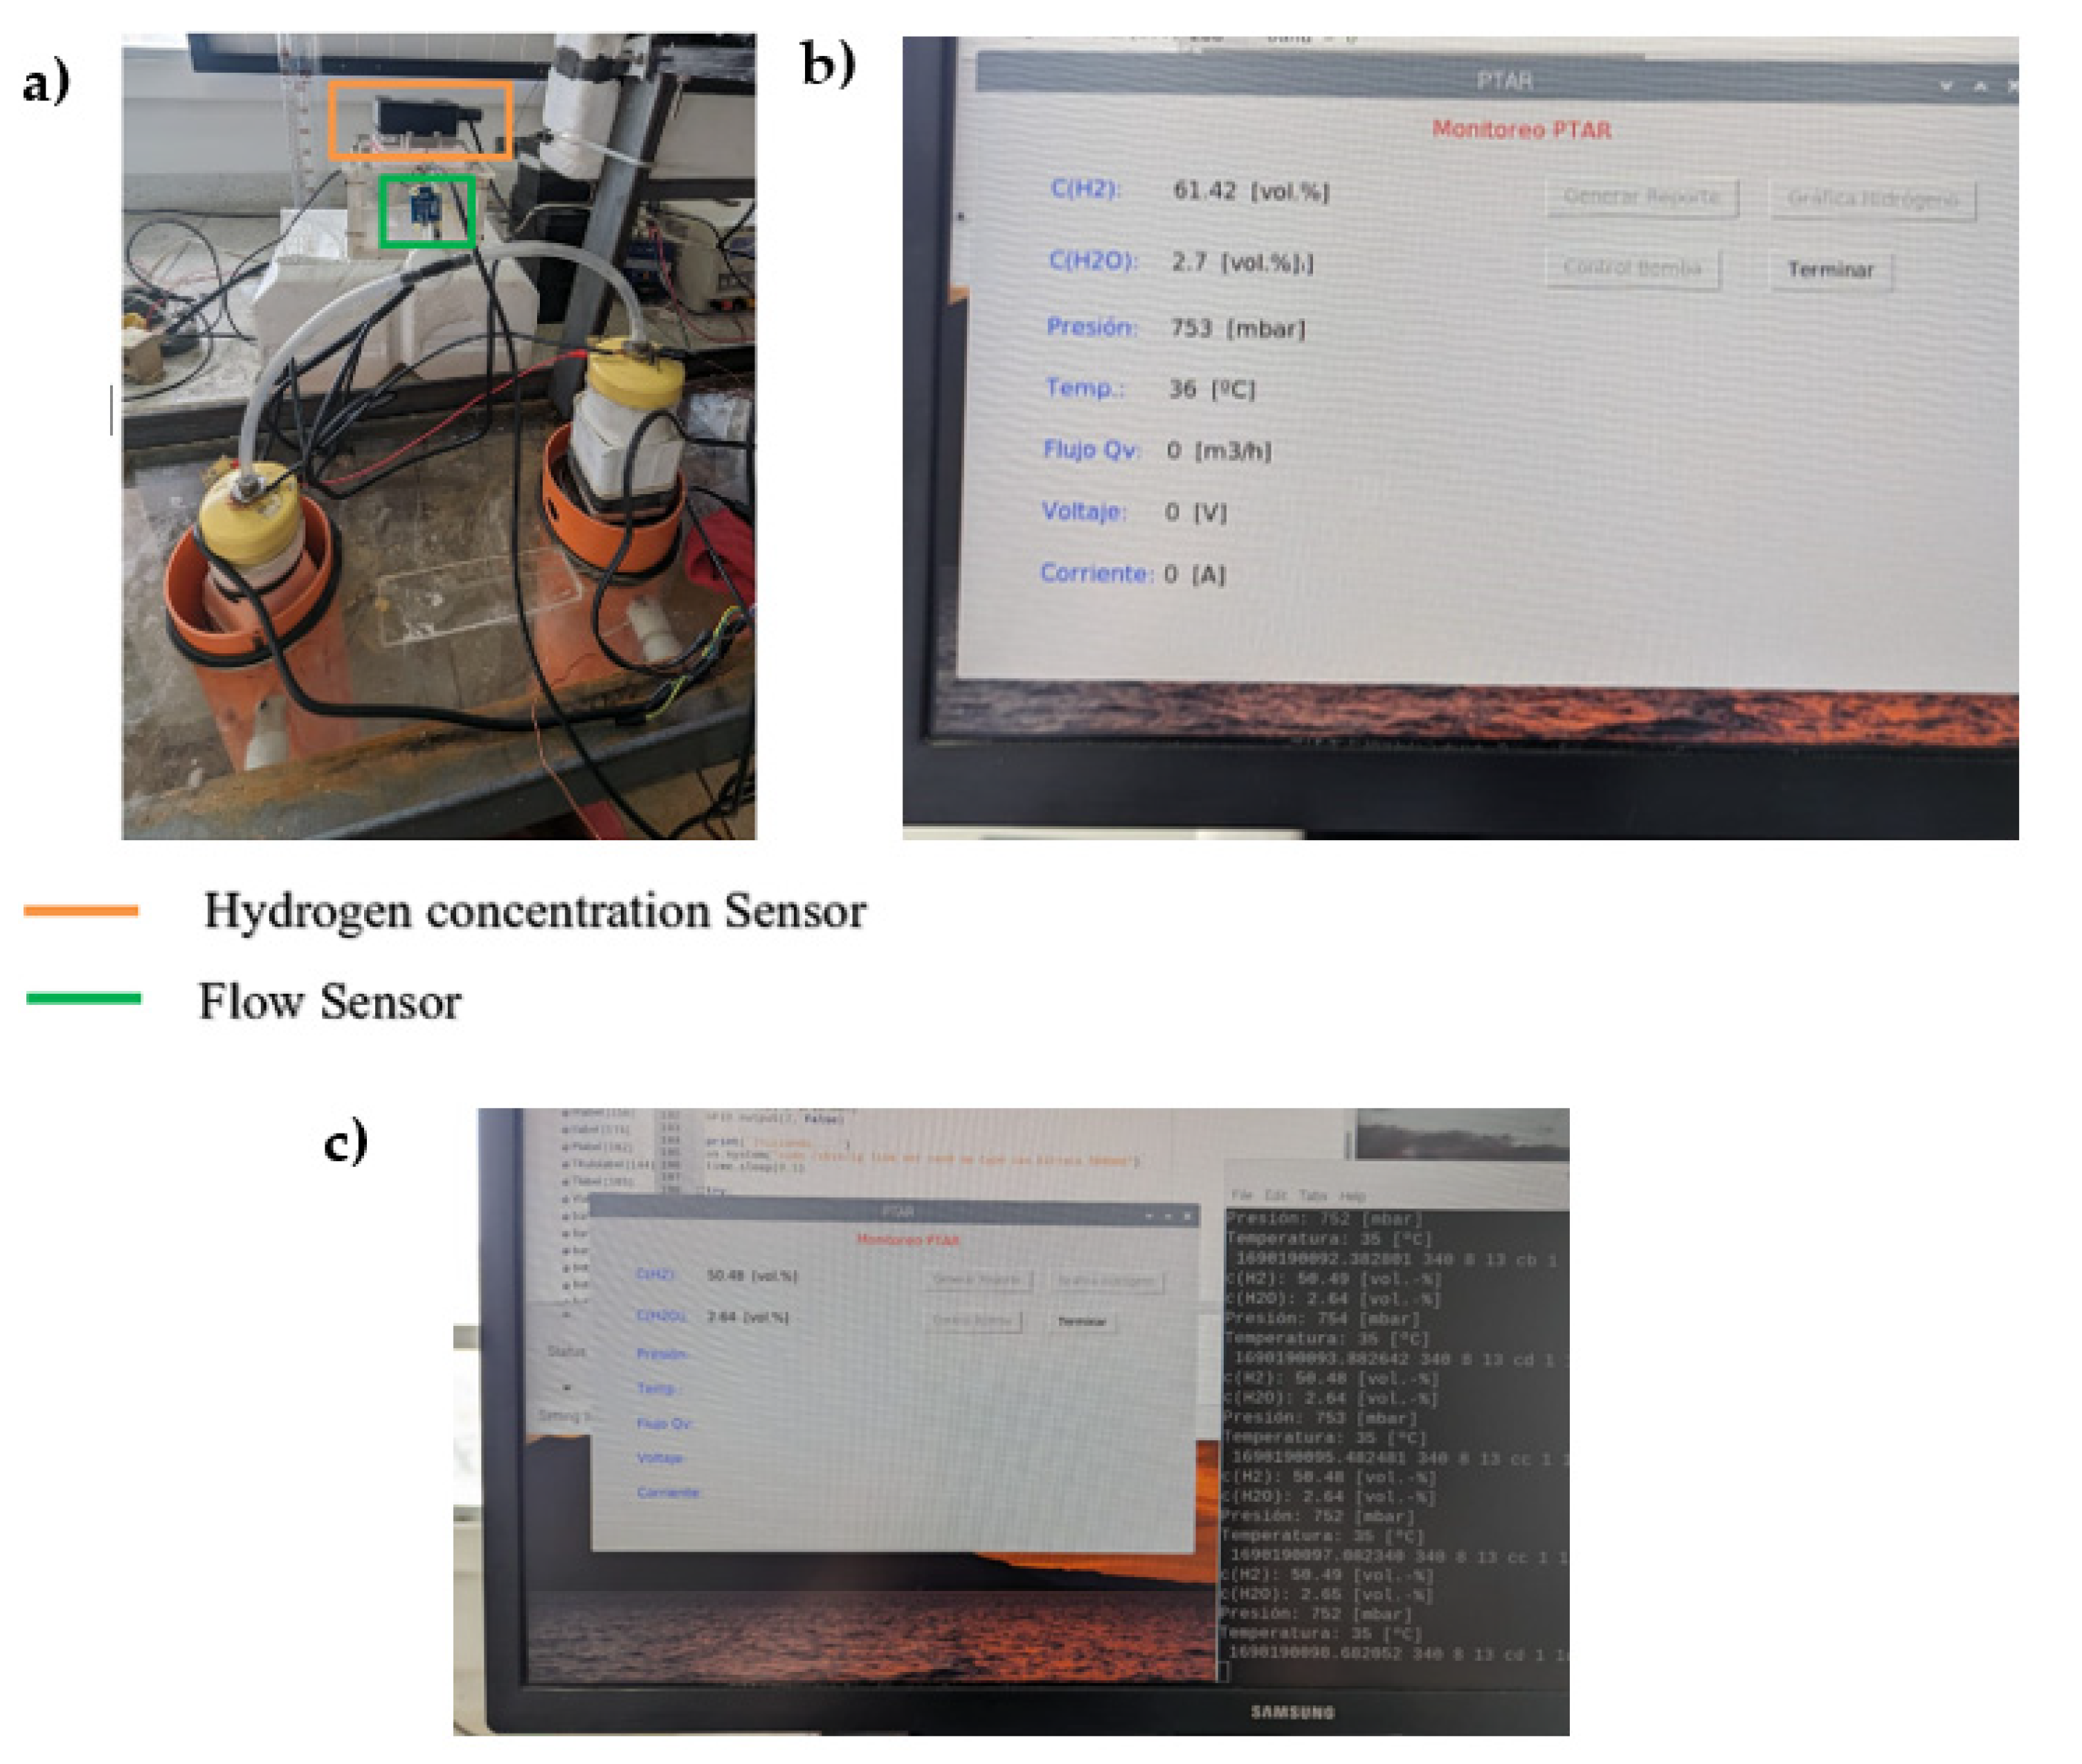
2.6. Hydrogen Collection and Quantification
2.7. Experimental Design
3. Results and Discussion
3.1. Hydraulic Retention Time (HRT)
- HRT: Hydraulic retention time
- V: Volume in cubic meters
- Q: Flow in cubic meters per hour
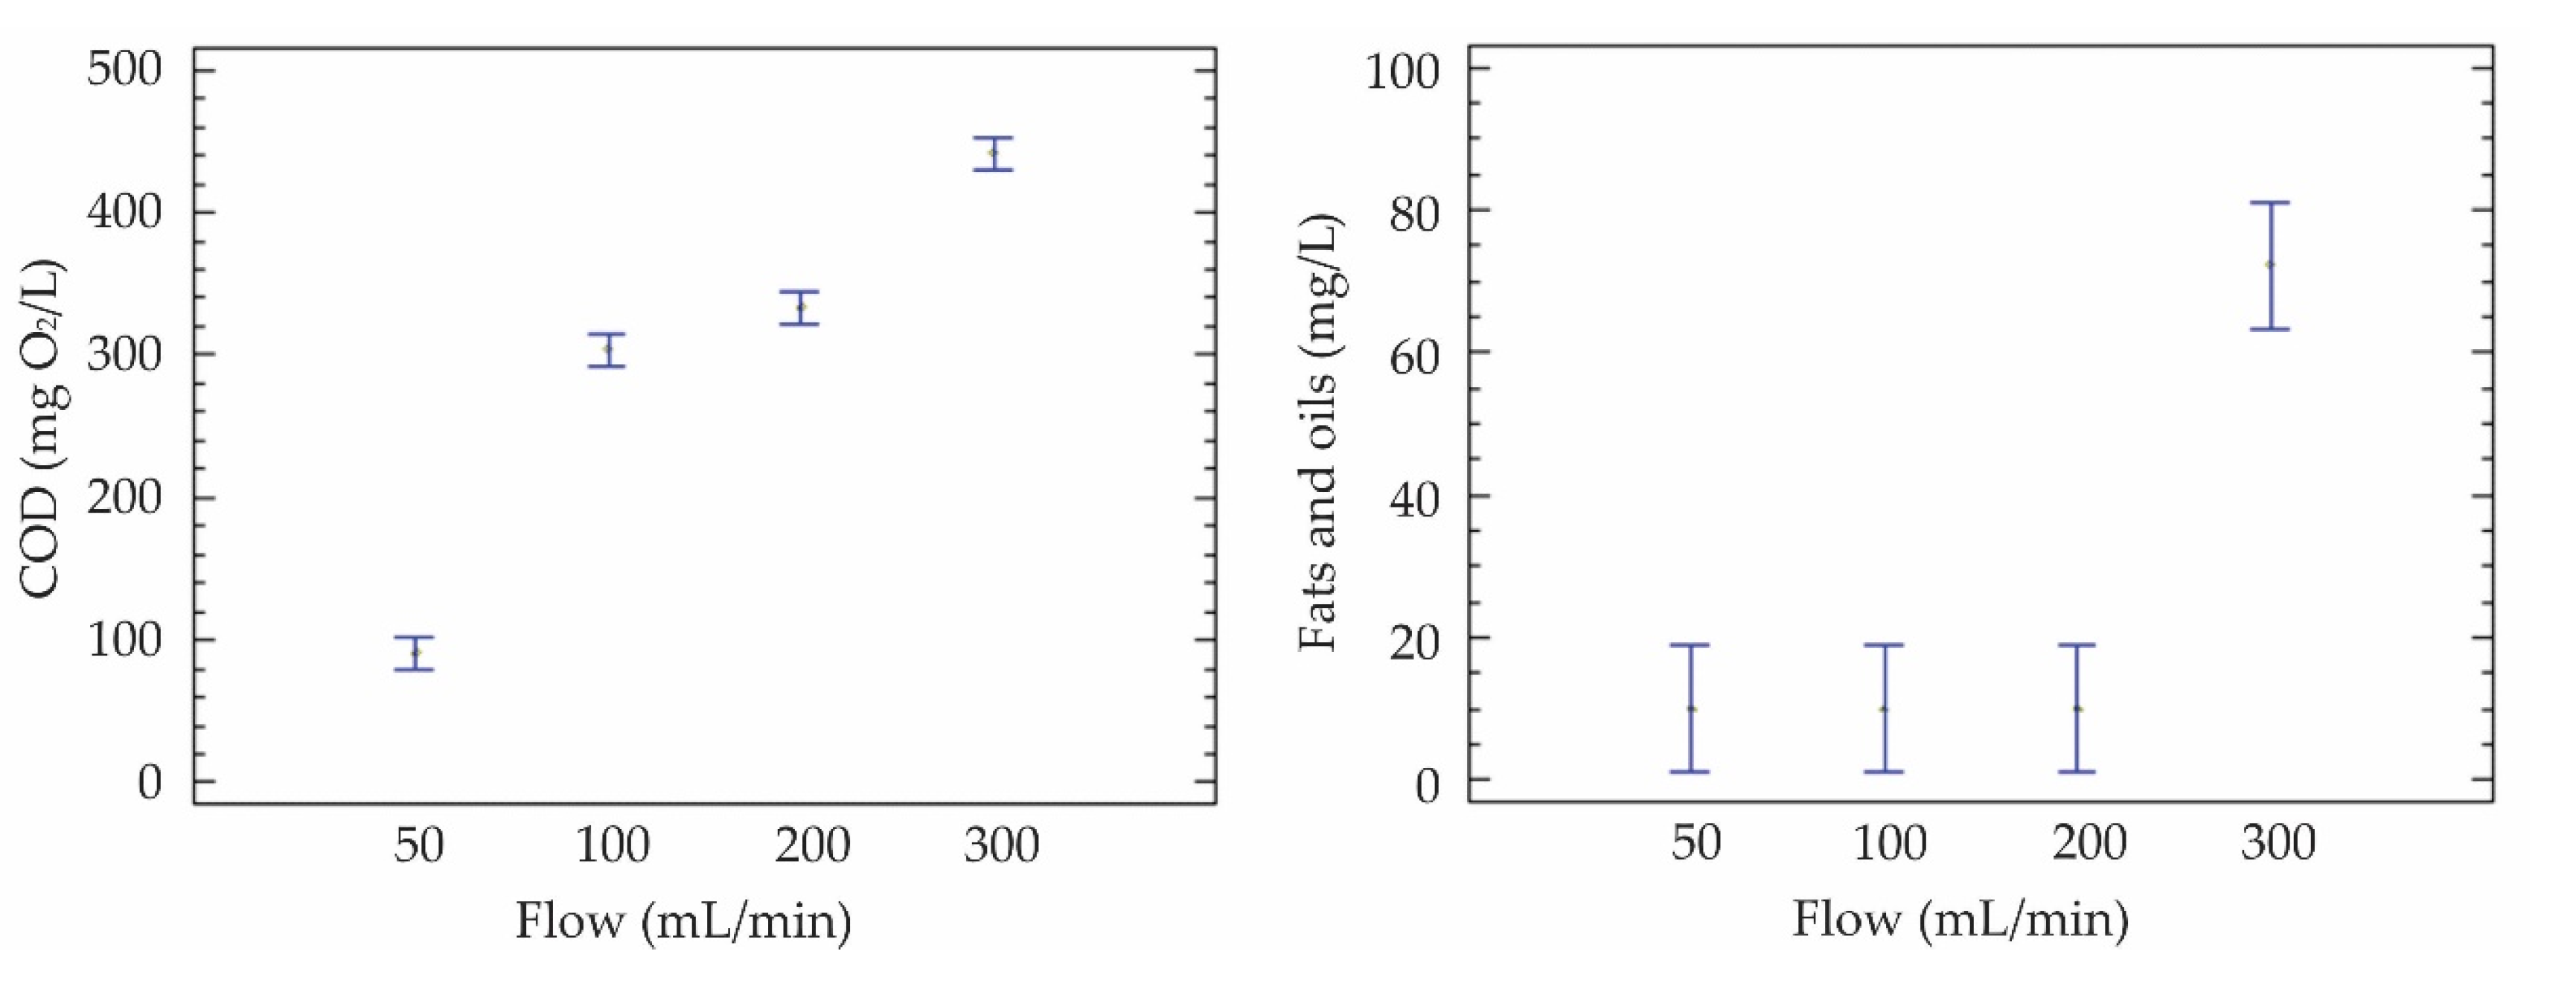
3.2. Experimental Design Results
3.3. Hydrogen Production

3.4. Wastewater Sample from Pasto City
5. Conclusions
Author Contributions
Acknowledgments
Conflicts of Interest
References
- Wanner, J. The development in biological wastewater treatment over the last 50 years. Wat. Sci. and Tech. 2021, 84(2), 274–283. [Google Scholar] [CrossRef] [PubMed]
- Riffat, R., & Husnain, T. Fundamentals of wastewater treatment and engineering, 2nd ed.; CRC Press, Taylor & Francis Group, London, England, 2022. [CrossRef]
- Karia, G. L., Christian, R. A., & Jariwala, N. D. Wastewater treatment: Concepts and design approach, 3rd ed.; PHI Learning Pvt. Ltd., Dehli, India, 2023. ISBN-978-81-19364-17-6.
- Rojas, R. Gestión integral de tratamiento de aguas residuales. Sistemas de tratamiento de aguas residuales. OMS. 25–27 sept. 2002.
- Iyamu, H. O., Anda, M., & Ho, G. A review of municipal solid waste management in the BRIC and high-income countries: A thematic framework for low-income countries. Habit. Int., 2020, 95, 102097. [CrossRef]
- Ramalho, R. S. Tratamiento de aguas residuales, 2nd ed.; Reverté, Barcelona, España, 2021. ISBN-978-84-291-9207-7.
- Muralidharan, V. , Palanivel, S., & Balaraman, M. Turning problem into possibility: A comprehensive review on leather solid waste intra-valorization attempts for leather processing. Jour. of Clean. Prod. 1330. [Google Scholar] [CrossRef]
- Vijarn L, Thanamai O, Tangtham N. Development of Criteria for Categorization of Wastewater Treatment Innovativeness: Case Study in North Sala Daeng Community and Bang Pharog Community. Environ. Nat. Resour. J. 2017, 7(2):124-37.
- Koul, B., Yadav, D., Singh, S., Kumar, M., & Song, M. Insights into the domestic wastewater treatment (DWWT) regimes: a review. Water, 2022, 14(21), 3542. [CrossRef]
- Mara, D. Domestic wastewater treatment in developing countries, 1st ed.; Routledge, London, England, 2013. [CrossRef]
- Huang, M. H., Li, Y. M., & Gu, G. W. Chemical composition of organic matters in domestic wastewater. Desalination, 2010, 262(1-3), 36-42. [CrossRef]
- Ng, W. J. Industrial wastewater treatment. 1st ed., World Scientific, London, England, 2006.
- Ahmed, J., Thakur, A., & Goyal, A. Industrial wastewater and its toxic effects. In Biological Treatment of Industrial Wastewater, 1st ed.; Shah, P. M. Royal Society of Chemistry, 2021. [CrossRef]
- Munter, R. Industrial wastewater characteristics, 2nd ed.; The Baltic University Programme (BUP), Sweden, 2003, 185.
- Thomas, O., & Thomas, M. F. Industrial wastewater. In UV-visible spectrophotometry of waters and soils. Elsevier, 2022, 385–416. [CrossRef]
- Peretti H, & Visintin A. Hidrógeno, combustible del futuro: ¿ Por qué, cómo y dónde?. Carbón. 2005. 8, 15-20.
- Linares-Hernández, I., Miranda, V. M., Díaz, C. B., Pavón-Romero, S., Bernal-Martínez, L., & Lugo, V. L. Oxidación de materia orgánica persistente en aguas residuales industriales mediante tratamientos electroquímicos. Avances en ciencias e ingeniería, 2011, 2(1), 21-36. ISSN-0718-8706.
- Parker, D. S. Introduction of new process technology into the wastewater treatment sector. Wat. Env. Res., 2011, 83(6), 483-497. [CrossRef]
- Arroyo, P., & Molinos, M. Selecting appropriate wastewater treatment technologies using a choosing-by-advantages approach. Scie. of the Total Env., 2018, 625, 819-827. [CrossRef]
- Rao, D. G., Senthilkumar, R., Byrne, J. A., & Feroz, S. Wastewater treatment: advanced processes and technologies, CRC Press, Taylor & Francis Group, London, England, 2012. ISBN-978-178040-034-1.
- Bera, S. P., Godhaniya, M., & Kothari, C.. Emerging and advanced membrane technology for wastewater treatment: A review. J. of Basic Microbiology, 2022, 62(3-4), 245-259. [CrossRef]
- Rout, P. R., Zhang, T. C., Bhunia, P., & Surampalli, R. Y. Treatment technologies for emerging contaminants in wastewater treatment plants: A review. Sc. of the Total Env., 2021, 753, 141990. [CrossRef]
- Pesqueira, J. F., Pereira, M. F. R., & Silva, A. M. Environmental impact assessment of advanced urban wastewater treatment technologies for the removal of priority substances and contaminants of emerging concern: a review. J. of Clean. Prod., 2020, 261, 121078. [CrossRef]
- ansel, B. (2008). New technologies for water and wastewater treatment: A survey of recent patents. Recent patents on chemical engineering, 2008, 1(1), 17-26.
- Lozada J. Proceso para la obtención de hidrógeno y reactor que produce hidrógeno a partir de la reducción de los iones hidronio presentes en el equilibrio químico del agua y por la oxidación de las moléculas orgánicas presentes en excrementos, SIC Patent No. 17294, 2020. https://sipi.sic.gov.co/sipi/Extra/IP/Mutual/Browse.aspx?sid=638623657950260889.
- Pholchan, M., Kaewseesuk, K., Klayraung, S. & Sompong, U., Effect of Light Intensities and Atmospheric Gas Conditions on Biohydrogen Production of Microalgae Isolated from Fisheries Wastewater. Environ. Nat. Resour. J. 2017, 15(2):21-9.
- Atilhan, S. , Park, S., El-Halwagi, M. M., Atilhan, M., Moore, M., & Nielsen, R. B. (2021). Green hydrogen as an alternative fuel for the shipping industry. Curr. Opin. in Chem. Engin., 2021, 31, 100668. [Google Scholar] [CrossRef]
- Saavedra Ruiz, N. S. , Tacanga Flores, L. J., Vega Palomino, C. D., & Verde Mendieta, L. Obtención del hidrógeno de la orina para la generación de energías limpias mediante la electrólisis. Tesis de pregrado, Universidad César Vallejo, Perú, 2020.
- Vargas, Y., et al. Caracterización espectroscópica, química y morfológica y propiedades superficiales de una montmorillonita mexicana. Revista mexicana de ciencias geológicas. 2008, 25, 1, 135-144.
- Lozada, J., Casanova, C., & Arturo, D. Electronic Monitoring System for Hydrogen Produced from the Oxidation of Human Urine (Mhydros). J. of Scien. and Engin. Res. 2021, 4, 2, 52-57.
- Rice, E. W., Bridgewater, L., & American Public Health Association. Standard methods for the examination of water and wastewater (Vol. 10). Washington, DC: American public health association. 2012.
- Ministerio de Ambiente y desarrollo Sostenible. Minambiente. Gobierno de Colombia. 2015.
- Handayani, Y., Syafrudin, S., & Suherman, S. The effectiveness of domestic wastewater treatment in reducing BOD and COD levels: a literature review. AIP Conference Proceedings. 2023, 2683, 1. [CrossRef]

| Component | Brand | Formula | Amount (mg/L) |
|---|---|---|---|
| Powdered milk | El Rodeo | ---- | 250 |
| Unflavored gelatin | Gel’hada | ---- | 250 |
| Potassium sulfate | ---- | K2SO4 | 125 |
| Ammonium chloride | ---- | NH4Cl | 125 |
| Sugar (sucrose) | ---- | C12H22O11 | 250 |
| Human urine | ---- | ---- | 8,3 mL/L |
| Sign | Flow (mL/min) | Total HRT (h) |
|---|---|---|
| F1 | 50 | 5,33 |
| F2 | 100 | 2,67 |
| F3 | 200 | 1,34 |
| F4 | 300 | 0,88 |
| Sign | COD (mg O2/L) | Fats and oils (mg/L) | Apparent Color (UPC) | True Color (UPC) | pH | Conductivity (µS/cm) | Total Solids (mg/L) |
|---|---|---|---|---|---|---|---|
| Raw Sample | 955,3 | 162,4 | 287,5 | 54,5 | 8,5 | 1676 | 824 |
| Raw Sample | 962,1 | 159,2 | 288,1 | 56,0 | 8,5 | 1712 | 833 |
| Raw Sample | 958,6 | 163,4 | 287,7 | 54,6 | 8,5 | 1684 | 831 |
| F1 | 92,0 | <10 | 28,4 | <8 | 7,3 | 321 | 121 |
| F1 | 89,2 | <10 | 25,2 | <8 | 7,4 | 311 | 147 |
| F1 | 90,8 | <10 | 26,9 | <8 | 7,3 | 335 | 138 |
| F2 | 292,0 | <10 | 28,6 | <8 | 7,1 | 445 | 343 |
| F2 | 315,5 | <10 | 30,8 | <8 | 7,4 | 421 | 334 |
| F2 | 303,9 | <10 | 31,3 | <8 | 7,1 | 457 | 345 |
| F3 | 338,8 | <10 | 58,1 | <8 | 7,7 | 387 | 354 |
| F3 | 317,4 | <10 | 55,0 | <8 | 7,5 | 391 | 374 |
| F3 | 343,8 | <10 | 62,8 | <8 | 7,5 | 373 | 360 |
| F4 | 453,5 | 93,1 | 83,4 | <8 | 8,2 | 865 | 550 |
| F4 | 447,5 | 66,8 | 88,1 | <8 | 8,0 | 844 | 513 |
| F4 | 423,1 | 56,7 | 75,5 | <8 | 8,0 | 868 | 541 |
| Sign | COD (mg O2/L) | Fats and oils (mg/L) | Apparent Color (UPC) | True Color (UPC) | pH | Conductivity (µS/cm) | Total Solids (mg/L) |
|---|---|---|---|---|---|---|---|
| Maximum Normative | 200,00 | 20,00 | NR | NR | 6–9 | NR | 100,00 |
| Average raw sample | 958,67 | 161,67 | 287,8 | 55 | 8,5 | 1690,7 | 829,33 |
| Average F1 | 90,66 | <10 | 26,8 | <8 | 7,3 | 322,3 | 135,33 |
| Average F2 | 303,85 | <10 | 30,2 | <8 | 7,2 | 441 | 340,67 |
| Average F3 | 333,30 | <10 | 58,6 | <8 | 7,6 | 383,7 | 362,67 |
| Average F4 | 441,39 | 72,2 | 82,3 | <8 | 8,1 | 859 | 534,67 |
| Sample | % H2 (w/v) Average | H2 Flow (L/h) | Moles of H2/h |
|---|---|---|---|
| F1 | 96 | 120 | 3,53 |
| F2 | 92 | 120 | 3,38 |
| F3 | 90 | 120 | 3,32 |
| F4 | 88 | 120 | 3,28 |
| Sign | COD (mg O2/L) | Fats and oils (mg/L) | Apparent Color (UPC) | True Color (UPC) | pH | Conductivity (µS/cm) | Total Solids (mg/L) |
|---|---|---|---|---|---|---|---|
| Raw Sample | 712,0 | 96,9 | 462,9 | 81 | 7,5 | 1232 | 663 |
| F1 | 98,7 | 20,0 | 8,6 | <8 | 7,3 | 244 | 112 |
| Maximum Regulation | 200,0 | 20,0 | NR | NR | 6–9 | NR | 100,0 |
Disclaimer/Publisher’s Note: The statements, opinions and data contained in all publications are solely those of the individual author(s) and contributor(s) and not of MDPI and/or the editor(s). MDPI and/or the editor(s) disclaim responsibility for any injury to people or property resulting from any ideas, methods, instructions or products referred to in the content. |
© 2025 by the authors. Licensee MDPI, Basel, Switzerland. This article is an open access article distributed under the terms and conditions of the Creative Commons Attribution (CC BY) license (http://creativecommons.org/licenses/by/4.0/).


