
Submitted:
26 January 2025
Posted:
27 January 2025
You are already at the latest version
Abstract
Animals often regulate their nutrient intake according to physiological needs. There is evidence that different traits require specific nutrient blends, and that animals cannot always maximise all traits with a single diet (‘nutritional trade-offs’). However, we still do not have a clear understanding of which traits might be involved in nutritional trade-offs. I compiled data from the Geometric Framework of nutrition literature on the ratio of protein and carbohydrates that maximise (best PC ratios) or minimise (worst PC ratios) several larval and adult traits in Drosophila melanogaster. Best and worst PC ratios clustered into three regions in the protein-carbohydrate nutrient space: (1) Low PC ratios (1:8 or higher) are best for lifespan but worst for growth or reproductive traits; (2) High PC ratios (1:1 or lower) are best for adult body mass, male reproduction and larval developmental time but worst for lifespan; (3) Intermediate PC ratios (between 1:1 and 1:8) are best for female lifetime egg production, female reproductive rate and larval survival. These findings support lifespan-reproduction nutritional trade-offs, highlight the potential for metamorphosis to solve nutritional trade-offs across life stages, and the potential for intralocus sexual conflict to emerge over the expression of metabolic genes.
Keywords:
dipterans
; energy metabolism
; gene expression
; comparative nutrition
1. Introduction
Animals acquire nutrients to subsidise their
metabolic demands, but the quantity and ratio of these nutrients vary [1–4]. When animals cannot acquire nutrients in the
quantity and ratio for all traits, there is the potential for conflict whereby
animals need to balance their nutrient intake to maximise one trait at the
expense of another (i.e., “nutritional trade-offs”) [5–7].
Previous research has uncovered evidence to support the concept of nutritional
trade-offs between reproduction and lifespan and reproduction and immune traits
[5–13] and between reproductive traits that
contribute to different sexual selection episodes [14–16]
(see also [17]). Thus, there is a general
assumption that nutritional trade-offs are ubiquitous and could play an
important role in shaping animal nutrition and evolution.
However, previous work has largely studied
nutritional trade-offs among only a limited number of traits (usually two or
three), with few exceptions (see e.g., [18]).
For example, the landmark paper by Lee et. al. [6]
used the Geometric Framework of nutrition (GF) to comprehensively assess how
the ratio of protein and carbohydrate (PC ratio) in diets modulated lifespan,
reproductive rate, and lifetime egg production in female Drosophila
melanogaster. Likewise, Maklakov et. al. [7]
studied PC ratio effects on the expression of three traits (lifespan and two
reproductive traits) in each sex of the cricket Teleogryllus commodus.
These examples are representative of the wider literature (e.g., [10,12,14–16,19–21] and references therein) and
continue to stimulate new studies that uncover insights into animal nutritional
ecology in both basic and applied sciences [22–25].
Yet, it is also important to step back to try and unify our knowledge in a more
general context to gain a proper overview of nutritional trade-offs across
multiple traits within and between species [10,26].
In this regard, there is unmatched advantages to the work in model organisms
like Drosophila melanogaster for which nutritional effects have been
mapped across several traits in high resolution using the GF. By compiling what
we know about D. melanogaster responses to diet from GF studies – which
to my knowledge has never been done – we will gain the much-needed general
insight about nutritional trade-offs that will help us interpret current
knowledge and guide future work.
Therefore, in this study, I collated the PC ratio
of diets that maximise (best) or minimize (worst) a wide range of traits in D.
melanogaster, using my previous analytical methods to reconstruct and
analyse GF landscapes [27,28]. My main goal
was to characterize the potential for nutritional trade-offs by highlighting
traits that have opposing responses to the same PC ratios. To achieve this, my
assumption was that the Drosophila strains used across different studies
responded were comparable. This assumption was necessary because I do not have
the information of the genetic architecture of all lines in the published
literature. It follows from this assumption that Drosophila strains
respond similarly to different diets irrespective of genetic differences, which
we know is not always true at least for highly inbred lines (e.g., [24]). I discuss the implications of this in the
methods and discussion sections. Nevertheless, the findings of this work
highlight the potential for nutritional trade-offs in Drosophila that
will stimulate future work to uncover the causes and consequences for the
ecology and evolution of this and other species.
2. Materials and Methods
2.1. Data
I included studies from the literature which used Drosophila
melanogaster as model system and the Geometric Framework for nutrition as
experimental design. I included studies that measure both food intake and that
manipulated the macronutrient in the diet without measuring diet intake; the
former approach was usually adopted by studies using adult flies while the
latter, larvae. I also included studies with liquid diet that used the CAFÉ
assay and studies with solid media. When possible, I used studies for which raw
data was made available in the original publication. When the raw data was not
available for lifespan, I used my previously validated approach to reconstruct
GF landscapes to extract data that could be used to estimate PC ratios [27]. Table 1
lists the studies which were used and the traits that were studied. Raw data is
provided in Data S1 in supplementary material.
2.2. Estimates of Peaks and Valleys
Using R version 4.3.2 [29],
I used the Nutrigonometry models to estimate the best (peaks) and worst
(valley) diets for the expression of the traits [28].
I plotted the average protein and carbohydrate estimate of peaks and valleys
from different traits in the same nutrient space to aid visualisation of the
potential nutritional trade-offs among traits. I estimated peaks and valleys
for all studies individually and then average these estimates across different
studies that measured the same trait to create a single estimates of PC ratios
for the peak and valley (e.g., male lifespan in [19,30]).
The best and worst PC ratio for male paternity share was estimated from [16] when males were the first (Paternity 1) or
second (Paternity 2) to mate with females. I also estimated ‘refractoriness’ as
the latency of females mated to focal male to remate with a competitor male
when focal males were first to mate (i.e., which helps increase male paternity
1) and latency of previously mated females to remate with a focal male
(‘Latency (Remate)’) when focal males were second to mate (i.e., for males to
gain paternity 2) [see [16] for details]. All
estimates of peak and valleys across traits were plotted in milligrams. All
figures were done using the ‘ggplot2’ package version 3.5.1 [31]. As mentioned above, studies varied in multiple
ways: genetic background of the Drosophila stock, diet composition
(solid vs liquid), intake estimates. I therefore opted to not conduct
statistical inferences as those would inevitably be biased.
3. Results
The distribution of peaks and valleys in nutrient
space created three regions.
3.1. Region 1: High Carbohydrate, Low Protein Diets
Low PC ratios (PC ratio of ~1:8 or lower) maximised
lifespan for both adult males and females as well as short-term female
oviposition rate and male refractoriness (Figure 1). On the other hand, low PC ratios minimised male paternity 1, male
and female adult body mass, larval developmental time and survival, and female
ovariole number. Overall, low PC ratios maximise lifespan at the expense of
most traits related to growth and male and female reproduction.
3.2. Region 2: High Protein, Low Carbohydrate Diets
High PC ratios (PC ratio of ~1:1 or higher)
maximised larval developmental time, adult body mass in both sexes, female
ovariole number and, for diets with higher concentration of macronutrients,
male paternity 2 and latency of females to remate with focal males (Figure 1). On the other hand, high PC ratios
minimised lifespan in both sexes as well as short-term female oviposition rate.
Male paternity 2 and latency of females to remate with focal males were also
minimised in this region, but when diets had less macronutrients. Overall, high
PC ratios maximised traits related to growth and reproduction at the expense of
lifespan.
3.3. Region 3: Balanced Diets
Balanced diets with PC ratios between ~1:1 and ~1:3
maximised larval survival and female reproductive rate and lifetime egg
production. No trait was minimised in this region (Figure 1).
4. Discussion
Animals must balance their nutrient intake to
express fitness-related traits, which creates the potential for nutritional
trade-offs among traits with competing nutritional needs [32]. Using the Nutrigonometry models on key GF
studies from the Drosophila literature, I compiled information about the
optimum PC ratio for a wide range of traits across life stages of the fly D.
melanogaster and found a strong potential for nutritional trade-offs among
traits related to lifespan, growth and reproduction. Specifically, there were
three regions in protein-carbohydrate nutrient space where peaks and valleys of
traits were found. Low PC ratios, which are diets richer in carbohydrates,
maximised lifespan and short-term female oviposition rate but minimised all
traits related to larval growth and survival, adult body mass and adult
reproduction. High PC ratios, which are diets richer in protein, showed the
opposite effect. Three traits were maximised at more intermediate PC ratios,
namely female lifetime egg production (PC ~1:3), female reproductive rate
(PC~1:2) and larval survival (PC ~1:1.5) (Figure 1). Flies are holometabolous insects and metamorphosis might help
resolve nutritional trade-offs between life stages [33,34].
This is less clear within life stages and between sexes, as shown here for male
and female reproductive and lifespan traits. Because males and females share
the same genome, nutritional trade-offs could create the potential for
intralocus sexual conflict [35–37], which
might be pervasive across insects [27]. One
way that intralocus sexual conflict could be resolved is through the modulation
of the expression of metabolic genes in males and females [38], but we do not yet have a complete
understanding of how nutritional trade-offs and sexual conflict interact to
modulate organism-wide gene expression.
It will be interesting to study the molecular
mechanisms and metabolic pathways which are up- and down-regulated when flies
experience different diets. An ambitious but worthwhile goal is to create GF
performance landscapes of genes and pathways using omics technologies to give
us the necessary mechanistic insights of the drivers underlying nutritional
trade-offs. TOR and AMPK pathways are two obvious higher level regulatory
pathways to control nutritional trade-offs but what are the genes that modulate
nutritional responses and trade-offs downstream of these major pathways [39–42]? My previous work has raised the possibility
that the uric acid pathway modulates at least some diet- and density-dependent
responses during D. melanogaster larval development [43], but the study lacks the high-resolution nature
of GF experiments and is by no means comprehensive. Other studies have used the
GF but did not gain similar level of molecular insights in either larvae (e.g.,
[18,20,21,44]) or adults (e.g., [6,19,30]). Molecular insights are crucial because
we are now uncovering how diet composition interact with genes and their
expression to modulate diet responses, growth and fitness. For example,
Yurkevych et al., [45] showed changed in the
expression of a wider range of genes that underpinned tolerance to high protein
diets. Similarly, Francis et al., [23]
showed that genetics plays a major role in diet-dependent responses in D.
melanogaster. Likewise, Havula et al., [24]
showed that genetics can strongly modulate larval development and survival,
particularly in less favourable diets such as high-sugar diets. Investigating
the effects of larval crowding – which is known to modulate protein
availability – on D. melanogaster larval gene expression, I found
transcriptomic-wide trade-offs across most major pathways including metabolism
and immunity [46]. Similar findings were
reported in Drosophila simulans [47].
It is possible that these transcriptomic-wide trade-offs emerge and are
modulated by diets, but specifically how remains to be ascertained. Future work
should take advantage of the molecular resources available for D.
melanogaster to uncover further insights into gene-diet interactions.
Even though there is growing evidence that genetics play an important role in diet-dependent responses, I assumed that the nutritional responses of the different D. melanogaster strains used across studies in the literature are comparable. There are not enough studies which consistently use the same genetic strain to allow for a study such as this. Therefore, the results presented here should be interpreted with caution, as there are likely unaccounted genetic effects underpinning the estimates of peaks and valleys. However, it is interesting that Havula et al., [24] reported higher larval survival variability in high-sugar diets across 196 D. melanogaster isolines. As shown here, this could be explained by the fact that diets with low PC ratio (i.e., sugar-rich diets) represent the worst diet for larval survival and therefore impose a much harsher developmental environment that could translate into higher variability in survival. Francis et al., [23] also found similar effect of genetic variability in more extreme (high sugar and high protein) diets. Together, these findings agree the argument I recently put forward that trait variability should increase when organisms feed in imbalanced diets [50]. This remains to be empirically tested.
5. Conclusions
There is strong potential for nutritional trade-offs between lifespan and traits related to growth and reproduction in Drosophila melanogaster. Future studies should focus on gaining mechanistic insights as in Havula et al., [24] and Francis et al., [23]. Furthermore, we need to gain a broader taxonomic understanding of how dietary responses are realised, and whether there are phylogenetic responses across taxa that can help us gain a broader understanding of how diet responses have evolved [27].
Supplementary Materials
The following supporting information can be downloaded at the website of this paper posted on Preprints.org, Data S1. Raw data used in this study.
Funding
No funding was received for the work presented in this manuscript.
Data Availability Statement
The data used in this paper is available as supplementary material.
Acknowledgements
I would like to acknowledge all colleagues working in the field of nutritional ecology whose work continue to inspire and underpin my own.
Conflict of interest: The author has no conflict of interests to declare.
References
- Evans, E.; Miller, D.S. Comparative Nutrition, Growth and Longevity. Proc. Nutr. Soc. 1968, 27, 121–129. [Google Scholar] [CrossRef] [PubMed]
- Mitchell, H. Comparative Nutrition of Man and Domestic Animals; Academic Press, 1964.
- Raubenheimer, D.; Simpson, S.J. The Geometry of Compensatory Feeding in the Locust. Anim. Behav. 1993, 45, 953–964. [Google Scholar] [CrossRef]
- Simpson, S.J.; Raubenheimer, D. A Multi-Level Analysis of Feeding Behaviour: The Geometry of Nutritional Decisions. Philos. Trans. R. Soc. Lond. B. Biol. Sci. 1993, 342, 381–402. [Google Scholar] [CrossRef]
- Fanson, B.; Yap, S.; Taylor, P.W. Geometry of Compensatory Feeding and Water Consumption in Drosophila Melanogaster. J. Exp. Biol. 2012, 215, 766–773. [Google Scholar] [CrossRef]
- Lee, K.P.; Simpson, S.J.; Clissold, F.J.; Brooks, R.; Ballard, J.W.; Taylor, P.W.; Soran, N.; Raubenheimer, D. Lifespan and Reproduction in Drosophila: New Insights from Nutritional Geometry. Proc. Natl. Acad. Sci. 2008, 105, 2498–2503. [Google Scholar] [CrossRef]
- Maklakov, A.A.; Simpson, S.J.; Zajitschek, F.; Hall, M.D.; Dessmann, J.; Clissold, F.; Raubenheimer, D.; Bonduriansky, R.; Brooks, R.C. Sex-Specific Fitness Effects of Nutrient Intake on Reproduction and Lifespan. Curr. Biol. 2008, 18, 1062–1066. [Google Scholar] [CrossRef]
- Guo, J.; Cui, Y.; Lin, P.; Zhai, B.; Lu, Z.; Chapman, J.W.; Hu, G. Male Nutritional Status Does Not Impact the Reproductive Potential of Female Cnaphalocrocis Medinalis Moths under Conditions of Nutrient Shortage. Insect Sci. 2021. [Google Scholar] [CrossRef] [PubMed]
- Treidel, L.A.; Clark, R.M.; Lopez, M.T.; Williams, C.M. Physiological Demands and Nutrient Intake Modulate a Trade-off between Dispersal and Reproduction Based on Age and Sex of Field Crickets. J. Exp. Biol. 2021, 224, jeb237834. [Google Scholar] [CrossRef]
- Rapkin, J.; Jensen, K.; Archer, C.R.; House, C.M.; Sakaluk, S.K.; Castillo, E. Del; Hunt, J. The Geometry of Nutrient Space-Based Life-History Trade-Offs: Sex-Specific Effects of Macronutrient Intake on the Trade-off between Encapsulation Ability and Reproductive Effort in Decorated Crickets. Am. Nat. 2018, 191, 452–474. [Google Scholar] [CrossRef] [PubMed]
- Harrison, S.J.; Raubenheimer, D.; Simpson, S.J.; Godin, J.-G.J.; Bertram, S.M. Towards a Synthesis of Frameworks in Nutritional Ecology: Interacting Effects of Protein, Carbohydrate and Phosphorus on Field Cricket Fitness. Proc. R. Soc. B Biol. Sci. 2014, 281, 20140539. [Google Scholar] [CrossRef] [PubMed]
- Ponton, F.; Wilson, K.; Holmes, A.; Raubenheimer, D.; Robinson, K.L.; Simpson, S.J. Macronutrients Mediate the Functional Relationship between Drosophila and Wolbachia. Proc. R. Soc. B-Biol. Sci. 2015, 282, 20142029. [Google Scholar] [CrossRef] [PubMed]
- Fanson, B.; Taylor, P.W. Protein:Carbohydrate Ratios Explain Life Span Patterns Found in Queensland Fruit Fly on Diets Varying in Yeast:Sugar Ratios. Age 2012, 34, 1361–1368. [Google Scholar] [CrossRef]
- Ng, S.H.; Simpson, S.J.; Simmons, L.W. Macronutrients and Micronutrients Drive Trade-offs between Male Pre-and Postmating Sexual Traits. Funct. Ecol. 2018, 32, 2380–2394. [Google Scholar] [CrossRef]
- Bunning, H.; Rapkin, J.; Belcher, L.; Archer, C.R.; Jensen, K.; Hunt, J. Protein and Carbohydrate Intake Influence Sperm Number and Fertility in Male Cockroaches, but Not Sperm Viability. Proc. R. Soc. B Biol. Sci. 2015, 282, 20142144. [Google Scholar] [CrossRef] [PubMed]
- Morimoto, J.; Wigby, S. Differential Effects of Male Nutrient Balance on Pre-and Post-Copulatory Traits, and Consequences for Female Reproduction in Drosophila Melanogaster. Sci. Rep. 2016, 6. [Google Scholar] [CrossRef] [PubMed]
- Gage, M.J.G.; Cook, P.A. Sperm Size or Numbers - Effects of Nutritional Stress upon Eupyrene and Apyrene Sperm Production Strategies in the Moth Plodia Interpunctella (Lepidoptera: Pyralidae). Funct. Ecol. 1994, 8, 594–599. [Google Scholar] [CrossRef]
- Rodrigues, M.A.; Martins, N.E.; Balancé, L.F.; Broom, L.N.; Dias, A.J.S.; Fernandes, A.S.D.; Rodrigues, F.; Sucena, É.; Mirth, C.K. Drosophila Melanogaster Larvae Make Nutritional Choices That Minimize Developmental Time. J. Insect Physiol. 2015, 81, 69–80. [Google Scholar] [CrossRef]
- Jensen, K.; McClure, C.; Priest, N.K.; Hunt, J. Sex-Specific Effects of Protein and Carbohydrate Intake on Reproduction but Not Lifespan in Drosophila Melanogaster. Aging Cell 2015, 14, 605–615. [Google Scholar] [CrossRef]
- Pascacio-Villafán, C.; Righini, N.; Nestel, D.; Birke, A.; Guillén, L.; Aluja, M. Diet Quality and Conspecific Larval Density Predict Functional Trait Variation and Performance in a Polyphagous Frugivorous Fly. Funct. Ecol. 2022, 36, 1163–1176. [Google Scholar] [CrossRef]
- Zanco, B.; Morimoto, J.; Cockerell, F.; Mirth, C.K.; Sgro, C.M. Fluctuating Temperatures Exacerbate Nutritional Stress during Development in Drosophila Melanogaster. bioRxiv 2023, 2023–11. [Google Scholar]
- Barragan-Fonseca, K.B.; Gort, G.; Dicke, M.; Van Loon, J.J.A. Effects of Dietary Protein and Carbohydrate on Life-history Traits and Body Protein and Fat Contents of the Black Soldier Fly Hermetia illucens . Physiol. Entomol. 2019, 44, 148–159. [Google Scholar] [CrossRef]
- Francis, D.; Ghazanfar, S.; Havula, E.; Krycer, J.R.; Strbenac, D.; Senior, A.; Minard, A.Y.; Geddes, T.; Nelson, M.E.; Weiss, F. Genome-Wide Analysis in Drosophila Reveals Diet-by-Gene Interactions and Uncovers Diet-Responsive Genes. G3 2021, 11, jkab171. [Google Scholar] [CrossRef] [PubMed]
- Havula, E.; Ghazanfar, S.; Lamichane, N.; Francis, D.; Hasygar, K.; Liu, Y.; Alton, L.A.; Johnstone, J.; Needham, E.J.; Pulpitel, T. Genetic Variation of Macronutrient Tolerance in Drosophila Melanogaster. Nat. Commun. 2022, 13, 1637. [Google Scholar] [CrossRef] [PubMed]
- Solon-Biet, S.M.; Cogger, V.C.; Pulpitel, T.; Wahl, D.; Clark, X.; Bagley, E.E.; Gregoriou, G.C.; Senior, A.M.; Wang, Q.-P.; Brandon, A.E. Branched-Chain Amino Acids Impact Health and Lifespan Indirectly via Amino Acid Balance and Appetite Control. Nat. Metab. 2019, 1, 532–545. [Google Scholar] [CrossRef] [PubMed]
- Morimoto, J.; Lihoreau, M. Quantifying Nutritional Trade-Offs across Multidimensional Performance Landscapes. Am. Nat. 2019, 193, E168–E181. [Google Scholar] [CrossRef] [PubMed]
- Morimoto, J. Optimum Ratio of Dietary Protein and Carbohydrate That Maximises Lifespan Is Shared among Related Insect Species. Aging Cell 2024, 23, e14067. [Google Scholar] [CrossRef] [PubMed]
- Morimoto, J.; Conceição, P.; Mirth, C.; Lihoreau, M. Nutrigonometry I: Using Right-Angle Triangles to Quantify Nutritional Trade-Offs in Performance Landscapes. Am. Nat. 2023, 201, 725–740. [Google Scholar] [CrossRef] [PubMed]
- R Core Team, R. R: A Language and Environment for Statistical Computing. 2013.
- Carey, M.R.; Archer, C.R.; Rapkin, J.; Castledine, M.; Jensen, K.; House, C.M.; Hosken, D.J.; Hunt, J. Mapping Sex Differences in the Effects of Protein and Carbohydrates on Lifespan and Reproduction in Drosophila Melanogaster: Is Measuring Nutrient Intake Essential? Biogerontology 2022, 23, 129–144. [Google Scholar] [CrossRef] [PubMed]
- Wickham, H. Ggplot2. WIREs Comput. Stat. 2011, 3, 180–185. [Google Scholar] [CrossRef]
- Simpson, S.J.; Raubenheimer, D. The Nature of Nutrition: A Unifying Framework from Animal Adaptation to Human Obesity; Princeton University Press: Princeton, 2012; ISBN 978-1-4008-4280-3. [Google Scholar]
- Collet, J.; Fellous, S. Do Traits Separated by Metamorphosis Evolve Independently? Concepts and Methods. Proc. R. Soc. B Biol. Sci. 2019, 286, 20190445. [Google Scholar] [CrossRef] [PubMed]
- Collet, J.M.; Nidelet, S.; Fellous, S. Genetic Independence between Traits Separated by Metamorphosis Is Widespread but Varies with Biological Function. Proc. R. Soc. B Biol. Sci. 2023, 290, 20231784. [Google Scholar] [CrossRef] [PubMed]
- Berger, D.; Grieshop, K.; Lind, M.I.; Goenaga, J.; Maklakov, A.A.; Arnqvist, G. Intralocus Sexual Conflict and Environmental Stress. Evolution 2014, 68, 2184–2196. [Google Scholar] [CrossRef] [PubMed]
- Bonduriansky, R.; Chenoweth, S.F. Intralocus Sexual Conflict. Trends Ecol. Evol. 2009, 24, 280–288. [Google Scholar] [CrossRef] [PubMed]
- Pennell, T.M.; Morrow, E.H. Two Sexes, One Genome: The Evolutionary Dynamics of Intralocus Sexual Conflict. Ecol. Evol. 2013, 3, 1819–1834. [Google Scholar] [CrossRef] [PubMed]
- Harano, T.; Okada, K.; Nakayama, S.; Miyatake, T.; Hosken, D.J. Intralocus Sexual Conflict Unresolved by Sex-Limited Trait Expression. Curr. Biol. 2010, 20, 2036–2039. [Google Scholar] [CrossRef] [PubMed]
- Simpson, S.J.; Raubenheimer, D. Macronutrient Balance and Lifespan. Aging 2009, 1, 875. [Google Scholar] [CrossRef]
- Solon-Biet, S.M.; Wahl, D.; Raubenheimer, D.; Cogger, V.C.; Le Couteur, D.G.; Simpson, S.J. The Geometric Framework: An Approach for Studying the Impact of Nutrition on Healthy Aging. Drug Discov. Today Dis. Models 2018, 27, 61–68. [Google Scholar] [CrossRef]
- Speakman, J.R.; Mitchell, S.E. Caloric Restriction. Mol. Aspects Med. 2011, 32, 159–221. [Google Scholar]
- Sperfeld, E.; Wagner, N.D.; Halvorson, H.M.; Malishev, M.; Raubenheimer, D. Bridging Ecological Stoichiometry and Nutritional Geometry with Homeostasis Concepts and Integrative Models of Organism Nutrition. Funct. Ecol. 2017, 31, 286–296. [Google Scholar] [CrossRef]
- Morimoto, J. Uric Acid Metabolism Modulates Diet-Dependent Responses to Intraspecific Competition in Drosophila Larvae. IScience 2022, 25. [Google Scholar] [CrossRef] [PubMed]
- Kutz, T.C.; Sgrò, C.M.; Mirth, C.K. Interacting with Change: Diet Mediates How Larvae Respond to Their Thermal Environment. Funct. Ecol. 2019, 33, 1940–1951. [Google Scholar] [CrossRef]
- Yurkevych, I.S.; Gray, L.J.; Gospodaryov, D.V.; Burdylyuk, N.I.; Storey, K.B.; Simpson, S.J.; Lushchak, O. Development of Fly Tolerance to Consuming a High-Protein Diet Requires Physiological, Metabolic and Transcriptional Changes. Biogerontology 2020, 21, 619–636. [Google Scholar] [CrossRef] [PubMed]
- Morimoto, J.; Wenzel, M.; Derous, D.; Henry, Y.; Colinet, H. The Transcriptomic Signature of Responses to Larval Crowding in Drosophila Melanogaster. Insect Sci. 2023, 30, 539–554. [Google Scholar] [CrossRef] [PubMed]
- Buchner, S.; Hsu, S.-K.; Nolte, V.; Otte, K.A.; Schlötterer, C. Effects of Larval Crowding on the Transcriptome of Drosophila Simulans. Evol. Appl. 2023, 16, 1671–1679. [Google Scholar] [CrossRef] [PubMed]
- Semaniuk, U.; Feden’ko, K.; Yurkevych, I.S.; Storey, K.B.; Simpson, S.J.; Lushchak, O. Within-diet Variation in Rates of Macronutrient Consumption and Reproduction Does Not Accompany Changes in Lifespan in D Rosophila Melanogaster . Entomol. Exp. Appl. 2018, 166, 74–80. [Google Scholar] [CrossRef]
- Lihoreau, M.; Poissonnier, L.-A.; Isabel, G.; Dussutour, A. Drosophila Females Trade off Good Nutrition with High-Quality Oviposition Sites When Choosing Foods. J. Exp. Biol. 2016, 219, 2514–2524. [Google Scholar] [CrossRef] [PubMed]
- Morimoto, J. A reply to: Reply to: A caveat about the use of trigonometric functions in statistical tests of Nutritional Geometry models. Sci. Rep. 2025. [Google Scholar]
Figure 1.
Nutritional trade-offs in Drosophila. The protein (x-axis) and carbohydrate (y-axis) estimates for the peaks (circles) and valleys (triangles) of each trait. Light blue = adult males; Red = adult females; Green = larvae. Black dashed line represents a PC ratio of 1:1.2. Black dotted line represents a PC ratio of 1:8.
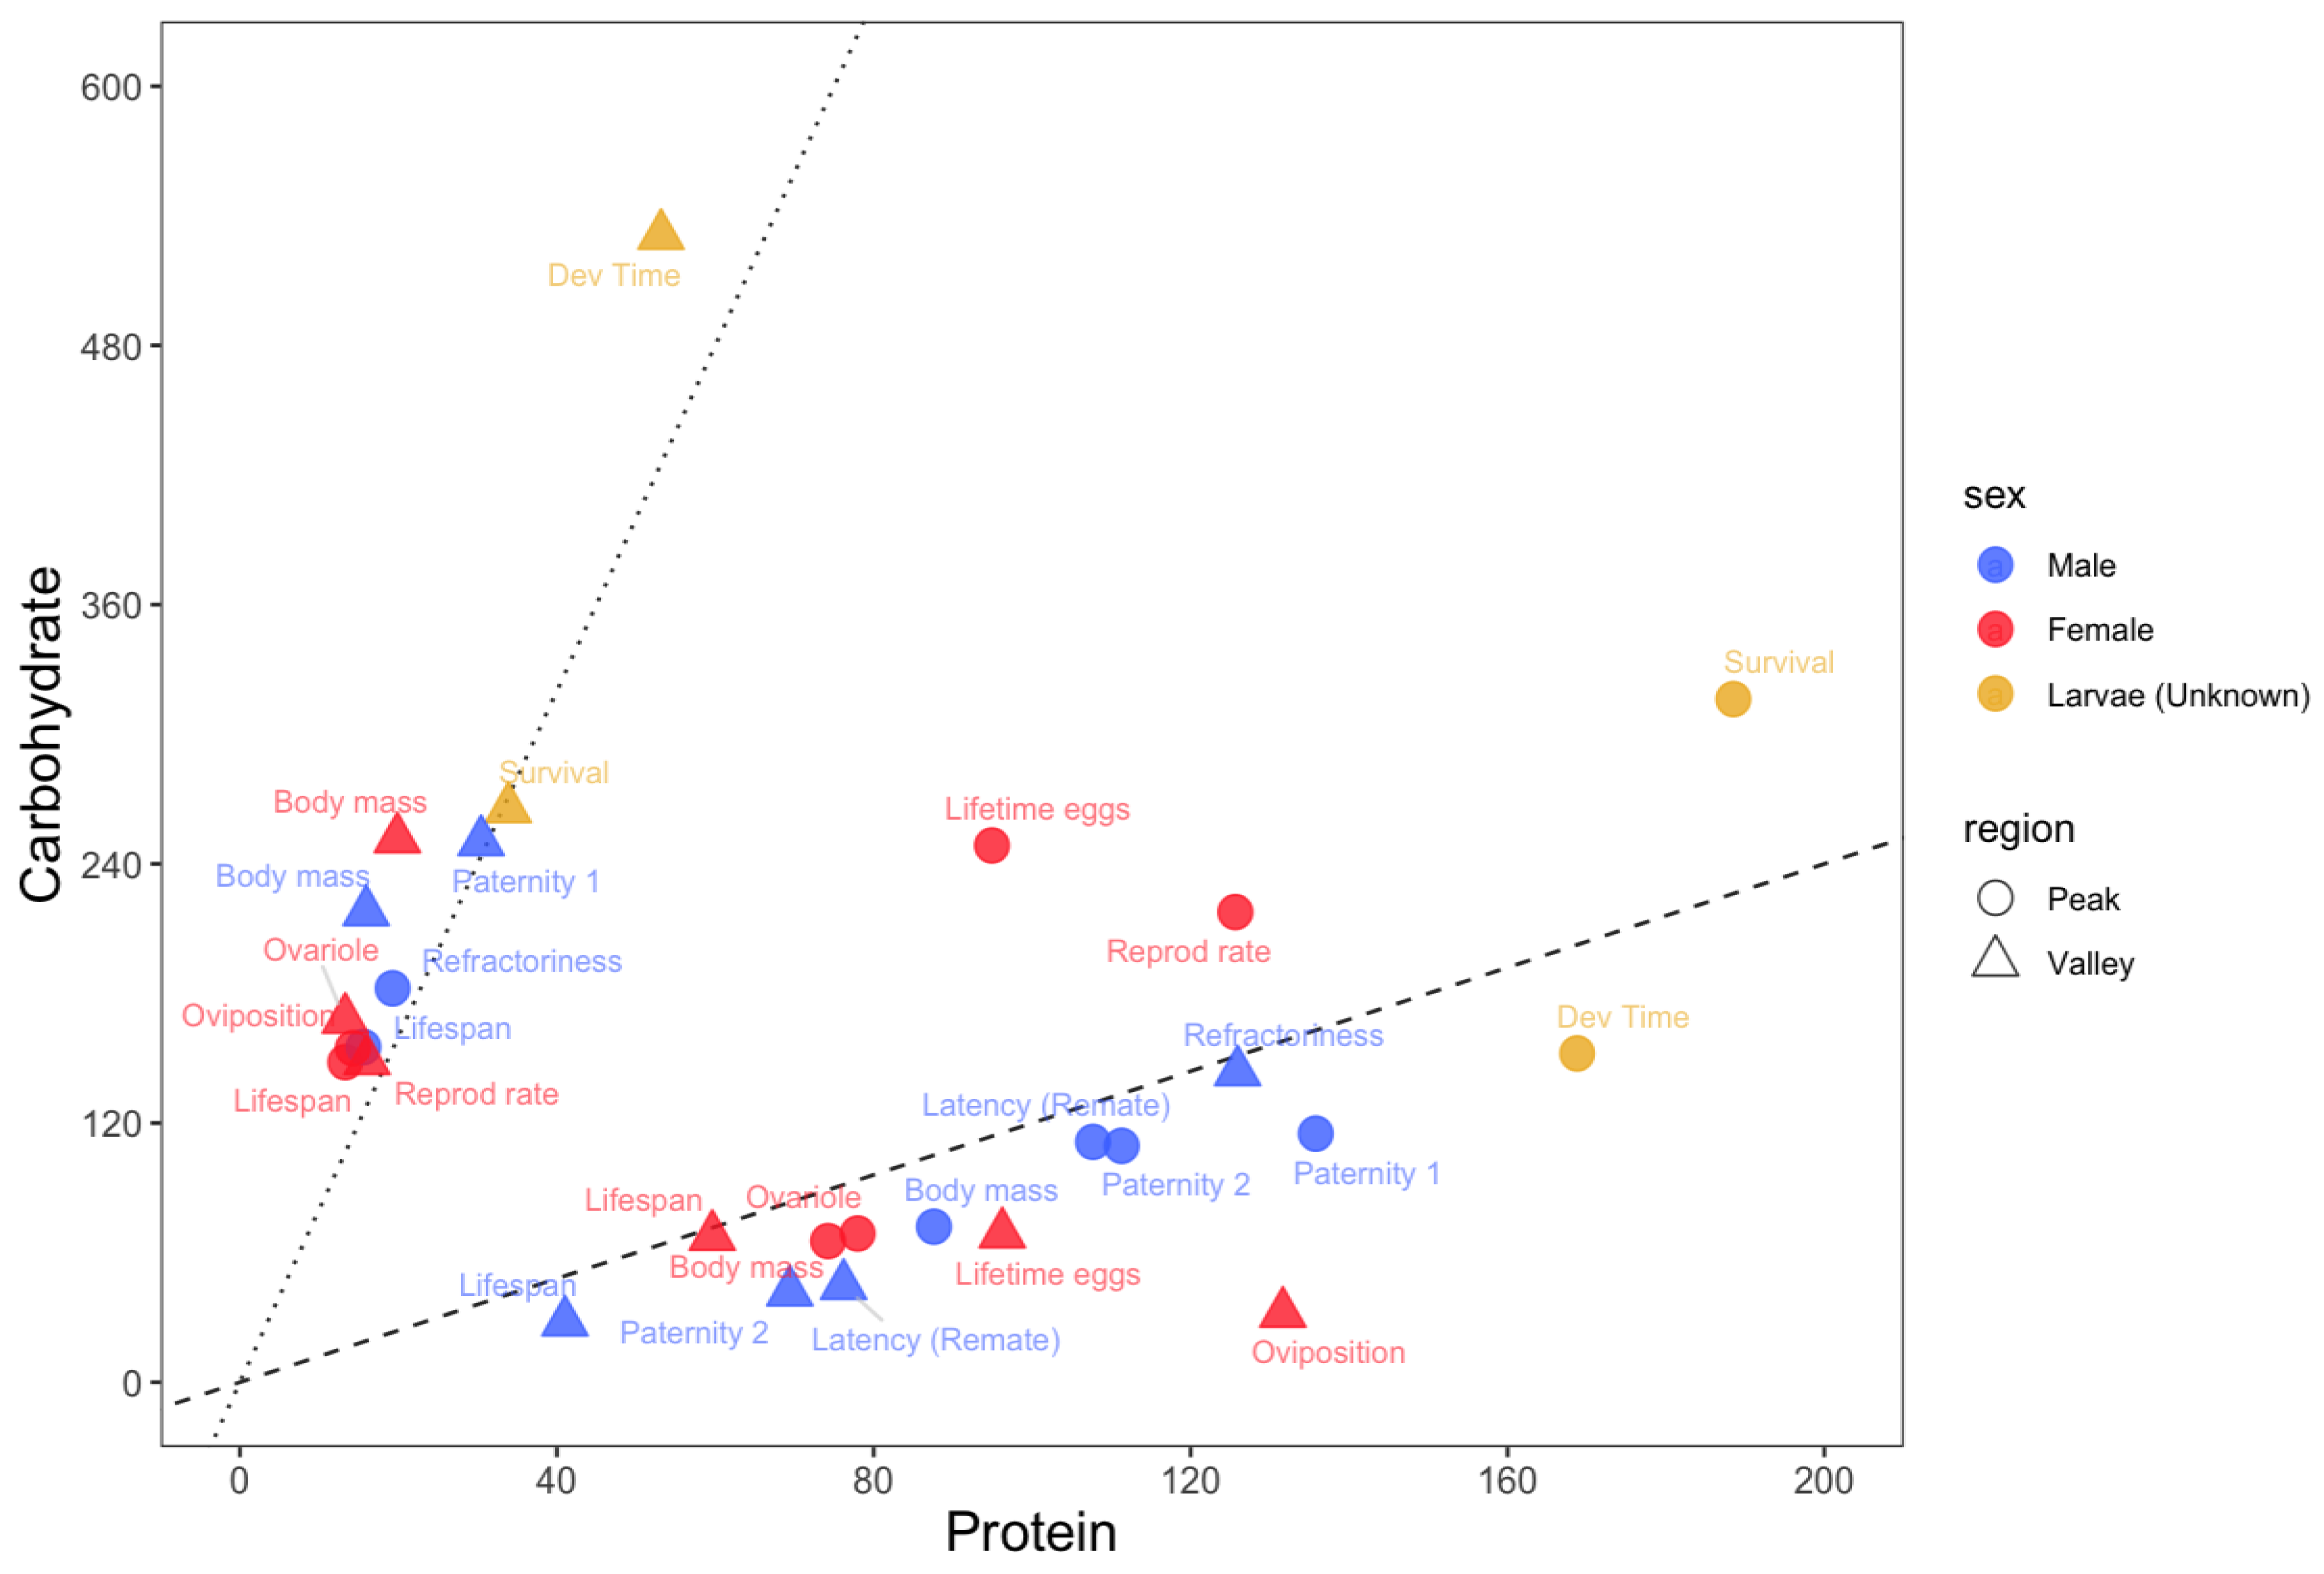

Table 1.
Literature that was included in this study.
| Lead author | Year | Trait(s) | Stage | Sex | Strain | Reference |
|---|---|---|---|---|---|---|
| Lee | 2008 | Lifespan, reproductive rate, lifetime egg production | Adults | Females | Canton-S | [6] |
| Semaniuk | 2018 | Lifespan | Adults | Females | ‘IF’ | [48] |
| Jensen | 2015 | Lifespan | Adults | Females, Males | Dahomey (Stuart Wigby) | [19] |
| Carey | 2022 | Lifespan | Adults | Females, Males | Dahomey(Nick Priest) | [30] |
| Rodrigues | 2015 | Adult body mass, Ovariole number | Adults | Females, Males | Outbred (Azeitão, Portugal) | [18] |
| Lihoreau | 2016 | Oviposition | Adults | Females | Canton-S | [49] |
| Morimoto | 2016 | Paternity share (P1 and P2), Refractoriness*, Latency to remate | Adults | Males | Dahomey | [16] |
| Kutz | 2019 | Developmental time, survival | Larvae | NA | Outbred (Ballina, Australia) | [44] |
* There was no detectable statistical effect of diet for this trait in the original study by [16] but the trait was included here for completeness.
Disclaimer/Publisher’s Note: The statements, opinions and data contained in all publications are solely those of the individual author(s) and contributor(s) and not of MDPI and/or the editor(s). MDPI and/or the editor(s) disclaim responsibility for any injury to people or property resulting from any ideas, methods, instructions or products referred to in the content. |
© 2025 by the authors. Licensee MDPI, Basel, Switzerland. This article is an open access article distributed under the terms and conditions of the Creative Commons Attribution (CC BY) license (http://creativecommons.org/licenses/by/4.0/).
Copyright: This open access article is published under a Creative Commons CC BY 4.0 license, which permit the free download, distribution, and reuse, provided that the author and preprint are cited in any reuse.


