
Submitted:
23 January 2025
Posted:
23 January 2025
You are already at the latest version
Abstract
Research on the impact of fiscal policy and foreign direct investment (FDI) on environmental quality has yielded conflicting results regarding their effects on carbon dioxide emissions. To further explore the asymmetric influences of these two critical factors on environmental quality, we employ a nonlinear ARDL approach to examine how fiscal policy (GOEX), FDI inflows, and other drivers of CO2 emissions, such as trade openness, financial development, and economic growth, affect environmental quality in Vietnam from 1990 to 2022. Our findings indicate that a positive shock in GOEX results in decreased emissions, whereas a negative shock in GOEX leads to increased emissions, challenging previous research suggesting that higher expenditures typically harm the environment. We also observe that positive changes in FDI result in higher CO2 emissions, whereas negative FDI shifts have no statistically significant impact. Additionally, our study revealed that trade openness improves environmental conditions, whereas economic growth and financial development contribute to increased CO2 emissions. The responses of CO2 emissions to the asymmetric effects of fiscal policy, FDI inflows, and other determinants in the short run last in the long run. These insights are valuable for policymakers to develop environmental sustainability strategies to mitigate climate change by addressing fiscal policies and other determinants of CO2 emissions.
Keywords:
fiscal policy
; foreign direct investment inflows
; CO2 emissions
; non-linear ARDL
1. Introduction
The global issue of climate change demands swift action to shift economies towards a low-carbon future. According to the Intergovernmental Panel on Climate Change [1] report, global temperatures are projected to rise by 1.5°C between 2030 and 2050, with further increases likely if greenhouse gas emissions are not reduced. There is a strong consensus among economists and scientists that global warming and climate change pose significant threats to economic growth, people's livelihoods, and human survival [2,3,4].
As emissions rise globally, research on their causes, especially the role of macroeconomic policies, is expanding. Fiscal policies, which are crucial for managing aggregate demand, economic growth, income, and inflation, are increasingly scrutinized for their environmental impacts. These policies could worsen and mitigate CO2 emissions. In the theoretical analysis of environmental fiscal reforms in India, [5] determined that environmental fiscal reforms offers a more efficient and cost-effective approach to improving environmental conditions compared to conventional regulatory measures. Few studies have focused on government spending as a tool for environmental management [6,7], while others have linked significant public expenditure to environmental harm [8,9,10,11]. Some studies have reported ambiguous results on the effects of fiscal policies on environmental quality [12,13], with limited investigations of the specific impacts of expansionary and contractionary fiscal policies on emissions.
It is crucial to explain the impact of fiscal policy instruments on environmental quality. Government spending can influence carbon emissions sources, thereby negatively affecting the environment [14]. [15] discuss mechanisms through which government expenditure impacts environmental quality. Health and educational spending can increase consumer income and potentially enhance environmental quality through income effects. Conversely, substantial government consumption can improve administrative and environmental controls and strengthen institutions that enhance environmental quality. Thus, government spending has a positive effect on environmental pollution. However, [6] also show that fiscal policy mechanisms include technique, income, and composition effects, potentially suggesting favorable ecological effects of fiscal policy. The technique effect enhances labor efficiency, which is linked to higher health and education spending, thus reducing pollution. The income effect denotes an increased demand for environmental quality with increasing income levels. The composition effect involves public spending promoting human capital-related economic activities that are less environmentally harmful than those linked to physical capital.
The impact of Foreign Direct Investment (FDI) on carbon dioxide emissions is complex, as illustrated by the "Pollution Haven" and "Pollution Halo” Pollution Halo’ hypotheses [16]. The "Pollution Haven" hypothesis suggests FDI from developed countries relocates to developing nations with lax environmental regulations, increasing CO2 emissions. This follows the comparative advantage theory, in which stricter regulations in developed countries raise production costs, prompting companies to move pollution-intensive operations to regions with looser standards. Conversely, the "Pollution Halo" hypothesis argues that FDI can improve environmental quality by introducing advanced technologies and management practices that reduce emissions. Proponents claim that FDI using cleaner technologies fosters eco-friendly growth and mitigates carbon emissions.
The World Bank identifies Vietnam as the country most impacted by air pollution among 10 nations worldwide [17], with environmental deterioration emerging as a critical concern [18]. As a rapidly growing Southeast Asian economy striving to achieve a high-middle-income status and become a modern industrialized nation by 2035, Vietnam faces challenges in balancing economic growth with environmental conservation [19]. A country's shift from a market economy to industrialization has negatively affected its environment and natural resources. Accelerated economic expansion, urban development, and industrial growth have led to increased energy use and environmental strain. The power sector's reliance on fossil fuels contributes to approximately two-thirds of the nation's greenhouse-gas emissions [17].
Since 1990, Vietnam's fiscal policy has supported national development through strategies such as economic revitalization, the State Budget Law, a Medium-term Expenditure Framework, and tax reforms such as reducing corporate income tax rates and introducing value-added tax. The Public Debt Management Law (2013) and Public Investment Law (2016) aim to enhance public debt management, fiscal sustainability, and investment transparency. Vietnam has also invested in infrastructure, education, and healthcare to boost its economic growth. Additionally, tax reforms and incentives have been introduced to attract foreign investment while maintaining a low public debt-to-GDP ratio [20].
Research suggests that the effects of fiscal policy on environmental quality and FDI inflows vary by pollutant type, region, and income level, necessitating further empirical studies to understand the relationship between fiscal policy, FDI inflows, and the environment. This study examines the dynamic connections between fiscal policy via government expenditure, FDI inflows, and CO2 emissions in Vietnam from 1990 to 2022. Furthermore, negative and positive shocks to Vietnam's government expenditure can lead to lower and higher CO2 emissions, respectively. These findings are not in line with previous research that has linked increased spending on environmental degradation. Additionally, an increase in FDI correlates with decreased CO2 emissions, whereas a reduction in FDI has no significant effect on emissions levels. Furthermore, trade openness improves environmental quality by enhancing energy efficiency, whereas economic growth and financial development are associated with higher CO2 emissions.
Our findings contribute to the existing literature by examining the asymmetrical effects of fiscal policy and FDI inflows on carbon dioxide emissions, considering trade openness, economic growth, and financial development as control variables. Unlike most previous studies, this study addressed the asymmetric impact of fiscal policies and FDI on environmental quality. Additionally, this study employs a nonlinear Autoregressive Distributed Lag (ARDL) approach to assess these effects in Vietnam's emerging economy. The nonlinear ARDL method offers several advantages. It captures both positive and negative variable effects simultaneously, performs well with limited sample sizes, accommodates variables integrated at different orders, and provides robust results through a dynamic error correction.
The remainder of this paper is organized as follows: Section 2 reviews the relevant literature. The third section elaborates on the data sources, variable estimation techniques, and methodological approaches. Section 4 presents the results and their analyses. Section 5 presents the conclusions and offers policy recommendations.
2. Literature Review
2.1. Fiscal Policy and Environmental Quality
Environmental and energy economists have shown a growing interest in the link between fiscal tools and environmental quality, although empirical research is still limited. Fiscal measures can both increase and decrease CO2 emissions, thereby influencing environmental quality. Few studies have analyzed government expenditure as a fiscal tool for managing environmental quality [6,7]. [6] identified four ways fiscal spending impacts atmospheric pollution: "scale, composition, technique, and income" effects. The scale effect pertains to environmental pressure from rapid economic growth. The composition effect involves shifting from physical capital-intensive inputs to less-polluting human capital-intensive inputs. This technique results in more efficient labor through improved practices. The income effect reflects the desire for a better environment as income increases. [5] conducted a theoretical analysis of environmental fiscal reforms (EFR) in India and concluded that EFR could achieve more efficient and cost-effective environmental improvements than traditional regulations.
[21] focuses on factors affecting carbon emissions, such as economic growth, political and economic freedom, population growth, urbanization, and energy use. [22] discovered no significant effect on CO2 emissions, but found a notable reduction in SO2 emissions from government expenditures in 77 economies (1980-2000), with SO2's impact shifting from negative to positive as income levels rose. Studies by [15] and [22] neglected the asymmetric relationships between fiscal policy and CO2 emissions. [23] found that vehicle registration taxes reduced carbon emissions in the automotive sector of 15 EU countries from 2001 to 2010. Current research has inadequately addressed the complex relationships between fiscal policies and CO2 emissions, neglecting both the positive and negative aspects.
[9] examined Turkey's fiscal policy impact on environmental quality from 1960 to 2013, concluding that fiscal measures reduce carbon emissions and are crucial for environmental management. Similarly, [11] studied China's fiscal policy tools and environmental degradation from 1980 to 2016 and found that fiscal policies significantly worsened long-term environmental quality, implying that expansionary fiscal measures harmed the environment. A limitation of these studies is the assumption of a symmetric relationship between fiscal policy instruments and environmental quality.
[24] reveal conflicting results among ASEAN countries regarding the asymmetric impacts of fiscal policies on CO2 emissions. In the long run, expansionary fiscal policy (positive government spending shocks) increased CO2 emissions in Indonesia, the Philippines, and Thailand, but had no significant effect in Malaysia and Singapore. Contractionary fiscal policy (negative government spending shocks) decreased CO2 emissions in Indonesia, the Philippines, and Singapore but increased emissions in Malaysia. These divergent outcomes suggest that the environmental impacts of fiscal policies vary considerably across ASEAN nations. In the short run, the effects of fiscal policies on CO2 emissions also differ among countries. Expansionary fiscal policies positively influenced emissions in all ASEAN economies, except Malaysia. Contractionary fiscal policies negatively impacted emissions only in Malaysia and the Philippines. These contrasting short- and long-term effects across countries highlight the complex relationship between fiscal policy and environmental quality in the ASEAN region.
Given these conflicting results, there is a clear need for further research on the ecological impacts of fiscal policies. Future studies should investigate the underlying factors contributing to these divergent outcomes across countries, such as differences in economic structures, the energy mix, and environmental regulations. Additionally, research should explore how the specific attributes of government spending in each country can affect emissions. More insights into Vietnam would be valuable for designing more effective and targeted fiscal policies to improve environmental quality in ASEAN and other countries with similar economic and environmental backgrounds.
2.2. Fiscal Policy and Environmental Quality
The "Pollution Haven" pollution haven hypothesis introduced by [25] suggests that economic globalization drives industrialized nations to transfer high-pollution industries to developing countries with lax environmental regulations. This aligns with the comparative advantage theory [26,27], which argues that stringent environmental regulations in developed countries increase production costs, leading manufacturers to relocate pollution-intensive operations to nations with looser regulations, a phenomenon also termed the "industrial flight hypothesis" [28,29,30,31,32]. [33] proposed the "Pollution Halo" hypothesis, suggesting that FDI improves host countries' environmental quality through advanced technologies and management experience, which was confirmed by [34,35,36], and [37] in South Africa from 1990 to 2018. However, [38] observed heterogeneous technical spillover effects of FDI across Chinese provinces, indicating the coexistence of "Pollution Haven" and "Pollution Halo" effects. [39] attributed the "Pollution Haven" in China to the energy rebound effect from FDI-induced energy efficiency improvements. The overall impact of FDI on China's carbon emissions remains uncertain because these studies do not address the scale and industrial structure effects of FDI.
Foreign direct investment (FDI) has been hailed as a potential catalyst for environmental improvements in host countries. The transfer of advanced technologies and management practices from multinational enterprises can facilitate the adoption of cleaner production processes and energy-efficient techniques [40]. Moreover, FDI inflows can stimulate economic growth, which may lead to increased demand for environmental quality and stricter environmental regulations [41]. Consequently, FDI could potentially reduce CO2 emissions and improve environmental quality in the recipient countries, especially in the long run [42]. Conversely, FDI may exacerbate environmental degradation through the pollution haven hypothesis, whereby multinational corporations relocate their polluting activities to countries with lax environmental regulations [43]. Furthermore, the scale effect of FDI-induced economic growth could outweigh the technique effect, leading to an overall increase in CO2 emissions [44].
Given the contrasting potential impacts of FDI on environmental quality, there is a compelling need to investigate the asymmetric effects of FDI on CO2 emissions. Negative and positive shocks or fluctuations in FDI inflows may have different impacts on a country's environmental performance. Negative FDI shocks, such as the divestment or downsizing of foreign firms, could lead to job losses, reduced economic activity, and potentially weaker environmental regulations, exacerbating CO2 emissions [45]. Conversely, positive FDI shocks, such as increased foreign investment in cleaner technologies and sustainable practices, may facilitate the transition towards a low-carbon economy [46]. By explicitly accounting for these asymmetries, policymakers can devise targeted strategies to mitigate the adverse environmental consequences of negative FDI shocks while capitalizing on the potential benefits of positive FDI inflows [47]. Such an asymmetric analysis is crucial for achieving sustainable economic development while safeguarding environmental quality.
2.3. Other Factors Responsible for Carbon Emissions
2.3.1. Financial Development and Carbon Emissions
Literature has found that financial development has a direct or indirect impact on carbon Some studies suggest that financial development reduces the cost of credit, facilitating loans [48] and consequently boosting industrial output and development. This positive association with energy consumption is supported by [49], indicating that a developed financial sector stimulates energy use and carbon emissions [50,51]. [52] found that in Central and Eastern Europe's frontier economies, financial development increased credit availability for energy-intensive products such as houses, cars, and appliances, leading to higher energy use and carbon emissions. Conversely, [53] argued that financial development reduces intermediary costs and risks for investors in clean energy projects, enhancing R&D investment in low-carbon technologies, which is crucial for reducing carbon emissions. However, some scholars question whether financial development can reduce carbon dioxide emissions [54]. Therefore, the relationship between financial development and carbon emissions requires an empirical investigation across various contexts and variables.
2.3.2. Trade Openness and Carbon Emissions
Trade openness and development not only attract foreign direct investment and enhance R&D capabilities [55], but also boost energy efficiency and reduce carbon emissions [56]. They improved their environmental governance [57], per capita carbon emissions, and elevated global environmental standards [58]. Moreover, international trade facilitates the spread of eco-friendly products and services, helping nations transition to low-carbon economies and tackle global carbon reduction [59]. In China, trade has been crucial for economic growth, advancing pollution control and environmental management techniques [60]. However, the relationship between trade openness and carbon emissions has been debated, with studies showing mixed effects. [61] found trade openness achieves carbon neutrality in wealthier countries but not in poorer ones, echoing [62] on how income influences emissions. Lopez [63] noted trade increases pollution and resource use due to its scale effect, supporting the environmental Kuznets hypothesis. The impact of trade liberalization varies by a country's income and economic structure, with [64] concluding it reduces emissions in high-income nations only.
2.3.3. Economic Growth and Carbon Emissions
Economic growth positively affects CO2 emissions across countries, as evidenced by numerous empirical studies using diverse methodologies. This relationship has been identified in Nigeria [65], OECD countries [66], Egypt [67], South Africa [68], Turkey [69], and China [70] using estimators such as ARDL, FMOLS, and DOLS with data spanning several decades. [71] and [72] found that economic growth increases CO2 emissions in various countries and regions, such as 20 African countries, MINT countries, GCC countries, G7 countries, and APEC countries, using different econometric approaches, including ARDL, STIRPAT, and DSUR, for different time periods ranging from 1980 to 2018
3. Model and Methodology
Based on previous studies on the determinants of CO2 emissions [10,73], we modeled CO2 emissions as a function of the variables under consideration as follows:
 where CO2, TRADE, CREDIT, FDI, GOEX, and GDPPC represent carbon dioxide emissions, trade openness, financial development, foreign direct investment inflows, fiscal policy, and economic growth, respectively. We claim that these variables are decisive production factors and major drivers of CO2 emissions. Variables in the time-series data undergo standardization, and natural logarithms are employed to generate accurate estimates [74]. Table 1 provides a detailed description of the study variables.
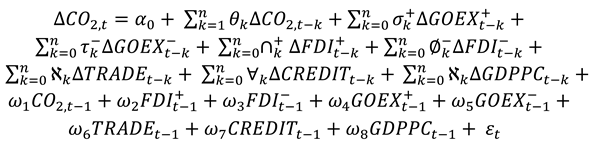
This research employs the augmented Dickey Fuller (ADF) [75] and Phillips Perron (PP) [76] tests to examine unit roots. To assess nonlinearity, the study utilizes the BDS test, which was published as [77]. The logarithmically transformed Equation (1), incorporating both positive and negative changes in fiscal policy and foreign direct investment inflows while controlling other determinants of carbon emissions, can be expressed as:

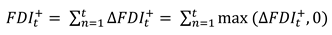
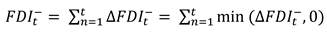
In this equation, the intercept is represented by , the coefficients of the variables are denoted by , and signifies the error term at time t. This research divides fiscal policy and foreign direct investment inflows into two separate components: a positive partial sum and a negative partial sum. From these, four new time series were generated as follows:


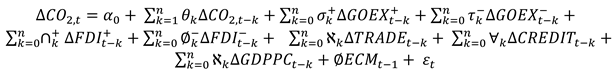
The nonlinear autoregressive distributed lag (NARDL) framework in Eq. (2) can be written as:
The asymmetric influence of variables on carbon emissions was investigated using the nonlinear ARDL approach for several reasons: (i) it integrates nonlinear asymmetry and cointegration within a single equation; (ii) the NARDL model assesses how positive and negative changes in decomposed variables affect the dependent variable; (iii) it is suitable for small sample sizes; (iv) it offers flexibility by not requiring variables to be integrated in the same order; and (v) it functions as a dynamic error-correction representation, providing robust empirical results even with limited sample sizes.
The long-run symmetry ( = for GOEX and = for FDI) and asymmetry ( ≠ for GOEX and ≠ for FDI) are tested by using the standard Wald test.
Regarding the long-term asymmetric relationship between FDI and carbon emissions, a statistically significant positive coefficient ( > 0) indicates that an increase in FDI (positive shocks in the partial sum of FDI) leads to higher carbon emissions. Conversely, a statistically significant negative coefficient ( < 0) suggests that a decrease in FDI (negative shocks in the partial sum of FDI) results in a substantial rise in carbon emissions. Similarly, for the long-term asymmetric relationship between GOEX and carbon emissions, a statistically significant positive coefficient ( > 0) implies that an expansionary fiscal policy (positive shocks in the partial sum of FDI) increases carbon emissions. In contrast, a statistically significant negative coefficient ( < 0) indicates that a contractionary fiscal policy (negative shocks in the partial sum of FDI) significantly raises carbon emissions.
To calculate short-term NARDL elasticities by incorporating an error correction mechanism, researchers can employ the following equation:
In the Eq. (8), represents error correction term, which also shows the long-run equilibrium speed of adjustment after the shock in the short-run. Also, the short-run symmetry ( = for GOEX and = for FDI) and asymmetry ( ≠ for GOEX and ≠ for FDI) are tested by using the standard Wald test.
Following the verification of a long-term relationship, the dynamic multiplier effect is evaluated. The asymmetric cumulative dynamic multipliers' impacts on CO2E resulting from a single unit change in , , and and can be determined using the following methods:
 where: as → ∞, then → and → for GOEX together with → and → for FDI. One should note that , , , and . The calculated dynamic multipliers allow for the observation of system-impacting shocks, revealing the dynamic process of adjustment both towards and away from a new equilibrium state.
Table 2 shows the descriptive statistics that evaluate the performance of the underlying variables during the study period of 1990-2022, focusing on their central tendencies and dispersion. GOEX exhibited the highest mean value, followed by CO2E, GDPPC, TRADE, CREDIT, and FDI. Negative skewness is observed for all variables, except FDI and GOEX. The 33 observations in each series demonstrated a normal distribution. As indicated by the standard deviation, CO2E shows the highest volatility, followed by CREDIT, GOEX, GDPPC, FDI, and TRADE. This indicated a significant level of variability among the examined variables.
4. Results and Discussion
4.1. Preliminary Analysis
This study examines the uneven impacts of fiscal policy tools and foreign direct investment inflows on environmental conditions in Vietnam. Table 3 presents the results of ADF and PP tests. The statistical findings from these tests reveal that all the variables exhibit stationarity at either I(0) or I(1), with no variables showing stationarity at I(2).
Before employing the NARDL model, it was essential to examine the dataset for nonlinearity. To accomplish this, the nonlinear method known as BDS, introduced by Broock, Scheinkman, Dechert and LeBaron [77], was applied. Table 4 presents the results of the BDS test, indicating that all the variables exhibit nonlinear characteristics. Consequently, the NARDL model was deemed appropriate for further analysis.
4.2. Results of NARDL Bound Test
To establish long-term connections between variables, this study employs a NARDL-bound methodology. The results of the NARDL-bound cointegration test are presented in Table 5. The findings reveal that the calculated F-statistics are significant at the 5% level, confirming the existence of a long-term co-integration relationship among the examined variables. This study distinguishes itself from previous research by demonstrating a long-run cointegration link between fiscal policy tools and CO2 emissions, within a nonlinear framework.
4.3. Long-Run Results
Another method to determine the existence of a long-term relationship is to examine the value of the cointegrating equation ECTt−1 [78] among the variables under study. The error correction term (ECTt−1) coefficient is both negative and statistically significant, indicating a substantial convergence towards long-term equilibrium. Consequently, any deviation from the long-term equilibrium among variables is corrected in each time period, ultimately resulting in the restoration of a stable, long-term equilibrium state.
Table 6 presents the results for the asymmetric ARDL model. Long-term findings reveal that a positive change in FDI has a significant effect on CO2 emissions. Specifically, a positive shock of 1% in FDI leads to a 0.124% improvement in the environmental quality. While a negative shift in FDI shows an unfavorable impact on environmental quality through an increase in carbon emissions, this effect is not statistically significant. Foreign direct investment has played a crucial role in improving environmental quality and reducing carbon emissions in Vietnam through several channels. Multinational electronics and semiconductor companies have introduced advanced energy-efficient technologies to their manufacturing plants in Vietnam, contributing to cleaner production processes and reduced emissions [79]. Global apparel and footwear brands have imposed stricter environmental standards on their suppliers, prompting local firms to adopt sustainable practices [80]. For example, in the first 9 months of 2024, FDI into Vietnam reached 24.8 billion USD, led by high-value industries such as electronics, auto components, semiconductors and green technology [81]. Furthermore, foreign investors in the renewable energy sector have increased environmental awareness and invested in wind farms and solar power plants, contributing to Vietnam's transition towards a greener energy mix [82,83]. These outcomes agree with [84], who argue that in the long run, a positive shock in FDI inflows has a harmful and substantial effect on CO2 emissions in Nigeria, indicating that such a shock impedes CO2 emissions. The research conducted by [85] aligns with our results, indicating that in the immediate aftermath, a 1% rise in FDI correlates with a slight 0.015% decrease in energy transformation quality, suggesting initial negative environmental consequences. Nevertheless, over an extended period, a significant 0.042% enhancement in energy transformation quality implies that FDI-driven projects ultimately positively contribute to sustainable energy practices.
The current study deviates from the findings of Minh, et al. [86], who demonstrate that a 1% surge in FDI results in a 0.1% increase in CO2 emissions per capita. This divergence can be attributed to our research employing positive shocks in FDI as a factor positively affecting CO2 emissions. According to our analysis, positive shocks in foreign direct investment (FDI) can potentially decrease CO2 emissions in Vietnam. This may be due to the fact that when multinational corporations with advanced green technologies invest in Vietnam, they often introduce their environmentally-friendly production processes and cleaner technologies. This technology transfer can enable Vietnamese firms to adopt more energy-efficient and low-carbon practices, reducing their carbon footprint. For instance, Samsung's investment in Vietnam has facilitated the transfer of energy-efficient technologies in its manufacturing facilities, which has contributed to reducing emissions [87]. Furthermore, increased FDI in renewable energy projects, such as solar and wind farms, can directly contribute to reducing Vietnam's reliance on fossil fuels and decreasing CO2 emissions from the power sector. For example, the Bac Lieu wind farm, a joint venture between Vietnamese goverment and Philippines-based companies, has helped to reduce CO2 emissions by generating clean electricity [88].
The long-term effects of changes in government spending show that any positive shock on GOEX leads to lower emissions, whereas any negative shock on GOEX causes higher emissions. Specifically, a 1% increase in government expenditure results in a 1.275% reduction in pollution, whereas a 1% decrease leads to a 5.627% increase. This contrasts with previous studies by [22] and [10], and [11], which indicated that higher government spending harms environmental quality. In Vietnam, recent substantial growth in government operational expenses, outpacing revenue growth primarily driven by expanded social welfare programs, higher wages and benefits, and increased debt interest payments, explains the findings. The wage component now constitutes about 20% of the total expenditure, mostly because the base salary increases. Investments in education and healthcare have grown significantly, outpacing the average expenditure increase and raising their budget shares to 19% and 9.5%, respectively [89]. This aligns with [6], who argued that changes in spending on public goods can significantly reduce pollution levels. As a typical case, Japan's economy benefits from increasing government expenditure, leading to a 0.352% reduction in CO2 emissions [10]. The Japanese government is likely to focus on investments in economic projects employing advanced eco-friendly technologies, thus reducing pollution. This indicates that Japanese spending is mainly on human capital activities such as health and education, which generate lower carbon emissions than physical infrastructure. This supports the notion that, while consumption-driven expenditures can cause environmental pollution, spending on health and education may prompt the government to enhance environmental quality through income-related channels [6,7]. These findings imply that fiscal policies are effective tools to improve environmental quality and address climate change in Vietnam.
A negative shock in fiscal policy, characterized by a reduction in government spending, can lead to higher emissions in Vietnam for several reasons. First, a contraction in government expenditure may result in lower investments in environment-friendly infrastructure, renewable energy projects, and energy-efficient technologies. Foreign direct investment has played a crucial role in the development of Vietnam's renewable energy sector, particularly in wind and solar power projects, which could discourage such investments, hindering the transition towards a greener energy mix and leading to higher reliance on fossil fuels, which are major contributors to emissions [82,90]. Second, cuts in public spending on education and healthcare could adversely affect environmental quality [91]. As noted by [89], investments in these sectors have grown significantly in Vietnam, raising their budget shares, with education promoting environmental awareness and healthcare expenditure improving overall well-being and potentially reducing the harmful effects of pollution. A negative fiscal shock might undermine these investments, consequently weakening the government's ability to effectively address environmental concerns. Furthermore, a fiscal contraction could slow economic growth and reduce household incomes, potentially leading to greater reliance on less expensive but more polluting energy sources [92], such as coal or biomass, which is particularly relevant in Vietnam, where a significant portion of the population still relies on traditional energy sources [83].
The long-term findings suggest that TRADE coefficients have a considerable negative effect on carbon dioxide emissions. This indicates that a 1% shift in the TRADE coefficient results in an approximately 0.487% enhancement in the environmental quality. This result suggests that trade liberalization could play a crucial role in enhancing energy efficiency and promoting energy-saving technologies, thereby reducing the emission of pollutants such as CO2 [93]. The estimated long-term coefficient of CREDIT is positive and statistically significant at the 5% level, suggesting that a 1% growth in economic activity leads to a 0.357% rise in CO2 emissions. This observation indicates that economic expansion contributes to environmental deterioration over time. This suggests that financial development enables the provision of credit for energy-intensive goods, such as homes, automobiles, and appliances, which increases energy usage and carbon emissions [52]. Moreover, economic growth has a positive impact on CO2 emissions, with a 1% increase in GDPPC resulting in a 3.197% decline in environmental quality. The increase in CO2 emissions from economic growth is primarily attributed to increased energy consumption, industrialization, and urbanization. As economies grow, they tend to rely more heavily on fossil fuels for energy, releasing substantial amounts of CO2. Research has demonstrated that the increased industrial activity and urbanization accompanying economic growth also contribute to higher emissions due to greater energy and transportation demands [68,94,95].
4.4. Short-Run Findings
As reported in Table 6, a 1% increase in foreign direct investment (FDI) leads to a 0.128% decrease in CO2 emissions in the short term, while negative changes in FDI show no significant impact on environmental quality. Additionally, positive shifts in government expenditure (GOEX) demonstrated significant decreasing effects on CO2 emissions, whereas a negative shift in government expenditure can lead to environmental degradation. Specifically, a 1% positive shock in the partial sum of government expenditures decreases carbon emissions by 0.719%, whereas a 1% negative shock increases emissions by 7.678%. Trade openness (TRADE) has a negative and significant effect on CO2 emissions, with a 1% increase in trade openness improving environmental quality by 0.608%. Financial development (CREDIT) has a positive and significant impact on CO2 emissions, as a 1% increase in this factor increases CO2 emission levels by 0.491%. Economic growth (GDP) significantly contributes to increased CO2 emissions in the short run, with a 1% rise in GDP resulting in a 1.209% decline in environmental quality. Therefore, these short-term asymmetric responses persist in the long term. The nature of the linkages persists consistently in both the short and the long run.
4.5. Stability Diagnostic Test
The research conducted various diagnostic assessments to evaluate NARDL outcomes, with comprehensive results presented in Table 7. The Breusch–Godfrey LM test was employed to detect serial correlation among variables. The table indicates that the LM test shows no first-order serial correlations. The RESET test confirmed the absence of model misspecification issues. Heteroscedasticity was examined using the Breusch-Pagan-Godfrey test and ARCH test, with insignificant probability F-statistic values, suggesting that the null hypothesis of homoscedasticity cannot be rejected. The Jarque-Bera test for normal distribution demonstrates that the variables follow a normal distribution. Finally, the Wald test was used to examine the nonlinear behavior of the model. The Wald test results indicate long-run asymmetries in the model for government expenditure.
Stability techniques were used to evaluate the structural stability of the model. Figure 1 illustrates the cumulative sum (CUSUM) and cumulative sum of squares (CUSUMSQ) stability tests, as introduced by [96]. The results demonstrate that the statistics are significant at the 5% level, indicating that the model coefficients are structurally stable.
Figure 2 illustrates the dynamic multiplier plots used to evaluate the asymmetries resulting from separating GOEX and FDI into positive and negative shocks. The findings indicate an asymmetric adjustment of government expenditure (GOEX) and foreign direct investment inflows (FDI) towards equilibrium in response to positive and negative shocks over the long term. Additionally, an expansionary fiscal policy leads to a reduction in CO2 emissions. Conversely, a contractionary fiscal policy results in a slight decrease in emissions during the forecast period.
Notes: The solid black line indicates positive shocks to the GOEX and FDI, while the dashed black line indicates negative shocks. The red dashed lines illustrate the dynamic multiplier combinations resulting from the positive and negative shocks of the disaggregated GOEX and FDI on CO2 emissions. The vertical axis shows the range of positive and negative impacts, and the horizontal axis shows the time frame.
5. Conclusion and Policy Implications
The impact of fiscal policy on environmental quality can be beneficial or harmful depending on public sector spending, causing asymmetric effects on CO2 emissions. Furthermore, mixed results have been found in previous studies on the decisive role of FDI. Based on this backdrop, this study examines the asymmetric influence of fiscal policy and FDI on Vietnam's environmental pollution (1990-2022) using the NARDL approach. The results indicate that the NARDL models statistically confirm a long-term causal relationship among variables, with a significant negative cointegrating parameter indicating both short-term dynamics and long-term equilibrium effects. Based on the asymmetric ARDL estimation, an analysis of the long-run impacts of alterations in government expenditure reveals that a positive shock in GOEX results in decreased emissions, whereas a negative disruption in GOEX leads to increased emissions. Increases in foreign direct investment (FDI) can significantly decrease CO2 emissions because FDI targets energy-saving industries and eco-friendly technologies. Conversely, decreases in FDI have a statistically insignificant effect on reducing CO2 emissions, indicating that an increase in pollution is not strongly linked to FDI decline. Trade openness enhances environmental quality, possibly by improving energy efficiency, while economic growth and financial development increase CO2 emissions because of higher energy consumption, industrialization, and urbanization.
Given these findings, Vietnam and other countries with identical economic backgrounds can adopt strategic measures to improve environmental quality by reducing carbon emissions. First, adapting fiscal policy is essential, with increased government investment in public goods such as healthcare and education, which have smaller carbon footprints than heavy industry, thus reducing emissions while fostering economic growth toward sustainability. Second, Vietnam should design policies to draw FDI into green technologies and low-energy sectors by offering incentives for clean energy initiatives and enforcing strict regulations for high-pollution industries. Third, enhancing trade openness can aid in acquiring eco-friendly technologies and adopting international energy efficiency standards by revising trade policies to favor low-carbon imports and exports. Fourth, financial development should prioritize green investments and sustainable financial mechanisms, including green bonds and sustainability-linked loans, to channel funds into emission-reducing projects. Finally, economic growth must shift towards green sectors, encouraging investments in clean energy and low-carbon technologies, thereby uncoupling the economic progress from energy consumption and CO2 emissions.
This analysis elucidates the asymmetric impacts of fiscal policy, FDI inflows, and other variables on CO2 emissions in Vietnam. Nonetheless, certain limitations must be considered in subsequent research. Extending the nonlinear ARDL approach to a panel of countries should improve the generalizability of the findings and facilitate cross-country comparisons, yielding more robust conclusions relevant to various economic structures and policy contexts. Furthermore, integrating disaggregated data at regional or sectoral levels may reveal potential heterogeneities within Vietnam, providing more nuanced insights and facilitating customized policy recommendations. Moreover, incorporating other explanatory variables, such as technical advancements, investments in renewable energy, and environmental regulations could yield a more thorough understanding of the factors affecting environmental quality. Expanding research to include additional environmental indicators beyond CO2 emissions, such as air pollution, water quality, and deforestation, would provide a comprehensive evaluation of environmental impacts, thereby guiding policymakers on a wider array of issues. Addressing these constraints could provide policymakers with more nuanced knowledge, facilitating the creation of effective, context-specific solutions to combat climate change, and advance sustainable development across diverse regions and industries.
Funding
This research was funded by University of Economics Ho Chi Minh City, Vietnam with grant number XXX.
Institutional Review Board Statement
Not applicable.
Informed Consent Statement
Not applicable.
Conflicts of Interest
The authors declare no conflicts of interest.
References
- Intergovernmental Panel on Climate Change, Climate Change 2022: Impacts, Adaptation, and Vulnerability. In Intergovernmental Panel on Climate Change (IPCC): 2022.
- Hussain, M.; Wang, W.; Wang, Y. Natural resources, consumer prices and financial development in China: Measures to control carbon emissions and ecological footprints. Resources Policy 2022, 78, 102880. [Google Scholar] [CrossRef]
- Mishra, B.R.; Arjun; Tiwari, A.K. Exploring the asymmetric effect of fiscal decentralization on economic growth and environmental quality: Evidence from India. Environmental Science and Pollution Research 2023, 30, 80192–80209. [Google Scholar] [CrossRef] [PubMed]
- Luo, R.; Ullah, S.; Ali, K. Pathway towards sustainability in selected Asian countries: Influence of green investment, technology innovations, and economic growth on CO2 emission. Sustainability 2021, 13, 12873. [Google Scholar] [CrossRef]
- Chaturvedi, A.; Saluja, M.S.; Banerjee, A.; Arora, R. Environmental fiscal reforms. IIMB management review 2014, 26, 193–205. [Google Scholar] [CrossRef]
- López, R.; Galinato, G.I.; Islam, A. Fiscal spending and the environment: Theory and empirics. Journal of Environmental Economics and Management 2011, 62, 180–198. [Google Scholar] [CrossRef]
- Halkos, G.E.; Paizanos, E. A. The effects of fiscal policy on CO2 emissions: Evidence from the USA. Energy policy 2016, 88, 317–328. [Google Scholar] [CrossRef]
- Adewuyi, A.O. Effects of public and private expenditures on environmental pollution: A dynamic heterogeneous panel data analysis. Renewable and Sustainable Energy Reviews 2016, 65, 489–506. [Google Scholar] [CrossRef]
- Katircioglu, S.; Katircioglu, S. Testing the role of fiscal policy in the environmental degradation: The case of Turkey. Environmental Science and Pollution Research 2018, 25, 5616–5630. [Google Scholar] [CrossRef]
- Ullah, S.; Majeed, M.T.; Chishti, M.Z. Examining the asymmetric effects of fiscal policy instruments on environmental quality in Asian economies. Environmental Science and Pollution Research 2020, 27, 38287–38299. [Google Scholar] [CrossRef]
- Yuelan, P.; Akbar, M.W.; Hafeez, M.; Ahmad, M.; Zia, Z.; Ullah, S. The nexus of fiscal policy instruments and environmental degradation in China. Environmental Science and Pollution Research 2019, 26, 28919–28932. [Google Scholar] [CrossRef]
- Abbass, K.; Song, H.; Khan, F.; Begum, H.; Asif, M. Fresh insight through the VAR approach to investigate the effects of fiscal policy on environmental pollution in Pakistan. Environmental science and pollution research 2022, 1–14. [Google Scholar] [CrossRef] [PubMed]
- Ike, G.N.; Usman, O.; Sarkodie, S.A. Fiscal policy and CO2 emissions from heterogeneous fuel sources in Thailand: Evidence from multiple structural breaks cointegration test. Science of the Total Environment 2020, 702, 134711. [Google Scholar] [CrossRef] [PubMed]
- McAusland, C. Trade, politics, and the environment: Tailpipe vs. smokestack. Journal of Environmental Economics and Management 2008, 55, 52–71. [Google Scholar] [CrossRef]
- Lopez, R.E.; Palacios, A. Have government spending and energy tax policies contributed to make Europe environmentally cleaner? 2010.
- Mujtaba, A.; Jena, P.K. Analyzing asymmetric impact of economic growth, energy use, FDI inflows, and oil prices on CO2 emissions through NARDL approach. Environmental Science and Pollution Research 2021, 28, 30873–30886. [Google Scholar] [CrossRef]
- Ali, K.; Bakhsh, S.; Ullah, S.; Ullah, A.; Ullah, S. Industrial growth and CO2 emissions in Vietnam: The key role of financial development and fossil fuel consumption. Environmental Science and Pollution Research 2021, 28, 7515–7527. [Google Scholar] [CrossRef]
- Nam, P.X.; Thanh, T.T. Effects of bribery on firms' environmental innovation adoption in Vietnam: Mediating roles of firms' bargaining power and credit and institutional constraints. Ecological Economics 2021, 185, 107042. [Google Scholar] [CrossRef]
- Le, T.H. Connectedness between nonrenewable and renewable energy consumption, economic growth and CO2 emission in Vietnam: New evidence from a wavelet analysis. Renewable Energy 2022, 195, 442–454. [Google Scholar] [CrossRef]
- Nguyen, D.X.; Nguyen, T.D. The Relationship of Fiscal Policy and Economic Cycle: Is Vietnam Different? Journal of Risk and Financial Management 2023, 16, 281. [Google Scholar] [CrossRef]
- Joshi, P.; Beck, K. Democracy and carbon dioxide emissions: Assessing the interactions of political and economic freedom and the environmental Kuznets curve. Energy Research & Social Science 2018, 39, 46–54. [Google Scholar] [CrossRef]
- Halkos, G.E.; Paizanos, E. A. The effect of government expenditure on the environment: An empirical investigation. Ecological Economics 2013, 91, 48–56. [Google Scholar] [CrossRef]
- Gerlagh, R.; Van Den Bijgaart, I.; Nijland, H.; Michielsen, T. Fiscal policy and CO 2 emissions of new passenger cars in the EU. Environmental and resource economics 2018, 69, 103–134. [Google Scholar] [CrossRef]
- Mughal, N.; Kashif, M.; Arif, A.; Guerrero, J.W.G.; Nabua, W.C.; Niedbała, G. Dynamic effects of fiscal and monetary policy instruments on environmental pollution in ASEAN. Environmental Science and Pollution Research 2021, 28, 65116–65126. [Google Scholar] [CrossRef] [PubMed]
- Walter, I.; Ugelow, J.L. Environmental policies in developing countries. Ambio 1979, 102–109. [Google Scholar]
- Shahbaz, M.; Nasreen, S.; Abbas, F.; Anis, O. Does foreign direct investment impede environmental quality in high-, middle-, and low-income countries? Energy Economics 2015, 51, 275–287. [Google Scholar] [CrossRef]
- Yaşar, N.; Telatar, M. The relationship between foreign direct investment and CO2 emissions across a panel of countries. Energy Economy, Finance and Geostrategy 2018, 157–169. [Google Scholar] [CrossRef]
- Bakhsh, K.; Rose, S.; Ali, M.F.; Ahmad, N.; Shahbaz, M. Economic growth, CO2 emissions, renewable waste and FDI relation in Pakistan: New evidences from 3SLS. Journal of environmental management 2017, 196, 627–632. [Google Scholar] [CrossRef]
- Cai, X.; Che, X.; Zhu, B.; Zhao, J.; Xie, R. Will developing countries become pollution havens for developed countries? An empirical investigation in the Belt and Road. Journal of Cleaner Production 2018, 198, 624–632. [Google Scholar] [CrossRef]
- Dou, J.; Han, X. How does the industry mobility affect pollution industry transfer in China: Empirical test on Pollution Haven Hypothesis and Porter Hypothesis. Journal of cleaner production 2019, 217, 105–115. [Google Scholar] [CrossRef]
- Duan, Y.; Jiang, X. Pollution haven or pollution halo? A Re-evaluation on the role of multinational enterprises in global CO2 emissions. Energy Economics 2021, 97, 105181. [Google Scholar] [CrossRef]
- Singhania, M.; Saini, N. Demystifying pollution haven hypothesis: Role of FDI. Journal of Business Research 2021, 123, 516–528. [Google Scholar] [CrossRef]
- Birdsall, N.; Wheeler, D. Trade policy and industrial pollution in Latin America: Where are the pollution havens? The Journal of Environment & Development 1993, 2, 137–149. [Google Scholar]
- Antweiler, W.; Copeland, B.R.; Taylor, M.S. Is free trade good for the environment? American economic review 2001, 91, 877–908. [Google Scholar] [CrossRef]
- Aust, V.; Morais, A.I.; Pinto, I. How does foreign direct investment contribute to Sustainable Development Goals? Evidence from African countries. Journal of Cleaner Production 2020, 245, 118823. [Google Scholar] [CrossRef]
- Wang, X.; Luo, Y. Has technological innovation capability addressed environmental pollution from the dual perspective of FDI quantity and quality? Evidence from China. Journal of cleaner production 2020, 258, 120941. [Google Scholar] [CrossRef]
- Sarkodie, S.A. Failure to control economic sectoral inefficiencies through policy stringency disrupts environmental performance. Science of The Total Environment 2021, 772, 145603. [Google Scholar] [CrossRef]
- Dong, Y.; Shao, S.; Zhang, Y. Does FDI have energy-saving spillover effect in China? A perspective of energy-biased technical change. Journal of Cleaner Production 2019, 234, 436–450. [Google Scholar] [CrossRef]
- Xin-gang, Z.; Yuan-feng, Z.; Yan-bin, L. The spillovers of foreign direct investment and the convergence of energy intensity. Journal of cleaner production 2019, 206, 611–621. [Google Scholar] [CrossRef]
- Tariq, G.; Sun, H.; Ali, I.; Pasha, A.A.; Khan, M.S.; Rahman, M.M.; Mohamed, A.; Shah, Q. Influence of green technology, green energy consumption, energy efficiency, trade, economic development and FDI on climate change in South Asia. Scientific Reports 2022, 12, 16376. [Google Scholar] [CrossRef]
- Abdouli, M.; Hammami, S. Economic growth, FDI inflows and their impact on the environment: An empirical study for the MENA countries. Quality & Quantity 2017, 51, 121–146. [Google Scholar] [CrossRef]
- Seker, F.; Ertugrul, H.M.; Cetin, M. The impact of foreign direct investment on environmental quality: A bounds testing and causality analysis for Turkey. Renewable and Sustainable Energy Reviews 2015, 52, 347–356. [Google Scholar] [CrossRef]
- Ben-David, I.; Jang, Y.; Kleimeier, S.; Viehs, M. Exporting pollution: Where do multinational firms emit CO2? Economic Policy 2021, 36, 377–437. [Google Scholar] [CrossRef]
- Zhuang, Y.; Yang, S.; Razzaq, A.; Khan, Z. Environmental impact of infrastructure-led Chinese outward FDI, tourism development and technology innovation: A regional country analysis. Journal of Environmental Planning and Management 2022, 66, 367–399. [Google Scholar] [CrossRef]
- Saini, N.; Sighania, M. Environmental impact of economic growth, emission and FDI: Systematic review of reviews. Qualitative Research in Financial Markets 2019, 11, 81–134. [Google Scholar] [CrossRef]
- Saqib, N.; Dincă, G. Exploring the asymmetric impact of economic complexity, FDI, and green technology on carbon emissions: Policy stringency for clean-energy investing countries. Geoscience Frontiers 2024, 15, 101671. [Google Scholar] [CrossRef]
- Qamruzzaman, M. Do environmental and institutional quality attribute to inflows of FDI in Lower-Middle income Nations? Evidences from asymmetric investigation. GSC Advanced Research and Reviews 2023, 15, 079–104. [Google Scholar] [CrossRef]
- Korutaro Nkundabanyanga, S.; Kasozi, D.; Nalukenge, I.; Tauringana, V. Lending terms, financial literacy and formal credit accessibility. International Journal of Social Economics 2014, 41, 342–361. [Google Scholar] [CrossRef]
- Islam, F.; Shahbaz, M.; Ahmed, A.U.; Alam, M.M. Financial development and energy consumption nexus in Malaysia: A multivariate time series analysis. Economic modelling 2013, 30, 435–441. [Google Scholar] [CrossRef]
- Al-Mulali, U.; Ozturk, I.; Lean, H.H. The influence of economic growth, urbanization, trade openness, financial development, and renewable energy on pollution in Europe. Natural Hazards 2015, 79, 621–644. [Google Scholar] [CrossRef]
- Salahuddin, M.; Alam, K.; Ozturk, I.; Sohag, K. The effects of electricity consumption, economic growth, financial development and foreign direct investment on CO2 emissions in Kuwait. Renewable and sustainable energy reviews 2018, 81, 2002–2010. [Google Scholar] [CrossRef]
- Sadorsky, P. Financial development and energy consumption in Central and Eastern European frontier economies. Energy policy 2011, 39, 999–1006. [Google Scholar] [CrossRef]
- Nasir, M.A.; Huynh, T.L.D.; Tram, H.T.X. Role of financial development, economic growth & foreign direct investment in driving climate change: A case of emerging ASEAN. Journal of environmental management 2019, 242, 131–141. [Google Scholar] [CrossRef] [PubMed]
- Cetin, M.; Ecevit, E.; Yucel, A.G. The impact of economic growth, energy consumption, trade openness, and financial development on carbon emissions: Empirical evidence from Turkey. Environmental science and pollution research 2018, 25, 36589–36603. [Google Scholar] [CrossRef] [PubMed]
- Frankel, J.A.; Romer, D. Does trade cause growth? In Global trade, Routledge: 2017; pp 255-276.
- Pata, U.K. Renewable energy consumption, urbanization, financial development, income and CO2 emissions in Turkey: Testing EKC hypothesis with structural breaks. Journal of cleaner production 2018, 187, 770–779. [Google Scholar] [CrossRef]
- Le, T.-H.; Chang, Y.; Park, D. Trade openness and environmental quality: International evidence. Energy policy 2016, 92, 45–55. [Google Scholar] [CrossRef]
- Li, R.; Wang, Q.; Liu, Y.; Jiang, R. Per-capita carbon emissions in 147 countries: The effect of economic, energy, social, and trade structural changes. Sustainable Production and Consumption 2021, 27, 1149–1164. [Google Scholar] [CrossRef]
- Tariq, M.; Xu, Y.; Ullah, K.; Dong, B. Toward low-carbon emissions and green growth for sustainable development in emerging economies: Do green trade openness, eco-innovation, and carbon price matter? Sustainable Development 2024, 32, 959–978. [Google Scholar] [CrossRef]
- Haisheng, Y.; Jia, J.; Yongzhang, Z.; Shugong, W. The impact on environmental Kuznets curve by trade and foreign direct investment in China. Chinese Journal of Population Resources and Environment 2005, 3, 14–19. [Google Scholar] [CrossRef]
- Wang, Q.; Sun, J.; Pata, U.K.; Li, R.; Kartal, M.T. Digital economy and carbon dioxide emissions: Examining the role of threshold variables. Geoscience Frontiers 2024, 15, 101644. [Google Scholar] [CrossRef]
- Wang, Q.; Ren, F.; Li, R. Exploring the impact of geopolitics on the environmental Kuznets curve research. Sustainable Development 2024, 32, 1700–1722. [Google Scholar] [CrossRef]
- Lopez, R. The environment as a factor of production: The effects of economic growth and trade liberalization 1. In International trade and the environment, Routledge: 2017; pp 239-260.
- Wang, Q.; Zhang, F.; Li, R. Free trade and carbon emissions revisited: The asymmetric impacts of trade diversification and trade openness. Sustainable Development 2024, 32, 876–901. [Google Scholar] [CrossRef]
- Odugbesan, J.A.; Rjoub, H. Relationship among economic growth, energy consumption, CO2 emission, and urbanization: Evidence from MINT countries. Sage Open 2020, 10, 2158244020914648. [Google Scholar] [CrossRef]
- Teng, J.-Z.; Khan, M.K.; Khan, M.I.; Chishti, M.Z.; Khan, M.O. Effect of foreign direct investment on CO 2 emission with the role of globalization, institutional quality with pooled mean group panel ARDL. Environmental Science and Pollution Research 2021, 28, 5271–5282. [Google Scholar] [CrossRef] [PubMed]
- Adebayo, T.S.; Beton Kalmaz, D. Determinants of CO2 emissions: Empirical evidence from Egypt. Environmental and Ecological Statistics 2021, 28, 239–262. [Google Scholar] [CrossRef]
- Shahbaz, M.; Tiwari, A.K.; Nasir, M. The effects of financial development, economic growth, coal consumption and trade openness on CO2 emissions in South Africa. Energy policy 2013, 61, 1452–1459. [Google Scholar] [CrossRef]
- Kirikkaleli, D.; Kalmaz, D.B. Testing the moderating role of urbanization on the environmental Kuznets curve: Empirical evidence from an emerging market. Environmental Science and Pollution Research 2020, 27, 38169–38180. [Google Scholar] [CrossRef]
- Liu, X.; Bae, J. Urbanization and industrialization impact of CO2 emissions in China. Journal of cleaner production 2018, 172, 178–186. [Google Scholar] [CrossRef]
- Raheem, I.D.; Ogebe, J.O. CO2 emissions, urbanization and industrialization: Evidence from a direct and indirect heterogeneous panel analysis. Management of Environmental Quality: An International Journal 2017, 28, 851–867. [Google Scholar] [CrossRef]
- Zmami, M.; Ben-Salha, O. An empirical analysis of the determinants of CO2 emissions in GCC countries. International Journal of Sustainable Development & World Ecology 2020, 27, 469–480. [Google Scholar] [CrossRef]
- Arjun; Mishra, B.R.; Tiwari, A.K. Exploring the asymmetric effect of fiscal policy instruments in encountering environmental degradation: Proposing an SDG framework for India. Environmental Science and Pollution Research 2024, 31, 25907–25928. [Google Scholar] [CrossRef]
- Nathaniel, S.; Anyanwu, O.; Shah, M. Renewable energy, urbanization, and ecological footprint in the Middle East and North Africa region. Environmental science and pollution research 2020, 27, 14601–14613. [Google Scholar] [CrossRef]
- Dickey, D.A.; Fuller, W.A. Distribution of the estimators for autoregressive time series with a unit root. Journal of the American statistical association 1979, 74, 427–431. [Google Scholar] [CrossRef]
- Perron, P.; Phillips, P.C. Does GNP have a unit root?: A re-evaluation. Economics Letters 1987, 23, 139–145. [Google Scholar] [CrossRef]
- Broock, W.A.; Scheinkman, J.A.; Dechert, W.D.; LeBaron, B. A test for independence based on the correlation dimension. Econometric reviews 1996, 15, 197–235. [Google Scholar] [CrossRef]
- Pesaran, M.H.; Shin, Y.; Smith, R.J. Bounds testing approaches to the analysis of level relationships. Journal of applied econometrics 2001, 16, 289–326. [Google Scholar] [CrossRef]
- Worrell, E.; Van Berkel, R.; Fengqi, Z.; Menke, C.; Schaeffer, R.; Williams, R.O. Technology transfer of energy efficient technologies in industry: A review of trends and policy issues. Energy policy 2001, 29, 29–43. [Google Scholar] [CrossRef]
- Nath, S.D.; Eweje, G.; Bathurst, R. The invisible side of managing sustainability in global supply chains: Evidence from multitier apparel suppliers. Journal of Business Logistics 2021, 42, 207–232. [Google Scholar] [CrossRef]
- Mai Tan Việt Nam đang ở vị thế tốt hút "làn sóng" mới đầu tư vào ngành công nghiệp giá trị cao. https://thoibaotaichinhvietnam.vn/viet-nam-dang-o-vi-the-tot-hut-lan-song-moi-dau-tu-vao-nganh-cong-nghiep-gia-tri-cao-163642.html#:~:text=Trong%209%20th%C3%A1ng%20n%C4%83m%202024,ngh%E1%BB%87%20cao%2C%20gi%C3%A1%20tr%E1%BB%8B%20cao. (11 December).
- Do, T.N.; Burke, P.J.; Nguyen, H.N.; Overland, I.; Suryadi, B.; Swandaru, A.; Yurnaidi, Z. Vietnam's solar and wind power success: Policy implications for the other ASEAN countries. Energy for Sustainable Development 2021, 65, 1–11. [Google Scholar] [CrossRef]
- Nong, D.; Wang, C.; Al-Amin, A.Q. A critical review of energy resources, policies and scientific studies towards a cleaner and more sustainable economy in Vietnam. Renewable and Sustainable Energy Reviews 2020, 134, 110117. [Google Scholar] [CrossRef]
- Odugbesan, J.A.; Adebayo, T.S. The symmetrical and asymmetrical effects of foreign direct investment and financial development on carbon emission: Evidence from Nigeria. SN Applied Sciences 2020, 2, 1982. [Google Scholar] [CrossRef]
- Nhuong, B.H.; Hang, L.T.T.; Thuy, D.T.T.; Quang, P.T.; Anh, K.T. Investigating the Nexus Between Foreign Direct Investment and Sustainable Energy Transition: The Case of Vietnam. Journal of Environmental Assessment Policy and Management 2024, 26, 2350023. [Google Scholar] [CrossRef]
- Minh, T.B.; Ngoc, T.N.; Van, H.B. Relationship between carbon emissions, economic growth, renewable energy consumption, foreign direct investment, and urban population in Vietnam. Heliyon 2023, 9. [Google Scholar]
- Thuy Dung Samsung Viet Nam works to contribute to Viet Nam's net-zero emissions target. https://en.baochinhphu.vn/samsung-viet-nam-works-to-contribute-to-viet-nams-net-zero-emissions-target-111240813095855541.htm (26 December).
- VNA Bac Lieu plans to become renewable energy export hub. https://en.vietnamplus.vn/bac-lieu-plans-to-become-renewable-energy-export-hub-post296771.vnp (26 December).
- World Bank, Vietnam Public Expenditure Review: Fiscal Policies towards Sustainability, Efficiency, and Equity. In Vietnam, G. o. Ed. World Bank: 2017.
- Hoa, P.X.; Xuan, V.N.; Thu, N.T.P. Nexus of innovation, foreign direct investment, economic growth and renewable energy: New insights from 60 countries. Energy Reports 2024, 11, 1834–1845. [Google Scholar] [CrossRef]
- Fahy, K.; Alexiou, A.; Daras, K.; Mason, K.; Bennett, D.; Taylor-Robinson, D.; Barr, B. Mental health impact of cuts to local government spending on cultural, environmental and planning services in England: A longitudinal ecological study. BMC Public Health 2023, 23, 1441. [Google Scholar] [CrossRef] [PubMed]
- Ahmad, M.; Satrovic, E. How do fiscal policy, technological innovation, and economic openness expedite environmental sustainability? Gondwana Research 2023, 124, 143–164. [Google Scholar] [CrossRef]
- Pata, U.K. Renewable and non-renewable energy consumption, economic complexity, CO 2 emissions, and ecological footprint in the USA: Testing the EKC hypothesis with a structural break. Environmental science and pollution research 2021, 28, 846–861. [Google Scholar] [CrossRef]
- Fei, L.; Dong, S.; Xue, L.; Liang, Q.; Yang, W. Energy consumption-economic growth relationship and carbon dioxide emissions in China. Energy policy 2011, 39, 568–574. [Google Scholar] [CrossRef]
- Sadorsky, P. The effect of urbanization on CO2 emissions in emerging economies. Energy economics 2014, 41, 147–153. [Google Scholar] [CrossRef]
- Brown, R.L.; Durbin, J.; Evans, J.M. Techniques for testing the constancy of regression relationships over time. Journal of the Royal Statistical Society Series B: Statistical Methodology 1975, 37, 149–163. [Google Scholar] [CrossRef]
Figure 1.
Plots Cumulative sum and cumulative sum of squares.
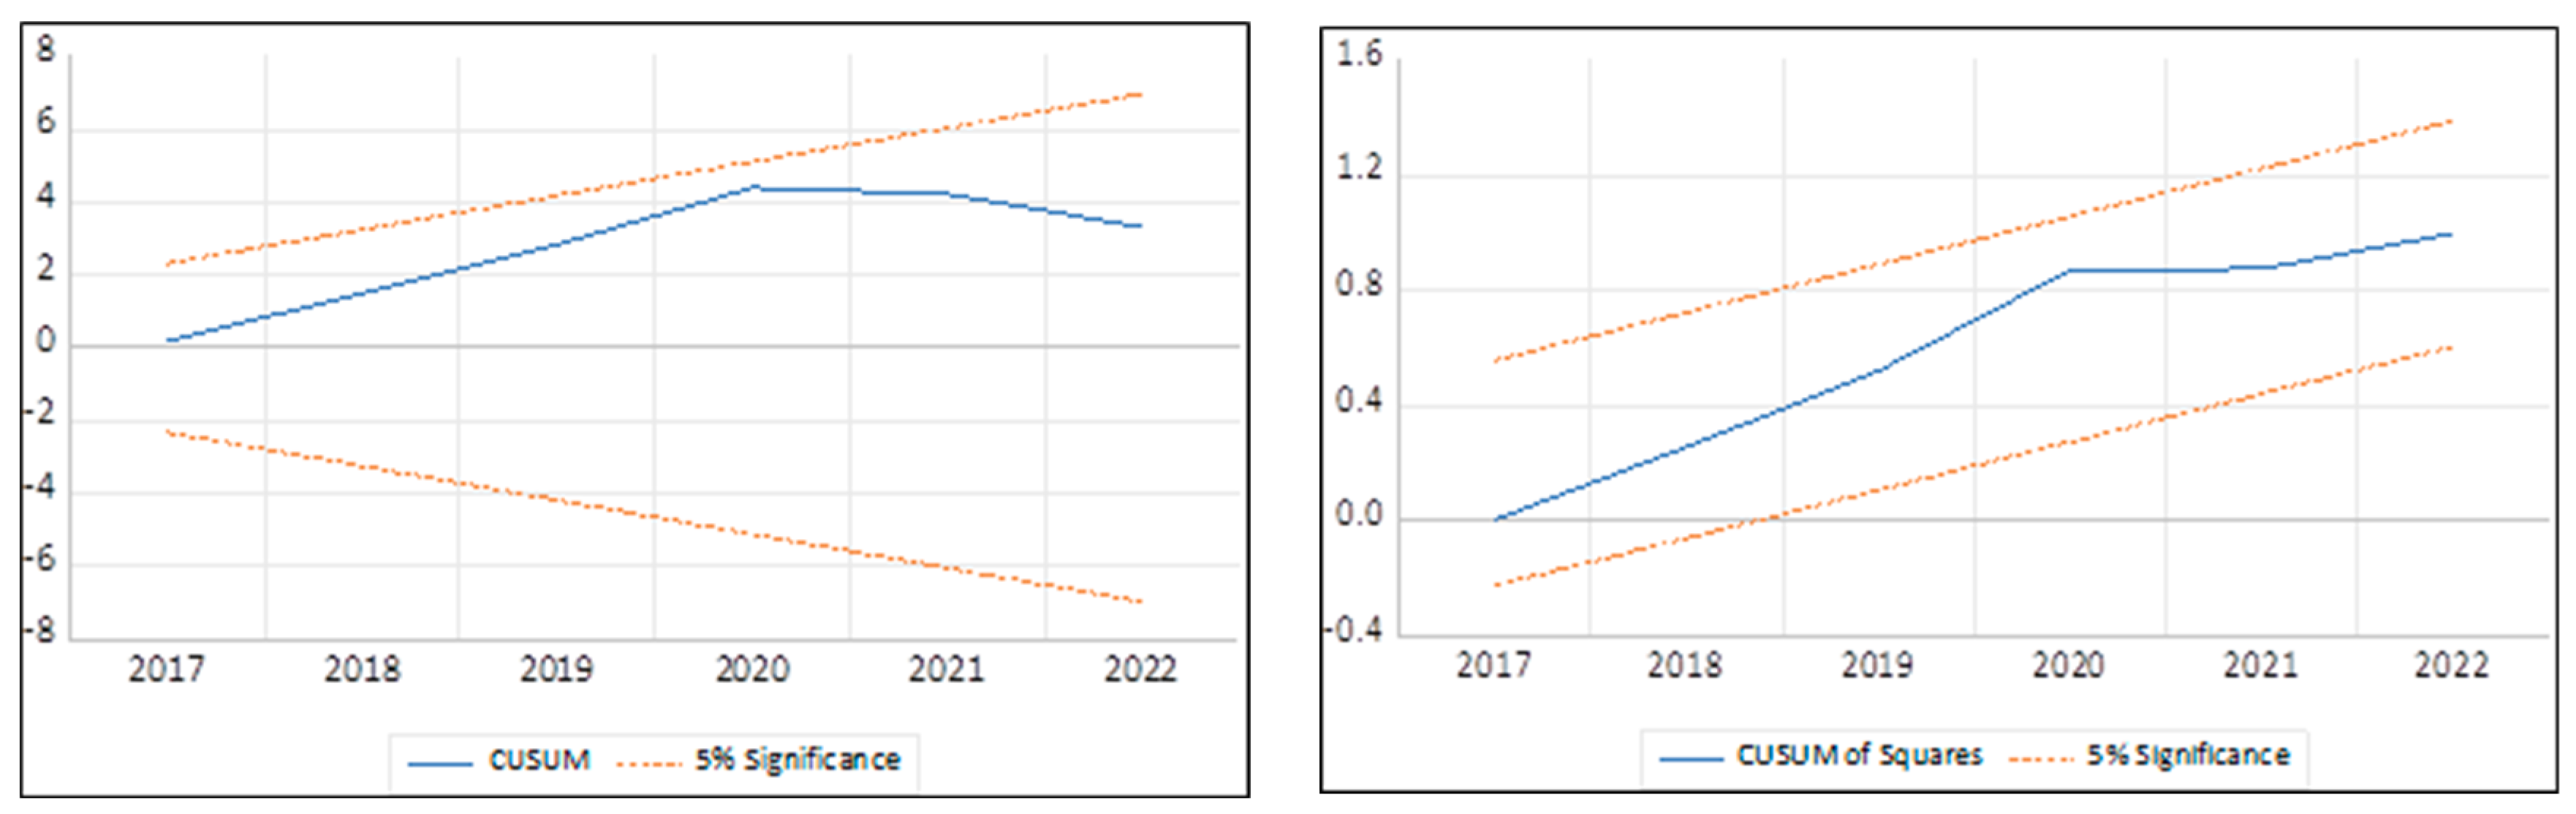
Figure 2.
Dynamic multiplier graphs of GOEX and FDI.
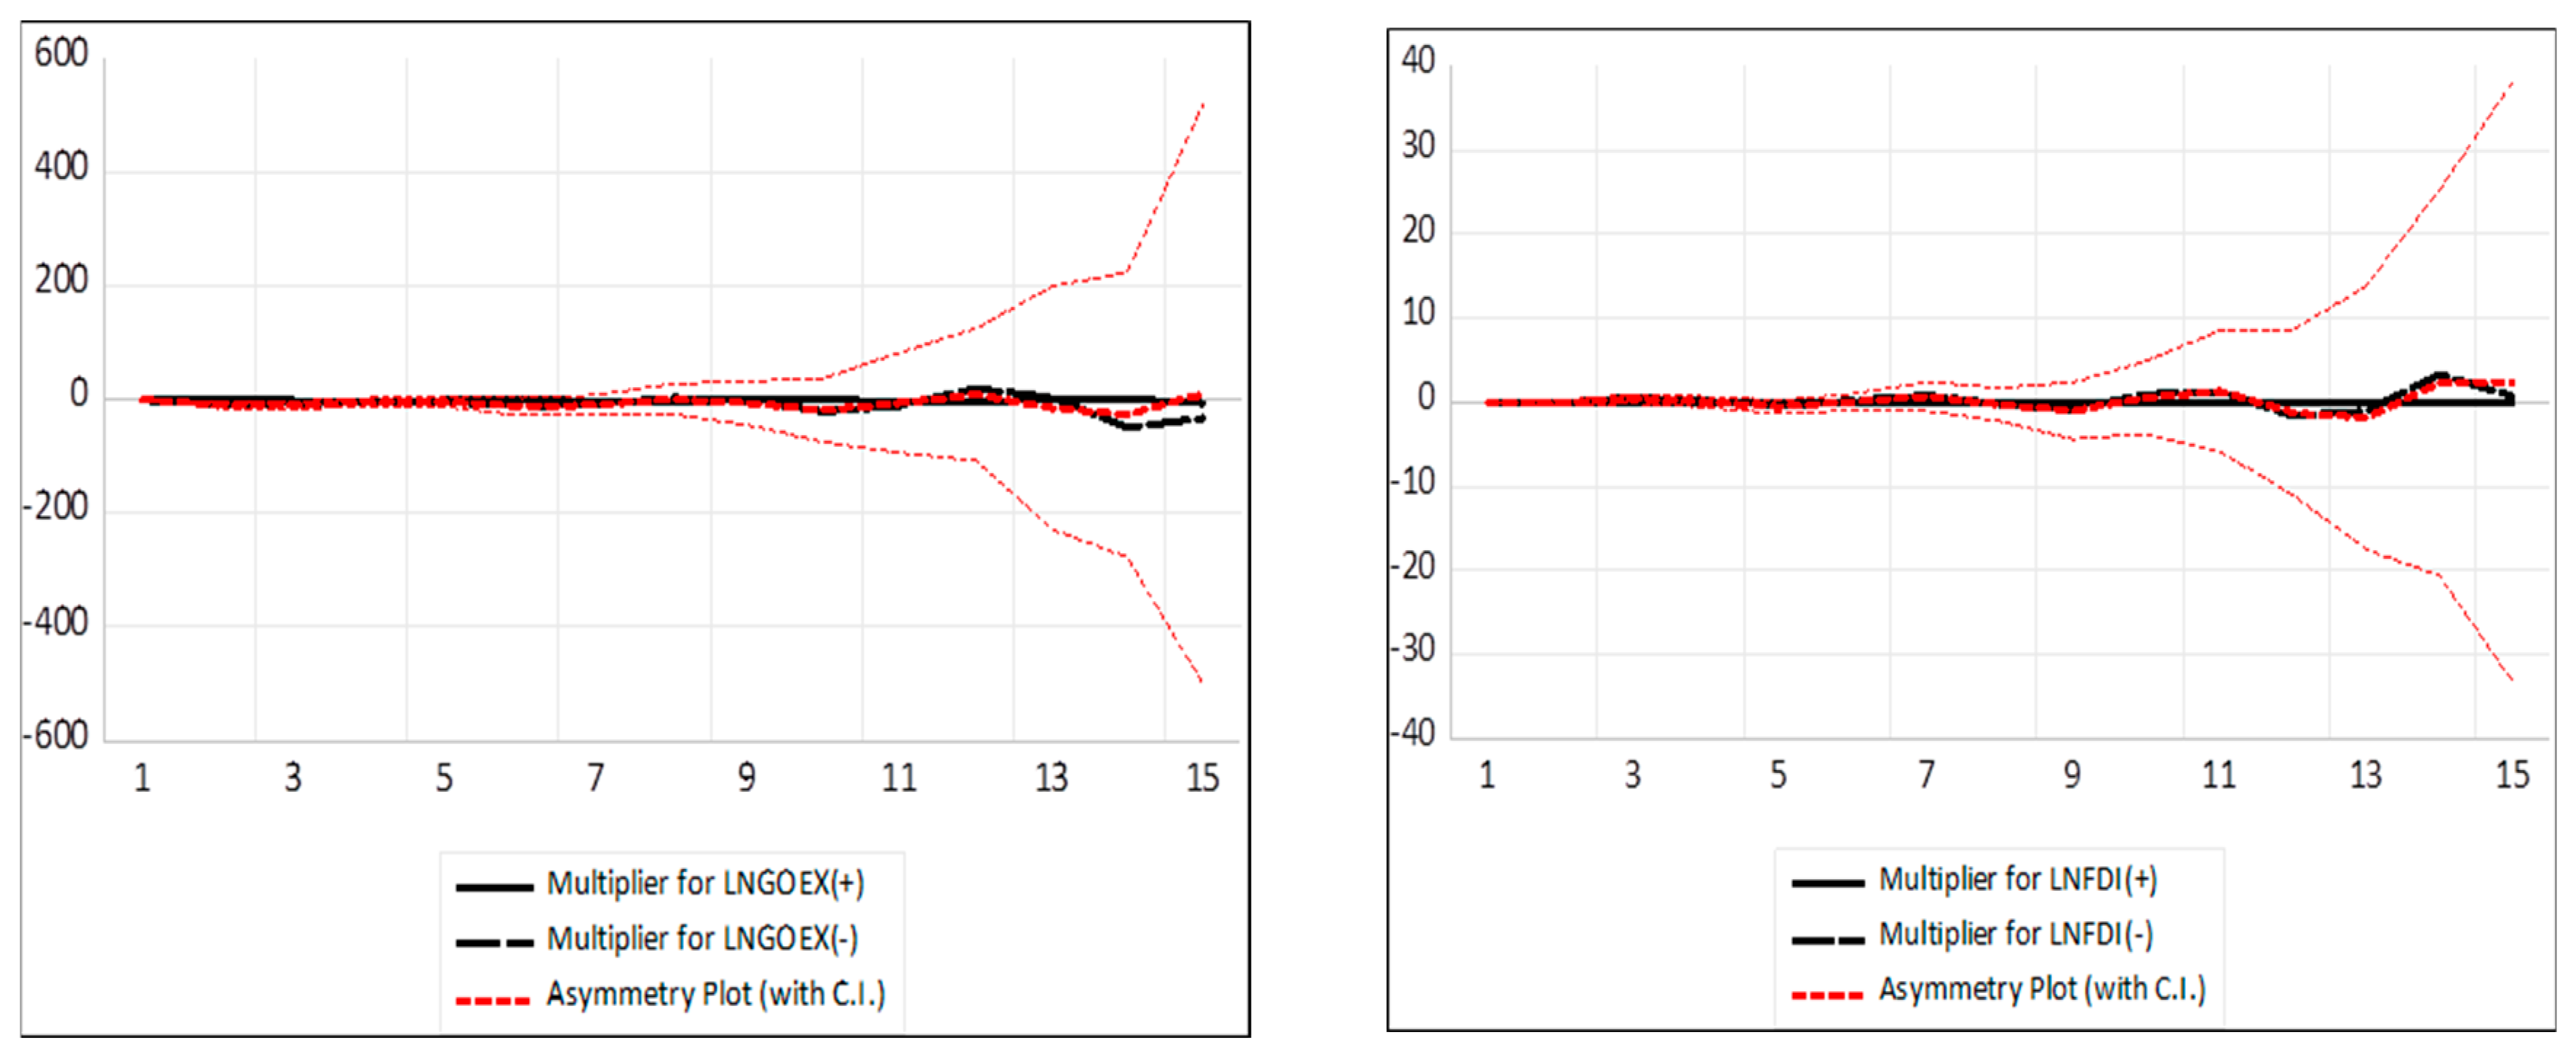

Table 1.
Variable description.
| Symbol | Variables | Definition | Sources |
|---|---|---|---|
| CO2 | Per capita carbon dioxide | Kt of CO2 emissions | WDI |
| TRADE | Trade openess | The sum of import and export (% of GDP) | WDI |
| CREDIT | Financial development | The volume of domestic credit to private sector (% of GDP) | WDI |
| FDI | Foreign direct investment inflow | Foreign direct investment inflows (% of GDP) | WDI |
| GOEX | Fiscal policy | Government expenditure (% of GDP) | WDI |
| GDPPC | Economic development | GDP per capita (constant $US 2010) | WDI |
Table 2.
Desciptive statistics.
| Variables | Mean | Median | Maximum | Minimum | Std. Dev. | Skewness | Kurtosis | Jarque-Bera | Prob. |
|---|---|---|---|---|---|---|---|---|---|
| CO2E | 11.427 | 11.460 | 13.027 | 9.869 | 0.943 | -0.074 | 1.912 | 1.657 | 0.437 |
| TRADE | 4.778 | 4.830 | 5.229 | 4.193 | 0.293 | -0.515 | 2.290 | 2.151 | 0.341 |
| CREDIT | 3.900 | 4.180 | 4.836 | 2.500 | 0.774 | -0.527 | 1.759 | 3.646 | 0.162 |
| FDI | 1.631 | 1.569 | 2.480 | 1.023 | 0.352 | 0.792 | 2.768 | 3.520 | 0.172 |
| GOEX | 23.376 | 23.323 | 24.245 | 22.561 | 0.561 | 0.125 | 1.539 | 3.020 | 0.221 |
| GDPPC | 7.390 | 7.417 | 8.205 | 6.512 | 0.514 | -0.089 | 1.824 | 1.945 | 0.378 |
Table 3.
Unit root test.
| Variables | ADF (p-value) | PP (p-value) | ||||||
|---|---|---|---|---|---|---|---|---|
| Intercept | Intercept & trend | Intercept | Intercept & trend | |||||
| Level | ||||||||
| CO2E | 0.078 | 0.959 | -2.114 | 0.519 | 0.110 | 0.962 | -2.228 | 0.459 |
| TRADE | -0.683 | 0.837 | -2.270 | 0.437 | -0.497 | 0.879 | -2.231 | 0.457 |
| CREDIT | -1.706 | 0.419 | -0.961 | 0.936 | -1.706 | 0.419 | -1.023 | 0.926 |
| FDI | -3.057** | 0.041 | -3.342* | 0.078 | -2.807* | 0.069 | -2.969 | 0.156 |
| GOEX | 0.324 | 0.976 | -3.763** | 0.036 | 0.194 | 0.968 | -1.814 | 0.674 |
| GDPPC | -1.330 | 0.602 | -3.758** | 0.034 | -2.257 | 0.192 | -1.280 | 0.875 |
| First differences | ||||||||
| CO2E | -5.501*** | 0.000 | -5.395*** | 0.001 | -5.542*** | 0.000 | -5.429*** | 0.001 |
| TRADE | -7.665*** | 0.000 | -7.522*** | 0.000 | -7.510*** | 0.000 | -7.523*** | 0.000 |
| CREDIT | -4.800*** | 0.001 | -5.036*** | 0.002 | -4.794*** | 0.001 | -5.036*** | 0.002 |
| FDI | -4.204*** | 0.003 | -4.129** | 0.014 | -4.099*** | 0.003 | -4.007** | 0.019 |
| GOEX | -4.424*** | 0.001 | -4.364*** | 0.008 | -4.507*** | 0.001 | -4.456*** | 0.007 |
| GDPPC | -4.887*** | 0.000 | -5.026*** | 0.002 | -3.671** | 0.010 | -4.181** | 0.013 |
Note: *, **, and *** indicate significance at the 1 %, 5 %, and 10% levels, respectively.
Table 4.
BDS test for nonlinearity results.
| Series | Dimension 2 | Dimension 3 | Dimension 4 | Dimension 5 | Dimension 6 |
|---|---|---|---|---|---|
| CO2E | 0.195*** | 0.327*** | 0.423*** | 0.488*** | 0.540*** |
| TRADE | 0.161*** | 0.285*** | 0.384*** | 0.456*** | 0.505*** |
| CREDIT | 0.202*** | 0.339*** | 0.433*** | 0.495*** | 0.535*** |
| FDI | 0.103*** | 0.160*** | 0.181*** | 0.200*** | 0.206*** |
| GOEX | 0.191*** | 0.317*** | 0.399*** | 0.454*** | 0.491*** |
| GDPPC | 0.199*** | 0.336*** | 0.431*** | 0.499*** | 0.549*** |
Note: * indicates significance at the 1% level.
Table 5.
NARDL bound test.
| F-Bounds Test | Null Hypothesis: No levels relationship | |||
|---|---|---|---|---|
| Test Statistic | Value | Signif. | I(0) | I(1) |
| F-statistic | 3.90** | 10% | 2.03 | 3.13 |
| k | 7 | 5% | 2.32 | 3.50 |
| 2.50% | 2.60 | 3.84 | ||
| 1% | 2.96 | 4.26 | ||
Note: ** indicates significance at the 5% level.
Table 6.
NARDL coefficient estimates.
| Long run estimation | ||||
|---|---|---|---|---|
| Variable | Coefficient | Std. Error | t-Statistic | Prob. |
| FDI+ | -0.124*** | 0.029 | -4.294 | 0.005 |
| FDI- | -0.125 | 0.088 | -1.418 | 0.206 |
| GOEX+ | -1.275** | 0.354 | -3.604 | 0.011 |
| GOEX- | 5.627** | 2.022 | 2.783 | 0.032 |
| TRADE | -0.487** | 0.162 | -3.009 | 0.024 |
| CREDIT | 0.357** | 0.112 | 3.188 | 0.019 |
| GDPPC | 3.197*** | 0.362 | 8.823 | 0.000 |
| Short-run estimation | ||||
| Variable | Coefficient | Std. Error | t-Statistic | Prob. |
| Δ(FDI+) | -0.128** | 0.041 | -3.158 | 0.020 |
| Δ (FDI-) | 0.018 | 0.070 | 0.259 | 0.804 |
| Δ (GOEX+) | -0.719** | 0.273 | -2.632 | 0.039 |
| Δ (GOEX-) | 7.678*** | 1.164 | 6.597 | 0.001 |
| Δ (TRADE) | -0.608*** | 0.113 | -5.358 | 0.002 |
| Δ (CREDIT) | 0.491*** | 0.106 | 4.648 | 0.004 |
| Δ (GDPPC) | 1.209* | 0.494 | 2.446 | 0.050 |
| C | -23.875*** | 3.378 | -7.068 | 0.000 |
| ECM(-1) | -2.456*** | 0.347 | -7.088 | 0.000 |
| R-squared | 0.882 | Adjusted R-squared | 0.736 | |
| F-statistic | 6.054 | Prob(F-statistic) | 0.001 |
Note: *,**, and *** indicate significance at the 1 %, 5 %, and 10% levels, respectively.
Table 7.
Results of diagnostic tests.
| Diagnostic tests | F-statistic | P-value |
|---|---|---|
| Model misspecification: RESET test | 0.376 | 0.566 |
| Serial Correlation: Breusch-Godfrey LM test | 3.340 | 0.140 |
| Heteroskedasticity Test: Breusch-Pagan-Godfrey | 0.486 | 0.902 |
| Heteroskedasticity Test: ARCH | 0.779 | 0.385 |
| Normality test: Jarque-Bera test | 2.147 | 0.342 |
| Long-run asymmetries based on Wald test | F-statistics | Prob. |
| FDI | 0.552 | 0.486 |
| GOEX | 5.053* | 0.066 |
| Short-run asymmetries based on Wald test | F-statistics | Prob. |
| FDI | 0.663 | 0.425 |
| GOEX | 1.327 | 0.262 |
Note: * indicates a 10% significance level.
Disclaimer/Publisher’s Note: The statements, opinions and data contained in all publications are solely those of the individual author(s) and contributor(s) and not of MDPI and/or the editor(s). MDPI and/or the editor(s) disclaim responsibility for any injury to people or property resulting from any ideas, methods, instructions or products referred to in the content. |
© 2025 by the authors. Licensee MDPI, Basel, Switzerland. This article is an open access article distributed under the terms and conditions of the Creative Commons Attribution (CC BY) license (http://creativecommons.org/licenses/by/4.0/).
Copyright: This open access article is published under a Creative Commons CC BY 4.0 license, which permit the free download, distribution, and reuse, provided that the author and preprint are cited in any reuse.


