1. Introduction
Despite advances in genetic engineering and cloning, the properties of wood are still influenced by various factors (climate, soil, altitude, etc.) related to the development of trees. These influences result in significant variability in the wood produced in the forest, making it difficult to establish important reference values for the production line of forest companies linked to pulp and paper, wood-based products (fiberboards and particleboards), as well as roundwood or processed wood used in solid or engineered forms (glued laminated timber or cross-laminated timber) in construction.
The prediction of tree properties in the forest has been a recurring topic in both national and international publications, with non-destructive techniques being a viable alternative to this challenge. By not affecting the material, these techniques allow tests to be repeated during the tree's growth. They can be performed directly on standing trees [
1,
2], and since no sampling or tree cutting is required, they are more economical, simpler, and faster, enabling increased sampling. Thus, several research groups have been developing studies using various nondestructive techniques aimed at inferring properties such as wood density (basic or apparent) and stiffness [
3,
4,
5,
6,
7,
8,
9,
10,
11,
12]. These nondestructive methods include those that use wave propagation (ultrasound and stress waves), resistance to drilling, resistance to penetration, mass spectrometry, among others. Regardless of the type of equipment or technique used, the focus of the research is to correlate the measured parameters in trees with wood properties, with statistical modeling being the tool typically used to obtain the relationship between variables to predict results. Classical statistical tools are no longer the most suitable when the volume of data is very large, and machine learning algorithms are currently recommended for such cases.
The adoption of non-destructive techniques as a tool for evaluating the quality of wood produced in forests stems from the possibility of obtaining correlations between the responses of these methods and the physical and mechanical properties of the fibers, which are used for the selection and classification of forest products. Thus, the adoption of such techniques in the wood production chain represents a fast and effective means of assessing wood quality, with the potential to enhance inference models already employed by companies in the forestry sector [
13,
14,
15].
The literature review indicated that in Brazil, studies related to machine learning are more strongly focused on estimating tree volume [
16,
17,
18,
19,
20]. In other countries, [
21] and [
22] researches were the closest to our objective, as the authors studied different machine learning algorithms in inferring density, with superior results to those obtained using classical multiple regression. In field trials, [
21] and [
22] used dendrometric measurements of trees (height and diameter at breast height (DBH), NDT techniques (stress wave propagation and resistance to drilling (only [
21]), and extracted cores with an increment borer for density measurement using X-ray densitometry.
The main objective of this research was to evaluate whether machine learning algorithms, utilizing data collected from standing trees (forest inventory and non-destructive inspections), can provide accurate predictions of wood basic density compared to conventional statistics methods.
2. Materials and Methods
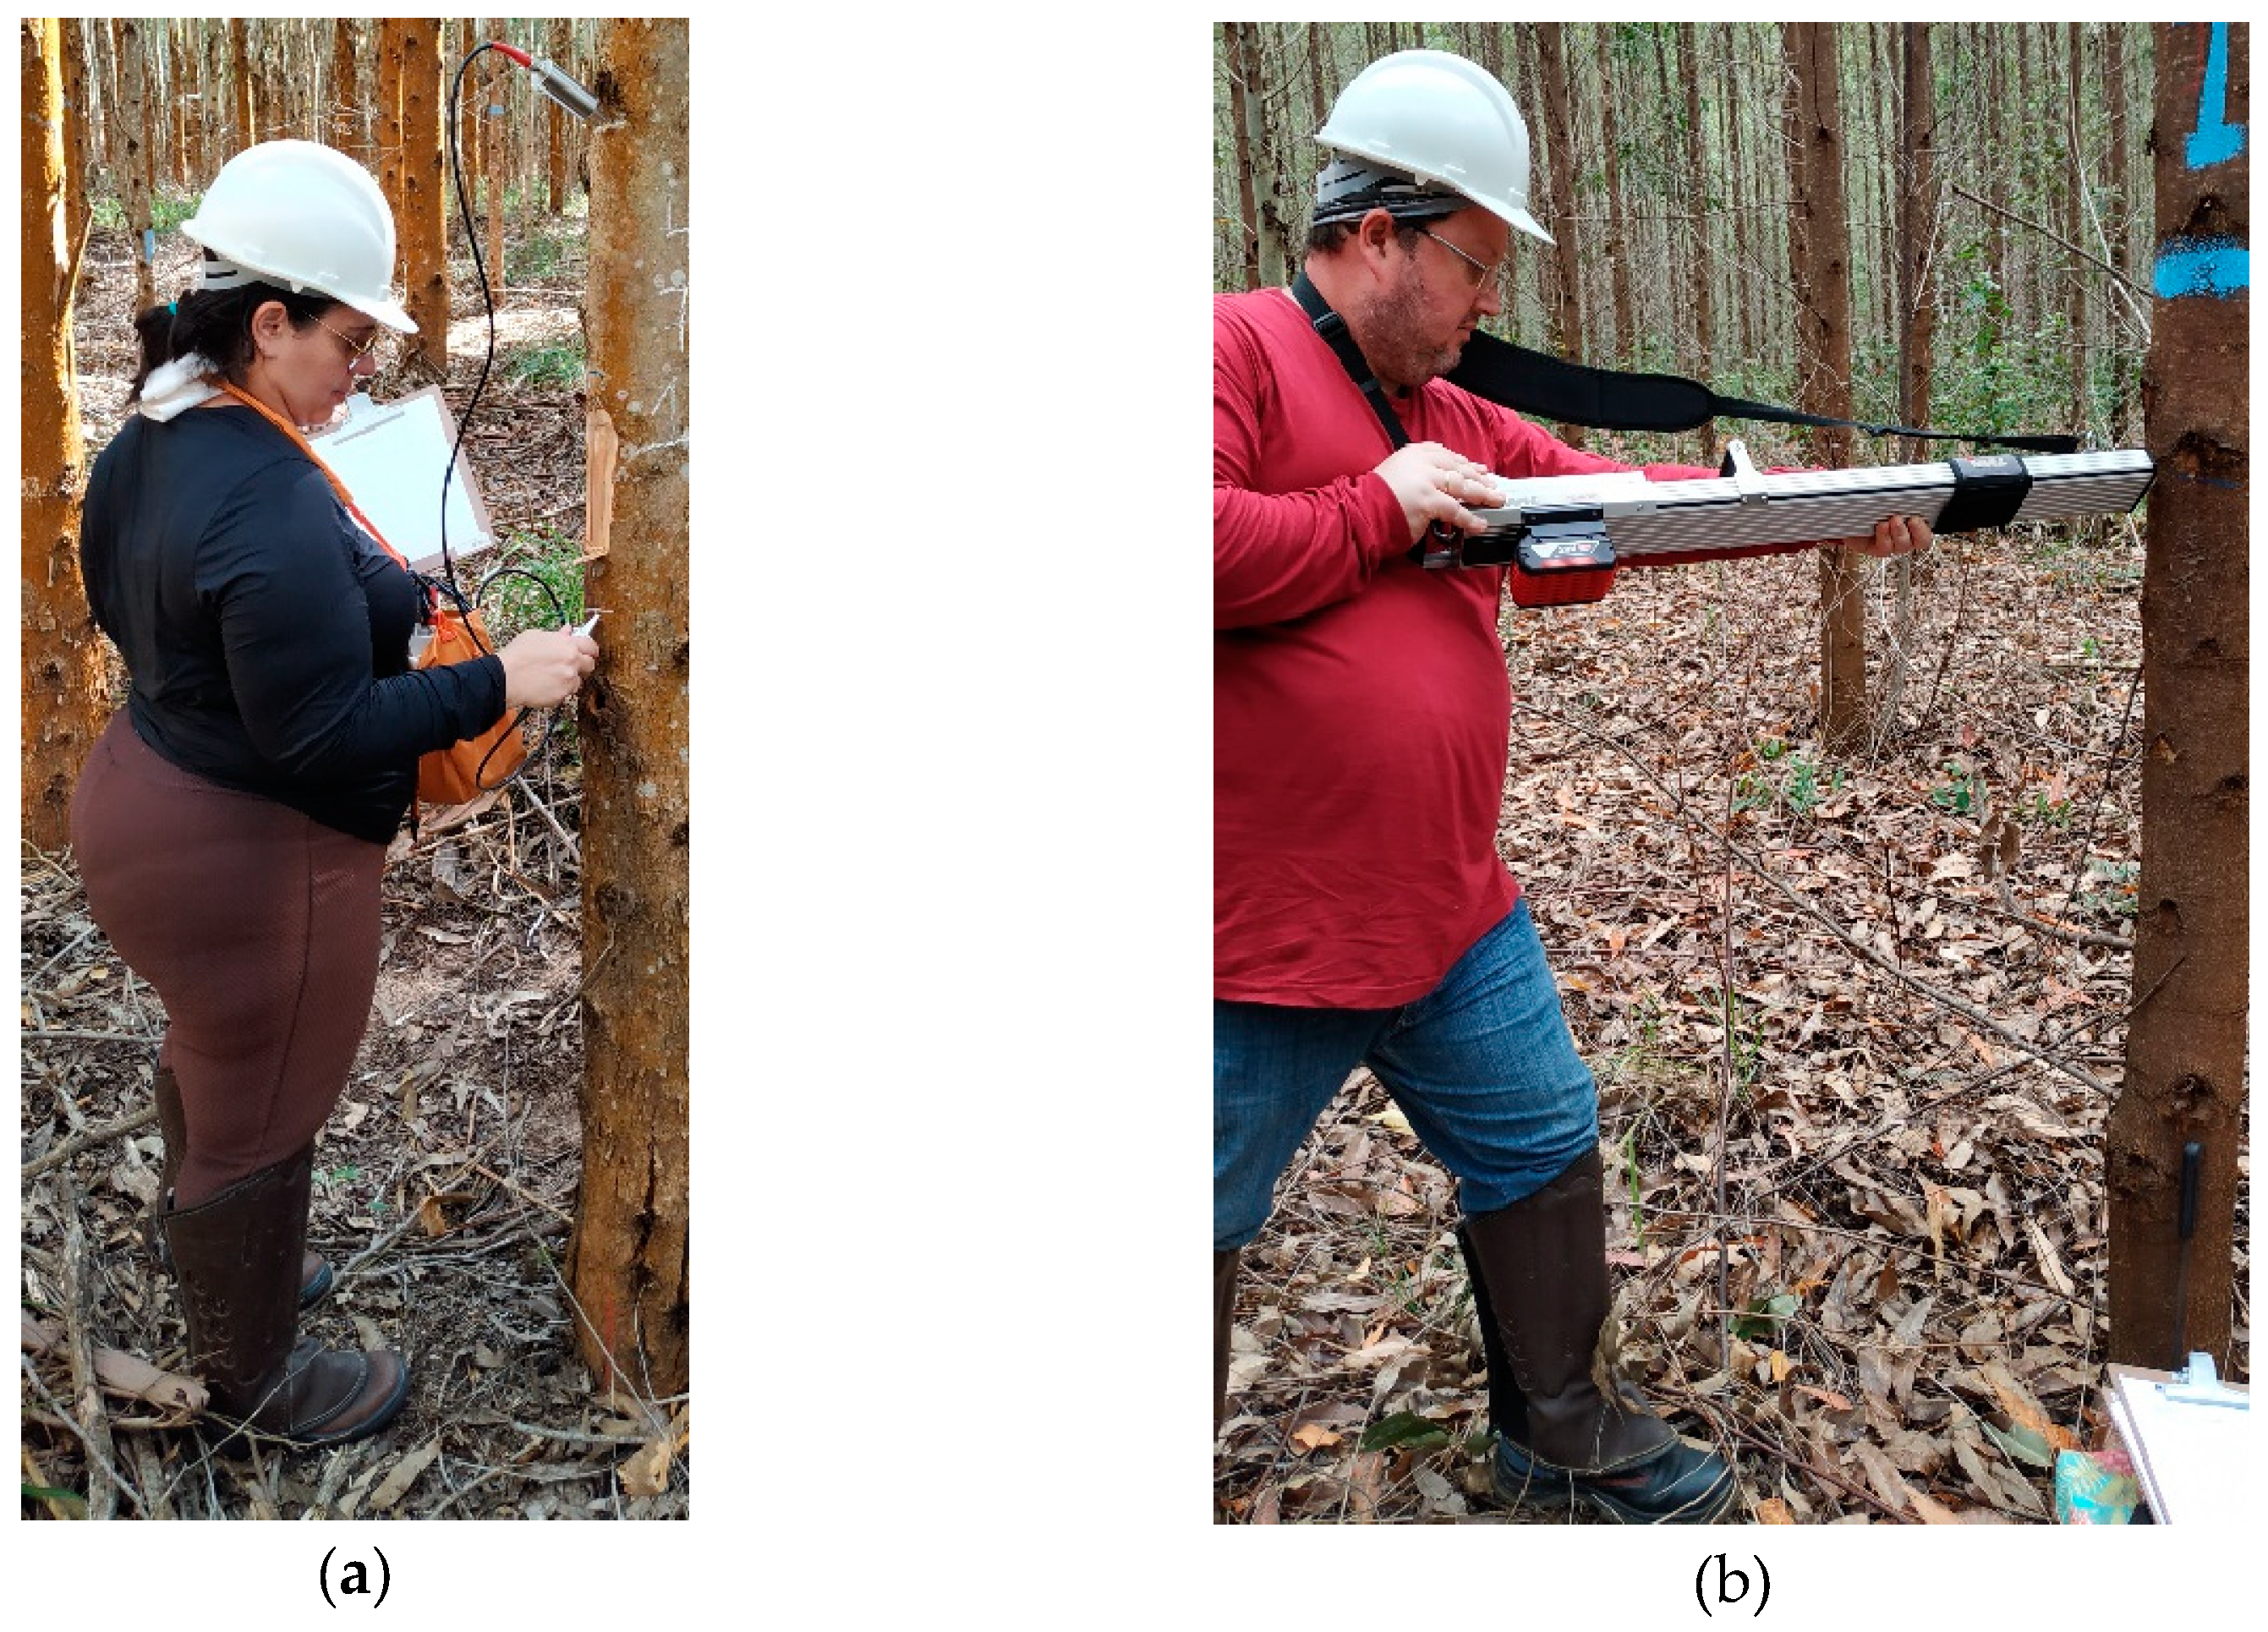
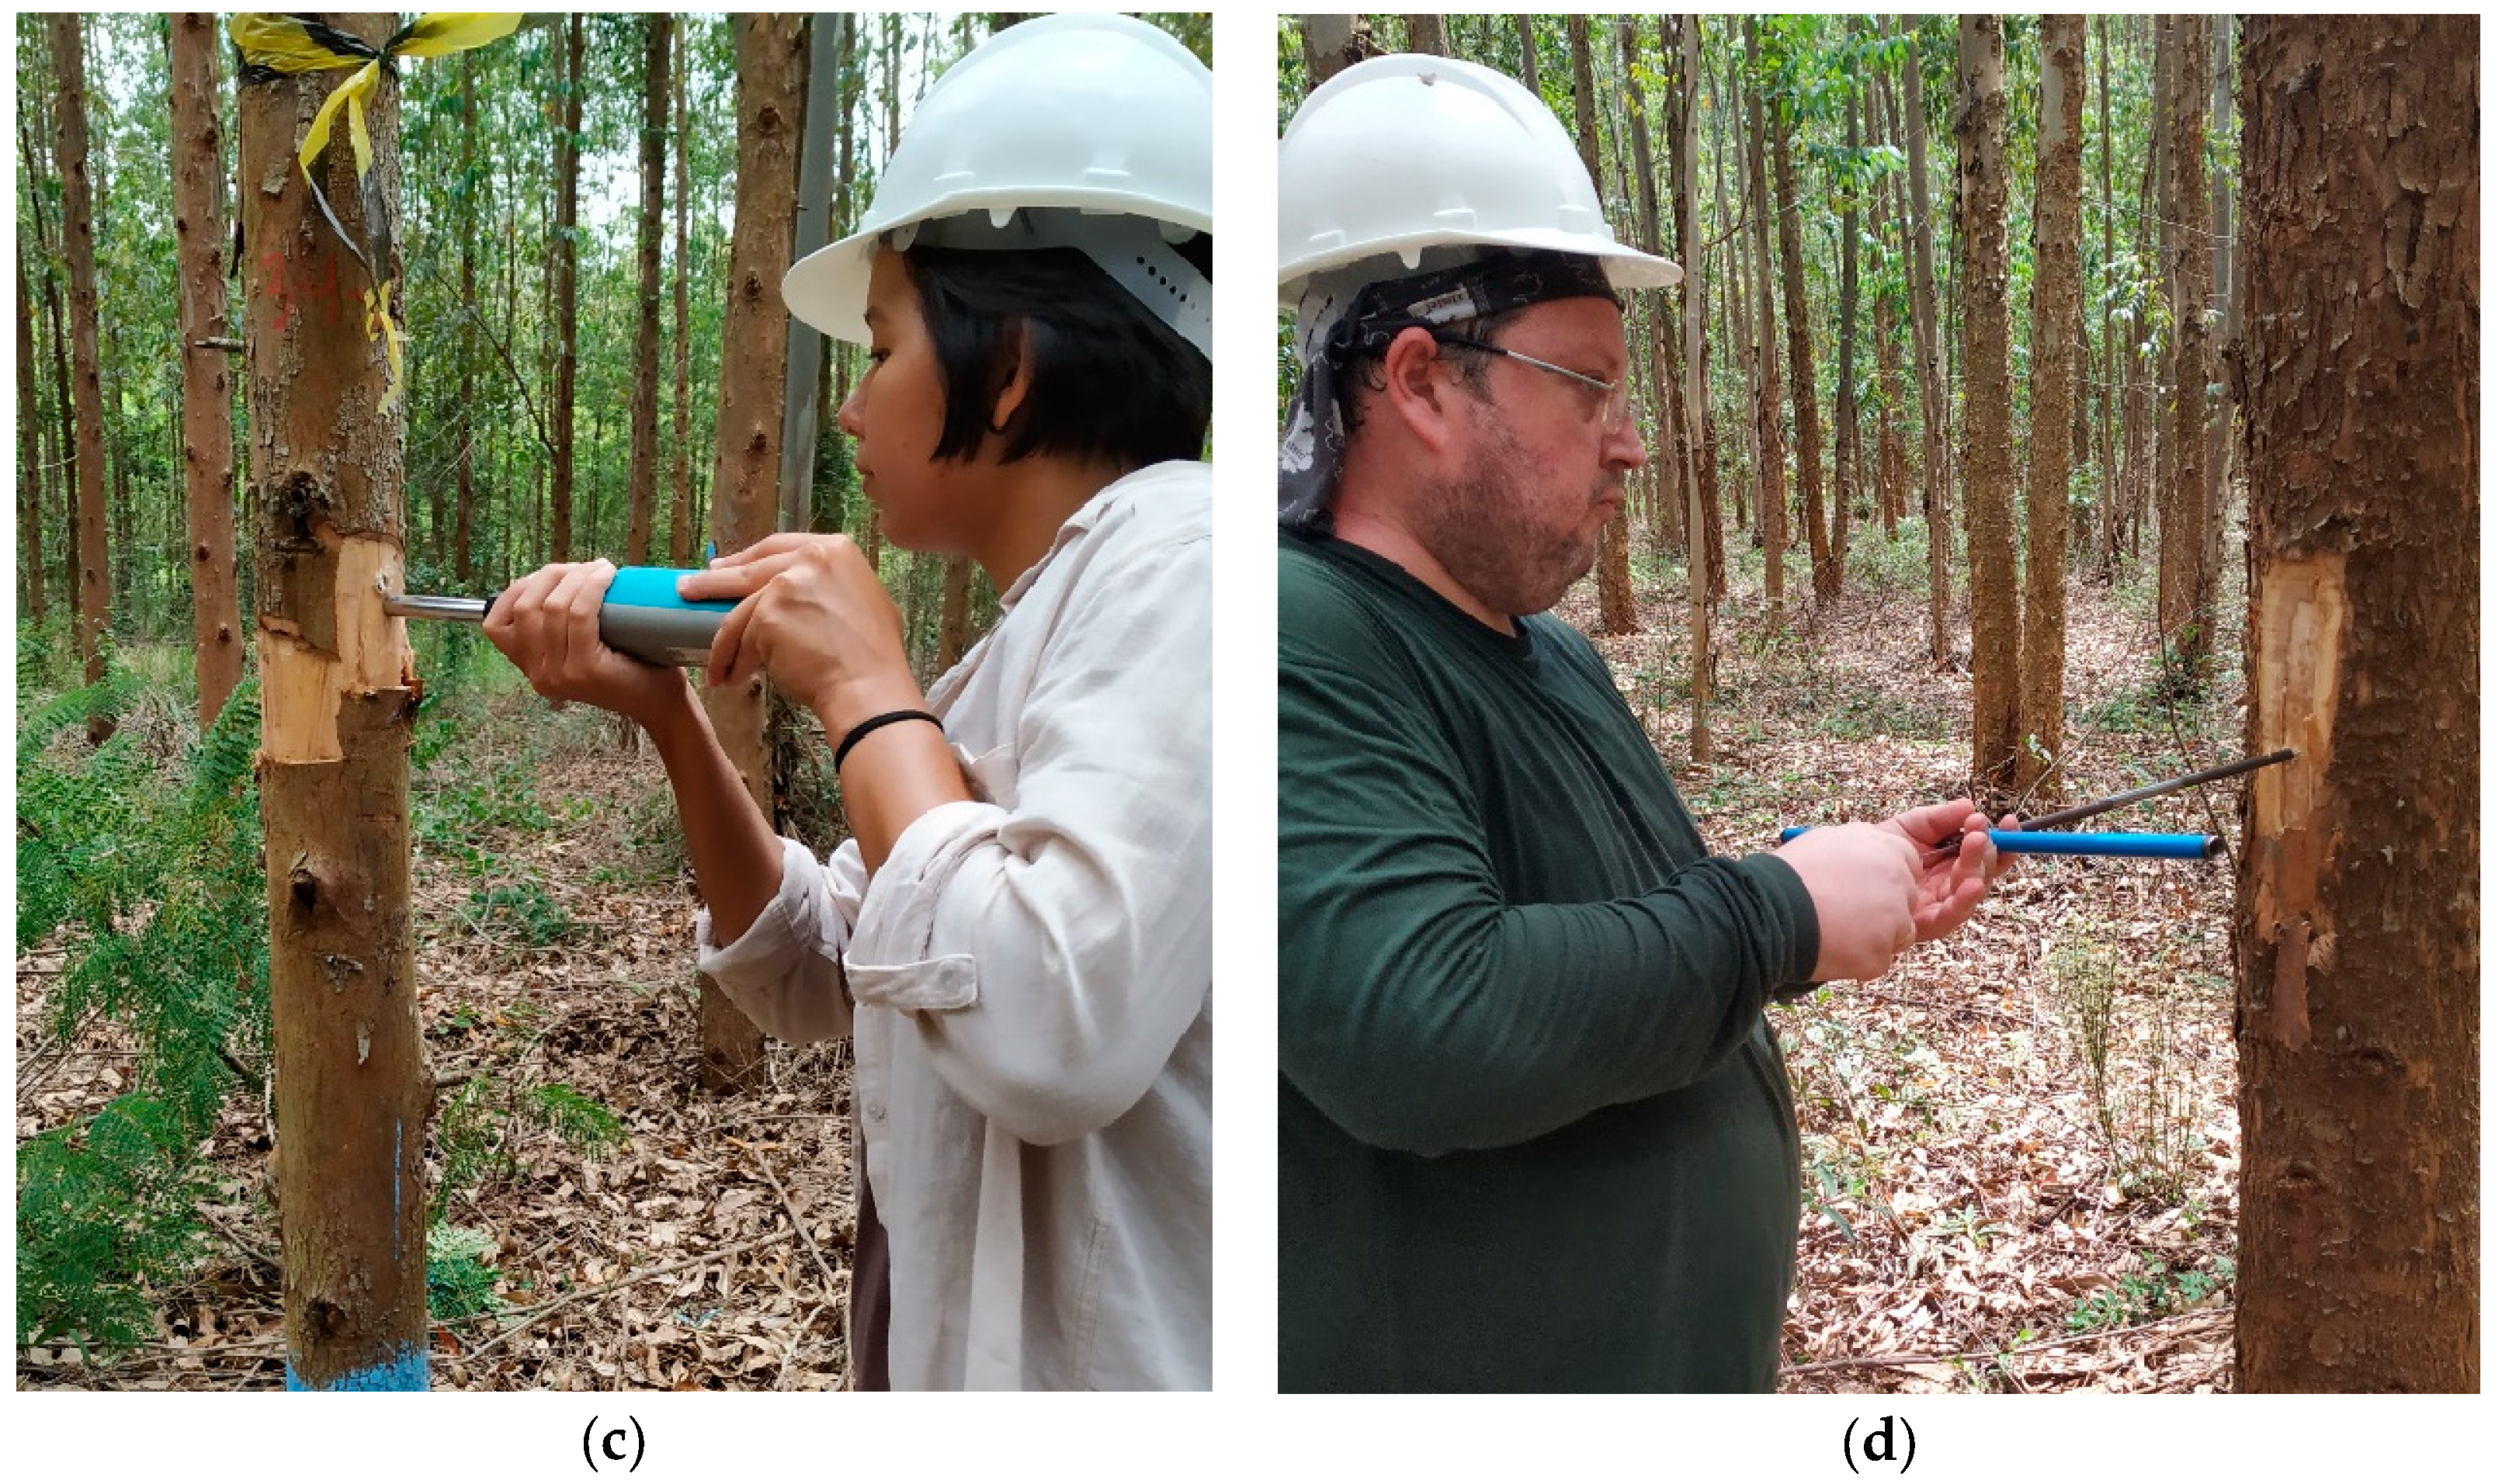
The sampling comprised 491 eucalyptus trees planted in the state of São Paulo, Brazil, aged between 3 and 7 years. In addition to the data collected in the conventional inventory of the partnering company (Suzano S.A.) (diameter at breast height, total height, and pylodin penetration), data from ultrasonic wave propagation tests in the longitudinal and radial directions, drilling resistance, sclerometric impact, and sample retrieval with the Pressler probe were added (
Figure 1). From each plot, 3 trees were chosen according to their DBH class (1: 8±4cm, 2: 12±4cm, 3: 16±4cm) and cut for determination of basic density in the laboratory of the partnering company. The data were compiled into a single database, containing the inventory results and additional tests, to which 7 machine learning algorithms were applied, selected with the aim of predicting basic density from the other variables, following a sequence of steps (
Figure 2). The basic density of the trees that were not cut was estimated using a model adopted by the partnering company.
The process of splitting the data into training and testing sets was carried out to ensure that the models were trained with distinct datasets in each training round. This approach increases their generalization capacity and reduces the likelihood of overfitting. The normalization step was critical to prevent dimensional differences between variables from being incorporated into the models. Moreover, some algorithms operate more effectively with normalized data, enhancing their performance.
The feature selection process aimed to identify the most relevant variables for predicting basic density in eucalyptus forests, optimizing model performance and reducing data dimensionality. Initially, the ExtraTreeRegressor algorithm was used to calculate feature importance based on the variance reduction provided by tree splits. Subsequently, other methods, such as Random Forest and XGBoost, were applied to validate the results and ensure robustness in the selection process. The most relevant variables were then selected to form the final set of features used in training the predictive models.
To prevent data leakage and ensure model reliability, the feature importance analysis was conducted exclusively on the training set after splitting the data. Only the variables selected based on the training data were used in the testing set. This approach ensures that model evaluation reflects performance on truly unseen data, simulating practical application scenarios [
23].
All data mining methods were configured following the guidelines of [
24,
25,
26] for hyperparameter tuning. Individual adjustments were made for each model to mitigate the risks of overfitting and underfitting. During hyperparameter optimization, different seeds were used for initializing evaluations, allowing the assessment of varying model behaviors. A 10-fold cross-validation strategy (cv=10) was also employed. Overfitting occurs when a model fits the training data exceptionally well but fails to generalize to new data. Conversely, underfitting happens when the model cannot capture relationships between the variables in the training set, causing the process to terminate prematurely, even before testing [
26].
The variables selected by machine learning algorithms were also evaluated using conventional statistical software (Statgraphics Centurion XV 15.1.02) to identify the best model for inferring wood basic density. This process involved applying classical statistical modeling techniques, such as multiple regression and models automatically suggested by the software, aiming to maximize the coefficient of determination (R2) and minimize the root mean square error (RMSE).
After the prediction step, each model was evaluated using the following metrics: coefficient of determination (R²), adjusted coefficient of determination (adjusted R²), Mean Absolute Error (MAE), and Root Mean Squared Error (RMSE).
3. Results
3.1. Laboratory and Field Results
The mean values, standard deviation, coefficient of variation, skewness, and kurtosis of the numerical variables evaluated in this research are presented in
Table 1. As mentioned previously, we can notice the difference between the scales of the variables and that is why it is important to carry out the normalization step.
3.2. Feature Selection
During the feature selection stage, the following variables were selected: DBH, H, VL, DR, AGE, and IMATCC. AGE, DBH, H, and IMATCC are already part of the inference models employed by companies. Conversely, VL and DR stood out as the non-destructive methods with the highest levels of importance within the models. It is also well-known that the individual use of DBH and H in models can lead to autocorrelation issues, as observed in
Table 2. Variance Inflation Factors (VIF) were calculated for each variable, and although there is no definitive consensus on acceptable VIF limits, we adopted the criterion that values exceeding 5 should be excluded or transformed. To address multicollinearity, these variables were combined (H/DBH).
3.3. Hyperparameter Optimization
The hyperparameter tuning process was conducted using multiple random seeds to initialize the evaluations and a 10-fold cross-validation strategy (cv=10) (
Table 3). The coefficient of variation (CV) for the evaluation metrics – mean absolute error (MAE), root mean squared error (RMSE), coefficient of determination (R²), and adjusted coefficient of determination (R² adj) – reached up to 21% across different random seeds (
Table 4).
3.4. Classical Statistics
The model obtained by classical statistics (Equation 1) was evaluated by parametrical statistics (Statgraphics Centurion XV 15.1.02), using the same variables previously selected. In this study, the classical statistical model was selected using the best-fit model proposed by the Statgraphics software, ensuring the most appropriate approach was utilized for comparison.
3.5. Optimal Metrics
Table 5 presents the best values obtained by the algorithms evaluated in this research with respect to the assessment metrics.
In addition to the metrics (
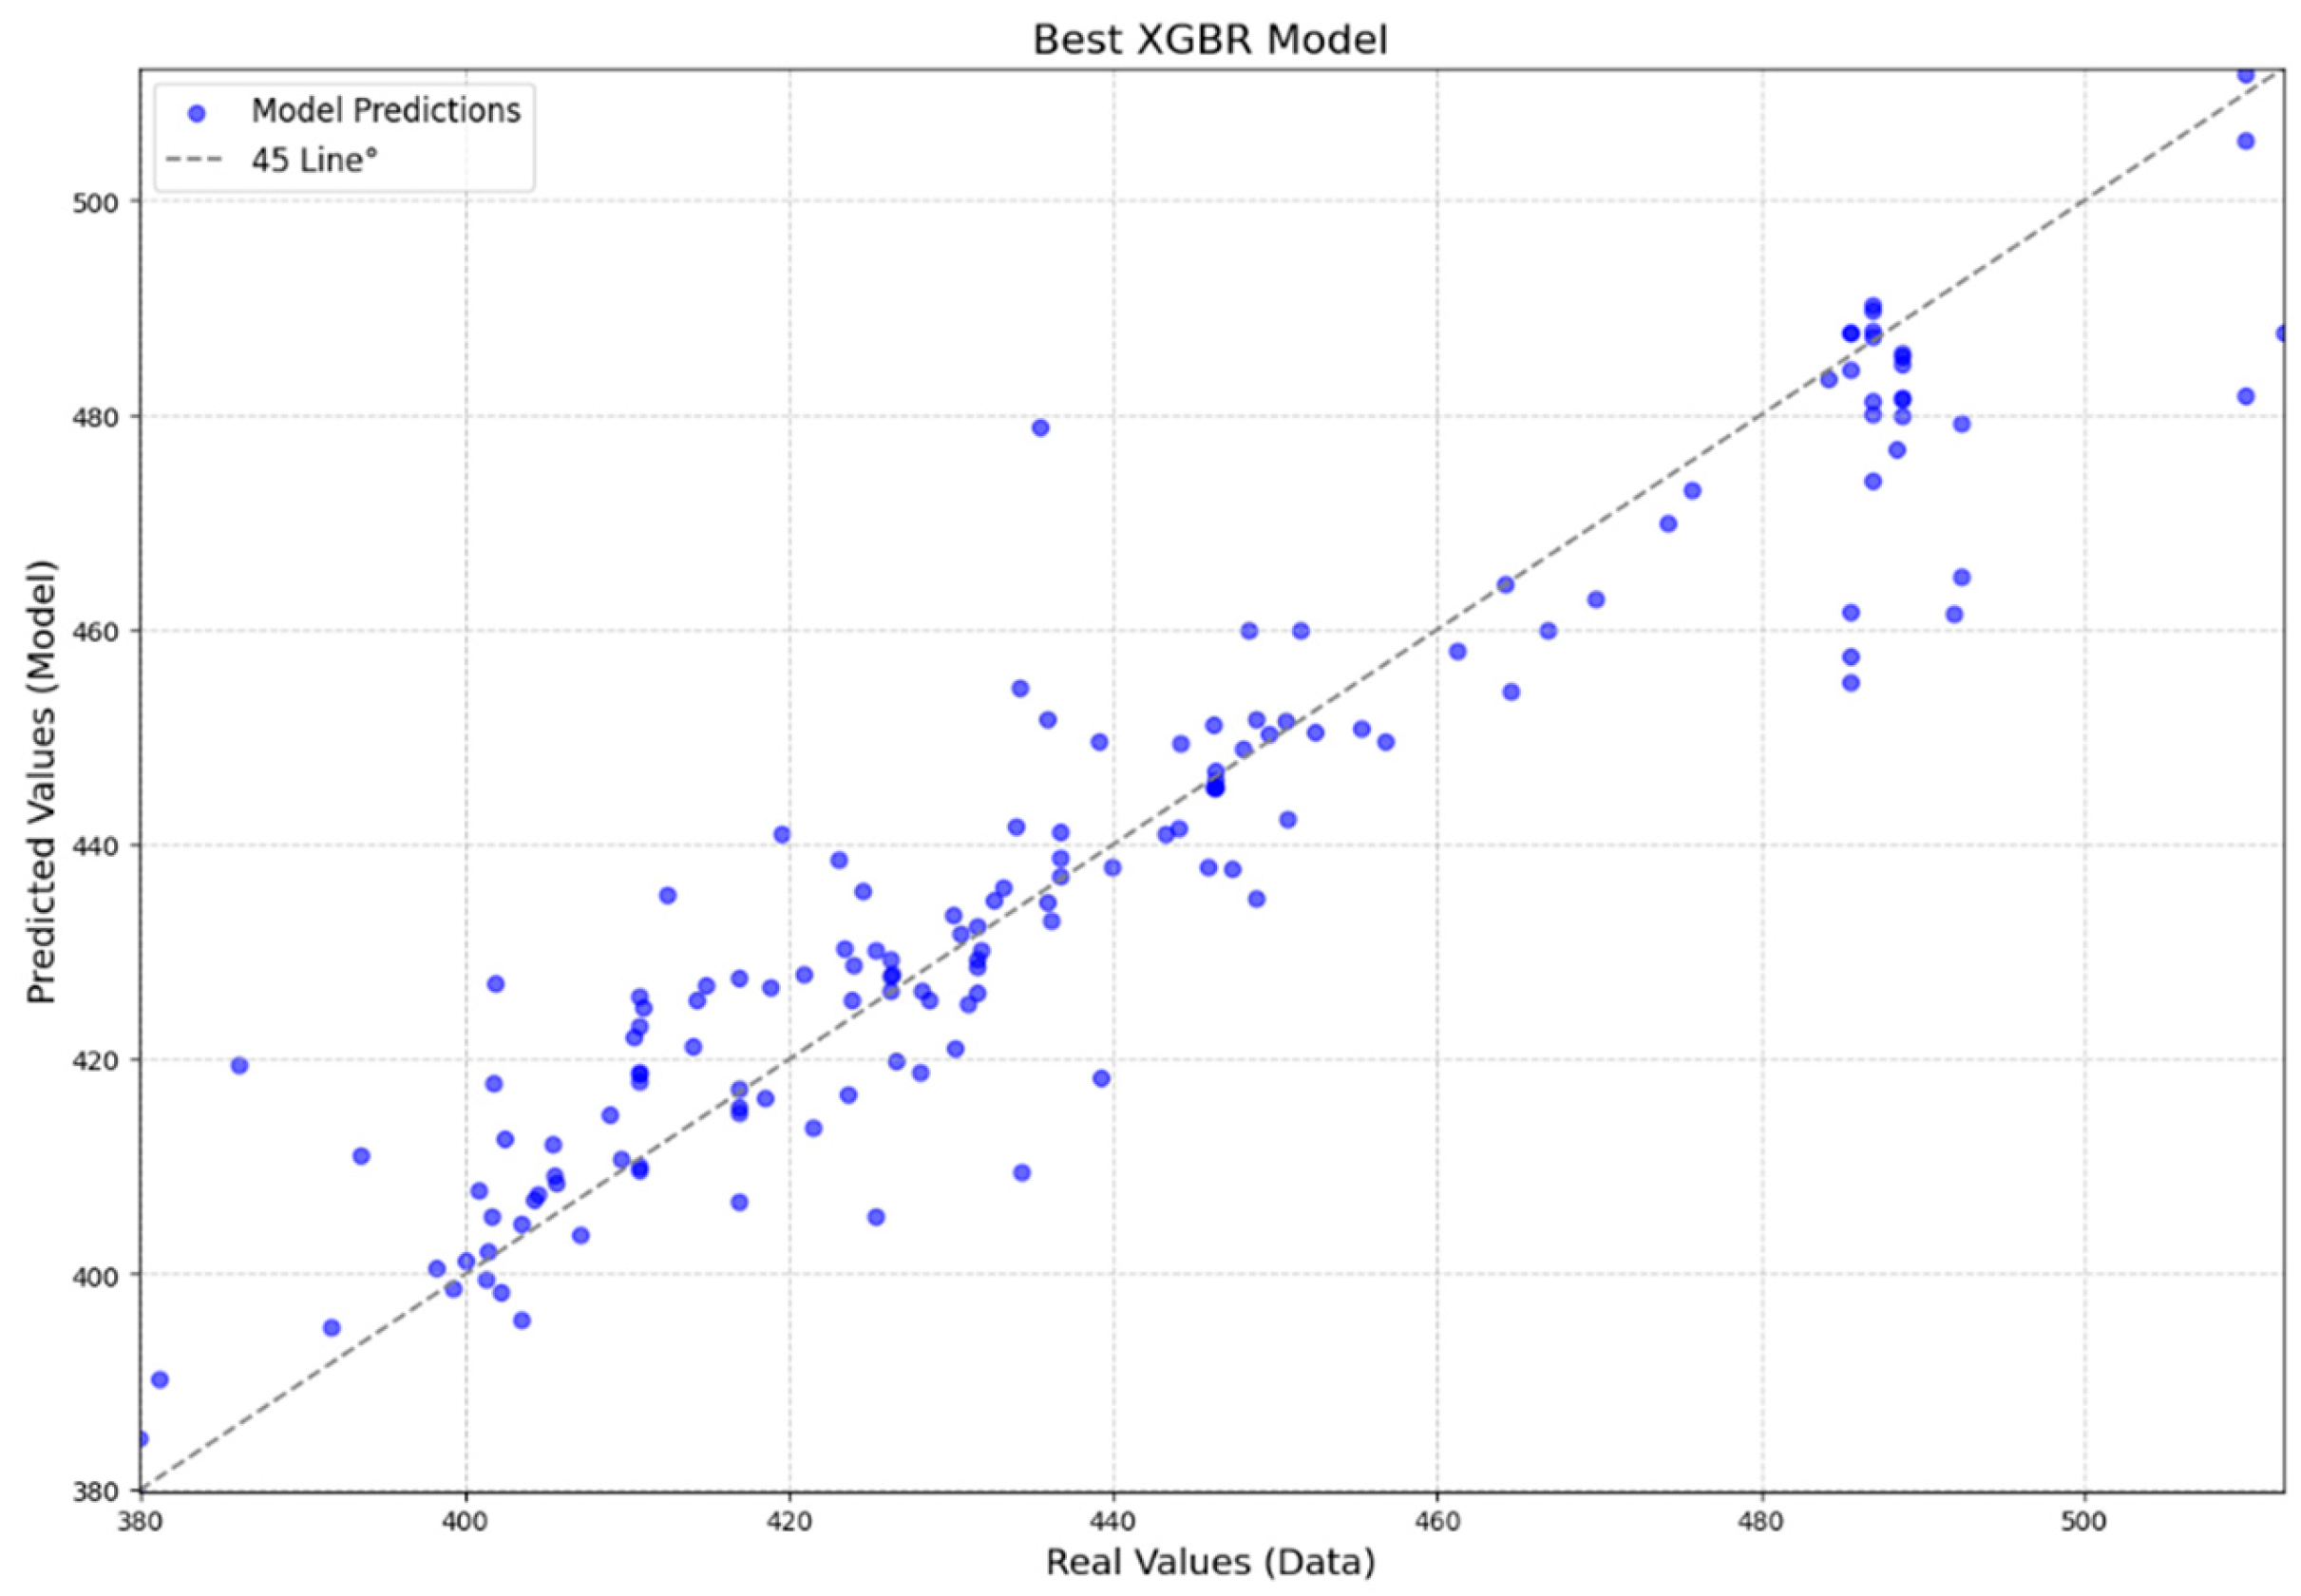
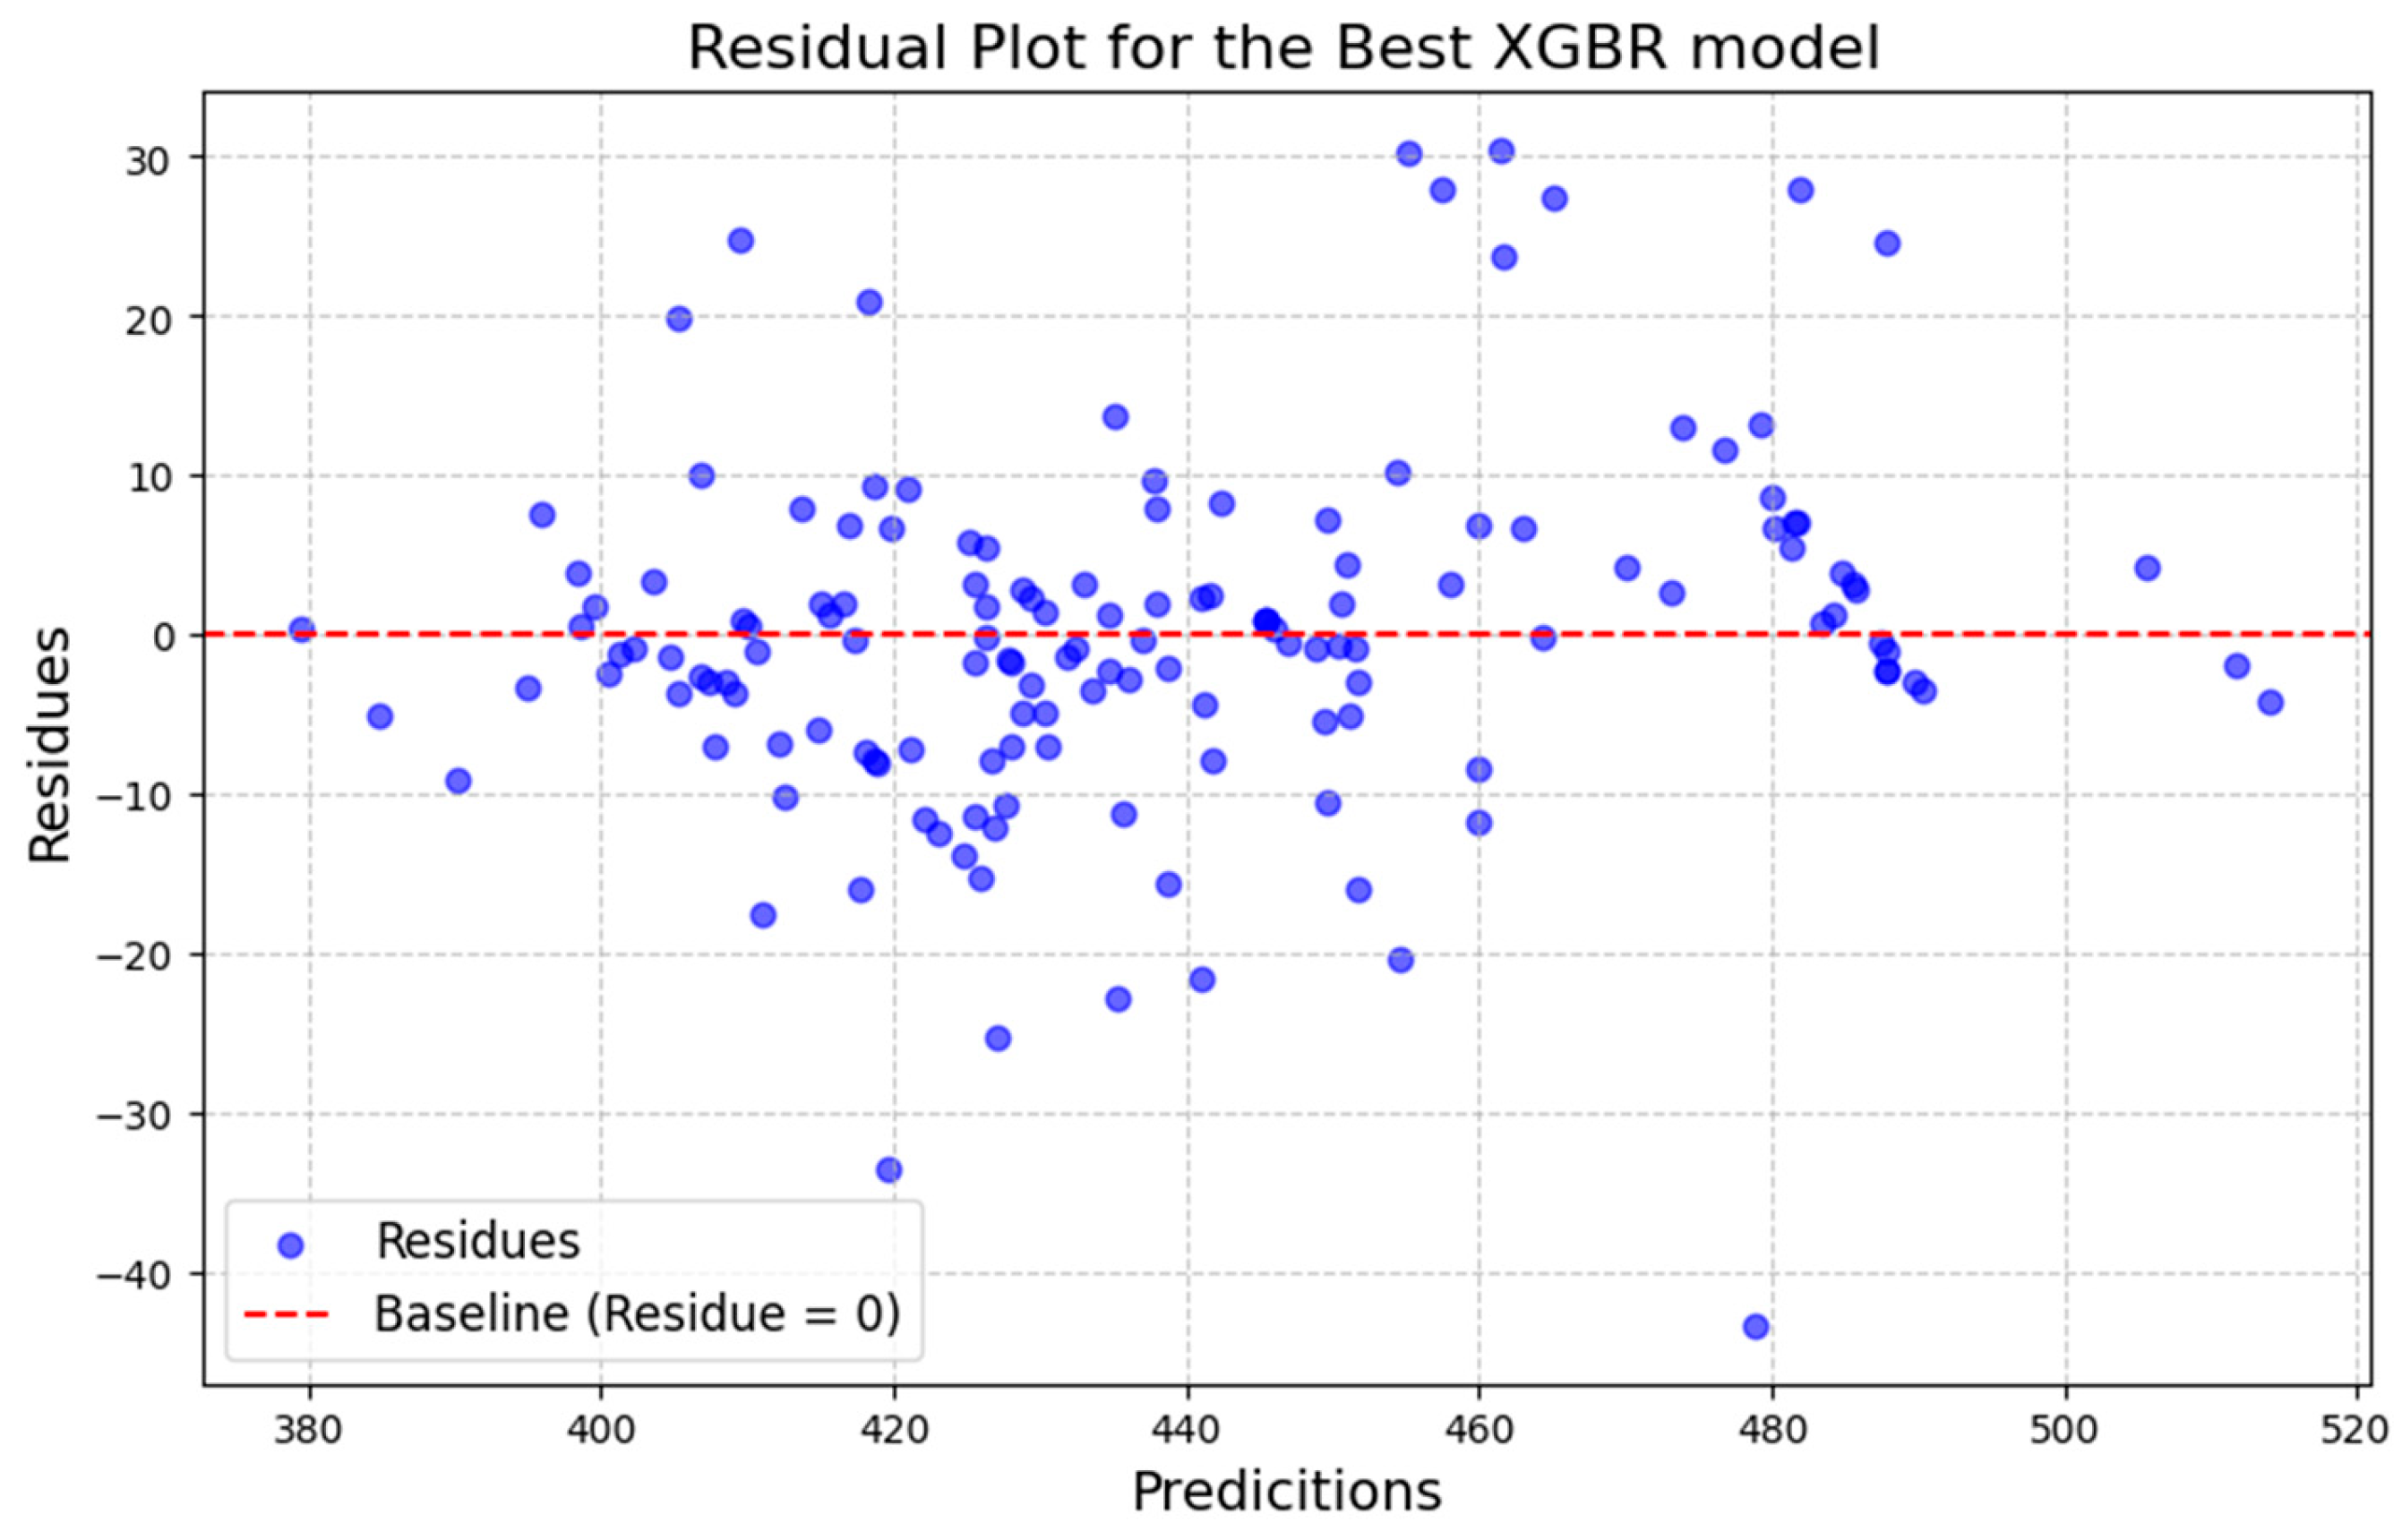
Table 5), two graphs were generated for each model: one showing the dispersion of predicted values versus observed values, and the other showing the dispersion of residuals (
Figure 3 and
Figure 4). The points representing the estimated and actual values are concentrated around the 45° line, indicating their proximity (
Figure 3).
4. Discussion
4.1. Laboratory and Field Results
Some parameters do not have a normal distribution because skewness and/or kurtosis values are outside the expected range of -2 to 2 for this type of distribution (
Table 1). For evaluations involving conventional parametric statistics, it sometimes necessary to attempt transformations, as for example in the case of statistics related to mean comparisons. In the case of multiple linear regressions, normality must be present in the residuals (errors) of the model, not necessarily in the independent or dependent variables [
27,
28].
4.2. Hyperparameter Optimization
During the hyperparameter optimization stage, we observed that the maximum coefficient of variation was 21% among all evaluated seeds. This result indicates moderate variability in the model's performance, suggesting that random initialization and variations in data splits may have a noticeable, though not critical, impact. Nonetheless, the CV values are within an acceptable range, indicating that the models provide reasonably consistent outcomes. This variability emphasizes the importance of using multiple seeds and cross-validation to ensure reliable and generalizable results. Overall, the models remain suitable for the proposed task of basic density prediction in eucalyptus forests [
26].
4.3. Classical Statistics
The use of predictive models evaluated through classical statistical techniques is a well-established method. Thus, to confirm the hypothesis of this research, we obtained Equation 1. This approach aligns with methodologies employed in other studies. For instance, [
29] evaluated Eucalyptus camaldulensis samples using ultrasound and developed density inference models with a determination coefficient of 34%. Similarly, [
30] assessed three conifer species using drilling resistance, which is also one of the methods evaluated in this research, achieving basic density inference models with determination coefficients ranging from 25% to 52%.
4.4. Optimal Metrics
Comparing the MAE to the mean laboratory value of basic density contextualizes the error, highlighting its practical relevance and confirming the model's robustness in handling the natural variability of basic density. Evaluating the MAE as a percentage of the mean basic density obtained from laboratory tests, values ranged from 1.61% to 4.90% (
Table 5). These results indicate low estimation errors relative to the coefficient of variation of basic density. Such findings suggest that the model effectively captures the variability of the data and provides accurate predictions that align with the observed dispersion of actual values.
When modeling a variable in relation to others, it is essential to always consider the composition of the dataset, its size, and how the variables within the dataset relate to each other. It is important to highlight that this study utilized a dataset consisting of trees planted at varying spacings and locations—factors that significantly influence density. However, these variables were not explicitly modeled in this phase of the research. While the model could potentially be improved by adding these factors to the dataset, this was not the objective of this paper, which aims to compare conventional techniques and machine learning approaches in modeling data for density inference.
When graphically analyzing the dispersion of predicted versus actual data (
Figure 3), where the intersection of the data is concentrated near the 45-degree line dividing the graph, it suggests that the model is capable of generalizing the data effectively and predicting new data with efficiency. Furthermore, the residuals are randomly distributed and do not show a trend (
Figure 4). This indicates that the model does not exhibit bias, overfitting, or underfitting issues, further supporting its robustness and reliability [
25].
[
20] presented predicted vs. observed plots and residual analyses that were comparable to those obtained in this study (
Figure 3 and
Figure 4). Although their study utilized a database approximately 4.5 times larger than ours—resulting in a more robust training dataset—and included additional variables such as basal area and number of stems per hectare, it did not incorporate nondestructive testing results. Despite working with a smaller database, our study achieved metrics of a similar magnitude, demonstrating the effectiveness of the selected variables and modeling approaches.
For species different than those examined in this research (e.g., Douglas-fir, fir hybrids, acacias, and species from the Brazilian Cerrado), with tree ages ranging from 32 to 50 years, the literature reports R² values between 50% and 80%. These studies employed various algorithms and architectures such as Artificial Neural Networks (ANN), Classification and Regression Trees (CART), and Support Vector Machines (SVM) [
21,
22,
31,
32]. These performance ranges are closer to those obtained in the present study, where R² values ranged from 19% to 89% (
Table 2 and
Table 3).
The results from the literature make it clear that the database size and variable selection significantly impact model performance, and that the incorporation of nondestructive testing methods provides a novel contribution of this study to the field. In addition to enhancing predictive accuracy, nondestructive testing data introduce information about the quality of the fiber produced, which is not captured by traditional models based solely on mass and volumetric variables [
13,
14,
15]. This added dimension positions nondestructive methods as valuable tools for advancing wood quality assessments, addressing gaps in current modeling approaches.
5. Conclusions
Machine learning algorithms, when applied to databases derived from measurements on standing trees and enhanced with data from nondestructive techniques, enable the development of suitable models for accurately inferring the basic density of wood.
This study highlighted the superior performance of machine learning models compared to those derived from classical statistical approaches. While classical methods offer simplicity and interpretability, machine learning models demonstrated significantly higher predictive accuracy and better generalization. Moreover, integrating data from nondestructive methods into the models not only improved performance but also incorporated valuable information about fiber quality—an aspect overlooked by traditional mass and volumetric models.
These findings underscore the importance of leveraging advanced modeling techniques in conjunction with robust datasets and interpretable frameworks. Such an approach enhances confidence in machine learning applications and supports their integration into forest management and industrial decision-making, offering a pathway toward more efficient and sustainable use of timber resources.
Author Contributions
Conceptualization, R.G.M.L. and R.G.; methodology, R.G.M.L. and R.G.; software, R.G.M.L.; validation, R.G.M.L. and R.G.; formal analysis, R.G.M.L.; investigation, R.G.M.L.; resources, R.G.; data curation, R.G.M.L.; writing—original draft preparation, R.G.M.L. and R.G.; writing—review and editing, R.G.M.L. and R.G.; visualization, R.G.M.L.; supervision, R.G.; project administration, R.G.M.L.; funding acquisition, R.G.M.L. All authors have read and agreed to the published version of the manuscript.
Funding
This research was funded by São Paulo Research Foundation (FAPESP), grant number 2022/14731-6.
Data Availability Statement
The datasets presented in this article are not readily available due to a confidentiality agreement signed with the partner company. This agreement restricts the disclosure of certain proprietary and sensitive data belonging to the company. Requests to access the datasets should be directed to rafael@valoramadeira.com, and access will be evaluated on a case-by-case basis in compliance with the confidentiality terms.
Acknowledgments
We thank the pulp and paper company Suzano for the logistical support and supply of eucalyptus clones for this research, and the Laboratory of Nondestructive Testing – LabEND (FEAGRI/UNICAMP) for the assistance with field and laboratory trials.
Conflicts of Interest
The authors declare no conflicts of interest.
References
- Gonçalves, R.; Lorensani, R.G.M.; Ruy, M.; Veiga, N.S.; Müller, G.; Alves, C.d.S.; Martins, G.A. Evolution of Acoustical, Geometrical, Physical, and Mechanical Parameters from Seedling to Cutting Age in Eucalyptus Clones Used in the Pulp and Paper Industries in Brazil. For. Prod. J. 2019, 69, 5–16. [Google Scholar] [CrossRef]
- Gonçalves, R.R.; Lorensani, R.M.L.; Merlo, E.; Santaclara, O.; Touza, M.; Guaita, M.; Lario, F.J. Modeling of wood properties from parameters obtained in nursery seedlings. Can. J. For. Res. 2018, 48, 621–628. [Google Scholar] [CrossRef]
- Gendvilas, V.; Downes, G.M.; Neyland, M.; Hunt, M.; Jacobs, A.; O’reilly-Wapstra, J. Friction Correction When Predicting Wood Basic Density Using Drilling Resistance. Holzforschung 2021, 75, 508–516. [Google Scholar] [CrossRef]
- Nickolas, H.; Williams, D.; Downes, G.; Harrison, P.A.; Vaillancourt, R.E.; Potts, B.M. Application of resistance drilling to genetic studies of growth, wood basic density and bark thickness in Eucalyptus globulus. Aust. For. 2020, 83, 172–179. [Google Scholar] [CrossRef]
- de Pádua, F.A.; Tomeleri, J.O.P.; Franco, M.P.; da Silva, J.R.M.; Trugilho, P.F. Recommendation of non-destructive sampling method for density estimation of the Eucalyptus wood. Maderas-Cienc Tecnol 2019, 21, 565–572. [Google Scholar] [CrossRef]
- Kharrat, W.; Koubaa, A.; Khlif, M.; Bradai, C. Intra-Ring Wood Density and Dynamic Modulus of Elasticity Profiles for Black Spruce and Jack Pine from X-Ray Densitometry and Ultrasonic Wave Velocity Measurement. Forests 2019, 10, 569. [Google Scholar] [CrossRef]
- Liu, F.; Xu, P.; Zhang, H.; Guan, C.; Feng, D.; Wang, X. Use of Time-of-Flight Ultrasound to Measure Wave Speed in Poplar Seedlings. Forests 2019, 10, 682. [Google Scholar] [CrossRef]
- Downes, G.M.; Lausberg, M.; Potts, B.M.; Pilbeam, D.L.; Bird, M.; Bradshaw, B. Application of the IML Resistograph to the infield assessment of basic density in plantation eucalypts. Aust. For. 2018, 81, 177–185. [Google Scholar] [CrossRef]
- Fundova, I.; Funda, T.; Wu, H.X. Non-destructive wood density assessment of Scots pine (Pinus sylvestris L.) using Resistograph and Pilodyn. PLOS ONE 2018, 13, e0204518. [Google Scholar] [CrossRef]
- Carrillo, I.; Valenzuela, S.; Elissetche, J.P. Comparative evaluation of Eucalyptus globulus and E. nitens wood and fibre quality. IAWA J. 2017, 38, 105–116. [Google Scholar] [CrossRef]
- Soriano, J.; da Veiga, N.S.; Martins, I.Z. Wood density estimation using the sclerometric method. Eur. J. Wood Wood Prod. 2015, 73, 753–758. [Google Scholar] [CrossRef]
- Sandoz, J.L. Standing Tree Quality Assessments Using Ultrasound. Acta Horticulturae 1999, 496, 269–278. [Google Scholar] [CrossRef]
- Proto, A.; Macrì, G.; Bernardini, V.; Russo, D.; Zimbalatti, G. Acoustic evaluation of wood quality with a non-destructive method in standing trees: a first survey in Italy. iForest - Biogeosciences For. 2017, 10, 700–706. [Google Scholar] [CrossRef]
- Ondrejka, V.; Gergeľ, T.; Bucha, T.; Pástor, M. Innovative methods of non-destructive evaluation of log quality. For. J. 2021, 67, 3–13. [Google Scholar] [CrossRef]
- Jones, G.; Liziniewicz, M.; Lindeberg, J.; Adamopoulos, S. Non-Destructive Evaluation of Downy and Silver Birch Wood Quality and Stem Features from a Progeny Trial in Southern Sweden. Forests 2023, 14, 2031. [Google Scholar] [CrossRef]
- Aragão, M. DE A.; Santos, J. S.; Da Silva, M. L. M. Técnica de mineração de dados aplicada a estimação de volume de árvores de eucalyptus. 5a Semana de Engenharia Florestal da Bahia. Anais...Vitória da Conquista: mar. 2018.
- Lima, E.D.S.; De Souza, Z.M.; Montanari, R.; Oliveira, S.R.D.M.; Lovera, L.H.; Farhate, C.V.V. Classification of the initial development of eucaliptus using data mining techniques. Cerne 2017, 23, 201–208. [Google Scholar] [CrossRef]
- Cordeiro, M.A.; Pereira, N.N.d.J.; Binoti, D.H.B.; Binoti, M.L.M.d.S.; Leite, H.G. Estimativa do volume de Acacia mangium utilizando técnicas de redes neurais artificiais e máquinas vetor de suporte. Pesqui. Florest. Bras. 2015, 35, 255–261. [Google Scholar] [CrossRef]
- Binoti, M.L.M.; DA, S.; et al. Redes neurais artificiais para estimação do volume de árvores. Revista Árvore 2014, 38, 283–288. [Google Scholar] [CrossRef]
- Leite, H.G.; Binoti, D.H.B.; Neto, R.R.d.O.; Lopes, P.F.; de Castro, R.R.; Paulino, E.J.; Binoti, M.L.M.d.S.; Colodette, J.L. Redes Neurais Artificiais para a estimação da densidade básica da madeira. Sci. For. 2016, 44. [Google Scholar] [CrossRef]
- Demertzis, K.; Iliadis, L.; Avramidis, S.; El-Kassaby, Y.A. Machine learning use in predicting interior spruce wood density utilizing progeny test information. Neural Comput. Appl. 2015, 28, 505–519. [Google Scholar] [CrossRef]
- Iliadis, L.; Mansfield, S.D.; Avramidis, S.; El-Kassaby, Y.A. Predicting Douglas-fir wood density by artificial neural networks (ANN) based on progeny testing information. Holzforschung 2013, 67, 771–777. [Google Scholar] [CrossRef]
- Nassar, O. Data Leakage in Machine Learning. 2023. [Google Scholar] [CrossRef]
- Plas, J.V. Python Data Science Handbook. 2016. ISBN: 9781491912058. Disponível em: <https://jakevdp.github.io/PythonDataScienceHandbook/>.
- McKinney, W. Python for data analysis, 3rd ed.; O'Reilly Media, Inc.; ISBN 978-1-098-10403-0.
- Goldschimidt, R.; Passos, E. Data mining: um guia prático; Campus: Rio de Janeiro, 2005. [Google Scholar] [CrossRef]
- Sainani, K.L. Dealing with Non-normal Data. PM&R 2012, 4, 1001–1005. [Google Scholar] [CrossRef]
- Chowdhury, S.; Lin, Y.; Liaw, B.; Kerby, L. Evaluation of Tree Based Regression over Multiple Linear Regression for Non-normally Distributed Data in Battery Performance. 2022 International Conference on Intelligent Data Science Technologies and Applications (IDSTA), 17-25. 2021. [Google Scholar]
- de Melo, R.R.; Barbosa, K.T.; Beltrame, R.; Acosta, A.P.; Pimenta, A.S.; Mascarenhas, A.R.P. Ultrasound to determine physical-mechanical properties of Eucalyptus camaldulensis wood. Wood Mater. Sci. Eng. 2020, 16, 407–413. [Google Scholar] [CrossRef]
- Yao, J.; Zhao, Y.; Lu, J.; Liu, H.; Wu, Z.; Song, X.; Li, Z. Research on the Wood Density Measurement in Standing Trees though the Micro Drilling Resistance Method. Forests 2024, 15, 175. [Google Scholar] [CrossRef]
- Iglesias, C.; Santos, A.J.A.; Martínez, J.; Pereira, H.; Anjos, O. Influence of Heartwood on Wood Density and Pulp Properties Explained by Machine Learning Techniques. Forests 2017, 8, 20. [Google Scholar] [CrossRef]
- Silva, J.P.M.; Cabacinha, C.D.; Assis, A.L.; Monteiro, T.C.; Júnior, C.A.A.; Maia, R.D. Redes neurais artificiais para estimar a densidade básica de madeiras do cerrado. Pesqui. Florest. Bras. 2018, 38. [Google Scholar] [CrossRef]
|
Disclaimer/Publisher’s Note: The statements, opinions and data contained in all publications are solely those of the individual author(s) and contributor(s) and not of MDPI and/or the editor(s). MDPI and/or the editor(s) disclaim responsibility for any injury to people or property resulting from any ideas, methods, instructions or products referred to in the content. |
© 2025 by the authors. Licensee MDPI, Basel, Switzerland. This article is an open access article distributed under the terms and conditions of the Creative Commons Attribution (CC BY) license (http://creativecommons.org/licenses/by/4.0/).