1. Introduction
Recently published results of a 3-year survey of US pet owners conducted by the Dog Aging Project found that over 82% of the participants reported feeding a kibble diet as the primary source of nutrition and 32% fed canned food as a secondary source [
1]. In other surveys, nearly half of the respondents reported a preference for diets that included natural, organic, and/or sustainable ingredients [
2]. While pet owners primarily feed processed diets for convenience, the humanization of pet food to provide natural, health promoting ingredients and increased palatability continues to drive innovation in the industry [
3]. Plant-based products are commonly viewed as natural and beneficial diet ingredients. In response, pet food manufacturers search for plant-derived ingredients from various industry waste streams to both improve sustainability and satisfy customer preferences for improved nutritional benefits from processed, shelf-stable diets [
4]. This, in turn, has led to interest in the potential benefits of these molecules for companion animals. However, the safety of plant extracts may vary with application and species, as dogs and cats have different tolerances for metabolizing the active molecules [
5]. For example, a recent update from the European Food Safety Authority approved the utilization of rosemary extract as an antioxidant at different concentrations for cat versus dog food [
6].
Publications focusing on the use of plant extracts in companion animal health focus on the administration via capsule or oral gavage, not as a part of the food matrix or flavor. One study administered capsules containing 200mg of a grapefruit extract, including 42mg of the bitter-tasting flavonoid naringin, to fasted dogs and measured the pharmacokinetics after a single dose and reported no adverse effects [
7]. Another dog study evaluated the effects of a mixed polyphenol-rich blueberry and grape extract administered in a capsule added to food at 0, 4, 20, and 40 mg/kg/day and found no evidence of renal or liver health concerns after a 24-week feeding period [
8]. Kapetanovic et al. demonstrated a 10-times decreased risk of an adverse event when the tea catechin epigallocatechin gallate (EGCG) was administered in a fed state versus a fasted state in adult Beagle dogs. Dosages tested were 200, 500 and 1000 mg/kg/day, which are considerably greater than levels of EGCG commonly found in pet foods [
9]. This study demonstrated that plant extracts should be administered as part of a diet to reduce the risk of potential adverse events if prior safety data is insufficient.
Growing popularity of the “Mediterranean diet” has led to the increased use of olive extracts (OE) as both a food-stabilizer as well as a bioactive ingredient for improved health in human products [
10]. While publications on OE in pets are scarce, dietary inclusion of a hydroxytyrosol-rich OE at 1000 ppm did not have a negative health effect on senior cats [
11]. Active ingredients in OE have been identified as volatile compounds in various olive species and products [
12,
13]. These volatile compounds have distinct aromas that may influence the acceptance of diets or supplements offered to pets. While it is important to evaluate the safety and benefits of these products in pets and pet foods, effects on palatability are under-represented in peer-reviewed literature. It is valuable for pet food manufacturers to understand the preference or tolerance of plant extracts in their diets to prevent negative consumer response. Previously, the acceptance of OE by cats demonstrated in an internal study using 2-day 2-bowl tests that provided between 15 to 150 ppm of dietary OE via liquid palatant in a kibble diet was equivalent to that of the control diet (0 ppm OE) [
14]. The objective of the current study was to evaluate the acceptance of dry and canned dog foods with various application rates of a natural OE product as a flavor component.
2. Materials and Methods
2.1. Olive Extract Flavor Characterization
Natural OE was provided by PhenoFarm (Scandriglia RI, Italy). Five subsamples of the same lot of OE were collected and analyzed in triplicate by headspace solid-phase microextraction coupled with gas chromatography quadrupole time-of-flight (HS-SPME GC/Q-TOF; Agilent 7250 Series, Santa Clara, CA, USA). Prepared in a 20 mL GC vial, 1 g of sample was mixed with 9 mL of saturated NaCl and 10 μL of an internal standard (200 ppb, 2-octanol/3 ppm, cyclopentanol) for qualitative analysis of volatile compounds. The sampling was automated by a PAL robotic tool change auto sampler (Agilent). The fiber (50/30 µm Carboxen®/DVB/PDMS, Agilent) was preconditioned at 250 °C for 3 min, and then exposed for 20 min at 60 °C to the headspace above the samples in 20 mL headspace glass vials (Agilent) with agitation. After sampling, the fiber was transferred to the GC inlet (250 °C for 3 min), equipped with a 0.75 mm ultra-inert SPME liner (Agilent). The injection was conducted in hot split mode (1:20 split ratio). The GC-mass spectrometry (MS) analysis was performed on a HP-5MS capillary column (30 m × 0.25 mm × 0.25 µm film thickness, Agilent). The oven temperature was held at 40 °C for 2 min and increased to 270 °C at the rate of 8 °C/min. Mass spectra in electron ionization mode were generated at 70 eV. Data analysis was conducted by deconvolution using MassHunter Qualitative Analysis (Version B.07.00, Agilent). Compound identification was based on suggestions by the National Institute of Standard and Technology library (version NIST14) and confirmed using a linear retention index. The retention index of each identified compound was calculated using a saturated alkanes standard (C7-C40, Millipore Sigma Supelco, Bellefonte, PA, USA).
For quantitative analysis, 1 g of sample was extracted with 4 mL of dichloromethane and spiked with 10 μL of the internal standard (201 ppm, 2-octanol/2990 ppm, cyclopentanol). Then, 1 mL of the dichloromethane extract was transferred to 2 mL GC autosampler vials for GC analysis. The GC-MS system consisted of a 7890 GC/5977A mass selective detector (Agilent). Separations were performed using a DB-Wax column (30 m × 0.25 mm i.d. × 0.25 µm df, Agilent). The initial oven temperature was 40 °C. After 5 min, the oven temperature increased by 8 °C/min to the final temperature of 230 °C and held for 20 min. The flow rate of helium carrier gas was 1 mL/min. The mass spectra were recorded in both full scan and selective ion monitoring mode (35-400 a.m.u., scan rate 5.27 scans/s, interface temperature 250 °C, and ionization energy 70 eV). The following ions were monitored for the selective ion monitoring mode: 41, 45, 55, 57, 60, 91, 96, 107, 108, 109, 137. The injection was conducted in hot splitless mode. Data analysis was conducted by deconvolution using MassHunter Qualitative Analysis (Version B.07.00).
The presence of hydroxytyrosol was quantified in 4 samples of the same lot of OE following the high-pressure liquid chromatography (HPLC) method published by the International Olive Council [
15].
2.2. Dog Food Preparations
2.2.1. Dry Food
Palatants are often applied on kibble surface to enhance palatability of the diet and deliver flavors. PALASURANCE
® D70-420+XG Liquid (D70-420+XG) is a Kemin Industries-made liquid palatant that has been used in kibble coatings. It was chosen as the palatant for the acceptance testing due to high performance in previous internal palatability testing. One lot of D70-420+XG sourced from Kemin Industries production facilities in Verona, MO, USA was received for use as the control and for prototype blending. Prototype palatants were made by adding different levels of OE in the D70-420+XG to provide OE at 120 ppm (PT120), 200 ppm (PT200), or 500 ppm (PT500) to the kibble surface when coated with 2.5% of the prototypes (
Table 1). The prototypes were prepared by measuring D70-420+XG and OE into 2 L glass beakers and combining with overhead mixers at 200 RPM for 5 min.
Uncoated dog kibble (All Life Stages Chicken & Rice Formula, Diamond Pet Foods®, Meta, MO, USA) was weighed into a rotating mixing drum (model 450DD, Kushlan Products LLC, Katy, TX, USA), sprayed with 5% chicken fat, and mixed for 3 min. Liquid palatants were sprayed on at 2.5% inclusion rate and mixed for another 3 min. Coated rations were transferred to a gusseted foil bag and labeled for shipment and feedings.
2.2.2. Wet Food
The OE was added into a wet food formulation at 0 (control), 120, 200, and 500 ppm. The formulation of control and treatment wet foods can be found in
Table 2. A grinder (Model Cutter C35Z, Fatosa, Barcelona, Spain) was used to grind frozen meat. The ground meat was then transferred to an electric kettle (Model KET20T, Cleveland
TM, Ontario, Canada). The gums were first hydrated with water with a commercial blender (Model CB15, Waring
®, McConnellsburg, PA, USA) before being added to the kettle and the other ingredients were also added to the electric kettle. The mixture was then heated to 26 °C. Once the temperature was reached, the mixture was transferred to a piping bag and the cans (307×109.3, Silgan Containers LLC, Woodland Hills CA, USA) were hand filled to 150 ± 3 g each. A vacuum seamer (Model UVGMD-HMI, Dixie Canner Co., Athens, GA, USA) was used to hermetically seal the filled cans. Seamed cans were then loaded into the retort machine (Model Multimode R&D Retort 2402 Series, Allpax Products LLC, Covington, LA, USA) to achieve a minimum of F
0=8 (come up: 7 min; cook: 121.7 °C for 55 min; pressure cool: 15 min; atmospheric cool: 8 min). The integrity of hermitic seals was tested with a seam analyzer (Model WACO Accuseam 3000, Wilkens-Anderson Company, Chicago, IL, USA) before and after retort. Fifteen cans from each batch were also stored at 35 °C in an incubator (Model Heratherm IGS400, Thermo Fisher Scientific, Langenselbold, Germany) for 10 days and tested for pH, vacuum, and appearance to ensure sufficient processing of the cans before feeding. The control and treatment wet foods were manufactured at a pilot plant at Kemin Industries, Inc. (Des Moines, IA, USA).
2.2.3. Chemical Composition for Treatment Foods
Treatment foods were analyzed for moisture, crude protein, acid hydrolyzed fat, crude fiber, ash, and minerals at Midwest Laboratories (Omaha, NE, USA). Macronutrient contributions to caloric density and metabolizable energy were determined for each dry dog diet using NRC calculations listed below [
16].
2.2.4. Oxidation Markers Analysis for Dry Foods
Study diets were analyzed for peroxide value [
17,
18,
19,
20] and secondary lipid oxidation products, 2,4-decadienal and hexanal, to examine the level of oxidation as lipid oxidation could affect the acceptance and nutritional quality of a diet [
21]. The measurement of secondary oxidation products was done by gas chromatography (Agilent 7890) at Kemin Nutrisurance Customer Lab Services (Des Moines, IA, USA). Five grams of sample and 11 mL of ethyl acetate were mixed in centrifuge tubes by vortex and then centrifuged for 5 min at 3500 RPM. The supernatant was transferred into vials and submitted for analysis.
2.3. Acceptance Testing
2.3.1. Dry Diets
The dry food Monadic acceptance study was arranged in a 4×4 Latin square design using a total of 20 adult Beagle dogs (10 males and 10 females, body weight 8 to 17 kg) assigned to the 4 dietary treatments (0, 120, 200, or 500 ppm OE) across four 5-day feeding periods at Summit Ridge Farms (Susquehanna, PA, USA). On each day of the feeding period, 400 ± 1 g of each diet was offered to every dog and the amount of remaining kibble was weighed back at the end of each day’s feeding session. Food consumption was calculated as the difference between offered and leftover diet. Dogs had free access to water at all times. The percent acceptance was a calculation that determined the proportion of the ration consumed relative to the total amount provided as shown below.
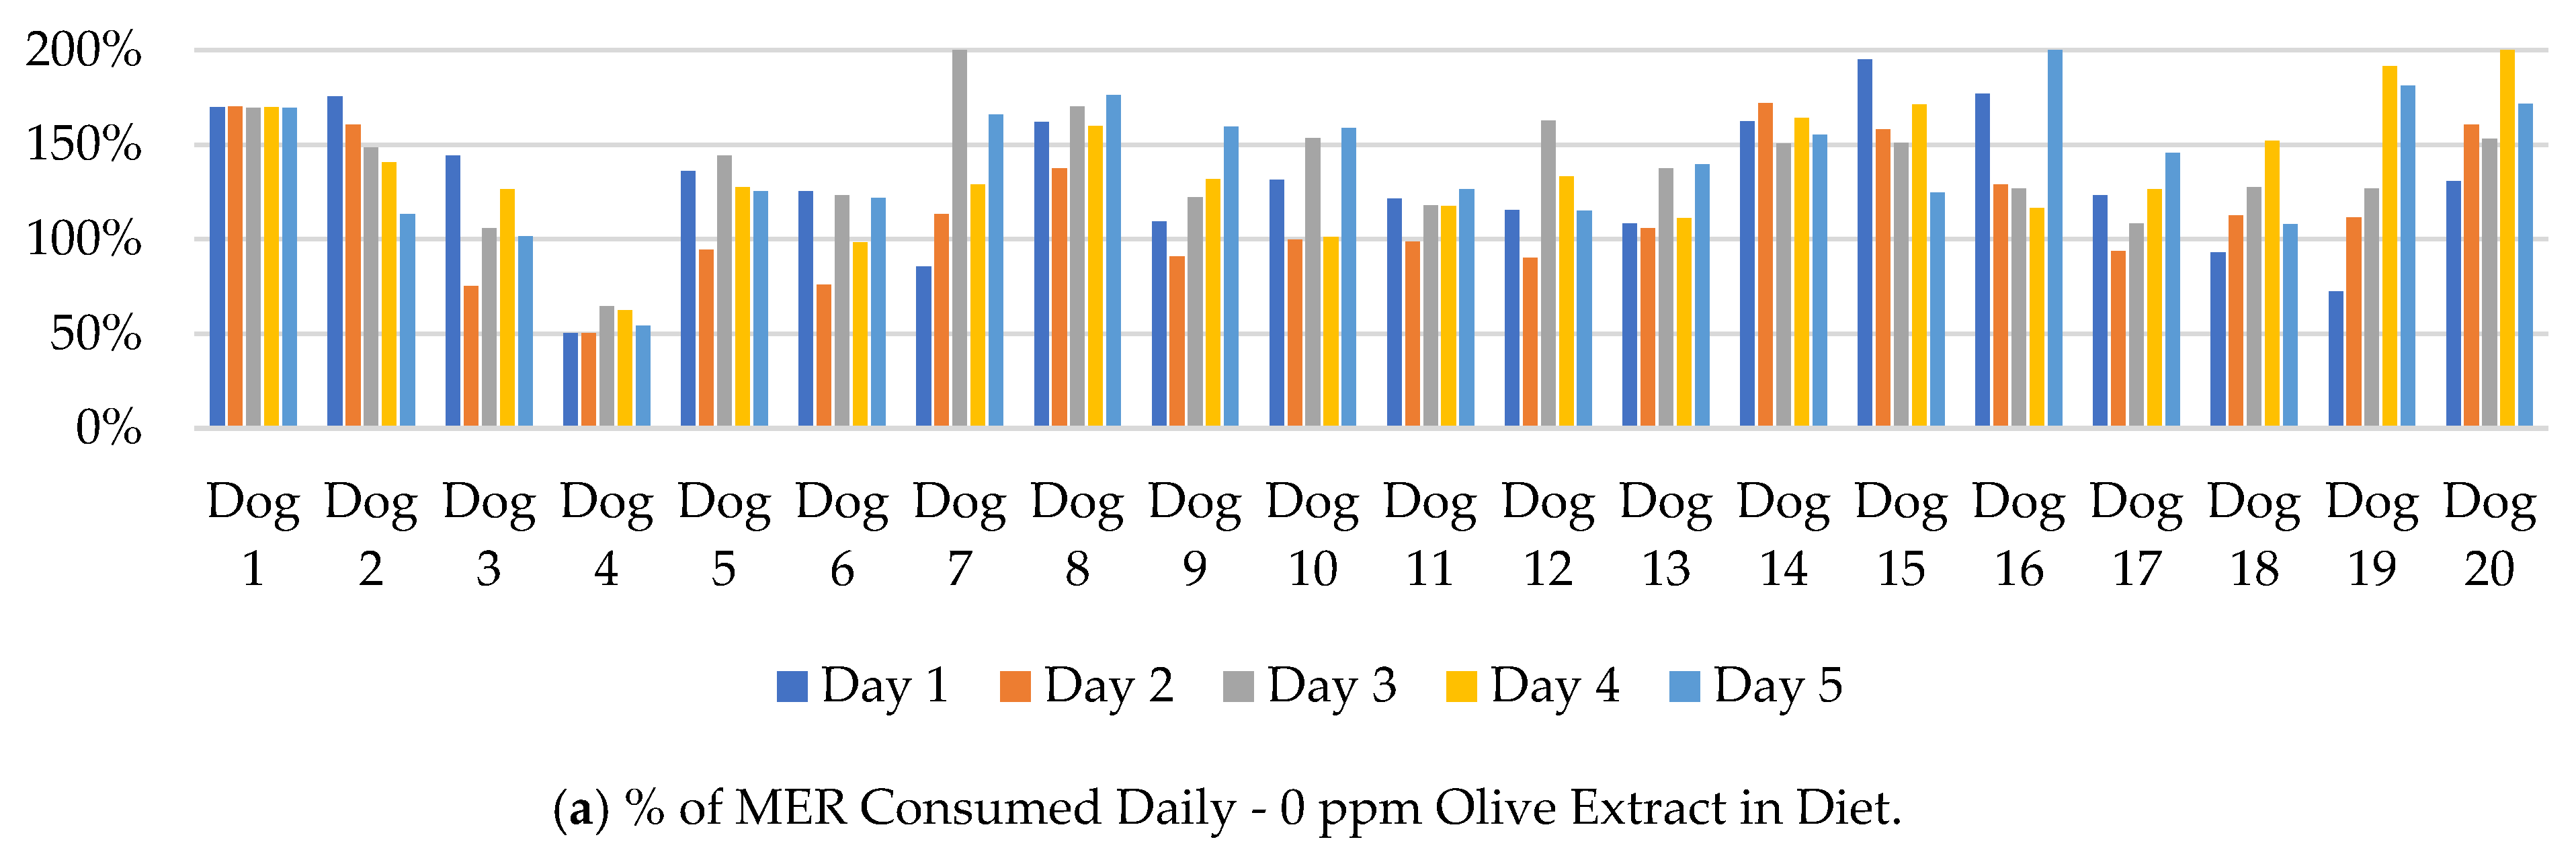
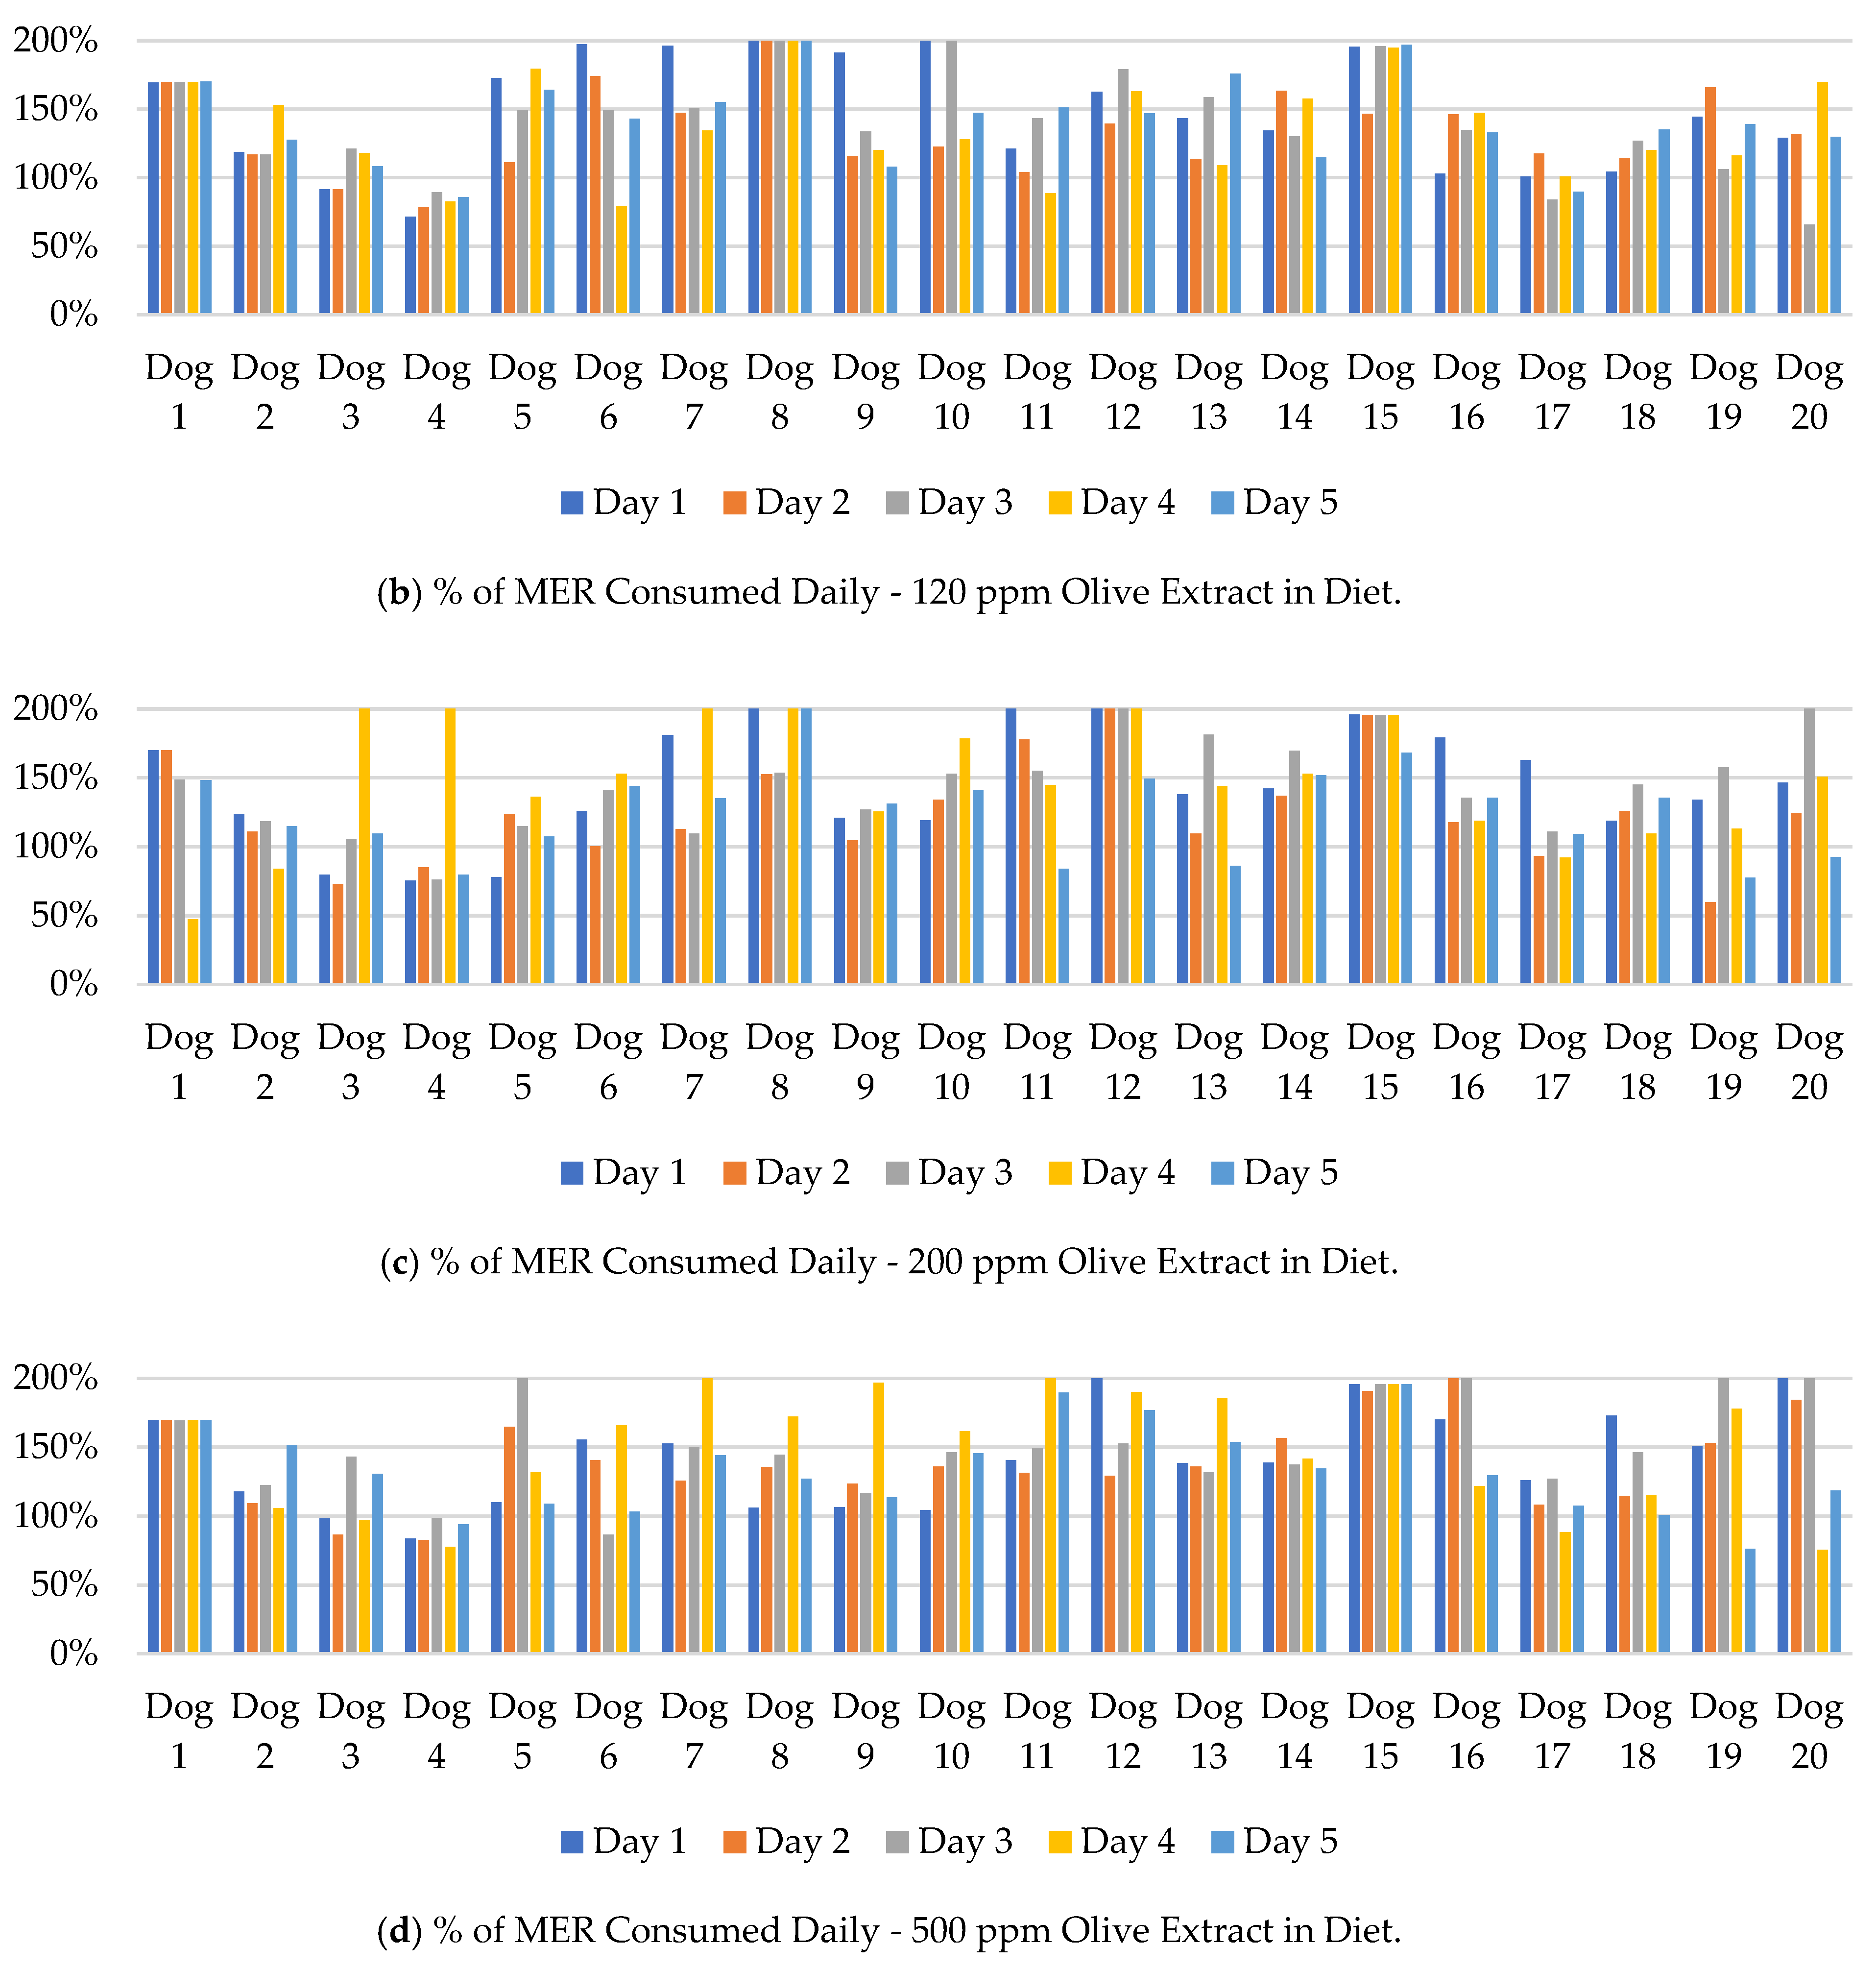
The mass of ration consumed by each dog was compared to their daily metabolic energy requirements (MER). The results are shown in
Figure 1. The MER was calculated using the National Resource Council (NRC) equation for moderately active laboratory animals as shown in the equation [
14]:
2.3.2. Wet Food
The wet food acceptance feeding trial was conducted at Kennelwood Inc. (Champaign, IL, USA). A 4×4 Latin square design was used for the study. Each feeding period was 5 days. A total of 16 adult beagles (7 males and 9 females) were included. Each dog was offered 2 cans of the assigned treatment canned food per day as a treat for a total of 1120 g over the 5 days while Purina Dog Chow (St. Louis, MO, USA) was fed to maintain body weight. The weights of canned foods consumed every day were recorded and the percent acceptance calculated as in equation 5. All dogs had free access to water.
2.4. Statistical Analysis
Food consumption data was analyzed using the following model:
wherein Y
ijklm is the response variable, μ is the general mean, D
i is the fixed effect of OE inclusion at the ith level (0, 120, 200, or 500 ppm), T
j is the fixed effect of timepoint at the jth level (days 1 to 5), (D×T) is the interaction of OE inclusion and timepoint, C
k is the random effect of individual animals at the kth level (k = dogs 1 to 20), P
l is the random effect of feeding period (l = 1 through 4), and e
ijklm is the associated error. This model was implemented in R (v4.3.3) using the lme4 package (v1.1-35.5) with residual assessment to evaluate model assumptions. No data points were excluded from analysis. Comparisons within each fixed effect were evaluated using the emmeans package (v1.10.5) to identify differences underlying the
P value provided for each fixed effect. Least squares means were separated using Tukey’s method for multiple comparisons.
Linear and quadratic contrasts were performed to evaluate any trends in feed consumption with increasing OE inclusion. Contrast coefficients were calculated in base R as OE inclusions were unevenly spaced and implemented in a model evaluating only the effect of inclusion within each feeding day or the 5-day average food consumption. For mixed model analysis and linear/quadratic contrasts, statistically significant outcomes were denoted at P ≤ 0.05.
3. Results and Discussion
3.1. Olive Extract Flavor Characterization
The GC-MS analysis of the OE identified 137 volatile compounds, with the largest represented groups being alcohols (n=33) and esters (n=30). The 15 most abundant compounds were measured for concentration and reported on a dry matter basis, as listed in
Table 3. The two most concentrated compounds reported were acetic acid and tyrosol. Results from quantification by HPLC of 4 samples from the OE lot used for the study ranged from 2258 to 2404 ppm (
Table 4)
. In accordance with the current study, previous research has reported olive to contain hydroxytyrosol, which is considered pungent and bitter tasting [
22].
There was some limitation on the accuracy of compound concentrations in the current study as the results would be more accurate with the use of a chiral column and/or isometric standards for all the targeted compounds. However, standards were not available for all compounds due to study constraints.
3.2. Analysis of Treatment Dry Foods
All diets were similar in chemical composition and caloric density (
Table 5), indicating low risk of interference on palatability from macro-/micronutrients. The oxidation markers measured were also similar for all diets. The reported levels were below the AOCS guidelines as indicators of lipid oxidation [
23].
3.3. Acceptance Testing for Dry Food Applications
The average consumption of the treatment diets ranged from 60.1 to 65.1% the amount of the offered diets (
Table 6). No significant interaction between timepoint and treatment was observed (
P = 0.40). The main effect of timepoint was determined to be significant (
P = 0.005) with food consumption on day 2 being 9, 10, and 9% lower than days 1, 3, and 4, respectively, regardless of OE inclusion. While the dogs did not eat all of the diet offered, the calories consumed were calculated for each meal and are shown in
Figure 1. For the 100 feedings of each treatment over the study, 84, 88, 84, and 88% of the 0, 120, 200, and 500 ppm diets, respectively, were consumed at over 99% of the MER for each dog. The average caloric consumption over each 5-day treatment period was more than 99% of the MER for each dog except Dog 4. Dog 4 averaged a consumption of less than 99% of the calculated MER for 3 of the 4 treatments: 0 ppm (56%), 120 ppm (82%), and 500 ppm (87%; data not shown).
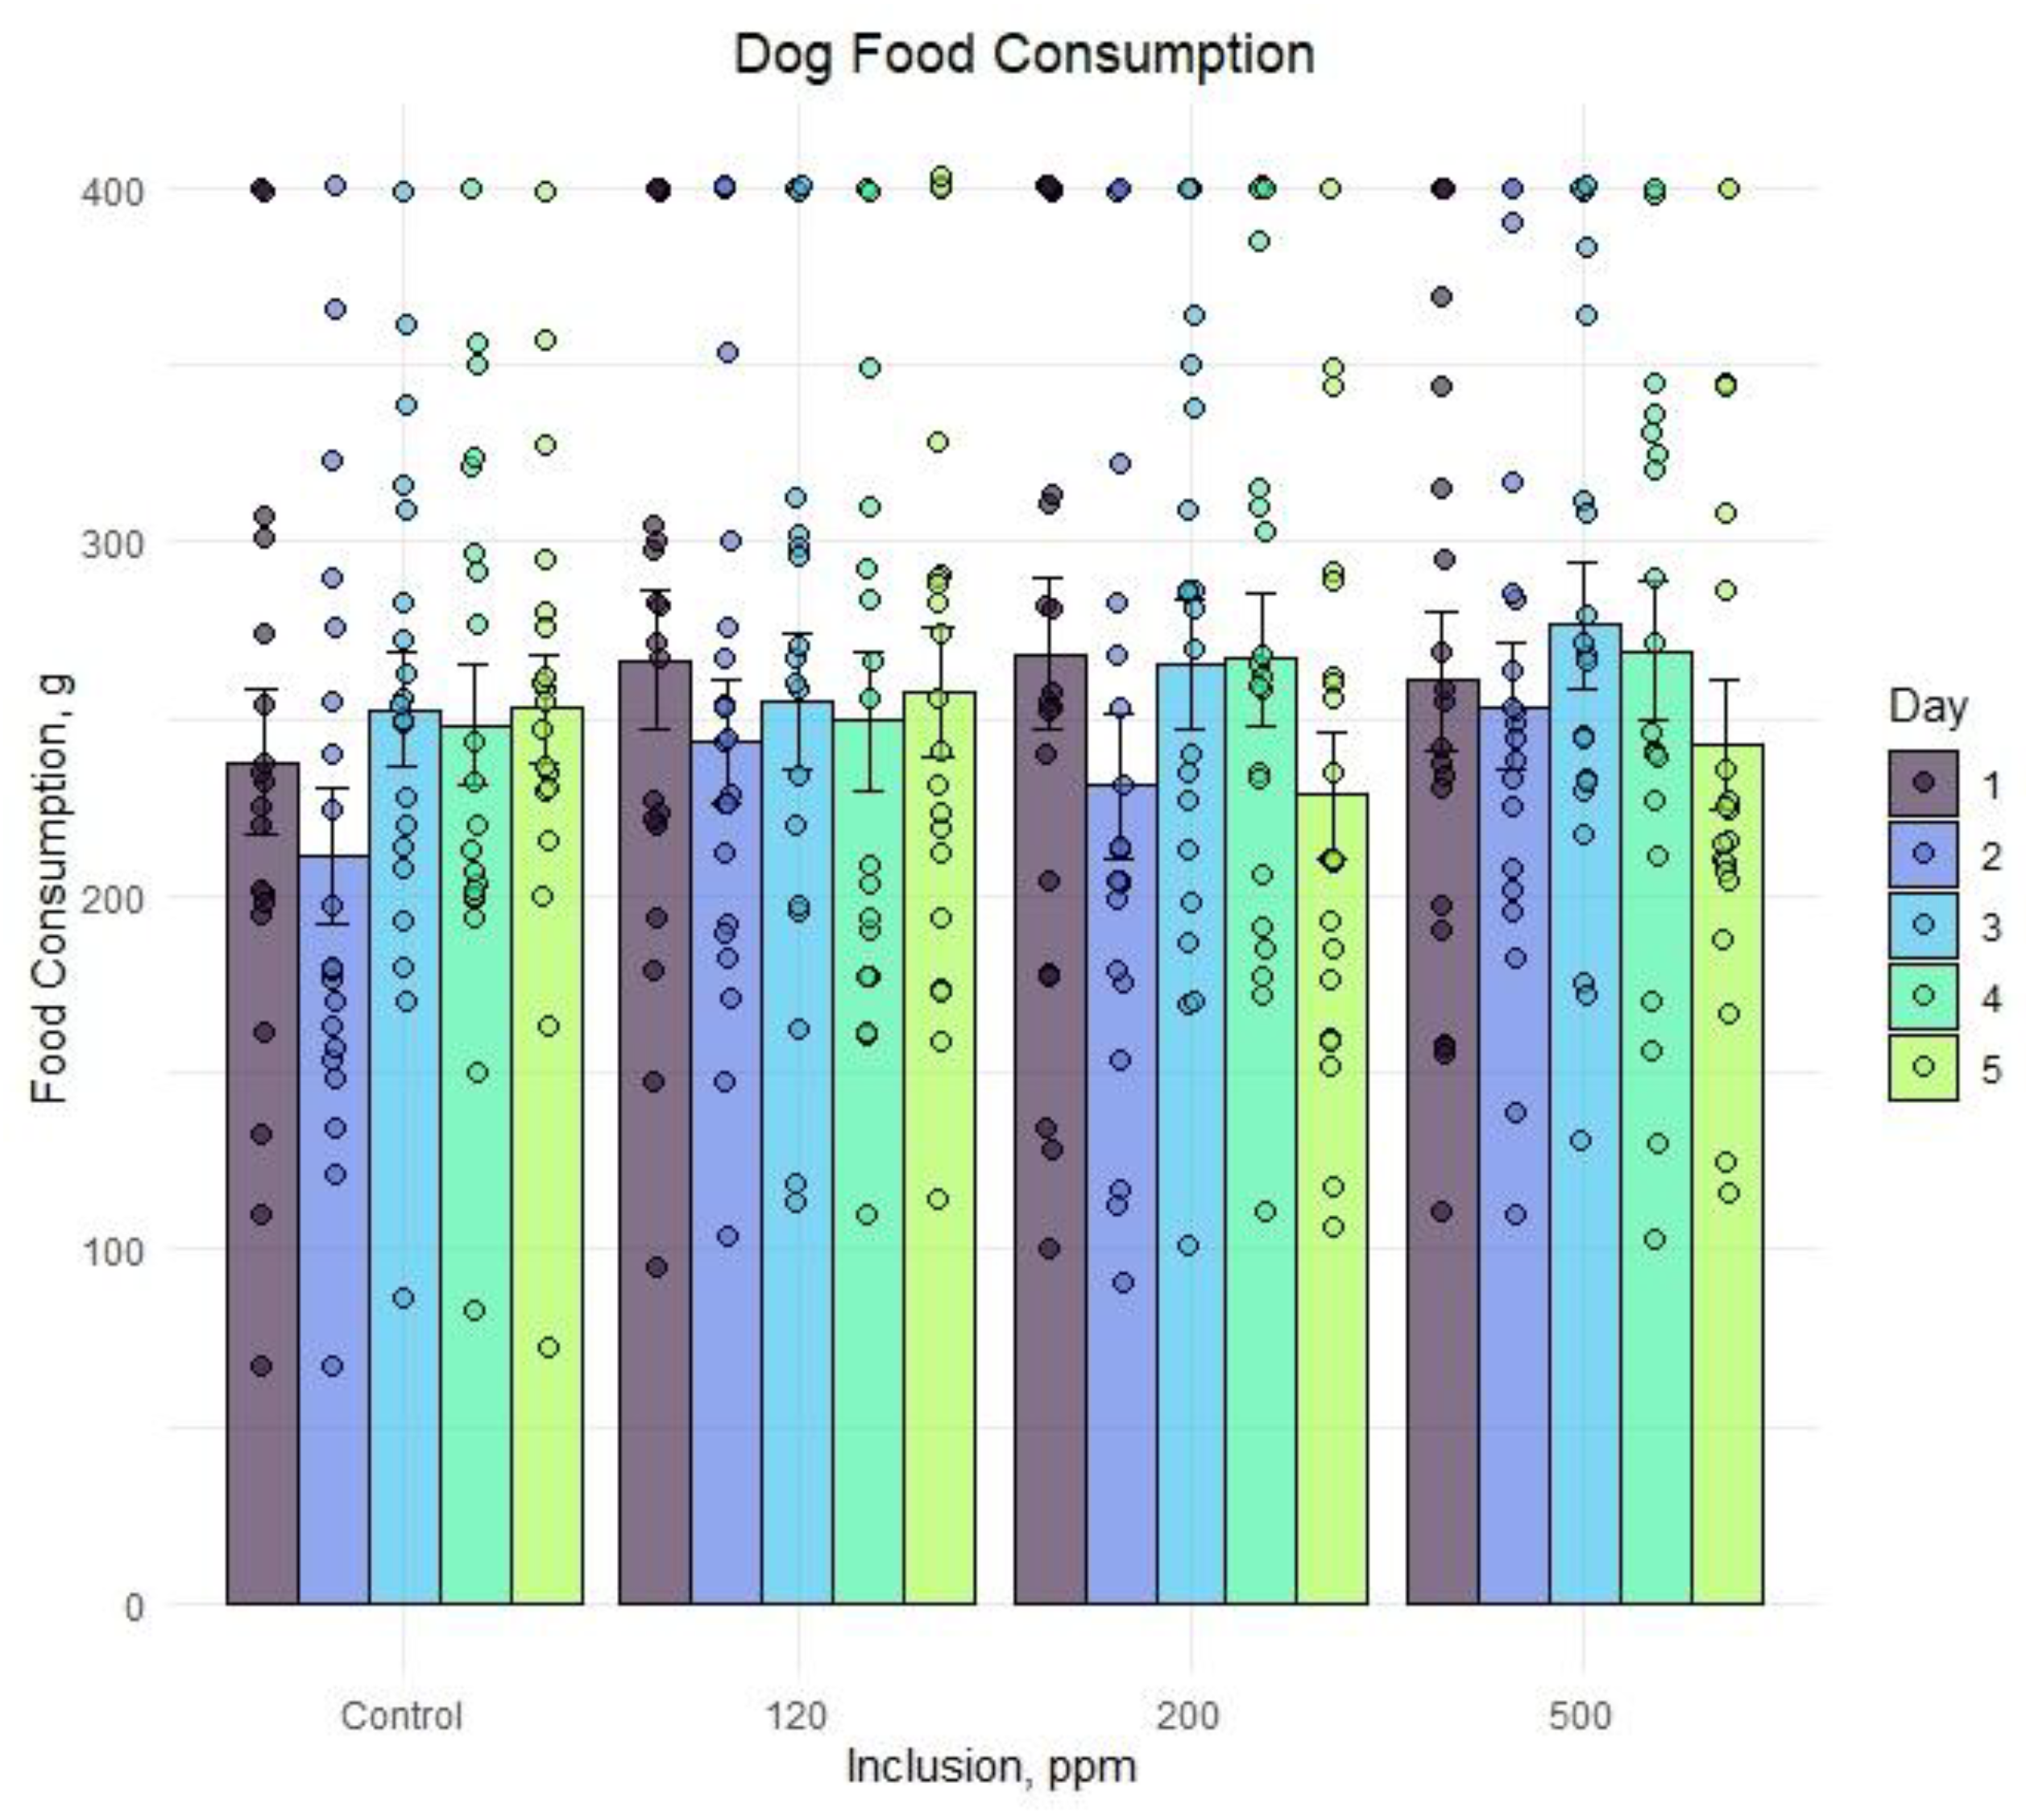
Figure 2 displays individual dog food consumption alongside the mean and standard error for each day and OE inclusion. A numeric drop in feed consumption was observed across all groups on day 2 but did not persist through the duration of the feeding period. Feed consumption within each group ranged from less than 100 g to the complete 400 g ration being consumed on a given day. Any significant results associated with study timepoint were likely due to individual animal variation and not associated with OE inclusion.
Table 7 demonstrates the outputs and
P-values for the linear and quadratic contrasts performed to evaluate if increasing OE inclusion was associated with dog food consumption trends. The intercept is the base feed consumption when OE inclusion is 0 ppm (control) and the estimates are the unit of change attributed to increasing OE inclusion for each contrast. No significant differences were observed for food consumption within each day or for the 5-day study average. This combined with the small magnitude of change associated with increasing inclusion (
Table 7) indicated that OE from 120 to 500 ppm was neither a significant driver nor deterrent for canine food acceptance.
1 Olive extract was applied as part of a liquid palatant at 0, 120, 200, and 500 ppm coated onto kibble. 2 Linear contrast coefficients were calculated in base R: -205, -85, -5, 295. 3 Quadratic contrast coefficients were calculated in base R: 7950, -26850, -34050, 52950.
3.4. Acceptance Testing for Wet Food Applications
All treatment wet foods had similar chemical composition (
Table 8) and, therefore, macro-/micronutrient content should not confound the palatability data. Each dog was fed a total of 1120 g of canned food over every 5-day treatment period and all offering was completely consumed (data not shown). Statistics were not performed as there was no difference in consumption rate among treatments. The results from the canned food acceptance support findings from dry diet acceptance tests, showing that the inclusion of OE does not deter the food acceptance for dogs.
1 n.d.: not detected.
4. Conclusions
Olive extract is a novel ingredient for pet foods and contains characteristic aromatic compounds that could be used as a flavor in dog foods. Testing showed high acceptance for all treatment foods, suggesting that adding olive extract to dry or canned foods at 120 to 500 ppm did not alter the dogs’ interest in consumption of the foods.
Author Contributions
Conceptualization, R.G. and K.F.-C.; formal analysis, K.F.-C.; investigation, R.G.; data curation, C.H., A.G., X.H., M.W., and K.R.; writing—original draft preparation, R.G., C.H., X.H., M.W., and A.G.; writing—review and editing, R.G., C.H., K.F.-C., X.H., M.W., K.R., and A.G.; project administration, C.H., A.G., X.H., M.W, and K.R. All authors have read and agreed to the published version of the manuscript.
Funding
This research was funded by Kemin Inc.
Institutional Review Board Statement
Ethical review and approval for this study fell under the umbrella protocols of day-to-day palatability and acceptance feeding studies. No further consideration for animal welfare was deemed necessary as no biological samples were collected from the animals and feeding was considered short-term.
Data Availability Statement
The data presented in this study are available on request from the corresponding author. Information or data may not be available if deemed confidential, intellectual property of Kemin.
Acknowledgments
We thank Ewa Fuller, Alex Odufu, Floriano Finco, and Ben Dankle for their support on the study.
Conflicts of Interest
All authors are employed by Kemin Inc.
Abbreviations
The following abbreviations are used in this manuscript:
| OE |
Olive extract |
| HS-SPME |
Headspace solid-phase microextraction |
| GC |
Gas chromatography |
| Q-TOF |
Quadrupole time-of-flight |
| MS |
Mass spectrometry |
| HPLC |
High-pressure liquid chromatography |
| MER |
Metabolic energy requirement |
| NRC |
National Research Council |
| SEM |
Standard error of mean |
References
- O’Brien, J.S.; Tolbert, M.K.; Dog Aging Project Consortium; Ruple, A. Dog and owner demographics impact dietary choices in Dog Aging Project cohort. J. Am. Vet. Med. Assoc. 2024, 262(12), 1676–1685. [CrossRef] [PubMed]
- ‘Premiumization’ of Pet Food Continues as Consumers Seek Healthy, Sustainable Options. U.S. FOODLINK. 2023, 19, 1-2. Available online: https://www.foodexport.org/wp-content/uploads/march-april-2023-us-foodlink-newsletter.pdf (accessed on 31/12/2024).
- White, B.L. Insights-driven development of humanized foods for pets. Meat Muscle Biol. 2022, 6, 14397. [Google Scholar] [CrossRef]
- Petcu, C.D.; Mihai, O.D.; Tăpăloagă, D.; Gheorghe-Irimia, R.-A.; Pogurschi, E.N.; Militaru, M.; Borda, C.; Ghimpețeanu, O.-M. Effects of plant-based antioxidants in animal diets and meat products: a review. Foods 2023, 12, 1334. [Google Scholar] [CrossRef] [PubMed]
- Guo, X.; Wang, Y.; Zhu, Z.; Li, L. The role of plant extracts in enhancing nutrition and health for dogs and cats: safety, benefits, and applications. Vet. Sci. 2024, 11, 426. [Google Scholar] [CrossRef] [PubMed]
- Commission Implementing Regulation (EU) 2024/1068 of 12 April 2024 concerning the authorisation of a preparation of rosemary extract as a feed additive for cats and dogs. Available online: http://data.europa.eu/eli/reg_impl/2024/1068/oj (accessed on 26/12/2024).
- Mata-Bilbao Mde L, Andrés-Lacueva C, Roura E, et al. Absorption and pharmacokinetics of grapefruit flavanones in beagles. Br J Nutr. 2007; 98(1):86-92. [CrossRef]
- Martineau AS, Leray V, Lepoudere A, et al. A mixed grape and blueberry extract is safe for dogs to consume. BMC Vet Res. 2016; 12(1):162. [CrossRef]
- Kapetanovic, I.M.; Crowell, J.A.; Krishnaraj, R.; Zakharov, A.; Lindeblad, M.; Lyubimov, A. Exposure and toxicity of green tea polyphenols in fasted and non-fasted dogs. J. Toxicol. 2009, 260, 28–36. [Google Scholar] [CrossRef] [PubMed]
- Silva, A.F.R.; Resende, D.; Monteiro, M.; Coimbra, M.A.; Silva, A.M.S.; Cardoso, S.M. Application of hydroxytyrosol in the functional foods field: from ingredient to dietary supplements. Antioxidants 2020, 9, 1246. [Google Scholar] [CrossRef] [PubMed]
- Thomas, D.G.; Dyer, P.; Andrews, C.J. The effect of dietary olive polyphenols on markers of inflammation and bodyweight in senior domestic cats. J. Appl. Anim. Nutr. 2024, 12, 29–39. [Google Scholar] [CrossRef]
- Blekas, G.; Vassilakis, C.; Harizanis, C.; Tsimidou, M.; Boskou, D.G. Biophenols in table olives. J. Agric. Food Chem. 2002, 50, 3688–3692. [Google Scholar] [CrossRef] [PubMed]
- Kiritsakis, A.K. Flavor components of olive oil—A review. J. Amer. Oil Chem. Soc. 1998, 75, 673–681. [Google Scholar] [CrossRef]
- Kokemuller, C. (Kemin Inc., Des Moines, IA, USA); Shelton, J. (Kemin Inc., Des Moines, IA, USA). Private communication: WP-24-2455 Palatability assessment of olive fruit extract in PALASURANCE® C40-10 for cat, 2024.
- International Olive Council. Method 1: COI/T.20/Doc. No 29/Rev.1 2017. Determination of biophenols in olive oils by HPLC. Available online: https://www.internationaloliveoil.org/wp-content/uploads/2022/06/Doc.-No-29-REV-2_ENK.pdf (accessed on 31/12/2024).
- National Research Council. Nutrient requirements of dogs and cats; National Academies Press: Washington DC, USA, 2006.
- Shantha, N.C.; Decker, E.A. Rapid, sensitive, iron-based spectrophotometric methods for determination of peroxide values of food lipids. J. AOAC Int. 1994, 77, 421–424. [Google Scholar] [CrossRef] [PubMed]
- Nourooz-Zadeh, J.; Tahaddine-Sarmadi, J.; Birlouez-Aragon, I.; and Wolff, S.P. Measurement of hydroperoxides in edible oils using the ferrous oxidation in xylenol orange assay. J. Agric. Food Chem. 1995, 43, 17–21. [Google Scholar] [CrossRef]
- Wolff, S.P. Ferrous ion oxidation in presence of ferric ion indicator xylenol orange for measurement of hydroperoxides. Methods Enzymol. 1994, 19, 182–189. [Google Scholar]
- Yildiz, G.; Wehling, R.L.; Cuppett, S.L. Comparison of four analytical methods for the determination of peroxide value in oxidized soybean oils. J. Am. Oil Chem. Soc. 2003, 80, 103–106. [Google Scholar] [CrossRef]
- Chanadang S., Koppel K., Aldrich G. The impact of rendered protein meal oxidation level on shelf-life, sensory characteristics, and acceptability in extruded pet food. Animals. 2016; 6:44. [CrossRef]
- Martínez, L.; Ros, G.; Nieto, G. Hydroxytyrosol: health benefits and use as functional ingredient in meat. Medicines (Basel) 2018, 5, 13. [Google Scholar] [CrossRef]
- American Oil Chemists’ Society. (2024). Recommended Practices for Assessing Oil Quality and Stability (Cg 3-91), In Official Methods and Recommended Practices of the American Oil Chemists’ Society (2003). AOCS Press, Champaign, IL, USA.
|
Disclaimer/Publisher’s Note: The statements, opinions and data contained in all publications are solely those of the individual author(s) and contributor(s) and not of MDPI and/or the editor(s). MDPI and/or the editor(s) disclaim responsibility for any injury to people or property resulting from any ideas, methods, instructions or products referred to in the content. |
© 2025 by the authors. Licensee MDPI, Basel, Switzerland. This article is an open access article distributed under the terms and conditions of the Creative Commons Attribution (CC BY) license (http://creativecommons.org/licenses/by/4.0/).