
Submitted:
20 January 2025
Posted:
21 January 2025
You are already at the latest version
Abstract
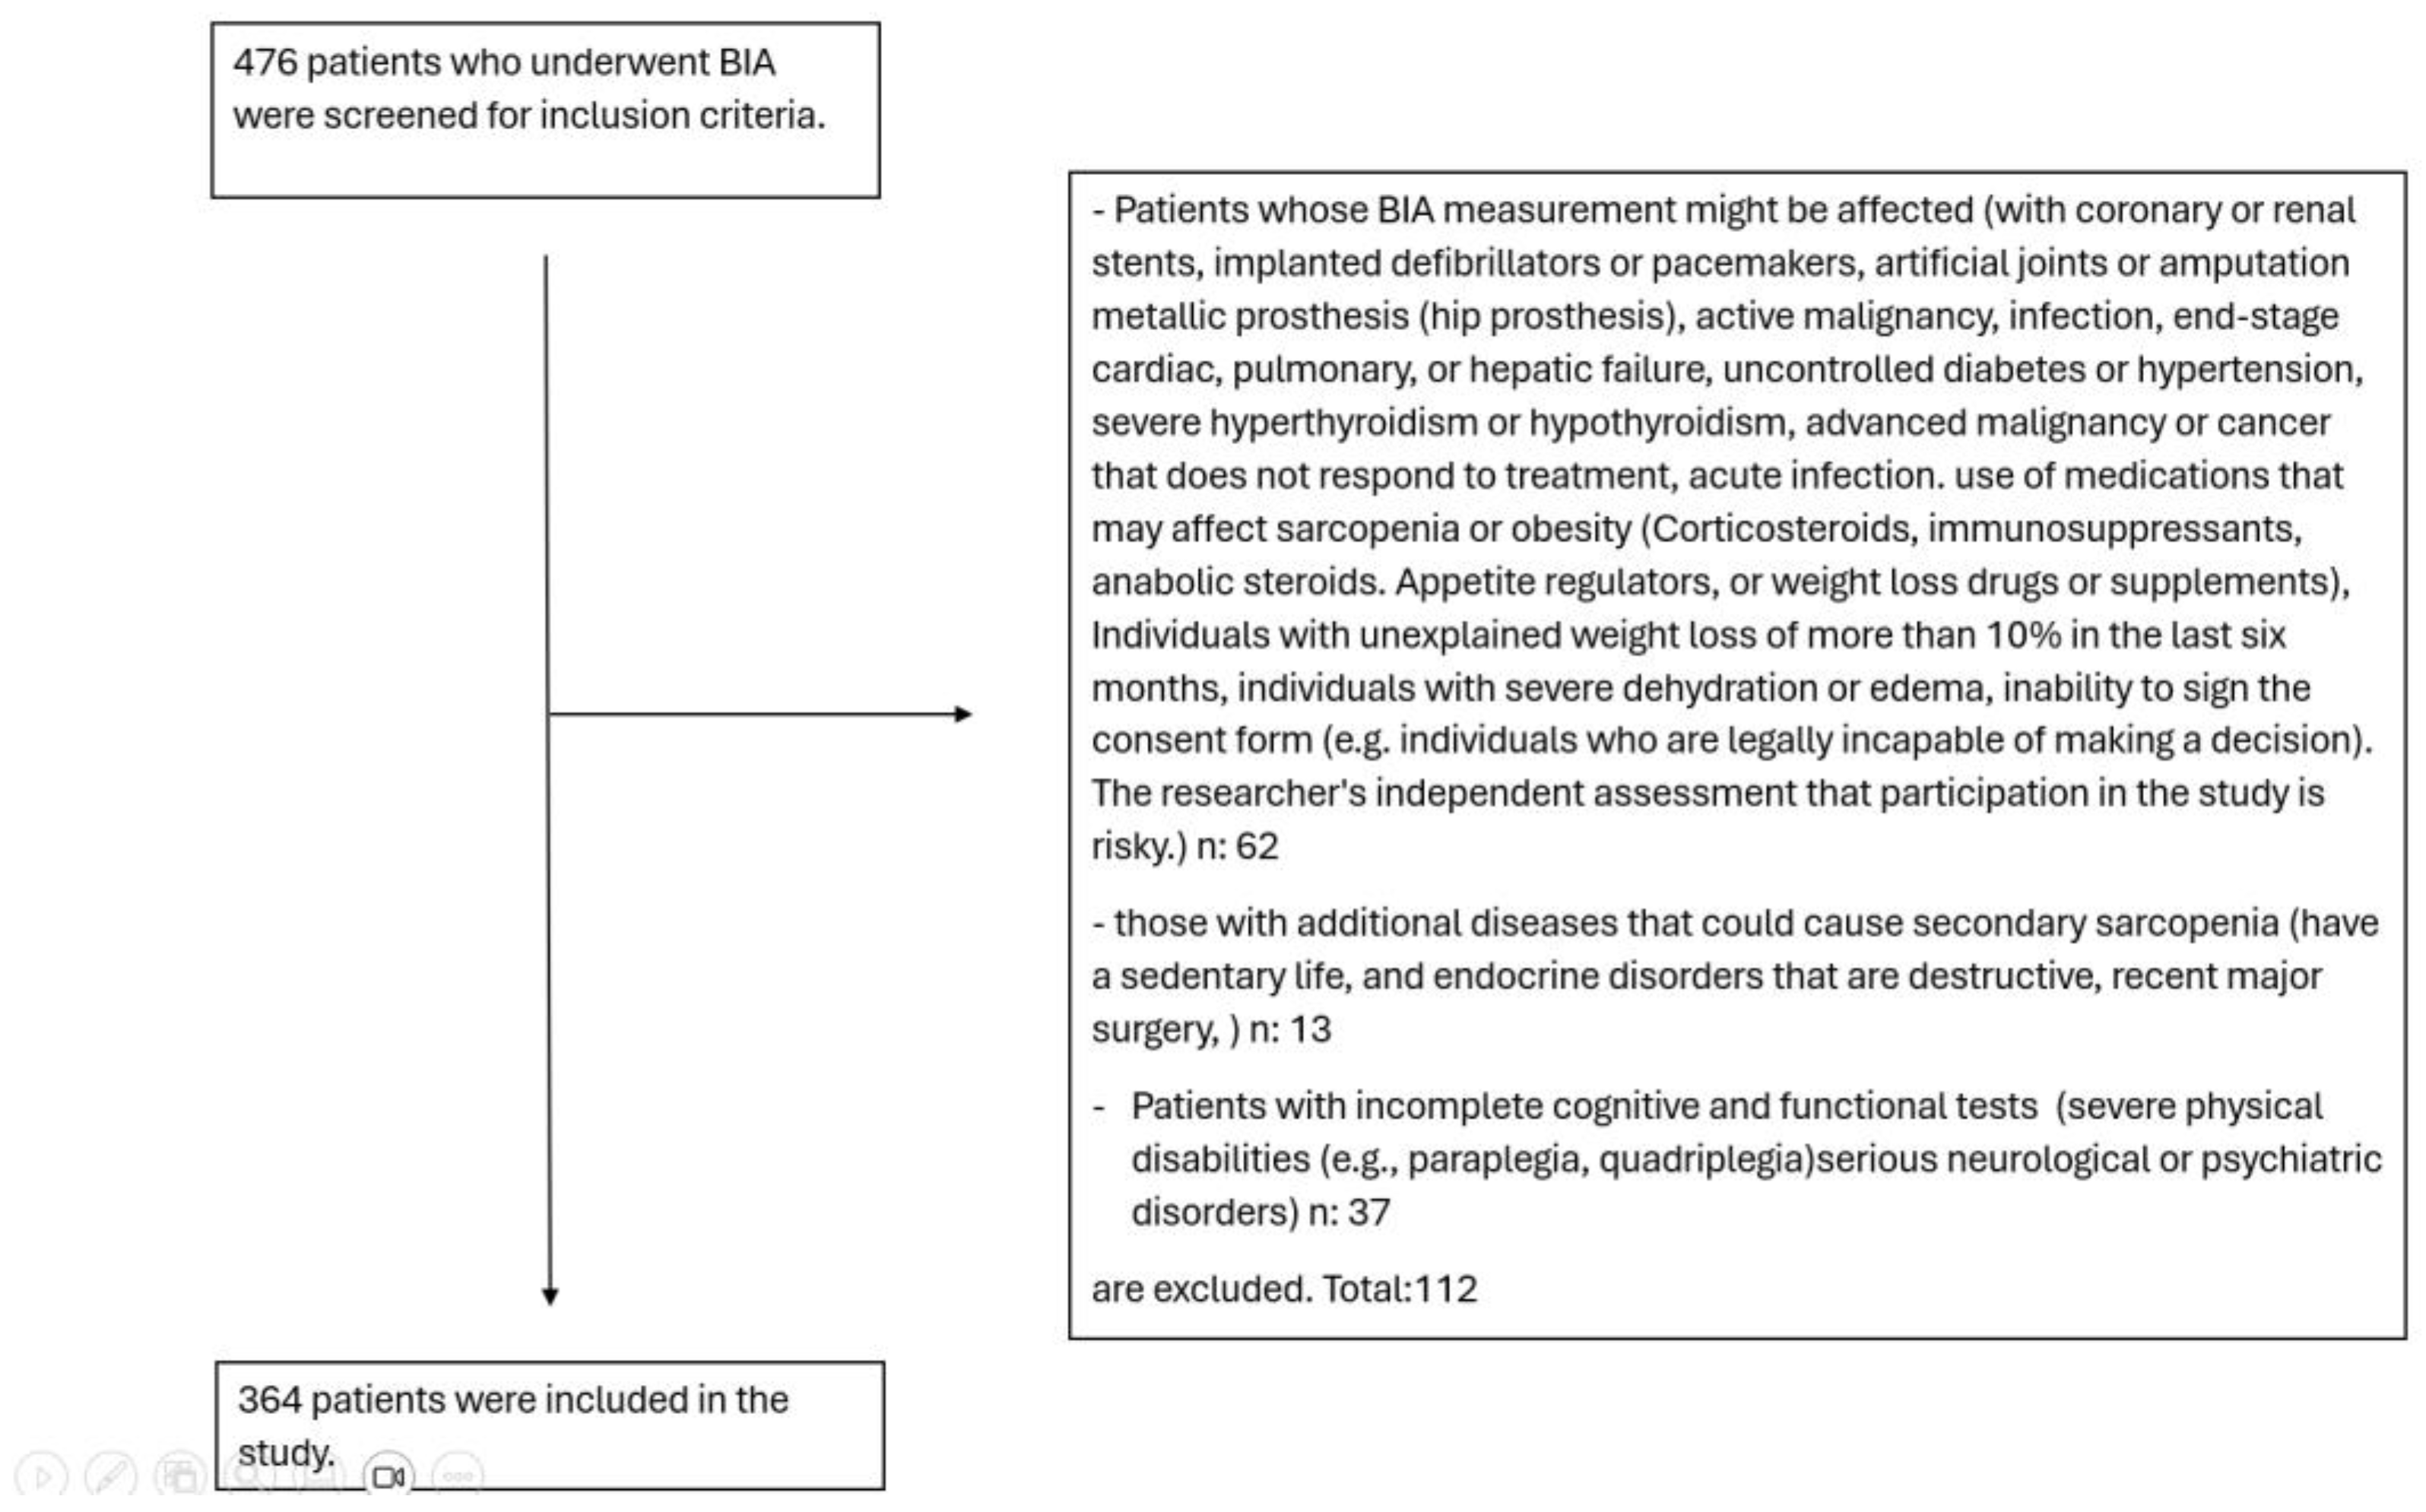
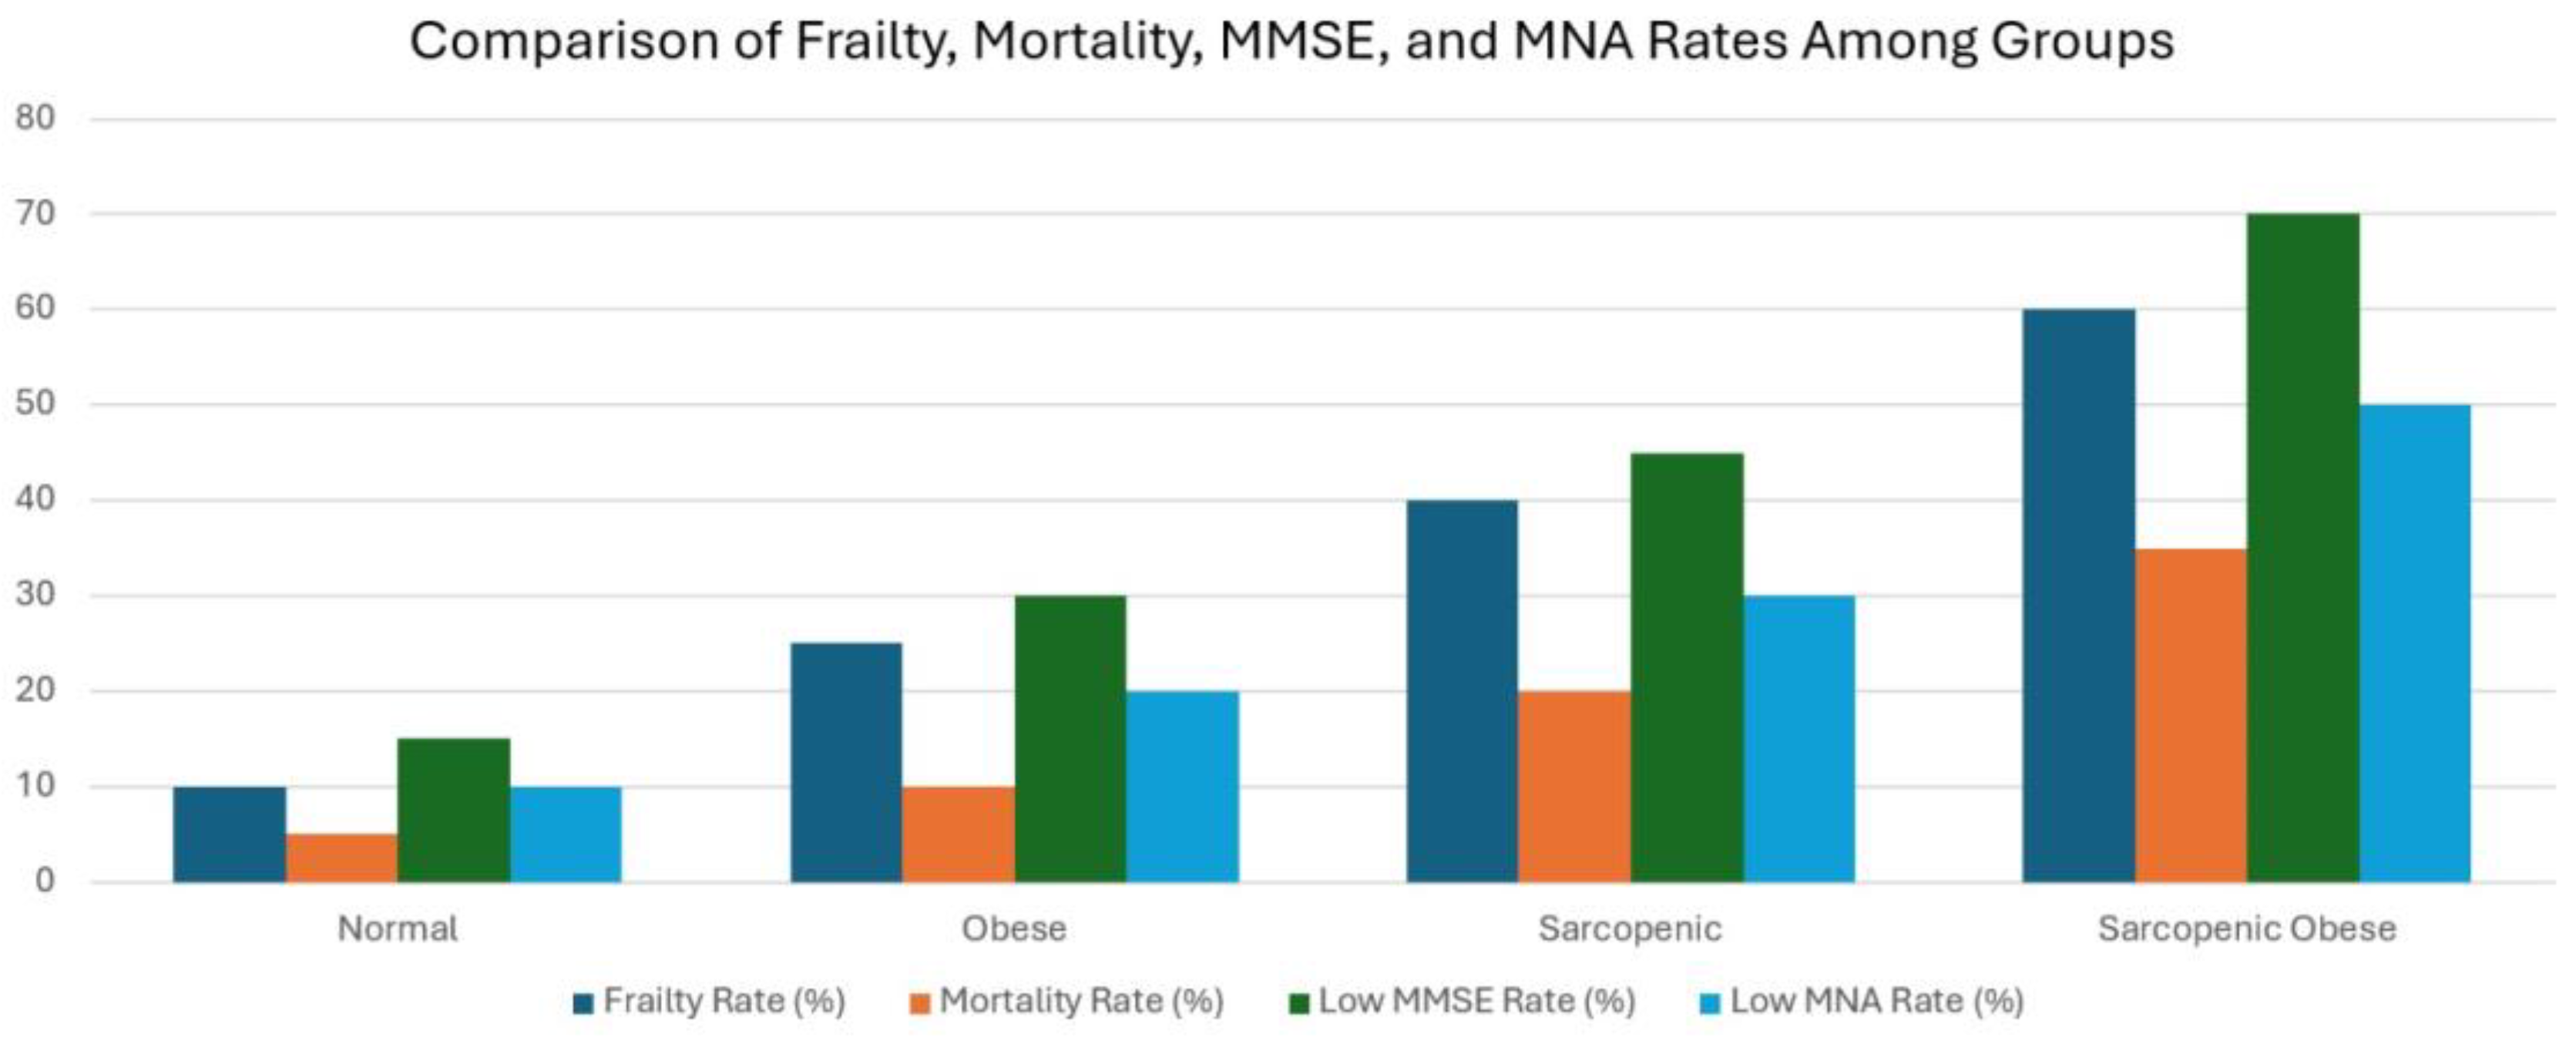
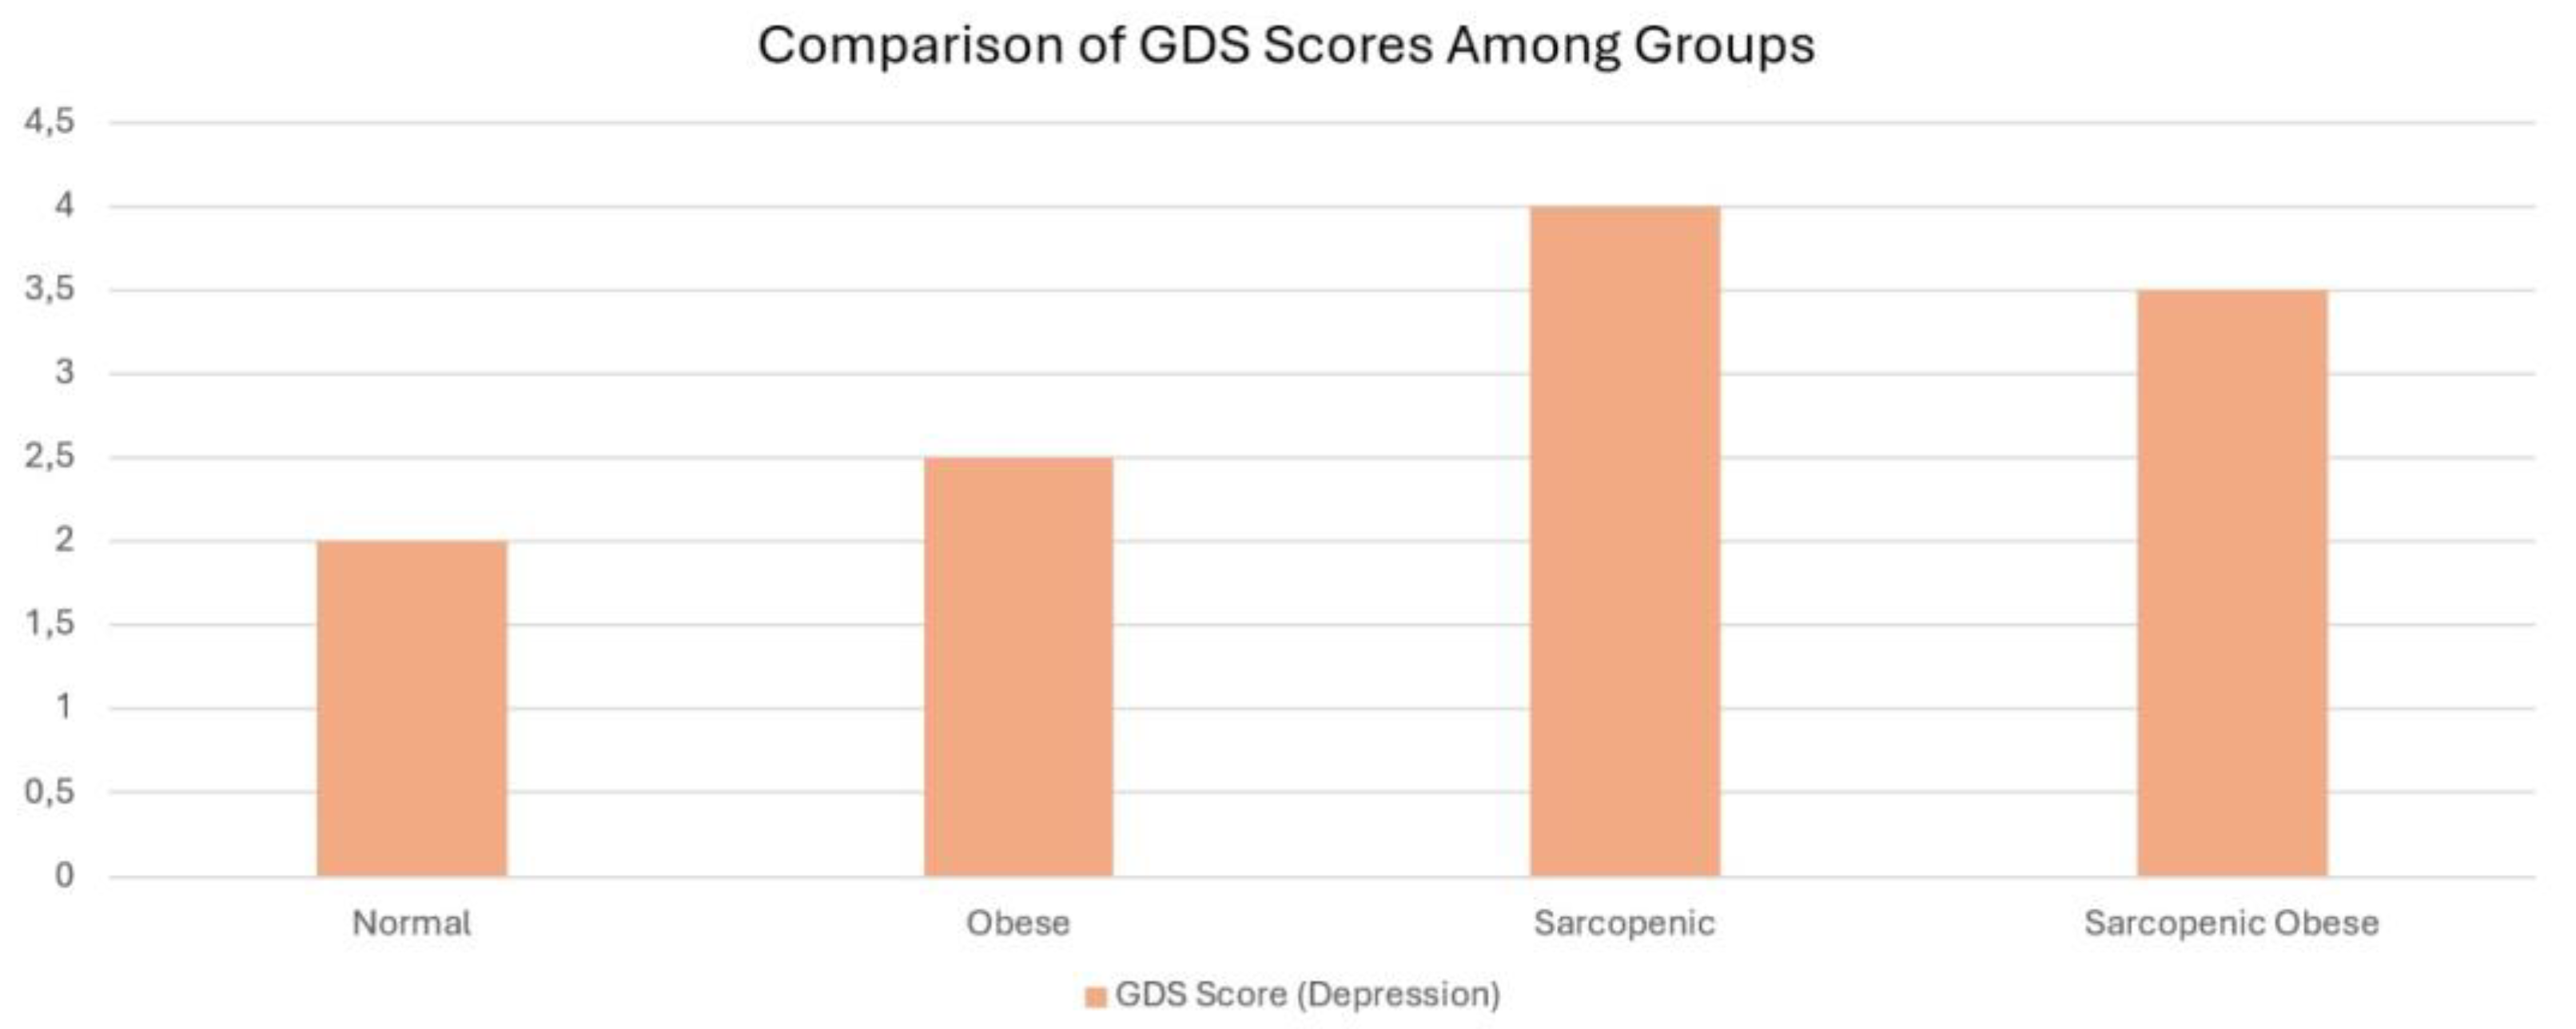
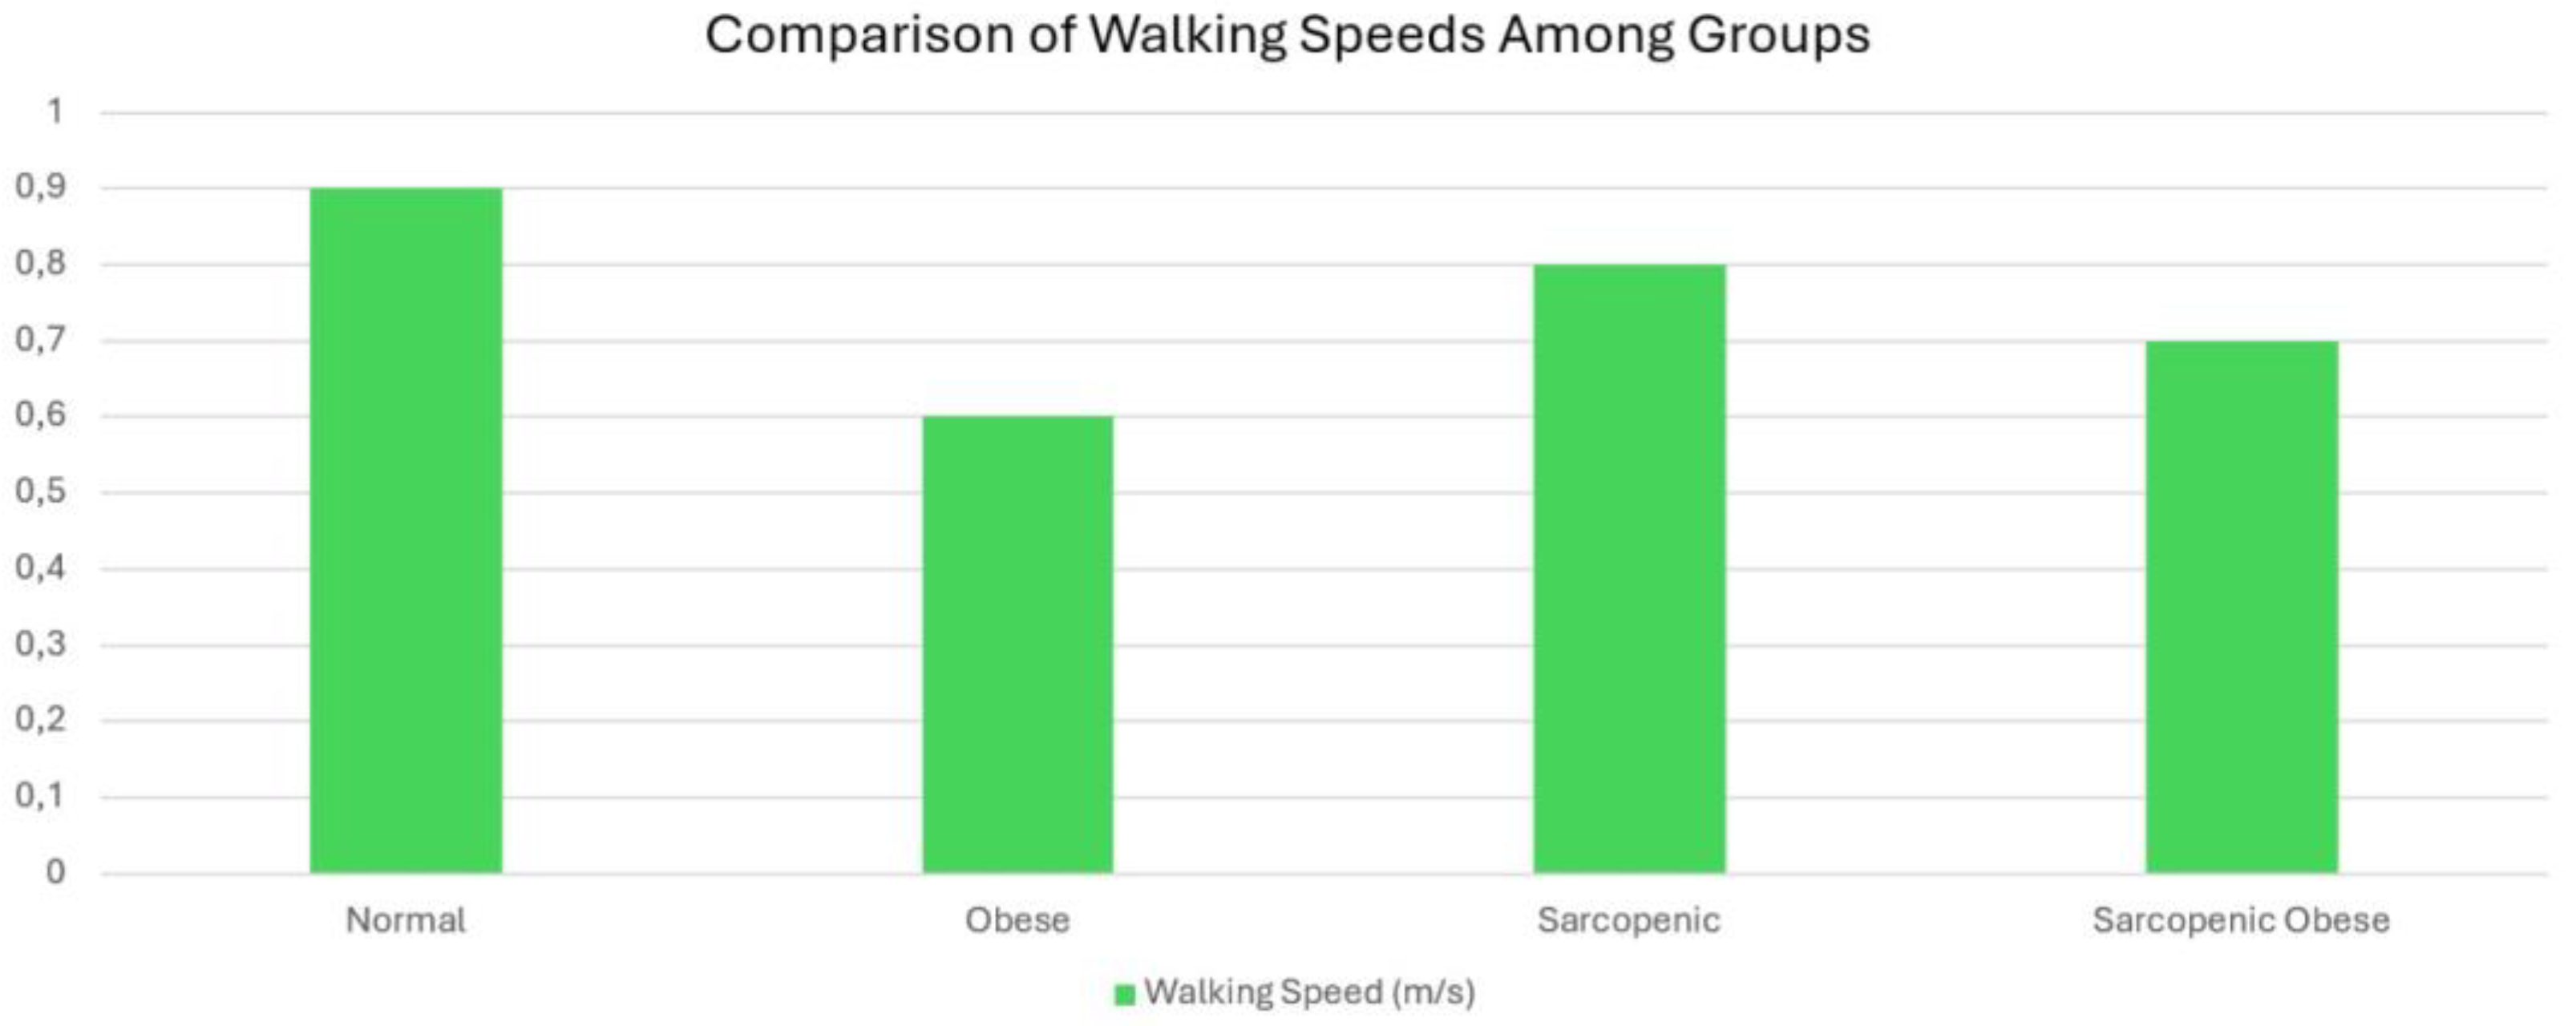
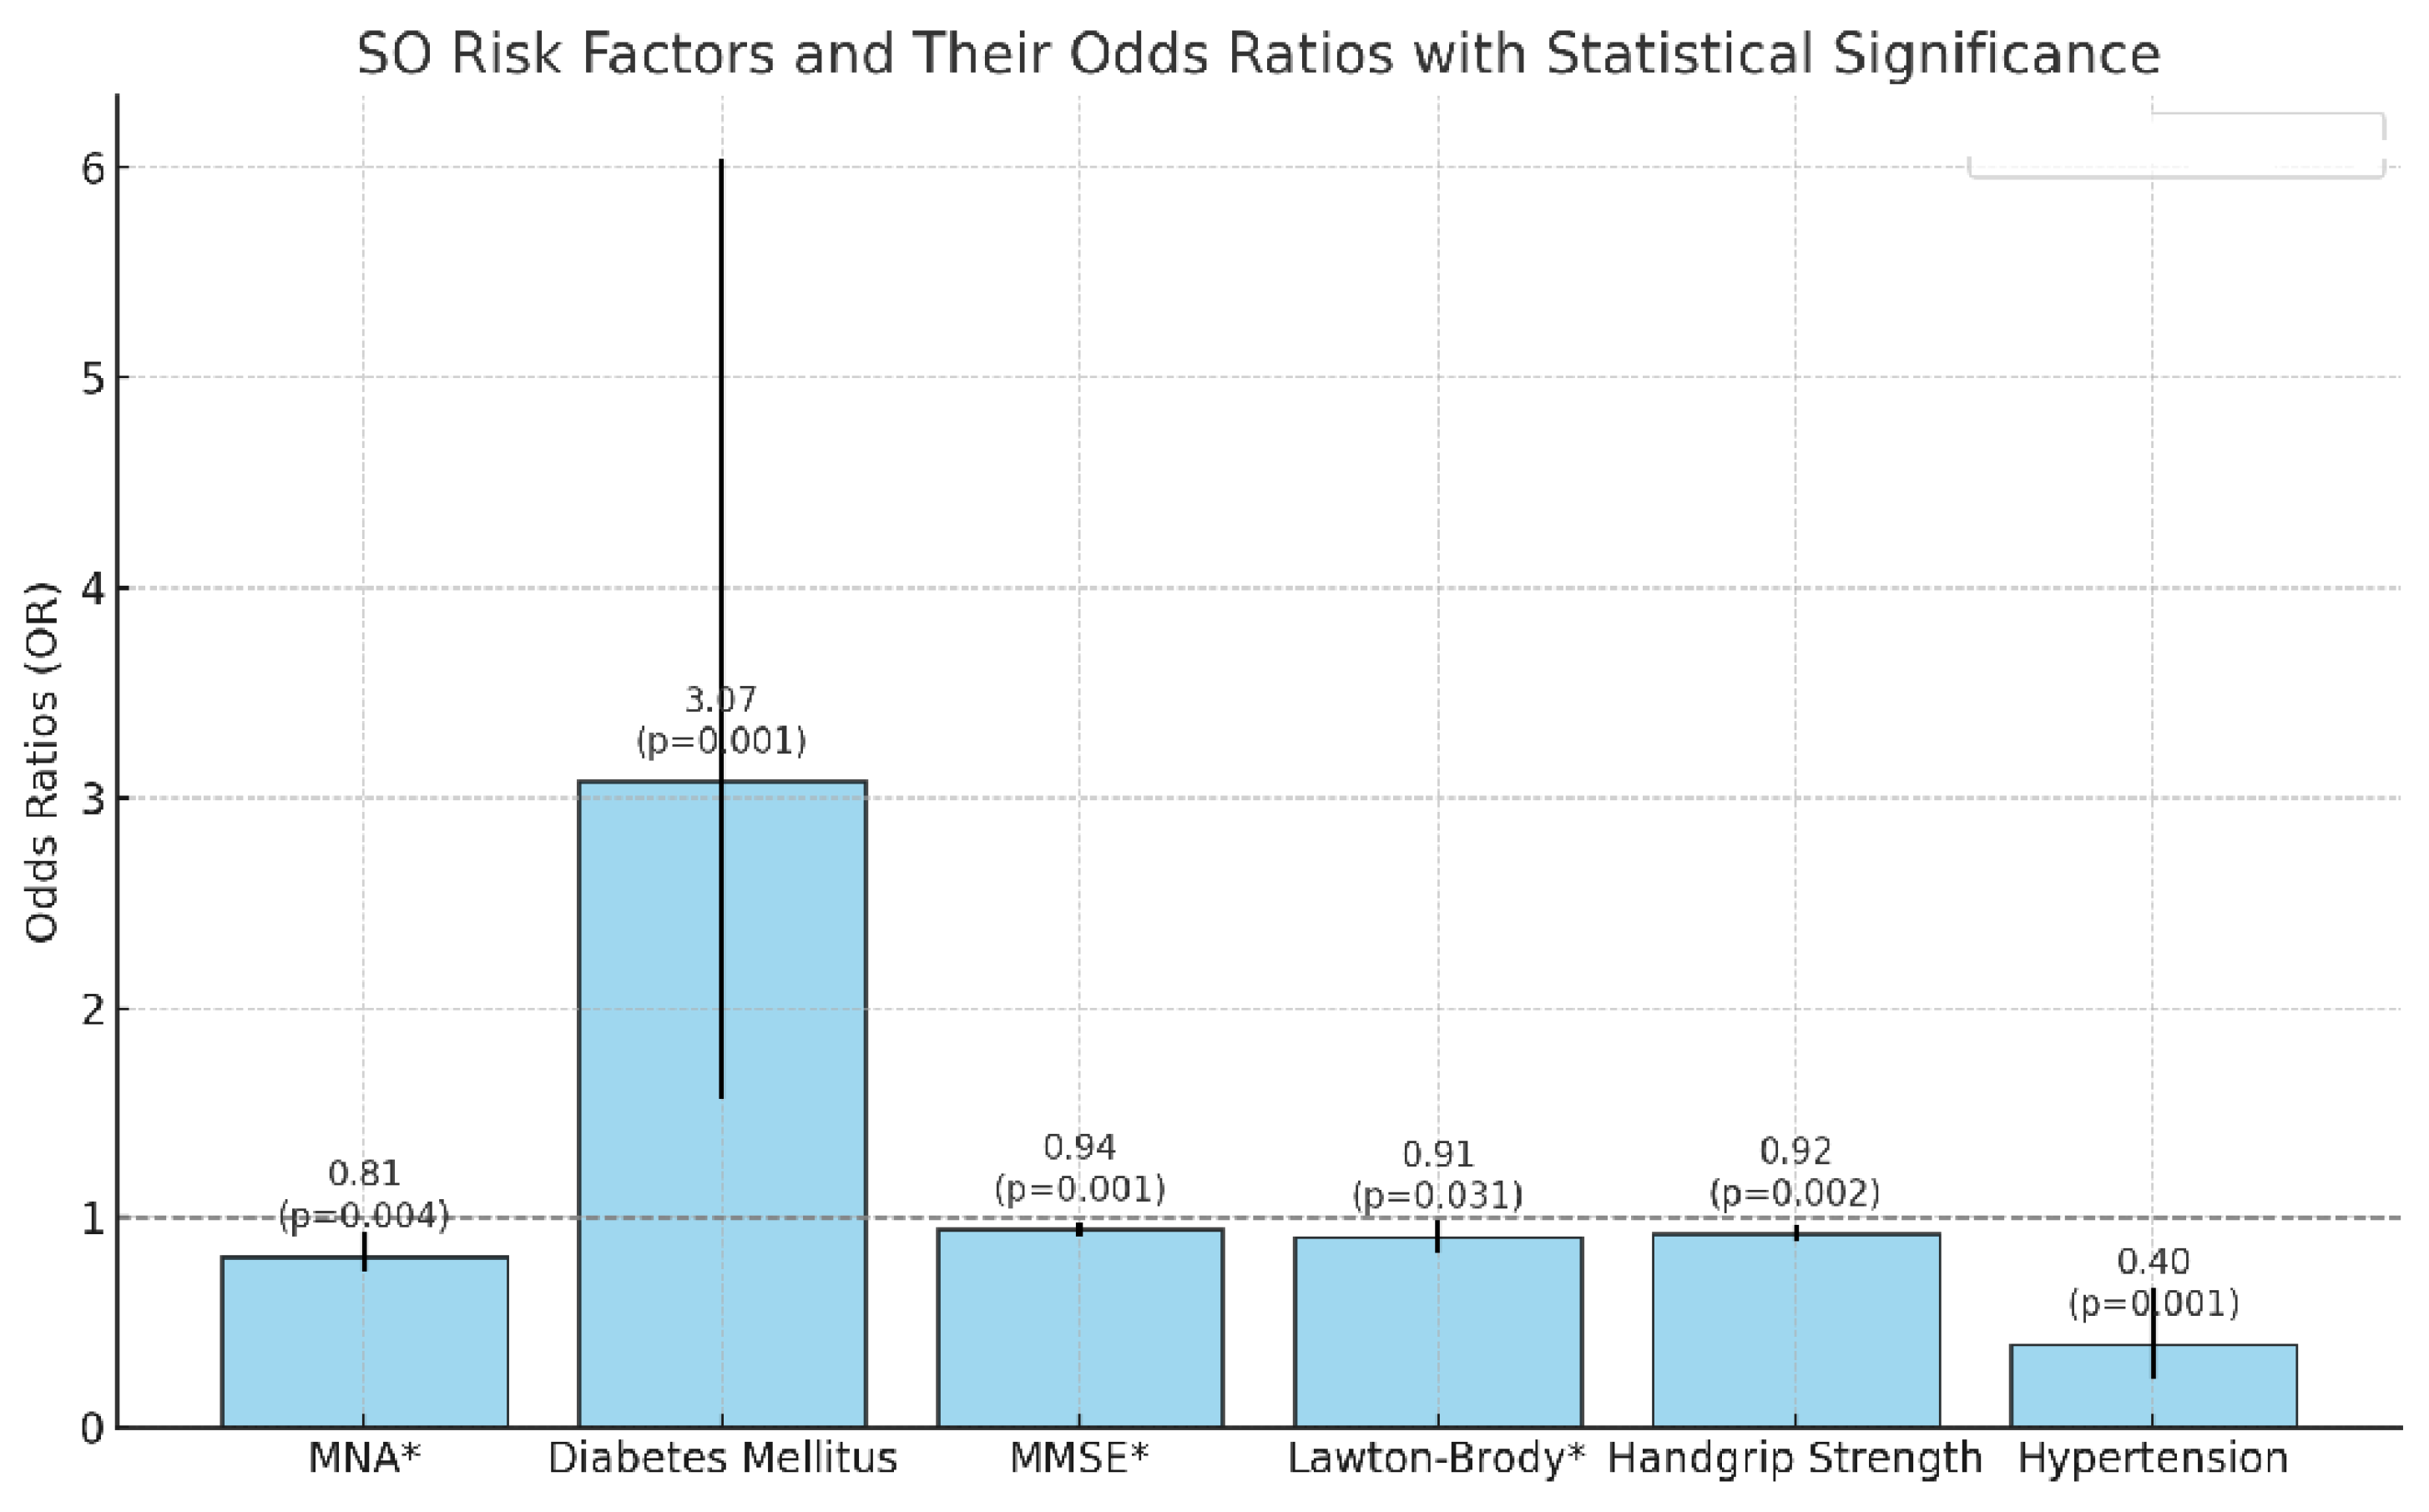
Background: Sarcopenia, characterized by age-related declines in muscle mass and strength, and obesity, marked by excessive body fat accumulation, often manifest concurrently, leading to a new entity known as sarcopenic obesity (SO). Although there are many studies on SO in older adults, the number of studies with new definition criteria is limited. Methods: We conducted a cross-sectional retrospective study including 364 patients aged 65 and older who underwent Bioelectrical Impedance Analysis (BIA) to assess body composition. We applied geriatric assessments (Katz Index of Activities of Daily Living, Lawton Instrumental Activities of Daily Living Scale), mini nutritional assessment, geriatric depression scale, and mental status examination). SO was defined using ESPEN (European Society for Clinical Nutrition and Metabolism) and EASO (European Association for the Study of Obesity) criteria, and frailty was graded with the clinical frailty score. Mortality data were obtained. We analyzed the associations of SO with geriatric tests, frailty, and mortality using univariate and multivariate analyses. Results: The mean age of the participants was 77.11 years (SD: 6.97). The prevalence rates for the groups were as follows: 39.6% classified as normal, 16.5% as obese (O), 19.5% as sarcopenic (S), and 24.5% as sarcopenic obese (SO). Patients in the SO group demonstrated significantly lower scores in functional and cognitive assessments, including ADL, IADL, MMSE, and MNA (p-values: 0.002, <0.001, <0.001, and <0.001, respectively). Additionally, this group exhibited reduced handgrip strength and elevated mortality rates (p = 0.002). SO patients showed the highest rates of cognitive impairment, S patients had the most elevated depression scores, and O patients displayed the slowest walking speeds. Both hypertension (β = 0.396, p = 0.001) and diabetes mellitus (β = 3.074, p < 0.001) were identified as significant risk factors for SO, with diabetes increasing the risk approximately threefold. Conclusion: SO exhibited greater physical dependence, mortality, and frailty. The S group showed a higher tendency toward depression. Significant risk factors for SO included poor nutrition, cognitive decline, low muscle strength, hypertension, and diabetes.
Keywords:
1. Introduction
2. Materials and Methods
2.1. Study Design and Patient Selection
2.2. Comprehensive Geriatric Assessment
2.3. SO Definition
2.4. Frailty Definition and Mortality
2.5. Laboratory Values
2.6. Statistical Analysis
3. Results
4. Discussion
4.1. Functional Limitations in Sarcopenic Obesity
4.2. Cognitive Decline in Sarcopenic Obesity
4.3. Nutritional Implications of Sarcopenic Obesity
4.4. Handgrip Strength and Physical Performance
4.5. Frailty and Mortality in Sarcopenic Obesity
4.6. Depression and Sarcopenic Obesity
4.7. Walking Speed and Sarcopenic Obesity
4.8. Interactions of Risk Factors and Their Effects on the Development of SO
4.9. Limitations and Strengths
5. Conclusions
Author Contributions
Funding
Institutional Review Board Statement
Informed Consent Statement
Data Availability Statement
Conflicts of Interest
References
- Hamer, M.; O'Donovan, O. Sarcopenic Obesity, Weight Loss, and Mortality: The English Longitudinal Study of Ageing. Am J Clin Nutr 2017, 106, 125–129. [Google Scholar] [CrossRef]
- Donini, L.M.; Busetto, L.; Bischoff, S.C.; Cederholm, T.; Ballesteros-Pomar, M.D.; Batsis, J.A.; Bauer, J.M.; Boirie, Y.; Cruz-Jentoft, A.J.; Dicker, D.; Frara, S.; Frühbeck, G.; Genton, L.; Gepner, Y.; Giustina, A.; Gonzalez, M.C.; Han, H.S.; Heymsfield, S.B.; Higashiguchi, T.; Laviano, A.; Lenzi, I.; Nyulasi, E.; Parrinello, E.; Poggiogalle, C.; Prado, C.M.; Salvador, J.; Rolland, Y.; Santini, F.; Serlie, M.J.; Shi, H.; Sieber, C.C.; Siervo, M.; Vettor, R.; Villareal, D.T.; Volkert, D.; Yu, J.; Zamboni, M.; Barazzoni, R. Definition and Diagnostic Criteria for Sarcopenic Obesity: ESPEN and EASO Consensus Statement. Obes Facts 2022, 15, 321–335. [Google Scholar] [CrossRef] [PubMed]
- Gross, D.C.; Cheever, C.R.; Batsis, J.A. Understanding the development of sarcopenic obesity. Expert Rev. Endocrinol. Metab. 2023, 18, 469–488. [Google Scholar] [CrossRef] [PubMed]
- Tang, H.; Li, R.; Lian, R.; Chen, X.; Jiang, W.; Jiang, J.; Yang, M. Sarcopenic obesity in nursing home residents: A multi-center study on diagnostic methods and their association with instrumental activities of daily living. BMC Geriatr. 2024, 24, 446. [Google Scholar] [CrossRef] [PubMed]
- Maheshwari, V.; Basu, S. Sarcopenic obesity burden, determinants, and association with risk of frailty, falls, and functional impairment in older adults with diabetes: A propensity score matching analysis. Cureus 2023, 15, e49601. [Google Scholar] [CrossRef] [PubMed]
- Murawiak, M.; Krzymińska-Siemaszko, R.; Kaluźniak-Szymanowska, A.; Lewandowicz, M.; Tobis, S.; Wieczorowska-Tobis, K.; Deskur-Śmielecka, E. Sarcopenia, obesity, sarcopenic obesity and risk of poor nutritional status in Polish community-dwelling older people aged 60 years and over. Nutrients 2022, 14, 2889. [Google Scholar] [CrossRef] [PubMed]
- Katz, S. The index of ADL: A standardized measure of biological and psychosocial function. J. Am. Med. Assoc. 1963, 185, 914–919. [Google Scholar] [CrossRef] [PubMed]
- Lawton, M.P.; Brody, E.M. Assessment of older people: Self-maintaining and instrumental activities of daily living. Gerontologist 1969, 9, 179–186. [Google Scholar] [CrossRef]
- Guigoz, Y.; Vellas, B. The Mini Nutritional Assessment (MNA) for grading the nutritional state of elderly patients: Presentation of the MNA, history and validation. Nestle Nutr. Workshop Ser. Clin. Perform. Programme 1999, 1, 3-11; discussion 11-2. [Google Scholar] [CrossRef]
- Yesavage, J.A.; Brink, T.L.; Rose, T.L.; Lum, O.; Huang, V.; Adey, M.; Leirer, V.O. Development and validation of a geriatric depression screening scale: A preliminary report. J. Psychiatr. Res. 1982, 17, 37–49. [Google Scholar] [CrossRef]
- Thal, L.J.; Grundman, M.; Golden, R. Alzheimer's disease: A correlational analysis of the Blessed Information-Memory-Concentration Test and the Mini-Mental State Exam. Neurology 1986, 36, 262–264. [Google Scholar] [CrossRef] [PubMed]
- Bahat, G.; Tufan, A.; Tufan, F.; Kilic, C.; Akpinar, T.S.; Kose, M.; Erten, N.; Karan, M.A.; Cruz-Jentoft, A.J. Cut-off points to identify sarcopenia according to European Working Group on Sarcopenia in Older People (EWGSOP) definition. Clin. Nutr. 2016, 35, 1557–1563. [Google Scholar] [CrossRef]
- Rockwood, K.; Song, X.; MacKnight, C.; Bergman, H.; Hogan, D.B.; McDowell, I.; Mitnitski, A. A global clinical measure of fitness and frailty in elderly people. CMAJ 2005, 173, 489–495. [Google Scholar] [CrossRef] [PubMed]
- JJanssen, I.; Heymsfield, S.B.; Baumgartner, R.N.; Ross, R. Estimation of skeletal muscle mass by bioelectrical impedance analysis. J. Appl. Physiol. 2000, 89, 465–471. [Google Scholar] [CrossRef] [PubMed]
- Available online: https://obs.saglik.gov.tr/account/login (accessed on 22 December 2024).
- El Ghoch, M.; Rossi, A.P.; Calugi, S.; Rubele, S.; Soave, F.; Zamboni, M.; Chignola, E.; Mazzali, G.; Bazzani, P.V.; Dalle Grave, R. Physical performance measures in screening for reduced lean body mass in adult females with obesity. Nutr. Metab. Cardiovasc. Dis. 2018, 28, 917–921. [Google Scholar] [CrossRef]
- Lan, L.; Shao, S.; Zheng, X. Associations between sarcopenia and trajectories of activities of daily living disability: A nationwide longitudinal study of middle-aged and older adults in China from 2011 to 2018. Arch. Public Health 2024, 82, 97. [Google Scholar] [CrossRef]
- Hirani, V.; Naganathan, V.; Blyth, F.; Le Couteur, D.G.; Seibel, M.J.; Waite, L.M.; Handelsman, D.J.; Cumming, R.G. Longitudinal associations between body composition, sarcopenic obesity and outcomes of frailty, disability, institutionalisation and mortality in community-dwelling older men: The Concord Health and Ageing in Men Project. Age Ageing 2017, 46, 413–420. [Google Scholar] [CrossRef] [PubMed]
- Cavazzotto, T.G.; de Campos, C.D.V.; Mazur, C.E.; da Silva, D.F.; Valério, J.M.S.; Vieira, E.R.; da Silva, W.; Bonini, J.S. Association between cognitive performance and sarcopenic obesity in older adults with Alzheimer's disease. Dement. Neuropsychol. 2022, 16, 28–32. [Google Scholar] [CrossRef] [PubMed]
- Tolea, M.I.; Chrisphonte, S.; Galvin, J.E. Sarcopenic obesity and cognitive performance. Clin. Interv. Aging 2018, 13, 1111–1119. [Google Scholar] [CrossRef] [PubMed]
- Weng, X.F.; Liu, S.W.; Li, M.; Zhang, Y.; Zhang, Y.C.; Liu, C.F.; Zhu, J.T.; Hu, H. Relationship between sarcopenic obesity and cognitive function in patients with mild to moderate Alzheimer's disease. Psychogeriatrics 2023, 23, 944–953. [Google Scholar] [CrossRef]
- d'Avila, J.D.C.; Moreira El Nabbout, T.G.; Moreira El Nabbout, H.G.; Silva, A.D.S.; Barbosa Ramos Junior, A.C.; Fonseca, E.R.D.; Santana Carlos, A.; de Azeredo Siqueira, R. Correlation between low handgrip strength and metabolic syndrome in older adults: A systematic review. Arch. Endocrinol. Metab. 2024, 68, e230026. [Google Scholar] [CrossRef] [PubMed]
- Kawamoto, R.; Ninomiya, D.; Kasai, Y.; Kusunoki, T.; Ohtsuka, N.; Kumagi, T.; Abe, M. Handgrip strength is associated with metabolic syndrome among middle-aged and elderly community-dwelling persons. Clin. Exp. Hypertens 2016, 38, 245–251. [Google Scholar] [CrossRef]
- de Lima, T.R.; González-Chica, D.A.; d'Orsi, E.; Moreno, Y.M.F.; Sui, X.; Silva, D.A.S. Muscle strength assessed by handgrip strength moderates the relationship between overweight and obesity with cardiometabolic risk markers among adults and older adults. Res. Q. Exerc. Sport 2023, 94, 409–417. [Google Scholar] [CrossRef] [PubMed]
- Soraya, N.; Parwanto, E. The controversial relationship between body mass index and handgrip strength in the elderly: An overview. Malays. J. Med. Sci. 2023, 30, 73–83. [Google Scholar] [CrossRef] [PubMed]
- Landi, F.; Calvani, R.; Cesari, M.; Tosato, M.; Martone, A.M.; Bernabei, R.; Onder, G.; Marzetti, E. Sarcopenia as the biological substrate of physical frailty. Clin. Geriatr. Med. 2015, 31, 367–374. [Google Scholar] [CrossRef] [PubMed]
- Álvarez-Bustos, A.; Carnicero-Carreño, J.A.; Davies, B.; Garcia-Garcia, F.J.; Rodríguez-Artalejo, F.; Rodríguez-Mañas, L.; Alonso-Bouzón, C. Role of sarcopenia in the frailty transitions in older adults: A population-based cohort study. J. Cachexia Sarcopenia Muscle 2022, 13, 2352–2360. [Google Scholar] [CrossRef] [PubMed]
- Zamboni, M.; Mazzali, G.; Fantin, F.; Rossi, A.; Di Francesco, V. Sarcopenic obesity: A new category of obesity in the elderly. Nutr. Metab. Cardiovasc. Dis. 2008, 18, 388–395. [Google Scholar] [CrossRef]
- Yang, M.; Hu, M.; Zhang, Y.; Jia, S.; Sun, X.; Zhao, W.; Ge, M.; Dong, B. Sarcopenic obesity is associated with frailty among community-dwelling older adults: Findings from the WCHAT study. BMC Geriatr. 2022, 22, 863. [Google Scholar] [CrossRef]
- Prado, C.M.; Batsis, J.A.; Donini, L.M.; Gonzalez, M.C.; Siervo, M. Sarcopenic obesity in older adults: A clinical overview. Nat. Rev. Endocrinol. 2024, 20, 261–277. [Google Scholar] [CrossRef]
- Benz, E.; Pinel, A.; Guillet, C.; Capel, F.; Pereira, B.; De Antonio, M.; Pouget, M.; Cruz-Jentoft, A.J.; Eglseer, D.; Topinkova, E.; Barazzoni, R.; Rivadeneira, F.; Ikram, M.A.; Steur, M.; Voortman, T.; Schoufour, J.D.; Weijs, P.J.M.; Boirie, Y. Sarcopenia and sarcopenic obesity and mortality among older people. JAMA Netw. Open 2024, 7, e243604. [Google Scholar] [CrossRef] [PubMed]
- Wannamethee, S.G.; Atkins, J.L. Sarcopenic obesity and cardiometabolic health and mortality in older adults: A growing health concern in an ageing population. Curr. Diab. Rep. 2023, 23, 307–314. [Google Scholar] [CrossRef]
- Pilati, I.; Slee, A.; Frost, R. Sarcopenic obesity and depression: A systematic review. J. Frailty Aging 2022, 11, 51–58. [Google Scholar] [CrossRef] [PubMed]
- Guo, Y.X.; Wang, A.Q.; Gao, X.; Na, J.; Zhe, W.; Zeng, Y.; Zhang, J.R.; Jiang, Y.J.; Yan, F.; Yunus, M.; Wang, H.; Yin, Z.X. Obesity is positively associated with depression in older adults: Role of systemic inflammation. Biomed. Environ. Sci. 2023, 36, 481–489. [Google Scholar] [CrossRef] [PubMed]
- Payne, M.E.; Porter Starr, K.N.; Orenduff, M.; Mulder, H.S.; McDonald, S.R.; Spira, A.P.; Pieper, C.F.; Bales, C.W. Quality of life and mental health in older adults with obesity and frailty: Associations with a weight loss intervention. J. Nutr. Health Aging 2018, 22, 1259–1265. [Google Scholar] [CrossRef] [PubMed]
- Qian, S.; Huang, T.; Wen, Q.; Zhang, Y.; Chen, J.; Feng, X. Dynapenic abdominal obesity and the risk of depressive symptoms in middle-aged and older Chinese adults: Evidence from a national cohort study. J. Affect. Disord. 2024, 355, 66–72. [Google Scholar] [CrossRef] [PubMed]
- Segal, Y.; Gunturu, S. Psychological issues associated with obesity. In StatPearls; StatPearls Publishing: Treasure Island, FL, USA, 2024. [Google Scholar]
- Steptoe, A.; Frank, P. Obesity and psychological distress. Philos. Trans. R. Soc. Lond. B Biol. Sci. 2023, 378, 20220225. [Google Scholar] [CrossRef] [PubMed]
- Wilson, J.B.; Epstein, M.; Lopez, B.; Brown, A.K.; Lutfy, K.; Friedman, T.C. The role of neurochemicals, stress hormones and immune system in the positive feedback loops between diabetes, obesity and depression. Front. Endocrinol. (Lausanne) 2023, 14, 1224612. [Google Scholar] [CrossRef]
- Ishii, S.; Chang, C.; Tanaka, T.; Kuroda, A.; Tsuji, T.; Akishita, M.; Iijima, K. The association between sarcopenic obesity and depressive symptoms in older Japanese adults. PLoS ONE 2016, 11, e0162898. [Google Scholar] [CrossRef] [PubMed]
- Lima, A.B.; Henrinques-Neto, D.; Ribeiro, G.D.S.; Gouveia, E.R.; Baptista, F. Muscle weakness and walking slowness for the identification of sarcopenia in the older adults from Northern Brazil: A cross-sectional study. Int. J. Environ. Res. Public Health 2022, 19, 9297. [Google Scholar] [CrossRef]
- Lin, Y.H.; Chen, H.C.; Hsu, N.W.; Chou, P. Using hand grip strength to detect slow walking speed in older adults: The Yilan study. BMC Geriatr. 2021, 21, 428. [Google Scholar] [CrossRef] [PubMed]
- Zanker, J.; Scott, D.; Szoeke, C.; Vogrin, S.; Patel, S.; Blackwell, T.; Bird, S.; Kirk, B.; Center, J.; Alajlouni, D.A.; Gill, T.; Jones, G.; Pasco, J.A.; Waters, D.L.; Cawthon, P.M.; Duque, G. Predicting slow walking speed from a pooled cohort analysis: Sarcopenia definitions, agreement, and prevalence in Australia and New Zealand. J. Gerontol. A Biol. Sci. Med. Sci. 2023, 78, 2415–2425. [Google Scholar] [CrossRef] [PubMed]
- Hanlon, P.; Nicholl, B.I.; Jani, B.D.; Lee, D.; McQueenie, R.; Mair, F.S. Frailty and pre-frailty in middle-aged and older adults and its association with multimorbidity and mortality: A prospective analysis of 493,737 UK Biobank participants. Lancet Public Health 2018, 3, e323–e332. [Google Scholar] [CrossRef]
- Kim, D.; Lewis, C.L.; Silverman, A.K.; Gill, S.V. Changes in dynamic balance control in adults with obesity across walking speeds. J. Biomech. 2022, 144, 111308. [Google Scholar] [CrossRef] [PubMed]
- Wang, M.; Tan, Y.; Shi, Y.; Wang, X.; Liao, Z.; Wei, P. Diabetes and sarcopenic obesity: Pathogenesis, diagnosis, and treatments. Front. Endocrinol. (Lausanne) 2020, 11, 568. [Google Scholar] [CrossRef] [PubMed]
- Wei, S.; Nguyen, T.T.; Zhang, Y.; Ryu, D.; Gariani, K. Sarcopenic obesity: Epidemiology, pathophysiology, cardiovascular disease, mortality, and management. Front. Endocrinol. (Lausanne) 2023, 14, 1185221. [Google Scholar] [CrossRef] [PubMed]
- Hong, S.H.; Choi, K.M. Sarcopenic obesity, insulin resistance, and their implications in cardiovascular and metabolic consequences. Endocrinol. Metab. 2020, 21, 494. [Google Scholar] [CrossRef] [PubMed]

| COMPREHENSİVE GERİATRİC ASSESSMENT TESTS | |||
| Test | Measurement Purpose | Interpretation | Reference |
| Katz | Activities of Daily Living Index (ADL) | The functions of dressing, bathing, going to the toilet, getting out of bed, eating, and continence are over six points. A total score means complete independence. A decrease in score suggests a decrease in functionality. |
[7] |
| Lawton-Brody | Instrumental Activities of Daily Living Scale (IADL) | Activities such as telephone use, shopping, food preparation, household chores, laundry, urban transportation, and proper use of drugs are evaluated at over eight points. A full score means complete independence. A decrease in score suggests a decrease in functionality. | [8] |
| Mini-Nutritional Assessment Short-Form (MNA-SF) | Malnutrition Screening | In the short screening form with 14 points; 0-7 points means malnutrition, 8-11 points means malnutrition risk and 12-14 points means normal nutrition. |
[9] |
| Geriatric Depression Scale (GDS) | Depression Screening | A score of 5 or above on the 15-item short form of the geriatric depression scale is considered consistent with a depressive mood. | [10] |
| Mini-Mental Status Examination (MMSE) | Cognitive Screening | Low scores on this test, which is evaluated over 30 points, indicate impairment in cognitive functions | [11] |
| Hand grip strength | Muscle Strength Screening A component of the diagnosis of sarcopenia |
Hand grip strength is measured by an electronic hand dynamometer (GRIP-D, influenza strength dynamometer produced by Takei, made in Japan). The unit of results is kilograms, with <22 kg for women and <32 kg for men indicating reduced muscle strength | [12] |
| Gait Speed over a 4-meter |
Muscle performance A component of the diagnosis of sarcopenia |
After walking time was measured with an electronic stopwatch, the walking speed was calculated with the formula 4 meter/walking time (seconds) in m/s., with ≤0.8 m/s indicating decreased performance | [12] |
| Clinical Frailty Score | Frailty Screening | Clinical frailty scores were used to assess frailty. In this scoring, high values are associated with frailty. There are nine categories: 1: Very fit—robust, active, energetic, well-motivated, and fit; these people commonly exercise regularly and are in the fittest group for their age. 2: Fit—without active disease, but less fit than people in category 1. 3: Well, with treated comorbid disease—disease symptoms are well controlled compared with those in category 4. 4: Vulnerable although not frankly dependent, these people commonly complain of being “slowed up” or having disease symptoms. 5: Mildly frail—with limited dependence on others for instrumental activities of daily living. 6: Moderately frail—help is needed with instrumental and non-instrumental daily living activities. 7: Severely frail—completely dependent on others for activities of daily living, but not at high risk of dying within six months. 8: Very severely frail—completely dependent on others for activities of daily living and approaching end of life. 9: Terminally ill—approaching end of life with life expectancy | [13] |
| BIA (bioelectrical impedance analysis) |
Muscle Mass A component of the diagnosis of sarcopenia |
Portable BIA analyzer in the supine position. Quadscan 4000 (Bodystat, Douglas, Isle of Man, UK) obtained the BIA resistance in ohms (Ω). The device was set to the participant’s age, gender, height, and body weight. Skeletal muscle mass (SMM) was calculated. | [14] |
| BİOCHEMİCAL PARAMETERS | |||
| Laboratory Values | (Unit-Normal Range) | Method | |
| Fasting blood glucose | (mg/dL 74-100) | Enzymatic Methods | . |
| Calculated Glomerular Filtration Rate | (mL/min/1.73 m2 >60) | Calculated From Serum Creatinine Levels | |
| Calcium | (mg/dL 8.8-10.6) | Spectrophotometric | The spectrophotometric method measures the amount of light absorbed by a substance at specific wavelengths. It is widely used in biochemistry and chemistry to analyze concentrations and monitor reactions |
| Total protein | (g/L 66-83) | Spectrophotometric | |
| Albumin | (g/L 35-52) | Spectrophotometric | |
| Leukocyte (white blood cell) | (×109/L 4.5-11) | counted using hematology analyzers | |
| Hemoglobin | (g/dL 11.7-16.1) | cyanmethemoglobin method | |
| Vitamin B12 | (pg/mL 126.5-505), | Spectrophotometric | |
| Thyroid-stimulating hormone | (µIU/mL 0.38-5.33) | ECLIA method | ECLIA (Electrochemiluminescence Immunoassay) is a sensitive immunoassay method that uses electrochemiluminescence to measure the concentration of specific analytes, such as hormones and proteins, in clinical laboratories. |
| C-reactive protein (CRP) | (mg/L 0.0-5.0) | Turbidimetric | Turbidimetry is an analytical technique for determining the concentration of suspended particles in a solution by measuring the amount of light scattered by these particles. |
| 25-hydroxy vitamin D | (µg/L 10-60) | HPLC method | HPLC (High-Performance Liquid Chromatography) is an analytical technique for separating, identifying, and quantifying components in a mixture by passing a liquid sample through a column packed with solid adsorbent material. |
| MORTALİTY DETECTİON | |||
| “TC Turkey Ministry of Health Public Health Agency of Death Reporting System” | [15] | ||
| P* | All | SO | S | O | Normal | Parameter |
| 364 (100) | 89 (24.5) | 71 (19.5) | 60 (16.5) | 144 (39.6) | n (%) | |
| <0.001 | 77.11 ± 6.97 | 79.40 ± 7.15 a | 75.86 ± 5.54 | 75.18 ± 6.80 | 75.28 ± 7.13 d | Age |
| <0.001 | 235 (64.6) | 74 (20.3) | 54 (14.8) | 28 (8.0) | 78 (21.4) | Female n (%) |
| Comprehensive Geriatric Assessment | ||||||
| <0.001 | 24 (0-30) (7.50) | 17 (0-30) (14.50) a | 21 (0-30) (11) | 20 (0-30) (8.75) | 23 (0-30) (6) d | MMSE |
| <0.001 | MMSE group n(%) | |||||
| 187 (51.4) | 30 (8.2) | 37 (10.2) | 27 (7.4) | 2 (25.5) | (24-30; normal cognition) | |
| 177 (48.6) | 59 (16.2) | 34 (9.3) | 33 (9.1) | 51 (14.0) | (<24; poor cognition) | |
| 0.002 | 6 (0-6) (0) | 3 (0-6) (3) a | 4 (0-6) (2) | 4 (0-6) (3) | 5 (0-6) (0) d | Katz ADL |
| <0.001 | 7 (0-8) (2) | 4 (0-8) (6) a | 5 (0-8) (3) | 5 (0-8) (4) | 6 (0-8) (8)d | Lawton-Brody IADL |
| <0.001 | 12 (2-14) (1) | 9 (2-14) (4) abc | 12 (3-14) (3) ad | 12 (3-14) (2) d | 12 (7-14) (1.8) cd | MNA-SF |
| .010 | 3 (0-15) (6) | 4 (0-15) (6.25) | 3 (0-15) (8) a | 5 (0-15) (12) | 6 (0-15) (4) c | GDS |
| <0.001 | 4.54 ± 1.58 | 4.98 ± 1.50 a | 4.91 ± 1.47 a | 4.65 ± 1.65 | 4.04 ± 1.51 cd | Clinical Frailty Score |
| 0.004 | 0.57 (0-2.25) (,36) | 0.50 (0-1.29) (,37) | 0.57 (0-2.25) (,32) | 0.47 (0-1.05) (,39) a | 0.57 (0-1.60) (,4) b | 4 m Walking Speed (m/sn) |
| <0.001 | 16.5 (0-43.1) (7,3) | 12.6 (0-26.5) (9,2) abc | 16.5 (5.5-34) (11,3) ad | 16.45 (5-38.1) (10,1) ad | 18.3 (5.9-43.1) (9,4) bcd | Handgrip strength (kg) |
| 0.002 | 87 (23.9) | 34 (9.3) | 12 (3.3) | 15 (4.1) | 26 (7.1) | Mortality n (%) |
| Comorbidities | ||||||
| 0.001 | 250 (68.7) | 47 (12.9) | 48 (13.2) | 44 (12.1) | 111 (30.5) | HT (n, %) |
| <0.001 | 134 (36.8) | 15 (4.1) | 31 (8.5) | 24 (6.6) | 64 (17.6) | DM (n, %) |
| 0.078 | 67 (18.5) | 16 (4.4) | 10 (2.8) | 18 (5) | 23 (6.3) | HF (n, %) |
| 0.371 | 77 (21.9) | 13 (3.7) | 17 (4.8) | 16 (4.5) | 31 (8.8) | Hypothyroidism (n, %) |
| 0.326 | 36 (10.2) | 9 (2.6) | 8 (2.3) | 9 (2.6) | 10 (2.8) | Cerebrovascular Diseases (n, %) |
| Laboratory Values | ||||||
| 0.159 | 98 (51-442) (5,21) | 95 (53-196) (16) | 102 (69-442) (13) | 90 (52-293) (21) | 105 (57-381) (43) | Fasting blood glucose (mg/dL) |
| 0.174 | 0.86 (0.17-3.45) (,28) | 0.78 (0-5,3) (,54) | 0.91 (0.42-1.9) (,33) | 0.84 (0.59-2.45) (,26) | 0.81 (0.5-2.86) (,27) | Creatinine (mg/dL) |
| 0.218 | 69 (11-90) (26) | 59 (24-90) (31,50) | 67 (25-90) (27,75) | 69 (11-90) (22) | 73 (15-90) (21,25) | Calculated glomerular filtration rate (mL/min/1.73 m2) |
| 0.108 | 9.5 (8.20-11.7) (,50) | 9.6 (8.2-11.7) (,50) | 9.1 (8.3-10.9) (,90) | 9.6 (8.7-10.8) (,30) | 9.6 (8.2-11.6) (,60) | Calcium (mg/dL) |
| 0.31 | 7.10 (5.20-8.20) (,70) | 7 (6.10-8.10) (,56) | 6.9 (5.40-7.84) (,60) | 7.3 (6.2-8.1) (,55) | 7.2 (5.3-8.3) (,70) | Total protein (g)/L |
| 0.232 | 4 (2-4.90) (,40) | 3.80 (2.2-4.9) (,51) | 4.05 (2.3-4.8) (,80) | 3.95 (2-4.7) (,50) | 4.1 (2.4-4.8) (,30) | Albumin (g/L) |
| 0.883 | 13 (2-88) (15,25) | 13 (5-87) (11,5) | 13 (5-88) (9) | 14 (3-49) (20) | 13 (2-87) (16,75) | Sedimentation Rate (mm/hour) |
| 0.063 | 6.78 (2.62-35.63) (2,54) | 6.13 (2.8-12.47) (2,21) | 6.75 (2.62-11.77) (3,84) | 7.04 (3.18-39.63) (2,12) | 6.8 (2.63-34) (2,76) | Leukocyte (WBC) (x10⁹/L) |
| 0.128 | 12.41 ± 1.88 | 12.31 ± 1.6 | 12.17 ± 1.83 | 12.16 ± 1.95 | 12.7 ± 2.02 | Hemoglobin (Hb) (g/dL) |
| 0.492 | 6.60 (5.10-14.90) (1,70) | 6.60 (5.6-10.49) (2,40) | 6.60 (5.10-9.20) (1,55) | 5.95 (5.20-8.60) (1,40) | 6.8 (5.5-14.9) (2,18) | HbA1C (%) |
| 0.224 | 342 (50-1500) (312,25) | 329 (50-1500) (306,25) | 397 (102-1500) (643) | 372 (169-1111) (230) | 317.5 (77-2000) (195,5) | Vitamin B12 (pg/mL) |
| 0.218 | 1.49 (0.02-30.59) (1,73) | 1.36 (0.02-6.76) (2,35) | 1.16 (0.02-21.58) (3,14) | 1.47 (0.02-30.59) (,71) | 1.80 (0.02-7.15) (2,30) | Thyroid-stimulating hormone (TSH) (µIU/mL) |
| 0.945 | 4.70 (0.10-147.9) (5,21) | 19.35 (10-100) (5,73) | 5.8 (0.10-105) (9,45) | 4.5 (0.80-139.90) (3,30) | 4.1 (0.2-147.9) (5,48) | CRP(mg/L) |
| 0.2 | 17.75 (4.5-299.0) (20,2) | 14.3 (4.5-58.1) (20,4) | 19.0 (4.9-47.4) (17,9) | 19.5 (5.2-125.7) (18.8) | 19.35 (5-299) (16) | 25-hydroxy vitamin D (µg/L) |
Disclaimer/Publisher’s Note: The statements, opinions and data contained in all publications are solely those of the individual author(s) and contributor(s) and not of MDPI and/or the editor(s). MDPI and/or the editor(s) disclaim responsibility for any injury to people or property resulting from any ideas, methods, instructions or products referred to in the content. |
© 2025 by the authors. Licensee MDPI, Basel, Switzerland. This article is an open access article distributed under the terms and conditions of the Creative Commons Attribution (CC BY) license (http://creativecommons.org/licenses/by/4.0/).


