
Submitted:
15 January 2025
Posted:
16 January 2025
You are already at the latest version
Abstract
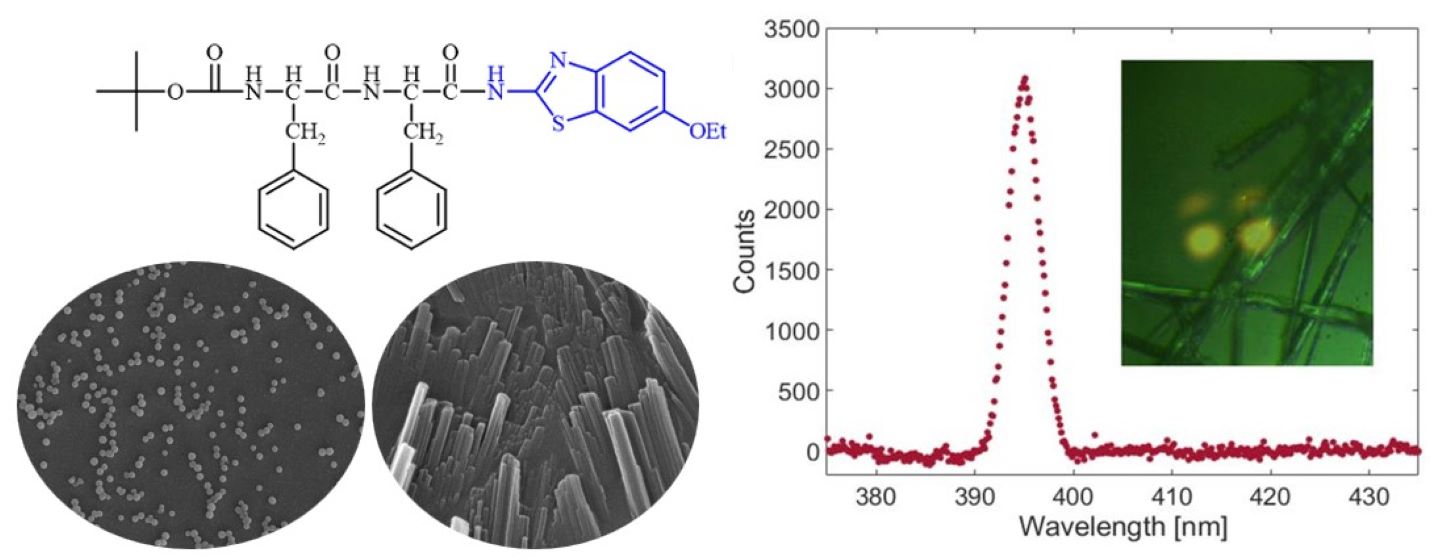
This work explores the self-assembly and optical properties of a novel chiral, aromatic-rich Boc-Phe-Phe dipeptide derivative functionalized with a benzothiazole bicyclic ring, which forms supramolecular structures. Leveraging the well-known self-assembling capabilities of diphenylalanine dipeptides, this modified derivative introduces a heterocyclic benzothiazole unit that significantly enhances the fluorescence of the resulting nanostructures. The derivative’s rich aromatic character drives the formation of supramolecular structures through self-organization mechanisms influenced by quantum confinement. By adjusting the solvent system, the nanostructures exhibit tunable morphologies, ranging from nanospheres to nanobelts. Furthermore, the nonlinear optical properties of these self-assembled structures are studied and an estimated deff of ~0.9 pm/V is obtained, which is comparable to that reported for the highly aromatic triphenylalanine peptide.
Keywords:
diphenylalanine dipeptides
; benzothiazole
; self-assembling
; optical properties
1. Introduction
Self-assembly into a variety of superstructures, both in solution and in the solid state, is a key feature of peptides, resulting from the self-organization of their constituent amino acid building blocks. One of the most frequently used building blocks in peptide synthesis is chiral phenylalanine (Phe), in either the L or D form, a precursor amino acid in the formation of several essential amino acids. The molecular aromatic dipeptides diphenylalanine (L-phenylalanine-L-phenylalanine-OH, hereafter referred to as Phe-Phe) and its derivative, N-tert-butoxycarbonyl-protected diphenylalanine (Boc-L-phenylalanine-L-phenylalanine-OH, hereafter referred to as Boc-Phe-Phe) are short dipeptides comprising two naturally occurring L-phenylalanine residues. Their exceptional mechanical, linear, and nonlinear optical properties, as well as their energy harvesting properties enabled by the piezoelectric effect [1,2,3,4,5,6], have attracted considerable and extensive research interest.
Phe-Phe, is a widely studied dipeptide which self-assembles into a variety of well-ordered structures such as nanotubes [7] nanowires [8], and nanorods [9]. Similarly, Boc-Phe-Phe forms highly ordered tubular nanostructures and nanospheres by self-assembling under different dissolution conditions [7,8,9,10,11].
Their rich hydrogen bonding network together with directional intermolecular π–π interactions originates their self-assembling with quantum nanocrystalline regions under the form of quantum dots with strong quantum confinement (QC). This phenomenon manifests itself as strong fluorescence making dipeptide superstructures promising materials for photonic applications [9]. Because all amino acids occur naturally as chiral molecular identities, apart from glycine, they further crystallize with acentric symmetry. The lack of a center of symmetry has the implication that the corresponding crystals display properties such as piezoelectricity and optical second harmonic generation. Therefore, dipeptides formed from chiral amino acids are attractive bio-systems for exploring both molecular and crystal properties [12,13,14,15].
It has been demonstrated that dipeptides with an increased aromatic groups content, relatively to Boc-Phe-Phe, may result in materials with enhanced optical and mechanical properties, in particular fluorescence and rigidity [14].
Based on these results, we decided to increase the aromaticity of Boc-Phe-Phe by attaching a benzothiazole (Bz) group to its carboxylic acid (COOH) group. Benzothiazoles are heterocyclic compounds with a bicyclic ring, forming a planar rigid structure and π-electron conjugated system, which is the preferred structure that exhibit strong fluorescence both in the solid state and in solutions and its derivatives have been recently used to construct fluorescent probes and sensors [16,17]. In addition, benzothiazole derivatives have found a wide range of applications, from pharmaceuticals to nonlinear optics [18,19].
Here we describe the synthesis, the chemical and thermal characterization of a new dipeptide, N-tert-butoxycarbonyl-protected diphenylalanine Boc-L-phenylalanine-L-phenylalanine-benzothiazole (hereafter Boc-Phe-Phe-Bz). Its self-assembling in different solvents and linear and nonlinear optical properties are also described.
2. Results and Discussion
2.1. Synthesis
The synthetic procedure used to prepare this compound is illustrated in Scheme S1. A simple coupling reaction between 2-amino-6-ethoxybenzothiazole (Bz-NH2) and Boc-diphenylalanine (Boc-Phe-Phe) produced Boc-Phe-Phe-Bz in a good yield of 68%. The synthesis of Boc-Phe-Phe was first carried out by protecting the carboxylic acid terminal of phenylalanine by reacting it with thionyl chloride in methanol, obtaining the corresponding methyl ester of the amino acid. Subsequently, the amino terminal was protected by reaction with di-tert-butylpyrocarbonate (Boc₂O), giving rise to the N-Boc protected amino acid. Boc-Phe-Phe was obtained by liquid-phase synthesis through the coupling of the phenylalanine methyl ester with the N-Boc protected amino acid, using DCC/HOBt as coupling agents. Deprotection of the carboxylic acid terminal was achieved by saponification with NaOH 2M, in methanol at room temperature. More details on the synthetic procedure are given in a previously published article [1].
The reaction of Bz-NH2 with Boc-Phe-Phe to obtain Boc-Phe-Phe-Bz, under normal amide coupling conditions, using DCC/HOBt as agents, produced the compound in 68% yield. The final dipeptide compound was fully characterized (see supplementary information, SI) through 1H and 13C NMR spectroscopy (Figures SI1 and SI2), Fourier transform infrared spectroscopy analysis (Figure SI3), differential scanning calorimetry (DSC) and thermal gravimetric analysis (TGA) (Figure SI4). Thermal analysis indicates the dipeptide initiates the degradation process at 222 °C.
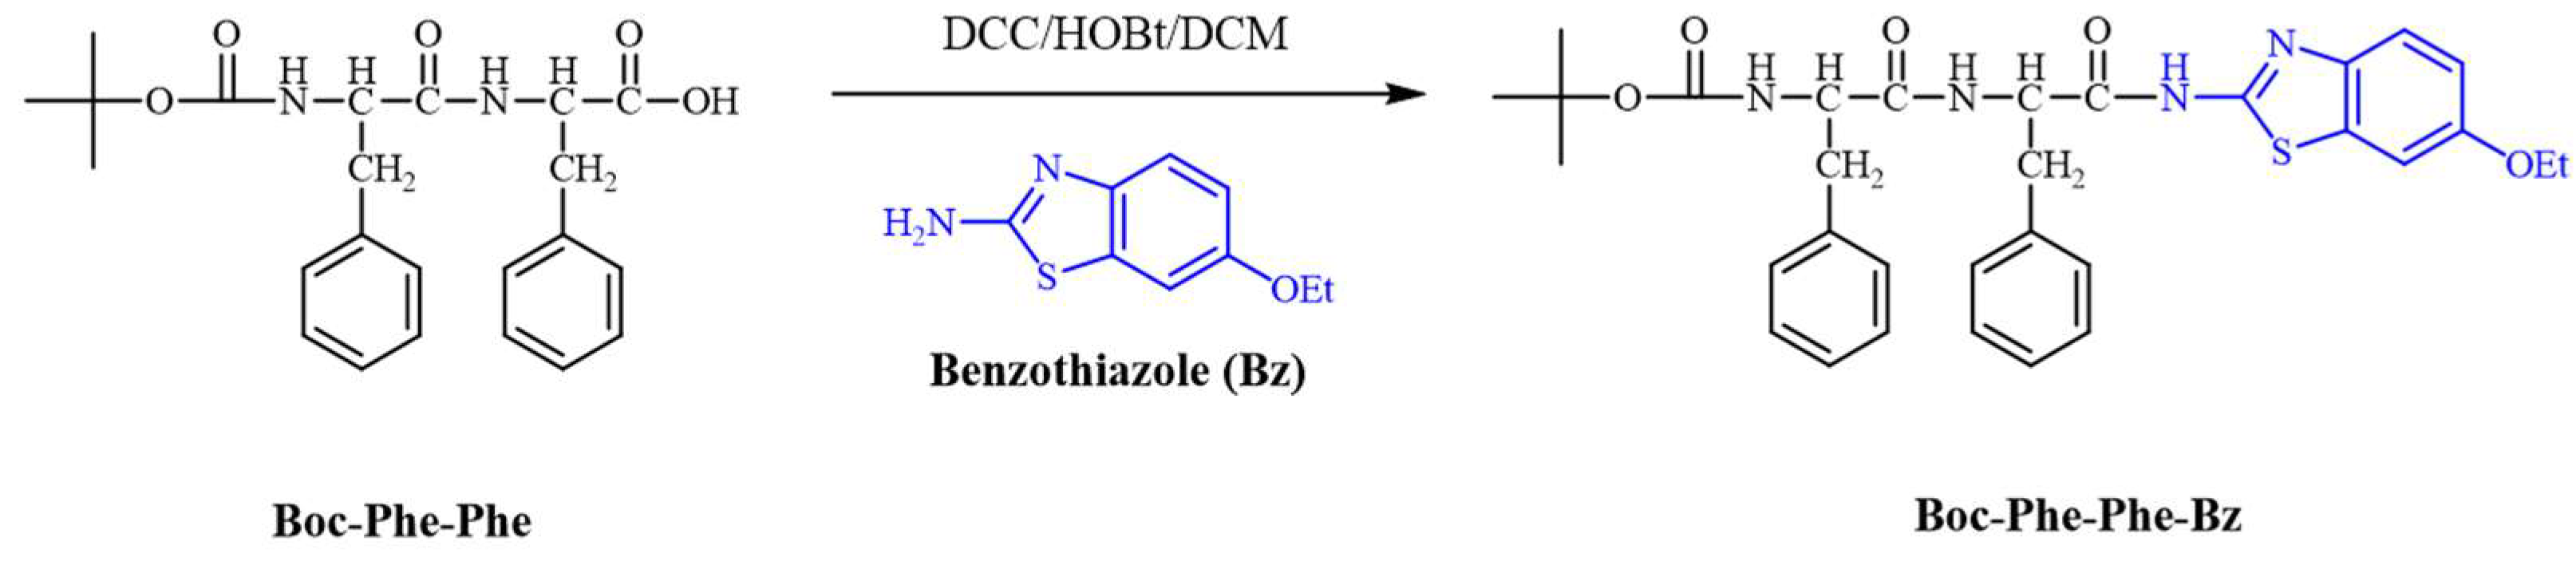
Figure 1.
Schematic description of the synthesis of Boc-Phe-Phe-Bz dipeptide.
2.2. Linear Optical Properties: Absorption and Fluorescence
Quantum electron-optical confinement (QC) was reported for Boc-Phe-Phe self-assembled nanotubes (NT) in ethanol, manifesting itself in the absorption spectra (OA) by formation of four peaks located at 263 nm, 257 nm, 252 nm and 247 nm (wavelength difference of 5-7 nm between adjacent peaks over the absorption band [1]. These peak-like formations result from the presence of quantum confined dipeptide nanostructures [9,20]. In Figure 2 (a), the normalized OA spectrum of Boc-Phe-Phe-Bz of a solution with a concentration of 2.5 mg/ml shows an absorption band in the range 250 nm-350 nm with three step-like peaks located at 290 nm, 299 nm, 304 nm and 308 nm and a wavelength difference of 5-9 nm between adjacent peaks over the absorption band, indicating the formation of quantum confined structures.
The absorption band of the new dipeptide ranges from 255 nm to 345 nm while that of Boc-Phe-Phe is narrower (250nm-300 nm). Figure 2 (b) shows the normalizeed emission spectra for both dipeptides. For Boc-Phe-Phe the maximum of emission occurs at 283 nm for an excitation wavelength of 257 nm, while for Boc-Phe-Phe-Bz the maximum of emission occurs at 369 nm for an excitation wavelength of 299 nm, with a red shift of 86 nm. Moreover, the emission spectra of Boc-Phe-Phe-Bz lies in the blue range of the optical spectra with an intensity circa of 30% stronger than measured for Boc-Phe-Phe.
As expected, the substitution in Boc-Phe-Phe molecule of the OH group by a benzothiazole group greatly increases the blue fluorescence of the dipeptide. Interestingly, ones observe a less intense emission band at 701 nm, already in the red part of the optical spectra. Table 1 summarizes these results.
The fluorescence characterization of Boc-Phe-Phe-Bz in a solution of concentration 1.6×10⁻⁵ M showed a broad emission spectrum in the visible light region between 320 and 500 nm, when excited in the range between 280 and 370 nm, Figure 3 (a). Notably, a plot of the emission maximum as a function of the corresponding excitation wavelength indicates a consistent red shift in the fluorescence peak as the excitation wavelength increases. This phenomenon, known as the red-edge excitation shift (REES), suggests the presence of a dense, inhomogeneous energy landscape and has previously been observed in Dip-Dip nanocrystals, where Dip refers to dipeptide β,β-diphenyl-Ala-OH [14]. As depicted in Figure 3(b), a strong linear correlation was observed between the emission maximum and the excitation wavelength, with a slope of approximately 0.63 nm/nm, slightly higher than the ~0.59 nm/nm reported for Dip-Dip crystals [14]. Furthermore, at longer excitation wavelengths, clear evidence of multiple peak emissions emerges, as previously reported [14]. This ability to tune the emission by simply adjusting the excitation wavelength presents promising opportunities for photonic and sensing applications. For example, REES has been demonstrated to be highly sensitive tryptophan composition making it a valuable tool for studying protein environments [21].
2.3. Scanning Electron Microscopy of Self-Assembled Nanostructures
SEM images Boc-PhePh-Bz crystallized in two different solvents were taken. It was found that there are diferent processes of self-assembling which are solvent dependent. In particular, from an ultra-pure water/ethanol (1:1) solution the dipeptide self-assembles into nanospheares with average diameter around 579 nm, as shown in Figure 4 (a) and (b); when in a HFP/ultra-pure water (1:2) solution, it self-assembles into two different types of nanostructures: nanospheres with smaller average diameter of 274 nm, compared to those formed in the ultra-pure water/ethanol system, Figure 4 (c) and (d). However, it also self-assembles into nanobelts with an average diameter of 36 nm as shown in Figure 4 (e) and (f). These findings highlight the remarkable ability of the new s Boc-PhePh-Bz system to adjust the morphology of the nanostructures based on the solvents used.
A similar behavior has been reported for Boc-Phe-Phe, where supramolecular structures under the form of nanospheres and nanotubes have been reported to experiment self-assembling processes [22].
2.4. Dynamic Light Scattering Studies
Dynamic Light Scattering (DLS) is an analytical technique that makes use of the natural Brownian motion of particles in a fluid. This method allows the evaluation of the hydrodynamic diameter of a sample, by measuring the size of particles as they move through the liquid medium, and also the polydispersity in a non-destructive manner [23].
The hydronamic diameter of the particles is calculated using the Stokes-Einstein equation, assuming spherical particles:
where, is the Boltzman’s constant; is the temperature; , the hydrodynamic diameter; η is the solvent viscosity; , is the diffusion coefficient.
In a DLS experiment, a laser beam is directed at the sample, and the scattered light is collected at a specific angle. The intensity fluctuations of the scattered light are analyzed to evaluate the diffusion behavior of the particles. These fluctuations are linked to particle size, with smaller particles diffusing more rapidly and generating faster intensity variations than larger particles. Polydispersity represents the width of the Gaussian distribution of particle sizes. It offers insight into the size variability of particles within the sample solution [24]. While SEM measures the geometric size of individual strctures, DLS measures their hydrodynamic diameter, which includes the particle core and any associated hydration layer or adsorbed molecules [25]. However, there is an intensity bias in DLS, as larger particles or aggregates can dominate the signal, potentially masking smaller particles [26].
In this study, for Boc-Phe-Phe-Bz in a EtOH/water solution the hydrodynamic radius measured by DLS, (see Table 2), is of the same order of magnitude as the mean diameter obtained via SEM (see Figure 4(a) and (b)). Concordantly, as observed in Figure 5 (a), there appear to be two distinct populations of particles with different diameters: a minor population with a diameter of approximately 66 nm and a predominant population of nanospheres with an average diameter of 541 nm.
For the second sample, Boc-Phe-Phe-Bz in HFP/water solution, SEM analysis reveals the formation of two types of nanostructures: nanospheres and nanobelts (see Figure 4 (c) and (e)). In Figure 5 (b), DLS measurements indicate the presence of a larger population with hydrodynamic diameters peaked at 222 nm, within the same order of magnitude as obtained with SEM analysis (272 nm) for nanospheres, and a minor population with diameters in the micrometer range, which corresponds to nanobelts formed from the agglomeration of smaller nanospheres.
2.5. Nonlinear Optical Response
The second-order nonlinear optical response of Boc-Phe-Phe-Bz confirms the presence of a noncentrosymmetric crystalline structure in the sample. Figure 6 (a) shows a typical second harmonic spectrum. The inset displays the sample area illuminated during second harmonic generation (SHG) measurements. The bright, saturated spot on the right corresponds to the incident laser beam, while the spot on the left is a reflection from the second surface of the beam splitter used to capture the image with a CCD camera. Two additional, weaker reflections from the back surface of the microscope slide supporting the nanobelts are also visible above the primary spots. The dependence of the integrated SHG signal on the incident laser polarization is depicted in Figure Figure 6 (b). For the data shown, the analyzer was adjusted to be aligned with the maximum signal.
Using a 1 mm-thick BBO (β-Barium Borate, EKSMA) crystal cut for phase matching at a fundamental wavelength of 800 nm, we calibrated the detection efficiency of our experimental setup. Under the strong focusing condition created by the ×10 microscope objective, the effective second harmonic generation (SHG) length within the BBO crystal is limited to approximately 35 µm due to spatial walk-off, which is 68 mrad for the SHG wavelength. The calibration procedure follows a previously reported method [27], and the relevant parameters and final results are summarized in Table 3.
To estimate the effective nonlinear susceptibility of the Boc-Phe-Phe-Bz nanobelts, it is essential to determine the effective thickness of the illuminated nanostructures. The CCD image inset in Figure 6 (a) indicates that the laser spot covered an area comprising 3–4 overlapping nanobelts, with 2–3 aligned along a common diagonal orientation and one more vertically oriented. For an estimate of we assume a scenario of five overlapping nanobelts, each with a thickness of 40 nm, slightly above the mean value from the thickness distribution histogram of Figure 4 (f), resulting in a total thickness of ~200 nm. Given a nanobelt width of approximately 1 µm, which corresponds to the upper range of the hydrodynamic radius distribution, we obtain an estimated of ~0.9 pm/V. There are very few studies of SHG measurements on dipeptide crystals, however we may compare our result with that of 0.34 pm/V reported for triphenylalanine nanobelts, which are morphologically like Boc-Phe-Phe-Bz dipeptide. The response obtained for the new dipeptide is substantial for an organic crystal, further supporting that Boc-Phe-Phe-Bz crystallizes in a non-centrosymmetric structure [28].
3. Materials and Methods
3.1. Materials
2-Amino-6-ethoxybenzothiazole, L-Phenylalanine (Phe), 1-hydroxybenzotriazole (HOBt), N,N-dicyclohexylcarbodiimide (DCC), thionyl chloride and di-tert-butylpyrocarbonate (Boc2O) were purchased from Merck/Sigma-Aldrich (Darmstadt, Germany), Alfa Aesar, and TCI (all purchased from Cymit Química, Barcelona, Spain, the distributor for both brands), and used as received. The solvents employed in this study, including dichloromethane (DCM), 1,1,1,3,3,3-hexafluoro-2-propanol (HFP), ethanol, methanol, and N,N-dimethylformamide (DMF), were purchased from Merck/Sigma-Aldrich. 1,4-dioxane was purchased from Fisher Chemicals (Zurich, Switzerland). All solvents were used as received, without further purification.
3.2. Procedure for the Synthesis of tert-butyl ((R)-1-(((R)-1-((6-ethoxybenzo[d]thiazol-2-yl)amino)-1-oxo-3-phenylpropan-2-yl)amino)-1-oxo-3-phenylpropan-2-yl)carbamate (Boc-Phe-Phe-Bz)
The Boc-protected diphenylalanine (Boc-Phe-Phe), synthesized according to the procedure described previously [1,29] (1.0 equiv), was dissolved in anhydrous dichloromethane (DCM), and the solution was cooled to 0 °C using an ice bath. N,N'-dicyclohexylcarbodiimide (DCC, 1.2 equiv) and 1-hydroxybenzotriazole hydrate (HOBt, 1.2 equiv) were added to the reaction mixture, which was stirred for 30 minutes at 0 °C. Subsequently, 2-Amino-6-ethoxybenzothiazole (Bz-NH2, 1.0 equiv) was introduced, and the mixture was stirred at room temperature for 48 hours. Dichloromethane was then added, and the resulting solution was washed with water. The organic phase was dried over sodium sulfate (Na2SO4), filtered, concentrated, and the final residue was purified via column chromatography on silica gel, using mixtures of DCM/methanol with increasing polarity. The NMR spectra were performed on a Bucker spectrometer operating at 400 MHz and 100.6 MHz for 1H and 13C, respectively. The solvent used to prepare the samples was DMSO-d6 (dimethylsulfoxide >99.80 atom% D). Chemical shifts were reported in parts per million and tetramethylsilane (TMS) was used as an external reference. 1H NMR (400 MHz, DMSO-d6, ppm) δ 1.27 (3×CH3-Boc, s, 9H), 1.32 (CH3-OEt, t, 3H), 2.48–2.49 (CH2-β, m, 1H), 2.67–2.72 (CH2-β, m, 2H), 3.10–3.14 (CH2-β, m, 1H), 4.02–4.05 (CH2-OEt, m, 2H), 4.19–4.20 (CH-α, m, 1H), 4.84–4.86 (CH-α, m, 1H), 6.81–6.84 (NH-Boc, d, 1H), 6.99–7.02 (CH-Bz, dd, Jo=8.8 Hz and Jm=2.4Hz, 1H), 7.13–7.32 (10×CH-Phe, m, 10H), 7.52–7.53 (CH-Bz, d, Jm=2.8Hz, 1H), 7.61–7.63 (CH-Bz, d, Jo=8.8Hz, 1H), 8.32–8.34 (NH-amide, d, 1H), 12.44 (NH-Bz, s, 1H); 13C NMR (100.6 MHz, DMSO-d6, ppm): δ 14.73, 28.16, 54.26, 55.69, 63.68, 78.22, 105.43, 115.36, 121.28, 126.66, 128.02, 128.25, 129.24, 129.35, 132.89, 136.92, 137.95, 142.61, 155.17, 155.51, 155.58, 170.79, 171.94.
3.3. Self-Assembly of Dipeptide Nanostructures in HFP/Water and Ethanol/Water Solutions
Two solutions of Boc-Phe-Phe-Bz were prepared by dissolving the dipeptide in HFP/ultra-pure water (1:2) or ethanol/ ultra-pure water (1:1) to concentrations of 5.7 mM and 4.3 mM, respectively. The solutions were left at room temperature for 24 hours to allow self-assembly to occur. After that, a few drops of the Boc-Phe-Phe-Bz solutions were placed on silica slides, and the solvent was removed by slow evaporation at room temperature before the samples were subject to SEM analysis.
These solutions were then further diluted in ultra-pure water to the desired final concentration of 5 µM according to the DLS study, with final solvent proportions of 0.1/99.9%.
3.4. Optical Absorption and Fluorescence
The 2.5 mg/mL solutions of Boc-Phe-Phe and Boc-Phe-Phe-Bz were subjected to optical absorption measurements using a Shimadzu UV-3101PC UV-Vis-NIR spectrophotometer (Shimadzu, Kyoto, Japan). A Fluorolog 3 spectrofluorimeter (HORIBA Jobin Yvon IBH Ltd., Glasgow, UK) was used for fluorescence measurements. For optical absorption measurements, the dipeptide solutions were prepared in ethanol. These samples were introduced into a quartz cuvette with a 1 cm light path. For fluorescence (PL) measurements, spectra were recorded at a wavelength of 360-900 nm. An excitation wavelength of 258 nm and 299 nm was used for Boc-Phe-Phe and Boc-Phe-Phe-Bz, respectively, with fixed entrance and exit slits to obtain a spectral resolution of 2 nm.
3.5. Dynamic Light Scattering (DLS)
To determine the hydrodynamic size and polydispersity index (PDI) of the Boc-Phe-Phe-Bz nanostructures, dynamic light scattering (DLS) analysis was performed using a Litesizer 500 from Anton Paar. This equipment features three detection angles (15°, 90°, and 175°) and utilizes a semiconductor laser diode with a wavelength of 658 nm and a power output of 40 mW. Measurements were conducted in a quartz cell at room temperature and at a backscatter detection angle, with each sample analyzed three times. The experimental data were processed using Kalliope software to obtain the hydrodynamic size and PDI values.
For DLS, the sample is diluted in ultra-pure water to a final concentration of 5 µM, treated in an ultrasonic bath, and filtered to 0.45 µm before analysis.
3.6. Scanning Electronic Microscopy (SEM)
The morphology, diameter distribution and thickness of the dipeptide nanostructures were obtained using a Nova NanoSEM scanning electron microscope at an accelerating voltage of 10 kV. Dipeptide single crystals were deposited on a silica surface and previously covered with a thin film (10 nm thickness) of Au-Pd (80-20 weight %) using a high-resolution sputter cover, 208HR Cressington Company, coupled with a MTM-20 Cressigton high resolution thickness controller. The diameter range of the produced nanofibers was measured from SEM images using ImageJ 1.51n image processing software (NIH, https://imagej.nih.gov/ij/, 06/11/2024). The average diameter and diameter distribution were determined by measuring a certain number of random nanofibers from the SEM images. Statistical analysis was performed using OriginPro 2017 SR2 software (OriginLab Corporation, USA), and fiber diameter distributions were fitted to the log-normal function.
3.7. Differential Scanning Calorimetry (DSC) and Thermogravimetric Analysis (TGA)
Differential scanning calorimetry (DSC) analysis was performed in a Netzsch 200 Maya (Netzsch, Selb, Germany) under nitrogen flow (50 mL/min). The sample was placed in an aluminium pan. A first heating ramp was performed from 20ºC to 120ºC, cooled down to 20ºC, and heated again up to 200ºC (second heating) at 2 °K/min. Thermogravimetric analysis (TGA) was performed using a TA Q500 thermogravimetric analyzer (TA Instruments, New Castle, DE, USA). The sample was placed in a platinum crucible and heated from 30 °C to 700 °C at a heating rate of 10 °C/min under a nitrogen flow (60 mL/min).
3.8. Second Harmonic Generation
The second harmonic signal was generated using a mode-locked Ti:Sapphire oscillator (Coherent Mira) with a nominal pulse duration of 100 fs and a repetition rate of 76 MHz. The experimental setup is essentially the same as previsouly used [27]. Briefly, incident power on the sample was controlled using a combination of a half-wave plate and polarizer. The laser beam was focused onto the sample using a ×10 microscope objective (Plan Fluorite, Nikon) with a numerical aperture of 0.30 and an effective focal length of 20 mm, producing a focal spot with a diameter of approximately 5 µm at the intensity level. A set of chirped mirrors from Edmund Optics, precompensated the pulse so that the nominal pulse duration was 110fs (FWHM).The transmitted second harmonic signal was collected using a second ×10 objective (Plan Achromat, Olympus) and passed through a dichroic mirror, followed by a zero-order half-wave plate and a fixed calcite polarizer. The signal was then filtered with a low-pass cut-off filter (transition wavelength of 650 nm) and focused into a multimode fiber bundle. At the fiber output, a 0.3 m imaging spectrometer (Shamrock 303i, Andor) was used to isolate the second harmonic signal near 400 nm, which was subsequently captured by a cooled CCD camera (Newton 920, Andor) and integrated over the second harmonic spectrum. To control both the incident and transmitted linear polarization states, zero-order half-wave plates were positioned before the focusing objective (800 nm) and after the collimating objective (400 nm), respectively. The polarization curve in Figure 6 (b) corresponds to the transmitted polarization state that maximizes the detected second harmonic signal. By rotating the half-wave plate before the focusing objective, the polarization of the incident fundamental light was varied over two full revolutions to measure the dependence of the second harmonic signal on the incident polarization angle.
4. Conclusions
In conclusion, we have designed and synthesized a new chiral and aromatic-rich dipeptide, N-tert-butoxycarbonyl-protected diphenylalanine benzothiazole, which self-assembles in different supramolecular structures, specifically as nanospheres and nanobelts, in different solvents.
These self-assembled architectures display increased blue fluorescence due to the presence of the bicyclic ring benzothiazole group. Furthermore, a consistent red shift in the fluorescence peak as the excitation wavelength increases is observed, accompanied by a strong linear correlation between the emission maximum and the excitation wavelength.
Finally, the new dipeptide nanobelts, which crystallize in a non-centrosymmetric structure, show a good nonlinear optical response with an estimated of ~0.9 pm/V, higher than that of 0.34 pm/V reported for triphenylalanine nanobelts.
Supplementary Materials
The following supporting information can be downloaded at: Preprints.org, Fig. SI1. ¹H NMR spectrum; Fig. SI2. 13C NMR spectrum; Fig. SI3: FTIR; Fig. SI4: DSC and TGA. Reference 30.
Author Contributions
Conceptualization, R.M.F.B. and E.M.G.; investigation, R.M.F.B., D.S., N.F.C., M.S.B., M.C.R.C., P.V.R. and A.V.M..; writing—original draft preparation, R.M.F.B., M.C.R.C., P.V.R, M.S.B. and E.M.G.; writing—review and editing, R.M.F.B., M.S.B. and E.M.G..; supervision, R.M.F.B. and E.M.G.; project administration, R.M.F.B. and E.M.G.; funding acquisition, R.M.F.B. and E.M.G. All authors have read and agreed to the published version of the manuscript.
Funding
This research was funded by Fundação para a Ciência e Tecnologia through FEDER (European Fund for Regional Development)-COMPETE-QREN-EU (ref. UID/FIS/04650/2013 and UID/FIS/04650/2019).
Institutional Review Board Statement
Not applicable.
Acknowledgments
Rosa M. F. Baptista acknowledges her contract DL57/2016, reference DL 57/2016/CP1377/CT0064 (DOI:10.54499/DL57/2016/CP1377/CT0064). Daniela Santos acknowledges FCT for her PhD grant, reference 2023.02245.BD. Nelssom Fernandez da Cunha acknowledges FCT for his PhD grant, reference NUI/4650/2020/CFUMUP/MAP-2022/2. Ana Vera Machado acknowledges de funding ”EMBALAGEM DO FUTURO | + ECOLÓGICA + DIGITAL + INCLUSIVA", financed by PRR - Plano de Recuperação e Resiliência pela União Europeia (Next Generation EU).
Conflicts of Interest
The authors declare no conflicts of interest.
References
- Baptista, R.M.F.; de Matos Gomes, E.; Raposo, M.M.M.; Costa, S.P.G.; Lopes, P.E.; Almeida, B.; Belsley, M.S. Self-assembly of dipeptide Boc-diphenylalanine nanotubes inside electrospun polymeric fibers with strong piezoelectric response. Nanoscale Adv. 2019, 1, 4339–4346. [Google Scholar] [CrossRef] [PubMed]
- Adler-Abramovich, L.; Gazit, E. The physical properties of supramolecular peptide assemblies: from building block association to technological applications. Chem. Soc. Rev. 2014, 43, 6881–6893. [Google Scholar] [CrossRef] [PubMed]
- Adler-Abramovich, L.; Kol, N.; Yanai, I.; Barlam, D.; Shneck, R.Z.; Gazit, E.; Rousso, I. Self-Assembled Organic Nanostructures with Metallic-Like Stiffness. Angew. Chem. Int. Ed. 2010, 49, 9939–9942. [Google Scholar] [CrossRef] [PubMed]
- Adler-Abramovich, L.; Reches, M.; Sedman, V.L.; Allen, S.; Tendler, S.J.B.; Gazit, E. Thermal and Chemical Stability of Diphenylalanine Peptide Nanotubes: Implications for Nanotechnological Applications. Langmuir 2006, 22, 1313–1320. [Google Scholar] [CrossRef] [PubMed]
- Amdursky, N.; Beker, P.; Schklovsky, J.; Gazit, E.; Rosenman, G. Ferroelectric and Related Phenomena in Biological and Bioinspired Nanostructures. Ferroelectrics 2010, 399, 107–117. [Google Scholar] [CrossRef]
- Gorbitz, C.H. The structure of nanotubes formed by diphenylalanine, the core recognition motif of Alzheimer's beta-amyloid polypeptide. Chem. Commun. 2006, 2332–2334. [Google Scholar] [CrossRef]
- Adler-Abramovich, L.; Aronov, D.; Beker, P.; Yevnin, M.; Stempler, S.; Buzhansky, L.; Rosenman, G.; Gazit, E. Self-assembled arrays of peptide nanotubes by vapour deposition. Nat. Nanotechnol. 2009, 4, 849. [Google Scholar] [CrossRef]
- Li, Q.; Jia, Y.; Dai, L.; Yang, Y.; Li, J. Controlled Rod Nanostructured Assembly of Diphenylalanine and Their Optical Waveguide Properties. ACS Nano 2015, 9, 2689–2695. [Google Scholar] [CrossRef]
- Adler-Abramovich, L.; Gazit, E. Controlled patterning of peptide nanotubes and nanospheres using inkjet printing technology. J. Pept. Sci. 2008, 14, 217–223. [Google Scholar] [CrossRef]
- Reches, M.; Gazit, E. Self-assembly of peptide nanotubes and amyloid-like structures by charged-termini-capped diphenylalanine peptide analogues. Isr. J. Chem. 2005, 45, 363–371. [Google Scholar] [CrossRef]
- Kim, J.; Han, T.H.; Kim, Y.-I.; Park, J.S.; Choi, J.; Churchill, D.G.; Kim, S.O.; Ihee, H. Role of Water in Directing Diphenylalanine Assembly into Nanotubes and Nanowires. Adv. Mater. 2010, 22, 583–587. [Google Scholar] [CrossRef] [PubMed]
- Arnon, Z.A.; Pinotsi, D.; Schmidt, M.; Gilead, S.; Guterman, T.; Sadhanala, A.; Ahmad, S.; Levin, A.; Walther, P.; Kaminski, C.F.; et al. Opal-like Multicolor Appearance of Self-Assembled Photonic Array. ACS Appl. Mater. Inter. 2018, 10, 20783–20789. [Google Scholar] [CrossRef] [PubMed]
- Zhang, S. Fabrication of novel biomaterials through molecular self-assembly. Nature Biotechnol. 2003, 21, 1171–1178. [Google Scholar] [CrossRef] [PubMed]
- Basavalingappa, V.; Bera, S.; Xue, B.; O’Donnell, J.; Guerin, S.; Cazade, P.-A.; Yuan, H.; Haq, E.u.; Silien, C.; Tao, K.; et al. Diphenylalanine-Derivative Peptide Assemblies with Increased Aromaticity Exhibit Metal-like Rigidity and High Piezoelectricity. ACS Nano 2020, 14, 7025–7037. [Google Scholar] [CrossRef]
- Tao, K.; Hu, W.; Xue, B.; Chovan, D.; Brown, N.; Shimon, L.J.W.; Maraba, O.; Cao, Y.; Tofail, S.A.M.; Thompson, D.; et al. Bioinspired Stable and Photoluminescent Assemblies for Power Generation. Adv. Mater. 2019, 31, 1807481. [Google Scholar] [CrossRef]
- Zhao, L.; Shi, J.; Liu, Y.; Han, M.; Li, S.; Cao, D. Novel benzothiazole-based fluorescent probe for efficient detection of Cu2+/S2− and Zn2+ and its applicability in cell imaging. Anal. Chim. Acta 2024, 1324, 343093. [Google Scholar] [CrossRef]
- Li, Z.; Wang, J.; Chen, Y.; Xiao, L.; Liu, Z. A benzothiazole-based fluorescent probe for sensing Zn2+ and its application. Inorg. Chim. Acta 2023, 545, 121275. [Google Scholar] [CrossRef]
- Das, S.; Indurthi, H.K.; Asati, P.; Saha, P.; Sharma, D.K. Benzothiazole based fluorescent probes for the detection of biomolecules, physiological conditions, and ions responsible for diseases. Dyes Pigments 2022, 199, 110074. [Google Scholar] [CrossRef]
- Abdallah, A.E.M.; Abdel-Latif, S.A.; Elgemeie, G.H. Novel Fluorescent Benzothiazolyl-Coumarin Hybrids as Anti-SARS-COVID-2 Agents Supported by Molecular Docking Studies: Design, Synthesis, X-ray Crystal Structures, DFT, and TD-DFT/PCM Calculations. ACS Omega 2023, 8, 19587–19602. [Google Scholar] [CrossRef]
- Even, N.; Adler-Abramovich, L.; Buzhansky, L.; Dodiuk, H.; Gazit, E. Improvement of the Mechanical Properties of Epoxy by Peptide Nanotube Fillers. Small 2011, 7, 1007–1011. [Google Scholar] [CrossRef]
- Warrender, A.K.; Pan, J.; Pudney, C.; Arcus, V.L.; Kelton, W. Red edge excitation shift spectroscopy is highly sensitive to tryptophan composition. J. R. Soc. Interface 2023, 20, 20230337. [Google Scholar] [CrossRef] [PubMed]
- Levin, A.; Mason, T.O.; Adler-Abramovich, L.; Buell, A.K.; Meisl, G.; Galvagnion, C.; Bram, Y.; Stratford, S.A.; Dobson, C.M.; Knowles, T.P.J.; et al. Ostwald’s rule of stages governs structural transitions and morphology of dipeptide supramolecular polymers. Nat. Commun. 2014, 5, 5219. [Google Scholar] [CrossRef] [PubMed]
- Stetefeld, J.; McKenna, S.A.; Patel, T.R. Dynamic light scattering: a practical guide and applications in biomedical sciences. Biophys. Rev. 2016, 8, 409–427. [Google Scholar] [CrossRef] [PubMed]
- Farkas, N.; Kramar, J.A. Dynamic light scattering distributions by any means. J. Nanopart. Res. 2021, 23, 120. [Google Scholar] [CrossRef]
- Kim, A.; Ng, W.B.; Bernt, W.; Cho, N.-J. Validation of size estimation of nanoparticle tracking analysis on polydisperse macromolecule assembly. Sci. Rep. 2019, 9, 2639. [Google Scholar] [CrossRef]
- Wishard, A.; Gibb, B.C. Dynamic light scattering–an all-purpose guide for the supramolecular chemist. Supramol. Chem. 2019, 31, 608–615. [Google Scholar] [CrossRef]
- Baptista, R.M.F.; Gomes, C.S.B.; Silva, B.; Oliveira, J.; Almeida, B.; Castro, C.; Rodrigues, P.V.; Machado, A.; Freitas, R.B.; Rodrigues, M.J.L.F.; et al. A Polymorph of Dipeptide Halide Glycyl-L-Alanine Hydroiodide Monohydrate: Crystal Structure, Optical Second Harmonic Generation, Piezoelectricity and Pyroelectricity. Materials 2023, 16, 3690. [Google Scholar] [CrossRef]
- Handelman, A.; Lavrov, S.; Kudryavtsev, A.; Khatchatouriants, A.; Rosenberg, Y.; Mishina, E.; Rosenman, G. Nonlinear optical bioinspired peptide nanostructures. Adv. Opt. Mater. 2013, 1, 875–884. [Google Scholar] [CrossRef]
- Jana, P.; Maity, S.; Maity, S.K.; Ghorai, P.K.; Haldar, D. Photo-induced charge-transfer complex formation and organogelation by a tripeptide. Soft Matter 2012, 8, 5621–5628. [Google Scholar] [CrossRef]
- Bera, S.; Jana, P.; Maity, S.K.; Haldar, D. Inhibition of fibril formation by tyrosine modification of diphenylalanine: crystallographic insights. Cryst. Growth. Des. 2014, 14, 1032–1038. [Google Scholar] [CrossRef]
Figure 2.
(a) Normalized optical absorption spectra (solid line) and (b) fluorescence spectrum (dashed line) of Boc-Phe-Phe and Boc-Phe-Phe-Bz in ethanol with a concentration of 2.5 mg/mL, measured at room temperature.
Figure 2.
(a) Normalized optical absorption spectra (solid line) and (b) fluorescence spectrum (dashed line) of Boc-Phe-Phe and Boc-Phe-Phe-Bz in ethanol with a concentration of 2.5 mg/mL, measured at room temperature.
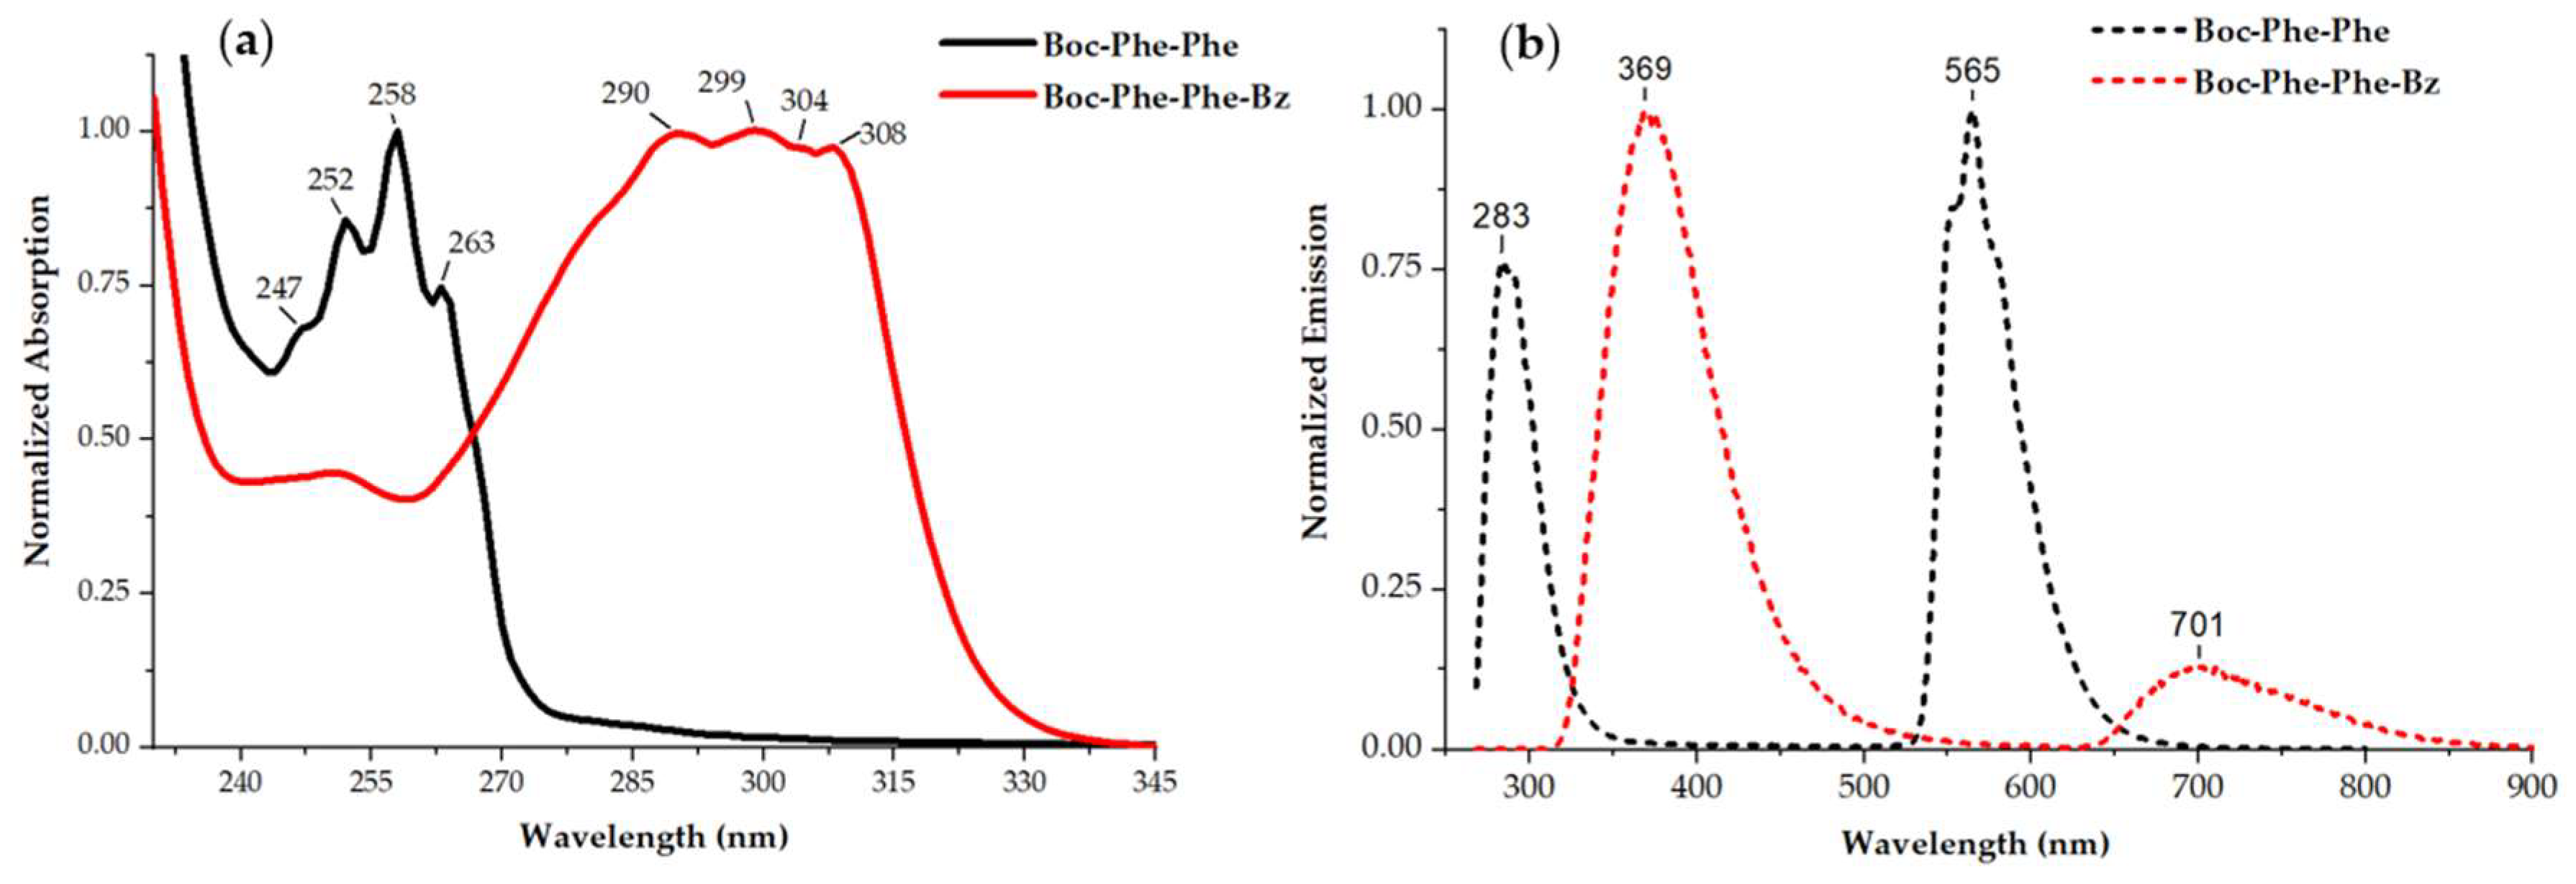
Figure 3.
(a) Normalized fluorescence spectra of Boc-Phe-Phe-Bz in ethanol with a concentration of 1.6×10⁻⁵ M, at different excitations ranging between 280 and 370 nm; (b) Emission versus excitation wavelengths.
Figure 3.
(a) Normalized fluorescence spectra of Boc-Phe-Phe-Bz in ethanol with a concentration of 1.6×10⁻⁵ M, at different excitations ranging between 280 and 370 nm; (b) Emission versus excitation wavelengths.
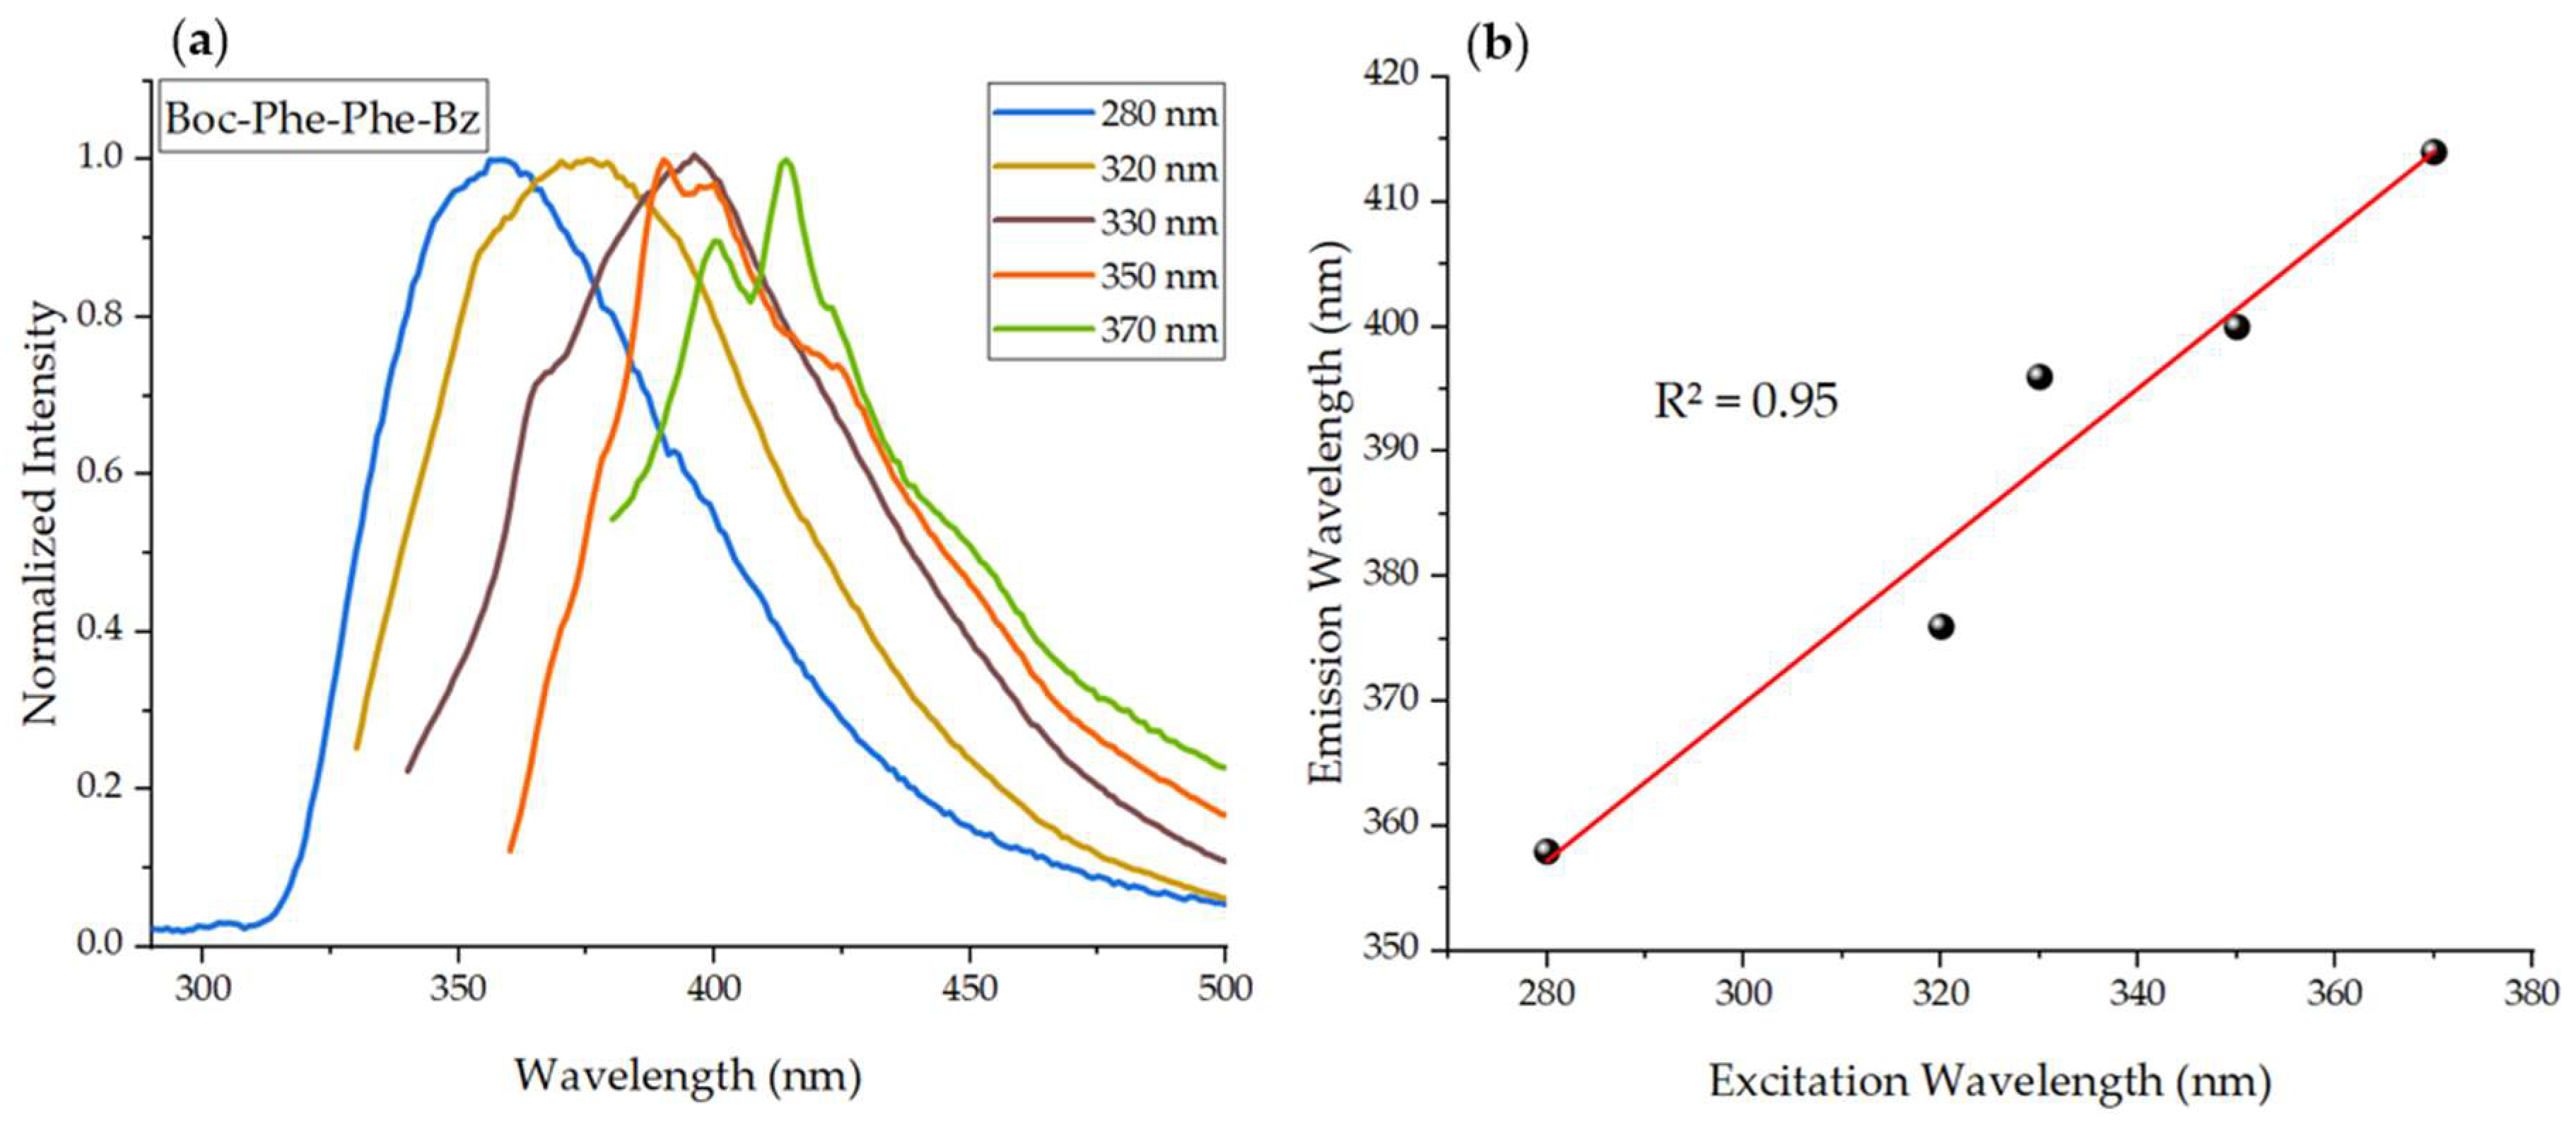
Figure 4.
(a-b) SEM images of Boc-Phe-Phe-Bz dipeptide nanospheres at 15,000× magnification, and their respective size distribution histograms in ethanol/ ultra-pure water (1:1) system; (c-f) SEM images of Boc-Phe-Phe-Bz dipeptide nanospheres and nanobelts at 100,000× magnification, and their respective size distribution histograms in HFP/ultra-pure water (1:2) system. The red curves indicate lognormal distributions.
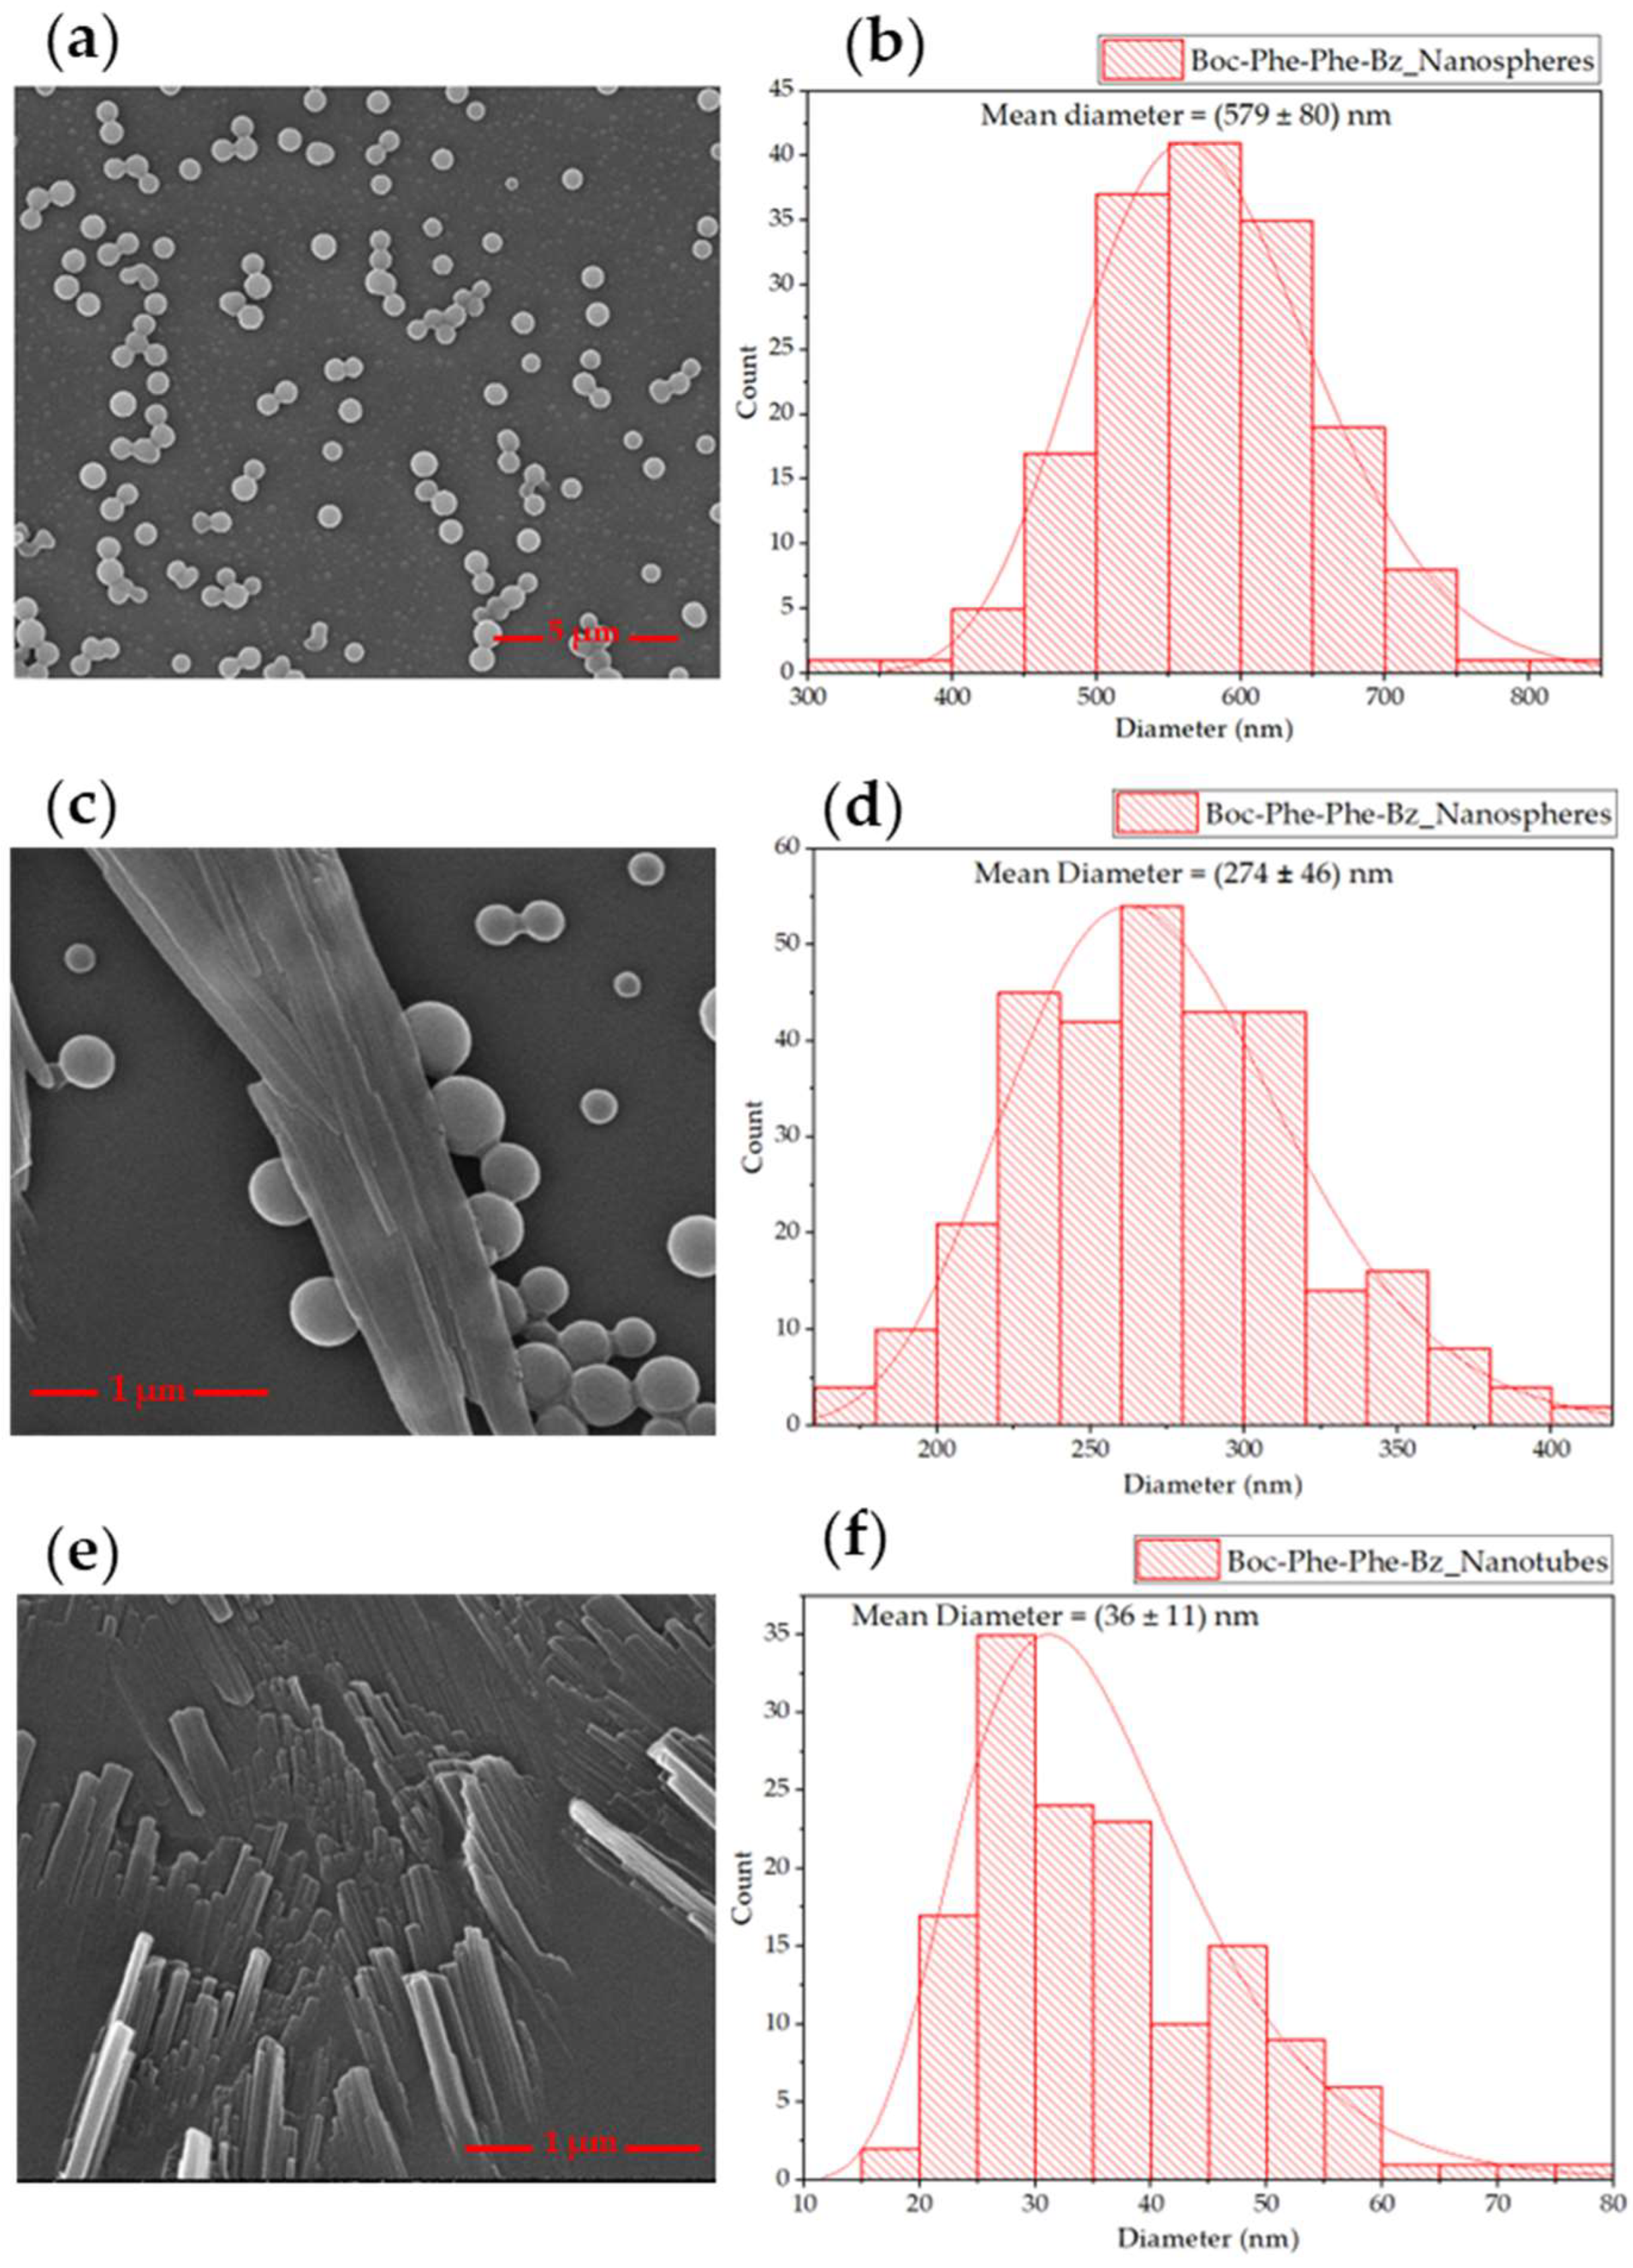
Figure 5.
Intensity weighted particle size distributions of Boc-Phe-Phe-Bz with a concentration of M, in ultra-pure water/ethanol (a) and in HFP/ultra-pure water (b).
Figure 5.
Intensity weighted particle size distributions of Boc-Phe-Phe-Bz with a concentration of M, in ultra-pure water/ethanol (a) and in HFP/ultra-pure water (b).
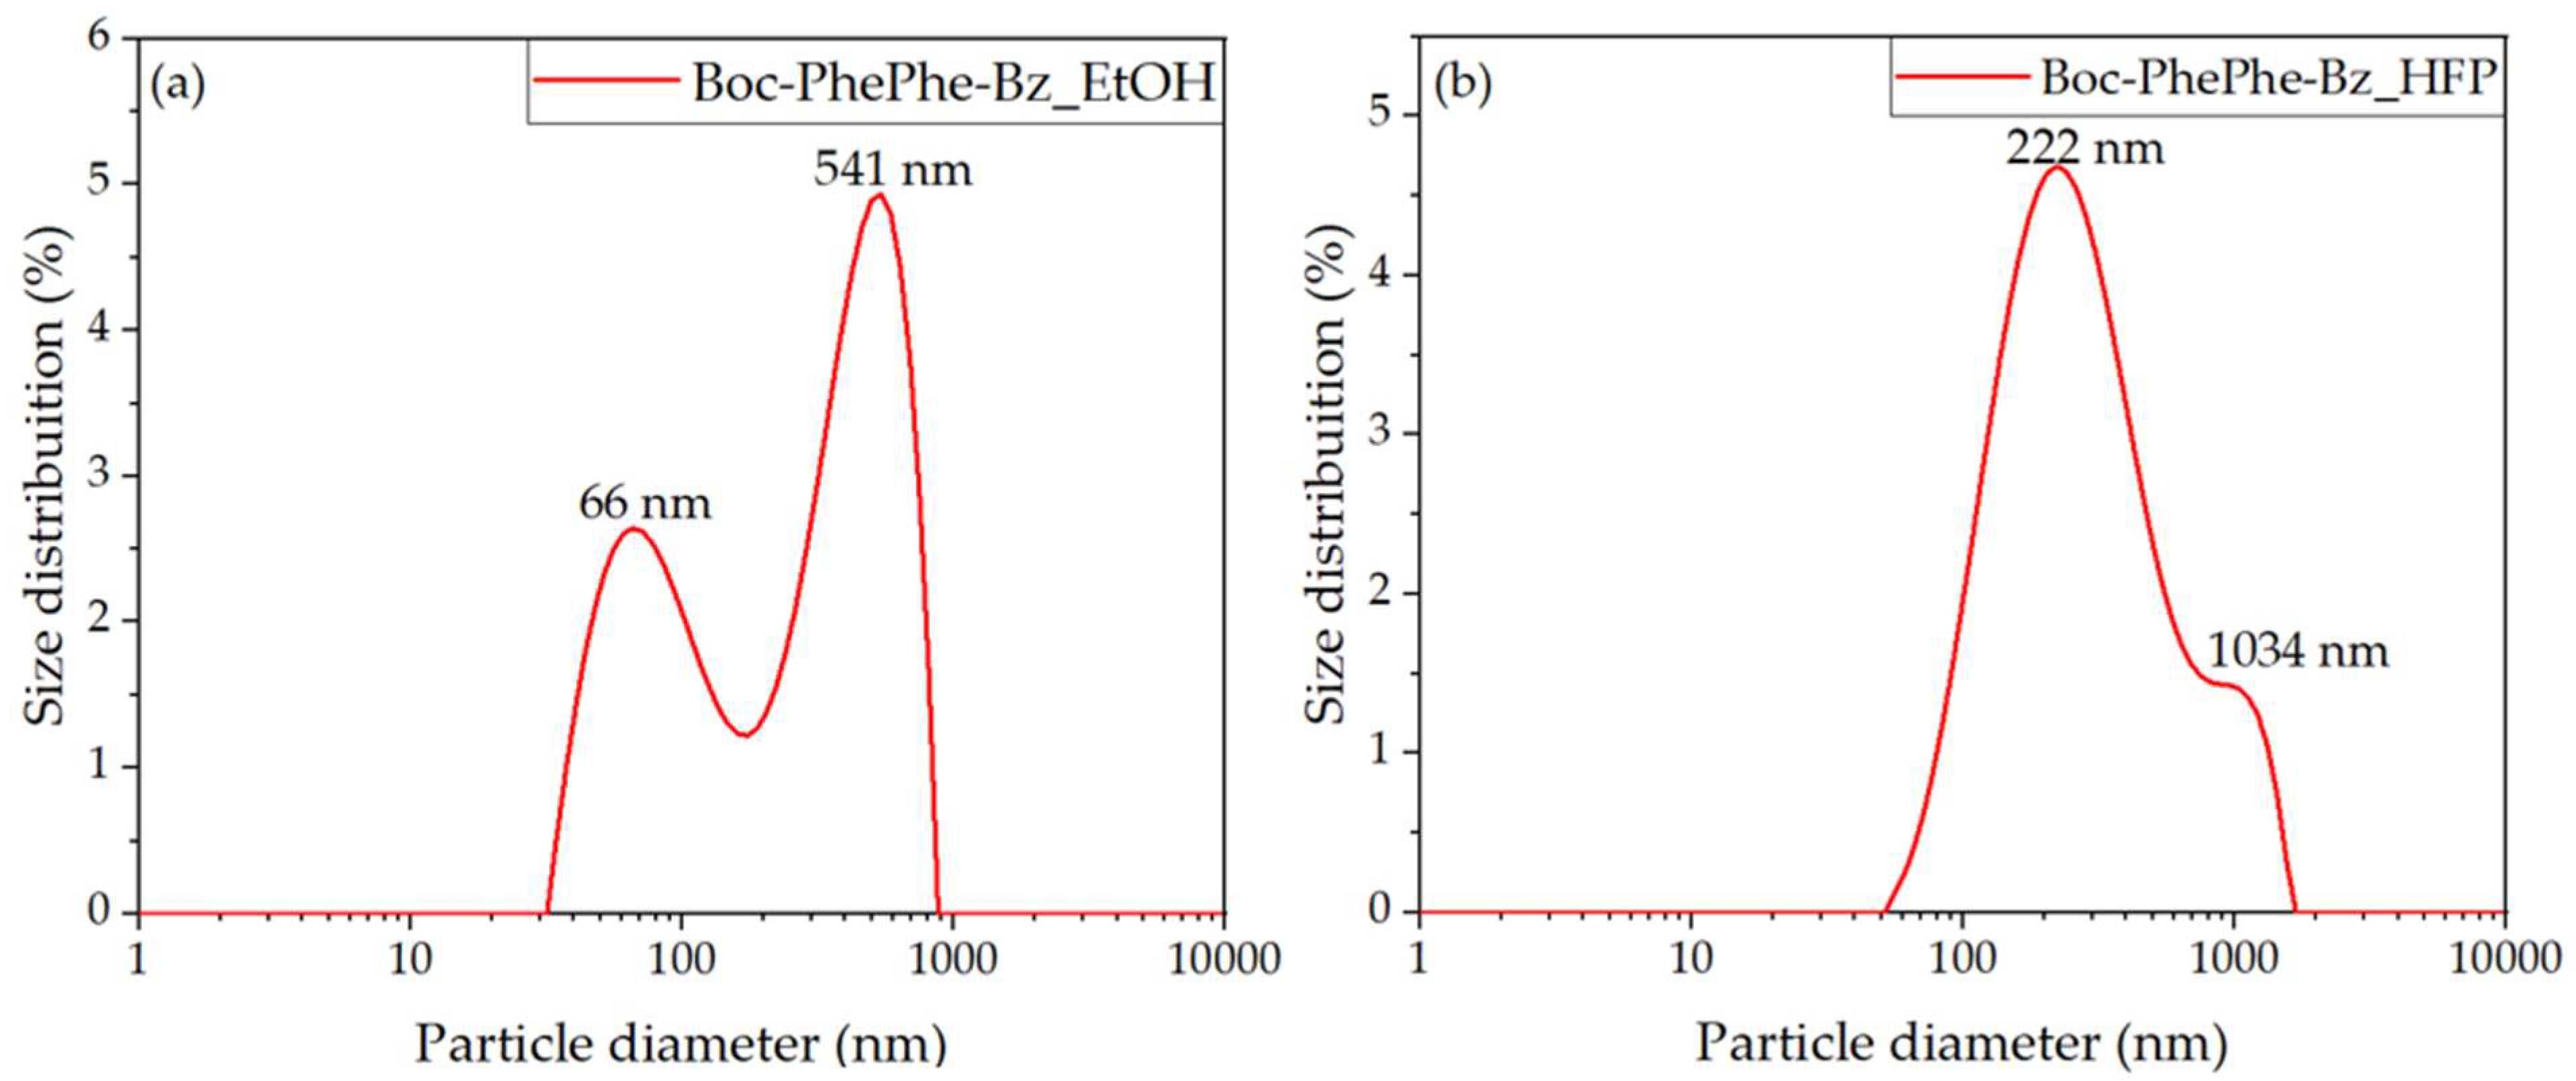
Figure 6.
(a) A representative second harmonic spectrum. The inset is an image of the illuminated region responsible for generating the second harmonic signal. The bright spot on the right corresponds to the incident laser beam. (b) Polarization dependence of the second harmonic signal, with the analyzer adjusted to maximize the detected intensity.
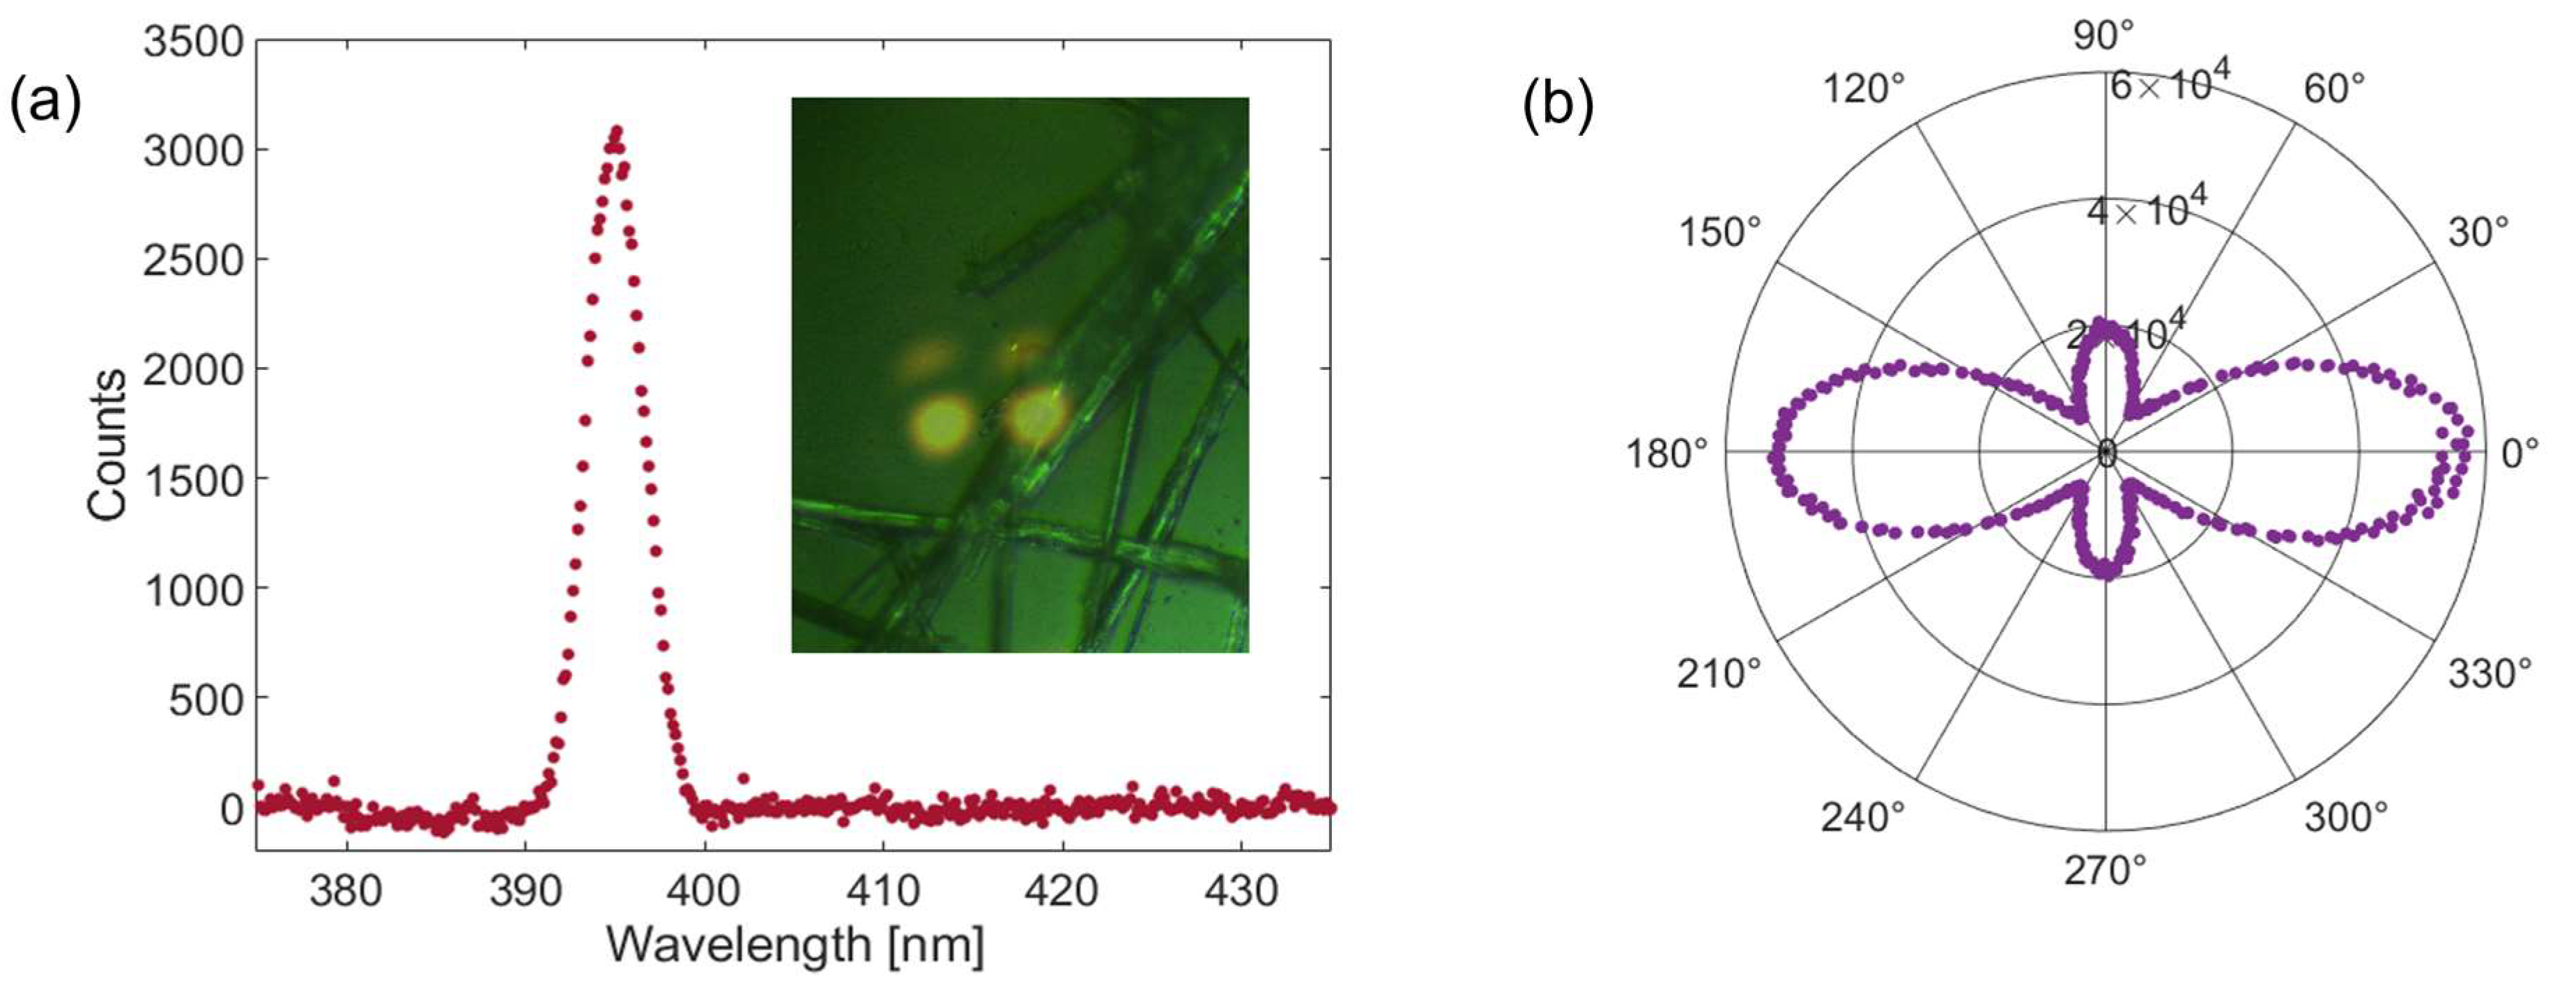

Table 1.
Maximum absorption and emission wavelengths of Boc-Phe-Phe and Boc-Phe-Phe-Bz in an ethanol solution.
Table 1.
Maximum absorption and emission wavelengths of Boc-Phe-Phe and Boc-Phe-Phe-Bz in an ethanol solution.
| Dipeptide | λabs [nm] |
λemi [nm] |
|---|---|---|
| Boc-Phe-Phe | 247; 252; 258; 263 | 283; 565 [1] |
| Boc-Phe-Phe-Bz | 290; 299; 304; 308 | 369; 701 |
Table 2.
Hydrodynamic mean diameter, transmittance, polydispersity index (PDI) and diffusion coefficient of the Boc-Phe-Phe-Bz nanospheres diluted in ultra-pure water/ethanol (0.1/99.9%) and nanobelts in HFP/ultra-pure water (0.1/99.9%) obtained by DLS.
Table 2.
Hydrodynamic mean diameter, transmittance, polydispersity index (PDI) and diffusion coefficient of the Boc-Phe-Phe-Bz nanospheres diluted in ultra-pure water/ethanol (0.1/99.9%) and nanobelts in HFP/ultra-pure water (0.1/99.9%) obtained by DLS.
| Boc-Phe-Phe-Bz | Hydrodynamic Diameter [nm] | Transmittance [%] |
Polydispersity Index [%] |
Diffusion Coefficient |
|---|---|---|---|---|
| Nanospheres | 482 | 99 | 30 | 1.02 |
| Nanobelts/nanospheres | 380 | 99 | 25 | 1.28 |
Table 3.
Second harmonic generation parameters for Boc-Phe-Phe-Bz.
| Sample | Fundamental Wave Average Power (mW) |
Signal Integration Time (ms) |
Effective Thickness (µm) | Second Harmonic Signal (Counts) |
(pm/V) |
|---|---|---|---|---|---|
| BBO | 0.62 | 0.1 | 35 | 6.5x10⁶ | 2.0 |
| Boc-Phe-Phe-Bz | 62 | 20 | 0.20 | 5.7x10⁴ | 0.9 |
Disclaimer/Publisher’s Note: The statements, opinions and data contained in all publications are solely those of the individual author(s) and contributor(s) and not of MDPI and/or the editor(s). MDPI and/or the editor(s) disclaim responsibility for any injury to people or property resulting from any ideas, methods, instructions or products referred to in the content. |
© 2025 by the authors. Licensee MDPI, Basel, Switzerland. This article is an open access article distributed under the terms and conditions of the Creative Commons Attribution (CC BY) license (http://creativecommons.org/licenses/by/4.0/).
Copyright: This open access article is published under a Creative Commons CC BY 4.0 license, which permit the free download, distribution, and reuse, provided that the author and preprint are cited in any reuse.


